

Europe Braze Alloys Market, By Metal (Nickel, Cobalt, Silver, Gold, Aluminum, Copper, Steel, Iron, Magnesium, Titanium and Others), Filler Material (Braze Powder, Braze Paste, Braze Tape, Braze Preform, Braze Foil and Braze Rod and Wire), Technology (Torch Brazing, Furnace Brazing, Induction Brazing, Dip Brazing, Resistance Brazing, Infrared Brazing, Exothermic Brazing, Blanket Brazing, Electron Beam/Laser Brazing, Braze Welding, Dissociated Ammonia, Vacuum Brazing, Hydrogen Brazing, Fuel Gas Brazing and Others), Form (Pipe, Tube, Sheet, Strip, Plate, Round Bar, Flat, Bar, Wire and Others), Production Temperature (Less than 900 °C, 901 °C to 1000 °C, 1001 °C to 1200 °C and Above 1200 °C), End Use (Aerospace and Defense, Electronics and Electrical, Automotive, Marine, Chemicals, Building and Construction and Others), Industry Trends and Forecast to 2029.
Market Analysis and Insights
Brazing fillers for joining applications are essential for manufacturing and designing advanced materials. Several types of brazing fillers have been developed in recent decades to join similar or different engineering materials. Important parts of automotive and aircraft components, including steel, are often joined by brazing. In addition, ceramic components in microwave devices and circuits have been joined with a high level of integration in microelectronic devices.
Similarly, in the medical field, metallic implants have been brazed to ceramic dental crowns. These advances have made human life more convenient. However, in brazing, there are certain issues with intermetallic compound (IMC) formation and residual stresses in joints at high temperatures.
Increasing use of braze alloys coupled with growing application of braze alloys in different end industry like aerospace, buildings and electronics has surged its demand. Data Bridge Market Research analyses that the braze alloys market will grow at a CAGR of 5.0% during the forecast period of 2022 to 2029.
|
Report Metric |
Details |
|
Forecast Period |
2022 to 2029 |
|
Base Year |
2021 |
|
Historic Years |
2020 (Customizable to 2020 - 2014) |
|
Quantitative Units |
Revenue in USD Million, Tons, Pricing in USD |
|
Segments Covered |
By Metal (Nickel, Cobalt, Silver, Gold, Aluminum, Copper, Steel, Iron, Magnesium, Titanium and Others), Filler Material (Braze Powder, Braze Paste, Braze Tape, Braze Preform, Braze Foil and Braze Rod and Wire), Technology (Torch Brazing, Furnace Brazing, Induction Brazing, Dip Brazing, Resistance Brazing, Infrared Brazing, Exothermic Brazing, Blanket Brazing, Electron Beam/Laser Brazing, Braze Welding, Dissociated Ammonia, Vacuum Brazing, Hydrogen Brazing, Fuel Gas Brazing and Others), Form (Pipe, Tube, Sheet, Strip, Plate, Round Bar, Flat, Bar, Wire and Others), Production Temperature (Less than 900 °C, 901 °C to 1000 °C, 1001 °C to 1200 °C and Above 1200 °C), End Use (Aerospace and Defense, Electronics and Electrical, Automotive, Marine, Chemicals, Building and Construction and Others), |
|
Countries Covered |
Germany, U.K., France, Italy, Spain, Netherlands, Belgium, Switzerland, Russia, Turkey, Rest Of Europe |
|
Market Players Covered |
Johnson Matthey, OC Oerlikon Management AG, Morgan Advanced Materials and its affiliates, Aimtek, Inc., AMETEK. Inc., TSI Technologies, ESAB (Subsidiary of Colfax Corporation), Umicore |
Europe Braze Alloys Market Dynamics
Drivers
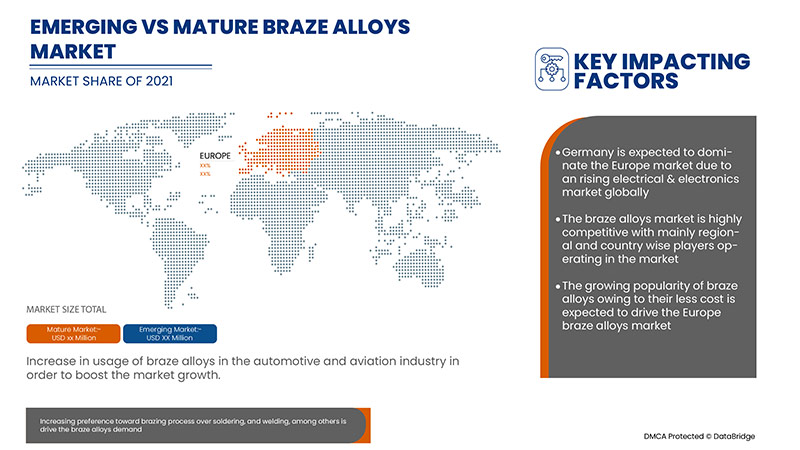
- Increase in usage of braze alloys in the automotive and aviation industry
Braze alloys are witnessing significant demand from the automotive industry, where they are used as condenser and evaporator connections for air-conditioning systems, fuel injection pipes, and brake linings. The automotive and aviation industry has been striving to develop lightweight automotive components.
- Increasing preference toward brazing process over soldering, and welding, among others
Brazing is a metal-joining process in which two or more metal items are joined together by melting and flowing a filler metal into the joint. It is widely used to join metal conductors in high through to low voltage electrical earthing systems. This process is currently used in the U.K., Ireland, and among other countries worldwide, to create a permanent joint of two conductive metals, usually copper or steel.
Opportunities
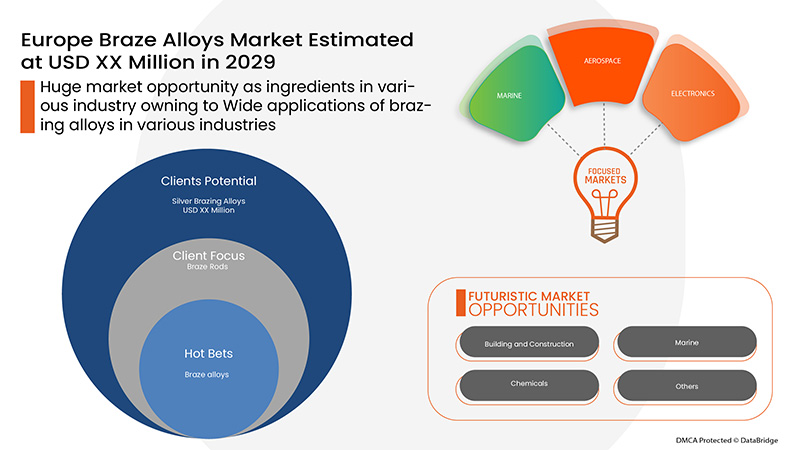
- Wide applications of brazing alloys in various industries
Brazing is a widely used joining process because it can join almost all metals except aluminum and magnesium. It is used for electrical components, pipe fittings among others. Metals having uneven thickness can be joined by brazing. Brazing is used to bond a variety of metals, dissimilar metals, and even non-metals.
Restraints/Challenges
- Fluctuating prices of braze metals
The prices of raw materials are currently fluctuating at unprecedented levels both in the United States and elsewhere in the world. Since pricing is affected by the tightening of supply markets. Beyond supply and demand, the other factor has been influencing short-run fluctuations in the prices of raw materials. Investors can suddenly move away from what they perceive to be riskier bets, including stocks and commodities.
- Adverse effect of brazing on the environment
Brazing is one of the fundamental technologies in manufacturing and is widely used in aerospace, rail transit, semiconductors, refrigerating appliances and other fields
The traditional brazing process involves harmful environment effects. The main cause of the pollution is excessive flux residual. The brazing process include the inability to precisely control the flux. The excessive residual flux and cleaning after brazing, leads to serious wastage of flux and environmental pollution. Also, it affects the service life of weldment.
This braze alloys market report provides details of new recent developments, trade regulations, import-export analysis, production analysis, value chain optimization, market share, impact of domestic and localized market players, analyses opportunities in terms of emerging revenue pockets, changes in market regulations, strategic market growth analysis, market size, category market growths, application niches and dominance, product approvals, product launches, geographic expansions, technological innovations in the market. To gain more info on braze alloys market contact Data Bridge Market Research for an Analyst Brief, our team will help you take an informed market decision to achieve market growth.
Post COVID-19 Impact on Braze Alloys Market
The COVID-19 pandemic has highly disrupted the supply chain of raw materials used to manufacture braze alloys and the disturbance in the supply chain of end-user industries. It was attributed to the lack of resources and transportation, which led to lower access, delayed stock, and supplies of raw materials products. Additionally, many governments restricted the movement of goods across the countries, and the entire supply chain was distorted. Due to the disrupted supply chain, transportation of raw materials has been interrupted, stalling production. Similarly, inflated prices and halt on braze alloys production have resulted in unmet demands for braze alloys in various end-users such as constructions, electronics, aerospace and defense.
COVID-19 pandemic also has adverse effects on end end-user industries of braze brazing alloys. It has negatively impacted the construction industry.
For instance,
According to global data, construction output in North America may decrease by as much as USD 122bn in 2020 as a result of the economic shock of COVID-19. A 0.6% increase in construction output was predicted across North America before the pandemic, but this is now expected to fall by about 6.5% in the U.S. and 7% in Canada
As a result the braze alloy market will also be affected as brazing techniques are used in buildings and construction.
Thus, disturbance in supply chain due to COVID-19 pandemic is expected to act as a challenge for Europe braze alloys market.
Recent Development
- In February 2022, OC Oerlikon Management AG has expanded its online ordering platform to its European customers. This expansion has helped the company to attract more customer base.
Europe Braze Alloys Market Scope
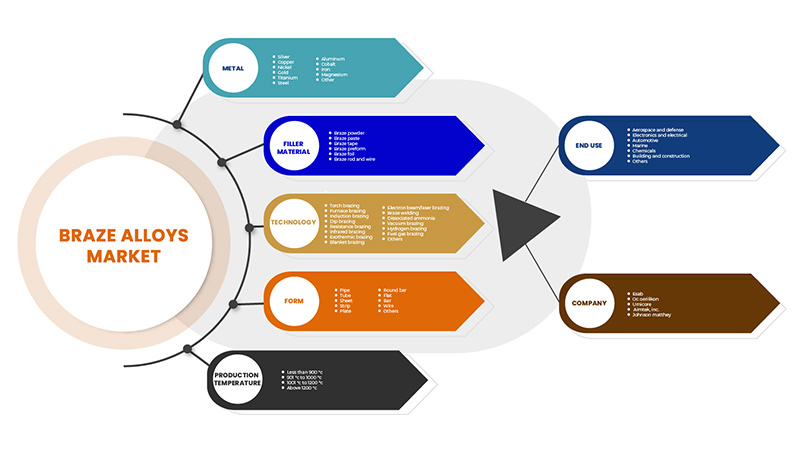
The braze alloys market is segmented into metal, filler material, technology, form, production temperature and end use.
The growth amongst these segments will help you analyze meager growth segments in the industries and provide the users with a valuable market overview and market insights to make strategic decisions to identify core market applications.
Metals
- Silver
- Copper
- Nickel
- Gold
- Titanium
- Steel
- Aluminum
- Cobalt
- Iron
- Magnesium
- Other
Based on metals, the market is segmented into silver, copper, nickel, gold, titanium, steel, aluminum, cobalt, iron, magnesium and other.
Filler Material
- Braze Paste
- Braze Rod and Wire
- Braze Powder
- Braze Preform
- Braze Foil
- Braze Tape
Based on filler material, the market is segmented into the braze paste, braze rod and wire, braze powder, braze preform, braze foil and braze tape.
Technology
- Torch Brazing
- Furnace Brazing
- Resistance Brazing
- Induction Brazing
- Dip Brazing
- Infrared Brazing
- Vacuum Brazing
- Electron Beam/Laser Brazing
- Exothermic Brazing
- Braze Welding
- Hydrogen Brazing
- Blanket Brazing
- Dissociated Ammonia
- Fuel Gas Brazing
- Others
Based on technology the market is segmented into torch brazing, furnace brazing, resistance brazing, induction brazing, dip brazing, infrared brazing, vacuum brazing, electron beam/laser brazing, exothermic brazing, braze welding, hydrogen brazing, blanket brazing, dissociated ammonia, fuel gas brazing, and others.
Form
- Wire
- Strip
- Bar
- Pipe
- Tube
- Flat
- Sheet
- Plate
- Round Bar
- Others
Based on form, the market is segmented into wire, strip, bar, pipe, tube, flat, sheet, plate, round bar and others.
Production Temperature
- 1001 °C to 1200 °C
- Less Than 900 °C
- 901 °C to 1000 °C
- Above 1200 °C
Based on production temperature, the market is segmented into 1001°C to 1200°C, less than 900°C, 901°C to 1000°C, and above 1200°C.
End Use
- Automotive
- Aerospace and Defense
- Electronics and Electrical
- Building and Construction
- Chemicals
- Marine
- Others
Based on end use, market is segmented into automotive, aerospace and defense, electronics and electrical, building and construction, chemicals, marine and others.
Braze Alloys Market Regional Analysis/Insights
The braze alloys market is analyzed and market size insights and trends are provided by country, metal, filler material, technology, form, production temperature and end use.
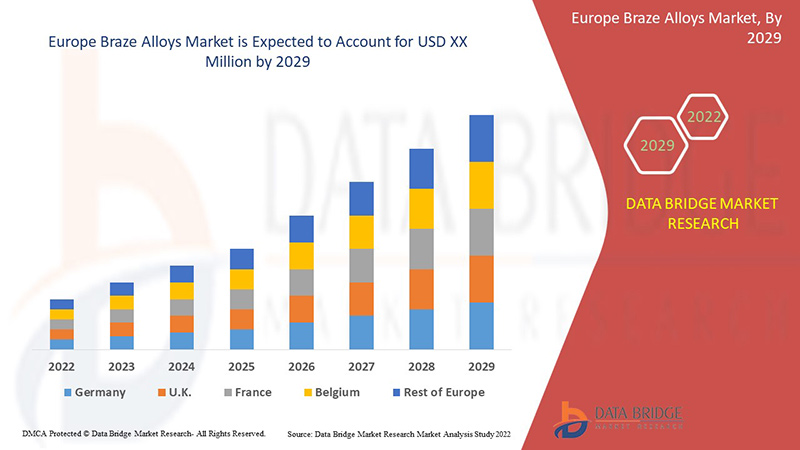
The regions covered in the Europe braze alloys market report are Germany, U.K., France, Italy, Spain, Netherlands, Belgium, Switzerland, Russia, Turkey, Rest Of Europe
Germany dominates the Europe region due to the growing usage of braze alloys in the region. The U.K. dominates the region due to the growing aerospace and building and construction industry in the region.
The country section of the report also provides individual market impacting factors and changes in regulations in the market that impact the current and future trends of the market. Data points, such as new and replacement sales, country demographics, disease epidemiology, and import-export tariffs, are some of the major pointers used to forecast the market scenario for individual countries. In addition, the presence and availability of Europe brands and their challenges faced due to high competition from local and domestic brands, and impact of sales channels are considered while providing forecast analysis of the country data.
Competitive Landscape and Braze Alloys Market Share Analysis
The Europe braze market alloys competitive landscape provides details by the competitors. Details included are company overview, company financials, revenue generated, market potential, investment in research and development, new market initiatives, GCC presence, production sites and facilities, production capacities, company strengths and weaknesses, product launch, product width and breadth, and application dominance. The above data points provided are only related to the companies' focus on Europe braze alloys market.
Some of the major players operating in the braze alloys market are Johnson Matthey, OC Oerlikon Management AG, Morgan Advanced Materials and its affiliates, Aimtek, Inc., AMETEK. Inc., TSI Technologies, ESAB (Subsidiary of Colfax Corporation), Umicore among others
Research Methodology
Data collection and base year analysis are done using data collection modules with large sample sizes. The market data is analyzed and estimated using market statistical and coherent models. In addition, market share analysis and key trend analysis are the major success factors in the market report. The key research methodology used by DBMR research team is data triangulation which involves data mining, analysis of the impact of data variables on the market, and primary (industry expert) validation. Apart from this, data models include Vendor Positioning Grid, Market Time Line Analysis, Market Overview and Guide, Company Positioning Grid, Company Market Share Analysis, Standards of Measurement, Europe Vs Regional and Vendor Share Analysis. Please request an analyst call in case of further inquiry.
SKU-