Medical Devices

Image

Asia-Pacific Aesthetic and Cosmetic Surgery Devices Market – Industry Trends and Forecast to 2028

  • Medical Devices
  • Published Report
  • Jun 2021
  • Asia-Pacific
  • 350 Pages
  • No of Tables: 179
  • No of Figures: 43

Asia-Pacific Aesthetic & Cosmetic Surgery Devices Market, By Type (Breast Implant/Mammary Implants, Implants for the Body and Custom Made Implants), Raw Material (Polymers, Metals and Biomaterials), End User (Clinics, Hospitals, Dermatology Clinics and Others), Distribution Channel (Direct Tender, Retail Pharmacies), Country(China, Japan, India, South Korea, Australia, Singapore, Thailand, Malaysia, Indonesia, Philippines, Vietnam, rest of Asia Pacific). Industry Trends and Forecast to 2028. 

Asia-Pacific Aesthetic and Cosmetic Surgery Devices Market

Market Analysis and Insights: Asia-Pacific Aesthetic and Cosmetic Surgery Devices Market

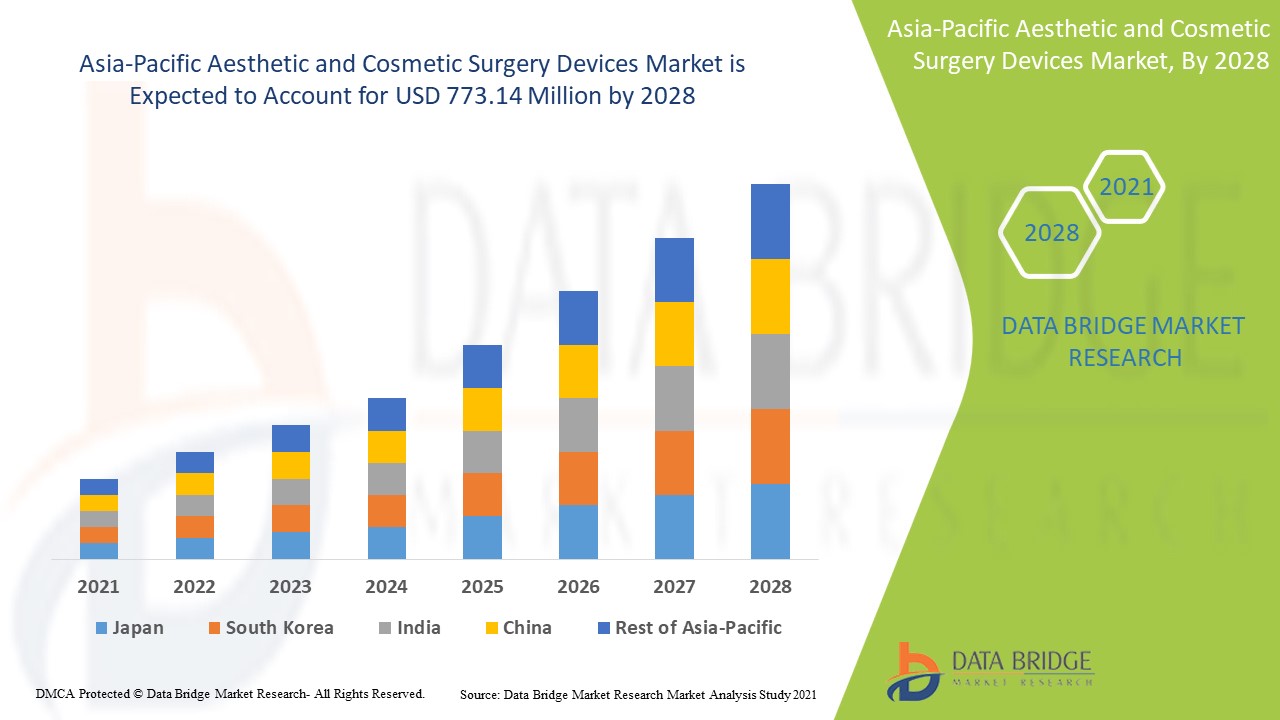
The aesthetic & cosmetic surgery devices market is expected to gain market growth in the forecast period of 2021 to 2028. Data Bridge Market Research analyses that the market is growing with a CAGR of 8.4% in the forecast period of 2021 to 2028 and is expected to reach USD 773.14 million by 2028. Growing geriatric population and rising per capita income are the major drivers which propelled the demand of the aesthetic & cosmetic surgery devices market in the forecast period. 

The aesthetic & cosmetic surgery devices market is growing tremendously across the globe due to the growing geriatric population across globe. The presence of wide range of aesthetic & cosmetic surgery devices products is satisfying the need of the surgeons during aesthetic & cosmetic surgery. The increased technological advancement leads to increased product launch by key market players of the aesthetic & cosmetic surgery devices market.

Advancement in healthcare infrastructure in developed as well as developing country is anticipated to bolster the further aesthetic & cosmetic surgery devices market growth. Devices/product recall by the regulatory authorities for patient health safety concerns such as inaccuracy of device, display error are few of the major concerns that acts as a restraint in the growth of the aesthetic & cosmetic surgery devices market. Favourable labour cost and increased developments in the developing countries makes the emerging markets as an opportunity for the growth of the aesthetic & cosmetic surgery devices market. Regulation policy and increasing risks associated with the procedure are acting as challenge for hampering the demand of the aesthetic & cosmetic surgery devices market.  

The aesthetic & cosmetic surgery devices market report provides details of market share, new developments, and product pipeline analysis, impact of domestic and localised market players, analyses opportunities in terms of emerging revenue pockets, changes in market regulations, product approvals, strategic decisions, product launches, geographic expansions, and technological innovations in the market. To understand the analysis and the market scenario contact us for an Analyst Brief, our team will help you create a revenue impact solution to achieve your desired goal.

Asia-Pacific Aesthetic and Cosmetic Surgery Devices Market

Asia-Pacific Aesthetic & Cosmetic Surgery Devices Market Scope and Market Size

The aesthetic & cosmetic surgery devices market is segmented on the basis of the type, raw material, end user and distribution channel. The growth among segments helps you analyse niche pockets of growth and strategies to approach the market and determine your core application areas and the difference in your target markets.

  • On the basis of type, the aesthetic & cosmetic surgery devices market is segmented into breast implant/mammary implants, implants for the body and custom made implants. In 2021, breast implant/mammary implants segment is dominating the market due to the rising prevalence and incidence of breast cancer across the globe.
  • On the basis of raw material, the aesthetic & cosmetic surgery devices market is segmented into polymers, metals and biomaterials. In 2021, polymers segment is dominating the market due to the rising healthcare expenditure and increasing demand of various polymer aesthetic & cosmetic surgery devices.
  • On the basis of end user, the aesthetic & cosmetic surgery devices market is segmented into clinics, hospitals, dermatology clinics and others. In 2021, hospitals segment is dominating the market as it provides patients with the best and accessible healthcare services.
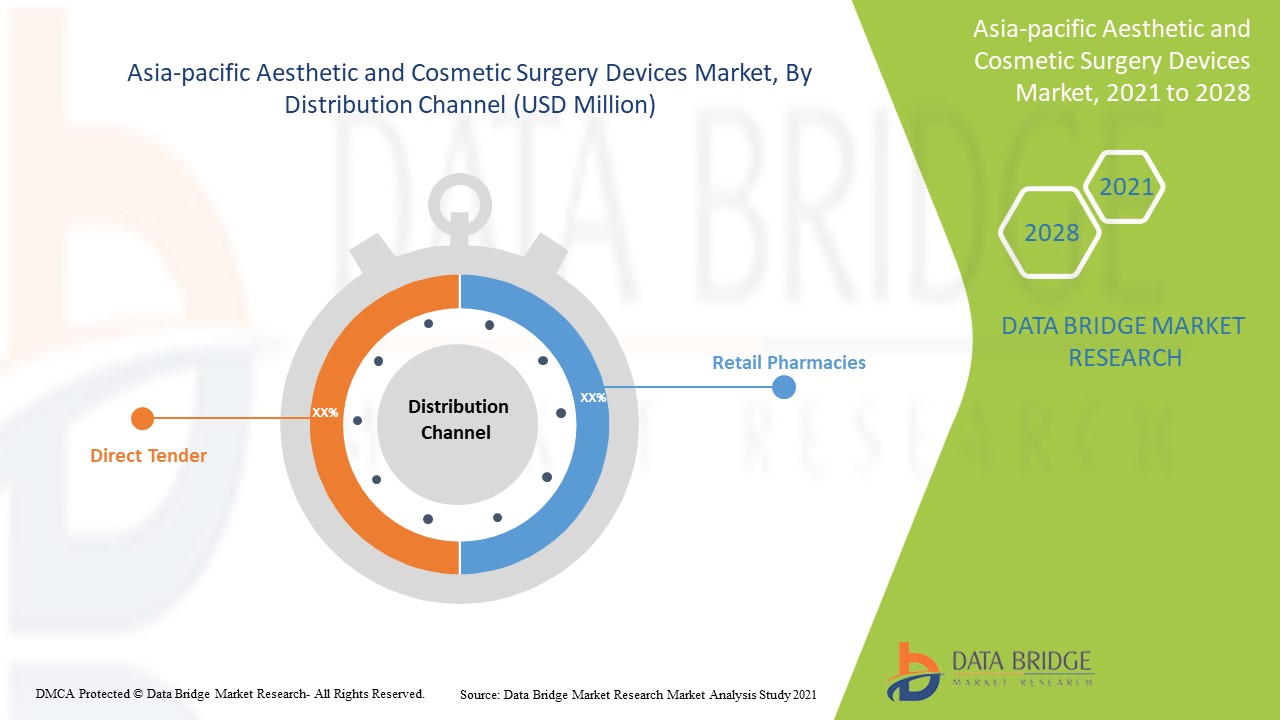
  • On the basis of distribution channel, the aesthetic & cosmetic surgery devices market is segmented into direct tender and retail pharmacies. In 2021, direct tender segment is dominating the market because direct tender holds the largest market share along with the highest CAGR because most of the service providers buy the devices from manufacturers and it is noticed that revenue from direct sales is higher, so it is influential as well as growing in the market.

Aesthetic & Cosmetic Surgery Devices Market Country Level Analysis

The aesthetic & cosmetic surgery devices market is analysed and market size information is provided by the country, type, raw material, end user and distribution channel as referenced above.

The countries covered in the Asia-Pacific aesthetic & cosmetic surgery devices market report are China, Japan, India, South Korea, Australia, Singapore, Thailand, Malaysia, and Indonesia, Philippines, Vietnam and rest of Asia Pacific.

China is leading the growth of the Asia-Pacific aesthetic & cosmetic surgery devices market due to growing geriatric population as well as technology advancement for the breast implant/mammary implants segment in healthcare sector.

The country section of the report also provides individual market impacting factors and changes in regulation in the market domestically that impacts the current and future trends of the market. Data points such as new sales, replacement sales, country demographics, regulatory acts and import-export tariffs are some of the major pointers used to forecast the market scenario for individual countries. Also, presence and availability of Asia-Pacific brands and their challenges faced due to large or scarce competition from local and domestic brands, impact of sales channels are considered while providing forecast analysis of the country data.  

Growing Strategic Activities by Major Market Players to enhance the awareness is boosting the Aesthetic & Cosmetic Surgery Devices Market Growth

The aesthetic & cosmetic surgery devices market also provides you with detailed market analysis for every country growth in aesthetic & cosmetic surgery devices industry. Moreover, it provides detailed information regarding aesthetic & cosmetic surgery devices sales, impact of regulatory scenarios, and trending parameters regarding aesthetic & cosmetic surgery devices market. The data is available for historic period 2011 to 2019.

Competitive Landscape and Aesthetic & Cosmetic Surgery Devices Market Share Analysis

The aesthetic & cosmetic surgery devices market competitive landscape provides details by competitor. Details included are company overview, company financials, revenue generated, market potential, investment in research and development, new market initiatives, production sites and facilities, company strengths and weaknesses, product launch, product trials pipelines, product approvals, patents, product width and breath, application dominance, technology lifeline curve. The above data points provided are only related to the company’s focus related to aesthetic & cosmetic surgery devices market.

The major players covered in the reports are Johnson & Johnson Services, Inc., Allergan (A Subsidiary of abbvie INC.),   Coloplast Corp, DPS Technology Development Ltd, GC Aesthetics, Hansbiomed Co. Ltd, Koken Co., Ltd., Laboratoires Arion, PMT Corporation, Polytech Health & Aesthetics Gmbh,   Shanghai Kangning Medical Supplies Ltd., Sientra, Inc., Stryker, Wanhe, Integra Lifesciences, Lipoelastic A.S., Defygravity, and Karl Storz Se & Co. Kg among others.. DBMR analysts understand competitive strengths and provide competitive analysis for each competitor separately.

Many contracts and agreements are also initiated by the companies’ worldwide which are also accelerating the aesthetic & cosmetic surgery devices market.

For instance,  

  • In May 2020, AbbVie Inc., the parent company of Allergan has completed its acquisition of Allergan. This acquisition has helped AbbVie Inc. to increase its market and demand for its product in future as the acquisition has combined the product portfolio of the companies thereby strengthening their business.

Collaboration, product launch, business expansion, award and recognition, joint ventures and other strategies by the market players is enhancing the company footprints in the aesthetic & cosmetic surgery devices market which also provides the benefit for organization’s profit growth.


SKU-

TABLE 1 BREAST CANCER RATE IN WORLD IN 2018

TABLE 2 BREAST CANCER RATE IN NORTH AMERICA IN 2018

TABLE 3 NEW CASES OF BREAST CANCER BY AGE GROUP IN AMERICA, 2017

TABLE 4 AESTHETIC BREAST SURGERY PROCEDURE IN AMERICA

TABLE 5 AESTHETIC BREAST SURGERY PROCEDURE IN SOME COUNTRIES OF LATIN AMERICA IN THE YEAR 2019

TABLE 6 APPROXIMATE COST OF BREAST AUGMENTATION VARIATIONS IN SAO PAULO, BRAZIL

TABLE 7 ASIA-PACIFIC BREAST RECONSTRUCTION MARKET, BY TYPE, 2014-2028 (USD MILLION)

TABLE 8 ASIA-PACIFIC BREAST IMPLANTS IN BREAST RECONSTRUCTION MARKET, BY REGION, 2014-2028 (USD MILLION)

TABLE 9 ASIA-PACIFIC BREAST IMPLANTS IN BREAST RECONSTRUCTION MARKET, BY TYPE, 2014-2028 (USD MILLION)

TABLE 10 ASIA-PACIFIC TISSUE EXPANDERS IN BREAST RECONSTRUCTION MARKET, BY REGION, 2014-2028 (USD MILLION)

TABLE 11 ASIA-PACIFIC IMPLANTS ACCESSORIES IN BREAST RECONSTRUCTION MARKET, BY REGION, 2014-2028 (USD MILLION)

TABLE 12 ASIA-PACIFIC BREAST RECONSTRUCTION MARKET, BY TECHNOLOGY, 2014-2028 (USD MILLION)

TABLE 13 ASIA-PACIFIC INFRAMAMMARY IN BREAST RECONSTRUCTION MARKET, BY REGION, 2014-2028 (USD MILLION)

TABLE 14 ASIA-PACIFIC TRANS-AXILLARY IN BREAST RECONSTRUCTION MARKET, BY REGION, 2014-2028 (USD MILLION)

TABLE 15 ASIA-PACIFIC PERI-AREOLAR IN BREAST RECONSTRUCTION MARKET, BY REGION, 2014-2028 (USD MILLION)

TABLE 16 ASIA-PACIFIC TRANS UMBILLICAL IN BREAST RECONSTRUCTION MARKET, BY REGION, 2014-2028 (USD MILLION)

TABLE 17 ASIA-PACIFIC BREAST RECONSTRUCTION MARKET, BY RECONSTRUCTION SHAPE, 2014-2028 (USD MILLION)

TABLE 18 ASIA-PACIFIC ROUND IMPLANT SHAPE IN BREAST RECONSTRUCTION MARKET, BY REGION, 2014-2028 (USD MILLION)

TABLE 19 ASIA-PACIFIC ANATOMICAL IMPLANT SHAPE IN BREAST RECONSTRUCTION MARKET, BY REGION, 2014-2028 (USD MILLION)

TABLE 20 ASIA-PACIFIC ROUND EXPANDER SHAPE IN BREAST RECONSTRUCTION MARKET, BY REGION, 2014-2028 (USD MILLION)

TABLE 21 ASIA-PACIFIC ANATOMICAL EXPANDER SHAPE IN BREAST RECONSTRUCTION MARKET, BY REGION, 2014-2028 (USD MILLION)

TABLE 22 ASIA-PACIFIC BREAST RECONSTRUCTION MARKET, BY PLACEMENT, 2014-2028 (USD MILLION)

TABLE 23 ASIA-PACIFIC DUAL-PLANE INSERTION IN BREAST RECONSTRUCTION MARKET, BY REGION, 2014-2028 (USD MILLION)

TABLE 24 ASIA-PACIFIC SUBGLANDULAR INSERTION IN BREAST RECONSTRUCTION MARKET, BY REGION, 2014-2028 (USD MILLION)

TABLE 25 ASIA-PACIFIC SUBMUSCULAR INSERTION IN BREAST RECONSTRUCTION MARKET, BY REGION, 2014-2028 (USD MILLION)

TABLE 26 ASIA-PACIFIC BREAST RECONSTRUCTION MARKET, BY END USER, 2014-2028 (USD MILLION)

TABLE 27 ASIA-PACIFIC HOSPITAL IN BREAST RECONSTRUCTION MARKET, BY REGION, 2014-2028 (USD MILLION)

TABLE 28 ASIA-PACIFIC CLINIC IN BREAST RECONSTRUCTION MARKET, BY REGION, 2014-2028 (USD MILLION)

TABLE 29 ASIA-PACIFIC AMBULATORY SURGICAL CENTERS IN BREAST RECONSTRUCTION MARKET, BY REGION, 2014-2028 (USD MILLION)

TABLE 30 ASIA-PACIFIC BREAST RECONSTRUCTION MARKET, BY DISTRIBUTION CHANNEL, 2014-2028 (USD MILLION)

TABLE 31 ASIA-PACIFIC DIRECT TENDER IN BREAST RECONSTRUCTION MARKET, BY REGION, 2014-2028 (USD MILLION)

TABLE 32 ASIA-PACIFIC RETAIL SALES IN BREAST RECONSTRUCTION MARKET, BY REGION, 2014-2028 (USD MILLION)

TABLE 33 ASIA-PACIFIC BREAST RECONSTRUCTION MARKET, BY COUNTRY, 2014-2028 (USD MILLION)

TABLE 34 ASIA-PACIFIC BREAST RECONSTRUCTION MARKET, BY TYPE, 2014-2028 (USD MILLION)

TABLE 35 ASIA-PACIFIC BREAST RECONSTRUCTION MARKET, BY TYPE, 2014-2028 (UNITS)

TABLE 36 ASIA-PACIFIC BREAST RECONSTRUCTION MARKET, BY TYPE, 2014-2028 (ASP)

TABLE 37 ASIA-PACIFIC BREAST IMPLANTS IN BREAST RECONSTRUCTION MARKET, BY TYPE, 2014-2028 (USD MILLION)

TABLE 38 ASIA-PACIFIC BREAST IMPLANTS IN BREAST RECONSTRUCTION MARKET, BY TYPE, 2014-2028 (UNITS)

TABLE 39 ASIA-PACIFIC BREAST IMPLANTS IN BREAST RECONSTRUCTION MARKET, BY TYPE, 2014-2028 (ASP)

TABLE 40 ASIA-PACIFIC BREAST RECONSTRUCTION MARKET, BY TECHNOLOGY, 2014-2028 (USD MILLION)

TABLE 41 ASIA-PACIFIC BREAST RECONSTRUCTION MARKET, BY RECONSTRUCTION SHAPE, 2014-2028 (USD MILLION)

TABLE 42 ASIA-PACIFIC BREAST RECONSTRUCTION MARKET, BY PLACEMENT, 2014-2028 (USD MILLION)

TABLE 43 ASIA-PACIFIC BREAST RECONSTRUCTION MARKET, BY END USER, 2014-2028 (USD MILLION)

TABLE 44 ASIA-PACIFIC BREAST RECONSTRUCTION MARKET, BY DISTRIBUTION CHANNEL, 2014-2028 (USD MILLION)

TABLE 45 CHINA BREAST RECONSTRUCTION MARKET, BY TYPE, 2014-2028 (USD MILLION)

TABLE 46 CHINA BREAST RECONSTRUCTION MARKET, BY TYPE, 2014-2028 (UNITS)

TABLE 47 CHINA BREAST RECONSTRUCTION MARKET, BY TYPE, 2014-2028 (ASP)

TABLE 48 CHINA BREAST IMPLANTS IN BREAST RECONSTRUCTION MARKET, BY TYPE, 2014-2028 (USD MILLION)

TABLE 49 CHINA BREAST IMPLANTS IN BREAST RECONSTRUCTION MARKET, BY TYPE, 2014-2028 (UNITS)

TABLE 50 CHINA BREAST IMPLANTS IN BREAST RECONSTRUCTION MARKET, BY TYPE, 2014-2028 (ASP)

TABLE 51 CHINA BREAST RECONSTRUCTION MARKET, BY TECHNOLOGY, 2014-2028 (USD MILLION)

TABLE 52 CHINA BREAST RECONSTRUCTION MARKET, BY RECONSTRUCTION SHAPE, 2014-2028 (USD MILLION)

TABLE 53 CHINA BREAST RECONSTRUCTION MARKET, BY PLACEMENT, 2014-2028 (USD MILLION)

TABLE 54 CHINA BREAST RECONSTRUCTION MARKET, BY END USER, 2014-2028 (USD MILLION)

TABLE 55 CHINA BREAST RECONSTRUCTION MARKET, BY DISTRIBUTION CHANNEL, 2014-2028 (USD MILLION)

TABLE 56 JAPAN BREAST RECONSTRUCTION MARKET, BY TYPE, 2014-2028 (USD MILLION)

TABLE 57 JAPAN BREAST RECONSTRUCTION MARKET, BY TYPE, 2014-2028 (UNITS)

TABLE 58 JAPAN BREAST RECONSTRUCTION MARKET, BY TYPE, 2014-2028 (ASP)

TABLE 59 JAPAN BREAST IMPLANTS IN BREAST RECONSTRUCTION MARKET, BY TYPE, 2014-2028 (USD MILLION)

TABLE 60 JAPAN BREAST IMPLANTS IN BREAST RECONSTRUCTION MARKET, BY TYPE, 2014-2028 (UNITS)

TABLE 61 JAPAN BREAST IMPLANTS IN BREAST RECONSTRUCTION MARKET, BY TYPE, 2014-2028 (ASP)

TABLE 62 JAPAN BREAST RECONSTRUCTION MARKET, BY TECHNOLOGY, 2014-2028 (USD MILLION)

TABLE 63 JAPAN BREAST RECONSTRUCTION MARKET, BY RECONSTRUCTION SHAPE, 2014-2028 (USD MILLION)

TABLE 64 JAPAN BREAST RECONSTRUCTION MARKET, BY PLACEMENT, 2014-2028 (USD MILLION)

TABLE 65 JAPAN BREAST RECONSTRUCTION MARKET, BY END USER, 2014-2028 (USD MILLION)

TABLE 66 JAPAN BREAST RECONSTRUCTION MARKET, BY DISTRIBUTION CHANNEL, 2014-2028 (USD MILLION)

TABLE 67 SOUTH KOREA BREAST RECONSTRUCTION MARKET, BY TYPE, 2014-2028 (USD MILLION)

TABLE 68 SOUTH KOREA BREAST RECONSTRUCTION MARKET, BY TYPE, 2014-2028 (UNITS)

TABLE 69 SOUTH KOREA BREAST RECONSTRUCTION MARKET, BY TYPE, 2014-2028 (ASP)

TABLE 70 SOUTH KOREA BREAST IMPLANTS IN BREAST RECONSTRUCTION MARKET, BY TYPE, 2014-2028 (USD MILLION)

TABLE 71 SOUTH KOREA BREAST IMPLANTS IN BREAST RECONSTRUCTION MARKET, BY TYPE, 2014-2028 (UNITS)

TABLE 72 SOUTH KOREA BREAST IMPLANTS IN BREAST RECONSTRUCTION MARKET, BY TYPE, 2014-2028 (ASP)

TABLE 73 SOUTH KOREA BREAST RECONSTRUCTION MARKET, BY TECHNOLOGY, 2014-2028 (USD MILLION)

TABLE 74 SOUTH KOREA BREAST RECONSTRUCTION MARKET, BY RECONSTRUCTION SHAPE, 2014-2028 (USD MILLION)

TABLE 75 SOUTH KOREA BREAST RECONSTRUCTION MARKET, BY PLACEMENT, 2014-2028 (USD MILLION)

TABLE 76 SOUTH KOREA BREAST RECONSTRUCTION MARKET, BY END USER, 2014-2028 (USD MILLION)

TABLE 77 SOUTH KOREA BREAST RECONSTRUCTION MARKET, BY DISTRIBUTION CHANNEL, 2014-2028 (USD MILLION)

TABLE 78 INDIA BREAST RECONSTRUCTION MARKET, BY TYPE, 2014-2028 (USD MILLION)

TABLE 79 INDIA BREAST RECONSTRUCTION MARKET, BY TYPE, 2014-2028 (UNITS)

TABLE 80 INDIA BREAST RECONSTRUCTION MARKET, BY TYPE, 2014-2028 (ASP)

TABLE 81 INDIA BREAST IMPLANTS IN BREAST RECONSTRUCTION MARKET, BY TYPE, 2014-2028 (USD MILLION)

TABLE 82 INDIA BREAST IMPLANTS IN BREAST RECONSTRUCTION MARKET, BY TYPE, 2014-2028 (UNITS)

TABLE 83 INDIA BREAST IMPLANTS IN BREAST RECONSTRUCTION MARKET, BY TYPE, 2014-2028 (ASP)

TABLE 84 INDIA BREAST RECONSTRUCTION MARKET, BY TECHNOLOGY, 2014-2028 (USD MILLION)

TABLE 85 INDIA BREAST RECONSTRUCTION MARKET, BY RECONSTRUCTION SHAPE, 2014-2028 (USD MILLION)

TABLE 86 INDIA BREAST RECONSTRUCTION MARKET, BY PLACEMENT, 2014-2028 (USD MILLION)

TABLE 87 INDIA BREAST RECONSTRUCTION MARKET, BY END USER, 2014-2028 (USD MILLION)

TABLE 88 INDIA BREAST RECONSTRUCTION MARKET, BY DISTRIBUTION CHANNEL, 2014-2028 (USD MILLION)

TABLE 89 AUSTRALIA BREAST RECONSTRUCTION MARKET, BY TYPE, 2014-2028 (USD MILLION)

TABLE 90 AUSTRALIA BREAST RECONSTRUCTION MARKET, BY TYPE, 2014-2028 (UNITS)

TABLE 91 AUSTRALIA BREAST RECONSTRUCTION MARKET, BY TYPE, 2014-2028 (ASP)

TABLE 92 AUSTRALIA BREAST IMPLANTS IN BREAST RECONSTRUCTION MARKET, BY TYPE, 2014-2028 (USD MILLION)

TABLE 93 AUSTRALIA BREAST IMPLANTS IN BREAST RECONSTRUCTION MARKET, BY TYPE, 2014-2028 (UNITS)

TABLE 94 AUSTRALIA BREAST IMPLANTS IN BREAST RECONSTRUCTION MARKET, BY TYPE, 2014-2028 (ASP)

TABLE 95 AUSTRALIA BREAST RECONSTRUCTION MARKET, BY TECHNOLOGY, 2014-2028 (USD MILLION)

TABLE 96 AUSTRALIA BREAST RECONSTRUCTION MARKET, BY RECONSTRUCTION SHAPE, 2014-2028 (USD MILLION)

TABLE 97 AUSTRALIA BREAST RECONSTRUCTION MARKET, BY PLACEMENT, 2014-2028 (USD MILLION)

TABLE 98 AUSTRALIA BREAST RECONSTRUCTION MARKET, BY END USER, 2014-2028 (USD MILLION)

TABLE 99 AUSTRALIA BREAST RECONSTRUCTION MARKET, BY DISTRIBUTION CHANNEL, 2014-2028 (USD MILLION)

TABLE 100 SINGAPORE BREAST RECONSTRUCTION MARKET, BY TYPE, 2014-2028 (USD MILLION)

TABLE 101 SINGAPORE BREAST RECONSTRUCTION MARKET, BY TYPE, 2014-2028 (UNITS)

TABLE 102 SINGAPORE BREAST RECONSTRUCTION MARKET, BY TYPE, 2014-2028 (ASP)

TABLE 103 SINGAPORE BREAST IMPLANTS IN BREAST RECONSTRUCTION MARKET, BY TYPE, 2014-2028 (USD MILLION)

TABLE 104 SINGAPORE BREAST IMPLANTS IN BREAST RECONSTRUCTION MARKET, BY TYPE, 2014-2028 (UNITS)

TABLE 105 SINGAPORE BREAST IMPLANTS IN BREAST RECONSTRUCTION MARKET, BY TYPE, 2014-2028 (ASP)

TABLE 106 SINGAPORE BREAST RECONSTRUCTION MARKET, BY TECHNOLOGY, 2014-2028 (USD MILLION)

TABLE 107 SINGAPORE BREAST RECONSTRUCTION MARKET, BY RECONSTRUCTION SHAPE, 2014-2028 (USD MILLION)

TABLE 108 SINGAPORE BREAST RECONSTRUCTION MARKET, BY PLACEMENT, 2014-2028 (USD MILLION)

TABLE 109 SINGAPORE BREAST RECONSTRUCTION MARKET, BY END USER, 2014-2028 (USD MILLION)

TABLE 110 SINGAPORE BREAST RECONSTRUCTION MARKET, BY DISTRIBUTION CHANNEL, 2014-2028 (USD MILLION)

TABLE 111 MALAYSIA BREAST RECONSTRUCTION MARKET, BY TYPE, 2014-2028 (USD MILLION)

TABLE 112 MALAYSIA BREAST RECONSTRUCTION MARKET, BY TYPE, 2014-2028 (UNITS)

TABLE 113 MALAYSIA BREAST RECONSTRUCTION MARKET, BY TYPE, 2014-2028 (ASP)

TABLE 114 MALAYSIA BREAST IMPLANTS IN BREAST RECONSTRUCTION MARKET, BY TYPE, 2014-2028 (USD MILLION)

TABLE 115 MALAYSIA BREAST IMPLANTS IN BREAST RECONSTRUCTION MARKET, BY TYPE, 2014-2028 (UNITS)

TABLE 116 MALAYSIA BREAST IMPLANTS IN BREAST RECONSTRUCTION MARKET, BY TYPE, 2014-2028 (ASP)

TABLE 117 MALAYSIA BREAST RECONSTRUCTION MARKET, BY TECHNOLOGY, 2014-2028 (USD MILLION)

TABLE 118 MALAYSIA BREAST RECONSTRUCTION MARKET, BY RECONSTRUCTION SHAPE, 2014-2028 (USD MILLION)

TABLE 119 MALAYSIA BREAST RECONSTRUCTION MARKET, BY PLACEMENT, 2014-2028 (USD MILLION)

TABLE 120 MALAYSIA BREAST RECONSTRUCTION MARKET, BY END USER, 2014-2028 (USD MILLION)

TABLE 121 MALAYSIA BREAST RECONSTRUCTION MARKET, BY DISTRIBUTION CHANNEL, 2014-2028 (USD MILLION)

TABLE 122 THAILAND BREAST RECONSTRUCTION MARKET, BY TYPE, 2014-2028 (USD MILLION)

TABLE 123 THAILAND BREAST RECONSTRUCTION MARKET, BY TYPE, 2014-2028 (UNITS)

TABLE 124 THAILAND BREAST RECONSTRUCTION MARKET, BY TYPE, 2014-2028 (ASP)

TABLE 125 THAILAND BREAST IMPLANTS IN BREAST RECONSTRUCTION MARKET, BY TYPE, 2014-2028 (USD MILLION)

TABLE 126 THAILAND BREAST IMPLANTS IN BREAST RECONSTRUCTION MARKET, BY TYPE, 2014-2028 (UNITS)

TABLE 127 THAILAND BREAST IMPLANTS IN BREAST RECONSTRUCTION MARKET, BY TYPE, 2014-2028 (ASP)

TABLE 128 THAILAND BREAST RECONSTRUCTION MARKET, BY TECHNOLOGY, 2014-2028 (USD MILLION)

TABLE 129 THAILAND BREAST RECONSTRUCTION MARKET, BY RECONSTRUCTION SHAPE, 2014-2028 (USD MILLION)

TABLE 130 THAILAND BREAST RECONSTRUCTION MARKET, BY PLACEMENT, 2014-2028 (USD MILLION)

TABLE 131 THAILAND BREAST RECONSTRUCTION MARKET, BY END USER, 2014-2028 (USD MILLION)

TABLE 132 THAILAND BREAST RECONSTRUCTION MARKET, BY DISTRIBUTION CHANNEL, 2014-2028 (USD MILLION)

TABLE 133 INDONESIA BREAST RECONSTRUCTION MARKET, BY TYPE, 2014-2028 (USD MILLION)

TABLE 134 INDONESIA BREAST RECONSTRUCTION MARKET, BY TYPE, 2014-2028 (UNITS)

TABLE 135 INDONESIA BREAST RECONSTRUCTION MARKET, BY TYPE, 2014-2028 (ASP)

TABLE 136 INDONESIA BREAST IMPLANTS IN BREAST RECONSTRUCTION MARKET, BY TYPE, 2014-2028 (USD MILLION)

TABLE 137 INDONESIA BREAST IMPLANTS IN BREAST RECONSTRUCTION MARKET, BY TYPE, 2014-2028 (UNITS)

TABLE 138 INDONESIA BREAST IMPLANTS IN BREAST RECONSTRUCTION MARKET, BY TYPE, 2014-2028 (ASP)

TABLE 139 INDONESIA BREAST RECONSTRUCTION MARKET, BY TECHNOLOGY, 2014-2028 (USD MILLION)

TABLE 140 INDONESIA BREAST RECONSTRUCTION MARKET, BY RECONSTRUCTION SHAPE, 2014-2028 (USD MILLION)

TABLE 141 INDONESIA BREAST RECONSTRUCTION MARKET, BY PLACEMENT, 2014-2028 (USD MILLION)

TABLE 142 INDONESIA BREAST RECONSTRUCTION MARKET, BY END USER, 2014-2028 (USD MILLION)

TABLE 143 INDONESIA BREAST RECONSTRUCTION MARKET, BY DISTRIBUTION CHANNEL, 2014-2028 (USD MILLION)

TABLE 144 PHILIPPINES BREAST RECONSTRUCTION MARKET, BY TYPE, 2014-2028 (USD MILLION)

TABLE 145 PHILIPPINES BREAST RECONSTRUCTION MARKET, BY TYPE, 2014-2028 (UNITS)

TABLE 146 PHILIPPINES BREAST RECONSTRUCTION MARKET, BY TYPE, 2014-2028 (ASP)

TABLE 147 PHILIPPINES BREAST IMPLANTS IN BREAST RECONSTRUCTION MARKET, BY TYPE, 2014-2028 (USD MILLION)

TABLE 148 PHILIPPINES BREAST IMPLANTS IN BREAST RECONSTRUCTION MARKET, BY TYPE, 2014-2028 (UNITS)

TABLE 149 PHILIPPINES BREAST IMPLANTS IN BREAST RECONSTRUCTION MARKET, BY TYPE, 2014-2028 (ASP)

TABLE 150 PHILIPPINES BREAST RECONSTRUCTION MARKET, BY TECHNOLOGY, 2014-2028 (USD MILLION)

TABLE 151 PHILIPPINES BREAST RECONSTRUCTION MARKET, BY RECONSTRUCTION SHAPE, 2014-2028 (USD MILLION)

TABLE 152 PHILIPPINES BREAST RECONSTRUCTION MARKET, BY PLACEMENT, 2014-2028 (USD MILLION)

TABLE 153 PHILIPPINES BREAST RECONSTRUCTION MARKET, BY END USER, 2014-2028 (USD MILLION)

TABLE 154 PHILIPPINES BREAST RECONSTRUCTION MARKET, BY DISTRIBUTION CHANNEL, 2014-2028 (USD MILLION)

TABLE 155 VIETNAM BREAST RECONSTRUCTION MARKET, BY TYPE, 2014-2028 (USD MILLION)

TABLE 156 VIETNAM BREAST RECONSTRUCTION MARKET, BY TYPE, 2014-2028 (UNITS)

TABLE 157 VIETNAM BREAST RECONSTRUCTION MARKET, BY TYPE, 2014-2028 (ASP)

TABLE 158 VIETNAM BREAST IMPLANTS IN BREAST RECONSTRUCTION MARKET, BY TYPE, 2014-2028 (USD MILLION)

TABLE 159 VIETNAM BREAST IMPLANTS IN BREAST RECONSTRUCTION MARKET, BY TYPE, 2014-2028 (UNITS)

TABLE 160 VIETNAM BREAST IMPLANTS IN BREAST RECONSTRUCTION MARKET, BY TYPE, 2014-2028 (ASP)

TABLE 161 VIETNAM BREAST RECONSTRUCTION MARKET, BY TECHNOLOGY, 2014-2028 (USD MILLION)

TABLE 162 VIETNAM BREAST RECONSTRUCTION MARKET, BY RECONSTRUCTION SHAPE, 2014-2028 (USD MILLION)

TABLE 163 VIETNAM BREAST RECONSTRUCTION MARKET, BY PLACEMENT, 2014-2028 (USD MILLION)

TABLE 164 VIETNAM BREAST RECONSTRUCTION MARKET, BY END USER, 2014-2028 (USD MILLION)

TABLE 165 VIETNAM BREAST RECONSTRUCTION MARKET, BY DISTRIBUTION CHANNEL, 2014-2028 (USD MILLION)

TABLE 166 BANGLADESH BREAST RECONSTRUCTION MARKET, BY TYPE, 2014-2028 (USD MILLION)

TABLE 167 BANGLADESH BREAST RECONSTRUCTION MARKET, BY TYPE, 2014-2028 (UNITS)

TABLE 168 BANGLADESH BREAST RECONSTRUCTION MARKET, BY TYPE, 2014-2028 (ASP)

TABLE 169 BANGLADESH BREAST IMPLANTS IN BREAST RECONSTRUCTION MARKET, BY TYPE, 2014-2028 (USD MILLION)

TABLE 170 BANGLADESH BREAST IMPLANTS IN BREAST RECONSTRUCTION MARKET, BY TYPE, 2014-2028 (UNITS)

TABLE 171 BANGLADESH BREAST IMPLANTS IN BREAST RECONSTRUCTION MARKET, BY TYPE, 2014-2028 (ASP)

TABLE 172 BANGLADESH BREAST RECONSTRUCTION MARKET, BY TECHNOLOGY, 2014-2028 (USD MILLION)

TABLE 173 BANGLADESH BREAST RECONSTRUCTION MARKET, BY RECONSTRUCTION SHAPE, 2014-2028 (USD MILLION)

TABLE 174 BANGLADESH BREAST RECONSTRUCTION MARKET, BY PLACEMENT, 2014-2028 (USD MILLION)

TABLE 175 BANGLADESH BREAST RECONSTRUCTION MARKET, BY END USER, 2014-2028 (USD MILLION)

TABLE 176 BANGLADESH BREAST RECONSTRUCTION MARKET, BY DISTRIBUTION CHANNEL, 2014-2028 (USD MILLION)

TABLE 177 REST OF ASIA-PACIFIC BREAST RECONSTRUCTION MARKET, BY TYPE, 2014-2028 (USD MILLION)

TABLE 178 REST OF ASIA-PACIFIC BREAST RECONSTRUCTION MARKET, BY TYPE, 2014-2028 (UNITS)

TABLE 179 REST OF ASIA-PACIFIC BREAST RECONSTRUCTION MARKET, BY TYPE, 2014-2028 (ASP)

Please fill in the below form for Infographics

By clicking the "Submit" button, you are agreeing to the Data Bridge Market Research Privacy Policy and Terms and Conditions

Research Methodology:

Data collection and base year analysis are done using data collection modules with large sample sizes. The stage includes obtaining market information or related data through various sources and strategies. It includes examining and planning all the data acquired from the past in advance. It likewise envelops the examination of information inconsistencies seen across different information sources. The market data is analysed and estimated using market statistical and coherent models. Also, market share analysis and key trend analysis are the major success factors in the market report. To know more, please request an analyst call or drop down your inquiry.

The key research methodology used by DBMR research team is data triangulation which involves data mining, analysis of the impact of data variables on the market and primary (industry expert) validation. Data models include Vendor Positioning Grid, Market Time Line Analysis, Market Overview and Guide, Company Positioning Grid, Patent Analysis, Pricing Analysis, Company Market Share Analysis, Standards of Measurement, Global versus Regional and Vendor Share Analysis. To know more about the research methodology, drop in an inquiry to speak to our industry experts.

Please fill in the below form for Research Methodology

By clicking the "Submit" button, you are agreeing to the Data Bridge Market Research Privacy Policy and Terms and Conditions

Customization Available:

Data Bridge Market Research is a leader in advanced formative research. We take pride in servicing our existing and new customers with data and analysis that match and suits their goal. The report can be customized to include price trend analysis of target brands understanding the market for additional countries (ask for the list of countries), clinical trial results data, literature review, refurbished market and product base analysis. Market analysis of target competitors can be analyzed from technology-based analysis to market portfolio strategies. We can add as many competitors that you require data about in the format and data style you are looking for. Our team of analysts can also provide you data in crude raw excel files pivot tables (Fact book) or can assist you in creating presentations from the data sets available in the report.

Please fill in the below form for Available Customization

By clicking the "Submit" button, you are agreeing to the Data Bridge Market Research Privacy Policy and Terms and Conditions

FREQUENTLY ASK QUESTIONS

The Asia-Pacific Aesthetic and Cosmetic Surgery Devices Market is projected to grow at a CAGR of 8.4% during the forecast period by 2028.
The future market value of the Asia-Pacific Aesthetic and Cosmetic Surgery Devices Market is expected to reach USD 773.14 million by 2028.
The major players in the Asia-Pacific Aesthetic and Cosmetic Surgery Devices Market are Johnson & Johnson Services, Inc., Allergan (A Subsidiary of abbvie INC.), Bonashmedical, Cereplas, Coloplast Corp, DPS Technology Development Ltd, Establishment Labs S.A., GC Aesthetics, Hansbiomed co. Ltd, Implantech, etc.
The countries covered in the Asia-Pacific Aesthetic and Cosmetic Surgery Devices Market are U.K., Germany, France, Spain, Italy, Netherlands, Switzerland, Russia, Turkey, Austria, Norway, Hungary, Lithuania, Ireland, Poland and rest of Europe.
Free Sample Report

CHOOSE LICENCE TYPE

  • 4200.00
  • 3500.00
  • 2000.00
  • 5500.00
  • 7500.00

Why Choose Us

Industry Coverage

DBMR works across the globe in multiple industries which equip us with knowledge across verticals and provide our clients with insights not only from their industry but how other industries will impact their ecosystem.

Regional Coverage

Coverage of Data Bridge is not restricted to developed or emerging economies. We work across the globe covering the largest array of countries where no other market research or business consulting firm has ever conducted research; creating growth opportunities for our clients in areas which are still unknown.

Technology Coverage

In today’s world, technology drives the market sentiment, so our vision is to provide our clients insights not only for developed technologies but upcoming and disrupting technological changes throughout the product lifecycle by enabling them with unforeseen opportunities in the market which will create disruption in their industry. This leads to innovation and our clients to come out as winners.

Goal Oriented Solutions

DBMR goal is to help our clients achieve their goals through our solutions; hence we formatively create the most appropriate solutions for our client needs, saving time and efforts for them to drive their grand strategies.

Unparallel Analyst Support

Our analysts take pride in our clients’ success. Unlike others, we believe in working along our clients to achieve their goals with 24 hours analyst support determining the correct needs and inspire innovation through service.

Banner

Client Testimonials