Chemical and Materials

Image

Europe Artificial Turf Market – Industry Trends and Forecast to 2028

  • Chemical and Materials
  • Published Report
  • Jun 2021
  • Europe
  • 350 Pages
  • No of Tables: 126
  • No of Figures: 28

Europe Artificial Turf Market, By Raw Material (Nylon, Polypropylene, Polyethylene, Polyamides, Jute, Rubber, Others), Infill Materials (Petroleum-Based, Organic Infill, Sand (Silica) Infill, Others), Pile Height (Less Than 10 mm, 10-30 mm, 30-50 mm, 50-70 mm, 70-100 mm, More Than 100 mm), Distribution Channel (Direct Sales/B2B, E-Commerce, Specialty Stores, Convenience Stores, Others), End-User (Households, Sports & Leisure, Restaurant, Hotels, Airports, Commercial Offices, Pet Areas, Others), Country (Germany, U.K., Italy, France, Spain, Russia, Turkey, Switzerland, Belgium, Netherlands, Rest of Europe) Industry Trends and Forecast to 2028.

Europe Artificial Turf Market

Market Analysis and Insights: Europe Artificial Turf Market

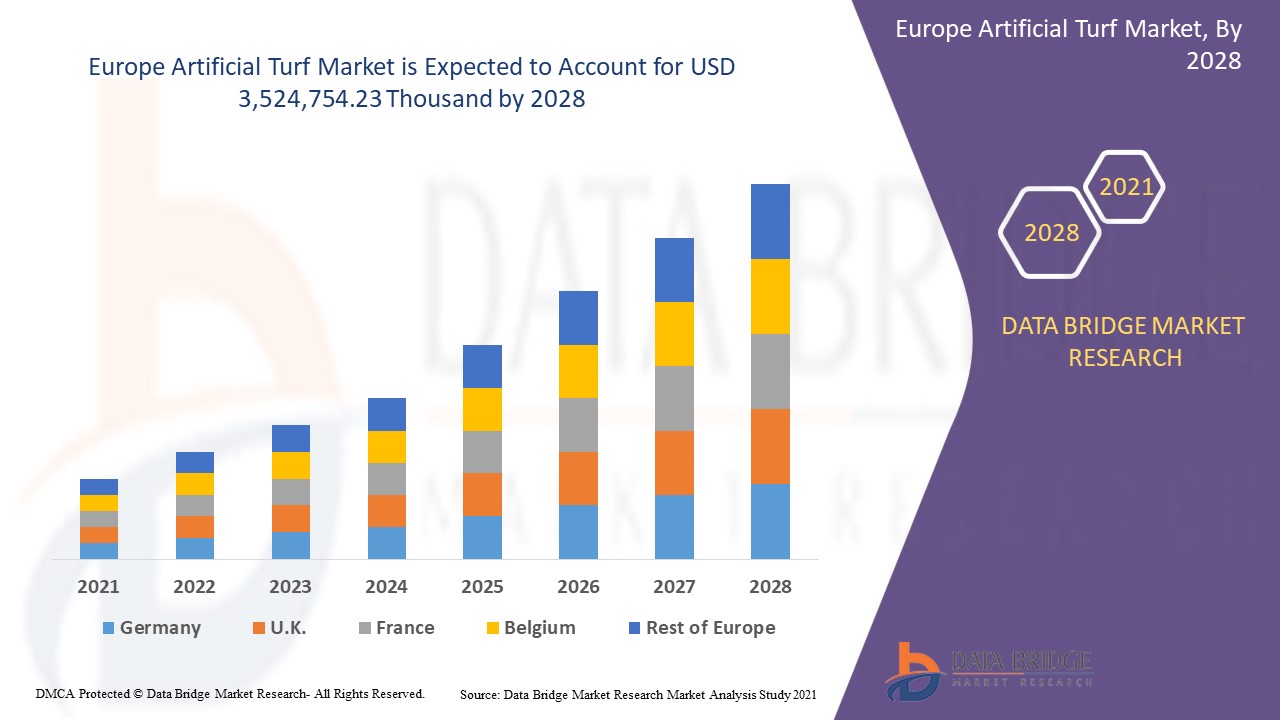
The artificial turf market is expected to gain market growth in the forecast period of 2021 to 2028. Data Bridge Market Research analyses that the market is growing with a CAGR of 18.5% in the forecast period of 2021 to 2028 and is expected to reach USD 3,524,754.23 thousand by 2028. Increasing demand of cosmetics among consumers is a driving factor for the market growth.

The artificial turf is a composite consisting of man-crafted, organic and grassy fibers. The blades are green and are usable in different stack heights. This is designed in the same fashion as a tapet, it has a strong back and the blades are stitched on by machine. The majority of the new glass developed often weaves into a brown stalk which resembled the appearance of dead grass one see in a real grassy pelvis.

The easy installation, environment friendly and low maintenance requirements which will increase the production of artificial turf products drives the market. With the increase in the growing demand from sports clubs and different venues will also boosts the demand of the artificial turf market. The stringent regulations regarding usage of artificial turf in several European countries will restrain the demand of the artificial turf market. The increase in the demand for the third generation artificial turf will act as an opportunity for the artificial turf market. The difficulty in maintaining a high field temperature due to the raw material and infill material acts as the challenge for the artificial turf market. 

This artificial turf market report provides details of market share, new developments and product pipeline analysis, impact of domestic and localised market players, analyses opportunities in terms of emerging revenue pockets, changes in market regulations, product approvals, strategic decisions, product launches, geographic expansions and technological innovations in the market. To understand the analysis and the artificial turf market scenario contact Data Bridge Market Research for an Analyst Brief, our team will help you create a revenue impact solution to achieve your desired goal.

Europe Artificial Turf Market

Artificial Turf Market Scope and Market Size

The artificial turf market is segmented on the basis of raw material, infill materials, pile height, distribution channel and end-user. The growth among segments helps you analyse niche pockets of growth and strategies to approach the market and determine your core application areas and the difference in your target markets.

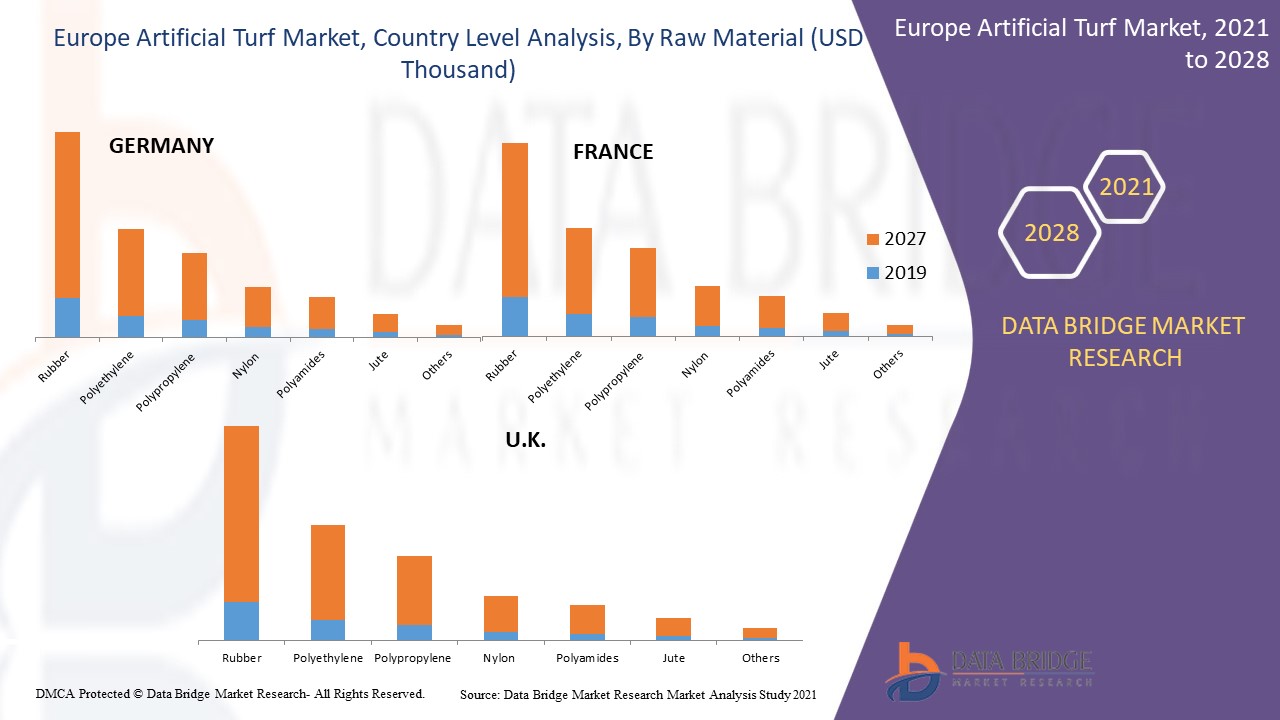
  • On the basis of raw material, the market is segmented into nylon, polypropylene, polyethylene, polyamides, jute, rubber and others. In 2020, rubber segment is dominating the market as they are considered to be the most stable base for the artificial turf.
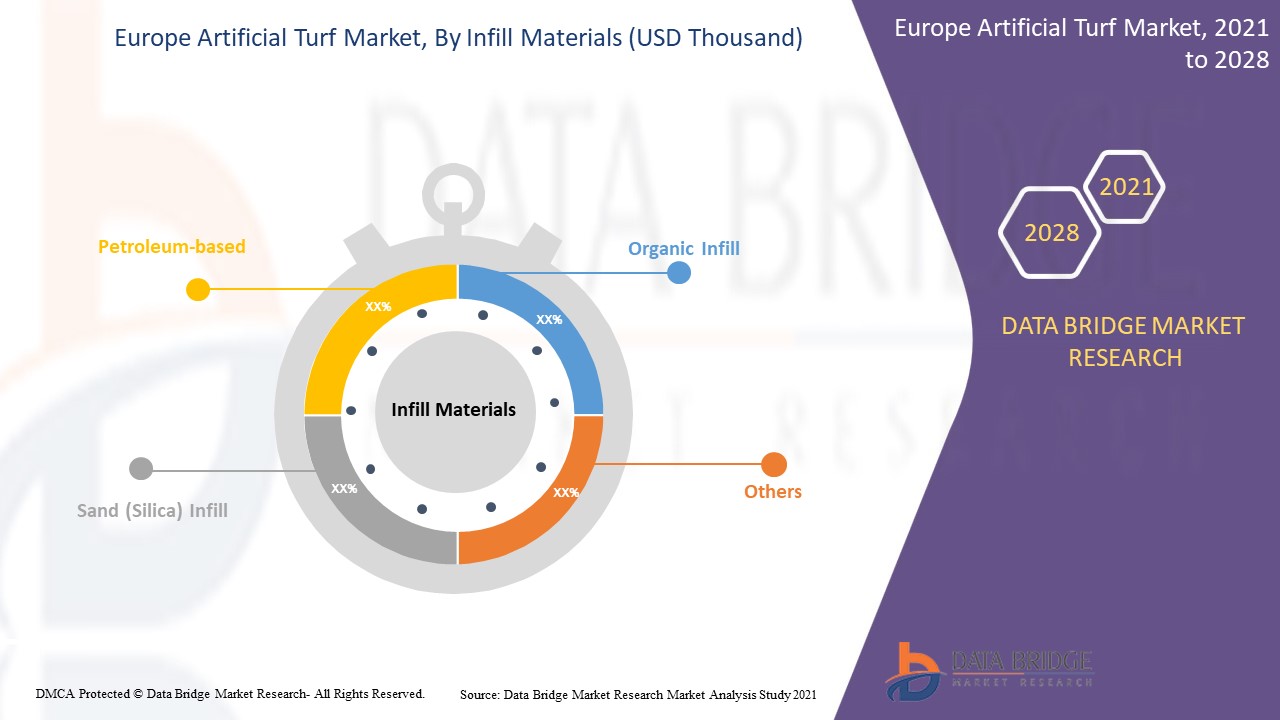
  • On the basis of infill materials, the market is segmented into petroleum-based, organic infill, sand (silica) infill and others. In 2020, petroleum-based segment is dominating as they help better to make playground and play arena.
  • On the basis of pile height, the market is segmented into less than 10 mm, 10-30 mm, 30-50 mm, 50-70 mm, 70-100 mm and more than 100 mm. In 2020, 10-30 mm segment is dominating as the 10-30 mm segment is very feasible for making artificial turf for the hockey, playing arena, household in the artificial turf market. 
  • On the basis of distribution channel, the market is segmented into direct sales/B2B, e-commerce, specialty stores, convenience stores and others. In 2020, direct sales/B2B segment is dominating since it majorly deals in bulk orders thus it’s a B2B business as per the market demand.
  • On the basis of end-user, the market is segmented into households, sports & leisure, restaurant, hotels, airports, commercial offices, pet areas and others. In 2020, sports & leisure segment is dominating due to rising demand in practice sessions for all countries thus the turf ground are the most preferable to play sports such as tennis, hockey and golf which requires large amount of turf to build the ground. 

Europe Artificial Turf Market

Europe Artificial Turf Market Country Level Analysis

Europe artificial turf market is analysed and market size information is provided by country, raw material, infill materials, pile height, distribution channel and end-user as referenced above.

The countries covered in the artificial turf market report are the Germany, U.K., Italy, France, Spain, Russia, Turkey, Switzerland, Belgium, Netherlands and rest of Europe.

Europe dominates the artificial turf market as in Germany, the consumers are more aware towards increasing use of artificial turf to reduce the FOD damage at runways from the artificial turf. The U.K. is expected to grow with the highest growth rate in the forecast period of 2020 to 2027 because of increasing business expansion and awareness among the customers and growing demand of the artificial turf in household which boosts demand of the artificial turf while France is dominating as the household sector is growing very rapidly in the region. Also, with the increasing consumption of artificial turf as a tuber in order to increase strength of the artificial turf boosts the demand for artificial turf in the market.  

The country section of the report also provides individual market impacting factors and changes in regulation in the market domestically that impacts the current and future trends of the market. Data points such as new sales, replacement sales, country demographics, regulatory acts and import-export tariffs are some of the major pointers used to forecast the market scenario for individual countries. Also, presence and availability of Europe brands and their challenges faced due to large or scarce competition from local and domestic brands, impact of sales channels are considered while providing forecast analysis of the country data.

Increasing Usage of Artificial Turf as a Wall Cladding in Residential

The artificial turf market also provides you with detailed market analysis for every country growth in industry with sales, components sales, impact of technological development in artificial turf and changes in regulatory scenarios with their support for the artificial turf market. The data is available for historic period 2011 to 2019.

Competitive Landscape and Artificial Turf Market Share Analysis

The artificial turf market competitive landscape provides details by competitor. Details included are company overview, company financials, revenue generated, market potential, investment in research and development, new market initiatives, Europe presence, production sites and facilities, company strengths and weaknesses, product launch, product trials pipelines, product approvals, patents, product width and breadth, application dominance, technology lifeline curve. The above data points provided are only related to the companies’ focus related to Europe artificial turf market.

The major players covered in the Europe artificial turf market report are Tarkett Group, Victoria PLC, SYNLAWN ARTIFICIAL GRASS, Polytan GmbH, SpectraTurf, Inc., Italgreen Spa, Dow, Royal Grass, SIS Pitches, Condor Group, Act Global, Nurteks, LIMONTA SPORT S.p.A., TenCate Grass, CCGrass among other domestic players. DBMR analysts understand competitive strengths and provide competitive analysis for each competitor separately.

Many product developments are also initiated by the companies worldwide which are also accelerating the growth of artificial turf market.

For instance,

  • In May 2020, Dow recently announces the new constructed PCR plastic resin designed for shrink film sticking applications in Asia-Pacific which has been developed and commercialized, the latest resin is engineered to achieve a film output equivalent to that of traditional resins with 40 percent PCR material. The drug, XUS 60921.01, is produced with recycled plastics obtained domestically through strategic recycling partner Dow's in Nanjing, China. This latest resin leads to a circular plastics system, but without losing the efficiency of brand owners and customers.

Partnership, joint ventures and other strategies enhances the company market share with increased coverage and presence. It also provides the benefit for organisation to improve their offering for artificial turf through expanded range of size.


SKU-

TABLE 1 IMPORT DATA OF ARTICLES AND EQUIPMENT FOR SPORT AND OUTDOOR GAMES N.E.S; SWIMMING AND PADDLING POOLS; HS CODE - 950699 (USD THOUSAND)

TABLE 2 EXPORT DATA OF ARTICLES AND EQUIPMENT FOR SPORT AND OUTDOOR GAMES N.E.S; SWIMMING AND PADDLING POOLS; HS CODE - 950699 (USD THOUSAND)

TABLE 3 EUROPE ARTIFICIAL TURF MARKET, BY RAW MATERIAL, 2018-2027 (USD THOUSAND)

TABLE 4 EUROPE ARTIFICIAL TURF MARKET, BY RAW MATERIAL, 2018-2027 (MILLION METER SQUARE)

TABLE 5 EUROPE ARTIFICIAL TURF MARKET, BY INFILL MATERIALS, 2018-2027 (USD THOUSAND)

TABLE 6 EUROPE IN ARTIFICIAL TURF MARKET, BY PETROLEUM-BASED TYPE, 2018-2027 (USD THOUSAND)

TABLE 7 EUROPE ARTIFICIAL TURF MARKET, BY PILE HEIGHT, 2018-2027 (USD THOUSAND)

TABLE 8 EUROPE ARTIFICIAL TURF MARKET, BY BACK COATING, 2018-2027 (USD THOUSAND)

TABLE 9 EUROPE ARTIFICIAL TURF MARKET, BY DISTRIBUTION CHANNEL, 2018-2027 (USD THOUSAND)

TABLE 10 EUROPE ARTIFICIAL TURF MARKET, BY END-USER, 2018-2027 (USD THOUSAND)

TABLE 11 EUROPE SPORTS & LEISURE IN ARTIFICIAL TURF MARKET, BY SPORTS & LEISURE TYPE, 2018-2027 (USD THOUSAND)

TABLE 12 EUROPE SPORTS & LEISURE IN ARTIFICIAL TURF MARKET, BY SPORTS & LEISURE TYPE, 2018-2027 (USD THOUSAND)

TABLE 13 EUROPE HOUSEHOLDSIN ARTIFICIAL TURF MARKET, BY HOUSEHOLDS END-USER, 2018-2027 (USD THOUSAND)

TABLE 14 EUROPE ARTIFICIAL TURF MARKET, BY COUNTRY, 2018-2027 (USD THOUSAND)

TABLE 15 GERMANY ARTIFICIAL TURF MARKET, BY RAW MATERIAL, 2018-2027 (USD THOUSAND)

TABLE 16 GERMANY ARTIFICIAL TURF MARKET, BY RAW MATERIAL, 2018-2027 (MILLION METER SQUARE )

TABLE 17 GERMANY ARTIFICIAL TURF MARKET, BY INFILL MATERIALS 2018-2027 (USD THOUSAND)

TABLE 18 GERMANY IN ARTIFICIAL TURF MARKET, BY PETROLEUM-BASED TYPE, 2018-2027 (USD THOUSAND)

TABLE 19 GERMANY ARTIFICIAL TURF MARKET, BY PILE HEIGHT, 2018-2027, (USD THOUSAND)

TABLE 20 GERMANY ARTIFICIAL TURF MARKET, BY BACK COATING, 2018-2027 (USD THOUSAND)

TABLE 21 GERMANY ARTIFICIAL TURF MARKET, BY DISTRIBUTION CHANNEL, 2018-2027 (USD THOUSAND)

TABLE 22 GERMANY ARTIFICIAL TURF MARKET, BY END-USER, 2018-2027, (USD THOUSAND)

TABLE 23 GERMANY IN SPORTS & LEISURE IN ARTIFICIAL TURF MARKET, BY SPORTS & LEISURE END-USER, 2018-2027 (USD THOUSAND)

TABLE 24 GERMANY IN SPORTS GROUNDS IN ARTIFICIAL TURF MARKET, BY SPORTS GROUNDS TYPE, 2018-2027, (USD THOUSAND)

TABLE 25 GERMANY HOUSEHOLDS IN ARTIFICIAL TURF MARKET, BY DAIRY PRODUCTS END-USER, 2018-2027, (USD THOUSAND)

TABLE 26 U.K. ARTIFICIAL TURF MARKET, BY RAW MATERIAL, 2018-2027 (USD THOUSAND)

TABLE 27 U.K. ARTIFICIAL TURF MARKET, BY RAW MATERIAL, 2018-2027 (MILLION METER SQUARE )

TABLE 28 U.K. ARTIFICIAL TURF MARKET, BY INFILL MATERIALS 2018-2027 (USD THOUSAND)

TABLE 29 U.K. IN ARTIFICIAL TURF MARKET, BY PETROLEUM-BASED TYPE, 2018-2027 (USD THOUSAND)

TABLE 30 U.K. ARTIFICIAL TURF MARKET, BY PILE HEIGHT, 2018-2027, (USD THOUSAND)

TABLE 31 U.K. ARTIFICIAL TURF MARKET, BY BACK COATING, 2018-2027 (USD THOUSAND)

TABLE 32 U.K. ARTIFICIAL TURF MARKET, BY DISTRIBUTION CHANNEL, 2018-2027 (USD THOUSAND)

TABLE 33 U.K. ARTIFICIAL TURF MARKET, BY END-USER, 2018-2027, (USD THOUSAND)

TABLE 34 U.K. IN SPORTS & LEISURE IN ARTIFICIAL TURF MARKET, BY SPORTS & LEISURE END-USER, 2018-2027 (USD THOUSAND)

TABLE 35 U.K. IN SPORTS GROUNDS IN ARTIFICIAL TURF MARKET, BY SPORTS GROUNDS TYPE, 2018-2027, (USD THOUSAND)

TABLE 36 U.K. HOUSEHOLDS IN ARTIFICIAL TURF MARKET, BY DAIRY PRODUCTS END-USER, 2018-2027, (USD THOUSAND)

TABLE 37 FRANCE ARTIFICIAL TURF MARKET, BY RAW MATERIAL, 2018-2027 (USD THOUSAND)

TABLE 38 FRANCE ARTIFICIAL TURF MARKET, BY RAW MATERIAL, 2018-2027 (MILLION METER SQUARE )

TABLE 39 FRANCE ARTIFICIAL TURF MARKET, BY INFILL MATERIALS 2018-2027 (USD THOUSAND)

TABLE 40 FRANCE IN ARTIFICIAL TURF MARKET, BY PETROLEUM-BASED TYPE, 2018-2027 (USD THOUSAND)

TABLE 41 FRANCE ARTIFICIAL TURF MARKET, BY PILE HEIGHT, 2018-2027, (USD THOUSAND)

TABLE 42 FRANCE ARTIFICIAL TURF MARKET, BY BACK COATING, 2018-2027 (USD THOUSAND)

TABLE 43 FRANCE ARTIFICIAL TURF MARKET, BY DISTRIBUTION CHANNEL, 2018-2027 (USD THOUSAND)

TABLE 44 FRANCE ARTIFICIAL TURF MARKET, BY END-USER, 2018-2027, (USD THOUSAND)

TABLE 45 FRANCE IN SPORTS & LEISURE IN ARTIFICIAL TURF MARKET, BY SPORTS & LEISURE END-USER, 2018-2027 (USD THOUSAND)

TABLE 46 FRANCE IN SPORTS GROUNDS IN ARTIFICIAL TURF MARKET, BY SPORTS GROUNDS TYPE, 2018-2027, (USD THOUSAND)

TABLE 47 FRANCE HOUSEHOLDS IN ARTIFICIAL TURF MARKET, BY DAIRY PRODUCTS END-USER, 2018-2027, (USD THOUSAND)

TABLE 48 ITALY ARTIFICIAL TURF MARKET, BY RAW MATERIAL, 2018-2027 (USD THOUSAND)

TABLE 49 ITALY ARTIFICIAL TURF MARKET, BY RAW MATERIAL, 2018-2027 (MILLION METER SQUARE )

TABLE 50 ITALY ARTIFICIAL TURF MARKET, BY INFILL MATERIALS 2018-2027 (USD THOUSAND)

TABLE 51 ITALY IN ARTIFICIAL TURF MARKET, BY PETROLEUM-BASED TYPE, 2018-2027 (USD THOUSAND)

TABLE 52 ITALY ARTIFICIAL TURF MARKET, BY PILE HEIGHT, 2018-2027, (USD THOUSAND)

TABLE 53 ITALY ARTIFICIAL TURF MARKET, BY BACK COATING, 2018-2027 (USD THOUSAND)

TABLE 54 ITALY ARTIFICIAL TURF MARKET, BY DISTRIBUTION CHANNEL, 2018-2027 (USD THOUSAND)

TABLE 55 ITALY ARTIFICIAL TURF MARKET, BY END-USER, 2018-2027, (USD THOUSAND)

TABLE 56 ITALY IN SPORTS & LEISURE IN ARTIFICIAL TURF MARKET, BY SPORTS & LEISURE END-USER, 2018-2027 (USD THOUSAND)

TABLE 57 ITALY IN SPORTS GROUNDS IN ARTIFICIAL TURF MARKET, BY SPORTS GROUNDS TYPE, 2018-2027, (USD THOUSAND)

TABLE 58 ITALY HOUSEHOLDS IN ARTIFICIAL TURF MARKET, BY DAIRY PRODUCTS END-USER, 2018-2027, (USD THOUSAND)

TABLE 59 RUSSIA ARTIFICIAL TURF MARKET, BY RAW MATERIAL, 2018-2027 (USD THOUSAND)

TABLE 60 RUSSIA ARTIFICIAL TURF MARKET, BY RAW MATERIAL, 2018-2027 (MILLION METER SQUARE )

TABLE 61 RUSSIA ARTIFICIAL TURF MARKET, BY INFILL MATERIALS 2018-2027 (USD THOUSAND)

TABLE 62 RUSSIA IN ARTIFICIAL TURF MARKET, BY PETROLEUM-BASED TYPE, 2018-2027 (USD THOUSAND)

TABLE 63 RUSSIA ARTIFICIAL TURF MARKET, BY PILE HEIGHT, 2018-2027, (USD THOUSAND)

TABLE 64 RUSSIA ARTIFICIAL TURF MARKET, BY BACK COATING, 2018-2027 (USD THOUSAND)

TABLE 65 RUSSIA ARTIFICIAL TURF MARKET, BY DISTRIBUTION CHANNEL, 2018-2027 (USD THOUSAND)

TABLE 66 RUSSIA ARTIFICIAL TURF MARKET, BY END-USER, 2018-2027, (USD THOUSAND)

TABLE 67 RUSSIA IN SPORTS & LEISURE IN ARTIFICIAL TURF MARKET, BY SPORTS & LEISURE END-USER, 2018-2027 (USD THOUSAND)

TABLE 68 RUSSIA IN SPORTS GROUNDS IN ARTIFICIAL TURF MARKET, BY SPORTS GROUNDS TYPE, 2018-2027, (USD THOUSAND)

TABLE 69 RUSSIA HOUSEHOLDS IN ARTIFICIAL TURF MARKET, BY DAIRY PRODUCTS END-USER, 2018-2027, (USD THOUSAND)

TABLE 70 SPAIN ARTIFICIAL TURF MARKET, BY RAW MATERIAL, 2018-2027 (USD THOUSAND)

TABLE 71 SPAIN ARTIFICIAL TURF MARKET, BY RAW MATERIAL, 2018-2027 (MILLION METER SQUARE )

TABLE 72 SPAIN ARTIFICIAL TURF MARKET, BY INFILL MATERIALS 2018-2027 (USD THOUSAND)

TABLE 73 SPAIN IN ARTIFICIAL TURF MARKET, BY PETROLEUM-BASED TYPE, 2018-2027 (USD THOUSAND)

TABLE 74 SPAIN ARTIFICIAL TURF MARKET, BY PILE HEIGHT, 2018-2027, (USD THOUSAND)

TABLE 75 SPAIN ARTIFICIAL TURF MARKET, BY BACK COATING, 2018-2027 (USD THOUSAND)

TABLE 76 SPAIN ARTIFICIAL TURF MARKET, BY DISTRIBUTION CHANNEL, 2018-2027 (USD THOUSAND)

TABLE 77 SPAIN ARTIFICIAL TURF MARKET, BY END-USER, 2018-2027, (USD THOUSAND)

TABLE 78 SPAIN IN SPORTS & LEISURE IN ARTIFICIAL TURF MARKET, BY SPORTS & LEISURE END-USER, 2018-2027 (USD THOUSAND)

TABLE 79 SPAIN IN SPORTS GROUNDS IN ARTIFICIAL TURF MARKET, BY SPORTS GROUNDS TYPE, 2018-2027, (USD THOUSAND)

TABLE 80 SPAIN HOUSEHOLDS IN ARTIFICIAL TURF MARKET, BY DAIRY PRODUCTS END-USER, 2018-2027, (USD THOUSAND)

TABLE 81 SWITZERLAND ARTIFICIAL TURF MARKET, BY RAW MATERIAL, 2018-2027 (USD THOUSAND)

TABLE 82 SWITZERLAND ARTIFICIAL TURF MARKET, BY RAW MATERIAL, 2018-2027 (MILLION METER SQUARE )

TABLE 83 SWITZERLAND ARTIFICIAL TURF MARKET, BY INFILL MATERIALS 2018-2027 (USD THOUSAND)

TABLE 84 SWITZERLAND IN ARTIFICIAL TURF MARKET, BY PETROLEUM-BASED TYPE, 2018-2027 (USD THOUSAND)

TABLE 85 SWITZERLAND ARTIFICIAL TURF MARKET, BY PILE HEIGHT, 2018-2027, (USD THOUSAND)

TABLE 86 SWITZERLAND ARTIFICIAL TURF MARKET, BY BACK COATING, 2018-2027 (USD THOUSAND)

TABLE 87 SWITZERLAND ARTIFICIAL TURF MARKET, BY DISTRIBUTION CHANNEL, 2018-2027 (USD THOUSAND)

TABLE 88 SWITZERLAND ARTIFICIAL TURF MARKET, BY END-USER, 2018-2027, (USD THOUSAND)

TABLE 89 SWITZERLAND IN SPORTS & LEISURE IN ARTIFICIAL TURF MARKET, BY SPORTS & LEISURE END-USER, 2018-2027 (USD THOUSAND)

TABLE 90 SWITZERLAND IN SPORTS GROUNDS IN ARTIFICIAL TURF MARKET, BY SPORTS GROUNDS TYPE, 2018-2027, (USD THOUSAND)

TABLE 91 SWITZERLAND HOUSEHOLDS IN ARTIFICIAL TURF MARKET, BY DAIRY PRODUCTS END-USER, 2018-2027, (USD THOUSAND)

TABLE 92 BELGIUM ARTIFICIAL TURF MARKET, BY RAW MATERIAL, 2018-2027 (USD THOUSAND)

TABLE 93 BELGIUM ARTIFICIAL TURF MARKET, BY RAW MATERIAL, 2018-2027 (MILLION METER SQUARE )

TABLE 94 BELGIUM ARTIFICIAL TURF MARKET, BY INFILL MATERIALS 2018-2027 (USD THOUSAND)

TABLE 95 BELGIUM IN ARTIFICIAL TURF MARKET, BY PETROLEUM-BASED TYPE, 2018-2027 (USD THOUSAND)

TABLE 96 BELGIUM ARTIFICIAL TURF MARKET, BY PILE HEIGHT, 2018-2027, (USD THOUSAND)

TABLE 97 BELGIUM ARTIFICIAL TURF MARKET, BY BACK COATING, 2018-2027 (USD THOUSAND)

TABLE 98 BELGIUM ARTIFICIAL TURF MARKET, BY DISTRIBUTION CHANNEL, 2018-2027 (USD THOUSAND)

TABLE 99 BELGIUM ARTIFICIAL TURF MARKET, BY END-USER, 2018-2027, (USD THOUSAND)

TABLE 100 BELGIUM IN SPORTS & LEISURE IN ARTIFICIAL TURF MARKET, BY SPORTS & LEISURE END-USER, 2018-2027 (USD THOUSAND)

TABLE 101 BELGIUM IN SPORTS GROUNDS IN ARTIFICIAL TURF MARKET, BY SPORTS GROUNDS TYPE, 2018-2027, (USD THOUSAND)

TABLE 102 BELGIUM HOUSEHOLDS IN ARTIFICIAL TURF MARKET, BY DAIRY PRODUCTS END-USER, 2018-2027, (USD THOUSAND)

TABLE 103 NETHERLANDS ARTIFICIAL TURF MARKET, BY RAW MATERIAL, 2018-2027 (USD THOUSAND)

TABLE 104 NETHERLANDS ARTIFICIAL TURF MARKET, BY RAW MATERIAL, 2018-2027 (MILLION METER SQUARE )

TABLE 105 NETHERLANDS ARTIFICIAL TURF MARKET, BY INFILL MATERIALS 2018-2027 (USD THOUSAND)

TABLE 106 NETHERLANDS IN ARTIFICIAL TURF MARKET, BY PETROLEUM-BASED TYPE, 2018-2027 (USD THOUSAND)

TABLE 107 NETHERLANDS ARTIFICIAL TURF MARKET, BY PILE HEIGHT, 2018-2027, (USD THOUSAND)

TABLE 108 NETHERLANDS ARTIFICIAL TURF MARKET, BY BACK COATING, 2018-2027 (USD THOUSAND)

TABLE 109 NETHERLANDS ARTIFICIAL TURF MARKET, BY DISTRIBUTION CHANNEL, 2018-2027 (USD THOUSAND)

TABLE 110 NETHERLANDS ARTIFICIAL TURF MARKET, BY END-USER, 2018-2027, (USD THOUSAND)

TABLE 111 NETHERLANDS IN SPORTS & LEISURE IN ARTIFICIAL TURF MARKET, BY SPORTS & LEISURE END-USER, 2018-2027 (USD THOUSAND)

TABLE 112 NETHERLANDS IN SPORTS GROUNDS IN ARTIFICIAL TURF MARKET, BY SPORTS GROUNDS TYPE, 2018-2027, (USD THOUSAND)

TABLE 113 NETHERLANDS HOUSEHOLDS IN ARTIFICIAL TURF MARKET, BY DAIRY PRODUCTS END-USER, 2018-2027, (USD THOUSAND)

TABLE 114 TURKEY ARTIFICIAL TURF MARKET, BY RAW MATERIAL, 2018-2027 (USD THOUSAND)

TABLE 115 TURKEY ARTIFICIAL TURF MARKET, BY RAW MATERIAL, 2018-2027 (MILLION METER SQUARE )

TABLE 116 TURKEY ARTIFICIAL TURF MARKET, BY INFILL MATERIALS 2018-2027 (USD THOUSAND)

TABLE 117 TURKEY IN ARTIFICIAL TURF MARKET, BY PETROLEUM-BASED TYPE, 2018-2027 (USD THOUSAND)

TABLE 118 TURKEY ARTIFICIAL TURF MARKET, BY PILE HEIGHT, 2018-2027, (USD THOUSAND)

TABLE 119 TURKEY ARTIFICIAL TURF MARKET, BY BACK COATING, 2018-2027 (USD THOUSAND)

TABLE 120 TURKEY ARTIFICIAL TURF MARKET, BY DISTRIBUTION CHANNEL, 2018-2027 (USD THOUSAND)

TABLE 121 TURKEY ARTIFICIAL TURF MARKET, BY END-USER, 2018-2027, (USD THOUSAND)

TABLE 122 TURKEY IN SPORTS & LEISURE IN ARTIFICIAL TURF MARKET, BY SPORTS & LEISURE END-USER, 2018-2027 (USD THOUSAND)

TABLE 123 TURKEY IN SPORTS GROUNDS IN ARTIFICIAL TURF MARKET, BY SPORTS GROUNDS TYPE, 2018-2027, (USD THOUSAND)

TABLE 124 TURKEY HOUSEHOLDS IN ARTIFICIAL TURF MARKET, BY DAIRY PRODUCTS END-USER, 2018-2027, (USD THOUSAND)

TABLE 125 REST OF EUROPE ARTIFICIAL TURF MARKET, BY RAW MATERIAL, 2018-2027 (USD THOUSAND)

TABLE 126 REST OF EUROPE ARTIFICIAL TURF MARKET, BY RAW MATERIAL, 2018-2027 (MILLION METER SQUARE )

Please fill in the below form for Infographics

By clicking the "Submit" button, you are agreeing to the Data Bridge Market Research Privacy Policy and Terms and Conditions

Research Methodology:

Data collection and base year analysis are done using data collection modules with large sample sizes. The stage includes obtaining market information or related data through various sources and strategies. It includes examining and planning all the data acquired from the past in advance. It likewise envelops the examination of information inconsistencies seen across different information sources. The market data is analysed and estimated using market statistical and coherent models. Also, market share analysis and key trend analysis are the major success factors in the market report. To know more, please request an analyst call or drop down your inquiry.

The key research methodology used by DBMR research team is data triangulation which involves data mining, analysis of the impact of data variables on the market and primary (industry expert) validation. Data models include Vendor Positioning Grid, Market Time Line Analysis, Market Overview and Guide, Company Positioning Grid, Patent Analysis, Pricing Analysis, Company Market Share Analysis, Standards of Measurement, Global versus Regional and Vendor Share Analysis. To know more about the research methodology, drop in an inquiry to speak to our industry experts.

Please fill in the below form for Research Methodology

By clicking the "Submit" button, you are agreeing to the Data Bridge Market Research Privacy Policy and Terms and Conditions

Customization Available:

Data Bridge Market Research is a leader in advanced formative research. We take pride in servicing our existing and new customers with data and analysis that match and suits their goal. The report can be customized to include price trend analysis of target brands understanding the market for additional countries (ask for the list of countries), clinical trial results data, literature review, refurbished market and product base analysis. Market analysis of target competitors can be analyzed from technology-based analysis to market portfolio strategies. We can add as many competitors that you require data about in the format and data style you are looking for. Our team of analysts can also provide you data in crude raw excel files pivot tables (Fact book) or can assist you in creating presentations from the data sets available in the report.

Please fill in the below form for Available Customization

By clicking the "Submit" button, you are agreeing to the Data Bridge Market Research Privacy Policy and Terms and Conditions

Free Sample Report

CHOOSE LICENCE TYPE

  • 4200.00
  • 3500.00
  • 2000.00
  • 5500.00
  • 7500.00

Why Choose Us

Industry Coverage

DBMR works across the globe in multiple industries which equip us with knowledge across verticals and provide our clients with insights not only from their industry but how other industries will impact their ecosystem.

Regional Coverage

Coverage of Data Bridge is not restricted to developed or emerging economies. We work across the globe covering the largest array of countries where no other market research or business consulting firm has ever conducted research; creating growth opportunities for our clients in areas which are still unknown.

Technology Coverage

In today’s world, technology drives the market sentiment, so our vision is to provide our clients insights not only for developed technologies but upcoming and disrupting technological changes throughout the product lifecycle by enabling them with unforeseen opportunities in the market which will create disruption in their industry. This leads to innovation and our clients to come out as winners.

Goal Oriented Solutions

DBMR goal is to help our clients achieve their goals through our solutions; hence we formatively create the most appropriate solutions for our client needs, saving time and efforts for them to drive their grand strategies.

Unparallel Analyst Support

Our analysts take pride in our clients’ success. Unlike others, we believe in working along our clients to achieve their goals with 24 hours analyst support determining the correct needs and inspire innovation through service.

Banner

Client Testimonials