LIST OF TABLES
TABLE 1 IMPORT DATA OF Product: 7010 Carboys, bottles, flasks, jars, pots, phials, ampoules and other containers, of glass, of a.....HS CODE: 7010 (USD THOUSAND)
TABLE 2 export DATA OF Product: 7010 Carboys, bottles, flasks, jars, pots, phials, ampoules and other containers, of glass, of a.....HS CODE: 7010 (USD THOUSAND)
TABLE 3 Time taken for garbage to decompose in the environment (2015)
TABLE 4 Europe Pharmaceutical Vials market, BY MATERIAL, 2019-2028 (USD million)
TABLE 5 Europe Pharmaceutical Vials market, BY Type, 2019-2028 (Million Units)
TABLE 6 Europe Pharmaceutical Vials market, Glass BY region, 2019-2028 (USD million)
TABLE 7 Europe Pharmaceutical Vials market, GLASS BY region, 2019-2028 (Million Units)
TABLE 8 Europe Pharmaceutical Vials Market, Glass By Color, 2019-2028 (USD Million)
TABLE 9 Europe Pharmaceutical Vials Market, Glass By Type, 2019-2028 (USD Million)
TABLE 10 Europe pharmaceutical vials Market, Glass By product, 2019-2028 (USD Million)
TABLE 11 Europe Pharmaceutical Vials market, Plastic BY region, 2019-2028 (USD million)
TABLE 12 Europe Pharmaceutical Vials market, Plastic BY region, 2019-2028 (Million Units)
TABLE 13 Europe Pharmaceutical vials Market, Plastic By Color, 2019-2028 (USD Million)
TABLE 14 Europe Pharmaceutical vials Market, Plastic By TYPE, 2019-2028 (USD Million)
TABLE 15 Europe Pharmaceutical Vials market, Others BY region, 2019-2028 (USD million)
TABLE 16 Europe Pharmaceutical Vials market, Others BY region, 2019-2028 (Million Units)
TABLE 17 Europe Pharmaceutical Vials market, BY Neck Type, 2019-2028 (USD million)
TABLE 18 Europe Pharmaceutical Vials market, Screw Neck BY region, 2019-2028 (USD million)
TABLE 19 Europe Pharmaceutical Vials market, Crimp Neck BY region, 2019-2028 (USD million)
TABLE 20 Europe Pharmaceutical Vials market, Double Chamber BY region, 2019-2028 (USD million)
TABLE 21 Europe Pharmaceutical Vials market, Flip Cap BY region, 2019-2028 (USD million)
TABLE 22 Europe Pharmaceutical Vials market, Others BY region, 2019-2028 (USD million)
TABLE 23 Europe Pharmaceutical Vials market, BY Cap Size, 2019-2028 (USD million)
TABLE 24 Europe Pharmaceutical Vials market, 9MM BY region, 2019-2028 (USD million)
TABLE 25 Europe Pharmaceutical Vials market, 8-425 MM BY region, 2019-2028 (USD million)
TABLE 26 Europe Pharmaceutical Vials market, 13-425 MM BY region, 2019-2028 (USD million)
TABLE 27 Europe Pharmaceutical Vials market, 15-425 MM BY region, 2019-2028 (USD million)
TABLE 28 Europe Pharmaceutical Vials market, 18-400 MM BY region, 2019-2028 (USD million)
TABLE 29 Europe Pharmaceutical Vials market, 22-350 MM BY region, 2019-2028 (USD million)
TABLE 30 Europe Pharmaceutical Vials market, 24-400 MM BY region, 2019-2028 (USD million)
TABLE 31 Europe Pharmaceutical Vials market, Others BY region, 2019-2028 (USD million)
TABLE 32 Europe Pharmaceutical Vials market, BY Distribution Channel, 2019-2028 (USD million)
TABLE 33 Europe Pharmaceutical Vials market, Direct Sales BY region, 2019-2028 (USD million)
TABLE 34 Europe Pharmaceutical Vials market, Medical Stores/Pharmacies BY region, 2019-2028 (USD million)
TABLE 35 Europe Pharmaceutical Vials market, E-Commerce BY region, 2019-2028 (USD million)
TABLE 36 Europe Pharmaceutical Vials market, Others BY region, 2019-2028 (USD million)
TABLE 37 Europe Pharmaceutical Vials market, BY Capacity, 2019-2028 (USD million)
TABLE 38 Europe Pharmaceutical Vials market, 1 ML BY region, 2019-2028 (USD million)
TABLE 39 Europe Pharmaceutical Vials market, 2 ML BY region, 2019-2028 (USD million)
TABLE 40 Europe Pharmaceutical Vials market, 3 ML BY region, 2019-2028 (USD million)
TABLE 41 Europe Pharmaceutical Vials market, 4 ML BY region, 2019-2028 (USD million)
TABLE 42 Europe Pharmaceutical Vials market, 8 ML BY region, 2019-2028 (USD million)
TABLE 43 Europe Pharmaceutical Vials market, 10 ML BY region, 2019-2028 (USD million)
TABLE 44 Europe Pharmaceutical Vials market, 20 ML BY region, 2019-2028 (USD million)
TABLE 45 Europe Pharmaceutical Vials market, 30 ML BY region, 2019-2028 (USD million)
TABLE 46 Europe Pharmaceutical Vials market, 50 ML BY region, 2019-2028 (USD million)
TABLE 47 Europe Pharmaceutical Vials market, Others BY region, 2019-2028 (USD million)
TABLE 48 Europe Pharmaceutical Vials market, BY Drug Type, 2019-2028 (USD million)
TABLE 49 Europe Pharmaceutical Vials market, Injectable BY region, 2019-2028 (USD million)
TABLE 50 Europe Pharmaceutical Vials Market, By Injectable Type, 2019-2028 (USD Million)
TABLE 51 Europe Pharmaceutical Vials market, Non-Injectable BY region, 2019-2028 (USD million)
TABLE 52 Europe Pharmaceutical VialS Market, By Non-Injectable Type, 2019-2028 (USD Million)
TABLE 53 Europe Pharmaceutical vials market, BY application, 2019-2028 (USD Million)
TABLE 54 Europe Pharmaceutical vials market, oral BY region, 2019-2028 (USD million)
TABLE 55 Europe Pharmaceutical vials market, Nasal BY region, 2019-2028 (USD million)
TABLE 56 Europe Pharmaceutical vials market, Others BY region, 2019-2028 (USD million)
TABLE 57 Europe Pharmaceutical vials market, BY End-User, 2019-2028 (USD Million)
TABLE 58 Europe Pharmaceutical vials market, Pharmaceutical companies BY region, 2019-2028 (USD million)
TABLE 59 Europe Pharmaceutical vials market, Biopharmaceutical companies BY region, 2019-2028 (USD million)
TABLE 60 Europe Pharmaceutical vials market, Contract Development and Manufacturing Companies BY region, 2019-2028 (USD million)
TABLE 61 Europe Pharmaceutical vials market, Compound Pharmacy BY region, 2019-2028 (USD million)
TABLE 62 Europe Pharmaceutical vials market, Others BY region, 2019-2028 (USD million)
TABLE 63 Europe Pharmaceutical vials market, BY market, 2019-2028 (USD million)
TABLE 64 Europe Pharmaceutical vials market, Parenteral BY region, 2019-2028 (USD million)
TABLE 65 Europe Pharmaceutical vials market, Gastro BY region, 2019-2028 (USD million)
TABLE 66 Europe Pharmaceutical vials market, Ent BY region, 2019-2028 (USD million)
TABLE 67 Europe Pharmaceutical vials market, others BY region, 2019-2028 (USD million)
TABLE 69 EUROPE pharmaceutical vials market, By region, 2018-2027 (million Units)
TABLE 70 EUROPE pharmaceutical vials market, By region, 2018-2027 (usd Million)
TABLE 71 EUROPE pharmaceutical vials Market, BY COUNtry ,2019-2028 (USD Million)
TABLE 72 EUROPE PHARMACEUTICAL VIALS Market, BY COUNtry ,2019-2028 (MILLION UNITS)
TABLE 73 Europe PHARMACEUTICAL VIALS Market, BY Material, 2019-2028 (USD Million)
TABLE 74 Europe PHARMACEUTICAL VIALS Market, BY material, 2019-2028 (Million units)
TABLE 75 Europe PHARMACEUTICAL VIALS Market, glass BY color, 2019-2028 (USD Million)
TABLE 76 Europe PHARMACEUTICAL VIALS Market, Glass BY type, 2019-2028 (USD Million)
TABLE 77 Europe PHARMACEUTICAL VIALS Market, glass BY product, 2019-2028 (USD Million)
TABLE 78 Europe PHARMACEUTICAL VIALS Market, Plastic BY color, 2019-2028 (USD Million)
TABLE 79 Europe PHARMACEUTICAL VIALS Market, Plastic BY type, 2019-2028 (USD Million)
TABLE 80 Europe PHARMACEUTICAL VIALS Market, BY neck type,2019-2028 (USD Million)
TABLE 81 Europe PHARMACEUTICAL VIALS Market, BY Cap size,2019-2028 (USD Million)
TABLE 82 Europe PHARMACEUTICAL VIALS Market, BY distribution channel,2019-2028 (USD Million)
TABLE 83 Europe PHARMACEUTICAL VIALS Market, BY Capacity,2019-2028 (USD Million)
TABLE 84 Europe PHARMACEUTICAL VIALS Market, BY Drug type,2019-2028 (USD Million)
TABLE 85 Europe PHARMACEUTICAL VIALS Market in Drug type, BY injectable,2019-2028 (USD Million)
TABLE 86 Europe PHARMACEUTICAL VIALS Market in Drug type, BY non-injectable,2019-2028 (USD Million)
TABLE 87 Europe PHARMACEUTICAL VIALS Market, BY application,2019-2028 (USD Million)
TABLE 88 Europe PHARMACEUTICAL VIALS Market, BY end-user,2019-2028 (USD Million)
TABLE 89 Europe PHARMACEUTICAL VIALS Market, BY Market,2019-2028 (USD Million)
TABLE 90 Germany PHARMACEUTICAL VIALS Market, BY Material, 2019-2028 (USD Million)
TABLE 91 Germany PHARMACEUTICAL VIALS Market, BY material, 2019-2028 (Million units)
TABLE 92 Germany PHARMACEUTICAL VIALS Market, glass BY color, 2019-2028 (USD Million)
TABLE 93 Germany PHARMACEUTICAL VIALS Market, Glass BY type, 2019-2028 (USD Million)
TABLE 94 Germany PHARMACEUTICAL VIALS Market, glass BY product, 2019-2028 (USD Million)
TABLE 95 Germany PHARMACEUTICAL VIALS Market, Plastic BY color, 2019-2028 (USD Million)
TABLE 96 Germany PHARMACEUTICAL VIALS Market, Plastic BY type, 2019-2028 (USD Million)
TABLE 97 Germany PHARMACEUTICAL VIALS Market, BY neck type,2019-2028 (USD Million)
TABLE 98 Germany PHARMACEUTICAL VIALS Market, BY Cap size,2019-2028 (USD Million)
TABLE 99 Germany PHARMACEUTICAL VIALS Market, BY distribution channel,2019-2028 (USD Million)
TABLE 100 Germany PHARMACEUTICAL VIALS Market, BY Capacity,2019-2028 (USD Million)
TABLE 101 Germany PHARMACEUTICAL VIALS Market, BY Drug type,2019-2028 (USD Million)
TABLE 102 Germany PHARMACEUTICAL VIALS Market in Drug type, BY injectable,2019-2028 (USD Million)
TABLE 103 Germany PHARMACEUTICAL VIALS Market in Drug type, BY non-injectable,2019-2028 (USD Million)
TABLE 104 Germany PHARMACEUTICAL VIALS Market, BY application,2019-2028 (USD Million)
TABLE 105 Germany PHARMACEUTICAL VIALS Market, BY end-user,2019-2028 (USD Million)
TABLE 106 Germany PHARMACEUTICAL VIALS Market, BY Market,2019-2028 (USD Million)
TABLE 107 U.K. PHARMACEUTICAL VIALS Market, BY Material, 2019-2028 (USD Million)
TABLE 108 U.K. PHARMACEUTICAL VIALS Market, BY material, 2019-2028 (Million units)
TABLE 109 U.K. PHARMACEUTICAL VIALS Market, glass BY color, 2019-2028 (USD Million)
TABLE 110 U.K. PHARMACEUTICAL VIALS Market, Glass BY type, 2019-2028 (USD Million)
TABLE 111 U.K. PHARMACEUTICAL VIALS Market, glass BY product, 2019-2028 (USD Million)
TABLE 112 U.K. PHARMACEUTICAL VIALS Market, Plastic BY color, 2019-2028 (USD Million)
TABLE 113 U.K. PHARMACEUTICAL VIALS Market, Plastic BY type, 2019-2028 (USD Million)
TABLE 114 U.K. PHARMACEUTICAL VIALS Market, BY neck type,2019-2028 (USD Million)
TABLE 115 U.K. PHARMACEUTICAL VIALS Market, BY Cap size,2019-2028 (USD Million)
TABLE 116 U.K. PHARMACEUTICAL VIALS Market, BY distribution channel,2019-2028 (USD Million)
TABLE 117 U.K. PHARMACEUTICAL VIALS Market, BY Capacity,2019-2028 (USD Million)
TABLE 118 U.K. PHARMACEUTICAL VIALS Market, BY Drug type,2019-2028 (USD Million)
TABLE 119 U.K. PHARMACEUTICAL VIALS Market in Drug type, BY injectable,2019-2028 (USD Million)
TABLE 120 U.K. PHARMACEUTICAL VIALS Market in Drug type, BY non-injectable,2019-2028 (USD Million)
TABLE 121 U.K. PHARMACEUTICAL VIALS Market, BY application,2019-2028 (USD Million)
TABLE 122 U.K. PHARMACEUTICAL VIALS Market, BY end-user,2019-2028 (USD Million)
TABLE 123 U.K. PHARMACEUTICAL VIALS Market, BY Market,2019-2028 (USD Million)
TABLE 124 ITALY PHARMACEUTICAL VIALS Market, BY Material, 2019-2028 (USD Million)
TABLE 125 ITALY PHARMACEUTICAL VIALS Market, BY material, 2019-2028 (Million units)
TABLE 126 ITALY PHARMACEUTICAL VIALS Market, glass BY color, 2019-2028 (USD Million)
TABLE 127 ITALY PHARMACEUTICAL VIALS Market, Glass BY type, 2019-2028 (USD Million)
TABLE 128 ITALY PHARMACEUTICAL VIALS Market, glass BY product, 2019-2028 (USD Million)
TABLE 129 ITALY PHARMACEUTICAL VIALS Market, Plastic BY color, 2019-2028 (USD Million)
TABLE 130 ITALY PHARMACEUTICAL VIALS Market, Plastic BY type, 2019-2028 (USD Million)
TABLE 131 ITALY PHARMACEUTICAL VIALS Market, BY neck type,2019-2028 (USD Million)
TABLE 132 ITALY PHARMACEUTICAL VIALS Market, BY Cap size,2019-2028 (USD Million)
TABLE 133 ITALY PHARMACEUTICAL VIALS Market, BY distribution channel,2019-2028 (USD Million)
TABLE 134 ITALY PHARMACEUTICAL VIALS Market, BY Capacity,2019-2028 (USD Million)
TABLE 135 ITALY PHARMACEUTICAL VIALS Market, BY Drug type,2019-2028 (USD Million)
TABLE 136 ITALY PHARMACEUTICAL VIALS Market in Drug type, BY injectable,2019-2028 (USD Million)
TABLE 137 ITALY PHARMACEUTICAL VIALS Market in Drug type, BY non-injectable,2019-2028 (USD Million)
TABLE 138 ITALY PHARMACEUTICAL VIALS Market, BY application,2019-2028 (USD Million)
TABLE 139 ITALY PHARMACEUTICAL VIALS Market, BY end-user,2019-2028 (USD Million)
TABLE 140 ITALY PHARMACEUTICAL VIALS Market, BY Market,2019-2028 (USD Million)
TABLE 141 FRANCE PHARMACEUTICAL VIALS Market, BY Material, 2019-2028 (USD Million)
TABLE 142 FRANCE PHARMACEUTICAL VIALS Market, BY material, 2019-2028 (Million units)
TABLE 143 FRANCE PHARMACEUTICAL VIALS Market, glass BY color, 2019-2028 (USD Million)
TABLE 144 FRANCE PHARMACEUTICAL VIALS Market, Glass BY type, 2019-2028 (USD Million)
TABLE 145 FRANCE PHARMACEUTICAL VIALS Market, glass BY product, 2019-2028 (USD Million)
TABLE 146 FRANCE PHARMACEUTICAL VIALS Market, Plastic BY color, 2019-2028 (USD Million)
TABLE 147 FRANCE PHARMACEUTICAL VIALS Market, Plastic BY type, 2019-2028 (USD Million)
TABLE 148 FRANCE PHARMACEUTICAL VIALS Market, BY neck type,2019-2028 (USD Million)
TABLE 149 FRANCE PHARMACEUTICAL VIALS Market, BY Cap size,2019-2028 (USD Million)
TABLE 150 FRANCE PHARMACEUTICAL VIALS Market, BY distribution channel,2019-2028 (USD Million)
TABLE 151 FRANCE PHARMACEUTICAL VIALS Market, BY Capacity,2019-2028 (USD Million)
TABLE 152 FRANCE PHARMACEUTICAL VIALS Market, BY Drug type,2019-2028 (USD Million)
TABLE 153 FRANCE PHARMACEUTICAL VIALS Market in Drug type, BY injectable,2019-2028 (USD Million)
TABLE 154 FRANCE PHARMACEUTICAL VIALS Market in Drug type, BY non-injectable,2019-2028 (USD Million)
TABLE 155 FRANCE PHARMACEUTICAL VIALS Market, BY application,2019-2028 (USD Million)
TABLE 156 FRANCE PHARMACEUTICAL VIALS Market, BY end-user,2019-2028 (USD Million)
TABLE 157 FRANCE PHARMACEUTICAL VIALS Market, BY Market,2019-2028 (USD Million)
TABLE 158 SPAIN PHARMACEUTICAL VIALS Market, BY Material, 2019-2028 (USD Million)
TABLE 159 SPAIN PHARMACEUTICAL VIALS Market, BY material, 2019-2028 (Million units)
TABLE 160 SPAIN PHARMACEUTICAL VIALS Market, glass BY color, 2019-2028 (USD Million)
TABLE 161 SPAIN PHARMACEUTICAL VIALS Market, Glass BY type, 2019-2028 (USD Million)
TABLE 162 SPAIN PHARMACEUTICAL VIALS Market, glass BY product, 2019-2028 (USD Million)
TABLE 163 SPAIN PHARMACEUTICAL VIALS Market, Plastic BY color, 2019-2028 (USD Million)
TABLE 164 SPAIN PHARMACEUTICAL VIALS Market, Plastic BY type, 2019-2028 (USD Million)
TABLE 165 SPAIN PHARMACEUTICAL VIALS Market, BY neck type,2019-2028 (USD Million)
TABLE 166 SPAIN PHARMACEUTICAL VIALS Market, BY Cap size,2019-2028 (USD Million)
TABLE 167 SPAIN PHARMACEUTICAL VIALS Market, BY distribution channel,2019-2028 (USD Million)
TABLE 168 SPAIN PHARMACEUTICAL VIALS Market, BY Capacity,2019-2028 (USD Million)
TABLE 169 SPAIN PHARMACEUTICAL VIALS Market, BY Drug type,2019-2028 (USD Million)
TABLE 170 SPAIN PHARMACEUTICAL VIALS Market in Drug type, BY injectable,2019-2028 (USD Million)
TABLE 171 SPAIN PHARMACEUTICAL VIALS Market in Drug type, BY non-injectable,2019-2028 (USD Million)
TABLE 172 SPAIN PHARMACEUTICAL VIALS Market, BY application,2019-2028 (USD Million)
TABLE 173 SPAIN PHARMACEUTICAL VIALS Market, BY end-user,2019-2028 (USD Million)
TABLE 174 SPAIN PHARMACEUTICAL VIALS Market, BY Market,2019-2028 (USD Million)
TABLE 175 SWITZERLAND PHARMACEUTICAL VIALS Market, BY Material, 2019-2028 (USD Million)
TABLE 176 SWITZERLAND PHARMACEUTICAL VIALS Market, BY material, 2019-2028 (Million units)
TABLE 177 SWITZERLAND PHARMACEUTICAL VIALS Market, glass BY color, 2019-2028 (USD Million)
TABLE 178 SWITZERLAND PHARMACEUTICAL VIALS Market, Glass BY type, 2019-2028 (USD Million)
TABLE 179 SWITZERLAND PHARMACEUTICAL VIALS Market, glass BY product, 2019-2028 (USD Million)
TABLE 180 SWITZERLAND PHARMACEUTICAL VIALS Market, Plastic BY color, 2019-2028 (USD Million)
TABLE 181 SWITZERLAND PHARMACEUTICAL VIALS Market, Plastic BY type, 2019-2028 (USD Million)
TABLE 182 SWITZERLAND PHARMACEUTICAL VIALS Market, BY neck type,2019-2028 (USD Million)
TABLE 183 SWITZERLAND PHARMACEUTICAL VIALS Market, BY Cap size,2019-2028 (USD Million)
TABLE 184 SWITZERLAND PHARMACEUTICAL VIALS Market, BY distribution channel,2019-2028 (USD Million)
TABLE 185 SWITZERLAND PHARMACEUTICAL VIALS Market, BY Capacity,2019-2028 (USD Million)
TABLE 186 SWITZERLAND PHARMACEUTICAL VIALS Market, BY Drug type,2019-2028 (USD Million)
TABLE 187 SWITZERLAND PHARMACEUTICAL VIALS Market in Drug type, BY injectable,2019-2028 (USD Million)
TABLE 188 SWITZERLAND PHARMACEUTICAL VIALS Market in Drug type, BY non-injectable,2019-2028 (USD Million)
TABLE 189 SWITZERLAND PHARMACEUTICAL VIALS Market, BY application,2019-2028 (USD Million)
TABLE 190 SWITZERLAND PHARMACEUTICAL VIALS Market, BY end-user,2019-2028 (USD Million)
TABLE 191 SWITZERLAND PHARMACEUTICAL VIALS Market, BY Market,2019-2028 (USD Million)
TABLE 192 RUSSIA PHARMACEUTICAL VIALS Market, BY Material, 2019-2028 (USD Million)
TABLE 193 RUSSIA PHARMACEUTICAL VIALS Market, BY material, 2019-2028 (Million units)
TABLE 194 RUSSIA PHARMACEUTICAL VIALS Market, glass BY color, 2019-2028 (USD Million)
TABLE 195 RUSSIA PHARMACEUTICAL VIALS Market, Glass BY type, 2019-2028 (USD Million)
TABLE 196 RUSSIA PHARMACEUTICAL VIALS Market, glass BY product, 2019-2028 (USD Million)
TABLE 197 RUSSIA PHARMACEUTICAL VIALS Market, Plastic BY color, 2019-2028 (USD Million)
TABLE 198 RUSSIA PHARMACEUTICAL VIALS Market, Plastic BY type, 2019-2028 (USD Million)
TABLE 199 RUSSIA PHARMACEUTICAL VIALS Market, BY neck type,2019-2028 (USD Million)
TABLE 200 RUSSIA PHARMACEUTICAL VIALS Market, BY Cap size,2019-2028 (USD Million)
TABLE 201 RUSSIA PHARMACEUTICAL VIALS Market, BY distribution channel,2019-2028 (USD Million)
TABLE 202 RUSSIA PHARMACEUTICAL VIALS Market, BY Capacity,2019-2028 (USD Million)
TABLE 203 RUSSIA PHARMACEUTICAL VIALS Market, BY Drug type,2019-2028 (USD Million)
TABLE 204 RUSSIA PHARMACEUTICAL VIALS Market in Drug type, BY injectable,2019-2028 (USD Million)
TABLE 205 RUSSIA PHARMACEUTICAL VIALS Market in Drug type, BY non-injectable,2019-2028 (USD Million)
TABLE 206 RUSSIA PHARMACEUTICAL VIALS Market, BY application,2019-2028 (USD Million)
TABLE 207 RUSSIA PHARMACEUTICAL VIALS Market, BY end-user,2019-2028 (USD Million)
TABLE 208 RUSSIA PHARMACEUTICAL VIALS Market, BY Market,2019-2028 (USD Million)
TABLE 209 TURKEY PHARMACEUTICAL VIALS Market, BY Material, 2019-2028 (USD Million)
TABLE 210 TURKEY PHARMACEUTICAL VIALS Market, BY material, 2019-2028 (Million units)
TABLE 211 TURKEY PHARMACEUTICAL VIALS Market, glass BY color, 2019-2028 (USD Million)
TABLE 212 TURKEY PHARMACEUTICAL VIALS Market, Glass BY type, 2019-2028 (USD Million)
TABLE 213 TURKEY PHARMACEUTICAL VIALS Market, glass BY product, 2019-2028 (USD Million)
TABLE 214 TURKEY PHARMACEUTICAL VIALS Market, Plastic BY color, 2019-2028 (USD Million)
TABLE 215 TURKEY PHARMACEUTICAL VIALS Market, Plastic BY type, 2019-2028 (USD Million)
TABLE 216 TURKEY PHARMACEUTICAL VIALS Market, BY neck type,2019-2028 (USD Million)
TABLE 217 TURKEY PHARMACEUTICAL VIALS Market, BY Cap size,2019-2028 (USD Million)
TABLE 218 TURKEY PHARMACEUTICAL VIALS Market, BY distribution channel,2019-2028 (USD Million)
TABLE 219 TURKEY PHARMACEUTICAL VIALS Market, BY Capacity,2019-2028 (USD Million)
TABLE 220 TURKEY PHARMACEUTICAL VIALS Market, BY Drug type,2019-2028 (USD Million)
TABLE 221 TURKEY PHARMACEUTICAL VIALS Market in Drug type, BY injectable,2019-2028 (USD Million)
TABLE 222 TURKEY PHARMACEUTICAL VIALS Market in Drug type, BY non-injectable,2019-2028 (USD Million)
TABLE 223 TURKEY PHARMACEUTICAL VIALS Market, BY application,2019-2028 (USD Million)
TABLE 224 TURKEY PHARMACEUTICAL VIALS Market, BY end-user,2019-2028 (USD Million)
TABLE 225 TURKEY PHARMACEUTICAL VIALS Market, BY Market,2019-2028 (USD Million)
TABLE 226 BELGIUM PHARMACEUTICAL VIALS Market, BY Material, 2019-2028 (USD Million)
TABLE 227 BELGIUM PHARMACEUTICAL VIALS Market, BY material, 2019-2028 (Million units)
TABLE 228 BELGIUM PHARMACEUTICAL VIALS Market, glass BY color, 2019-2028 (USD Million)
TABLE 229 BELGIUM PHARMACEUTICAL VIALS Market, Glass BY type, 2019-2028 (USD Million)
TABLE 230 BELGIUM PHARMACEUTICAL VIALS Market, glass BY product, 2019-2028 (USD Million)
TABLE 231 BELGIUM PHARMACEUTICAL VIALS Market, Plastic BY color, 2019-2028 (USD Million)
TABLE 232 BELGIUM PHARMACEUTICAL VIALS Market, Plastic BY type, 2019-2028 (USD Million)
TABLE 233 BELGIUM PHARMACEUTICAL VIALS Market, BY neck type,2019-2028 (USD Million)
TABLE 234 BELGIUM PHARMACEUTICAL VIALS Market, BY Cap size,2019-2028 (USD Million)
TABLE 235 BELGIUM PHARMACEUTICAL VIALS Market, BY distribution channel,2019-2028 (USD Million)
TABLE 236 BELGIUM PHARMACEUTICAL VIALS Market, BY Capacity,2019-2028 (USD Million)
TABLE 237 BELGIUM PHARMACEUTICAL VIALS Market, BY Drug type,2019-2028 (USD Million)
TABLE 238 BELGIUM PHARMACEUTICAL VIALS Market in Drug type, BY injectable,2019-2028 (USD Million)
TABLE 239 BELGIUM PHARMACEUTICAL VIALS Market in Drug type, BY non-injectable,2019-2028 (USD Million)
TABLE 240 BELGIUM PHARMACEUTICAL VIALS Market, BY application,2019-2028 (USD Million)
TABLE 241 BELGIUM PHARMACEUTICAL VIALS Market, BY end-user,2019-2028 (USD Million)
TABLE 242 BELGIUM PHARMACEUTICAL VIALS Market, BY Market,2019-2028 (USD Million)
TABLE 243 NETHERLANDS PHARMACEUTICAL VIALS Market, BY Material, 2019-2028 (USD Million)
TABLE 244 NETHERLANDS PHARMACEUTICAL VIALS Market, BY material, 2019-2028 (Million units)
TABLE 245 NETHERLANDS PHARMACEUTICAL VIALS Market, glass BY color, 2019-2028 (USD Million)
TABLE 246 NETHERLANDS PHARMACEUTICAL VIALS Market, Glass BY type, 2019-2028 (USD Million)
TABLE 247 NETHERLANDS PHARMACEUTICAL VIALS Market, glass BY product, 2019-2028 (USD Million)
TABLE 248 NETHERLANDS PHARMACEUTICAL VIALS Market, Plastic BY color, 2019-2028 (USD Million)
TABLE 249 NETHERLANDS PHARMACEUTICAL VIALS Market, Plastic BY type, 2019-2028 (USD Million)
TABLE 250 NETHERLANDS PHARMACEUTICAL VIALS Market, BY neck type,2019-2028 (USD Million)
TABLE 251 NETHERLANDS PHARMACEUTICAL VIALS Market, BY Cap size,2019-2028 (USD Million)
TABLE 252 NETHERLANDS PHARMACEUTICAL VIALS Market, BY distribution channel,2019-2028 (USD Million)
TABLE 253 NETHERLANDS PHARMACEUTICAL VIALS Market, BY Capacity,2019-2028 (USD Million)
TABLE 254 NETHERLANDS PHARMACEUTICAL VIALS Market, BY Drug type,2019-2028 (USD Million)
TABLE 255 NETHERLANDS PHARMACEUTICAL VIALS Market in Drug type, BY injectable,2019-2028 (USD Million)
TABLE 256 NETHERLANDS PHARMACEUTICAL VIALS Market in Drug type, BY non-injectable,2019-2028 (USD Million)
TABLE 257 NETHERLANDS PHARMACEUTICAL VIALS Market, BY application,2019-2028 (USD Million)
TABLE 258 NETHERLANDS PHARMACEUTICAL VIALS Market, BY end-user,2019-2028 (USD Million)
TABLE 259 NETHERLANDS PHARMACEUTICAL VIALS Market, BY Market,2019-2028 (USD Million)
TABLE 260 Rest of europe PHARMACEUTICAL VIALS Market, BY Material, 2019-2028 (USD Million)
TABLE 261 Rest of Europe PHARMACEUTICAL VIALS Market, BY material, 2019-2028 (Million units)


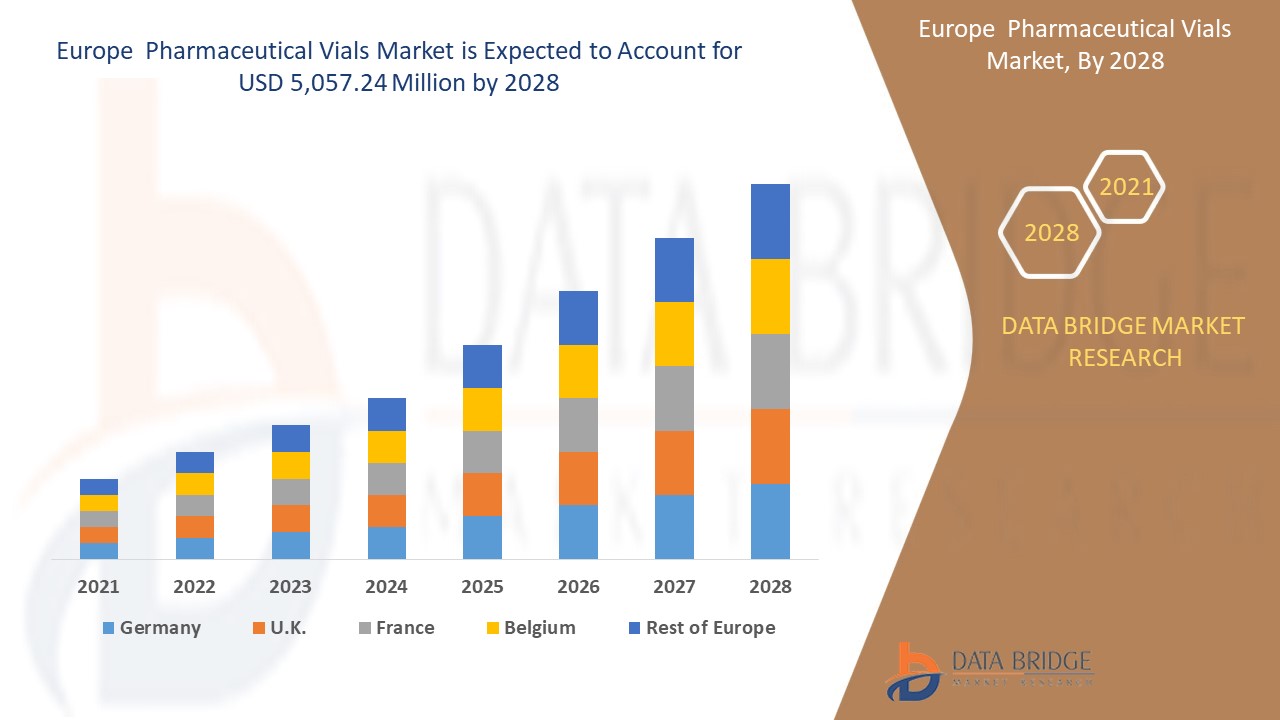 Market Analysis and Insights: Europe Pharmaceutical Vials Market
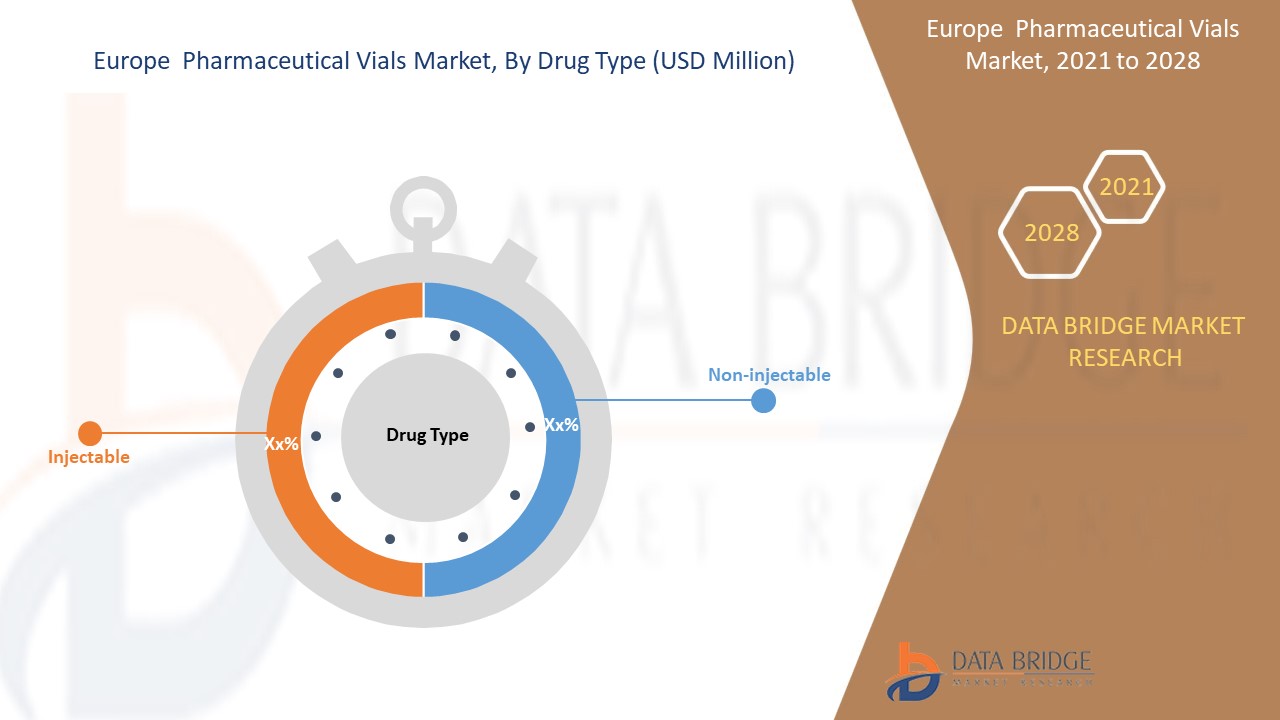 Pharmaceutical Vials Market Scope and Market Size