


 Forecast Period
  Market Size (Base Year)
  Market Size (Forecast Year)
 CAGR
CAGRGlobal Esports Market, By Revenue Streams (Sponsorships and Direct Advertisements, Media Rights, Publisher Fees, Tickets and Merchandise, Digital, and Streaming), Games (First/Third Person Shooters (FPS/TPS), Multiplayer Online Battle Arena (MOBA), Real Time Strategy (RTS), Fighting Games, Sports Simulations, Player Vs. Player (PvP), and Others), E-Platform (Mobile and Tablets, Consoles-Based eSports, PC-based eSports) - Industry Trends and Forecast to 2031.
eSports Market Analysis and Size
The global esports market continues to surge, driven by a confluence of factors. One of the primary drivers is the increasing accessibility of high-speed internet and the proliferation of smartphones and gaming devices, which have democratized gaming participation worldwide. Additionally, the rise of streaming platforms like Twitch and YouTube gaming has facilitated the widespread dissemination of esports content, fostering a vibrant community and attracting a diverse audience. However, amidst this growth, challenges such as regulatory hurdles and concerns over player health and well-being have emerged.
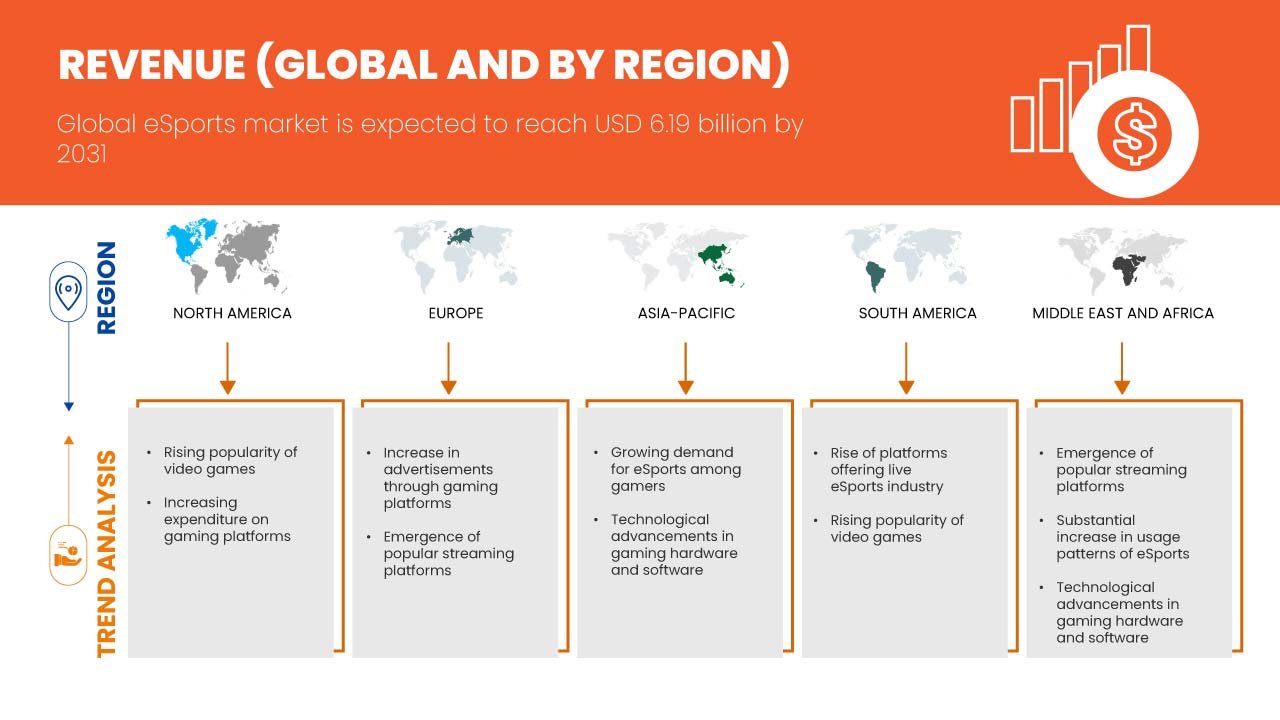
Data Bridge Market Research analyzes that the global eSports market is expected reach USD 6.19 billion by 2031 from USD 1.58 billion in 2023, growing with CAGR of 18.8% during forecast period of 2024 to 2031.
|
Report Metric |
Details |
|
Forecast Period |
2024 to 2031 |
|
Base Year |
2023 |
|
Historic Years |
2022 (Customizable to 2016-2021) |
|
Quantitative Units |
Revenue in USD Billion |
|
Segments Covered |
Revenue Streams (Sponsorships and Direct Advertisements, Media Rights, Publisher Fees, Tickets and Merchandise, Digital, and Streaming), Games (First/Third Person Shooters (FPS/TPS), Multiplayer Online Battle Arena (MOBA), Real Time Strategy (RTS), Fighting Games, Sports Simulations, Player Vs. Player (PvP), and Others), E-Platform (Mobile and Tablets, Consoles-Based eSports, PC-based eSports) |
|
Countries Covered |
U.S., Canada, Mexico, Germany, France, Italy, U.K., Netherlands, Belgium, Spain, Switzerland, Russia, Turkey, Rest of Europe, China, Japan, South Korea, India, Australia, Singapore, Thailand, Malaysia, Indonesia, Philippines, Rest of Asia-Pacific, Brazil, Argentina, Rest of South America, Saudi Arabia, South Africa, U.A.E., Egypt, Israel, and Rest of Middle East And Africa |
|
Market Players Covered |
FaZe Holdings Inc., X1 Entertainment Group, ESL FACEIT GROUP, CLOUD9, Activision Blizzard, Gfinity, NODWINGAMING, G ESports Holding GmbH., Team Liquid, Challonge, LLC, Battlefy, Inc., Play Versus, Inc., OPTIC GAMING, ESports Battle, and ESports Tower LLC. among others |
Market Definition
eSports, short for electronic sports, refers to competitive video gaming organized in a professional or semi-professional setting. Players or teams compete against each other in various video games, often in multiplayer formats, with tournaments and leagues organized on local, national, and international levels. eSports has gained significant popularity in recent years, with professional players, teams, and organizations competing for prize money, sponsorships, and recognition. Games commonly played in eSports include popular titles like League of Legends, Counter-Strike: Global Offensive, Dota 2, Overwatch, and many others across a range of genres such as first-person shooters, real-time strategy, and multiplayer online battle arena (MOBA) games.
Global eSports Market Dynamics
Drivers
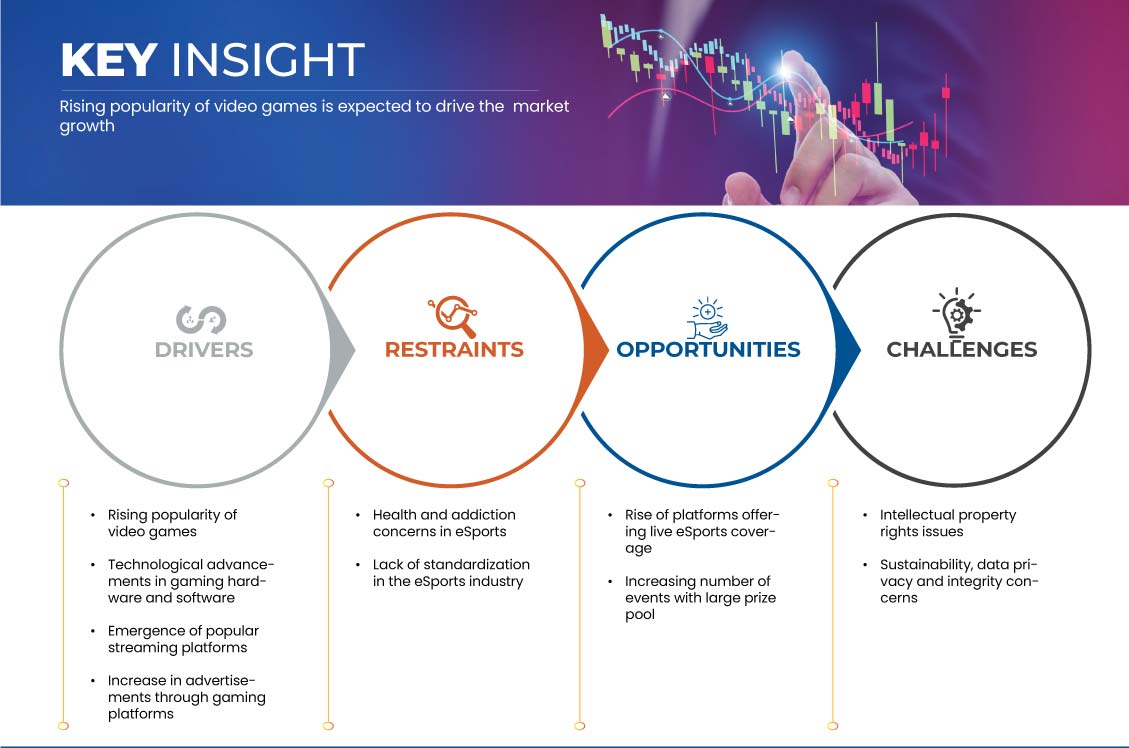
- Rising Popularity of Video Games
The rising popularity of video games serves as a significant driver for the global eSports market, fueling its rapid growth and expanding its reach to new audiences worldwide. As video games continue to evolve and attract a diverse range of players, the potential for competitive gaming as a form of entertainment has surged. With advancements in technology, particularly in internet connectivity and gaming platforms, players can easily connect and compete with others from around the globe. The rising popularity of video games not only attracts new participants and spectators to eSports events but also cultivates a vibrant ecosystem of content creators, influencers, and community engagement platforms. Consequently, eSports benefits from this symbiotic relationship with the broader gaming industry, experiencing a surge in viewership, sponsorship deals, and investment opportunities.
- Technological Advancements in Gaming Hardware and Software
The continuous innovation and improvement in gaming technology have led to enhanced gaming experiences, which directly impact the competitiveness and appeal of eSports. Firstly, advancements in gaming hardware, such as graphics processing units (GPUs), central processing units (CPUs), and peripherals like high-performance gaming mice and keyboards, enable players to achieve higher levels of precision, responsiveness, and immersion during gameplay. These technological improvements not only enhance the skill for players but also contribute to the overall spectacle and excitement of eSports events, attracting larger audiences and sponsors.
Furthermore, advancements in gaming software, including game engines, graphics rendering techniques have revolutionized the way eSports competitions are organized and experienced. Game engines allow developers to create visually stunning and immersive environments, enhancing the spectator experience and blurring the line between virtual and physical reality. Additionally, robust online matchmaking systems and dedicated eSports modes within games facilitate fair and competitive gameplay, enabling players from around the world to compete against each other seamlessly.
Opportunities
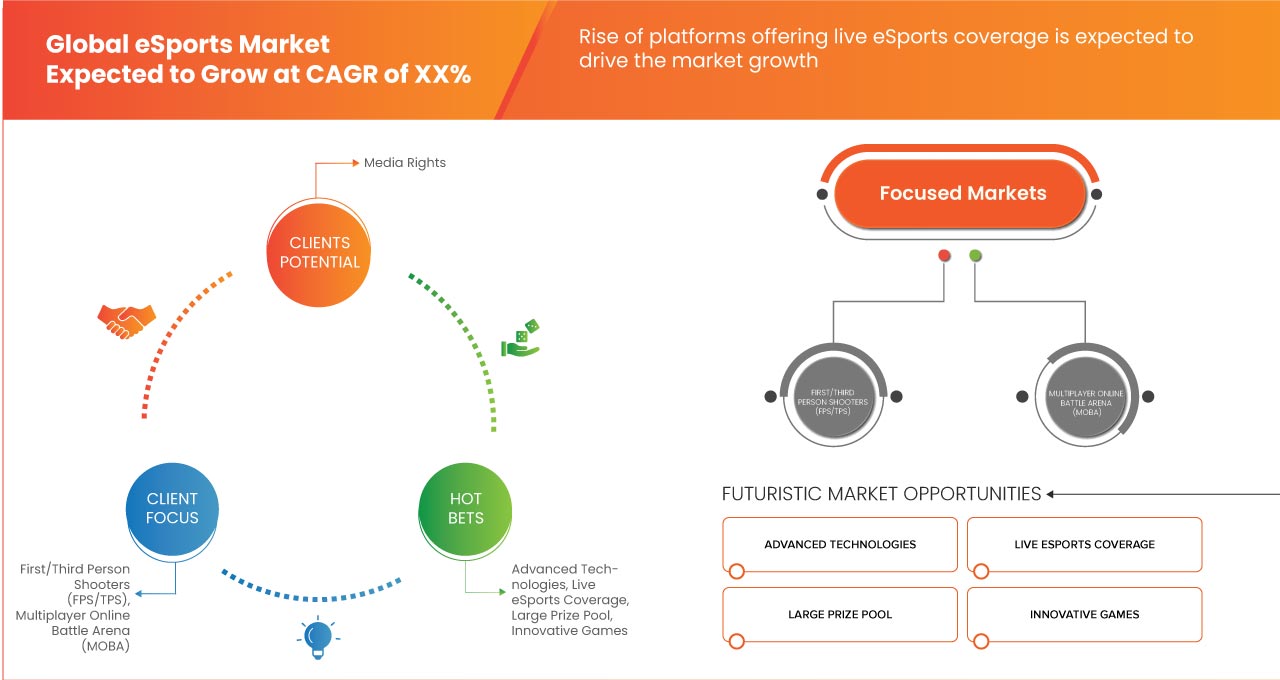
- Rise of Platforms Offering Live ESports Coverage
The eSports industry has seen tremendous growth over the years, both in terms of viewership and revenue. The increasing viewership is what mainly contributed to the revenue growth – and it's not just because those viewers are generating revenue. Seeing the potential of reaching a large and engaged audience, brands are investing in eSports marketing, both directly and indirectly. With the exponential growth of the eSports industry, there has been a corresponding surge in platforms offering live coverage of eSports events. These platforms range from dedicated eSports streaming websites to mainstream media channels and have become key players in the dissemination of eSports content to a global audience. This presents a significant opportunity to collate and analyze viewership data, engagement metrics, and audience demographics across various platforms.
The rise of platforms offering live eSports coverage represents a monumental shift in how audiences consume gaming content. Platforms such as Twitch, YouTube Gaming, and Facebook Gaming also have democratized access to eSports events, allowing fans to watch their favourite games and players in real-time from anywhere in the world. For Instance, Twitch, has emerged as a dominant force in the eSports streaming landscape, boasting millions of active users and hosting a wide array of gaming content.
Restraint/Challenge
- Health and Addiction Concerns in eSports
Health and addiction concerns in the eSports market are significant considerations given the immersive nature of gaming and the intense competition involved. Prolonged gaming sessions can lead to various physical health issues such as eye strain, repetitive strain injuries (RSI), and musculoskeletal problems due to prolonged sitting or improper posture. Additionally, excessive gaming can have adverse effects on mental health, including increased stress, anxiety, and depression, particularly among professional players who face intense pressure to perform.
Furthermore, addiction to gaming, known as gaming disorder, is recognized as a legitimate concern by the World Health Organization (WHO). Gaming addiction can lead to social withdrawal, neglect of personal hygiene, disrupted sleep patterns, and academic or occupational impairment. It can also strain relationships with family and friends.
Recent Developments
- In October 2022, according to an article by ResearchGate GmbH., The realm of eSports presents a promising avenue for advertisers, with players generally perceiving ads within video games positively, This increase in advertising through the gaming industry serves as a driving force for the global eSports market, enhancing revenue streams, fostering brand engagement, and bolstering the overall growth and sustainability of the eSports ecosystem
- In June 2021, according to an article by National Library of Medicine, The surge in advertising through the gaming industry serves as a significant driver for the global eSports market. Advertisers recognize eSports as a prime opportunity due to the positive reception of ads by players, who perceive them favorably if they seamlessly blend into the gaming experience without disrupting gameplay. This approach mirrors the concept of "product placement," where brands are integrated into entertainment content. As advertising within gaming continues to evolve, it not only generates revenue but also enhances the overall eSports experience, contributing to the industry's continued growth and commercial success
Global Esports Market Scope
The global eSports market is segmented into three notable segments based on revenue streams, games and e-platform. The growth amongst these segments will help you analyze major growth segments in the industries and provide the users with a valuable market overview and market insights to make strategic decisions to identify core market applications.
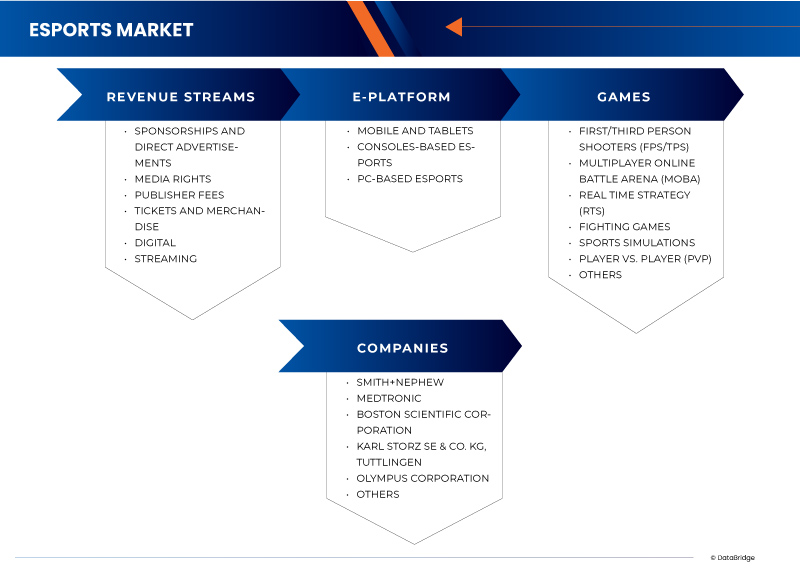
Revenue Streams
- Sponsorships and Direct Advertisements
- Media Rights
- Publisher Fees
- Tickets and Merchandise
- Digital
- Streaming
On the basis of revenue streams, the market is segmented into sponsorships and direct advertisements, media rights, publisher fees, tickets and merchandise, digital, and streaming.
Games
- First/Third Person Shooters (FPS/TPS)
- Multiplayer Online Battle Arena (MOBA)
- Real Time Strategy (RTS)
- Fighting Games
- Sports Simulations
- Player Vs. Player (PVP)
- Others
On the basis of games, the market is further segmented into First/Third Person Shooters (FPS/TPS), Multiplayer Online Battle Arena (MOBA), Real Time Strategy (RTS), fighting games, sports simulations, player vs. player (PVP) and others.
E-Platform
- Mobile and Tablets
- Consoles-Based eSports
- Pc-Based Esports
On the basis of E-platform, the market is segmented into mobile and tablets, consoles-based esports and PC-based esports.
Global eSports Market Regional Analysis/Insights
The global eSports market is segmented on the basis of revenue streams, games and E-platform.
The countries covered in Global eSports market report are U.S., Canada, Mexico, Germany, France, Italy, U.K., Netherlands, Belgium, Spain, Switzerland, Russia, Turkey, rest of Europe, China, Japan, South Korea, India, Australia, Singapore, Thailand, Malaysia, Indonesia, Philippines, rest of Asia-Pacific, Brazil, Argentina, rest of South America, Saudi Arabia, South Africa, U.A.E., Egypt, Israel, and rest of Middle East and Africa.
Asia-Pacific is expected to dominate in this market due to rapid industrialization, increasing construction activities, and high demand for paints, coatings, and adhesives, supported by growing infrastructure development and manufacturing sectors in the region. China is expected to dominate in Asia-Pacific because increase in advertisements through gaming platforms. U.S. is expected to dominate in North America due to rise in demand for video games. Germany is expected to dominate in Europe due to increasing number of streaming platforms.
The country section of the report also provides individual market-impacting factors and changes in market regulation that impact the current and future trends of the market. Data point downstream and upstream value chain analysis, technical trends porter's five forces analysis, and case studies are some of the pointers used to forecast the market scenario for individual countries. Also, the presence and availability of North America brands and their challenges faced due to large or scarce competition from local and domestic brands, the impact of domestic tariffs, and trade routes are considered while providing forecast analysis of the country data.
Competitive Landscape and Global eSports Market Share Analysis
The global eSports market competitive landscape provides details by competitors. Details included are company overview, company financials, revenue generated, market potential, investment in research and development, new market initiatives, production sites and facilities, company strengths and weaknesses, product launch, product trials pipelines, product approvals, patents, product width and breadth, application dominance, technology lifeline curve. The above data points provided are only related to the companies’ focus related to the Global Surfactants Market.
Some of the prominent participants operating in the global eSports market are FaZe Holdings Inc., X1 Entertainment Group, ESL FACEIT GROUP, CLOUD9, Activision Blizzard, Gfinity PLC., NODWINGAMING, G ESports Holding GmbH., Team Liquid, Challonge, LLC, Battlefy, Inc., Play Versus, Inc., OPTIC GAMING, ESports Battle, and ESports Tower LLC. among others.
SKU-