Food & Beverage

Image

Middle East and Africa Sugar Substitute Market – Industry Trends and Forecast to 2029

  • Food & Beverage
  • Upcoming Report
  • Jun 2022
  • MEA
  • 350 Pages
  • No of Tables: 220
  • No of Figures: 60

Middle East and Africa Sugar Substitute Market, By Type (High-Fructose Syrups, High-Intensity Sweeteners, Low-Intensity Sweeteners), Form (Crystallized, Liquid, Powder), Category (Natural, Synthetic), Application (Beverages, Food Products, Oral Care, Pharmaceuticals, Others)– Industry Trends and Forecast to 2029

Middle East and Africa Sugar Substitute Market

Market Analysis and Size

Diabetes, obesity, and metabolic syndrome have all become major public health issues as a result of their links to an imbalanced calorie intake. Sugar substitutes play an important role in reducing calories as part of an overall healthy diet and physical activity regimen to combat the conditions mentioned above.

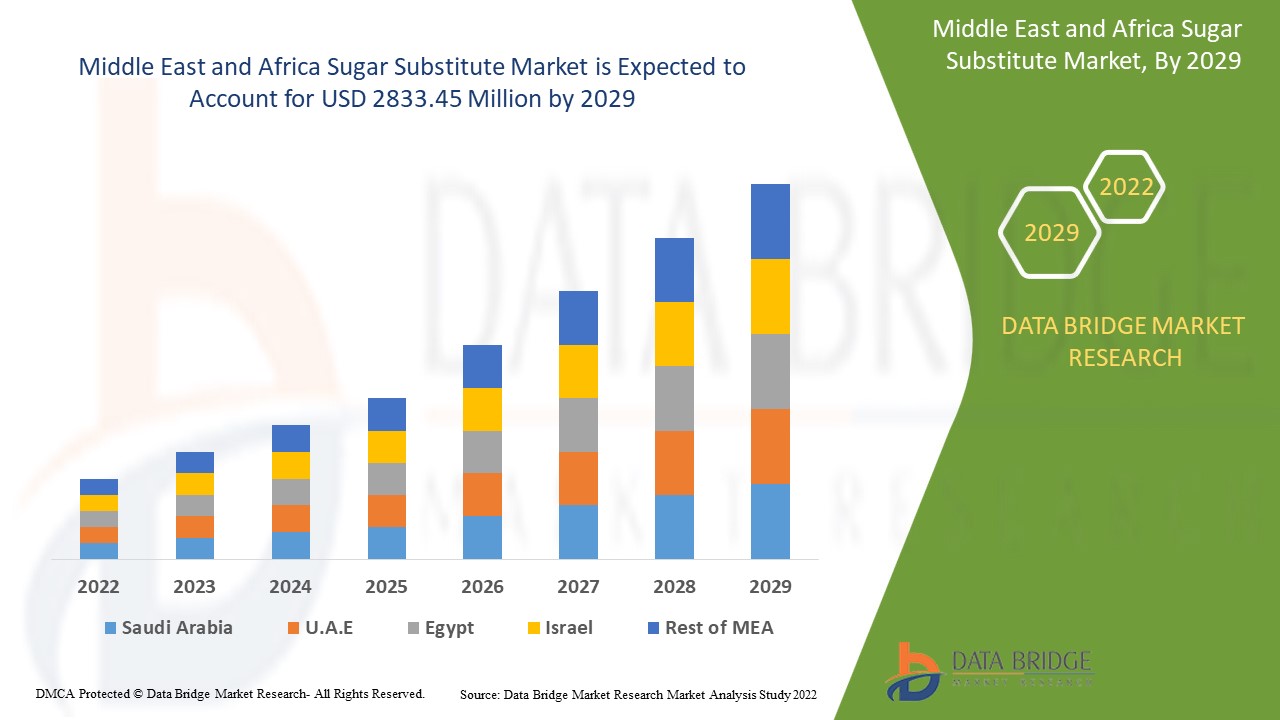
Data Bridge Market Research analyses that the sugar substitutes market which was growing at a value of 1624.64 million in 2021 and is expected to reach the value of USD 2833.45 million by 2029, at a CAGR of 7.2% during the forecast period of 2022 to 2029.

Market Definition

A sugar substitute is a food additive that tastes like sugar but contains far less calories than sugar-based sweeteners, making it a zero-calorie or low-calorie sweetener. They are derived from natural substances or artificially created using chemicals and preservatives.

Report Scope and Market Segmentation

Report Metric

Details

Forecast Period

2022 to 2029

Base Year

2021

Historic Years

2020 (Customizable to 2019 - 2014)

Quantitative Units

Revenue in USD million, Volumes in Units, Pricing in USD

Segments Covered

Type (High-Fructose Syrups, High-Intensity Sweeteners, Low-Intensity Sweeteners), Form (Crystallized, Liquid, Powder), Category (Natural, Synthetic), Application (Beverages, Food Products, Oral Care, Pharmaceuticals, Others)

Countries Covered

South Africa, U.A.E, Saudi Arabia, Oman, Kuwait, rest of Middle East & Africa

Market Players Covered

DuPont (US), ADM (US), Tate & Lyle (UK), Ingredion (US), Cargill Incorporated (US), Roquette Frères (France), PureCircle Ltd (US), MacAndrews & Forbes Incorporated (US), JK Sucralose Inc. (China), Ajinomoto Co. Inc. (Japan), JK Sucralose Inc. (China), Ajinomoto Co. Inc. (Japan), NutraSweetM Co. (U.S.), Südzucker AG (Germany), Layn Corp. (China), Zhucheng Haotian Pharm Co., Ltd. (China), HSWT (France)

Opportunities

  • Rising technological innovation in food and beverage industry
  • Rising demand for nutritional supplements and snacks
  • The fluctuating prices of sugar

Sugar Substitutes Market Dynamics

Drivers

  • Rising preferences for natural sugar

Sugar substitutes are commonly used as sugar substitutes in beverages such as soft drinks or carbonated beverages, flavouring juices, and other food products. Natural sugar substitutes are gaining popularity in the United States as consumer preferences shift toward organic-based foods and beverages. Natural sugar is a low caloric sweetener extracted from plants like stevia, monk fruits, and others that is 200 times sweeter than sugar. These advantages of sugar substitutes, as well as their organic advantages, have aided market growth.

 Growing demand in various end-user industries

The growing usage of sugar substitutes in a variety of end-use applications such as medicines, cosmetics, food, feed, ethanol generation, and others is also propelling the market. It can be utilized as a water-retention agent in personal care and cosmetics serums, as well as a nutritional supplement in pharmaceutical products like syrups and injections. Strong R&D paired with technical expertise has propelled the company to the forefront, and as a result, crystalline sugar demand has increased over time.

Opportunity

Growing technical innovation in the food processing sector and rising demand for nutritional snack bars will augment market growth. Sugar substitute manufacturers are expected to benefit from price fluctuations in sugar. As a result of these factors, the market is expanding in tandem with the number of diabetic patients and consumer health consciousness.

Restraints

However, many scientists believe that excessive sugar substitute consumption can lead to serious health problems such as type II diabetes, heart disease, obesity, and in some cases can led to cancer. The decreased availability of sugar substitutes, combined with the development of artificial sweeteners, has shifted consumer preferences toward artificial sweeteners, limiting market growth.

This sugar substitute market report provides details of new recent developments, trade regulations, import-export analysis, production analysis, value chain optimization, market share, impact of domestic and localized market players, analyses opportunities in terms of emerging revenue pockets, changes in market regulations, strategic market growth analysis, market size, category market growths, application niches and dominance, product approvals, product launches, geographic expansions, technological innovations in the market. To gain more info on the Sugar substitute market contact Data Bridge Market Research for an Analyst Brief, our team will help you take an informed market decision to achieve market growth.

COVID-19 Impact on Sugar Substitutes Market

The sugar substitutes market is experiencing a significant impact as a result of the pandemic that has entered the world's functioning because of changing market trends, the pandemic's effects have disrupted the supply chain mechanism. The market is predicting impediments, and the production of substitutes will be guided by changing consumer tastes and preferences. Consumption is expected to rise, assisting people in maintaining a low sugar intake and adhering to various types of low-calorie diets.

Recent development

  • Tate & Lyle will release the VANTAGE sweetener solution design tools in July 2020. It is a collection of new and innovative sweetener solution design tools and an education programme for creating sugar-reduced food and drinks with low-calorie sweeteners.

Middle East and Africa Sugar Substitutes Market Scope

The sugar substitutes market is segmented on the basis of type, form, category and application.. The growth amongst these segments will help you analyze meagre growth segments in the industries and provide the users with a valuable market overview and market insights to help them make strategic decisions for identifying core market applications.

Type

  • High-intensity sweeteners
  • Low-intensity sweeteners
  • High-fructose syrups

On the basis of type, the market is segmented into high-intensity sweeteners, low-intensity sweeteners and high-fructose syrups.

Form

  • Powder
  • Crystallized
  • Liquid.

On the basis of form, the market is segmented into powder, crystallized and liquid.

Category

  • Natural
  • Synthetic

On the basis of category, the market is segmented into natural and synthetic.

Application

  • Food products
  • Oral care
  • Pharmaceuticals
  • Beverages

On the basis of application, the market is segmented into beverages, food products, oral care, pharmaceuticals and others.

Sugar Substitutes Market Regional Analysis/Insights

The sugar substitutes market is analysed and market size insights and trends are provided by country, type, form, category and application.as referenced above.

The countries covered in the sugar substitutes market report are South Africa, U.A.E, Saudi Arabia, Oman, Kuwait, rest of Middle East & Africa

In the Middle East and Africa sugar substitutes market, Middle East and Africa and Europe accounted for the vast majority of market share because of the presence of key market players, significant investment in R&D, technologically advanced methods of production, and the availability of raw materials in the region. The advancement of pharmaceuticals through the use of natural sugar has proven to be the most promising for market growth. The Asia Pacific region accounted for the second-largest sugar substitutes market because of increased use in the pharmaceutical and food and beverage industries. China leads the market due to the presence of market key players and the country's large population, whereas India is the fastest-growing market due to the use of innovative manufacturing techniques and rising income levels.

The country section of the report also provides individual market impacting factors and changes in market regulation that impact the current and future trends of the market. Data points like down-stream and upstream value chain analysis, technical trends and porter's five forces analysis, case studies are some of the pointers used to forecast the market scenario for individual countries. Also, the presence and availability of Middle East and Africa brands and their challenges faced due to large or scarce competition from local and domestic brands, impact of domestic tariffs and trade routes are considered while providing forecast analysis of the country data.   

Competitive Landscape and Sugar Substitutes Market Share Analysis

The sugar substitutes market competitive landscape provides details by competitor. Details included are company overview, company financials, revenue generated, market potential, investment in research and development, new market initiatives, Middle East and Africa presence, production sites and facilities, production capacities, company strengths and weaknesses, product launch, product width and breadth, application dominance. The above data points provided are only related to the companies' focus related to sugar substitutes market.

Some of the major players operating in the sugar substitutes market are:

  • DuPont (US)
  • ADM (US)
  • Tate & Lyle (UK)
  • Ingredion (US)
  • Cargill Incorporated (US)
  • Roquette Frères (France)
  • PureCircle Ltd (US)
  • MacAndrews & Forbes Incorporated (US)
  • JK Sucralose Inc. (China)
  • Ajinomoto Co. Inc. (Japan)
  • JK Sucralose Inc. (China)
  • Ajinomoto Co. Inc. (Japan)
  • NutraSweetM Co. (U.S.)
  • Südzucker AG (Germany)
  • Layn Corp. (China)
  • Zhucheng Haotian Pharm Co., Ltd. (China)
  • HSWT (France)


SKU-

TABLE 1 MIDDLE EAST & AFRICA SUGAR SUBSTITUTES MARKET, BY TYPE, 2018-2027 (USD MILLION)

TABLE 2 MIDDLE EAST & AFRICA HIGH-FRUCTOSE SYRUPS IN SUGAR SUBSTITUTES MARKET, BY REGION, 2018-2027 (USD MILLION)

TABLE 3 MIDDLE EAST & AFRICA HIGH-INTENSITY SWEETENERS IN SUGAR SUBSTITUTES MARKET, BY REGION, 2018-2027 (USD MILLION)

TABLE 4 MIDDLE EAST & AFRICA HIGH-INTENSITY SWEETENERS IN SUGAR SUBSTITUTES MARKET, BY COMPOSITION, 2018-2027 (USD MILLION)

TABLE 5 MIDDLE EAST & AFRICA LOW-INTENSITY SWEETENERS IN SUGAR SUBSTITUTES MARKET, BY REGION, 2018-2027 (USD MILLION)

TABLE 6 MIDDLE EAST & AFRICA LOW-INTENSITY SWEETENERS IN SUGAR SUBSTITUTES MARKET, BY COMPOSITION, 2018-2027 (USD MILLION)

TABLE 7 MIDDLE EAST & AFRICA SUGAR SUBSTITUTES MARKET, BY FORM, 2018-2027 (USD MILLION)

TABLE 8 MIDDLE EAST & AFRICA CRYSTALLIZED FORM IN SUGAR SUBSTITUTES MARKET, BY REGION, 2018-2027 (USD MILLION)

TABLE 9 MIDDLE EAST & AFRICA LIQUID FORM IN SUGAR SUBSTITUTES MARKET, BY REGION, 2018-2027 (USD MILLION)

TABLE 10 MIDDLE EAST & AFRICA POWDER FORM IN SUGAR SUBSTITUTES MARKET, BY REGION, 2018-2027 (USD MILLION)

TABLE 11 MIDDLE EAST & AFRICA SUGAR SUBSTITUTES MARKET, BY APPLICATION, 2018-2027 (USD MILLION)

TABLE 12 MIDDLE EAST & AFRICA BEVERAGES APPLICATION IN SUGAR SUBSTITUTES MARKET, BY REGION, 2018-2027 (USD MILLION)

TABLE 13 MIDDLE EAST & AFRICA BEVERAGES IN SUGAR SUBSTITUTES MARKET, BY APPLICATION, 2018-2027 (USD MILLION)

TABLE 14 MIDDLE EAST & AFRICA POWDERED BEVERAGES IN SUGAR SUBSTITUTES MARKET, BY APPLICATION, 2018-2027 (USD MILLION)

TABLE 15 MIDDLE EAST & AFRICA FOOD PRODUCTS APPLICATION IN SUGAR SUBSTITUTES MARKET, BY REGION, 2018-2027 (USD MILLION)

TABLE 16 MIDDLE EAST & AFRICA FOOD PRODUCTS IN SUGAR SUBSTITUTES MARKET, BY APPLICATION, 2018-2027 (USD MILLION)

TABLE 17 MIDDLE EAST & AFRICA DAIRY PRODUCTS IN SUGAR SUBSTITUTES MARKET, BY APPLICATION, 2018-2027 (USD MILLION)

TABLE 18 MIDDLE EAST & AFRICA BAKERY PRODUCTS IN SUGAR SUBSTITUTES MARKET, BY APPLICATION, 2018-2027 (USD MILLION)

TABLE 19 MIDDLE EAST & AFRICA CONFECTIONERY IN SUGAR SUBSTITUTES MARKET, BY APPLICATION, 2018-2027 (USD MILLION)

TABLE 20 MIDDLE EAST & AFRICA ORAL CARE APPLICATION IN SUGAR SUBSTITUTES MARKET, BY REGION, 2018-2027 (USD MILLION)

TABLE 21 MIDDLE EAST & AFRICA ORAL CARE IN SUGAR SUBSTITUTES MARKET, BY APPLICATION, 2018-2027 (USD MILLION)

TABLE 22 MIDDLE EAST & AFRICA PHARMACEUTICALS APPLICATION IN SUGAR SUBSTITUTES MARKET, BY REGION, 2018-2027 (USD MILLION)

TABLE 23 MIDDLE EAST & AFRICA PHARMACEUTICALS IN SUGAR SUBSTITUTES MARKET, BY APPLICATION, 2018-2027 (USD MILLION)

TABLE 24 MIDDLE EAST & AFRICA OTHERS APPLICATION IN SUGAR SUBSTITUTES MARKET, BY REGION, 2018-2027 (USD MILLION)

TABLE 25 MIDDLE EAST & AFRICA SUGAR SUBSTITUTES MARKET, BY CATEGORY, 2018-2027 (USD MILLION)

TABLE 26 MIDDLE EAST & AFRICA NATURAL CATGORY IN SUGAR SUBSTITUTES MARKET, BY REGION, 2018-2027 (USD MILLION)

TABLE 27 MIDDLE EAST & AFRICA SYNTHETIC CATEGORY IN SUGAR SUBSTITUTES MARKET, BY REGION, 2018-2027 (USD MILLION)

TABLE 28 MIDDLE EAST & AFRICA SUGAR SUBSTITUTES MARKET, BY COUNTRY, 2018-2027 (USD MILLION)

TABLE 29 MIDDLE EAST & AFRICA SUGAR SUBSTITUTES MARKET, BY TYPE, 2018-2027 (USD MILLION)

TABLE 30 MIDDLE EAST & AFRICA HIGH-INTENSITY SWEETENERS IN SUGAR SUBSTITUTES MARKET, BY COMPOSITION, 2018-2027 (USD MILLION)

TABLE 31 MIDDLE EAST & AFRICA LOW-INTENSITY SWEETENERS IN SUGAR SUBSTITUTES MARKET, BY COMPOSITION, 2018-2027 (USD MILLION)

TABLE 32 MIDDLE EAST & AFRICA SUGAR SUBSTITUTES MARKET, BY FORM, 2018-2027 (USD MILLION)

TABLE 33 MIDDLE EAST & AFRICA SUGAR SUBSTITUTES MARKET, BY CATEGORY, 2018-2027 (USD MILLION)

TABLE 34 MIDDLE EAST & AFRICA SUGAR SUBSTITUTES MARKET, BY APPLICATION, 2018-2027 (USD MILLION)

TABLE 35 MIDDLE EAST & AFRICA BEVERAGES IN SUGAR SUBSTITUTES MARKET, BY APPLICATION, 2018-2027 (USD MILLION)

TABLE 36 MIDDLE EAST & AFRICA POWDERED BEVERAGES IN SUGAR SUBSTITUTES MARKET, BY APPLICATION, 2018-2027 (USD MILLION)

TABLE 37 MIDDLE EAST & AFRICA FOOD PRODUCTS IN SUGAR SUBSTITUTES MARKET, BY APPLICATION, 2018-2027 (USD MILLION)

TABLE 38 MIDDLE EAST & AFRICA BAKERY PRODUCTS IN SUGAR SUBSTITUTES MARKET, BY APPLICATION, 2018-2027 (USD MILLION)

TABLE 39 MIDDLE EAST & AFRICA CONFECTIONERY IN SUGAR SUBSTITUTES MARKET, BY APPLICATION, 2018-2027 (USD MILLION)

TABLE 40 MIDDLE EAST & AFRICA DAIRY PRODUCTS IN SUGAR SUBSTITUTES MARKET, BY APPLICATION, 2018-2027 (USD MILLION)

TABLE 41 MIDDLE EAST & AFRICA ORAL CARE IN SUGAR SUBSTITUTES MARKET, BY APPLICATION, 2018-2027 (USD MILLION)

TABLE 42 MIDDLE EAST & AFRICA PHARMACEUTICALS IN SUGAR SUBSTITUTES MARKET, BY APPLICATION, 2018-2027 (USD MILLION)

TABLE 43 SOUTH AFRICA SUGAR SUBSTITUTES MARKET, BY TYPE, 2018-2027 (USD MILLION)

TABLE 44 SOUTH AFRICA HIGH-INTENSITY SWEETENERS IN SUGAR SUBSTITUTES MARKET, BY COMPOSITION, 2018-2027 (USD MILLION)

TABLE 45 SOUTH AFRICA LOW-INTENSITY SWEETENERS IN SUGAR SUBSTITUTES MARKET, BY COMPOSITION, 2018-2027 (USD MILLION)

TABLE 46 SOUTH AFRICA SUGAR SUBSTITUTES MARKET, BY FORM, 2018-2027 (USD MILLION)

TABLE 47 SOUTH AFRICA SUGAR SUBSTITUTES MARKET, BY CATEGORY, 2018-2027 (USD MILLION)

TABLE 48 SOUTH AFRICA SUGAR SUBSTITUTES MARKET, BY APPLICATION, 2018-2027 (USD MILLION)

TABLE 49 SOUTH AFRICA BEVERAGES IN SUGAR SUBSTITUTES MARKET, BY APPLICATION, 2018-2027 (USD MILLION)

TABLE 50 SOUTH AFRICA POWDERED BEVERAGES IN SUGAR SUBSTITUTES MARKET, BY APPLICATION, 2018-2027 (USD MILLION)

TABLE 51 SOUTH AFRICA FOOD PRODUCTS IN SUGAR SUBSTITUTES MARKET, BY APPLICATION, 2018-2027 (USD MILLION)

TABLE 52 SOUTH AFRICA BAKERY PRODUCTS IN SUGAR SUBSTITUTES MARKET, BY APPLICATION, 2018-2027 (USD MILLION)

TABLE 53 SOUTH AFRICA CONFECTIONERY IN SUGAR SUBSTITUTES MARKET, BY APPLICATION, 2018-2027 (USD MILLION)

TABLE 54 SOUTH AFRICA DAIRY PRODUCTS IN SUGAR SUBSTITUTES MARKET, BY APPLICATION, 2018-2027 (USD MILLION)

TABLE 55 SOUTH AFRICA ORAL CARE IN SUGAR SUBSTITUTES MARKET, BY APPLICATION, 2018-2027 (USD MILLION)

TABLE 56 SOUTH AFRICA PHARMACEUTICALS IN SUGAR SUBSTITUTES MARKET, BY APPLICATION, 2018-2027 (USD MILLION)

TABLE 57 U.A.E SUGAR SUBSTITUTES MARKET, BY TYPE, 2018-2027 (USD MILLION)

TABLE 58 U.A.E HIGH-INTENSITY SWEETENERS IN SUGAR SUBSTITUTES MARKET, BY COMPOSITION, 2018-2027 (USD MILLION)

TABLE 59 U.A.E LOW-INTENSITY SWEETENERS IN SUGAR SUBSTITUTES MARKET, BY COMPOSITION, 2018-2027 (USD MILLION)

TABLE 60 U.A.E SUGAR SUBSTITUTES MARKET, BY FORM, 2018-2027 (USD MILLION)

TABLE 61 U.A.E SUGAR SUBSTITUTES MARKET, BY CATEGORY, 2018-2027 (USD MILLION)

TABLE 62 U.A.E SUGAR SUBSTITUTES MARKET, BY APPLICATION, 2018-2027 (USD MILLION)

TABLE 63 U.A.E BEVERAGES IN SUGAR SUBSTITUTES MARKET, BY APPLICATION, 2018-2027 (USD MILLION)

TABLE 64 U.A.E POWDERED BEVERAGES IN SUGAR SUBSTITUTES MARKET, BY APPLICATION, 2018-2027 (USD MILLION)

TABLE 65 U.A.E FOOD PRODUCTS IN SUGAR SUBSTITUTES MARKET, BY APPLICATION, 2018-2027 (USD MILLION)

TABLE 66 U.A.E BAKERY PRODUCTS IN SUGAR SUBSTITUTES MARKET, BY APPLICATION, 2018-2027 (USD MILLION)

TABLE 67 U.A.E CONFECTIONERY IN SUGAR SUBSTITUTES MARKET, BY APPLICATION, 2018-2027 (USD MILLION)

TABLE 68 U.A.E DAIRY PRODUCTS IN SUGAR SUBSTITUTES MARKET, BY APPLICATION, 2018-2027 (USD MILLION)

TABLE 69 U.A.E ORAL CARE IN SUGAR SUBSTITUTES MARKET, BY APPLICATION, 2018-2027 (USD MILLION)

TABLE 70 U.A.E PHARMACEUTICALS IN SUGAR SUBSTITUTES MARKET, BY APPLICATION, 2018-2027 (USD MILLION)

TABLE 71 SAUDI ARABIA SUGAR SUBSTITUTES MARKET, BY TYPE, 2018-2027 (USD MILLION)

TABLE 72 SAUDI ARABIA HIGH-INTENSITY SWEETENERS IN SUGAR SUBSTITUTES MARKET, BY COMPOSITION, 2018-2027 (USD MILLION)

TABLE 73 SAUDI ARABIA LOW-INTENSITY SWEETENERS IN SUGAR SUBSTITUTES MARKET, BY COMPOSITION, 2018-2027 (USD MILLION)

TABLE 74 SAUDI ARABIA SUGAR SUBSTITUTES MARKET, BY FORM, 2018-2027 (USD MILLION)

TABLE 75 SAUDI ARABIA SUGAR SUBSTITUTES MARKET, BY CATEGORY, 2018-2027 (USD MILLION)

TABLE 76 SAUDI ARABIA SUGAR SUBSTITUTES MARKET, BY APPLICATION, 2018-2027 (USD MILLION)

TABLE 77 SAUDI ARABIA BEVERAGES IN SUGAR SUBSTITUTES MARKET, BY APPLICATION, 2018-2027 (USD MILLION)

TABLE 78 SAUDI ARABIA POWDERED BEVERAGES IN SUGAR SUBSTITUTES MARKET, BY APPLICATION, 2018-2027 (USD MILLION)

TABLE 79 SAUDI ARABIA FOOD PRODUCTS IN SUGAR SUBSTITUTES MARKET, BY APPLICATION, 2018-2027 (USD MILLION)

TABLE 80 SAUDI ARABIA BAKERY PRODUCTS IN SUGAR SUBSTITUTES MARKET, BY APPLICATION, 2018-2027 (USD MILLION)

TABLE 81 SAUDI ARABIA CONFECTIONERY IN SUGAR SUBSTITUTES MARKET, BY APPLICATION, 2018-2027 (USD MILLION)

TABLE 82 SAUDI ARABIA DAIRY PRODUCTS IN SUGAR SUBSTITUTES MARKET, BY APPLICATION, 2018-2027 (USD MILLION)

TABLE 83 SAUDI ARABIA ORAL CARE IN SUGAR SUBSTITUTES MARKET, BY APPLICATION, 2018-2027 (USD MILLION)

TABLE 84 SAUDI ARABIA PHARMACEUTICALS IN SUGAR SUBSTITUTES MARKET, BY APPLICATION, 2018-2027 (USD MILLION)

TABLE 85 OMAN SUGAR SUBSTITUTES MARKET, BY TYPE, 2018-2027 (USD MILLION)

TABLE 86 OMAN HIGH-INTENSITY SWEETENERS IN SUGAR SUBSTITUTES MARKET, BY COMPOSITION, 2018-2027 (USD MILLION)

TABLE 87 OMAN LOW-INTENSITY SWEETENERS IN SUGAR SUBSTITUTES MARKET, BY COMPOSITION, 2018-2027 (USD MILLION)

TABLE 88 OMAN SUGAR SUBSTITUTES MARKET, BY FORM, 2018-2027 (USD MILLION)

TABLE 89 OMAN SUGAR SUBSTITUTES MARKET, BY CATEGORY, 2018-2027 (USD MILLION)

TABLE 90 OMAN SUGAR SUBSTITUTES MARKET, BY APPLICATION, 2018-2027 (USD MILLION)

TABLE 91 OMAN BEVERAGES IN SUGAR SUBSTITUTES MARKET, BY APPLICATION, 2018-2027 (USD MILLION)

TABLE 92 OMAN POWDERED BEVERAGES IN SUGAR SUBSTITUTES MARKET, BY APPLICATION, 2018-2027 (USD MILLION)

TABLE 93 OMAN FOOD PRODUCTS IN SUGAR SUBSTITUTES MARKET, BY APPLICATION, 2018-2027 (USD MILLION)

TABLE 94 OMAN BAKERY PRODUCTS IN SUGAR SUBSTITUTES MARKET, BY APPLICATION, 2018-2027 (USD MILLION)

TABLE 95 OMAN CONFECTIONERY IN SUGAR SUBSTITUTES MARKET, BY APPLICATION, 2018-2027 (USD MILLION)

TABLE 96 OMAN DAIRY PRODUCTS IN SUGAR SUBSTITUTES MARKET, BY APPLICATION, 2018-2027 (USD MILLION)

TABLE 97 OMAN ORAL CARE IN SUGAR SUBSTITUTES MARKET, BY APPLICATION, 2018-2027 (USD MILLION)

TABLE 98 OMAN PHARMACEUTICALS IN SUGAR SUBSTITUTES MARKET, BY APPLICATION, 2018-2027 (USD MILLION)

TABLE 99 KUWAIT SUGAR SUBSTITUTES MARKET, BY TYPE, 2018-2027 (USD MILLION)

TABLE 100 KUWAIT HIGH-INTENSITY SWEETENERS IN SUGAR SUBSTITUTES MARKET, BY COMPOSITION, 2018-2027 (USD MILLION)

TABLE 101 KUWAIT LOW-INTENSITY SWEETENERS IN SUGAR SUBSTITUTES MARKET, BY COMPOSITION, 2018-2027 (USD MILLION)

TABLE 102 KUWAIT SUGAR SUBSTITUTES MARKET, BY FORM, 2018-2027 (USD MILLION)

TABLE 103 KUWAIT SUGAR SUBSTITUTES MARKET, BY CATEGORY, 2018-2027 (USD MILLION)

TABLE 104 KUWAIT SUGAR SUBSTITUTES MARKET, BY APPLICATION, 2018-2027 (USD MILLION)

TABLE 105 KUWAIT BEVERAGES IN SUGAR SUBSTITUTES MARKET, BY APPLICATION, 2018-2027 (USD MILLION)

TABLE 106 KUWAIT POWDERED BEVERAGES IN SUGAR SUBSTITUTES MARKET, BY APPLICATION, 2018-2027 (USD MILLION)

TABLE 107 KUWAIT FOOD PRODUCTS IN SUGAR SUBSTITUTES MARKET, BY APPLICATION, 2018-2027 (USD MILLION)

TABLE 108 KUWAIT BAKERY PRODUCTS IN SUGAR SUBSTITUTES MARKET, BY APPLICATION, 2018-2027 (USD MILLION)

TABLE 109 KUWAIT CONFECTIONERY IN SUGAR SUBSTITUTES MARKET, BY APPLICATION, 2018-2027 (USD MILLION)

TABLE 110 KUWAIT DAIRY PRODUCTS IN SUGAR SUBSTITUTES MARKET, BY APPLICATION, 2018-2027 (USD MILLION)

TABLE 111 KUWAIT ORAL CARE IN SUGAR SUBSTITUTES MARKET, BY APPLICATION, 2018-2027 (USD MILLION)

TABLE 112 KUWAIT PHARMACEUTICALS IN SUGAR SUBSTITUTES MARKET, BY APPLICATION, 2018-2027 (USD MILLION)

TABLE 113 REST OF MIDDLE EAST & AFRICA SUGAR SUBSTITUTES MARKET, BY TYPE, 2018-2027 (USD MILLION)

Please fill in the below form for Infographics

By clicking the "Submit" button, you are agreeing to the Data Bridge Market Research Privacy Policy and Terms and Conditions

Research Methodology:

Data collection and base year analysis are done using data collection modules with large sample sizes. The stage includes obtaining market information or related data through various sources and strategies. It includes examining and planning all the data acquired from the past in advance. It likewise envelops the examination of information inconsistencies seen across different information sources. The market data is analysed and estimated using market statistical and coherent models. Also, market share analysis and key trend analysis are the major success factors in the market report. To know more, please request an analyst call or drop down your inquiry.

The key research methodology used by DBMR research team is data triangulation which involves data mining, analysis of the impact of data variables on the market and primary (industry expert) validation. Data models include Vendor Positioning Grid, Market Time Line Analysis, Market Overview and Guide, Company Positioning Grid, Patent Analysis, Pricing Analysis, Company Market Share Analysis, Standards of Measurement, Global versus Regional and Vendor Share Analysis. To know more about the research methodology, drop in an inquiry to speak to our industry experts.

Please fill in the below form for Research Methodology

By clicking the "Submit" button, you are agreeing to the Data Bridge Market Research Privacy Policy and Terms and Conditions

Customization Available:

Data Bridge Market Research is a leader in advanced formative research. We take pride in servicing our existing and new customers with data and analysis that match and suits their goal. The report can be customized to include price trend analysis of target brands understanding the market for additional countries (ask for the list of countries), clinical trial results data, literature review, refurbished market and product base analysis. Market analysis of target competitors can be analyzed from technology-based analysis to market portfolio strategies. We can add as many competitors that you require data about in the format and data style you are looking for. Our team of analysts can also provide you data in crude raw excel files pivot tables (Fact book) or can assist you in creating presentations from the data sets available in the report.

Please fill in the below form for Available Customization

By clicking the "Submit" button, you are agreeing to the Data Bridge Market Research Privacy Policy and Terms and Conditions

FREQUENTLY ASK QUESTIONS

Middle East and Africa Sugar Substitute Market will be worth USD 2833.45 million by 2029.
Middle East and Africa Sugar Substitute Market growth rate is 7.2% during the forecast period.
Rising preferences for natural sugar & Growing demand in various end-user industries are the growth drivers of the Middle East and Africa Sugar Substitute Market.
Type, form, category and application are the factors on which the Middle East and Africa Sugar Substitute Market research is based.
Tate & Lyle will release the VANTAGE sweetener solution design tools in July 2020. It is a collection of new and innovative sweetener solution design tools and an education programme for creating sugar-reduced food and drinks with low-calorie sweeteners are the latest developments in the Middle East and Africa Sugar Substitute Market.
Free Sample Report

CHOOSE LICENCE TYPE

  • 4200.00
  • 3500.00
  • 2000.00
  • 5500.00
  • 7500.00

Why Choose Us

Industry Coverage

DBMR works across the globe in multiple industries which equip us with knowledge across verticals and provide our clients with insights not only from their industry but how other industries will impact their ecosystem.

Regional Coverage

Coverage of Data Bridge is not restricted to developed or emerging economies. We work across the globe covering the largest array of countries where no other market research or business consulting firm has ever conducted research; creating growth opportunities for our clients in areas which are still unknown.

Technology Coverage

In today’s world, technology drives the market sentiment, so our vision is to provide our clients insights not only for developed technologies but upcoming and disrupting technological changes throughout the product lifecycle by enabling them with unforeseen opportunities in the market which will create disruption in their industry. This leads to innovation and our clients to come out as winners.

Goal Oriented Solutions

DBMR goal is to help our clients achieve their goals through our solutions; hence we formatively create the most appropriate solutions for our client needs, saving time and efforts for them to drive their grand strategies.

Unparallel Analyst Support

Our analysts take pride in our clients’ success. Unlike others, we believe in working along our clients to achieve their goals with 24 hours analyst support determining the correct needs and inspire innovation through service.

Banner

Client Testimonials