Semiconductors and Electronics

Image

Asia-Pacific Microgrid Market – Industry Trends and Forecast to 2029

  • Semiconductors and Electronics
  • Upcoming Report
  • Apr 2022
  • Asia-Pacific
  • 350 Pages
  • No of Tables: 220
  • No of Figures: 60

Asia-Pacific Microgrid Market, By Connectivity (Grid Connected, Off-Grid Connected), Grid Type (AC Microgrid, DC Microgrid, Hybrid), Pattern (Urban/Metropolitan, Semi Urban, Rural/Island), Offering (Hardware, Software and Services), Source (Diesel Generators, Natural Gas, Solar PV, CHP and Others), Storage (Lithium-Ion, Lead Acid, Flow Batteries, Flywheel and Others), Application (Healthcare, Educational Institutes, Government, Military, Utility, Industrial/Commercial, Remote and Others) - Industry Trends and Forecast to 2029.

Asia-Pacific Microgrid Market

 Market Analysis and Size

In past years, microgrid are widely being preferred over traditional electrical grids as they are more efficient and combined with various renewable sources such as wind power, waste-to-energy, geothermal, solar, small hydro, and combined heat and power (CHP) systems.
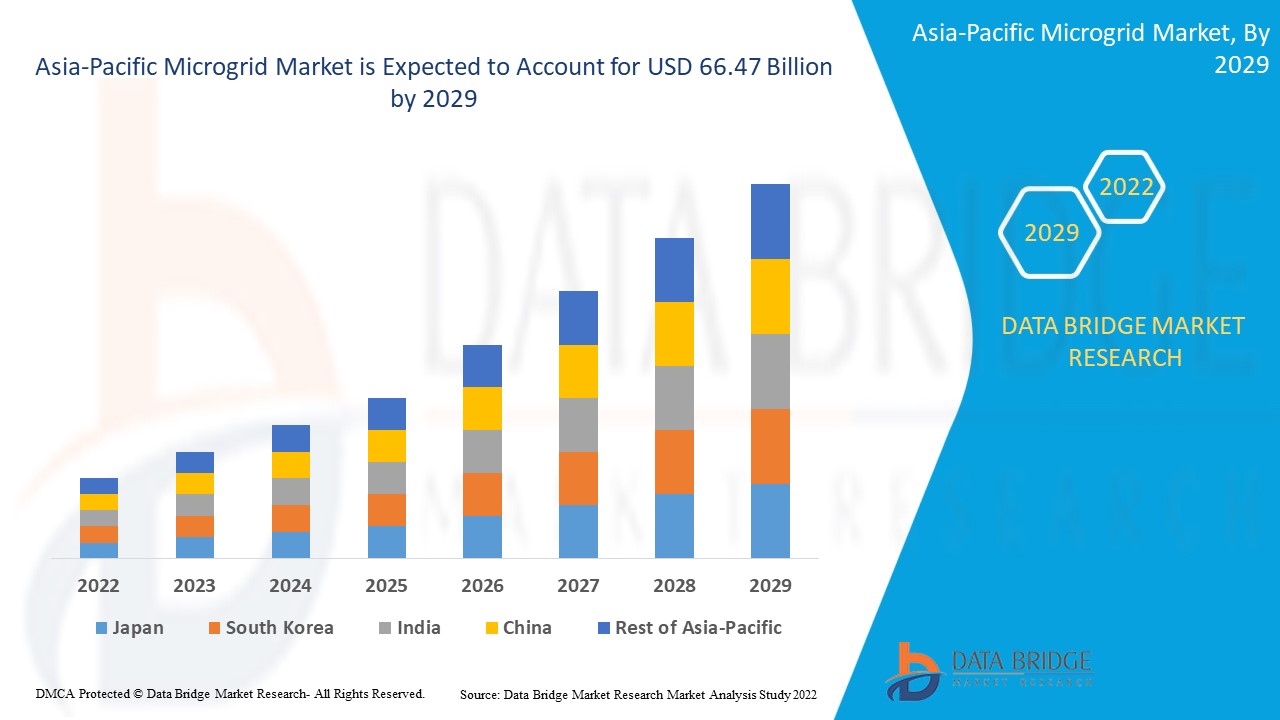
These grids are capable of being powered by distributed generators, batteries or solar panels. Microgrid are considered a reliable source of electricity as they operate continuously. Asia-Pacific Microgrid Market was valued at USD 1.05 billion in 2021 and is expected to reach USD 66.47 billion by 2029, registering a CAGR of 43.50% during the forecast period of 2022-2029. “Grid Connected” in the connectivity segment is expected to witness high growth during the forecast period due to the expansion of utility-based grid networks globally. The market report curated by the Data Bridge Market Research team includes in-depth expert analysis, import/export analysis, pricing analysis, production consumption analysis, and pestle analysis.

Market Definition

Microgridare a managed network of linked charges and a combination of technologies such as electricity generation, transmission and distribution. A microgrid is a localized group of electricity sources and sinks which can also operate through off-grid and remote areas in disconnected mode. A microgrid is an independent energy system can connect and disconnect from the grid to enable it to operate in both grid-connected or island-mode.

Report Scope and Market Segmentation

Report Metric

Details

Forecast Period

2022 to 2029

Base Year

2021

Historic Years

2020 (Customizable to 2019 - 2014)

Quantitative Units

Revenue in USD Billion, Volumes in Units, Pricing in USD

Segments Covered

Connectivity (Grid Connected, Off-Grid Connected), Grid Type (AC Microgrid, DC Microgrid, Hybrid), Pattern (Urban/Metropolitan, Semi Urban, Rural/Island), Offering (Hardware, Software and Services), Source (Diesel Generators, Natural Gas, Solar PV, CHP and Others), Storage (Lithium-Ion, Lead Acid, Flow Batteries, Flywheel and Others), Application (Healthcare, Educational Institutes, Government, Military, Utility, Industrial/Commercial, Remote and Others)

Countries Covered

China, Japan, India, South Korea, Singapore, Malaysia, Australia, Thailand, Indonesia, Philippines, Rest of Asia-Pacific (APAC) in the Asia-Pacific (APAC)

Market Players Covered

Eaton Corporation (US), Siemens Ag (Germany), Schneider Electric SE (France), ABB (Switzerland), Caterpillar Inc (US), Homer Energy LLC (US), EnSync Energy Systems (US), Lockheed Martin Corporation (US), Hitachi, Ltd. (Japan), Honeywell International (US), Exelon Corporation (US), TOSHIBA CORPORATION (Japan), Advanced Microgrid Solutions (US), Viridity Energy, Inc (US) and Tesla (US), among others

Market Opportunities

  • Increase in number of microgrid projects for different verticals
  • Rise in penetration of distributed energy resources (der’s)
  • Rise in the demand for uninterrupted and resilient power supply

Asia-Pacific Microgrid Market Dynamics

This section deals with understanding the market drivers, advantages, opportunities, restraints and challenges. All of this is discussed in detail as below:

Drivers

  • Penetration of Distributed Energy Resources

The rise in penetration of distributed energy resources (DER’s) due to the rapid commercial and industrial development is one of the major factors driving the growth of microgrid market. The increase in the focus on decarbonization by various end users and governments have a positive impact on the market.

  • Demand for Uninterrupted Power Supply

The rise in the demand for uninterrupted and resilient power supply accelerate the market growth. Also, increase in electrification rate largely across the developing economies assist in the expansion of the market.

  • Demand from Various Industries

The surge in adoption of software across various end-user segments, such as industrial, healthcare, commercial and government for managing and controlling distributed energy resources. The rise in instances of cyberattacks on energy infrastructures is further escalating the market growth.

Additionally, rapid urbanization, change in lifestyle, surge in investments and increased consumer spending positively impact the microgrid market.

Opportunities

Furthermore, increase in number of microgrid projects for different verticals extend profitable opportunities to the market players in the forecast period of 2022 to 2029. Also, government support to encourage development of microgridwill further expand the market.

Restraints/Challenges

On the other hand, huge installation and maintenance costs of microgridis expected to obstruct market growth. Also, lack of standard and regulatory frameworks related to microgrid operations and technical challenges of island mode microgridare projected to challenge the microgridmarket in the forecast period of 2022-2029.

This microgrid market report provides details of new recent developments, trade regulations, import-export analysis, production analysis, value chain optimization, market share, impact of domestic and localized market players, analyses opportunities in terms of emerging revenue pockets, changes in market regulations, strategic market growth analysis, market size, category market growths, application niches and dominance, product approvals, product launches, geographic expansions, technological innovations in the market. To gain more info on microgrid market contact Data Bridge Market Research for an Analyst Brief, our team will help you take an informed market decision to achieve market growth.

COVID-19 Impact on Asia-Pacific Microgrid Market

The COVID-19 had a negative impact on the microgrid market owing to the strict lockdowns and social distancing to contain the spread of the virus. The economic uncertainty, partial shutdown of the business and low consumer confidence impacted demand microgrid market. The supply chain got hampered during the pandemic along with delay logistics activities. However, the microgrid market is expected to regain its pace during the post pandemic scenario due to the easing on the restrictions.

Recent Developments

  • In June 2020, Singapore-based energy company Canopy Power partnered with EDF on the development of renewable energy microgrid in Asia.

Global Asia-Pacific Microgrid Market Scope and Market Size

The microgrid market is segmented on the basis of connectivity, grid type, pattern, source, storage, offering and application. The growth amongst these segments will help you analyze meager growth segments in the industries and provide the users with a valuable market overview and market insights to help them make strategic decisions for identifying core market applications.

On the basis of connectivity, the microgrid market has been segmented as grid connected and off-grid connected.  

Based on grid type, microgrid market has been segmented into AC microgrid, DC microgrid and hybrid.

On the basis of source, the microgrid market has been segmented into diesel generators, natural gas, solar PV, CHP and others.

On the basis of storage, the microgrid market has been segmented into lithium-ion, lead acid, flow batteries, flywheel and others.

The microgrid market has also been segmented on the basis of end user into healthcare, educational institutes, military, utility, industrial/commercial, government, remote and others.

On the basis of pattern, the microgrid market has been segmented into urban/metropolitan, semi urban and rural/island.

On the basis of offering, the microgrid market has been segmented into hardware and software and services. Hardware is further segmented into power generators, energy storage systems and controllers.

Asia-Pacific Microgrid Market Regional Analysis/Insights

The microgrid market is analysed and market size insights and trends are provided by country, connectivity, grid type, pattern, source, storage, offering and application as referenced above.

The countries covered in the microgrid market report are China, Japan, India, South Korea, Singapore, Malaysia, Australia, Thailand, Indonesia, Philippines, and Rest of Asia-Pacific (APAC) in the Asia-Pacific (APAC).

Japan, China and India will dominate the growth in the Asia-Pacific microgrid market owing to the industrial development and supporting government initiatives as China’s thirty five-year plan for electricity development, national solar mission of India and many more.

The country section of the report also provides individual market impacting factors and changes in regulation in the market domestically that impacts the current and future trends of the market. Data points like down-stream and upstream value chain analysis, technical trends and porter's five forces analysis, case studies are some of the pointers used to forecast the market scenario for individual countries. Also, the presence and availability of global brands and their challenges faced due to large or scarce competition from local and domestic brands, impact of domestic tariffs and trade routes are considered while providing forecast analysis of the country data.   

Competitive Landscape and Asia-Pacific Microgrid Market

The microgrid market competitive landscape provides details by competitor. Details included are company overview, company financials, revenue generated, market potential, investment in research and development, new market initiatives, global presence, production sites and facilities, production capacities, company strengths and weaknesses, product launch, product width and breadth, application dominance. The above data points provided are only related to the companies' focus related to microgrid market.

Some of the major players operating in the microgrid market are

  • Eaton Corporation (US)
  • Siemens Ag (Germany)
  • Schneider Electric SE (France)
  • ABB (Switzerland)
  • Caterpillar Inc (US)
  • Homer Energy LLC (US)
  • EnSync Energy Systems (US)
  • Lockheed Martin Corporation (US)
  • Hitachi, Ltd. (Japan)
  • Honeywell International (US)
  • Exelon Corporation (US)
  • TOSHIBA CORPORATION (Japan)
  • Advanced Microgrid Solutions (US)
  • Viridity Energy, Inc (US)
  • Tesla (US)


SKU-

LIST OF TABLES ASIA-PACIFIC MICROGRID MARKET

TABLE 1 ASIA-PACIFIC MICROGRID MARKET, BY GRID TYPE, 2016– 2025, (USD MILLION)

TABLE 2 ASIA-PACIFIC AC MICROGRID MARKET, BY REGION, 2016-2025 (USD MILLION)

TABLE 3 ASIA-PACIFIC DC MICROGRID MARKET, BY REGION, 2016-2025 (USD MILLION)

TABLE 4 ASIA-PACIFIC HYBRID MARKET, BY REGION, 2016-2025 (USD MILLION)

TABLE 5 ASIA-PACIFIC MICROGRID MARKET, BY CONNECTIVITY, 2016– 2025, (USD MILLION)

TABLE 6 ASIA-PACIFIC GRID CONNECTED MARKET, BY REGION, 2016-2025 (USD MILLION)

TABLE 7 ASIA-PACIFIC REMOTE/ISLAND MARKET, BY REGION, 2016-2025 (USD MILLION)

TABLE 8 ASIA-PACIFIC MICROGRID MARKET, BY OFFERING, 2016– 2025, (USD MILLION)

TABLE 9 ASIA-PACIFIC HARDWARE MARKET, BY REGION, 2016-2025 (USD MILLION)

TABLE 10 ASIA-PACIFIC SOFTWARE MARKET, BY REGION, 2016-2025 (USD MILLION)

TABLE 11 ASIA-PACIFIC SERVICES MARKET, BY REGION, 2016-2025 (USD MILLION)

TABLE 12 ASIA-PACIFIC MICROGRID MARKET, BY VERTICAL, 2016– 2025, (USD MILLION)

TABLE 13 ASIA-PACIFIC HEALTHCARE MARKET, BY REGION, 2016-2025 (USD MILLION)

TABLE 14 ASIA-PACIFIC EDUCATIONAL INSTITUTIONS MARKET, BY REGION, 2016-2025 (USD MILLION)

TABLE 15 ASIA-PACIFIC INDUSTRIAL MARKET, BY REGION, 2016-2025 (USD MILLION)

TABLE 16 ASIA-PACIFIC MILITARY MARKET, BY REGION, 2016-2025 (USD MILLION)

TABLE 17 ASIA-PACIFIC ELECTRIC UTILITY MARKET, BY REGION, 2016-2025 (USD MILLION)

TABLE 18 ASIA-PACIFIC MICROGRID MARKET, BY POWER SOURCE, 2016– 2025, (USD MILLION)

TABLE 19 ASIA-PACIFIC NATURAL GAS MARKET, BY REGION, 2016-2025 (USD MILLION)

TABLE 20 ASIA-PACIFIC COMBINED HEAT AND POWER MARKET, BY REGION, 2016-2025 (USD MILLION)

TABLE 21 ASIA-PACIFIC DIESEL MARKET, BY REGION, 2016-2025 (USD MILLION)

TABLE 22 ASIA-PACIFIC SOLAR MARKET, BY REGION, 2016-2025 (USD MILLION)

TABLE 23 ASIA-PACIFIC FUEL CELLS MARKET, BY REGION, 2016-2025 (USD MILLION)

TABLE 24 ASIA-PACIFIC MICROGRID MARKET, BY COUNTRY, 2016-2025 (USD MILLION)

TABLE 25 ASIA-PACIFIC MICROGRID MARKET, BY INSTALLATION CAPACITY, 2016-2025 (MW)

TABLE 26 ASIA-PACIFIC MICROGRID MARKET, BY GRID TYPE, 2016-2025 (USD MILLION)

TABLE 27 ASIA-PACIFIC MICROGRID MARKET, BY CONNECTIVITY, 2016-2025 (USD MILLION)

TABLE 28 ASIA-PACIFIC MICROGRID MARKET, BY OFFERING, 2016-2025 (USD MILLION)

TABLE 29 ASIA-PACIFIC HARDWARE IN MICROGRID MARKET, BY TYPE, 2016-2025 (USD MILLION)

TABLE 30 ASIA-PACIFIC ENERGY STORAGE AND POWER GENERATORS IN MICROGRID MARKET, BY TYPE, 2016-2025 (USD MILLION)

TABLE 31 ASIA-PACIFIC POWER GENERATORS IN ENERGY STORAGE AND POWER GENERATORS MARKET, BY TYPE, 2016-2025 (USD MILLION)

TABLE 32 ASIA-PACIFIC RENEWABLES IN POWER GENERATORS MARKET, BY TYPE, 2016-2025 (USD MILLION)

TABLE 33 ASIA-PACIFIC ENERGY STORAGE SYSTEMS IN ENERGY STORAGE AND POWER GENERATORS MARKET, BY TYPE, 2016-2025 (USD MILLION)

TABLE 34 ASIA-PACIFIC SERVICES IN MICROGRID MARKET, BY TYPE, 2016-2025 (USD MILLION)

TABLE 35 ASIA-PACIFIC MICROGRID MARKET, BY VERTICAL, 2016-2025 (USD MILLION)

TABLE 36 ASIA-PACIFIC INDUSTRIAL IN MICROGRID MARKET, BY TYPE, 2016-2025 (USD MILLION)

TABLE 37 ASIA-PACIFIC ENERGY UTILITY IN VERTICAL IN MICROGRID MARKET, BY TYPE, 2016-2025 (USD MILLION)

TABLE 38 ASIA-PACIFIC MICROGRID MARKET, BY POWER SOURCE, 2016-2025 (USD MILLION)

TABLE 39 JAPAN MICROGRID MARKET, BY GRID TYPE, 2016-2025 (USD MILLION)

TABLE 40 JAPAN MICROGRID MARKET, BY CONNECTIVITY, 2016-2025 (USD MILLION)

TABLE 41 JAPAN MICROGRID MARKET, BY OFFERING, 2016-2025 (USD MILLION)

TABLE 42 JAPAN HARDWARE IN MICROGRID MARKET, BY TYPE, 2016-2025 (USD MILLION)

TABLE 43 JAPAN ENERGY STORAGE AND POWER GENERATORS IN MICROGRID MARKET, BY TYPE, 2016-2025 (USD MILLION)

TABLE 44 JAPAN POWER GENERATORS IN ENERGY STORAGE AND POWER GENERATORS MARKET, BY TYPE, 2016-2025 (USD MILLION)

TABLE 45 JAPAN RENEWABLES IN POWER GENERATORS MARKET, BY TYPE, 2016-2025 (USD MILLION)

TABLE 46 JAPAN ENERGY STORAGE SYSTEMS IN ENERGY STORAGE AND POWER GENERATORS MARKET, BY TYPE, 2016-2025 (USD MILLION)

TABLE 47 JAPAN SERVICES IN MICROGRID MARKET, BY TYPE, 2016-2025 (USD MILLION)

TABLE 48 JAPAN MICROGRID MARKET, BY VERTICAL, 2016-2025 (USD MILLION)

TABLE 49 JAPAN INDUSTRIAL IN MICROGRID MARKET, BY TYPE, 2016-2025 (USD MILLION)

TABLE 50 JAPAN ENERGY UTILITY IN VERTICAL IN MICROGRID MARKET, BY TYPE, 2016-2025 (USD MILLION)

TABLE 51 JAPAN MICROGRID MARKET, BY POWER SOURCE, 2016-2025 (USD MILLION)

TABLE 52 CHINA MICROGRID MARKET, BY GRID TYPE, 2016-2025 (USD MILLION)

TABLE 53 CHINA MICROGRID MARKET, BY CONNECTIVITY, 2016-2025 (USD MILLION)

TABLE 54 CHINA MICROGRID MARKET, BY OFFERING, 2016-2025 (USD MILLION)

TABLE 55 CHINA HARDWARE IN MICROGRID MARKET, BY TYPE, 2016-2025 (USD MILLION)

TABLE 56 CHINA ENERGY STORAGE AND POWER GENERATORS IN MICROGRID MARKET, BY TYPE, 2016-2025 (USD MILLION)

TABLE 57 CHINA POWER GENERATORS IN ENERGY STORAGE AND POWER GENERATORS MARKET, BY TYPE, 2016-2025 (USD MILLION)

TABLE 58 CHINA RENEWABLES IN POWER GENERATORS MARKET, BY TYPE, 2016-2025 (USD MILLION)

TABLE 59 CHINA ENERGY STORAGE SYSTEMS IN ENERGY STORAGE AND POWER GENERATORS MARKET, BY TYPE, 2016-2025 (USD MILLION)

TABLE 60 CHINA SERVICES IN MICROGRID MARKET, BY TYPE, 2016-2025 (USD MILLION)

TABLE 61 CHINA MICROGRID MARKET, BY VERTICAL, 2016-2025 (USD MILLION)

TABLE 62 CHINA INDUSTRIAL IN MICROGRID MARKET, BY TYPE, 2016-2025 (USD MILLION)

TABLE 63 CHINA ENERGY UTILITY IN VERTICAL IN MICROGRID MARKET, BY TYPE, 2016-2025 (USD MILLION)

TABLE 64 CHINA MICROGRID MARKET, BY POWER SOURCE, 2016-2025 (USD MILLION)

TABLE 65 INDIA MICROGRID MARKET, BY GRID TYPE, 2016-2025 (USD MILLION)

TABLE 66 INDIA MICROGRID MARKET, BY CONNECTIVITY, 2016-2025 (USD MILLION)

TABLE 67 INDIA MICROGRID MARKET, BY OFFERING, 2016-2025 (USD MILLION)

TABLE 68 INDIA HARDWARE IN MICROGRID MARKET, BY TYPE, 2016-2025 (USD MILLION)

TABLE 69 INDIA ENERGY STORAGE AND POWER GENERATORS IN MICROGRID MARKET, BY TYPE, 2016-2025 (USD MILLION)

TABLE 70 INDIA POWER GENERATORS IN ENERGY STORAGE AND POWER GENERATORS MARKET, BY TYPE, 2016-2025 (USD MILLION)

TABLE 71 INDIA RENEWABLES IN POWER GENERATORS MARKET, BY TYPE, 2016-2025 (USD MILLION)

TABLE 72 INDIA ENERGY STORAGE SYSTEMS IN ENERGY STORAGE AND POWER GENERATORS MARKET, BY TYPE, 2016-2025 (USD MILLION)

TABLE 73 INDIA SERVICES IN MICROGRID MARKET, BY TYPE, 2016-2025 (USD MILLION)

TABLE 74 INDIA MICROGRID MARKET, BY VERTICAL, 2016-2025 (USD MILLION)

TABLE 75 INDIA INDUSTRIAL IN MICROGRID MARKET, BY TYPE, 2016-2025 (USD MILLION)

TABLE 76 INDIA ENERGY UTILITY IN VERTICAL IN MICROGRID MARKET, BY TYPE, 2016-2025 (USD MILLION)

TABLE 77 INDIA MICROGRID MARKET, BY POWER SOURCE, 2016-2025 (USD MILLION)

TABLE 78 SOUTH KOREA MICROGRID MARKET, BY GRID TYPE, 2016-2025 (USD MILLION)

TABLE 79 SOUTH KOREA MICROGRID MARKET, BY CONNECTIVITY, 2016-2025 (USD MILLION)

TABLE 80 SOUTH KOREA MICROGRID MARKET, BY OFFERING, 2016-2025 (USD MILLION)

TABLE 81 SOUTH KOREA HARDWARE IN MICROGRID MARKET, BY TYPE, 2016-2025 (USD MILLION)

TABLE 82 SOUTH KOREA ENERGY STORAGE AND POWER GENERATORS IN MICROGRID MARKET, BY TYPE, 2016-2025 (USD MILLION)

TABLE 83 SOUTH KOREA POWER GENERATORS IN ENERGY STORAGE AND POWER GENERATORS MARKET, BY TYPE, 2016-2025 (USD MILLION)

TABLE 84 SOUTH KOREA RENEWABLES IN POWER GENERATORS MARKET, BY TYPE, 2016-2025 (USD MILLION)

TABLE 85 SOUTH KOREA ENERGY STORAGE SYSTEMS IN ENERGY STORAGE AND POWER GENERATORS MARKET, BY TYPE, 2016-2025 (USD MILLION)

TABLE 86 SOUTH KOREA SERVICES IN MICROGRID MARKET, BY TYPE, 2016-2025 (USD MILLION)

TABLE 87 SOUTH KOREA MICROGRID MARKET, BY VERTICAL, 2016-2025 (USD MILLION)

TABLE 88 SOUTH KOREA INDUSTRIAL IN MICROGRID MARKET, BY TYPE, 2016-2025 (USD MILLION)

TABLE 89 SOUTH KOREA ENERGY UTILITY IN VERTICAL IN MICROGRID MARKET, BY TYPE, 2016-2025 (USD MILLION)

TABLE 90 SOUTH KOREA MICROGRID MARKET, BY POWER SOURCE, 2016-2025 (USD MILLION)

TABLE 91 AUSTRALIA MICROGRID MARKET, BY GRID TYPE, 2016-2025 (USD MILLION)

TABLE 92 AUSTRALIA MICROGRID MARKET, BY CONNECTIVITY, 2016-2025 (USD MILLION)

TABLE 93 AUSTRALIA MICROGRID MARKET, BY OFFERING, 2016-2025 (USD MILLION)

TABLE 94 AUSTRALIA HARDWARE IN MICROGRID MARKET, BY TYPE, 2016-2025 (USD MILLION)

TABLE 95 AUSTRALIA ENERGY STORAGE AND POWER GENERATORS IN MICROGRID MARKET, BY TYPE, 2016-2025 (USD MILLION)

TABLE 96 AUSTRALIA POWER GENERATORS IN ENERGY STORAGE AND POWER GENERATORS MARKET, BY TYPE, 2016-2025 (USD MILLION)

TABLE 97 AUSTRALIA RENEWABLES IN POWER GENERATORS MARKET, BY TYPE, 2016-2025 (USD MILLION)

TABLE 98 AUSTRALIA ENERGY STORAGE SYSTEMS IN ENERGY STORAGE AND POWER GENERATORS MARKET, BY TYPE, 2016-2025 (USD MILLION)

TABLE 99 AUSTRALIA SERVICES IN MICROGRID MARKET, BY TYPE, 2016-2025 (USD MILLION)

TABLE 100 AUSTRALIA MICROGRID MARKET, BY VERTICAL, 2016-2025 (USD MILLION)

TABLE 101 AUSTRALIA INDUSTRIAL IN MICROGRID MARKET, BY TYPE, 2016-2025 (USD MILLION)

TABLE 102 AUSTRALIA ENERGY UTILITY IN VERTICAL IN MICROGRID MARKET, BY TYPE, 2016-2025 (USD MILLION)

TABLE 103 AUSTRALIA MICROGRID MARKET, BY POWER SOURCE, 2016-2025 (USD MILLION)

TABLE 104 SINGAPORE MICROGRID MARKET, BY GRID TYPE, 2016-2025 (USD MILLION)

TABLE 105 SINGAPORE MICROGRID MARKET, BY CONNECTIVITY, 2016-2025 (USD MILLION)

TABLE 106 SINGAPORE MICROGRID MARKET, BY OFFERING, 2016-2025 (USD MILLION)

TABLE 107 SINGAPORE HARDWARE IN MICROGRID MARKET, BY TYPE, 2016-2025 (USD MILLION)

TABLE 108 SINGAPORE ENERGY STORAGE AND POWER GENERATORS IN MICROGRID MARKET, BY TYPE, 2016-2025 (USD MILLION)

TABLE 109 SINGAPORE POWER GENERATORS IN ENERGY STORAGE AND POWER GENERATORS MARKET, BY TYPE, 2016-2025 (USD MILLION)

TABLE 110 SINGAPORE RENEWABLES IN POWER GENERATORS MARKET, BY TYPE, 2016-2025 (USD MILLION)

TABLE 111 SINGAPORE ENERGY STORAGE SYSTEMS IN ENERGY STORAGE AND POWER GENERATORS MARKET, BY TYPE, 2016-2025 (USD MILLION)

TABLE 112 SINGAPORE SERVICES IN MICROGRID MARKET, BY TYPE, 2016-2025 (USD MILLION)

TABLE 113 SINGAPORE MICROGRID MARKET, BY VERTICAL, 2016-2025 (USD MILLION)

TABLE 114 SINGAPORE INDUSTRIAL IN MICROGRID MARKET, BY TYPE, 2016-2025 (USD MILLION)

TABLE 115 SINGAPORE ENERGY UTILITY IN VERTICAL IN MICROGRID MARKET, BY TYPE, 2016-2025 (USD MILLION)

TABLE 116 SINGAPORE MICROGRID MARKET, BY POWER SOURCE, 2016-2025 (USD MILLION)

TABLE 117 MALAYSIA MICROGRID MARKET, BY GRID TYPE, 2016-2025 (USD MILLION)

TABLE 118 MALAYSIA MICROGRID MARKET, BY CONNECTIVITY, 2016-2025 (USD MILLION)

TABLE 119 MALAYSIA MICROGRID MARKET, BY OFFERING, 2016-2025 (USD MILLION)

TABLE 120 MALAYSIA HARDWARE IN MICROGRID MARKET, BY TYPE, 2016-2025 (USD MILLION)

TABLE 121 MALAYSIA ENERGY STORAGE AND POWER GENERATORS IN MICROGRID MARKET, BY TYPE, 2016-2025 (USD MILLION)

TABLE 122 MALAYSIA POWER GENERATORS IN ENERGY STORAGE AND POWER GENERATORS MARKET, BY TYPE, 2016-2025 (USD MILLION)

TABLE 123 MALAYSIA RENEWABLES IN POWER GENERATORS MARKET, BY TYPE, 2016-2025 (USD MILLION)

TABLE 124 MALAYSIA ENERGY STORAGE SYSTEMS IN ENERGY STORAGE AND POWER GENERATORS MARKET, BY TYPE, 2016-2025 (USD MILLION)

TABLE 125 MALAYSIA SERVICES IN MICROGRID MARKET, BY TYPE, 2016-2025 (USD MILLION)

TABLE 126 MALAYSIA MICROGRID MARKET, BY VERTICAL, 2016-2025 (USD MILLION)

TABLE 127 MALAYSIA INDUSTRIAL IN MICROGRID MARKET, BY TYPE, 2016-2025 (USD MILLION)

TABLE 128 MALAYSIA ENERGY UTILITY IN VERTICAL IN MICROGRID MARKET, BY TYPE, 2016-2025 (USD MILLION)

TABLE 129 MALAYSIA MICROGRID MARKET, BY POWER SOURCE, 2016-2025 (USD MILLION)

TABLE 130 THAILAND MICROGRID MARKET, BY GRID TYPE, 2016-2025 (USD MILLION)

TABLE 131 THAILAND MICROGRID MARKET, BY CONNECTIVITY, 2016-2025 (USD MILLION)

TABLE 132 THAILAND MICROGRID MARKET, BY OFFERING, 2016-2025 (USD MILLION)

TABLE 133 THAILAND HARDWARE IN MICROGRID MARKET, BY TYPE, 2016-2025 (USD MILLION)

TABLE 134 THAILAND ENERGY STORAGE AND POWER GENERATORS IN MICROGRID MARKET, BY TYPE, 2016-2025 (USD MILLION)

TABLE 135 THAILAND POWER GENERATORS IN ENERGY STORAGE AND POWER GENERATORS MARKET, BY TYPE, 2016-2025 (USD MILLION)

TABLE 136 THAILAND RENEWABLES IN POWER GENERATORS MARKET, BY TYPE, 2016-2025 (USD MILLION)

TABLE 137 THAILAND ENERGY STORAGE SYSTEMS IN ENERGY STORAGE AND POWER GENERATORS MARKET, BY TYPE, 2016-2025 (USD MILLION)

TABLE 138 THAILAND SERVICES IN MICROGRID MARKET, BY TYPE, 2016-2025 (USD MILLION)

TABLE 139 THAILAND MICROGRID MARKET, BY VERTICAL, 2016-2025 (USD MILLION)

TABLE 140 THAILAND INDUSTRIAL IN MICROGRID MARKET, BY TYPE, 2016-2025 (USD MILLION)

TABLE 141 THAILAND ENERGY UTILITY IN VERTICAL IN MICROGRID MARKET, BY TYPE, 2016-2025 (USD MILLION)

TABLE 142 THAILAND MICROGRID MARKET, BY POWER SOURCE, 2016-2025 (USD MILLION)

TABLE 143 INDONESIA MICROGRID MARKET, BY GRID TYPE, 2016-2025 (USD MILLION)

TABLE 144 INDONESIA MICROGRID MARKET, BY CONNECTIVITY, 2016-2025 (USD MILLION)

TABLE 145 INDONESIA MICROGRID MARKET, BY OFFERING, 2016-2025 (USD MILLION)

TABLE 146 INDONESIA HARDWARE IN MICROGRID MARKET, BY TYPE, 2016-2025 (USD MILLION)

TABLE 147 INDONESIA ENERGY STORAGE AND POWER GENERATORS IN MICROGRID MARKET, BY TYPE, 2016-2025 (USD MILLION)

TABLE 148 INDONESIA POWER GENERATORS IN ENERGY STORAGE AND POWER GENERATORS MARKET, BY TYPE, 2016-2025 (USD MILLION)

TABLE 149 INDONESIA RENEWABLES IN POWER GENERATORS MARKET, BY TYPE, 2016-2025 (USD MILLION)

TABLE 150 INDONESIA ENERGY STORAGE SYSTEMS IN ENERGY STORAGE AND POWER GENERATORS MARKET, BY TYPE, 2016-2025 (USD MILLION)

TABLE 151 INDONESIA SERVICES IN MICROGRID MARKET, BY TYPE, 2016-2025 (USD MILLION)

TABLE 152 INDONESIA MICROGRID MARKET, BY VERTICAL, 2016-2025 (USD MILLION)

TABLE 153 INDONESIA INDUSTRIAL IN MICROGRID MARKET, BY TYPE, 2016-2025 (USD MILLION)

TABLE 154 INDONESIA ENERGY UTILITY IN VERTICAL IN MICROGRID MARKET, BY TYPE, 2016-2025 (USD MILLION)

TABLE 155 INDONESIA MICROGRID MARKET, BY POWER SOURCE, 2016-2025 (USD MILLION)

TABLE 156 PHILIPPINES MICROGRID MARKET, BY GRID TYPE, 2016-2025 (USD MILLION)

TABLE 157 PHILIPPINES MICROGRID MARKET, BY CONNECTIVITY, 2016-2025 (USD MILLION)

TABLE 158 PHILIPPINES MICROGRID MARKET, BY OFFERING, 2016-2025 (USD MILLION)

TABLE 159 PHILIPPINES HARDWARE IN MICROGRID MARKET, BY TYPE, 2016-2025 (USD MILLION)

TABLE 160 PHILIPPINES ENERGY STORAGE AND POWER GENERATORS IN MICROGRID MARKET, BY TYPE, 2016-2025 (USD MILLION)

TABLE 161 PHILIPPINES POWER GENERATORS IN ENERGY STORAGE AND POWER GENERATORS MARKET, BY TYPE, 2016-2025 (USD MILLION)

TABLE 162 PHILIPPINES RENEWABLES IN POWER GENERATORS MARKET, BY TYPE, 2016-2025 (USD MILLION)

TABLE 163 PHILIPPINES ENERGY STORAGE SYSTEMS IN ENERGY STORAGE AND POWER GENERATORS MARKET, BY TYPE, 2016-2025 (USD MILLION)

TABLE 164 PHILIPPINES SERVICES IN MICROGRID MARKET, BY TYPE, 2016-2025 (USD MILLION)

TABLE 165 PHILIPPINES MICROGRID MARKET, BY VERTICAL, 2016-2025 (USD MILLION)

TABLE 166 PHILIPPINES INDUSTRIAL IN MICROGRID MARKET, BY TYPE, 2016-2025 (USD MILLION)

TABLE 167 PHILIPPINES ENERGY UTILITY IN VERTICAL IN MICROGRID MARKET, BY TYPE, 2016-2025 (USD MILLION)

TABLE 168 PHILIPPINES MICROGRID MARKET, BY POWER SOURCE, 2016-2025 (USD MILLION)

TABLE 169 REST OF ASIA-PACIFIC MICROGRID MARKET, BY GRID TYPE, 2016-2025 (USD MILLION)

Please fill in the below form for Infographics

By clicking the "Submit" button, you are agreeing to the Data Bridge Market Research Privacy Policy and Terms and Conditions

Research Methodology:

Data collection and base year analysis are done using data collection modules with large sample sizes. The stage includes obtaining market information or related data through various sources and strategies. It includes examining and planning all the data acquired from the past in advance. It likewise envelops the examination of information inconsistencies seen across different information sources. The market data is analysed and estimated using market statistical and coherent models. Also, market share analysis and key trend analysis are the major success factors in the market report. To know more, please request an analyst call or drop down your inquiry.

The key research methodology used by DBMR research team is data triangulation which involves data mining, analysis of the impact of data variables on the market and primary (industry expert) validation. Data models include Vendor Positioning Grid, Market Time Line Analysis, Market Overview and Guide, Company Positioning Grid, Patent Analysis, Pricing Analysis, Company Market Share Analysis, Standards of Measurement, Global versus Regional and Vendor Share Analysis. To know more about the research methodology, drop in an inquiry to speak to our industry experts.

Please fill in the below form for Research Methodology

By clicking the "Submit" button, you are agreeing to the Data Bridge Market Research Privacy Policy and Terms and Conditions

Customization Available:

Data Bridge Market Research is a leader in advanced formative research. We take pride in servicing our existing and new customers with data and analysis that match and suits their goal. The report can be customized to include price trend analysis of target brands understanding the market for additional countries (ask for the list of countries), clinical trial results data, literature review, refurbished market and product base analysis. Market analysis of target competitors can be analyzed from technology-based analysis to market portfolio strategies. We can add as many competitors that you require data about in the format and data style you are looking for. Our team of analysts can also provide you data in crude raw excel files pivot tables (Fact book) or can assist you in creating presentations from the data sets available in the report.

Please fill in the below form for Available Customization

By clicking the "Submit" button, you are agreeing to the Data Bridge Market Research Privacy Policy and Terms and Conditions

FREQUENTLY ASK QUESTIONS

The Asia-Pacific Microgrid Market will be projected to grow at a CAGR of 43.50% during forecast by 2029.
The Asia-Pacific Microgrid Market will be projected at USD 66.47 billion during forecast by 2029.
On the basis of application, the Asia-Pacific Microgrid Market is segmented into Healthcare, Educational Institutes, Government, Military, Utility, Industrial/Commercial, Remote and Others.
The major players operating in the Asia-Pacific Microgrid Market are Eaton Corporation (US), Siemens Ag (Germany), Schneider Electric SE (France), ABB (Switzerland), Caterpillar Inc (US), Homer Energy LLC (US), EnSync Energy Systems (US), Lockheed Martin Corporation (US), Hitachi, Ltd. (Japan), Honeywell International (US), Exelon Corporation (US), TOSHIBA CORPORATION (Japan), Advanced Microgrid Solutions (US), Viridity Energy, Inc (US) and Tesla (US), among others.
Free Sample Report

CHOOSE LICENCE TYPE

  • 4200.00
  • 3500.00
  • 2000.00
  • 5500.00
  • 7500.00

Why Choose Us

Industry Coverage

DBMR works across the globe in multiple industries which equip us with knowledge across verticals and provide our clients with insights not only from their industry but how other industries will impact their ecosystem.

Regional Coverage

Coverage of Data Bridge is not restricted to developed or emerging economies. We work across the globe covering the largest array of countries where no other market research or business consulting firm has ever conducted research; creating growth opportunities for our clients in areas which are still unknown.

Technology Coverage

In today’s world, technology drives the market sentiment, so our vision is to provide our clients insights not only for developed technologies but upcoming and disrupting technological changes throughout the product lifecycle by enabling them with unforeseen opportunities in the market which will create disruption in their industry. This leads to innovation and our clients to come out as winners.

Goal Oriented Solutions

DBMR goal is to help our clients achieve their goals through our solutions; hence we formatively create the most appropriate solutions for our client needs, saving time and efforts for them to drive their grand strategies.

Unparallel Analyst Support

Our analysts take pride in our clients’ success. Unlike others, we believe in working along our clients to achieve their goals with 24 hours analyst support determining the correct needs and inspire innovation through service.

Banner

Client Testimonials