Asia-Pacific Amino Acid in Dietary Supplements Market Analysis and Size
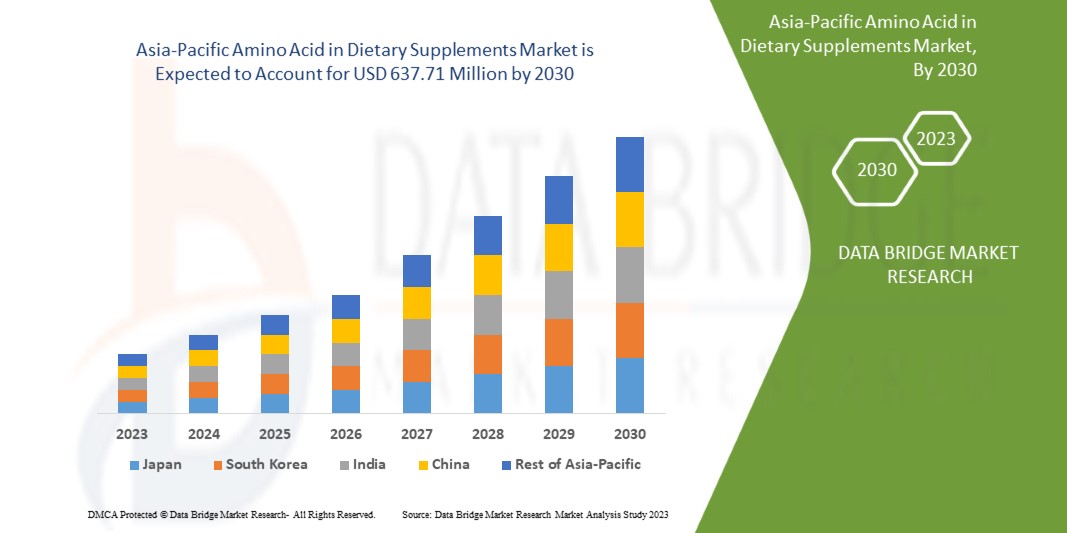
Asia-Pacific amino acid in dietary supplements market is expected to grow significantly from 2023 to 2030. Data Bridge Market Research analyses that the market is growing with a CAGR of 6.8% from 2023 to 2030 and is expected to reach USD 637.71 Million by 2030. The rise in the number of consumers opting for a healthy diet around the Asia-Pacific is a key factor fueling the expansion of the amino acid in the dietary supplements market.
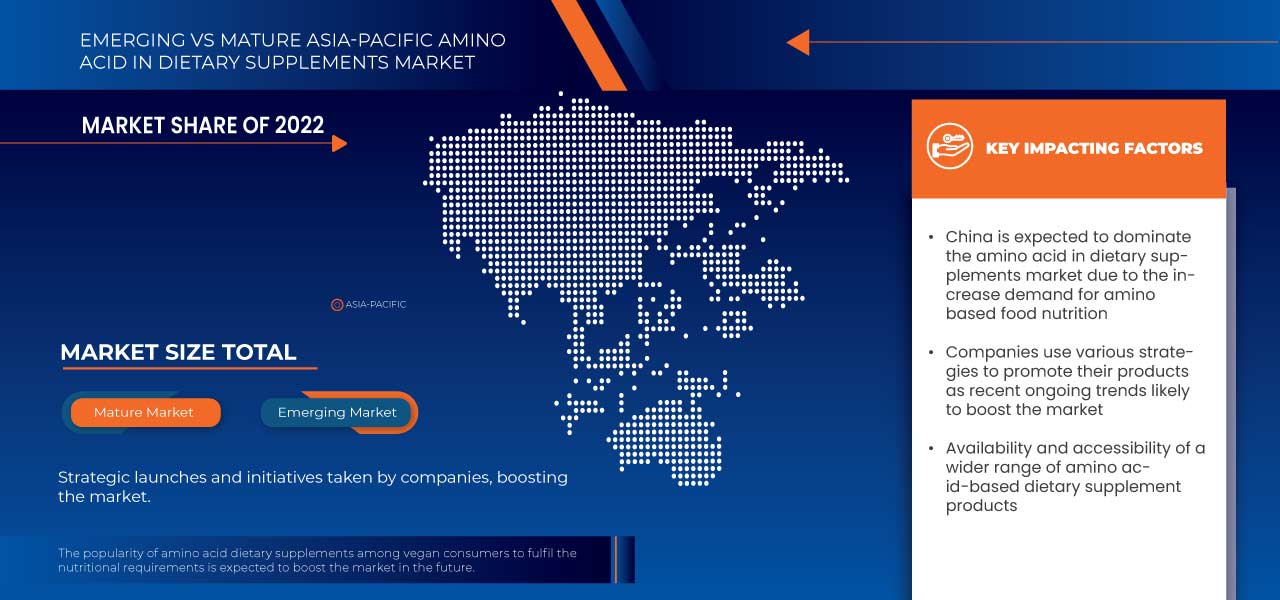
The availability of a wider range of amino acid in dietary supplements products is driving the market's expansion. Moreover, the rise in promotional activities and social media marketing for amino acid in dietary supplements has boosted the market. In addition to the expansions, R&D and the modernization of dietary supplements product in the market has opened up more business potential for amino acid in dietary supplements.
The Asia-Pacific amino acid in dietary supplements market report provides details of market share, new developments, and the impact of domestic and localized market players, analyses opportunities in terms of emerging revenue pockets, changes in market regulations, products approvals, strategic decisions, product launches, geographic expansions, and technological innovations in the market. To understand the analysis and the market scenario, contact us for an analyst brief. Our team will help you create a revenue-impact solution to achieve your desired goal.
|
Report Metric |
Details |
|
Forecast Period |
2023 to 2030 |
|
Base Year |
2022 |
|
Historic Years |
2021 (Customizable to 2015 - 2020) |
|
Quantitative Units |
Revenue in USD Million, Volumes in Kilo Tons |
|
Segments Covered |
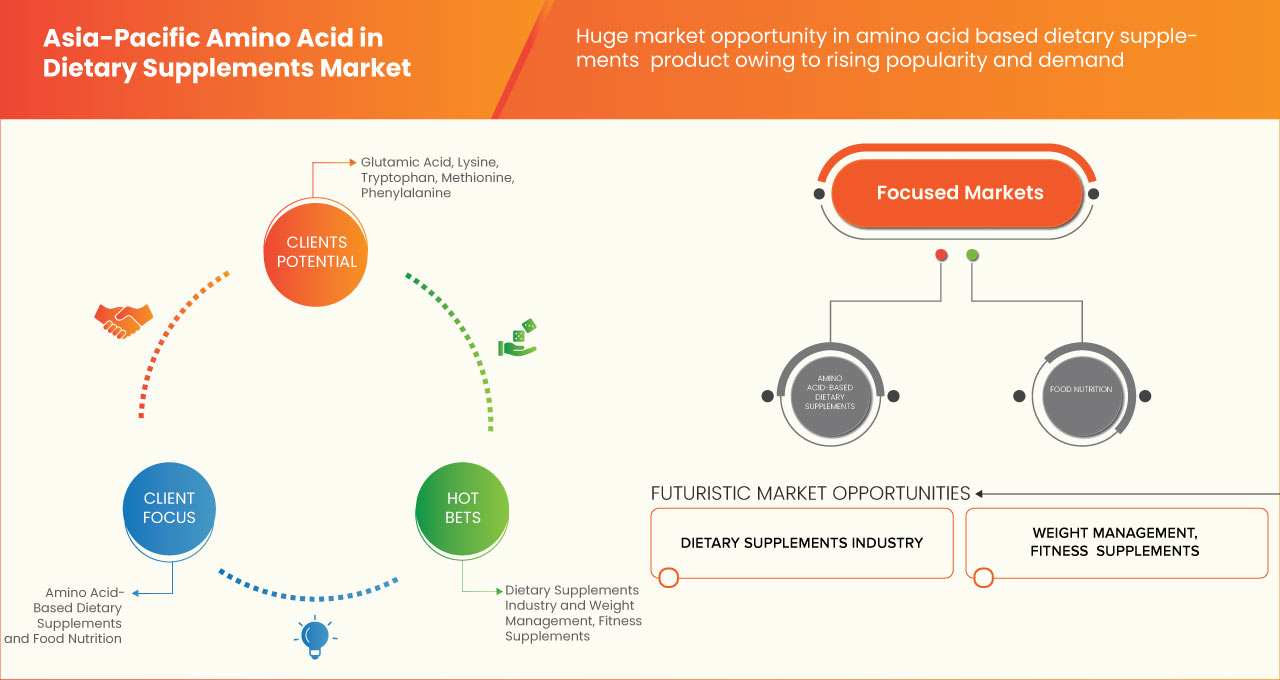
By Type (Glutamic Acid, Lysine, Tryptophan, Methionine, Phenylalanine, and Others), Form (Tablets, Capsules, Soft Gels, Powders, Gummies, Liquids, and Others), Application (Energy & Weight Management, General Health, Bone & Joint Health, Gastrointestinal Health, Immunity, Cardiac Health, Diabetes, Anti-Cancer, and Others (If Any)), End User (Adults, Geriatric, Pregnant Women, Children, and Infants), Distribution Channel (OTC and Prescribed) |
|
Countries Covered |
Japan, China, South Korea, India, Singapore, Thailand, Indonesia, Malaysia, Philippines, Australia, Rest of Asia-Pacific |
|
Market Players Covered |
MusclePharm., True Nutrition, Reliance Private Label supplements, NOW Foods, Solgar Inc., BIOVEA, Jarrow Formulas, Inc, Optimum Nutrition, Universal Nutrition, Evonik Industries AG, Cellucor, KAGED, EVLUTION NUTRITION, ALLMAX, Ajinomoto Co., Inc., GAT WHP, ProSupps USA, LLC, NutraBio Labs, Inc., Five Percent Nutrition, LLC., and Beverly International among others |
Market Definition
Amino acids are molecules that combine to form proteins. Amino acids and proteins are the building blocks of life. They form a substantial part of both animal and human nutrition. In the human body, they are necessary for vital processes such as synthesizing neurotransmitters and hormones. They are advantageous for nourishing the immune system, fighting diabetes and cancer, and treating bones & joints problem and overall health. Amino acids are commonly used as supplements to enhance athletic performance and mood, prevent muscle loss, and promote natural weight loss, energy boosters, and general health and well-being, among other applications.
Asia-Pacific Amino Acid in Dietary Supplements Market Dynamics
This section deals with understanding the market drivers, advantages, opportunities, restraints, and challenges. All of this is discussed in detail below:
Driver
- Increasing demand for amino acid-based dietary supplements due to the health and nutritional benefits
Consumers' rising demand for amino acid-based dietary supplements due to their health and nutritional benefits is expected to drive the Asia-Pacific market of amino acids in dietary supplements. This demand is due to the health benefits associated with various amino acids. The rising health consciousness of consumers has raised the demand for healthier food products and supplements. This has encouraged food and beverage manufacturers to launch products infused with essential nutrients such as amino acids. In addition, protein-deficit people, such as older people and weak individuals in terms of body weight, can gain protein by taking amino acid-rich dietary supplements. Amino acid-rich food & dietary supplements are advised for various health conditions, including attention deficit-hyperactivity disorder (ADHD), premenstrual dysphoric disorder (PMDD), smoking cessation, bruxism, and sleep aid.
Furthermore, bodybuilders and athletes turn to protein-rich foods to improve their performance and muscle building. Some amino acid-based products, such as energy drinks, nutrition bars, reduced carbohydrate meals, and nutrition supplements, are sports supplements. Several amino acids are employed for muscle development and bodybuilding supplements. It is necessary to consume protein and amino acids to grow muscle. Furthermore, amino acid has various health benefits besides the human body's protein development.
For instance,
- In August 2022, according to the scientific article published in NCBI (National Center for Biotechnology Information), the body's ability to build muscle protein is directly influenced by the essential amino acid (EAAs), which the body cannot produce on its own and must obtain from food. Recent scientific experiments that looked at how essential amino acid (EAA) supplements affected muscle mass and strength have revealed positive health results
Therefore, the health benefits provided by dietary supplements based on amino acid formulas are expected to create more demand among the consumer base and generate a larger consumer base. This increasing demand due to the consumer health benefits of measured amino acid consumption in dietary supplements is expected to drive the market in the forecast period.
Opportunity
- Rising awareness among consumers toward the consumption of amino acid-based dietary supplements
As health factors and concerns are growing among the consumer and manufacturers of the food industry, the market has seen a shift toward sales growth. This awareness has led many consumers to make lifestyle changes such as a healthy, protein-rich diet and increased amino acid-based dietary supplement consumption. Moreover, this awareness has opened up many new opportunities for the Asia-Pacific amino acid in the dietary supplements market, as amino acid-based dietary supplements have health benefits when consumed. Dietary supplements containing amino acids are food components with good value that can provide muscle strength and other nutritional benefits such as proteins. In addition, amino acids have many classifications and categories, such as essential amino acids, which the human body needs to get from an external source since it cannot synthesize them independently. Amino acid-based dietary supplements have proven to be healthy and beneficial. In addition, the increasing awareness among consumers regarding the health-beneficial food components such as dietary and health supplements based on amino acids and other vital nutrients is expected to boost the market.
For instance,
- In February 2022, BW BUSINESSWORLD reported that Indian consumers are more willing to spend money on health supplements, healthy products, and fitness classes and activities
Thus the health benefits of different amino acid-based dietary supplement types, and their increasing promotion via various health and medical contents and their manufacturers boost consumer preference. This preference creates an opportunity for the Asia-Pacific amino acid in the dietary supplements market in the forecast period.
Restraint/Challenge
- Stringent government regulations
Regulations are applied to manufacturing amino acids and products containing amino acids, such as dietary supplements based on the amino acid. The regulations are also applied to the daily consumption of amino acids to avoid their side effects. Additionally, regulations are also put on amino acid use in foods and dietary supplements to ensure the right consumption of amino acids.
For instance,
- The Journal of Nutrition, Volume 150, Issue Supplement_1, October 2020, International Regulations on Amino Acid Use in Foods and Supplements and Recommendations to Control Their Safety Based on Purity and Quality. International regulatory trends concerning the use of protein-genic amino acids in human nutrition were reviewed, and it was determined that existing risk-assessment techniques tend to focus solely on setting maximum daily limits
Hence, the increasing regulation on the consumption of amino acids might hamper the market growth as these regulations limit the usage of amino acids in various products and supplements.
Recent Developments
- In October 2021, Arla Foods Ingredients launched new dietary supplements extending the protein category line. They promoted the product as a pure BLG ingredient with a distinctive nutritional profile: Lacprodan BLG-100. It is made using a patented new separation technique and has 45% more leucine than commercially available whey protein isolates, the main amino acid for building muscle. Through this product launch and promotion, consumers learn about the efficiency of muscle building of the product. This attracted a larger consumer base while making them aware of the benefits
- In October 2020, Evonik Industries AG announced it would cluster its MetAMINO (DL-methionine) production at three international hubs (the Americas, Europe, and Asia) to maximize economies of scale and implement robust processes. The company is a leading producer of DL-methionine, an essential amino acid used in modern feed formulation. It can play a crucial part in addressing issues like a sustainable food safety supply
Asia-Pacific Amino Acid in Dietary Supplements Market Scope
The Asia-Pacific amino acid in dietary supplements market is segmented into five notable segments based on type, form, application, end user, and distribution channel. The growth amongst these segments will help you analyze major industry growth segments and provide the users with a valuable market overview and market insights to make strategic decisions to identify core market applications.
By Type
- Glutamic Acid
- Lysine
- Tryptophan
- Methionine
- Phenylalanine
- Others
On the basis of type, the Asia-Pacific amino acid in dietary supplements market is segmented into glutamic acid, lysine, tryptophan, methionine, phenylalanine, and others.
By Form
- Tablets
- Capsules
- Soft Gels
- Powders
- Gummies
- Liquids
- Others
On the basis of form, the Asia-Pacific amino acid in dietary supplements market is segmented into tablets, capsules, soft gels, powders, gummies, liquids, and others.
By Application
- Energy & Weight Management
- General Health
- Bone & Joint Health
- Gastrointestinal Health
- Immunity
- Cardiac Health
- Diabetes
- Anti-Cancer
- Others (if any)
On the basis of application, the Asia-Pacific amino acid in dietary supplements market is segmented into energy & weight management, general health, bone & joint health, gastrointestinal health, immunity, cardiac health, diabetes, anti-cancer, and others (if any).
By End User
- Adults
- Geriatric
- Pregnant Women
- Children
- Infants
On the basis of end user, the Asia-Pacific amino acid in dietary supplements market is segmented into adults, geriatric, pregnant women, children, and infants.
By Distribution Channel
- OTC
- Prescribed
On the basis of distribution channel, the Asia-Pacific amino acid in dietary supplements market is segmented into store based OTC and prescribed.
Asia-Pacific Amino Acid in Dietary Supplements Market Regional Analysis/Insights
The Asia-Pacific amino acid in dietary supplements market is segmented based on type, form, application, end user, and distribution channel.
The countries in the Asia-Pacific amino acid in dietary supplements market are Japan, China, South Korea, India, Singapore, Thailand, Indonesia, Malaysia, Philippines, Australia, rest of Asia-Pacific.
China is expected to dominate the Asia-Pacific amino acid in dietary supplements market because of increasing use of amino acids in dietary supplements and promotional activities by the market players. China dominated the amino acid in dietary supplements market in the Asia-Pacific due to consumers' high preference for amino acid in dietary supplements.
The country section of the report also provides individual market-impacting factors and changes in market regulation that impact the current and future trends of the market. Data point downstream and upstream value chain analysis, technological trends, Porter's five forces analysis, and case studies are some pointers used to forecast the market scenario for individual countries. Also, the presence and availability of Asia-Pacific brands and their challenges faced due to large or scarce competition from local and domestic brands, the impact of domestic tariffs, and trade routes are considered while providing forecast analysis of the country data.
Competitive Landscape and Asia-Pacific Amino Acid in Dietary Supplements Market Share Analysis
The Asia-Pacific amino acid in dietary supplements market competitive landscape provides details of competitors. Details included are company overview, company financials, revenue generated, market potential, investment in research and development, new market initiatives, production sites and facilities, company strengths and weaknesses, product launch, product trials pipelines, product approvals, patents, product width and breadth, application dominance, technology lifeline curve. The above data points are only related to the companies focus on the Asia-Pacific amino acid in dietary supplements market.
Some of the key market players in the Asia-Pacific amino acid in dietary supplements market are MusclePharm, NOW Foods, Solgar Inc., BIOVEA, Optimum Nutrition, Universal Nutrition, Evonik Industries AG, Cellucor, EVLUTION NUTRITION, Ajinomoto Co., Inc., and ProSupps USA, LLC among others.
SKU-
Get online access to the report on the World's First Market Intelligence Cloud
- Interactive Data Analysis Dashboard
- Company Analysis Dashboard for high growth potential opportunities
- Research Analyst Access for customization & queries
- Competitor Analysis with Interactive dashboard
- Latest News, Updates & Trend analysis
- Harness the Power of Benchmark Analysis for Comprehensive Competitor Tracking
Table of Content
1 INTRODUCTION
1.1 OBJECTIVES OF THE STUDY
1.2 MARKET DEFINITION
1.3 OVERVIEW OF ASIA PACIFIC AMINO ACID IN DIETARY SUPPLEMENTS MARKET
1.4 LIMITATIONS
1.5 MARKETS COVERED
2 MARKET SEGMENTATION
2.1 MARKETS COVERED
2.2 GEOGRAPHICAL SCOPE
2.3 YEARS CONSIDERED FOR THE STUDY
2.4 CURRENCY AND PRICING
2.5 DBMR TRIPOD DATA VALIDATION MODEL
2.6 MULTIVARIATE MODELLING
2.7 PRODUCT LIFELINE CURVE
2.8 PRIMARY INTERVIEWS WITH KEY OPINION LEADERS
2.9 DBMR MARKET POSITION GRID
2.1 MARKET APPLICATION COVERAGE GRID
2.11 SECONDARY SOURCES
2.12 ASSUMPTIONS
3 EXECUTIVE SUMMARY
4 PREMIUM INSIGHTS
4.1 PORTER'S FIVE FORCES
4.1.1 THE THREAT OF NEW ENTRANTS
4.1.2 THE THREAT OF SUBSTITUTES
4.1.3 CUSTOMER BARGAINING POWER
4.1.4 SUPPLIER BARGAINING POWER
4.1.5 INTERNAL COMPETITION (RIVALRY)
4.2 CONSUMER LEVEL TRENDS OF ASIA PACIFIC AMINO ACID IN DIETARY SUPPLEMENTS MARKET
4.2.1 OVERVIEW
4.2.2 HEALTH BENEFITS FROM AMINO ACIDS-BASED DIETARY SUPPLEMENTS
4.2.3 CERTIFIED AND RELIABLE PRODUCTS
4.2.4 ON-THE-GO FOOD PRODUCTS
4.3 FACTOR INFLUENCING PURCHASE DECISION
4.3.1 HIGH NUTRITIONAL VALUE
4.3.2 PRICING OF THE AMINO ACIDS
4.3.3 HIGH QUALITY
4.4 GROWTH STRATEGIES ADOPTED BY KEY MARKET PLAYERS
4.5 IMPACT OF ECONOMIC SLOWDOWN ON THE MARKET
4.5.1 IMPACT OF COVID-19
4.5.2 IMPACT OF WAR
4.5.3 IMPACT ON SUPPLY CHAIN
4.6 INDUSTRY TRENDS AND FUTURE PERSPECTIVE
4.6.1 RISING ADOPTION OF ADVANCED TECHNOLOGIES AND NEW BENEFICIAL FORMULATIONS IN NEW PRODUCT DEVELOPMENT OF AMINO ACIDS IN THE DIETARY SUPPLEMENT INDUSTRY
4.6.2 CERTIFICATIONS & LABELLING CLAIMS AMONG MANUFACTURERS
4.6.3 BUSINESS EXPANSIONS THROUGH DIFFERENT STRATEGIC DECISIONS
4.6.4 FUTURE PERSPECTIVE
5 SUPPLY CHAIN ANALYSIS
5.1 RAW MATERIAL PROCUREMENT
5.2 PROCESSING AND MANUFACTURING
5.3 MARKETING AND DISTRIBUTION
5.4 END USERS
6 VALUE CHAIN ANALYSIS
7 REGULATORY FRAMEWORK AND GUIDELINES
8 MARKET OVERVIEW
8.1 DRIVERS
8.1.1 INCREASING DEMAND FOR AMINO ACID-BASED DIETARY SUPPLEMENTS DUE TO THE HEALTH AND NUTRITIONAL BENEFITS
8.1.2 RISING BIOTECHNOLOGICAL ADVANCEMENT IN AMINO ACID PRODUCTION FOR DIETARY SUPPLEMENTS
8.1.3 INCREASING LAUNCHES OF AMINO ACID-BASED DIETARY SUPPLEMENTS IN THE MARKET
8.1.4 GROWING A SUSTAINABLE AND WELL-ESTABLISHED SUPPLY CHAIN IN THE MARKET
8.2 RESTRAINTS
8.2.1 AVAILABILITY OF SUBSTITUTES FOR AMINO ACID-BASED DIETARY SUPPLEMENTS
8.2.2 STRINGENT GOVERNMENT REGULATIONS
8.3 OPPORTUNITIES
8.3.1 RISING AWARENESS AMONG CONSUMERS TOWARDS CONSUMPTION OF AMINO ACID-BASED DIETARY SUPPLEMENTS
8.3.2 INCREASING BUSINESS ACTIVITIES AND INVESTMENTS DONE BY THE DIETARY SUPPLEMENTS PRODUCERS IN THE MARKET
8.4 CHALLENGES
8.4.1 COMPLEX MANUFACTURING PROCESS
8.4.2 RISING AWARENESS REGARDING THE SIDE EFFECTS CAUSED BY OVERCONSUMPTION OF AMINO ACID
8.4.3 INCREASING R&D ON PERSONALIZED NUTRITION
9 ASIA PACIFIC AMINO ACID IN DIETARY SUPPLEMENTS MARKET, BY TYPE
9.1 OVERVIEW
9.2 GLUTAMIC ACID
9.3 METHIONINE
9.4 LYSINE
9.5 PHENYLALANINE
9.6 TRYPTOPHAN
9.7 OTHERS
10 ASIA PACIFIC AMINO ACID IN DIETARY SUPPLEMENTS MARKET, BY FORM
10.1 OVERVIEW
10.2 POWDERS
10.3 LIQUIDS
10.4 SOFT GELS
10.5 TABLETS
10.6 CAPSULES
10.7 GUMMIES
10.8 OTHERS
11 ASIA PACIFIC AMINO ACID IN DIETARY SUPPLEMENTS MARKET, BY APPLICATION
11.1 OVERVIEW
11.2 ENERGY & WEIGHT MANAGEMENT
11.3 IMMUNITY
11.4 GENERAL HEALTH
11.5 BONE & JOINT HEALTH
11.6 DIABETES
11.7 GASTROINTESTINAL HEALTH
11.8 CARDIAC HEALTH
11.9 ANTI-CANCER
11.1 OTHERS
12 ASIA PACIFIC AMINO ACID IN DIETARY SUPPLEMENTS MARKET, BY END USER
12.1 OVERVIEW
12.2 ADULTS
12.3 GERIATRIC
12.4 PREGNANT WOMEN
12.5 CHILDREN
12.6 INFANTS
13 ASIA PACIFIC AMINO ACID IN DIETARY SUPPLEMENTS MARKET, BY DISTRIBUTION CHANNEL
13.1 OVERVIEW
13.2 OTC
13.3 PRESCRIBED
14 ASIA PACIFIC AMINO ACID IN DIETARY SUPPLEMENTS MARKET, BY REGION
14.1 ASIA-PACIFIC
14.1.1 CHINA
14.1.2 INDIA
14.1.3 JAPAN
14.1.4 AUSTRALIA
14.1.5 SOUTH KOREA
14.1.6 INDONESIA
14.1.7 PHILIPPINES
14.1.8 THAILAND
14.1.9 MALAYSIA
14.1.10 SINGAPORE
14.1.11 REST OF ASIA-PACIFIC
15 COMPANY LANDSCAPE
15.1 COMPANY SHARE ANALYSIS: ASIA PACIFIC
16 SWOT ANALYSIS
17 COMPANY PROFILES
17.1 EVONIK INDUSTRIES AG
17.1.1 COMPANY SNAPSHOT
17.1.2 REVENUE ANALYSIS
17.1.3 COMPANY SHARE ANALYSIS
17.1.4 PRODUCT PORTFOLIO
17.1.5 RECENT DEVELOPMENTS
17.2 AJINOMOTO CO., INC.
17.2.1 COMPANY SNAPSHOT
17.2.2 REVENUE ANALYSIS
17.2.3 COMPANY SHARE ANALYSIS
17.2.4 PRODUCT PORTFOLIO
17.2.5 RECENT DEVELOPMENTS
17.3 NOW FOODS
17.3.1 COMPANY SNAPSHOT
17.3.2 COMPANY SHARE ANALYSIS
17.3.3 PRODUCT PORTFOLIO
17.3.4 RECENT DEVELOPMENTS
17.4 MUSCLEPHARM
17.4.1 COMPANY SNAPSHOT
17.4.2 REVENUE ANALYSIS
17.4.3 COMPANY SHARE ANALYSIS
17.4.4 PRODUCT PORTFOLIO
17.4.5 RECENT DEVELOPMENTS
17.5 JARROW FORMULAS, INC
17.5.1 COMPANY SNAPSHOT
17.5.2 COMPANY SHARE ANALYSIS
17.5.3 PRODUCT PORTFOLIO
17.5.4 RECENT DEVELOPMENTS
17.6 ALLMAX
17.6.1 COMPANY SNAPSHOT
17.6.2 PRODUCT PORTFOLIO
17.6.3 RECENT DEVELOPMENTS
17.7 BEVERLY INTERNATIONAL
17.7.1 COMPANY SNAPSHOT
17.7.2 PRODUCT PORTFOLIO
17.7.3 RECENT DEVELOPMENT
17.8 BIOVEA
17.8.1 COMPANY SNAPSHOT
17.8.2 PRODUCT PORTFOLIO
17.8.3 RECENT DEVELOPMENTS
17.9 CELLUCOR
17.9.1 COMPANY SNAPSHOT
17.9.2 PRODUCT PORTFOLIO
17.9.3 RECENT DEVELOPMENTS
17.1 EVLUTION NUTRITION
17.10.1 COMPANY SNAPSHOT
17.10.2 PRODUCT PORTFOLIO
17.10.3 RECENT DEVELOPMENTS
17.11 FIVE PERCENT NUTRITION, LLC.
17.11.1 COMPANY SNAPSHOT
17.11.2 PRODUCT PORTFOLIO
17.11.3 RECENT DEVELOPMENTS
17.12 GAT WHP
17.12.1 COMPANY SNAPSHOT
17.12.2 PRODUCT PORTFOLIO
17.12.3 RECENT DEVELOPMENTS
17.13 KAGED
17.13.1 COMPANY SNAPSHOT
17.13.2 PRODUCT PORTFOLIO
17.13.3 RECENT DEVELOPMENT
17.14 NUTRABIO LABS, INC.
17.14.1 COMPANY SNAPSHOT
17.14.2 PRODUCT PORTFOLIO
17.14.3 RECENT DEVELOPMENTS
17.15 OPTIMUM NUTRITION
17.15.1 COMPANY SNAPSHOT
17.15.2 PRODUCT PORTFOLIO
17.15.3 RECENT DEVELOPMENT
17.16 PROSUPPS USA, LLC
17.16.1 COMPANY SNAPSHOT
17.16.2 PRODUCT PORTFOLIO
17.16.3 RECENT DEVELOPMENT
17.17 RELIANCE PRIVATE LABEL SUPPLEMENTS
17.17.1 COMPANY SNAPSHOT
17.17.2 PRODUCT PORTFOLIO
17.17.3 RECENT DEVELOPMENTS
17.18 SOLGAR INC.
17.18.1 COMPANY SNAPSHOT
17.18.2 PRODUCT PORTFOLIO
17.18.3 RECENT DEVELOPMENT
17.19 TRUE NUTRITION
17.19.1 COMPANY SNAPSHOT
17.19.2 PRODUCT PORTFOLIO
17.19.3 RECENT DEVELOPMENTS
17.2 UNIVERSAL NUTRITION
17.20.1 COMPANY SNAPSHOT
17.20.2 PRODUCT PORTFOLIO
17.20.3 RECENT DEVELOPMENTS
18 QUESTIONNAIRE
19 RELATED REPORTS
List of Table
TABLE 1 ASIA PACIFIC AMINO ACID IN DIETARY SUPPLEMENTS MARKET, BY TYPE, 2021-2030 (USD MILLION)
TABLE 2 ASIA PACIFIC AMINO ACID IN DIETARY SUPPLEMENTS MARKET, BY TYPE, 2021-2030 (KILO TONS)
TABLE 3 ASIA PACIFIC GLUTAMIC ACID IN AMINO ACID IN DIETARY SUPPLEMENTS MARKET, BY REGION, 2021-2030 (USD MILLION)
TABLE 4 ASIA PACIFIC GLUTAMIC ACID IN AMINO ACID IN DIETARY SUPPLEMENTS MARKET, BY REGION, 2021-2030 (KILO TONS)
TABLE 5 ASIA PACIFIC METHIONINE IN AMINO ACID IN DIETARY SUPPLEMENTS MARKET, BY REGION, 2021-2030 (USD MILLION)
TABLE 6 ASIA PACIFIC METHIONINE IN AMINO ACID IN DIETARY SUPPLEMENTS MARKET, BY REGION, 2021-2030 (KILO TONS)
TABLE 7 ASIA PACIFIC LYSINE IN AMINO ACID IN DIETARY SUPPLEMENTS MARKET, BY REGION, 2021-2030 (USD MILLION)
TABLE 8 ASIA PACIFIC LYSINE IN AMINO ACID IN DIETARY SUPPLEMENTS MARKET, BY REGION, 2021-2030 (KILO TONS)
TABLE 9 ASIA PACIFIC PHENYLALANINE IN AMINO ACID IN DIETARY SUPPLEMENTS MARKET, BY REGION, 2021-2030 (USD MILLION)
TABLE 10 ASIA PACIFIC PHENYLALANINE IN AMINO ACID IN DIETARY SUPPLEMENTS MARKET, BY REGION, 2021-2030 (KILO TONS)
TABLE 11 ASIA PACIFIC TRYPTOPHAN IN AMINO ACID IN DIETARY SUPPLEMENTS MARKET, BY REGION, 2021-2030 (USD MILLION)
TABLE 12 ASIA PACIFIC TRYPTOPHAN IN AMINO ACID IN DIETARY SUPPLEMENTS MARKET, BY REGION, 2021-2030 (KILO TONS)
TABLE 13 ASIA PACIFIC OTHERS IN AMINO ACID IN DIETARY SUPPLEMENTS MARKET, BY REGION, 2021-2030 (USD MILLION)
TABLE 14 ASIA PACIFIC OTHERS IN AMINO ACID IN DIETARY SUPPLEMENTS MARKET, BY REGION, 2021-2030 (KILO TONS)
TABLE 15 ASIA PACIFIC AMINO ACID IN DIETARY SUPPLEMENTS MARKET, BY FORM, 2021-2030 (USD MILLION)
TABLE 16 ASIA PACIFIC AMINO ACID IN DIETARY SUPPLEMENTS MARKET, BY FORM, 2021-2030 (KILO TONS)
TABLE 17 ASIA PACIFIC POWDERS IN AMINO ACID IN DIETARY SUPPLEMENTS MARKET, BY REGION, 2021-2030 (USD MILLION)
TABLE 18 ASIA PACIFIC POWDERS IN AMINO ACID IN DIETARY SUPPLEMENTS MARKET, BY REGION, 2021-2030 (KILO TONS)
TABLE 19 ASIA PACIFIC LIQUIDS IN AMINO ACID IN DIETARY SUPPLEMENTS MARKET, BY REGION, 2021-2030 (USD MILLION)
TABLE 20 ASIA PACIFIC LIQUIDS IN AMINO ACID IN DIETARY SUPPLEMENTS MARKET, BY REGION, 2021-2030 (KILO TONS)
TABLE 21 ASIA PACIFIC SOFT GELS IN AMINO ACID IN DIETARY SUPPLEMENTS MARKET, BY REGION, 2021-2030 (USD MILLION)
TABLE 22 ASIA PACIFIC SOFT GELS IN AMINO ACID IN DIETARY SUPPLEMENTS MARKET, BY REGION, 2021-2030 (KILO TONS)
TABLE 23 ASIA PACIFIC TABLETS IN AMINO ACID IN DIETARY SUPPLEMENTS MARKET, BY REGION, 2021-2030 (USD MILLION)
TABLE 24 ASIA PACIFIC TABLETS IN AMINO ACID IN DIETARY SUPPLEMENTS MARKET, BY REGION, 2021-2030 (KILO TONS)
TABLE 25 ASIA PACIFIC CAPSULES IN AMINO ACID IN DIETARY SUPPLEMENTS MARKET, BY REGION, 2021-2030 (USD MILLION)
TABLE 26 ASIA PACIFIC CAPSULES IN AMINO ACID IN DIETARY SUPPLEMENTS MARKET, BY REGION, 2021-2030 (KILO TONS)
TABLE 27 ASIA PACIFIC GUMMIES IN AMINO ACID IN DIETARY SUPPLEMENTS MARKET, BY REGION, 2021-2030 (USD MILLION)
TABLE 28 ASIA PACIFIC GUMMIES IN AMINO ACID IN DIETARY SUPPLEMENTS MARKET, BY REGION, 2021-2030 (KILO TONS)
TABLE 29 ASIA PACIFIC OTHERS IN AMINO ACID IN DIETARY SUPPLEMENTS MARKET, BY REGION, 2021-2030 (USD MILLION)
TABLE 30 ASIA PACIFIC OTHERS IN AMINO ACID IN DIETARY SUPPLEMENTS MARKET, BY REGION, 2021-2030 (KILO TONS)
TABLE 31 ASIA PACIFIC AMINO ACID IN DIETARY SUPPLEMENTS MARKET, BY APPLICATION, 2021-2030 (USD MILLION)
TABLE 32 ASIA PACIFIC AMINO ACID IN DIETARY SUPPLEMENTS MARKET, BY APPLICATION, 2021-2030 (KILO TONS)
TABLE 33 ASIA PACIFIC ENERGY & WEIGHT MANAGEMENT IN AMINO ACID IN DIETARY SUPPLEMENTS MARKET, BY REGION, 2021-2030 (USD MILLION)
TABLE 34 ASIA PACIFIC ENERGY & WEIGHT MANAGEMENT IN AMINO ACID IN DIETARY SUPPLEMENTS MARKET, BY REGION, 2021-2030 (KILO TONS)
TABLE 35 ASIA PACIFIC IMMUNITY IN AMINO ACID IN DIETARY SUPPLEMENTS MARKET, BY REGION, 2021-2030 (USD MILLION)
TABLE 36 ASIA PACIFIC IMMUNITY IN AMINO ACID IN DIETARY SUPPLEMENTS MARKET, BY REGION, 2021-2030 (KILO TONS)
TABLE 37 ASIA PACIFIC GENERAL HEALTH IN AMINO ACID IN DIETARY SUPPLEMENTS MARKET, BY REGION, 2021-2030 (USD MILLION)
TABLE 38 ASIA PACIFIC GENERAL HEALTH IN AMINO ACID IN DIETARY SUPPLEMENTS MARKET, BY REGION, 2021-2030 (KILO TONS)
TABLE 39 ASIA PACIFIC BONE & JOINT HEALTH IN AMINO ACID IN DIETARY SUPPLEMENTS MARKET, BY REGION, 2021-2030 (USD MILLION)
TABLE 40 ASIA PACIFIC BONE & JOINT HEALTH IN AMINO ACID IN DIETARY SUPPLEMENTS MARKET, BY REGION, 2021-2030 (KILO TONS)
TABLE 41 ASIA PACIFIC DIABETES IN AMINO ACID IN DIETARY SUPPLEMENTS MARKET, BY REGION, 2021-2030 (USD MILLION)
TABLE 42 ASIA PACIFIC DIABETES IN AMINO ACID IN DIETARY SUPPLEMENTS MARKET, BY REGION, 2021-2030 (KILO TONS)
TABLE 43 ASIA PACIFIC GASTROINTESTINAL HEALTH IN AMINO ACID IN DIETARY SUPPLEMENTS MARKET, BY REGION, 2021-2030 (USD MILLION)
TABLE 44 ASIA PACIFIC GASTROINTESTINAL HEALTH IN AMINO ACID IN DIETARY SUPPLEMENTS MARKET, BY REGION, 2021-2030 (KILO TONS)
TABLE 45 ASIA PACIFIC CARDIAC HEALTH IN AMINO ACID IN DIETARY SUPPLEMENTS MARKET, BY REGION, 2021-2030 (USD MILLION)
TABLE 46 ASIA PACIFIC CARDIAC HEALTH IN AMINO ACID IN DIETARY SUPPLEMENTS MARKET, BY REGION, 2021-2030 (KILO TONS)
TABLE 47 ASIA PACIFIC ANTI-CANCER IN AMINO ACID IN DIETARY SUPPLEMENTS MARKET, BY REGION, 2021-2030 (USD MILLION)
TABLE 48 ASIA PACIFIC ANTI-CANCER IN AMINO ACID IN DIETARY SUPPLEMENTS MARKET, BY REGION, 2021-2030 (KILO TONS)
TABLE 49 ASIA PACIFIC OTHERS IN AMINO ACID IN DIETARY SUPPLEMENTS MARKET, BY REGION, 2021-2030 (USD MILLION)
TABLE 50 ASIA PACIFIC OTHERS IN AMINO ACID IN DIETARY SUPPLEMENTS MARKET, BY REGION, 2021-2030 (KILO TONS)
TABLE 51 ASIA PACIFIC AMINO ACID IN DIETARY SUPPLEMENTS MARKET, BY END USER, 2021-2030 (USD MILLION)
TABLE 52 ASIA PACIFIC AMINO ACID IN DIETARY SUPPLEMENTS MARKET, BY END USER, 2021-2030 (KILO TONS)
TABLE 53 ASIA PACIFIC ADULTS IN AMINO ACID IN DIETARY SUPPLEMENTS MARKET, BY REGION, 2021-2030 (USD MILLION)
TABLE 54 ASIA PACIFIC ADULTS IN AMINO ACID IN DIETARY SUPPLEMENTS MARKET, BY REGION, 2021-2030 (KILO TONS)
TABLE 55 ASIA PACIFIC GERIATRIC IN AMINO ACID IN DIETARY SUPPLEMENTS MARKET, BY REGION, 2021-2030 (USD MILLION)
TABLE 56 ASIA PACIFIC GERIATRIC IN AMINO ACID IN DIETARY SUPPLEMENTS MARKET, BY REGION, 2021-2030 (KILO TONS)
TABLE 57 ASIA PACIFIC PREGNANT WOMEN IN AMINO ACID IN DIETARY SUPPLEMENTS MARKET, BY REGION, 2021-2030 (USD MILLION)
TABLE 58 ASIA PACIFIC PREGNANT WOMEN IN AMINO ACID IN DIETARY SUPPLEMENTS MARKET, BY REGION, 2021-2030 (KILO TONS)
TABLE 59 ASIA PACIFIC CHILDREN IN AMINO ACID IN DIETARY SUPPLEMENTS MARKET, BY REGION, 2021-2030 (USD MILLION)
TABLE 60 ASIA PACIFIC CHILDREN IN AMINO ACID IN DIETARY SUPPLEMENTS MARKET, BY REGION, 2021-2030 (KILO TONS)
TABLE 61 ASIA PACIFIC INFANTS IN AMINO ACID IN DIETARY SUPPLEMENTS MARKET, BY REGION, 2021-2030 (USD MILLION)
TABLE 62 ASIA PACIFIC INFANTS IN AMINO ACID IN DIETARY SUPPLEMENTS MARKET, BY REGION, 2021-2030 (KILO TONS)
TABLE 63 ASIA PACIFIC AMINO ACID IN DIETARY SUPPLEMENTS MARKET, BY DISTRIBUTION CHANNEL, 2021-2030 (USD MILLION)
TABLE 64 ASIA PACIFIC AMINO ACID IN DIETARY SUPPLEMENTS MARKET, BY DISTRIBUTION CHANNEL, 2021-2030 (KILO TONS)
TABLE 65 ASIA PACIFIC OTC IN AMINO ACID IN DIETARY SUPPLEMENTS MARKET, BY REGION, 2021-2030 (USD MILLION)
TABLE 66 ASIA PACIFIC OTC IN AMINO ACID IN DIETARY SUPPLEMENTS MARKET, BY REGION, 2021-2030 (KILO TONS)
TABLE 67 ASIA PACIFIC PRESCRIBED IN AMINO ACID IN DIETARY SUPPLEMENTS MARKET, BY REGION, 2021-2030 (USD MILLION)
TABLE 68 ASIA PACIFIC PRESCRIBED IN AMINO ACID IN DIETARY SUPPLEMENTS MARKET, BY REGION, 2021-2030 (KILO TONS)
TABLE 69 ASIA-PACIFIC AMINO ACID IN DIETARY SUPPLEMENTS MARKET, BY COUNTRY, 2021-2030 (USD MILLION)
TABLE 70 ASIA-PACIFIC AMINO ACID IN DIETARY SUPPLEMENTS MARKET, BY COUNTRY, 2021-2030 (KILO TONS)
TABLE 71 ASIA-PACIFIC AMINO ACID IN DIETARY SUPPLEMENTS MARKET, BY TYPE, 2021-2030 (USD MILLION)
TABLE 72 ASIA-PACIFIC AMINO ACID IN DIETARY SUPPLEMENTS MARKET, BY TYPE, 2021-2030 (KILO TONS)
TABLE 73 ASIA-PACIFIC AMINO ACID IN DIETARY SUPPLEMENTS MARKET, BY FORM, 2021-2030 (USD MILLION)
TABLE 74 ASIA-PACIFIC AMINO ACID IN DIETARY SUPPLEMENTS MARKET, BY FORM, 2021-2030 (KILO TONS)
TABLE 75 ASIA-PACIFIC AMINO ACID IN DIETARY SUPPLEMENTS MARKET, BY DISTRIBUTION CHANNEL, 2021-2030 (USD MILLION)
TABLE 76 ASIA-PACIFIC AMINO ACID IN DIETARY SUPPLEMENTS MARKET, BY DISTRIBUTION CHANNEL, 2021-2030 (KILO TONS)
TABLE 77 ASIA-PACIFIC AMINO ACID IN DIETARY SUPPLEMENTS MARKET, BY END USER, 2021-2030 (USD MILLION)
TABLE 78 ASIA-PACIFIC AMINO ACID IN DIETARY SUPPLEMENTS MARKET, BY END USER, 2021-2030 (KILO TONS)
TABLE 79 ASIA-PACIFIC AMINO ACID IN DIETARY SUPPLEMENTS MARKET, BY APPLICATION, 2021-2030 (USD MILLION)
TABLE 80 ASIA-PACIFIC AMINO ACID IN DIETARY SUPPLEMENTS MARKET, BY APPLICATION, 2021-2030 (KILO TONS)
TABLE 81 CHINA AMINO ACID IN DIETARY SUPPLEMENTS MARKET, BY TYPE, 2021-2030 (USD MILLION)
TABLE 82 CHINA AMINO ACID IN DIETARY SUPPLEMENTS MARKET, BY TYPE, 2021-2030 (KILO TONS)
TABLE 83 CHINA AMINO ACID IN DIETARY SUPPLEMENTS MARKET, BY FORM, 2021-2030 (USD MILLION)
TABLE 84 CHINA AMINO ACID IN DIETARY SUPPLEMENTS MARKET, BY FORM, 2021-2030 (KILO TONS)
TABLE 85 CHINA AMINO ACID IN DIETARY SUPPLEMENTS MARKET, BY DISTRIBUTION CHANNEL, 2021-2030 (USD MILLION)
TABLE 86 CHINA AMINO ACID IN DIETARY SUPPLEMENTS MARKET, BY DISTRIBUTION CHANNEL, 2021-2030 (KILO TONS)
TABLE 87 CHINA AMINO ACID IN DIETARY SUPPLEMENTS MARKET, BY END USER, 2021-2030 (USD MILLION)
TABLE 88 CHINA AMINO ACID IN DIETARY SUPPLEMENTS MARKET, BY END USER, 2021-2030 (KILO TONS)
TABLE 89 CHINA AMINO ACID IN DIETARY SUPPLEMENTS MARKET, BY APPLICATION, 2021-2030 (USD MILLION)
TABLE 90 CHINA AMINO ACID IN DIETARY SUPPLEMENTS MARKET, BY APPLICATION, 2021-2030 (KILO TONS)
TABLE 91 INDIA AMINO ACID IN DIETARY SUPPLEMENTS MARKET, BY TYPE, 2021-2030 (USD MILLION)
TABLE 92 INDIA AMINO ACID IN DIETARY SUPPLEMENTS MARKET, BY TYPE, 2021-2030 (KILO TONS)
TABLE 93 INDIA AMINO ACID IN DIETARY SUPPLEMENTS MARKET, BY FORM, 2021-2030 (USD MILLION)
TABLE 94 INDIA AMINO ACID IN DIETARY SUPPLEMENTS MARKET, BY FORM, 2021-2030 (KILO TONS)
TABLE 95 INDIA AMINO ACID IN DIETARY SUPPLEMENTS MARKET, BY DISTRIBUTION CHANNEL, 2021-2030 (USD MILLION)
TABLE 96 INDIA AMINO ACID IN DIETARY SUPPLEMENTS MARKET, BY DISTRIBUTION CHANNEL, 2021-2030 (KILO TONS)
TABLE 97 INDIA AMINO ACID IN DIETARY SUPPLEMENTS MARKET, BY END USER, 2021-2030 (USD MILLION)
TABLE 98 INDIA AMINO ACID IN DIETARY SUPPLEMENTS MARKET, BY END USER, 2021-2030 (KILO TONS)
TABLE 99 INDIA AMINO ACID IN DIETARY SUPPLEMENTS MARKET, BY APPLICATION, 2021-2030 (USD MILLION)
TABLE 100 INDIA AMINO ACID IN DIETARY SUPPLEMENTS MARKET, BY APPLICATION, 2021-2030 (KILO TONS)
TABLE 101 JAPAN AMINO ACID IN DIETARY SUPPLEMENTS MARKET, BY TYPE, 2021-2030 (USD MILLION)
TABLE 102 JAPAN AMINO ACID IN DIETARY SUPPLEMENTS MARKET, BY TYPE, 2021-2030 (KILO TONS)
TABLE 103 JAPAN AMINO ACID IN DIETARY SUPPLEMENTS MARKET, BY FORM, 2021-2030 (USD MILLION)
TABLE 104 JAPAN AMINO ACID IN DIETARY SUPPLEMENTS MARKET, BY FORM, 2021-2030 (KILO TONS)
TABLE 105 JAPAN AMINO ACID IN DIETARY SUPPLEMENTS MARKET, BY DISTRIBUTION CHANNEL, 2021-2030 (USD MILLION)
TABLE 106 JAPAN AMINO ACID IN DIETARY SUPPLEMENTS MARKET, BY DISTRIBUTION CHANNEL, 2021-2030 (KILO TONS)
TABLE 107 JAPAN AMINO ACID IN DIETARY SUPPLEMENTS MARKET, BY END USER, 2021-2030 (USD MILLION)
TABLE 108 JAPAN AMINO ACID IN DIETARY SUPPLEMENTS MARKET, BY END USER, 2021-2030 (KILO TONS)
TABLE 109 JAPAN AMINO ACID IN DIETARY SUPPLEMENTS MARKET, BY APPLICATION, 2021-2030 (USD MILLION)
TABLE 110 JAPAN AMINO ACID IN DIETARY SUPPLEMENTS MARKET, BY APPLICATION, 2021-2030 (KILO TONS)
TABLE 111 AUSTRALIA AMINO ACID IN DIETARY SUPPLEMENTS MARKET, BY TYPE, 2021-2030 (USD MILLION)
TABLE 112 AUSTRALIA AMINO ACID IN DIETARY SUPPLEMENTS MARKET, BY TYPE, 2021-2030 (KILO TONS)
TABLE 113 AUSTRALIA AMINO ACID IN DIETARY SUPPLEMENTS MARKET, BY FORM, 2021-2030 (USD MILLION)
TABLE 114 AUSTRALIA AMINO ACID IN DIETARY SUPPLEMENTS MARKET, BY FORM, 2021-2030 (KILO TONS)
TABLE 115 AUSTRALIA AMINO ACID IN DIETARY SUPPLEMENTS MARKET, BY DISTRIBUTION CHANNEL, 2021-2030 (USD MILLION)
TABLE 116 AUSTRALIA AMINO ACID IN DIETARY SUPPLEMENTS MARKET, BY DISTRIBUTION CHANNEL, 2021-2030 (KILO TONS)
TABLE 117 AUSTRALIA AMINO ACID IN DIETARY SUPPLEMENTS MARKET, BY END USER, 2021-2030 (USD MILLION)
TABLE 118 AUSTRALIA AMINO ACID IN DIETARY SUPPLEMENTS MARKET, BY END USER, 2021-2030 (KILO TONS)
TABLE 119 AUSTRALIA AMINO ACID IN DIETARY SUPPLEMENTS MARKET, BY APPLICATION, 2021-2030 (USD MILLION)
TABLE 120 AUSTRALIA AMINO ACID IN DIETARY SUPPLEMENTS MARKET, BY APPLICATION, 2021-2030 (KILO TONS)
TABLE 121 SOUTH KOREA AMINO ACID IN DIETARY SUPPLEMENTS MARKET, BY TYPE, 2021-2030 (USD MILLION)
TABLE 122 SOUTH KOREA AMINO ACID IN DIETARY SUPPLEMENTS MARKET, BY TYPE, 2021-2030 (KILO TONS)
TABLE 123 SOUTH KOREA AMINO ACID IN DIETARY SUPPLEMENTS MARKET, BY FORM, 2021-2030 (USD MILLION)
TABLE 124 SOUTH KOREA AMINO ACID IN DIETARY SUPPLEMENTS MARKET, BY FORM, 2021-2030 (KILO TONS)
TABLE 125 SOUTH KOREA AMINO ACID IN DIETARY SUPPLEMENTS MARKET, BY DISTRIBUTION CHANNEL, 2021-2030 (USD MILLION)
TABLE 126 SOUTH KOREA AMINO ACID IN DIETARY SUPPLEMENTS MARKET, BY DISTRIBUTION CHANNEL, 2021-2030 (KILO TONS)
TABLE 127 SOUTH KOREA AMINO ACID IN DIETARY SUPPLEMENTS MARKET, BY END USER, 2021-2030 (USD MILLION)
TABLE 128 SOUTH KOREA AMINO ACID IN DIETARY SUPPLEMENTS MARKET, BY END USER, 2021-2030 (KILO TONS)
TABLE 129 SOUTH KOREA AMINO ACID IN DIETARY SUPPLEMENTS MARKET, BY APPLICATION, 2021-2030 (USD MILLION)
TABLE 130 SOUTH KOREA AMINO ACID IN DIETARY SUPPLEMENTS MARKET, BY APPLICATION, 2021-2030 (KILO TONS)
TABLE 131 INDONESIA AMINO ACID IN DIETARY SUPPLEMENTS MARKET, BY TYPE, 2021-2030 (USD MILLION)
TABLE 132 INDONESIA AMINO ACID IN DIETARY SUPPLEMENTS MARKET, BY TYPE, 2021-2030 (KILO TONS)
TABLE 133 INDONESIA AMINO ACID IN DIETARY SUPPLEMENTS MARKET, BY FORM, 2021-2030 (USD MILLION)
TABLE 134 INDONESIA AMINO ACID IN DIETARY SUPPLEMENTS MARKET, BY FORM, 2021-2030 (KILO TONS)
TABLE 135 INDONESIA AMINO ACID IN DIETARY SUPPLEMENTS MARKET, BY DISTRIBUTION CHANNEL, 2021-2030 (USD MILLION)
TABLE 136 INDONESIA AMINO ACID IN DIETARY SUPPLEMENTS MARKET, BY DISTRIBUTION CHANNEL, 2021-2030 (KILO TONS)
TABLE 137 INDONESIA AMINO ACID IN DIETARY SUPPLEMENTS MARKET, BY END USER, 2021-2030 (USD MILLION)
TABLE 138 INDONESIA AMINO ACID IN DIETARY SUPPLEMENTS MARKET, BY END USER, 2021-2030 (KILO TONS)
TABLE 139 INDONESIA AMINO ACID IN DIETARY SUPPLEMENTS MARKET, BY APPLICATION, 2021-2030 (USD MILLION)
TABLE 140 INDONESIA AMINO ACID IN DIETARY SUPPLEMENTS MARKET, BY APPLICATION, 2021-2030 (KILO TONS)
TABLE 141 PHILIPPINES AMINO ACID IN DIETARY SUPPLEMENTS MARKET, BY TYPE, 2021-2030 (USD MILLION)
TABLE 142 PHILIPPINES AMINO ACID IN DIETARY SUPPLEMENTS MARKET, BY TYPE, 2021-2030 (KILO TONS)
TABLE 143 PHILIPPINES AMINO ACID IN DIETARY SUPPLEMENTS MARKET, BY FORM, 2021-2030 (USD MILLION)
TABLE 144 PHILIPPINES AMINO ACID IN DIETARY SUPPLEMENTS MARKET, BY FORM, 2021-2030 (KILO TONS)
TABLE 145 PHILIPPINES AMINO ACID IN DIETARY SUPPLEMENTS MARKET, BY DISTRIBUTION CHANNEL, 2021-2030 (USD MILLION)
TABLE 146 PHILIPPINES AMINO ACID IN DIETARY SUPPLEMENTS MARKET, BY DISTRIBUTION CHANNEL, 2021-2030 (KILO TONS)
TABLE 147 PHILIPPINES AMINO ACID IN DIETARY SUPPLEMENTS MARKET, BY END USER, 2021-2030 (USD MILLION)
TABLE 148 PHILIPPINES AMINO ACID IN DIETARY SUPPLEMENTS MARKET, BY END USER, 2021-2030 (KILO TONS)
TABLE 149 PHILIPPINES AMINO ACID IN DIETARY SUPPLEMENTS MARKET, BY APPLICATION, 2021-2030 (USD MILLION)
TABLE 150 PHILIPPINES AMINO ACID IN DIETARY SUPPLEMENTS MARKET, BY APPLICATION, 2021-2030 (KILO TONS)
TABLE 151 THAILAND AMINO ACID IN DIETARY SUPPLEMENTS MARKET, BY TYPE, 2021-2030 (USD MILLION)
TABLE 152 THAILAND AMINO ACID IN DIETARY SUPPLEMENTS MARKET, BY TYPE, 2021-2030 (KILO TONS)
TABLE 153 THAILAND AMINO ACID IN DIETARY SUPPLEMENTS MARKET, BY FORM, 2021-2030 (USD MILLION)
TABLE 154 THAILAND AMINO ACID IN DIETARY SUPPLEMENTS MARKET, BY FORM, 2021-2030 (KILO TONS)
TABLE 155 THAILAND AMINO ACID IN DIETARY SUPPLEMENTS MARKET, BY DISTRIBUTION CHANNEL, 2021-2030 (USD MILLION)
TABLE 156 THAILAND AMINO ACID IN DIETARY SUPPLEMENTS MARKET, BY DISTRIBUTION CHANNEL, 2021-2030 (KILO TONS)
TABLE 157 THAILAND AMINO ACID IN DIETARY SUPPLEMENTS MARKET, BY END USER, 2021-2030 (USD MILLION)
TABLE 158 THAILAND AMINO ACID IN DIETARY SUPPLEMENTS MARKET, BY END USER, 2021-2030 (KILO TONS)
TABLE 159 THAILAND AMINO ACID IN DIETARY SUPPLEMENTS MARKET, BY APPLICATION, 2021-2030 (USD MILLION)
TABLE 160 THAILAND AMINO ACID IN DIETARY SUPPLEMENTS MARKET, BY APPLICATION, 2021-2030 (KILO TONS)
TABLE 161 MALAYSIA AMINO ACID IN DIETARY SUPPLEMENTS MARKET, BY TYPE, 2021-2030 (USD MILLION)
TABLE 162 MALAYSIA AMINO ACID IN DIETARY SUPPLEMENTS MARKET, BY TYPE, 2021-2030 (KILO TONS)
TABLE 163 MALAYSIA AMINO ACID IN DIETARY SUPPLEMENTS MARKET, BY FORM, 2021-2030 (USD MILLION)
TABLE 164 MALAYSIA AMINO ACID IN DIETARY SUPPLEMENTS MARKET, BY FORM, 2021-2030 (KILO TONS)
TABLE 165 MALAYSIA AMINO ACID IN DIETARY SUPPLEMENTS MARKET, BY DISTRIBUTION CHANNEL, 2021-2030 (USD MILLION)
TABLE 166 MALAYSIA AMINO ACID IN DIETARY SUPPLEMENTS MARKET, BY DISTRIBUTION CHANNEL, 2021-2030 (KILO TONS)
TABLE 167 MALAYSIA AMINO ACID IN DIETARY SUPPLEMENTS MARKET, BY END USER, 2021-2030 (USD MILLION)
TABLE 168 MALAYSIA AMINO ACID IN DIETARY SUPPLEMENTS MARKET, BY END USER, 2021-2030 (KILO TONS)
TABLE 169 MALAYSIA AMINO ACID IN DIETARY SUPPLEMENTS MARKET, BY APPLICATION, 2021-2030 (USD MILLION)
TABLE 170 MALAYSIA AMINO ACID IN DIETARY SUPPLEMENTS MARKET, BY APPLICATION, 2021-2030 (KILO TONS)
TABLE 171 SINGAPORE AMINO ACID IN DIETARY SUPPLEMENTS MARKET, BY TYPE, 2021-2030 (USD MILLION)
TABLE 172 SINGAPORE AMINO ACID IN DIETARY SUPPLEMENTS MARKET, BY TYPE, 2021-2030 (KILO TONS)
TABLE 173 SINGAPORE AMINO ACID IN DIETARY SUPPLEMENTS MARKET, BY FORM, 2021-2030 (USD MILLION)
TABLE 174 SINGAPORE AMINO ACID IN DIETARY SUPPLEMENTS MARKET, BY FORM, 2021-2030 (KILO TONS)
TABLE 175 SINGAPORE AMINO ACID IN DIETARY SUPPLEMENTS MARKET, BY DISTRIBUTION CHANNEL, 2021-2030 (USD MILLION)
TABLE 176 SINGAPORE AMINO ACID IN DIETARY SUPPLEMENTS MARKET, BY DISTRIBUTION CHANNEL, 2021-2030 (KILO TONS)
TABLE 177 SINGAPORE AMINO ACID IN DIETARY SUPPLEMENTS MARKET, BY END USER, 2021-2030 (USD MILLION)
TABLE 178 SINGAPORE AMINO ACID IN DIETARY SUPPLEMENTS MARKET, BY END USER, 2021-2030 (KILO TONS)
TABLE 179 SINGAPORE AMINO ACID IN DIETARY SUPPLEMENTS MARKET, BY APPLICATION, 2021-2030 (USD MILLION)
TABLE 180 SINGAPORE AMINO ACID IN DIETARY SUPPLEMENTS MARKET, BY APPLICATION, 2021-2030 (KILO TONS)
TABLE 181 REST OF ASIA-PACIFIC AMINO ACID IN DIETARY SUPPLEMENTS MARKET, BY TYPE, 2021-2030 (USD MILLION)
List of Figure
FIGURE 1 ASIA PACIFIC AMINO ACID IN DIETARY SUPPLEMENTS MARKET: SEGMENTATION
FIGURE 2 ASIA PACIFIC AMINO ACID IN DIETARY SUPPLEMENTS MARKET: DATA TRIANGULATION
FIGURE 3 ASIA PACIFIC AMINO ACID IN DIETARY SUPPLEMENTS MARKET: DROC ANALYSIS
FIGURE 4 ASIA PACIFIC AMINO ACID IN DIETARY SUPPLEMENTS MARKET: ASIA PACIFIC VS REGIONAL MARKET ANALYSIS
FIGURE 5 ASIA PACIFIC AMINO ACID IN DIETARY SUPPLEMENTS MARKET: COMPANY RESEARCH ANALYSIS
FIGURE 6 ASIA PACIFIC AMINO ACID IN DIETARY SUPPLEMENTS MARKET: INTERVIEW DEMOGRAPHICS
FIGURE 7 ASIA PACIFIC AMINO ACID IN DIETARY SUPPLEMENTS MARKET: DBMR MARKET POSITION GRID
FIGURE 8 ASIA PACIFIC AMINO ACID IN DIETARY SUPPLEMENTS MARKET: MARKET APPLICATION COVERAGE GRID
FIGURE 9 ASIA PACIFIC AMINO ACID IN DIETARY SUPPLEMENTS MARKET: SEGMENTATION
FIGURE 10 INCREASING LAUNCHES OF AMINO ACID-BASED DIETARY SUPPLEMENTS IN THE MARKET IS DRIVING THE GROWTH OF THE ASIA PACIFIC AMINO ACID IN DIETARY SUPPLEMENTS MARKET IN THE FORECAST PERIOD OF 2023 TO 2030
FIGURE 11 THE GLUTAMIC ACID SEGMENT IS EXPECTED TO ACCOUNT FOR THE LARGEST SHARE OF THE ASIA PACIFIC AMINO ACID IN DIETARY SUPPLEMENTS MARKET IN 2023 & 2030
FIGURE 12 SUPPLY CHAIN OF ASIA PACIFIC AMINO ACID IN DIETARY SUPPLEMENT MARKET
FIGURE 13 DRIVERS, RESTRAINTS, OPPORTUNITIES AND CHALLENGES OF THE ASIA PACIFIC AMINO ACID IN DIETARY SUPPLEMENTS MARKET
FIGURE 14 ASIA PACIFIC AMINO ACID IN DIETARY SUPPLEMENT MARKET: BY TYPE, 2022
FIGURE 15 ASIA PACIFIC AMINO ACID IN DIETARY SUPPLEMENT MARKET: BY FORM, 2022
FIGURE 16 ASIA PACIFIC AMINO ACID IN DIETARY SUPPLEMENT MARKET: BY APPLICATION, 2022
FIGURE 17 ASIA PACIFIC AMINO ACID IN DIETARY SUPPLEMENT MARKET: BY END USER, 2022
FIGURE 18 ASIA PACIFIC AMINO ACID IN DIETARY SUPPLEMENT MARKET: BY DISTRIBUTION CHANNEL, 2022
FIGURE 19 ASIA-PACIFIC AMINO ACID IN DIETARY SUPPLEMENTS MARKET: SNAPSHOT (2022)
FIGURE 20 ASIA-PACIFIC AMINO ACID IN DIETARY SUPPLEMENTS MARKET: BY COUNTRY (2022)
FIGURE 21 ASIA-PACIFIC AMINO ACID IN DIETARY SUPPLEMENTS MARKET: BY COUNTRY (2023 & 2030)
FIGURE 22 ASIA-PACIFIC AMINO ACID IN DIETARY SUPPLEMENTS MARKET: BY COUNTRY (2022 & 2030)
FIGURE 23 ASIA-PACIFIC AMINO ACID IN DIETARY SUPPLEMENTS MARKET: BY TYPE (2023-2030)
FIGURE 24 ASIA PACIFIC AMINO ACID IN DIETARY SUPPLEMENTS MARKET: COMPANY SHARE 2022 (%)
Asia Pacific Amino Acid In Dietary Supplements Market, Supply Chain Analysis and Ecosystem Framework
To support market growth and help clients navigate the impact of geopolitical shifts, DBMR has integrated in-depth supply chain analysis into its Asia Pacific Amino Acid In Dietary Supplements Market research reports. This addition empowers clients to respond effectively to global changes affecting their industries. The supply chain analysis section includes detailed insights such as Asia Pacific Amino Acid In Dietary Supplements Market consumption and production by country, price trend analysis, the impact of tariffs and geopolitical developments, and import and export trends by country and HSN code. It also highlights major suppliers with data on production capacity and company profiles, as well as key importers and exporters. In addition to research, DBMR offers specialized supply chain consulting services backed by over a decade of experience, providing solutions like supplier discovery, supplier risk assessment, price trend analysis, impact evaluation of inflation and trade route changes, and comprehensive market trend analysis.
Research Methodology
Data collection and base year analysis are done using data collection modules with large sample sizes. The stage includes obtaining market information or related data through various sources and strategies. It includes examining and planning all the data acquired from the past in advance. It likewise envelops the examination of information inconsistencies seen across different information sources. The market data is analysed and estimated using market statistical and coherent models. Also, market share analysis and key trend analysis are the major success factors in the market report. To know more, please request an analyst call or drop down your inquiry.
The key research methodology used by DBMR research team is data triangulation which involves data mining, analysis of the impact of data variables on the market and primary (industry expert) validation. Data models include Vendor Positioning Grid, Market Time Line Analysis, Market Overview and Guide, Company Positioning Grid, Patent Analysis, Pricing Analysis, Company Market Share Analysis, Standards of Measurement, Global versus Regional and Vendor Share Analysis. To know more about the research methodology, drop in an inquiry to speak to our industry experts.
Customization Available
Data Bridge Market Research is a leader in advanced formative research. We take pride in servicing our existing and new customers with data and analysis that match and suits their goal. The report can be customized to include price trend analysis of target brands understanding the market for additional countries (ask for the list of countries), clinical trial results data, literature review, refurbished market and product base analysis. Market analysis of target competitors can be analyzed from technology-based analysis to market portfolio strategies. We can add as many competitors that you require data about in the format and data style you are looking for. Our team of analysts can also provide you data in crude raw excel files pivot tables (Fact book) or can assist you in creating presentations from the data sets available in the report.