Market Analysis and Insights: Asia-Pacific Dental Instruments Market
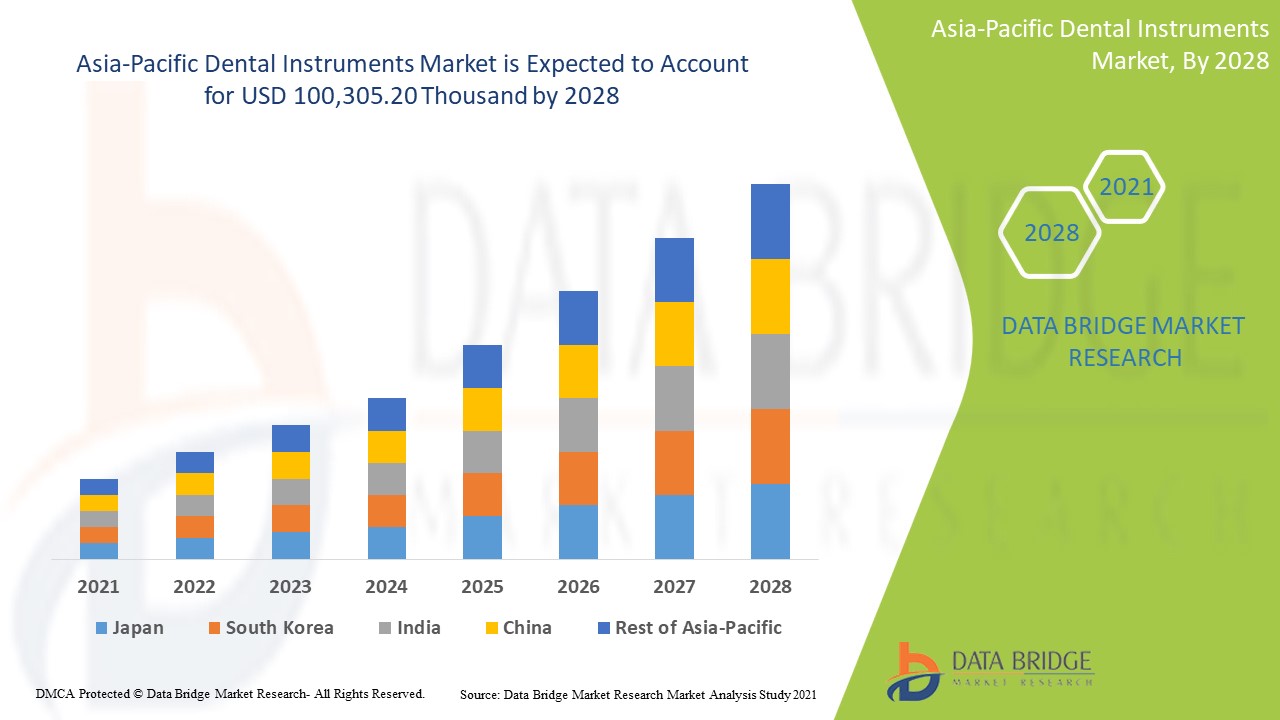
Asia-Pacific dental instruments market is expected to gain market growth in the forecast period of 2021 to 2028. Data Bridge Market Research analyses that the market is growing with a CAGR of 6.9% in the forecast period of 2021 to 2028 and is expected to reach USD 100,305.20 thousand by 2028 from USD 61,105.91 thousand in 2020. The high prevalence of dental disorders and technological development is likely to be the major drivers which propel the demand of the market in the forecast period.
The dental instruments are used by dental professionals to provide various types of dental diagnosis and treatment. The instruments include tools to examine, restore, treat, and manipulate oral structures. There are some kinds of standard instruments which are used to examine, restore, retract and manipulate tissues. These instruments are also used to diagnose and treat all kinds of dental deformities. The common dental instruments include dental mirrors, dental burs, dental hand pieces and dental probes among others.
Some of the dental disorders require surgery for the treatment. The dental surgical instruments aid at the time of performing surgery which includes radiology instruments and hand pieces among others.
According to World Health Organization, 2.3 billion people suffer from caries of permanent teeth. As a counter measure, the World Health Organization has taken the initiative to promote the prevention of oral disease which led to rise in number of dental instruments. The high prevalence of dental disorders along with rising awareness is driving the growth of the Asia-Pacific dental instruments market. However, the high cost of dental procedures may hamper the growth of the market.
The Asia-Pacific dental instruments market report provides details of market share, new developments, and impact of domestic and localized market players, analyses opportunities in terms of emerging revenue pockets, changes in market regulations, product approvals, strategic decisions, product launches, geographic expansions, and technological innovations in the market. To understand the analysis and the market scenario, contact us for an Analyst Brief. Our team will help you create a revenue impact solution to achieve your desired goal.
Asia-Pacific Dental Instruments Market Scope and Market Size
Asia-Pacific dental instruments market is categorized into four notable segments which are based on product, instrument type, end user and distribution channel. The growth among segments helps you analyse niche pockets of growth and strategies to approach the market and determine your core application areas and the difference in your target markets.
- On the basis of product, the dental instruments market is segmented into perio/oral surgery, hygiene, diagnostic, endodontic, operative and others. In 2021, perio/oral surgery segment is expected to dominate the market because of rise in number of dental oral surgeries performed across Asia-Pacific as people are getting more aware towards oral hygiene.
- On the basis of Instruments type, the dental instruments market is segmented into examination instruments, cutting instruments and others. In 2021, examination instruments segment is expected to dominate the market as these instruments are used in wide variety of dental applications.
- On the basis of end user, the dental instruments market is segmented into hospitals, clinics, dental laboratories, scientific research and others. In 2021, hospitals segment is expected to dominate the market as people mostly visit hospitals for the diagnosis and treatment of diseases.
- On the basis of distribution channel, the dental instruments market is segmented into direct tender, third party distributors and others. In 2021, direct tender is expected to dominate the market as the cost is minimum in direct tender in bulk purchase.
Asia-Pacific Dental Instruments Market Country Level Analysis
The Asia-Pacific dental instruments market is analysed, and market size information is provided by country, product, instrument type, end-user, and distribution.
The countries covered in the Asia-Pacific dental instruments market report are Japan, China, South Korea, India, Australia, Singapore, Thailand, Malaysia, Indonesia, Philippines, Vietnam, Rest of Asia-Pacific.
China is expected to dominate the market as the demand for dental instruments is increasing because of high prevalence of dental disorders and increasing healthcare infrastructure.
The country section of the report also provides individual market impacting factors and changes in regulation in the market domestically that impacts the current and future trends of the market. Data points such as new sales, replacement sales, country demographics, regulatory acts, and import-export tariffs are some of the major pointers used to forecast the market scenario for individual countries. Also, the presence and availability of Asia-Pacific brands and their challenges faced due to large or scarce competition from local and domestic brands, the impact of sales channels are considered while providing forecast analysis of the country data.
The presence of advanced technology and strategic initiatives taken by players are creating new opportunities in Asia-Pacific dental instruments market
Asia-Pacific dental instruments market also provides you with detailed market analysis for every country's growth in a particular industry with products sales, the impact of advancement in the market, and changes in regulatory scenarios with their support for the dental instruments market. The data is available for the historic period 2010 to 2019.
Competitive Landscape and Asia-Pacific Dental Instruments Market Share Analysis
Asia-Pacific dental instruments market competitive landscape provides details by the competitor. Details included are company overview, company financials, revenue generated, market potential, investment in research and development, new market initiatives, production sites and facilities, company strengths and weaknesses, product launch, product trials pipelines, product approvals, patents, product width, and breadth, application dominance, technology lifeline curve. The above data points provided are only related to the company's focus related to dental instruments market.
The major companies providing the dental instruments are 3M, DENTSPLY SIRONA, COLTENE Group, Hu-Friedy Mfg. Co., LLC, SurgiMac, Integra LifeSciences, IndoSurgicals Private Limited, ESSENTIAL DENTAL SYSTEMS, INC. VDW GmbH, Brasseler USA, Premier Dental Co., Berman Dental Instruments, PDT, Inc., Kerr Corporation, NTI-Kahla GmbH, A-dec, Inc., B. Braun Melsungen AG, Narang Medical Limited, Goldman Dental, Metron Optics, Inc., Technodent Exim India Pvt. Ltd, Devemed GmbH, LM-Instruments Oy, Daniel Kurten GmbH & Co. KG, NAKANISHI INC., Helmut Zepf Medizintechnik GmbH among others.
DBMR analysts understand competitive strengths and provide competitive analysis for each competitor separately.
The strategic initiatives by market players and new technological advancements for dental instruments are bridging the gap for variety of treatments.
For instance,
- In February 2019, Hu-Friedy Mfg. Co., LLC announced that it has participated in annual Chicago midwinter meeting. This has helped the company to furnish correct knowledge about its products in the market.
Collaboration, joint ventures, and other strategies by the market player is enhancing the company market in the dental instruments market, which also provides the benefit for the organization to improve their offering for dental instruments market.
SKU-
Get online access to the report on the World's First Market Intelligence Cloud
- Interactive Data Analysis Dashboard
- Company Analysis Dashboard for high growth potential opportunities
- Research Analyst Access for customization & queries
- Competitor Analysis with Interactive dashboard
- Latest News, Updates & Trend analysis
- Harness the Power of Benchmark Analysis for Comprehensive Competitor Tracking
Table of Content
1 INTRODUCTION
1.1 OBJECTIVES OF THE STUDY
1.2 MARKET DEFINITION
1.3 OVERVIEW OF ASIA PACIFIC DENTAL INSTRUMENTS MARKET
1.4 LIMITATIONS
1.5 MARKETS COVERED
2 MARKET SEGMENTATION
2.1 MARKETS COVERED
2.2 GEOGRAPHICAL SCOPE
2.3 YEARS CONSIDERED FOR THE STUDY
2.4 CURRENCY AND PRICING
2.5 DBMR TRIPOD DATA VALIDATION MODEL
2.6 MULTIVARIATE MODELLING
2.7 INSTRUMENT TYPE LIFELINE CURVE
2.8 PRIMARY INTERVIEWS WITH KEY OPINION LEADERS
2.9 DBMR MARKET POSITION GRID
2.1 MARKET END USER COVERAGE GRID
2.11 VENDOR SHARE ANALYSIS
2.12 SECONDARY SOURCES
2.13 ASSUMPTIONS
3 EXECUTIVE SUMMARY
4 PREMIUM INSIGHTS
4.1 PORTERS FIVE FORCES
4.2 PESTEL ANALYSIS
5 INDUSTRY INSIGHTS
6 REGULATORY FRAMEWORK
6.1 U.S.
6.2 CHINA
6.3 AUSTRALIA
7 MARKET OVERVIEW
7.1 DRIVERS
7.1.1 HIGH PREVALENCE OF DENTAL DISORDERS
7.1.2 INCREASING NUMBER OF DENTAL PRACTITIONERS AND DENTAL CLINICS
7.1.3 GROWING GERIATRIC POPULATION
7.1.4 RISING PER CAPITA INCOME AND RISE IN DENTAL EXPENDITURE
7.2 RESTRAINTS
7.2.1 HIGH COST OF DENTAL TREATMENTS
7.2.2 STRINGENT GOVERNMENT REGULATIONS
7.2.3 INAPPROPRIATE REIMBURSEMENT SCENARIO
7.3 OPPORTUNITIES
7.3.1 INCREASED AESTHETIC DENTISTRY
7.3.2 STRATEGIC INITIATIVES BY KEY MARKET PLAYERS
7.3.3 GROWING MEDICAL TOURISM FOR DENTAL PROCEDURES
7.3.4 INCREASING AWARENESS REGARDING PERIODONTAL DISEASE
7.4 CHALLENGES
7.4.1 HIGH COST OF RESEARCH AND DEVELOPMENT
7.4.2 EMERGENCE OF COVID-19
8 COVID-19 IMPACT ON DENTAL INSTRUMENTS MARKET
8.1 IMPACT ON PRICE OF DENTAL INSTRUMENTS
8.2 IMPACT ON DEMAND OF DENTAL INSTRUMENTS
8.3 IMPACT ON SUPPLY CHAIN OF DENTAL INSTRUMENTS
8.4 STRATEGIC DECISIONS FOR MANUFACTURERS
8.5 CONCLUSION
9 ASIA PACIFIC DENTAL INSTRUMENTS MARKET, BY PRODUCT
9.1 OVERVIEW
9.2 PERIO/ORAL SURGERY
9.2.1 SURGICAL CURETTES
9.2.2 ELEVATORS
9.2.3 TISSUE PLIERS
9.2.3.1 STRAIGHT
9.2.3.2 CURVED
9.2.4 SCISSORS
9.2.4.1 TISSUE
9.2.4.2 SUTURE
9.2.4.3 CROWN AND COLLAR
9.2.4.4 OTHERS
9.2.5 FILES
9.2.6 RONGEURS
9.2.7 NEEDLE HOLDERS
9.2.8 KNIVES
9.2.9 ASPIRATORS
9.2.10 RETRACTORS/SPREADERS
9.2.11 HEMOSTATS
9.2.12 MALLETS
9.2.13 BIOPSY PUNCH
9.2.14 OTHERS
9.3 HYGIENE
9.3.1 SCALERS
9.3.2 CURETTES
9.3.3 ULTRASONIC INSERTS
9.3.4 OTHERS
9.4 DIAGNOSTIC
9.4.1 PROBES
9.4.2 EXPLORERS
9.4.2.1 SINGLE END
9.4.2.2 DOUBLE END
9.4.3 MIRROR HANDLES
9.4.4 DRESSING PLIERS
9.4.5 OTHERS
9.5 ENDODONTIC
9.5.1 PLUGGERS
9.5.2 EXCAVATORS
9.5.3 EXPLORERS
9.5.4 SPREADERS
9.5.4.1 STAINLESS STEEL
9.5.4.2 NICKEL TITANIUM
9.5.4.3 OTHERS
9.5.5 SPECIALITY
9.5.6 OTHERS
9.6 OPERATIVE
9.6.1 EXCAVATORS
9.6.2 PLUGGERS
9.6.3 SPATULAS
9.6.4 CARVERS
9.6.5 CORD PACKERS
9.6.6 AMALGAM CARRIERS/GUMS
9.6.7 APPLICATORS
9.6.8 OTHERS
10 ASIA PACIFIC DENTAL INSTRUMENTS MARKET, BY INSTRUMENT TYPE
10.1 OVERVIEW
10.2 EXAMINATION INSTRUMENTS
10.3 CUTTING INSTRUMENTS
10.4 OTHERS
11 ASIA PACIFIC DENTAL INSTRUMENTS MARKET, BY END USER
11.1 OVERVIEW
11.2 HOSPITALS
11.3 CLINICS
11.4 DENTAL LABORATORIES
11.5 SCIENTIFIC RESEARCH
11.6 OTHERS
12 ASIA PACIFIC DENTAL INSTRUMENTS MARKET, BY DISTRIBUTION CHANNEL
12.1 OVERVIEW
12.2 DIRECT TENDER
12.3 THIRD PARTY DISTRIBUTORS
12.4 OTHERS
13 ASIA PACIFIC DENTAL INSTRUMENTS MARKET, BY REGION
13.1 ASIA-PACIFIC
13.1.1 CHINA
13.1.2 INDIA
13.1.3 JAPAN
13.1.4 SOUTH KOREA
13.1.5 INDONESIA
13.1.6 PHILIPPINES
13.1.7 AUSTRALIA
13.1.8 THAILAND
13.1.9 VIETNAM
13.1.10 MALAYSIA
13.1.11 SINGAPORE
13.1.12 REST OF ASIA-PACIFIC
14 ASIA PACIFIC DENTAL INSTRUMENTS MARKET, COMPANY LANDSCAPE
14.1 COMPANY SHARE ANALYSIS: ASIA PACIFIC
15 SWOT ANALYSIS
16 COMPANY PROFILE
16.1 COLTENE GROUP
16.1.1 COMPANY SNAPSHOT
16.1.1 RECENT FINANCIALS
16.1.2 COMPANY SHARE ANALYSIS
16.1.3 PRODUCT PORTFOLIO
16.1.4 RECENT DEVELOPMENT
16.2 DENTSPLY SIRONA
16.2.1 COMPANY SNAPSHOT
16.2.2 RECENT FINANCIALS
16.2.3 COMPANY SHARE ANALYSIS
16.2.4 PRODUCT PORTFOLIO
16.2.5 RECENT DEVELOPMENTS
16.3 NAKANISHI INC.
16.3.1 COMPANY SNAPSHOT
16.3.2 COMPANY SHARE ANALYSIS
16.3.3 PRODUCT PORTFOLIO
16.3.4 RECENT DEVELOPMENTS
16.4 PREMIER DENTAL CO.
16.4.1 COMPANY SNAPSHOT
16.4.2 COMPANY SHARE ANALYSIS
16.4.3 PRODUCT PORTFOLIO
16.4.4 RECENT DEVELOPMENT
16.5 BRASELLER USA
16.5.1 COMPANY SNAPSHOT
16.5.2 COMPANY SHARE ANALYSIS
16.5.3 PRODUCT PORTFOLIO
16.5.4 RECENT DEVELOPMENT
16.6 INTEGRA LIFESCIENCES
16.6.1 COMPANY SNAPSHOT
16.6.2 RECENT FINANCIALS
16.6.3 PRODUCT PORTFOLIO
16.6.4 RECENT DEVELOPMENT
16.7 A-DEC, INC.
16.7.1 COMPANY SNAPSHOT
16.7.2 PRODUCT PORTFOLIO
16.7.3 RECENT DEVELOPMENTS
16.8 B. BRAUN MELSUNGEN AG
16.8.1 COMPANY SNAPSHOT
16.8.2 PRODUCT PORTFOLIO
16.8.3 RECENT DEVELOPMENT
16.9 BERMAN DENTAL INSTRUMENTS
16.9.1 COMPANY SNAPSHOT
16.9.2 PRODUCT PORTFOLIO
16.9.3 RECENT DEVELOPMENT
16.1 DANIEL KURTEN GMBH & CO. KG
16.10.1 COMPANY SNAPSHOT
16.10.2 PRODUCT PORTFOLIO
16.10.3 RECENT DEVELOPMENTS
16.11 DEVEMED GMBH
16.11.1 COMPANY SNAPSHOT
16.11.2 PRODUCT PORTFOLIO
16.11.3 RECENT DEVELOPMENT
16.12 ESSENTIAL DENTAL SYSTEMS, INC.
16.12.1 COMPANY SNAPSHOT
16.12.2 PRODUCT PORTFOLIO
16.12.3 RECENT DEVELOPMENT
16.13 GOLDMAN DENTAL
16.13.1 COMPANY SNAPSHOT
16.13.2 PRODUCT PORTFOLIO
16.13.3 RECENT DEVELOPMENT
16.14 HELMUT ZEPF MEDIZINTECHNIK GMBH
16.14.1 COMPANY SNAPSHOT
16.14.2 PRODUCT PORTFOLIO
16.14.3 RECENT DEVELOPMENT
16.15 HU-FRIEDY MFG. CO., LLC
16.15.1 COMPANY SNAPSHOT
16.15.2 PRODUCT PORTFOLIO
16.15.3 RECENT DEVELOPMENTS
16.16 INDOSURGICALS PRIVATE LIMITED
16.16.1 COMPANY SNAPSHOT
16.16.2 PRODUCT PORTFOLIO
16.16.3 RECENT DEVELOPMENT
16.17 KERR CORPORATION
16.17.1 COMPANY SNAPSHOT
16.17.2 PRODUCT PORTFOLIO
16.17.3 RECENT DEVELOPMENTS
16.18 LM-INSTRUMENTS OY
16.18.1 COMPANY SNAPSHOT
16.18.2 PRODUCT PORTFOLIO
16.18.3 RECENT DEVELOPMENT
16.19 3M
16.19.1 COMPANY SNAPSHOT
16.19.2 RECENT FINANCIALS
16.19.3 PRODUCT PORTFOLIO
16.19.4 RECENT DEVELOPMENT
16.2 METRON OPTICS, INC.
16.20.1 COMPANY SNAPSHOT
16.20.2 PRODUCT PORTFOLIO
16.20.3 RECENT DEVELOPMENT
16.21 NARANG MEDICAL LIMITED
16.21.1 COMPANY SNAPSHOT
16.21.2 PRODUCT PORTFOLIO
16.21.3 RECENT DEVELOPMENT
16.22 NTI-KAHLA GMBH
16.22.1 COMPANY SNAPSHOT
16.22.2 PRODUCT PORTFOLIO
16.22.3 RECENT DEVELOPMENT
16.23 PDT, INC.
16.23.1 COMPANY SNAPSHOT
16.23.2 PRODUCT PORTFOLIO
16.23.3 RECENT DEVELOPMENT
16.24 SURGIMAC
16.24.1 COMPANY SNAPSHOT
16.24.2 PRODUCT PORTFOLIO
16.24.3 RECENT DEVELOPMENT
16.25 TECHNODENT EXIM INDIA PVT. LTD.
16.25.1 COMPANY SNAPSHOT
16.25.2 PRODUCT PORTFOLIO
16.25.3 RECENT DEVELOPMENT
16.26 VDW GMBH
16.26.1 COMPANY SNAPSHOT
16.26.2 PRODUCT PORTFOLIO
16.26.3 RECENT DEVELOPMENT
17 QUESTIONNAIRE
18 RELATED REPORTS
List of Table
TABLE 1 DENTAL TREATMENT COST IN U.K.
TABLE 2 ASIA PACIFIC DENTAL INSTRUMENTS MARKET, BY PRODUCT, 2019-2028 (USD THOUSAND)
TABLE 3 ASIA PACIFIC PERIO/ORAL SURGERY IN DENTAL INSTRUMENTS MARKET, BY REGION, 2019-2028 (USD THOUSAND)
TABLE 4 ASIA PACIFIC PERIO/ORAL SURGERY IN DENTAL INSTRUMENTS MARKET, BY PRODUCT, 2019-2028 (USD THOUSAND)
TABLE 5 ASIA PACIFIC TISSUE PLIERS IN DENTAL INSTRUMENTS MARKET, BY PRODUCT, 2019-2028 (USD THOUSAND)
TABLE 6 ASIA PACIFIC SCISSORS IN DENTAL INSTRUMENTS MARKET, BY PRODUCT, 2019-2028 (USD THOUSAND)
TABLE 7 ASIA PACIFIC HYGIENE IN DENTAL INSTRUMENTS MARKET, BY REGION, 2019-2028 (USD THOUSAND)
TABLE 8 ASIA PACIFIC HYGIENE IN DENTAL INSTRUMENTS MARKET, BY PRODUCT, 2019-2028 (USD THOUSAND)
TABLE 9 ASIA PACIFIC DIAGNOSTIC IN DENTAL INSTRUMENTS MARKET, BY REGION, 2019-2028 (USD THOUSAND)
TABLE 10 ASIA PACIFIC DIAGNOSTIC IN DENTAL INSTRUMENTS MARKET, BY PRODUCT, 2019-2028 (USD THOUSAND)
TABLE 11 ASIA PACIFIC EXPLORERS IN DENTAL INSTRUMENTS MARKET, BY PRODUCT, 2019-2028 (USD THOUSAND)
TABLE 12 ASIA PACIFIC ENDODONTIC IN DENTAL INSTRUMENTS MARKET, BY REGION, 2019-2028 (USD THOUSAND)
TABLE 13 ASIA PACIFIC ENDODONTIC IN DENTAL INSTRUMENTS MARKET, BY PRODUCT, 2019-2028 (USD THOUSAND)
TABLE 14 ASIA PACIFIC SPREADERS IN DENTAL INSTRUMENTS MARKET, BY PRODUCT, 2019-2028 (USD THOUSAND)
TABLE 15 ASIA PACIFIC OPERATIVE IN DENTAL INSTRUMENTS MARKET, BY REGION, 2019-2028 (USD THOUSAND)
TABLE 16 ASIA PACIFIC OPERATIVE IN DENTAL INSTRUMENTS MARKET, BY PRODUCT, 2019-2028 (USD THOUSAND)
TABLE 17 ASIA PACIFIC DENTAL INSTRUMENTS MARKET, BY INSTRUMENT TYPE, 2019-2028 (USD THOUSAND)
TABLE 18 ASIA PACIFIC EXAMINATION INSTRUMENTS IN DENTAL INSTRUMENTS MARKET, BY REGION, 2019-2028 (USD THOUSAND)
TABLE 19 ASIA PACIFIC CUTTING INSTRUMENTS IN DENTAL INSTRUMENTS MARKET, BY REGION, 2019-2028 (USD THOUSAND)
TABLE 20 ASIA PACIFIC OTHERS IN DENTAL INSTRUMENTS MARKET, BY REGION, 2019-2028 (USD THOUSAND)
TABLE 21 ASIA PACIFIC DENTAL INSTRUMENTS MARKET, BY END USER, 2019-2028 (USD THOUSAND)
TABLE 22 ASIA PACIFIC HOSPITALS IN DENTAL INSTRUMENTS MARKET, BY REGION, 2019-2028 (USD THOUSAND)
TABLE 23 ASIA PACIFIC CLINICS IN DENTAL INSTRUMENTS MARKET, BY REGION, 2019-2028 (USD THOUSAND)
TABLE 24 ASIA PACIFIC DENTAL LABORATORIES IN DENTAL INSTRUMENTS MARKET, BY REGION, 2019-2028 (USD THOUSAND)
TABLE 25 ASIA PACIFIC SCIENTIFIC RESEARCH IN DENTAL INSTRUMENTS MARKET, BY REGION, 2019-2028 (USD THOUSAND)
TABLE 26 ASIA PACIFIC OTHERS IN DENTAL INSTRUMENTS MARKET, BY REGION, 2019-2028 (USD THOUSAND)
TABLE 27 ASIA PACIFIC DENTAL INSTRUMENTS MARKET, BY DISTRIBUTION CHANNEL, 2019-2028 (USD THOUSAND)
TABLE 28 ASIA PACIFIC DIRECT TENDER IN DENTAL INSTRUMENTS MARKET, BY REGION, 2019-2028 (USD THOUSAND)
TABLE 29 ASIA PACIFIC THIRD PARTY DISTRIBUTORS IN DENTAL INSTRUMENTS MARKET, BY REGION, 2019-2028 (USD THOUSAND)
TABLE 30 ASIA PACIFIC OTHERS IN DENTAL INSTRUMENTS MARKET, BY REGION, 2019-2028 (USD THOUSAND)
TABLE 31 ASIA-PACIFIC DENTAL INSTRUMENTS MARKET, BY COUNTRY, 2019-2028 (USD THOUSAND)
TABLE 32 ASIA-PACIFIC DENTAL INSTRUMENTS MARKET, BY PRODUCT, 2019-2028 (USD THOUSAND)
TABLE 33 ASIA-PACIFIC PERIO/ORAL SURGERY IN DENTAL INSTRUMENTS MARKET, BY PRODUCT, 2019-2028 (USD THOUSAND)
TABLE 34 ASIA-PACIFIC SCISSORS IN DENTAL INSTRUMENTS MARKET, BY PRODUCT, 2019-2028 (USD THOUSAND)
TABLE 35 ASIA-PACIFIC TISSUE PLIERS IN DENTAL INSTRUMENTS MARKET, BY PRODUCT, 2019-2028 (USD THOUSAND)
TABLE 36 ASIA-PACIFIC HYGIENE IN DENTAL INSTRUMENTS MARKET, BY PRODUCT, 2019-2028 (USD THOUSAND)
TABLE 37 ASIA-PACIFIC DIAGNOSTIC IN DENTAL INSTRUMENTS MARKET, BY PRODUCT, 2019-2028 (USD THOUSAND)
TABLE 38 ASIA-PACIFIC EXPLORERS IN DENTAL INSTRUMENTS MARKET, BY PRODUCT, 2019-2028 (USD THOUSAND)
TABLE 39 ASIA-PACIFIC ENDODONTIC IN DENTAL INSTRUMENTS MARKET, BY PRODUCT, 2019-2028 (USD THOUSAND)
TABLE 40 ASIA-PACIFIC SPREADERS IN DENTAL INSTRUMENTS MARKET, BY PRODUCT, 2019-2028 (USD THOUSAND)
TABLE 41 ASIA-PACIFIC OPERATIVE IN DENTAL INSTRUMENTS MARKET, BY PRODUCT, 2019-2028 (USD THOUSAND)
TABLE 42 ASIA-PACIFIC DENTAL INSTRUMENTS MARKET, BY INSTRUMENT TYPE, 2019-2028 (USD THOUSAND)
TABLE 43 ASIA-PACIFIC DENTAL INSTRUMENTS, BY END USER, 2019-2028 (USD THOUSAND)
TABLE 44 ASIA-PACIFIC DENTAL INSTRUMENTS MARKET, BY DISTRIBUTION CHANNEL, 2019-2028 (USD THOUSAND)
TABLE 45 CHINA DENTAL INSTRUMENTS MARKET, BY PRODUCT, 2019-2028 (USD THOUSAND)
TABLE 46 CHINA PERIO/ORAL SURGERY IN DENTAL INSTRUMENTS MARKET, BY PRODUCT, 2019-2028 (USD THOUSAND)
TABLE 47 CHINA SCISSORS IN DENTAL INSTRUMENTS MARKET, BY PRODUCT, 2019-2028 (USD THOUSAND)
TABLE 48 CHINA TISSUE PLIERS IN DENTAL INSTRUMENTS MARKET, BY PRODUCT, 2019-2028 (USD THOUSAND)
TABLE 49 CHINA HYGIENE IN DENTAL INSTRUMENTS MARKET, BY PRODUCT, 2019-2028 (USD THOUSAND)
TABLE 50 CHINA DIAGNOSTIC IN DENTAL INSTRUMENTS MARKET, BY PRODUCT, 2019-2028 (USD THOUSAND)
TABLE 51 CHINA EXPLORERS IN DENTAL INSTRUMENTS MARKET, BY PRODUCT, 2019-2028 (USD THOUSAND)
TABLE 52 CHINA ENDODONTIC IN DENTAL INSTRUMENTS MARKET, BY PRODUCT, 2019-2028 (USD THOUSAND)
TABLE 53 CHINA SPREADERS IN DENTAL INSTRUMENTS MARKET, BY PRODUCT, 2019-2028 (USD THOUSAND)
TABLE 54 CHINA OPERATIVE IN DENTAL INSTRUMENTS MARKET, BY PRODUCT, 2019-2028 (USD THOUSAND)
TABLE 55 CHINA DENTAL INSTRUMENTS MARKET, BY INSTRUMENT TYPE, 2019-2028 (USD THOUSAND)
TABLE 56 CHINA DENTAL INSTRUMENTS, BY END USER, 2019-2028 (USD THOUSAND)
TABLE 57 CHINA DENTAL INSTRUMENTS MARKET, BY DISTRIBUTION CHANNEL, 2019-2028 (USD THOUSAND)
TABLE 58 INDIA DENTAL INSTRUMENTS MARKET, BY PRODUCT, 2019-2028 (USD THOUSAND)
TABLE 59 INDIA PERIO/ORAL SURGERY IN DENTAL INSTRUMENTS MARKET, BY PRODUCT, 2019-2028 (USD THOUSAND)
TABLE 60 INDIA SCISSORS IN DENTAL INSTRUMENTS MARKET, BY PRODUCT, 2019-2028 (USD THOUSAND)
TABLE 61 INDIA TISSUE PLIERS IN DENTAL INSTRUMENTS MARKET, BY PRODUCT, 2019-2028 (USD THOUSAND)
TABLE 62 INDIA HYGIENE IN DENTAL INSTRUMENTS MARKET, BY PRODUCT, 2019-2028 (USD THOUSAND)
TABLE 63 INDIA DIAGNOSTIC IN DENTAL INSTRUMENTS MARKET, BY PRODUCT, 2019-2028 (USD THOUSAND)
TABLE 64 INDIA EXPLORERS IN DENTAL INSTRUMENTS MARKET, BY PRODUCT, 2019-2028 (USD THOUSAND)
TABLE 65 INDIA ENDODONTIC IN DENTAL INSTRUMENTS MARKET, BY PRODUCT, 2019-2028 (USD THOUSAND)
TABLE 66 INDIA SPREADERS IN DENTAL INSTRUMENTS MARKET, BY PRODUCT, 2019-2028 (USD THOUSAND)
TABLE 67 INDIA OPERATIVE IN DENTAL INSTRUMENTS MARKET, BY PRODUCT, 2019-2028 (USD THOUSAND)
TABLE 68 INDIA DENTAL INSTRUMENTS MARKET, BY INSTRUMENT TYPE, 2019-2028 (USD THOUSAND)
TABLE 69 INDIA DENTAL INSTRUMENTS, BY END USER, 2019-2028 (USD THOUSAND)
TABLE 70 INDIA DENTAL INSTRUMENTS MARKET, BY DISTRIBUTION CHANNEL, 2019-2028 (USD THOUSAND)
TABLE 71 JAPAN DENTAL INSTRUMENTS MARKET, BY PRODUCT, 2019-2028 (USD THOUSAND)
TABLE 72 JAPAN PERIO/ORAL SURGERY IN DENTAL INSTRUMENTS MARKET, BY PRODUCT, 2019-2028 (USD THOUSAND)
TABLE 73 JAPAN SCISSORS IN DENTAL INSTRUMENTS MARKET, BY PRODUCT, 2019-2028 (USD THOUSAND)
TABLE 74 JAPAN TISSUE PLIERS IN DENTAL INSTRUMENTS MARKET, BY PRODUCT, 2019-2028 (USD THOUSAND)
TABLE 75 JAPAN HYGIENE IN DENTAL INSTRUMENTS MARKET, BY PRODUCT, 2019-2028 (USD THOUSAND)
TABLE 76 JAPAN DIAGNOSTIC IN DENTAL INSTRUMENTS MARKET, BY PRODUCT, 2019-2028 (USD THOUSAND)
TABLE 77 JAPAN EXPLORERS IN DENTAL INSTRUMENTS MARKET, BY PRODUCT, 2019-2028 (USD THOUSAND)
TABLE 78 JAPAN ENDODONTIC IN DENTAL INSTRUMENTS MARKET, BY PRODUCT, 2019-2028 (USD THOUSAND)
TABLE 79 JAPAN SPREADERS IN DENTAL INSTRUMENTS MARKET, BY PRODUCT, 2019-2028 (USD THOUSAND)
TABLE 80 JAPAN OPERATIVE IN DENTAL INSTRUMENTS MARKET, BY PRODUCT, 2019-2028 (USD THOUSAND)
TABLE 81 JAPAN DENTAL INSTRUMENTS MARKET, BY INSTRUMENT TYPE, 2019-2028 (USD THOUSAND)
TABLE 82 JAPAN DENTAL INSTRUMENTS, BY END USER, 2019-2028 (USD THOUSAND)
TABLE 83 JAPAN DENTAL INSTRUMENTS MARKET, BY DISTRIBUTION CHANNEL, 2019-2028 (USD THOUSAND)
TABLE 84 SOUTH KOREA DENTAL INSTRUMENTS MARKET, BY PRODUCT, 2019-2028 (USD THOUSAND)
TABLE 85 SOUTH KOREA PERIO/ORAL SURGERY IN DENTAL INSTRUMENTS MARKET, BY PRODUCT, 2019-2028 (USD THOUSAND)
TABLE 86 SOUTH KOREA SCISSORS IN DENTAL INSTRUMENTS MARKET, BY PRODUCT, 2019-2028 (USD THOUSAND)
TABLE 87 SOUTH KOREA TISSUE PLIERS IN DENTAL INSTRUMENTS MARKET, BY PRODUCT, 2019-2028 (USD THOUSAND)
TABLE 88 SOUTH KOREA HYGIENE IN DENTAL INSTRUMENTS MARKET, BY PRODUCT, 2019-2028 (USD THOUSAND)
TABLE 89 SOUTH KOREA DIAGNOSTIC IN DENTAL INSTRUMENTS MARKET, BY PRODUCT, 2019-2028 (USD THOUSAND)
TABLE 90 SOUTH KOREA EXPLORERS IN DENTAL INSTRUMENTS MARKET, BY PRODUCT, 2019-2028 (USD THOUSAND)
TABLE 91 SOUTH KOREA ENDODONTIC IN DENTAL INSTRUMENTS MARKET, BY PRODUCT, 2019-2028 (USD THOUSAND)
TABLE 92 SOUTH KOREA SPREADERS IN DENTAL INSTRUMENTS MARKET, BY PRODUCT, 2019-2028 (USD THOUSAND)
TABLE 93 SOUTH KOREA OPERATIVE IN DENTAL INSTRUMENTS MARKET, BY PRODUCT, 2019-2028 (USD THOUSAND)
TABLE 94 SOUTH KOREA DENTAL INSTRUMENTS MARKET, BY INSTRUMENT TYPE, 2019-2028 (USD THOUSAND)
TABLE 95 SOUTH KOREA DENTAL INSTRUMENTS, BY END USER, 2019-2028 (USD THOUSAND)
TABLE 96 SOUTH KOREA DENTAL INSTRUMENTS MARKET, BY DISTRIBUTION CHANNEL, 2019-2028 (USD THOUSAND)
TABLE 97 INDONESIA DENTAL INSTRUMENTS MARKET, BY PRODUCT, 2019-2028 (USD THOUSAND)
TABLE 98 INDONESIA PERIO/ORAL SURGERY IN DENTAL INSTRUMENTS MARKET, BY PRODUCT, 2019-2028 (USD THOUSAND)
TABLE 99 INDONESIA SCISSORS IN DENTAL INSTRUMENTS MARKET, BY PRODUCT, 2019-2028 (USD THOUSAND)
TABLE 100 INDONESIA TISSUE PLIERS IN DENTAL INSTRUMENTS MARKET, BY PRODUCT, 2019-2028 (USD THOUSAND)
TABLE 101 INDONESIA HYGIENE IN DENTAL INSTRUMENTS MARKET, BY PRODUCT, 2019-2028 (USD THOUSAND)
TABLE 102 INDONESIA DIAGNOSTIC IN DENTAL INSTRUMENTS MARKET, BY PRODUCT, 2019-2028 (USD THOUSAND)
TABLE 103 INDONESIA EXPLORERS IN DENTAL INSTRUMENTS MARKET, BY PRODUCT, 2019-2028 (USD THOUSAND)
TABLE 104 INDONESIA ENDODONTIC IN DENTAL INSTRUMENTS MARKET, BY PRODUCT, 2019-2028 (USD THOUSAND)
TABLE 105 INDONESIA SPREADERS IN DENTAL INSTRUMENTS MARKET, BY PRODUCT, 2019-2028 (USD THOUSAND)
TABLE 106 INDONESIA OPERATIVE IN DENTAL INSTRUMENTS MARKET, BY PRODUCT, 2019-2028 (USD THOUSAND)
TABLE 107 INDONESIA DENTAL INSTRUMENTS MARKET, BY INSTRUMENT TYPE, 2019-2028 (USD THOUSAND)
TABLE 108 INDONESIA DENTAL INSTRUMENTS, BY END USER, 2019-2028 (USD THOUSAND)
TABLE 109 INDONESIA DENTAL INSTRUMENTS MARKET, BY DISTRIBUTION CHANNEL, 2019-2028 (USD THOUSAND)
TABLE 110 PHILIPPINES DENTAL INSTRUMENTS MARKET, BY PRODUCT, 2019-2028 (USD THOUSAND)
TABLE 111 PHILIPPINES PERIO/ORAL SURGERY IN DENTAL INSTRUMENTS MARKET, BY PRODUCT, 2019-2028 (USD THOUSAND)
TABLE 112 PHILIPPINES SCISSORS IN DENTAL INSTRUMENTS MARKET, BY PRODUCT, 2019-2028 (USD THOUSAND)
TABLE 113 PHILIPPINES TISSUE PLIERS IN DENTAL INSTRUMENTS MARKET, BY PRODUCT, 2019-2028 (USD THOUSAND)
TABLE 114 PHILIPPINES HYGIENE IN DENTAL INSTRUMENTS MARKET, BY PRODUCT, 2019-2028 (USD THOUSAND)
TABLE 115 PHILIPPINES DIAGNOSTIC IN DENTAL INSTRUMENTS MARKET, BY PRODUCT, 2019-2028 (USD THOUSAND)
TABLE 116 PHILIPPINES EXPLORERS IN DENTAL INSTRUMENTS MARKET, BY PRODUCT, 2019-2028 (USD THOUSAND)
TABLE 117 PHILIPPINES ENDODONTIC IN DENTAL INSTRUMENTS MARKET, BY PRODUCT, 2019-2028 (USD THOUSAND)
TABLE 118 PHILIPPINES SPREADERS IN DENTAL INSTRUMENTS MARKET, BY PRODUCT, 2019-2028 (USD THOUSAND)
TABLE 119 PHILIPPINES OPERATIVE IN DENTAL INSTRUMENTS MARKET, BY PRODUCT, 2019-2028 (USD THOUSAND)
TABLE 120 PHILIPPINES DENTAL INSTRUMENTS MARKET, BY INSTRUMENT TYPE, 2019-2028 (USD THOUSAND)
TABLE 121 PHILIPPINES DENTAL INSTRUMENTS, BY END USER, 2019-2028 (USD THOUSAND)
TABLE 122 PHILIPPINES DENTAL INSTRUMENTS MARKET, BY DISTRIBUTION CHANNEL, 2019-2028 (USD THOUSAND)
TABLE 123 AUSTRALIA DENTAL INSTRUMENTS MARKET, BY PRODUCT, 2019-2028 (USD THOUSAND)
TABLE 124 AUSTRALIA PERIO/ORAL SURGERY IN DENTAL INSTRUMENTS MARKET, BY PRODUCT, 2019-2028 (USD THOUSAND)
TABLE 125 AUSTRALIA SCISSORS IN DENTAL INSTRUMENTS MARKET, BY PRODUCT, 2019-2028 (USD THOUSAND)
TABLE 126 AUSTRALIA TISSUE PLIERS IN DENTAL INSTRUMENTS MARKET, BY PRODUCT, 2019-2028 (USD THOUSAND)
TABLE 127 AUSTRALIA HYGIENE IN DENTAL INSTRUMENTS MARKET, BY PRODUCT, 2019-2028 (USD THOUSAND)
TABLE 128 AUSTRALIA DIAGNOSTIC IN DENTAL INSTRUMENTS MARKET, BY PRODUCT, 2019-2028 (USD THOUSAND)
TABLE 129 AUSTRALIA EXPLORERS IN DENTAL INSTRUMENTS MARKET, BY PRODUCT, 2019-2028 (USD THOUSAND)
TABLE 130 AUSTRALIA ENDODONTIC IN DENTAL INSTRUMENTS MARKET, BY PRODUCT, 2019-2028 (USD THOUSAND)
TABLE 131 AUSTRALIA SPREADERS IN DENTAL INSTRUMENTS MARKET, BY PRODUCT, 2019-2028 (USD THOUSAND)
TABLE 132 AUSTRALIA OPERATIVE IN DENTAL INSTRUMENTS MARKET, BY PRODUCT, 2019-2028 (USD THOUSAND)
TABLE 133 AUSTRALIA DENTAL INSTRUMENTS MARKET, BY INSTRUMENT TYPE, 2019-2028 (USD THOUSAND)
TABLE 134 AUSTRALIA DENTAL INSTRUMENTS, BY END USER, 2019-2028 (USD THOUSAND)
TABLE 135 AUSTRALIA DENTAL INSTRUMENTS MARKET, BY DISTRIBUTION CHANNEL, 2019-2028 (USD THOUSAND)
TABLE 136 THAILAND DENTAL INSTRUMENTS MARKET, BY PRODUCT, 2019-2028 (USD THOUSAND)
TABLE 137 THAILAND PERIO/ORAL SURGERY IN DENTAL INSTRUMENTS MARKET, BY PRODUCT, 2019-2028 (USD THOUSAND)
TABLE 138 THAILAND SCISSORS IN DENTAL INSTRUMENTS MARKET, BY PRODUCT, 2019-2028 (USD THOUSAND)
TABLE 139 THAILAND TISSUE PLIERS IN DENTAL INSTRUMENTS MARKET, BY PRODUCT, 2019-2028 (USD THOUSAND)
TABLE 140 THAILAND HYGIENE IN DENTAL INSTRUMENTS MARKET, BY PRODUCT, 2019-2028 (USD THOUSAND)
TABLE 141 THAILAND DIAGNOSTIC IN DENTAL INSTRUMENTS MARKET, BY PRODUCT, 2019-2028 (USD THOUSAND)
TABLE 142 THAILAND EXPLORERS IN DENTAL INSTRUMENTS MARKET, BY PRODUCT, 2019-2028 (USD THOUSAND)
TABLE 143 THAILAND ENDODONTIC IN DENTAL INSTRUMENTS MARKET, BY PRODUCT, 2019-2028 (USD THOUSAND)
TABLE 144 THAILAND SPREADERS IN DENTAL INSTRUMENTS MARKET, BY PRODUCT, 2019-2028 (USD THOUSAND)
TABLE 145 THAILAND OPERATIVE IN DENTAL INSTRUMENTS MARKET, BY PRODUCT, 2019-2028 (USD THOUSAND)
TABLE 146 THAILAND DENTAL INSTRUMENTS MARKET, BY INSTRUMENT TYPE, 2019-2028 (USD THOUSAND)
TABLE 147 THAILAND DENTAL INSTRUMENTS, BY END USER, 2019-2028 (USD THOUSAND)
TABLE 148 THAILAND DENTAL INSTRUMENTS MARKET, BY DISTRIBUTION CHANNEL, 2019-2028 (USD THOUSAND)
TABLE 149 VIETNAM DENTAL INSTRUMENTS MARKET, BY PRODUCT, 2019-2028 (USD THOUSAND)
TABLE 150 VIETNAM PERIO/ORAL SURGERY IN DENTAL INSTRUMENTS MARKET, BY PRODUCT, 2019-2028 (USD THOUSAND)
TABLE 151 VIETNAM SCISSORS IN DENTAL INSTRUMENTS MARKET, BY PRODUCT, 2019-2028 (USD THOUSAND)
TABLE 152 VIETNAM TISSUE PLIERS IN DENTAL INSTRUMENTS MARKET, BY PRODUCT, 2019-2028 (USD THOUSAND)
TABLE 153 VIETNAM HYGIENE IN DENTAL INSTRUMENTS MARKET, BY PRODUCT, 2019-2028 (USD THOUSAND)
TABLE 154 VIETNAM DIAGNOSTIC IN DENTAL INSTRUMENTS MARKET, BY PRODUCT, 2019-2028 (USD THOUSAND)
TABLE 155 VIETNAM EXPLORERS IN DENTAL INSTRUMENTS MARKET, BY PRODUCT, 2019-2028 (USD THOUSAND)
TABLE 156 VIETNAM ENDODONTIC IN DENTAL INSTRUMENTS MARKET, BY PRODUCT, 2019-2028 (USD THOUSAND)
TABLE 157 VIETNAM SPREADERS IN DENTAL INSTRUMENTS MARKET, BY PRODUCT, 2019-2028 (USD THOUSAND)
TABLE 158 VIETNAM OPERATIVE IN DENTAL INSTRUMENTS MARKET, BY PRODUCT, 2019-2028 (USD THOUSAND)
TABLE 159 VIETNAM DENTAL INSTRUMENTS MARKET, BY INSTRUMENT TYPE, 2019-2028 (USD THOUSAND)
TABLE 160 VIETNAM DENTAL INSTRUMENTS, BY END USER, 2019-2028 (USD THOUSAND)
TABLE 161 VIETNAM DENTAL INSTRUMENTS MARKET, BY DISTRIBUTION CHANNEL, 2019-2028 (USD THOUSAND)
TABLE 162 MALAYSIA DENTAL INSTRUMENTS MARKET, BY PRODUCT, 2019-2028 (USD THOUSAND)
TABLE 163 MALAYSIA PERIO/ORAL SURGERY IN DENTAL INSTRUMENTS MARKET, BY PRODUCT, 2019-2028 (USD THOUSAND)
TABLE 164 MALAYSIA SCISSORS IN DENTAL INSTRUMENTS MARKET, BY PRODUCT, 2019-2028 (USD THOUSAND)
TABLE 165 MALAYSIA TISSUE PLIERS IN DENTAL INSTRUMENTS MARKET, BY PRODUCT, 2019-2028 (USD THOUSAND)
TABLE 166 MALAYSIA HYGIENE IN DENTAL INSTRUMENTS MARKET, BY PRODUCT, 2019-2028 (USD THOUSAND)
TABLE 167 MALAYSIA DIAGNOSTIC IN DENTAL INSTRUMENTS MARKET, BY PRODUCT, 2019-2028 (USD THOUSAND)
TABLE 168 MALAYSIA EXPLORERS IN DENTAL INSTRUMENTS MARKET, BY PRODUCT, 2019-2028 (USD THOUSAND)
TABLE 169 MALAYSIA ENDODONTIC IN DENTAL INSTRUMENTS MARKET, BY PRODUCT, 2019-2028 (USD THOUSAND)
TABLE 170 MALAYSIA SPREADERS IN DENTAL INSTRUMENTS MARKET, BY PRODUCT, 2019-2028 (USD THOUSAND)
TABLE 171 MALAYSIA OPERATIVE IN DENTAL INSTRUMENTS MARKET, BY PRODUCT, 2019-2028 (USD THOUSAND)
TABLE 172 MALAYSIA DENTAL INSTRUMENTS MARKET, BY INSTRUMENT TYPE, 2019-2028 (USD THOUSAND)
TABLE 173 MALAYSIA DENTAL INSTRUMENTS, BY END USER, 2019-2028 (USD THOUSAND)
TABLE 174 MALAYSIA DENTAL INSTRUMENTS MARKET, BY DISTRIBUTION CHANNEL, 2019-2028 (USD THOUSAND)
TABLE 175 SINGAPORE DENTAL INSTRUMENTS MARKET, BY PRODUCT, 2019-2028 (USD THOUSAND)
TABLE 176 SINGAPORE PERIO/ORAL SURGERY IN DENTAL INSTRUMENTS MARKET, BY PRODUCT, 2019-2028 (USD THOUSAND)
TABLE 177 SINGAPORE SCISSORS IN DENTAL INSTRUMENTS MARKET, BY PRODUCT, 2019-2028 (USD THOUSAND)
TABLE 178 SINGAPORE TISSUE PLIERS IN DENTAL INSTRUMENTS MARKET, BY PRODUCT, 2019-2028 (USD THOUSAND)
TABLE 179 SINGAPORE HYGIENE IN DENTAL INSTRUMENTS MARKET, BY PRODUCT, 2019-2028 (USD THOUSAND)
TABLE 180 SINGAPORE DIAGNOSTIC IN DENTAL INSTRUMENTS MARKET, BY PRODUCT, 2019-2028 (USD THOUSAND)
TABLE 181 SINGAPORE EXPLORERS IN DENTAL INSTRUMENTS MARKET, BY PRODUCT, 2019-2028 (USD THOUSAND)
TABLE 182 SINGAPORE ENDODONTIC IN DENTAL INSTRUMENTS MARKET, BY PRODUCT, 2019-2028 (USD THOUSAND)
TABLE 183 SINGAPORE SPREADERS IN DENTAL INSTRUMENTS MARKET, BY PRODUCT, 2019-2028 (USD THOUSAND)
TABLE 184 SINGAPORE OPERATIVE IN DENTAL INSTRUMENTS MARKET, BY PRODUCT, 2019-2028 (USD THOUSAND)
TABLE 185 SINGAPORE DENTAL INSTRUMENTS MARKET, BY INSTRUMENT TYPE, 2019-2028 (USD THOUSAND)
TABLE 186 SINGAPORE DENTAL INSTRUMENTS, BY END USER, 2019-2028 (USD THOUSAND)
TABLE 187 SINGAPORE DENTAL INSTRUMENTS MARKET, BY DISTRIBUTION CHANNEL, 2019-2028 (USD THOUSAND)
TABLE 188 REST OF ASIA-PACIFIC DENTAL INSTRUMENTS MARKET, BY PRODUCT, 2019-2028 (USD THOUSAND)
List of Figure
FIGURE 1 ASIA PACIFIC DENTAL INSTRUMENTS MARKET: SEGMENTATION
FIGURE 2 ASIA PACIFIC DENTAL INSTRUMENTS MARKET: DATA TRIANGULATION
FIGURE 3 ASIA PACIFIC DENTAL INSTRUMENTS MARKET: DROC ANALYSIS
FIGURE 4 ASIA PACIFIC DENTAL INSTRUMENTS MARKET : ASIA PACIFIC VS REGIONAL MARKET ANALYSIS
FIGURE 5 ASIA PACIFIC DENTAL INSTRUMENTS MARKET : COMPANY RESEARCH ANALYSIS
FIGURE 6 ASIA PACIFIC DENTAL INSTRUMENTS MARKET: INTERVIEW DEMOGRAPHICS
FIGURE 7 ASIA PACIFIC DENTAL INSTRUMENTS MARKET: DBMR MARKET POSITION GRID
FIGURE 8 ASIA PACIFIC DENTAL INSTRUMENTS MARKET: MARKET END USER COVERAGE GRID
FIGURE 9 ASIA PACIFIC DENTAL INSTRUMENTS MARKET: VENDOR SHARE ANALYSIS
FIGURE 10 ASIA PACIFIC DENTAL INSTRUMENTS MARKET: SEGMENTATION
FIGURE 11 THE HIGH PREVALENCE OF DENTAL DISORDERS AND RISE IN PER CAPITAL INCOME WITH INCREASE IN DENTAL EXPENDITURE IS EXPECTED TO DRIVE THE ASIA PACIFIC DENTAL INSTRUMENTS MARKET IN THE FORECAST PERIOD OF 2021 TO 2028
FIGURE 12 PERIO/ORAL SURGERY SEGMENT IS EXPECTED TO ACCOUNT FOR THE LARGEST SHARE OF THE ASIA PACIFIC DENTAL INSTRUMENTS MARKET IN 2021 & 2028
FIGURE 13 NORTH AMERICA IS EXPECTED TO DOMINATE THE ASIA PACIFIC DENTAL INSTRUMENTS MARKET AND ASIA-PACIFIC IS EXPECTED TO GROW WITH THE HIGHEST CAGR IN THE FORECAST PERIOD OF 2021 TO 2028
FIGURE 14 DRIVERS, RESTRAINTS, OPPORTUNITIES AND CHALLENGES OF THE ASIA PACIFIC DENTAL INSTRUMENTS MARKET
FIGURE 15 PREVALENCE OF CARIES IN PERMANENT TEETH (IN %), IN U.S.
FIGURE 16 AGING POPULATION IN THE WORLD (IN MILLIONS)
FIGURE 17 ASIA PACIFIC DENTAL INSTRUMENTS MARKET: BY PRODUCT, 2020
FIGURE 18 ASIA PACIFIC DENTAL INSTRUMENTS MARKET: BY PRODUCT, 2019 TO 2028 (USD THOUSAND)
FIGURE 19 ASIA PACIFIC DENTAL INSTRUMENTS MARKET: BY PRODUCT, CAGR (2021-2028)
FIGURE 20 ASIA PACIFIC DENTAL INSTRUMENTS MARKET: BY PRODUCT, LIFELINE CURVE
FIGURE 21 ASIA PACIFIC DENTAL INSTRUMENTS MARKET: BY INSTRUMENT TYPE, 2020
FIGURE 22 ASIA PACIFIC DENTAL INSTRUMENTS MARKET: BY INSTRUMENT TYPE, 2019-2028 (USD THOUSAND)
FIGURE 23 ASIA PACIFIC DENTAL INSTRUMENTS MARKET: BY INSTRUMENT TYPE, CAGR (2021-2028)
FIGURE 24 ASIA PACIFIC DENTAL INSTRUMENTS MARKET: BY INSTRUMENT TYPE, LIFELINE CURVE
FIGURE 25 ASIA PACIFIC DENTAL INSTRUMENTS MARKET: BY END USER, 2020
FIGURE 26 ASIA PACIFIC DENTAL INSTRUMENTS MARKET: BY END USER, 2019-2028 (USD THOUSAND)
FIGURE 27 ASIA PACIFIC DENTAL INSTRUMENTS MARKET: BY END USER, CAGR (2021-2028)
FIGURE 28 ASIA PACIFIC DENTAL INSTRUMENTS MARKET: BY END USER, LIFELINE CURVE
FIGURE 29 ASIA PACIFIC DENTAL INSTRUMENTS MARKET: BY DISTRIBUTION CHANNEL, 2020
FIGURE 30 ASIA PACIFIC DENTAL INSTRUMENTS MARKET: BY DISTRIBUTION CHANNEL, 2019-2028 (USD THOUSAND)
FIGURE 31 ASIA PACIFIC DENTAL INSTRUMENTS MARKET: BY DISTRIBUTION CHANNEL, CAGR (2021-2028)
FIGURE 32 ASIA PACIFIC DENTAL INSTRUMENTS MARKET: BY DISTRIBUTION CHANNEL, LIFELINE CURVE
FIGURE 33 ASIA-PACIFIC DENTAL INSTRUMENTS MARKET: SNAPSHOT (2020)
FIGURE 34 ASIA-PACIFIC DENTAL INSTRUMENTS MARKET: BY COUNTRY (2020)
FIGURE 35 ASIA-PACIFIC DENTAL INSTRUMENTS MARKET: BY COUNTRY (2021 & 2028)
FIGURE 36 ASIA-PACIFIC DENTAL INSTRUMENTS MARKET: BY COUNTRY (2020 & 2028)
FIGURE 37 ASIA-PACIFIC DENTAL INSTRUMENTS MARKET: BY PRODUCT (2021-2028)
FIGURE 38 ASIA PACIFIC DENTAL INSTRUMENTS MARKET: COMPANY SHARE 2020 (%)
Research Methodology
Data collection and base year analysis are done using data collection modules with large sample sizes. The stage includes obtaining market information or related data through various sources and strategies. It includes examining and planning all the data acquired from the past in advance. It likewise envelops the examination of information inconsistencies seen across different information sources. The market data is analysed and estimated using market statistical and coherent models. Also, market share analysis and key trend analysis are the major success factors in the market report. To know more, please request an analyst call or drop down your inquiry.
The key research methodology used by DBMR research team is data triangulation which involves data mining, analysis of the impact of data variables on the market and primary (industry expert) validation. Data models include Vendor Positioning Grid, Market Time Line Analysis, Market Overview and Guide, Company Positioning Grid, Patent Analysis, Pricing Analysis, Company Market Share Analysis, Standards of Measurement, Global versus Regional and Vendor Share Analysis. To know more about the research methodology, drop in an inquiry to speak to our industry experts.
Customization Available
Data Bridge Market Research is a leader in advanced formative research. We take pride in servicing our existing and new customers with data and analysis that match and suits their goal. The report can be customized to include price trend analysis of target brands understanding the market for additional countries (ask for the list of countries), clinical trial results data, literature review, refurbished market and product base analysis. Market analysis of target competitors can be analyzed from technology-based analysis to market portfolio strategies. We can add as many competitors that you require data about in the format and data style you are looking for. Our team of analysts can also provide you data in crude raw excel files pivot tables (Fact book) or can assist you in creating presentations from the data sets available in the report.