Europe Clinical Trial Imaging Market Analysis and Insight
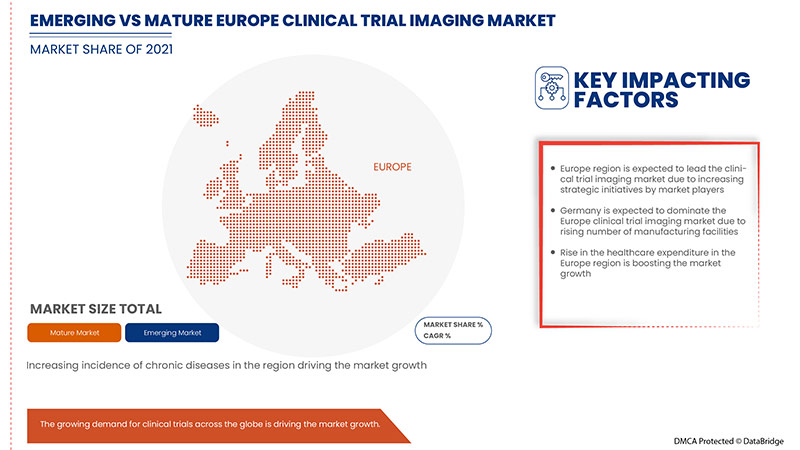
The increasing demand for imaging technology, followed by rise in the prevalence of chronic diseases due to rise in elderly population and strategic initiatives by market players such as product launch, advancement, acquisition and agreements are the factors that are expected to drive the market growth.
However, improper and unfavourable reimbursement scenarios for imaging devices and lack of well-defined standards in clinical trial imaging instruments are expected to restrain the market growth.
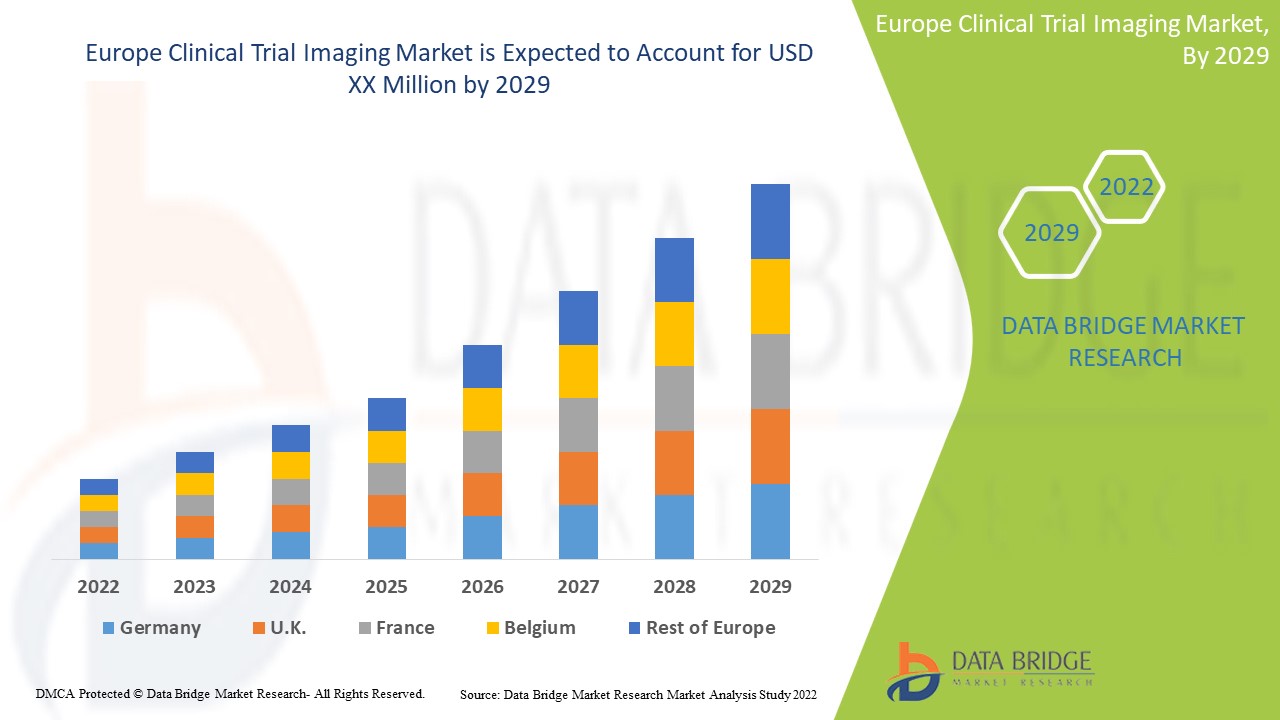
The rising technological progressions in clinical trial imaging for diagnosis and treatment of chronic diseases are expected to drive market growth. Data Bridge Market Research analyzes that the Europe clinical trial imaging market will grow at a CAGR of 7.9% during the forecast period of 2022 to 2029.
|
Report Metric |
Details |
|
Forecast Period |
2022 to 2029 |
|
Base Year |
2021 |
|
Historic Years |
2020 (Customisable to 2019-2014) |
|
Quantitative Units |
Revenue in USD Million and Pricing in USD |
|
Segments Covered |
By Product and Services (Services and Software), Modality (Computed Tomography, Magnetic Resonance Imaging, Echocardiography, Nuclear Medicine, Positron Emission Tomography, X-ray, Ultrasound, Optical Coherence Tomography and Others), Application (Oncology, Neurology, Endocrinology, Cardiology, Dermatology, Hematology and Others), End User (Pharmaceutical & Biotechnology Companies, Contract Research Organizations, Medical Device Manufacturers, Academic and Government Research Institutes and Others), Distributor (Direct Sales and Tender Sales) |
|
Countries Covered |
Germany, France, U.K., Italy, Spain, Russia, Turkey, Belgium, Netherlands, Switzerland, rest of Europe |
|
Market Players Covered |
Navitas Life Sciences, Resonance Health Analytical Services, BioTelemetry, a Philips Company, IXICO plc, ICON plc, anagram 4 clinical trials, Quotient Sciences,WORLDCARE CLINICAL, Clario, Paraxel International Corporation, Median Technologies, Perspectum, Calyx, WIRB-Copernicus Group, and Invicro.LLC among others |
Market Definition
Clinical trial is a process of developing new drugs. It is designed for potential treatment and its effects on humans. Before the commercialization of new drugs, extensive clinical testing is done to identify promising compounds, and safety tests are conducted to determine the possible risks.
In clinical trials, medical imaging plays a significant role in more accurate and effective results. Different imaging technologies may be used to elucidate and demonstrate the mechanistic actions of drugs. Clinical trial imaging is the process of clinical analysis and medical intervention by creating image representations of inner parts of the body. It has several different technologies which are used to view the human body to monitor, treat, and diagnose medical conditions.
In the coming future, important decisions related to clinical trial imaging on drug discovery will be made by individuals who not only understand the biopsy but can also use the clinical trial imaging tools and the knowledge they release to develop hypotheses and identify quality targets.
Europe Clinical Trial Imaging Market Dynamics
Drivers
- Growth in the Pharmaceutical and Imaging Industries
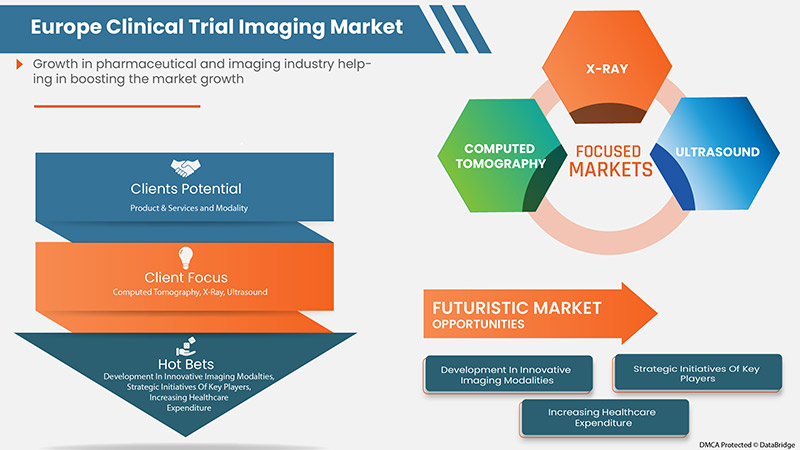
Pharmaceutical and imaging industries conduct clinical trials to evaluate the safety and efficacy of drug development. They are among the fastest growing. Currently, more than 8% annual growth rate accounts for biopharmaceuticals, which is double the growth rate as compared to conventional pharma and growth is expected to continue at that rate for the foreseeable future. The development of a new drug is intensively used in pharmaceutical and imaging companies as they are one of the most research-oriented industries.
Many pharmaceutical companies are continuing to drive efficiencies in their processes of development to reduce costs associated with the process of new drug development. Many pharmaceutical companies are increasingly looking to consolidate the number of outsourcing providers with which they engage, with many strategic arrangements of partnership with a limited number of outsourcing providers. Some pharmaceutical companies have entered into a collaboration to develop new drugs. An increase in the number of collaborations between pharmaceutical companies has led to great opportunities in research.
Different types of collaboration and agreement increase the growth of pharmaceutical and imaging industries which act as a driver for market growth.
- Rising R&D Expenditure
Imaging and pharma companies are continuously investing in R&D to offer innovative services for clinical trial imaging to customers and enhance their market presence. Medical imaging plays a dynamic role in clinical development. While the medical imaging industry is in a constant state of fluctuation due to implementation of new technologies in the market, the pharmaceutical and imaging industries continue to increase. This is attributed to enhanced investment in medical imaging companies along with mergers and acquisitions as well as the adoption of innovation in imaging technologies to support clinical trials for medical devices. Increasing R&D expenditure in pharmaceutical and biotechnological companies is fuelling market growth.
This has encouraged the development of new products and high research-oriented programs organized in biopharmaceutical industries and a high preference for the studies of human genome. Rising expenditure on R&D activities also develops new drugs and therapies to treat chronic diseases that boost market growth. This helps the pharmaceutical and biotechnological companies in the development of new technologies in the category of imaging clinical trials therefore, rising R&D expenditure is expected to drive the market growth.
Opportunities
- Rise in Healthcare Expenditure
Healthcare expenditure has increased across the world as people's disposable income in various countries is increasing. Moreover, to accomplish the population requirements, government bodies and healthcare organizations are taking the initiative by virtue of accelerating healthcare expenditure.
For instance,
- In October 2020, MedTech Europe Organization's report stated that the overall healthcare expenditure in Europe grew to reach approximately 10% of the GDP in 2020, which was 8.3% GDP in the year 2019, out of which 76.6% is spent on inpatient and outpatient care
Growing healthcare expenditure is also beneficial for further growth in the economic and healthcare sector, and it is primarily fruitful as it significantly affects the development of better and advanced medical products in the market. Therefore, the surge in healthcare expenditure is a greater opportunity for the market.
- Strategic Initiatives by Market Players
The demand for clinical trial imaging is increasing in the market owing to the increased levels of R&D along with the growth of clinical trial imaging market aided by the desire for innovative medications. Thus, the top market players have implemented a new strategy by developing new products and collaborating with other market players to improve business operations and profitability.
For instance,
- In February 2020, ICON plc acquired MedPass International, a European medical devices CRO, reimbursement and regulatory consultancy. This acquisition has reportedly helped in the expansion of the medical device and diagnostic research services of ICON in Europe.
These strategic initiatives by the market players, including acquisition, conferences and focused segment product launches, are helping them grow and improve the company's product portfolio, ultimately leading to more revenue generation. Hence, these strategic initiatives by the market players may act as an opportunity for market growth.
- High-Risk Radiation Causing Diseases
In clinical medical imaging, radiation is absorbed by the body which can harm molecular structures inside the patient’s body. High doses of radiation can affect human cells including loss of hair, skin burns and increased incidence of cancer. The estimated risk of developing fatal cancer is one in 2000 after going through a radiation dose of 10 mSv in a CT scan.
For instance,
- According to Radiological Society of America (RSNA), 1% to 2% of all cancers in the U.S. are caused by CT scans and the American Cancer Society identified CT scans and X-rays as one of the reasons for breast cancer, brain cancer and other cancers
- According to the Center for Disease Control and Prevention, exposure to high levels of radiation results in acute radiation syndrome. The amount of radiation that a person's body absorbs is called the radiation dose.
The high-risk radiation that occurs, would decrease the usage and sale of clinical trial imaging devices, thereby affecting the credibility of manufacturers involved in this market. Therefore, the high-risk radiation-causing diseases are expected to restrain the market growth.
- Strict Regulatory Policies
The healthcare industry is regulated by a structure of laws and rules & regulations that are extensive and complex.
For instance,
- In April 2018, the U.S. FDA released updated Guidance for Clinical Trial Imaging Endpoint Process Standards for the industry which includes the quality of imaging data obtained in clinical trials
- Biotechnology and pharmaceutical industries need to take first approval from the FDA for the process of drug development. They have to submit an Investigational New Drug (IND) application to the FDA before beginning clinical research.
COVID-19 Impact on the Europe Clinical Trial Imaging Market
Diagnostic imaging services have been time-consuming and complicated by the need for strict infection control and prevention practices developed to contain the risk of transmission and protect healthcare personnel. Hence, the decision to image suspected patients or COVID-19-positive patients is based on their impact on the improvement of patient status.
Countries in Europe with a lower GDP reduced cardiac imaging procedures in April 2020, to prevent their healthcare systems becoming overwhelmed. In addition to policies cancelling non-urgent investigations, other important factors may have driven the decline in performance of imaging procedures, such as patient’s inability or reluctance to seek healthcare advice during the COVID-19 pandemic. This includes factors such as fear, a desire to avoid potential infection, access to public transport, and other essential axillary services. This appeared to be part of a general pattern of reduced healthcare utility for non-COVID-19 conditions during the pandemic.
Recent Developments
- In January 2022, Clario partnered with XingImaging, a radiopharmaceutical production and Positron Emission Tomography (PET) acquisition company, to deliver PET imaging clinical trials for testing novel therapeutics in China. The partnership offers to share the joint resources and neuroscience experts of Clario and XingImaging to expedite the startup of clinical trials and drug discovery in China.
- In November 2021, Clario was formed. ERT and Bioclinica, merged to form Clario. The formation of a new company resulted in distribution of clinical imaging software and services and rise in sales.
Europe Clinical Trial Imaging Market Scope
Europe clinical trial imaging market is segmented into five segments based on product and services, modality, application, end user, and distributor. The growth amongst these segments will help you analyze meager growth segments in the industries and provide the users with a valuable market overview and market insights to help them make strategic decisions for identifying core market applications.
Product and Services
- Services
- Software
Based on product and services, the market is segmented into services and software.
Modality
- Computed Tomography
- Magnetic Resonance Imaging
- Echocardiography
- Nuclear Medicine
- Positron Emission Tomography
- X-ray
- Ultrasound
- Optical Coherence Tomography
- Others
Based on modality, the market is segmented into computed tomography, magnetic resonance imaging, echocardiography, nuclear medicine, positron emission tomography, X-ray, ultrasound, optical coherence tomography and others.
Application
- Oncology
- Neurology
- Cardiology
- Endocrinology
- Dermatology
- Hematology
- Others
Based on application, the market is segmented into oncology, neurology, cardiology, endocrinology, dermatology, hematology and others.
End user
- Contract Research Organizations
- Pharmaceutical & Biotechnology Companies
- Medical Device Manufacturers
- Academic and Government Research Institutes
- Others
Based on end user, the market is segmented into contract research organizations, pharmaceutical & biotechnology companies, medical device manufacturers, academic and government research institutes and others.
Distributor
- Direct Sales
- Tender Sales
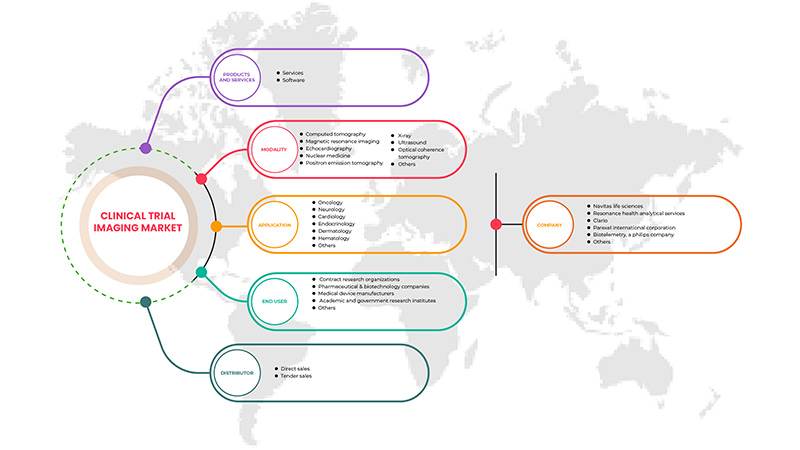
Based on distributor, the market is segmented into direct sales and tender sales.
Europe Clinical Trial Imaging Market Regional Analysis/Insights
Europe clinical trial imaging market is analyzed, and market size insights and trends are provided by regions, product and services, modality, application, end user, and distributor as referenced above.
The countries covered in this market report are Germany, France, U.K., Italy, Spain, Russia, Turkey, Belgium, Netherlands, Switzerland, rest of Europe. Germany is expected to dominate the market since clinical imaging market in Germany is the single largest market in Europe, and proficient to accumulate innovative medical imaging technologies. At the same time, the high number of well-qualified users provides a powerful platform for the further development of medical imaging technologies.
The country section of the report also provides individual market-impacting factors and changes in regulations in the market domestically that impact the current and future trends of the market. Data points such as new sales, replacement sales, country demographics, disease epidemiology, and import-export tariffs are some of the major pointers used to forecast the market scenario for individual countries. Also, the presence and availability of European brands and their challenges faced due to large or scarce competition from local and domestic brands impact on sales channels are considered while providing forecast analysis of the country data.
Competitive Landscape and Europe Clinical Trial Imaging Market Share Analysis
The Europe clinical trial imaging market competitive landscape provides details on the competitor. Details included are company overview, company financials, revenue generated, market potential, investment in R&D, new market initiatives, the Europe presence, production sites and facilities, production capacities, company strengths and weaknesses, product launch, product width, and breadth, and application dominance. The above data points provided are only related to the companies' focus related to the Europe clinical trial imaging market.
Some of the major players operating in the market are Navitas Life Sciences, Resonance Health Analytical Services, BioTelemetry, a Philips Company, IXICO plc, ICON plc, anagram 4 clinical trials, Quotient Sciences,WORLDCARE CLINICAL, Clario, Paraxel International Corporation, Median Technologies, Perspectum, Calyx, WIRB-Copernicus Group, and Invicro.LLC among others.
SKU-
Get online access to the report on the World's First Market Intelligence Cloud
- Interactive Data Analysis Dashboard
- Company Analysis Dashboard for high growth potential opportunities
- Research Analyst Access for customization & queries
- Competitor Analysis with Interactive dashboard
- Latest News, Updates & Trend analysis
- Harness the Power of Benchmark Analysis for Comprehensive Competitor Tracking
Table of Content
1 INTRODUCTION
1.1 OBJECTIVES OF THE STUDY
1.2 MARKET DEFINITION
1.3 OVERVIEW OF EUROPE CLINICAL TRIAL IMAGING MARKET
1.4 LIMITATIONS
1.5 MARKETS COVERED
2 MARKET SEGMENTATION
2.1 MARKETS COVERED
2.2 GEOGRAPHICAL SCOPE
2.3 YEARS CONSIDERED FOR THE STUDY
2.4 CURRENCY AND PRICING
2.5 DBMR TRIPOD DATA VALIDATION MODEL
2.6 MULTIVARIATE MODELLING
2.7 PRODUCTS AND SERVICES LIFELINE CURVE
2.8 PRIMARY INTERVIEWS WITH KEY OPINION LEADERS
2.9 DBMR MARKET POSITION GRID
2.1 MARKET APPLICATION COVERAGE GRID
2.11 VENDOR SHARE ANALYSIS
2.12 SECONDARY SOURCES
2.13 ASSUMPTIONS
3 EXECUTIVE SUMMARY
4 PREMIUM INSIGHTS
4.1 PESTEL ANALYSIS
4.2 PORTER’S FIVE FORCES
5 EUROPE CLINICAL TRIAL IMAGING MARKET: REGULATIONS
6 MARKET OVERVIEW
6.1 DRIVERS
6.1.1 RISING R&D EXPENDITURE
6.1.2 INCREASING NUMBER OF CONTRACT RESEARCH ORGANIZATIONS (CROS)
6.1.3 INCREASING INCIDENCE OF CHRONIC DISEASES
6.1.4 GROWTH IN THE PHARMACEUTICAL AND IMAGING INDUSTRIES
6.2 RESTRAINTS
6.2.1 HIGH-RISK RADIATION CAUSING DISEASES
6.2.2 HIGH IMPLEMENTATION COST OF IMAGING SYSTEMS
6.3 OPPORTUNITIES
6.3.1 RISE IN HEALTHCARE EXPENDITURE
6.3.2 STRATEGIC INITIATIVES BY KEY PLAYERS
6.3.3 DEVELOPMENT OF INNOVATIVE IMAGING MODALITIES AND CONTRAST AGENTS
6.4 CHALLENGES
6.4.1 STRICT REGULATORY POLICIES
6.4.2 COST OF CLINICAL TRIALS
7 EUROPE CLINICAL TRIAL IMAGING MARKET, BY PRODUCTS & SERVICES
7.1 OVERVIEW
7.2 SERVICES
7.2.1 OPERATIONAL IMAGING SERVICES
7.2.2 READ ANALYSIS SERVICES
7.2.3 TRIAL DESIGN CONSULTING SERVICES
7.2.4 SYSTEM AND TECHNICAL SUPPORT SERVICES
7.3 SOFTWARE
8 EUROPE CLINICAL TRIAL IMAGING MARKET, BY MODALITY
8.1 OVERVIEW
8.2 COMPUTED TOMOGRAPHY
8.3 MAGENTIC RESONANCE IMAGING
8.4 ECHOCARDIOGRAPHY
8.5 NUCLEAR MEDICINE
8.6 POSITRON EMISSION TOMOGRAPHY
8.7 X-RAY
8.8 ULTRASOUND
8.9 OPTICAL COHERENCE TOMOGRAPHY
8.1 OTHERS
9 EUROPE CLINICAL TRIAL IMAGING MARKET, BY APPLICATION
9.1 OVERVIEW
9.2 ONCOLOGY
9.2.1 X-RAY
9.2.2 ULTRASOUND
9.2.3 COMPUTED TOMOGRAPHY
9.2.4 MAGNETIC RESONANCE IMAGING
9.2.5 NUCLEAR MEDICINE
9.2.6 POSITRON EMISSION TOMOGRAPHY
9.2.7 OPTICAL COHERENCE TOMOGRAPHY
9.2.8 ECHOCARDIOGRAPHY
9.2.9 OTHERS
9.3 NEUROLOGY
9.3.1 COMPUTED TOMOGRAPHY
9.3.2 MAGNETIC RESONANCE IMAGING
9.3.3 POSITRON EMISSION TOMOGRAPHY
9.3.4 NUCLEAR MEDICINE
9.3.5 X-RAY
9.3.6 ULTRASOUND
9.3.7 OPTICAL COHERENCE TOMOGRAPHY
9.3.8 ECHOCARDIOGRAPHY
9.3.9 OTHERS
9.4 CARDIOLOGY
9.4.1 ECHOCARDIOGRAPHY
9.4.2 MAGNETIC RESONANCE IMAGING
9.4.3 COMPUTED TOMOGRAPHY
9.4.4 POSITRON EMISSION TOMOGRAPHY
9.4.5 NUCLEAR MEDICINE
9.4.6 X-RAY
9.4.7 ULTRASOUND
9.4.8 OPTICAL COHERENCE TOMOGRAPHY
9.4.9 OTHERS
9.5 ENDOCRINOLOGY
9.5.1 COMPUTED TOMOGRAPHY
9.5.2 MAGNETIC RESONANCE IMAGING
9.5.3 ECHOCARDIOGRAPHY
9.5.4 POSITRON EMISSION TOMOGRAPHY
9.5.5 NUCLEAR MEDICINE
9.5.6 X-RAY
9.5.7 ULTRASOUND
9.5.8 OPTICAL COHERENCE TOMOGRAPHY
9.5.9 OTHERS
9.6 DERMATOLOGY
9.6.1 ULTRASOUND
9.6.2 X-RAY
9.6.3 MAGNETIC RESONANCE IMAGING
9.6.4 COMPUTED TOMOGRAPHY
9.6.5 OPTICAL COHERENCE TOMOGRAPHY
9.6.6 POSITRON EMISSION TOMOGRAPHY
9.6.7 NUCLEAR MEDICINE
9.6.8 ECHOCARDIOGRAPHY
9.6.9 OTHERS
9.7 HEMATOLOGY
9.7.1 ULTRASOUND
9.7.2 COMPUTED TOMOGRAPHY
9.7.3 MAGNETIC RESONANCE IMAGING
9.7.4 X-RAY
9.7.5 POSITRON EMISSION TOMOGRAPHY
9.7.6 NUCLEAR MEDICINE
9.7.7 OPTICAL COHERENCE TOMOGRAPHY
9.7.8 ECHOCARDIOGRAPHY
9.7.9 OTHERS
9.8 OTHERS
10 EUROPE CLINICAL TRIAL IMAGING MARKET, BY END USER
10.1 OVERVIEW
10.2 CONTRACT RESEARCH ORGANIZATION
10.3 PHARMACEUTICAL AND BIOTECHNOLOGY COMPANIES
10.4 MEDICAL DEVICE MANUFACTURERS
10.5 ACADEMIC AND GOVERNMENT RESEARCH INSTITUTES
10.6 OTHERS
11 EUROPE CLINICAL TRIAL IMAGING MARKET, BY DISTRIBUTOR
11.1 OVERVIEW
11.2 DIRECT SALES
11.3 TENDER SALES
12 EUROPE CLINICAL TRIAL IMAGING MARKET, BY REGION
12.1 EUROPE
12.1.1 GERMANY
12.1.2 FRANCE
12.1.3 U.K.
12.1.4 ITALY
12.1.5 SPAIN
12.1.6 SWITZERLAND
12.1.7 RUSSIA
12.1.8 NETHERLANDS
12.1.9 BELGIUM
12.1.10 TURKEY
12.1.11 REST OF EUROPE
13 EUROPE CLINICAL TRIAL IMAGING MARKET: COMPANY LANDSCAPE
13.1 COMPANY SHARE ANALYSIS: EUROPE
14 SWOT ANALYSIS
15 COMPANY PROFILE
15.1 NAVITAS LIFE SCIENCES
15.1.1 COMPANY SNAPSHOT
15.1.2 COMPANY SHARE ANALYSIS
15.1.3 PRODUCT PORTFOLIO
15.1.4 RECENT DEVELOPMENTS
15.2 RESONANCE HEALTH ANALYTICAL SERVICES
15.2.1 COMPANY SNAPSHOT
15.2.2 REVENUE ANALYSIS
15.2.3 COMPANY SHARE ANALYSIS
15.2.4 PRODUCT PORTFOLIO
15.2.5 RECENT DEVELOPMENT
15.3 CLARIO
15.3.1 COMPANY SNAPSHOT
15.3.2 COMPANY SHARE ANALYSIS
15.3.3 PRODUCT PORTFOLIO
15.3.4 RECENT DEVELOPMENTS
15.4 PARAXEL
15.4.1 COMPANY SNAPSHOT
15.4.2 COMPANY SHARE ANALYSIS
15.4.3 PRODUCT PORTFOLIO
15.4.4 RECENT DEVELOPMENT
15.5 BIOTELEMETRY, A PHILIPS COMPANY
15.5.1 COMPANY SNAPSHOT
15.5.2 COMPANY SHARE ANALYSIS
15.5.3 PRODUCT PORTFOLIO
15.5.4 RECENT DEVELOPMENT
15.6 ICON PLC
15.6.1 COMPANY SNAPSHOT
15.6.2 REVENUE ANALYSIS
15.6.3 PRODUCT PORTFOLIO
15.6.4 RECENT DEVELOPMENTS
15.7 MEDIAN TECHNOLOGIES
15.7.1 COMPANY SNAPSHOT
15.7.2 REVENUE ANALYSIS
15.7.3 PRODUCT PORTFOLIO
15.7.4 RECENT DEVELOPMENT
15.8 PERSPECTUM
15.8.1 COMPANY SNAPSHOT
15.8.2 PRODUCT PORTFOLIO
15.8.3 RECENT DEVELOPMENTS
15.9 ANAGRAM 4 CLINICAL TRIALS
15.9.1 COMPANY SNAPSHOT
15.9.2 PRODUCT PORTFOLIO
15.9.3 RECENT DEVELOPMENT
15.1 CALYX
15.10.1 COMPANY SNAPSHOT
15.10.2 PRODUCT PORTFOLIO
15.10.3 RECENT DEVELOPMENT
15.11 IMAGE CORE LAB
15.11.1 COMPANY SNAPSHOT
15.11.2 PRODUCT PORTFOLIO
15.11.3 RECENT DEVELOPMENT
15.12 INVICRO. LLC. (A SUBSIDIARY OF KONICA MINOLTA)
15.12.1 COMPANY SNAPSHOT
15.12.2 REVENUE ANALYSIS
15.12.3 PRODUCT PORTFOLIO
15.12.4 RECENT DEVELOPMENTS
15.13 IXICO PLC
15.13.1 COMPANY SNAPSHOT
15.13.2 REVENUE ANALYSIS
15.13.3 PRODUCT PORTFOLIO
15.13.4 RECENT DEVELOPMENTS
15.14 QUOTIENT SCIENCES
15.14.1 COMPANY SNAPSHOT
15.14.2 PRODUCT PORTFOLIO
15.14.3 RECENT DEVELOPMENT
15.15 RADIANT SAGE LLC
15.15.1 COMPANY SNAPSHOT
15.15.2 PRODUCT PORTFOLIO
15.15.3 RECENT DEVELOPMENT
15.16 WIRB-COPERNICUS GROUP
15.16.1 COMPANY SNAPSHOT
15.16.2 PRODUCT PORTFOLIO
15.16.3 RECENT DEVELOPMENT
15.17 WORLDCARE CLINICAL
15.17.1 COMPANY SNAPSHOT
15.17.2 PRODUCT PORTFOLIO
15.17.3 RECENT DEVELOPMENT
16 QUESTIONNAIRE
17 RELATED REPORTS
List of Table
TABLE 1 COST OF CLINICAL TRIAL PHASE 2 AND PHASE 3
TABLE 2 HUGE R&D COST IN THE U.S. FOR DIFFERENT PHASES
TABLE 3 EUROPE CLINICAL TRIAL IMAGING MARKET, BY PRODUCTS & SERVICES, 2020-2029 (USD MILLION)
TABLE 4 EUROPE SERVICES IN CLINICAL TRIAL IMAGING MARKET, BY REGION, 2020-2029 (USD MILLION)
TABLE 5 EUROPE SERVICES IN CLINICAL TRIAL IMAGING MARKET, BY PRODUCTS & SERVICES, 2020-2029 (USD MILLION)
TABLE 6 EUROPE SOFTWARE IN CLINICAL TRIAL IMAGING MARKET, BY REGION, 2020-2029 (USD MILLION)
TABLE 7 EUROPE CLINICAL TRIAL IMAGING MARKET, BY MODALITY, 2020-2029 (USD MILLION)
TABLE 8 EUROPE COMPUTED TOMOGRAPHY IN CLINICAL TRIAL IMAGING MARKET, BY REGION, 2020-2029 (USD MILLION)
TABLE 9 EUROPE MAGNETIC RESONANCE IMAGING IN CLINICAL TRIAL IMAGING MARKET, BY REGION, 2020-2029 (USD MILLION)
TABLE 10 EUROPE ECHOCARDIOGRAPHY IN CLINICAL TRIAL IMAGING MARKET, BY REGION, 2020-2029 (USD MILLION)
TABLE 11 EUROPE NUCLEAR MEDICINE IN CLINICAL TRIAL IMAGING MARKET, BY REGION, 2020-2029 (USD MILLION)
TABLE 12 EUROPE POSITRON EMISSION TOMOGRAPHY IN CLINICAL TRIAL IMAGING MARKET, BY REGION, 2020-2029 (USD MILLION)
TABLE 13 EUROPE X-RAY IN CLINICAL TRIAL IMAGING MARKET, BY REGION, 2020-2029 (USD MILLION)
TABLE 14 EUROPE ULTRASOUND IN CLINICAL TRIAL IMAGING MARKET, BY REGION, 2020-2029 (USD MILLION)
TABLE 15 EUROPE OPTICAL COHERENCE TOMOGRAPHY IN CLINICAL TRIAL IMAGING MARKET, BY REGION, 2020-2029 (USD MILLION)
TABLE 16 EUROPE OTHERS IN CLINICAL TRIAL IMAGING MARKET, BY REGION, 2020-2029 (USD MILLION)
TABLE 17 EUROPE CLINICAL TRIAL IMAGING MARKET, BY APPLICATION, 2020-2029 (USD MILLION)
TABLE 18 EUROPE ONCOLOGY IN CLINICAL TRIAL IMAGING MARKET, BY REGION, 2020-2029 (USD MILLION)
TABLE 19 EUROPE ONCOLOGY IN CLINICAL TRIAL IMAGING MARKET, BY APPLICATION, 2020-2029 (USD MILLION)
TABLE 20 EUROPE NEUROLOGY IN CLINICAL TRIAL IMAGING MARKET, BY REGION, 2020-2029 (USD MILLION)
TABLE 21 EUROPE NEUROLOGY IN CLINICAL TRIAL IMAGING MARKET, BY APPLICATION, 2020-2029 (USD MILLION)
TABLE 22 EUROPE CARDIOLOGY IN CLINICAL TRIAL IMAGING MARKET, BY REGION, 2020-2029 (USD MILLION)
TABLE 23 EUROPE CARDIOLOGY IN CLINICAL TRIAL IMAGING MARKET, BY APPLICATION, 2020-2029 (USD MILLION)
TABLE 24 EUROPE ENDOCRINOLOGY IN CLINICAL TRIAL IMAGING MARKET, BY REGION, 2020-2029 (USD MILLION)
TABLE 25 EUROPE ENDOCRINOLOGY IN CLINICAL TRIAL IMAGING MARKET, BY APPLICATION, 2020-2029 (USD MILLION)
TABLE 26 EUROPE DERMATOLOGY IN CLINICAL TRIAL IMAGING MARKET, BY REGION, 2020-2029 (USD MILLION)
TABLE 27 EUROPE DERMATOLOGY IN CLINICAL TRIAL IMAGING MARKET, BY APPLICATION, 2020-2029 (USD MILLION)
TABLE 28 EUROPE HEMATOLOGY IN CLINICAL TRIAL IMAGING MARKET, BY REGION, 2020-2029 (USD MILLION)
TABLE 29 EUROPE HEMATOLOGY IN CLINICAL TRIAL IMAGING MARKET, BY APPLICATION, 2020-2029 (USD MILLION)
TABLE 30 EUROPE OTHERS IN CLINICAL TRIAL IMAGING MARKET, BY REGION, 2020-2029 (USD MILLION)
TABLE 31 EUROPE CLINICAL TRIAL IMAGING MARKET, BY END USER, 2020-2029 (USD MILLION)
TABLE 32 EUROPE CONTRACT RESEARCH ORGANIZATION IN CLINICAL TRIAL IMAGING MARKET, BY REGION, 2020-2029 (USD MILLION)
TABLE 33 EUROPE PHARMACEUTICAL AND BIOTECHNOLOGY COMPANIES IN CLINICAL TRIAL IMAGING MARKET, BY REGION, 2020-2029 (USD MILLION)
TABLE 34 EUROPE MEDICAL DEVICE MANUFACTURERS IN CLINICAL TRIAL IMAGING MARKET, BY REGION, 2020-2029 (USD MILLION)
TABLE 35 EUROPE ACADEMIC AND GOVERNMENT RESEARCH INSTITUTES IN CLINICAL TRIAL IMAGING MARKET, BY REGION, 2020-2029 (USD MILLION)
TABLE 36 EUROPE OTHERS IN CLINICAL TRIAL IMAGING MARKET, BY REGION, 2020-2029 (USD MILLION)
TABLE 37 EUROPE CLINICAL TRIAL IMAGING MARKET, BY DISTRIBUTOR, 2020-2029 (USD MILLION)
TABLE 38 EUROPE DIRECT SALES IN CLINICAL TRIAL IMAGING MARKET, BY REGION, 2020-2029 (USD MILLION)
TABLE 39 EUROPE TENDER SALES IN CLINICAL TRIAL IMAGING MARKET, BY REGION, 2020-2029 (USD MILLION)
TABLE 40 EUROPE CLINICAL TRIAL IMAGING MARKET, BY COUNTRY, 2020-2029 (USD MILLION)
TABLE 41 EUROPE CLINICAL TRIAL IMAGING MARKET, BY PRODUCT & SERVICES, 2020-2029 (USD MILLION)
TABLE 42 EUROPE SERVICES IN CLINICAL TRIAL IMAGING MARKET, BY PRODUCT & SERVICES, 2020-2029 (USD MILLION)
TABLE 43 EUROPE CLINICAL TRIAL IMAGING MARKET, BY MODALITY, 2020-2029 (USD MILLION)
TABLE 44 EUROPE CLINICAL TRIAL IMAGING MARKET, BY APPLICATION, 2020-2029 (USD MILLION)
TABLE 45 EUROPE ONCOLOGY IN CLINICAL TRIAL IMAGING MARKET, BY APPLICATION, 2020-2029 (USD MILLION)
TABLE 46 EUROPE NEUROLOGY IN CLINICAL TRIAL IMAGING MARKET, BY APPLICATION, 2020-2029 (USD MILLION)
TABLE 47 EUROPE ENDOCRINOLOGY IN CLINICAL TRIAL IMAGING MARKET, BY APPLICATION, 2020-2029 (USD MILLION)
TABLE 48 EUROPE CARDIOLOGY IN CLINICAL TRIAL IMAGING MARKET, BY APPLICATION, 2020-2029 (USD MILLION)
TABLE 49 EUROPE DERMATOLOGY IN CLINICAL TRIAL IMAGING MARKET, BY APPLICATION, 2020-2029 (USD MILLION)
TABLE 50 EUROPE HEMATOLOGY IN CLINICAL TRIAL IMAGING MARKET, BY APPLICATION, 2020-2029 (USD MILLION)
TABLE 51 EUROPE CLINICAL TRIAL IMAGING MARKET, BY END USER, 2020-2029 (USD MILLION)
TABLE 52 EUROPE CLINICAL TRIAL IMAGING MARKET, BY DISTRIBUTOR, 2020-2029 (USD MILLION)
TABLE 53 GERMANY CLINICAL TRIAL IMAGING MARKET, BY PRODUCT & SERVICES, 2020-2029 (USD MILLION)
TABLE 54 GERMANY SERVICES IN CLINICAL TRIAL IMAGING MARKET, BY PRODUCT & SERVICES, 2020-2029 (USD MILLION)
TABLE 55 GERMANY CLINICAL TRIAL IMAGING MARKET, BY MODALITY, 2020-2029 (USD MILLION)
TABLE 56 GERMANY CLINICAL TRIAL IMAGING MARKET, BY APPLICATION, 2020-2029 (USD MILLION)
TABLE 57 GERMANY ONCOLOGY IN CLINICAL TRIAL IMAGING MARKET, BY APPLICATION, 2020-2029 (USD MILLION)
TABLE 58 GERMANY NEUROLOGY IN CLINICAL TRIAL IMAGING MARKET, BY APPLICATION, 2020-2029 (USD MILLION)
TABLE 59 GERMANY ENDOCRINOLOGY IN CLINICAL TRIAL IMAGING MARKET, BY APPLICATION, 2020-2029 (USD MILLION)
TABLE 60 GERMANY CARDIOLOGY IN CLINICAL TRIAL IMAGING MARKET, BY APPLICATION, 2020-2029 (USD MILLION)
TABLE 61 GERMANY DERMATOLOGY IN CLINICAL TRIAL IMAGING MARKET, BY APPLICATION, 2020-2029 (USD MILLION)
TABLE 62 GERMANY HEMATOLOGY IN CLINICAL TRIAL IMAGING MARKET, BY APPLICATION, 2020-2029 (USD MILLION)
TABLE 63 GERMANY CLINICAL TRIAL IMAGING MARKET, BY END USER, 2020-2029 (USD MILLION)
TABLE 64 GERMANY CLINICAL TRIAL IMAGING MARKET, BY DISTRIBUTOR, 2020-2029 (USD MILLION)
TABLE 65 FRANCE CLINICAL TRIAL IMAGING MARKET, BY PRODUCT & SERVICES, 2020-2029 (USD MILLION)
TABLE 66 FRANCE SERVICES IN CLINICAL TRIAL IMAGING MARKET, BY PRODUCT & SERVICES, 2020-2029 (USD MILLION)
TABLE 67 FRANCE CLINICAL TRIAL IMAGING MARKET, BY MODALITY, 2020-2029 (USD MILLION)
TABLE 68 FRANCE CLINICAL TRIAL IMAGING MARKET, BY APPLICATION, 2020-2029 (USD MILLION)
TABLE 69 FRANCE ONCOLOGY IN CLINICAL TRIAL IMAGING MARKET, BY APPLICATION, 2020-2029 (USD MILLION)
TABLE 70 FRANCE NEUROLOGY IN CLINICAL TRIAL IMAGING MARKET, BY APPLICATION, 2020-2029 (USD MILLION)
TABLE 71 FRANCE ENDOCRINOLOGY IN CLINICAL TRIAL IMAGING MARKET, BY APPLICATION, 2020-2029 (USD MILLION)
TABLE 72 FRANCE CARDIOLOGY IN CLINICAL TRIAL IMAGING MARKET, BY APPLICATION, 2020-2029 (USD MILLION)
TABLE 73 FRANCE DERMATOLOGY IN CLINICAL TRIAL IMAGING MARKET, BY APPLICATION, 2020-2029 (USD MILLION)
TABLE 74 FRANCE HEMATOLOGY IN CLINICAL TRIAL IMAGING MARKET, BY APPLICATION, 2020-2029 (USD MILLION)
TABLE 75 FRANCE CLINICAL TRIAL IMAGING MARKET, BY END USER, 2020-2029 (USD MILLION)
TABLE 76 FRANCE CLINICAL TRIAL IMAGING MARKET, BY DISTRIBUTOR, 2020-2029 (USD MILLION)
TABLE 77 U.K. CLINICAL TRIAL IMAGING MARKET, BY PRODUCT & SERVICES, 2020-2029 (USD MILLION)
TABLE 78 U.K. SERVICES IN CLINICAL TRIAL IMAGING MARKET, BY PRODUCT & SERVICES, 2020-2029 (USD MILLION)
TABLE 79 U.K. CLINICAL TRIAL IMAGING MARKET, BY MODALITY, 2020-2029 (USD MILLION)
TABLE 80 U.K. CLINICAL TRIAL IMAGING MARKET, BY APPLICATION, 2020-2029 (USD MILLION)
TABLE 81 U.K. ONCOLOGY IN CLINICAL TRIAL IMAGING MARKET, BY APPLICATION, 2020-2029 (USD MILLION)
TABLE 82 U.K. NEUROLOGY IN CLINICAL TRIAL IMAGING MARKET, BY APPLICATION, 2020-2029 (USD MILLION)
TABLE 83 U.K. ENDOCRINOLOGY IN CLINICAL TRIAL IMAGING MARKET, BY APPLICATION, 2020-2029 (USD MILLION)
TABLE 84 U.K. CARDIOLOGY IN CLINICAL TRIAL IMAGING MARKET, BY APPLICATION, 2020-2029 (USD MILLION)
TABLE 85 U.K. DERMATOLOGY IN CLINICAL TRIAL IMAGING MARKET, BY APPLICATION, 2020-2029 (USD MILLION)
TABLE 86 U.K. HEMATOLOGY IN CLINICAL TRIAL IMAGING MARKET, BY APPLICATION, 2020-2029 (USD MILLION)
TABLE 87 U.K. CLINICAL TRIAL IMAGING MARKET, BY END USER, 2020-2029 (USD MILLION)
TABLE 88 U.K. CLINICAL TRIAL IMAGING MARKET, BY DISTRIBUTOR, 2020-2029 (USD MILLION)
TABLE 89 ITALY CLINICAL TRIAL IMAGING MARKET, BY PRODUCT & SERVICES, 2020-2029 (USD MILLION)
TABLE 90 ITALY CLINICAL TRIAL IMAGING MARKET, BY PRODUCT & SERVICES, 2020-2029 (USD MILLION)
TABLE 91 ITALY CLINICAL TRIAL IMAGING MARKET, BY MODALITY, 2020-2029 (USD MILLION)
TABLE 92 ITALY CLINICAL TRIAL IMAGING MARKET, BY APPLICATION, 2020-2029 (USD MILLION)
TABLE 93 ITALY ONCOLOGY IN CLINICAL TRIAL IMAGING MARKET, BY APPLICATION, 2020-2029 (USD MILLION)
TABLE 94 ITALY NEUROLOGY IN CLINICAL TRIAL IMAGING MARKET, BY APPLICATION, 2020-2029 (USD MILLION)
TABLE 95 ITALY ENDOCRINOLOGY IN CLINICAL TRIAL IMAGING MARKET, BY APPLICATION, 2020-2029 (USD MILLION)
TABLE 96 ITALY CARDIOLOGY IN CLINICAL TRIAL IMAGING MARKET, BY APPLICATION, 2020-2029 (USD MILLION)
TABLE 97 ITALY DERMATOLOGY IN CLINICAL TRIAL IMAGING MARKET, BY APPLICATION, 2020-2029 (USD MILLION)
TABLE 98 ITALY HEMATOLOGY IN CLINICAL TRIAL IMAGING MARKET, BY APPLICATION, 2020-2029 (USD MILLION)
TABLE 99 ITALY CLINICAL TRIAL IMAGING MARKET, BY END USER, 2020-2029 (USD MILLION)
TABLE 100 ITALY CLINICAL TRIAL IMAGING MARKET, BY DISTRIBUTOR, 2020-2029 (USD MILLION)
TABLE 101 SPAIN CLINICAL TRIAL IMAGING MARKET, BY PRODUCT & SERVICES, 2020-2029 (USD MILLION)
TABLE 102 SPAIN SERVICES IN CLINICAL TRIAL IMAGING MARKET, BY PRODUCT & SERVICES, 2020-2029 (USD MILLION)
TABLE 103 SPAIN CLINICAL TRIAL IMAGING MARKET, BY MODALITY, 2020-2029 (USD MILLION)
TABLE 104 SPAIN CLINICAL TRIAL IMAGING MARKET, BY APPLICATION, 2020-2029 (USD MILLION)
TABLE 105 SPAIN ONCOLOGY IN CLINICAL TRIAL IMAGING MARKET, BY APPLICATION, 2020-2029 (USD MILLION)
TABLE 106 SPAIN NEUROLOGY IN CLINICAL TRIAL IMAGING MARKET, BY APPLICATION, 2020-2029 (USD MILLION)
TABLE 107 SPAIN ENDOCRINOLOGY IN CLINICAL TRIAL IMAGING MARKET, BY APPLICATION, 2020-2029 (USD MILLION)
TABLE 108 SPAIN CARDIOLOGY IN CLINICAL TRIAL IMAGING MARKET, BY APPLICATION, 2020-2029 (USD MILLION)
TABLE 109 SPAIN DERMATOLOGY IN CLINICAL TRIAL IMAGING MARKET, BY APPLICATION, 2020-2029 (USD MILLION)
TABLE 110 SPAIN HEMATOLOGY IN CLINICAL TRIAL IMAGING MARKET, BY APPLICATION, 2020-2029 (USD MILLION)
TABLE 111 SPAIN CLINICAL TRIAL IMAGING MARKET, BY END USER, 2020-2029 (USD MILLION)
TABLE 112 SPAIN CLINICAL TRIAL IMAGING MARKET, BY DISTRIBUTOR, 2020-2029 (USD MILLION)
TABLE 113 SWITZERLAND CLINICAL TRIAL IMAGING MARKET, BY PRODUCT & SERVICES, 2020-2029 (USD MILLION)
TABLE 114 SWITZERLAND SERVICES IN CLINICAL TRIAL IMAGING MARKET, BY PRODUCT & SERVICES, 2020-2029 (USD MILLION)
TABLE 115 SWITZERLAND CLINICAL TRIAL IMAGING MARKET, BY MODALITY, 2020-2029 (USD MILLION)
TABLE 116 SWITZERLAND CLINICAL TRIAL IMAGING MARKET, BY APPLICATION, 2020-2029 (USD MILLION)
TABLE 117 SWITZERLAND ONCOLOGY IN CLINICAL TRIAL IMAGING MARKET, BY APPLICATION, 2020-2029 (USD MILLION)
TABLE 118 SWITZERLAND NEUROLOGY IN CLINICAL TRIAL IMAGING MARKET, BY APPLICATION, 2020-2029 (USD MILLION)
TABLE 119 SWITZERLAND ENDOCRINOLOGY IN CLINICAL TRIAL IMAGING MARKET, BY APPLICATION, 2020-2029 (USD MILLION)
TABLE 120 SWITZERLAND CARDIOLOGY IN CLINICAL TRIAL IMAGING MARKET, BY APPLICATION, 2020-2029 (USD MILLION)
TABLE 121 SWITZERLAND DERMATOLOGY IN CLINICAL TRIAL IMAGING MARKET, BY APPLICATION, 2020-2029 (USD MILLION)
TABLE 122 SWITZERLAND HEMATOLOGY IN CLINICAL TRIAL IMAGING MARKET, BY APPLICATION, 2020-2029 (USD MILLION)
TABLE 123 SWITZERLAND CLINICAL TRIAL IMAGING MARKET, BY END USER, 2020-2029 (USD MILLION)
TABLE 124 SWITZERLAND CLINICAL TRIAL IMAGING MARKET, BY DISTRIBUTOR, 2020-2029 (USD MILLION)
TABLE 125 RUSSIA CLINICAL TRIAL IMAGING MARKET, BY PRODUCT & SERVICES, 2020-2029 (USD MILLION)
TABLE 126 RUSSIA SERVICES IN CLINICAL TRIAL IMAGING MARKET, BY PRODUCT & SERVICES, 2020-2029 (USD MILLION)
TABLE 127 RUSSIA CLINICAL TRIAL IMAGING MARKET, BY MODALITY, 2020-2029 (USD MILLION)
TABLE 128 RUSSIA CLINICAL TRIAL IMAGING MARKET, BY APPLICATION, 2020-2029 (USD MILLION)
TABLE 129 RUSSIA ONCOLOGY IN CLINICAL TRIAL IMAGING MARKET, BY APPLICATION, 2020-2029 (USD MILLION)
TABLE 130 RUSSIA NEUROLOGY IN CLINICAL TRIAL IMAGING MARKET, BY APPLICATION, 2020-2029 (USD MILLION)
TABLE 131 RUSSIA ENDOCRINOLOGY IN CLINICAL TRIAL IMAGING MARKET, BY APPLICATION, 2020-2029 (USD MILLION)
TABLE 132 RUSSIA CARDIOLOGY IN CLINICAL TRIAL IMAGING MARKET, BY APPLICATION, 2020-2029 (USD MILLION)
TABLE 133 RUSSIA DERMATOLOGY IN CLINICAL TRIAL IMAGING MARKET, BY APPLICATION, 2020-2029 (USD MILLION)
TABLE 134 RUSSIA HEMATOLOGY IN CLINICAL TRIAL IMAGING MARKET, BY APPLICATION, 2020-2029 (USD MILLION)
TABLE 135 RUSSIA CLINICAL TRIAL IMAGING MARKET, BY END USER, 2020-2029 (USD MILLION)
TABLE 136 RUSSIA CLINICAL TRIAL IMAGING MARKET, BY DISTRIBUTOR, 2020-2029 (USD MILLION)
TABLE 137 NETHERLANDS CLINICAL TRIAL IMAGING MARKET, BY PRODUCT & SERVICES, 2020-2029 (USD MILLION)
TABLE 138 NETHERLANDS SERVICES IN CLINICAL TRIAL IMAGING MARKET, BY PRODUCT & SERVICES, 2020-2029 (USD MILLION)
TABLE 139 NETHERLANDS CLINICAL TRIAL IMAGING MARKET, BY MODALITY, 2020-2029 (USD MILLION)
TABLE 140 NETHERLANDS CLINICAL TRIAL IMAGING MARKET, BY APPLICATION, 2020-2029 (USD MILLION)
TABLE 141 NETHERLANDS ONCOLOGY IN CLINICAL TRIAL IMAGING MARKET, BY APPLICATION, 2020-2029 (USD MILLION)
TABLE 142 NETHERLANDS NEUROLOGY IN CLINICAL TRIAL IMAGING MARKET, BY APPLICATION, 2020-2029 (USD MILLION)
TABLE 143 NETHERLANDS ENDOCRINOLOGY IN CLINICAL TRIAL IMAGING MARKET, BY APPLICATION, 2020-2029 (USD MILLION)
TABLE 144 NETHERLANDS CARDIOLOGY IN CLINICAL TRIAL IMAGING MARKET, BY APPLICATION, 2020-2029 (USD MILLION)
TABLE 145 NETHERLANDS DERMATOLOGY IN CLINICAL TRIAL IMAGING MARKET, BY APPLICATION, 2020-2029 (USD MILLION)
TABLE 146 NETHERLANDS HEMATOLOGY IN CLINICAL TRIAL IMAGING MARKET, BY APPLICATION, 2020-2029 (USD MILLION)
TABLE 147 NETHERLANDS CLINICAL TRIAL IMAGING MARKET, BY END USER, 2020-2029 (USD MILLION)
TABLE 148 NETHERLANDS CLINICAL TRIAL IMAGING MARKET, BY DISTRIBUTOR, 2020-2029 (USD MILLION)
TABLE 149 BELGIUM CLINICAL TRIAL IMAGING MARKET, BY PRODUCT & SERVICES, 2020-2029 (USD MILLION)
TABLE 150 BELGIUM SERVICES IN CLINICAL TRIAL IMAGING MARKET, BY PRODUCT & SERVICES, 2020-2029 (USD MILLION)
TABLE 151 BELGIUM CLINICAL TRIAL IMAGING MARKET, BY MODALITY, 2020-2029 (USD MILLION)
TABLE 152 BELGIUM CLINICAL TRIAL IMAGING MARKET, BY APPLICATION, 2020-2029 (USD MILLION)
TABLE 153 BELGIUM ONCOLOGY IN CLINICAL TRIAL IMAGING MARKET, BY APPLICATION, 2020-2029 (USD MILLION)
TABLE 154 BELGIUM NEUROLOGY IN CLINICAL TRIAL IMAGING MARKET, BY APPLICATION, 2020-2029 (USD MILLION)
TABLE 155 BELGIUM ENDOCRINOLOGY IN CLINICAL TRIAL IMAGING MARKET, BY APPLICATION, 2020-2029 (USD MILLION)
TABLE 156 BELGIUM CARDIOLOGY IN CLINICAL TRIAL IMAGING MARKET, BY APPLICATION, 2020-2029 (USD MILLION)
TABLE 157 BELGIUM DERMATOLOGY IN CLINICAL TRIAL IMAGING MARKET, BY APPLICATION, 2020-2029 (USD MILLION)
TABLE 158 BELGIUM HEMATOLOGY IN CLINICAL TRIAL IMAGING MARKET, BY APPLICATION, 2020-2029 (USD MILLION)
TABLE 159 BELGIUM CLINICAL TRIAL IMAGING MARKET, BY END USER, 2020-2029 (USD MILLION)
TABLE 160 BELGIUM CLINICAL TRIAL IMAGING MARKET, BY DISTRIBUTOR, 2020-2029 (USD MILLION)
TABLE 161 TURKEY CLINICAL TRIAL IMAGING MARKET, BY PRODUCT & SERVICES, 2020-2029 (USD MILLION)
TABLE 162 TURKEY SERVICES IN CLINICAL TRIAL IMAGING MARKET, BY PRODUCT & SERVICES, 2020-2029 (USD MILLION)
TABLE 163 TURKEY CLINICAL TRIAL IMAGING MARKET, BY MODALITY, 2020-2029 (USD MILLION)
TABLE 164 TURKEY CLINICAL TRIAL IMAGING MARKET, BY APPLICATION, 2020-2029 (USD MILLION)
TABLE 165 TURKEY ONCOLOGY IN CLINICAL TRIAL IMAGING MARKET, BY APPLICATION, 2020-2029 (USD MILLION)
TABLE 166 TURKEY NEUROLOGY IN CLINICAL TRIAL IMAGING MARKET, BY APPLICATION, 2020-2029 (USD MILLION)
TABLE 167 TURKEY ENDOCRINOLOGY IN CLINICAL TRIAL IMAGING MARKET, BY APPLICATION, 2020-2029 (USD MILLION)
TABLE 168 TURKEY CARDIOLOGY IN CLINICAL TRIAL IMAGING MARKET, BY APPLICATION, 2020-2029 (USD MILLION)
TABLE 169 TURKEY DERMATOLOGY IN CLINICAL TRIAL IMAGING MARKET, BY APPLICATION, 2020-2029 (USD MILLION)
TABLE 170 TURKEY HEMATOLOGY IN CLINICAL TRIAL IMAGING MARKET, BY APPLICATION, 2020-2029 (USD MILLION)
TABLE 171 TURKEY CLINICAL TRIAL IMAGING MARKET, BY END USER, 2020-2029 (USD MILLION)
TABLE 172 TURKEY CLINICAL TRIAL IMAGING MARKET, BY DISTRIBUTOR, 2020-2029 (USD MILLION)
TABLE 173 REST OF EUROPE CLINICAL TRIAL IMAGING MARKET, BY PRODUCT & SERVICES, 2020-2029 (USD MILLION)
List of Figure
FIGURE 1 EUROPE CLINICAL TRIAL IMAGING MARKET: SEGMENTATION
FIGURE 2 EUROPE CLINICAL TRIAL IMAGING MARKET: DATA TRIANGULATION
FIGURE 3 EUROPE CLINICAL TRIAL IMAGING MARKET: DROC ANALYSIS
FIGURE 4 EUROPE CLINICAL TRIAL IMAGING MARKET: EUROPE VS REGIONAL MARKET ANALYSIS
FIGURE 5 EUROPE CLINICAL TRIAL IMAGING MARKET: COMPANY RESEARCH ANALYSIS
FIGURE 6 EUROPE CLINICAL TRIAL IMAGING MARKET: INTERVIEW DEMOGRAPHICS
FIGURE 7 EUROPE CLINICAL TRIAL IMAGING MARKET: DBMR MARKET POSITION GRID
FIGURE 8 EUROPE CLINICAL TRIAL IMAGING MARKET: MARKET APPLICATION COVERAGE GRID
FIGURE 9 EUROPE CLINICAL TRIAL IMAGING MARKET: VENDOR SHARE ANALYSIS
FIGURE 10 EUROPE CLINICAL TRIAL IMAGING MARKET: SEGMENTATION
FIGURE 11 THE INCREASING NUMBER OF CONTRACT RESEARCH ORGANIZATION AND RISING R&D EXPENDITURE ARE EXPECTED TO DRIVE THE EUROPE CLINICAL TRIAL IMAGING MARKET IN THE FORECAST PERIOD OF 2022 TO 2029
FIGURE 12 SERVICES SEGMENT IS EXPECTED TO ACCOUNT FOR THE LARGEST SHARE OF THE EUROPE CLINICAL TRIAL IMAGING MARKET IN 2022 & 2029
FIGURE 13 DRIVERS, RESTRAINTS, OPPORTUNITIES, AND CHALLENGES OF THE EUROPE CLINICAL TRIAL IMAGING MARKET
FIGURE 14 WORLDWIDE BIOPHARMA COMPANIES R&D EXPENDITURE (IN USD MILLION)
FIGURE 15 THE MARKET GROWTH IN CLINICAL CRO (IN USD MILLIONS)
FIGURE 16 THE FUNCTION OF CRO
FIGURE 17 ESTIMATED NEW CANCER CASES, 2022
FIGURE 18 VALUE OF THE PHARMACEUTICAL SECTOR, WORLDWIDE, 2021 BY COUNTRY (IN MILLION U.S. DOLLARS)
FIGURE 19 EUROPE CLINICAL TRIAL IMAGING MARKET: BY PRODUCTS & SERVICES, 2021
FIGURE 20 EUROPE CLINICAL TRIAL IMAGING MARKET: BY PRODUCTS & SERVICES, 2022-2029 (USD MILLION)
FIGURE 21 EUROPE CLINICAL TRIAL IMAGING MARKET: BY PRODUCTS & SERVICES, CAGR (2022-2029)
FIGURE 22 EUROPE CLINICAL TRIAL IMAGING MARKET: BY PRODUCTS & SERVICES, LIFELINE CURVE
FIGURE 23 EUROPE CLINICAL TRIAL IMAGING MARKET: BY MODALITY, 2021
FIGURE 24 EUROPE CLINICAL TRIAL IMAGING MARKET: BY MODALITY, 2022-2029 (USD MILLION)
FIGURE 25 EUROPE CLINICAL TRIAL IMAGING MARKET: BY MODALITY, CAGR (2022-2029)
FIGURE 26 EUROPE CLINICAL TRIAL IMAGING MARKET: BY MODALITY, LIFELINE CURVE
FIGURE 27 EUROPE CLINICAL TRIAL IMAGING MARKET: BY APPLICATION, 2021
FIGURE 28 EUROPE CLINICAL TRIAL IMAGING MARKET: BY APPLICATION, 2022-2029 (USD MILLION)
FIGURE 29 EUROPE CLINICAL TRIAL IMAGING MARKET: BY APPLICATION, CAGR (2022-2029)
FIGURE 30 EUROPE CLINICAL TRIAL IMAGING MARKET: BY APPLICATION, LIFELINE CURVE
FIGURE 31 EUROPE CLINICAL TRIAL IMAGING MARKET: BY END USER, 2021
FIGURE 32 EUROPE CLINICAL TRIAL IMAGING MARKET: BY END USER, 2022-2029 (USD MILLION)
FIGURE 33 EUROPE CLINICAL TRIAL IMAGING MARKET: BY END USER, CAGR (2022-2029)
FIGURE 34 EUROPE CLINICAL TRIAL IMAGING MARKET: BY END USER, LIFELINE CURVE
FIGURE 35 EUROPE CLINICAL TRIAL IMAGING MARKET: BY DISTRIBUTOR, 2021
FIGURE 36 EUROPE CLINICAL TRIAL IMAGING MARKET: BY DISTRIBUTOR, 2022-2029 (USD MILLION)
FIGURE 37 EUROPE CLINICAL TRIAL IMAGING MARKET: BY DISTRIBUTOR, CAGR (2022-2029)
FIGURE 38 EUROPE CLINICAL TRIAL IMAGING MARKET: BY DISTRIBUTOR, LIFELINE CURVE
FIGURE 39 EUROPE CLINICAL TRIAL IMAGING MARKET: SNAPSHOT (2021)
FIGURE 40 EUROPE CLINICAL TRIAL IMAGING MARKET: BY COUNTRY (2021)
FIGURE 41 EUROPE CLINICAL TRIAL IMAGING MARKET: BY COUNTRY (2022 & 2029)
FIGURE 42 EUROPE CLINICAL TRIAL IMAGING MARKET: BY COUNTRY (2021 & 2029)
FIGURE 43 EUROPE CLINICAL TRIAL IMAGING MARKET: BY PRODUCT AND SERVICES (2022-2029)
FIGURE 44 EUROPE CLINICAL TRIAL IMAGING MARKET: COMPANY SHARE 2021 (%)
Research Methodology
Data collection and base year analysis are done using data collection modules with large sample sizes. The stage includes obtaining market information or related data through various sources and strategies. It includes examining and planning all the data acquired from the past in advance. It likewise envelops the examination of information inconsistencies seen across different information sources. The market data is analysed and estimated using market statistical and coherent models. Also, market share analysis and key trend analysis are the major success factors in the market report. To know more, please request an analyst call or drop down your inquiry.
The key research methodology used by DBMR research team is data triangulation which involves data mining, analysis of the impact of data variables on the market and primary (industry expert) validation. Data models include Vendor Positioning Grid, Market Time Line Analysis, Market Overview and Guide, Company Positioning Grid, Patent Analysis, Pricing Analysis, Company Market Share Analysis, Standards of Measurement, Global versus Regional and Vendor Share Analysis. To know more about the research methodology, drop in an inquiry to speak to our industry experts.
Customization Available
Data Bridge Market Research is a leader in advanced formative research. We take pride in servicing our existing and new customers with data and analysis that match and suits their goal. The report can be customized to include price trend analysis of target brands understanding the market for additional countries (ask for the list of countries), clinical trial results data, literature review, refurbished market and product base analysis. Market analysis of target competitors can be analyzed from technology-based analysis to market portfolio strategies. We can add as many competitors that you require data about in the format and data style you are looking for. Our team of analysts can also provide you data in crude raw excel files pivot tables (Fact book) or can assist you in creating presentations from the data sets available in the report.