North America Automotive Logistics Market
Market Size in USD Billion
CAGR :
% 
 USD
92.11 Billion
USD
133.94 Billion
2024
2032
USD
92.11 Billion
USD
133.94 Billion
2024
2032
| 2025 –2032 | |
| USD 92.11 Billion | |
| USD 133.94 Billion | |
| % | |
|
North America Automotive Logistics Market Size
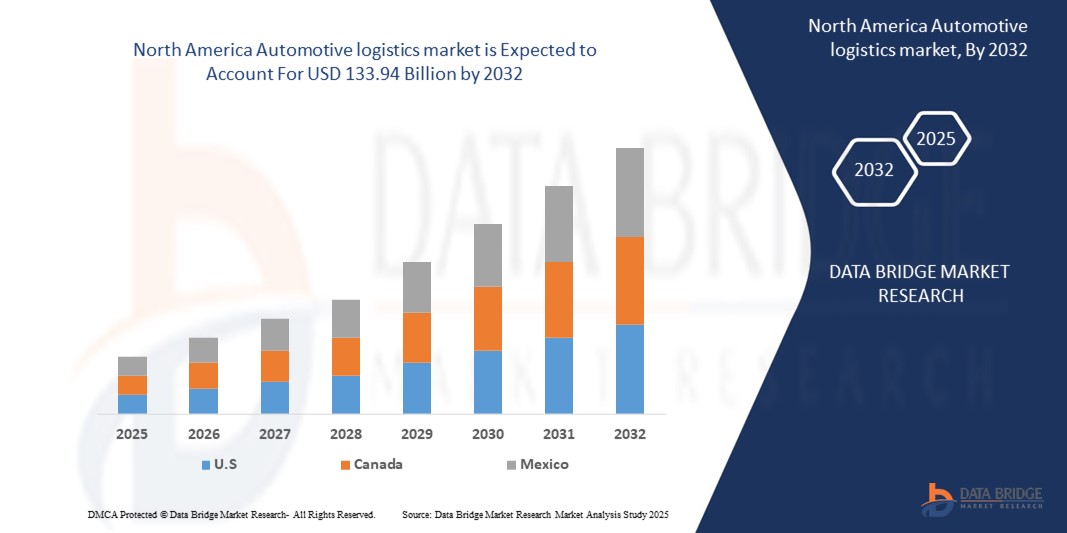
- The North America Automotive logistics market Size was valued at USD 92.11 Billion in 2024 and is expected to reach USD 133.94 Billion by 2032, at a CAGR of 5.5% during the forecast period
- The growth of the North America automotive logistics market is fueled by rising vehicle production, increasing demand for just-in-time delivery, and advancements in digital and electric vehicle supply chains.
North America Automotive Logistics Market Analysis
The North America automotive logistics market is witnessing significant momentum as automotive manufacturers and suppliers increasingly focus on enhancing supply chain visibility, reducing delivery times, and ensuring just-in-time (JIT) inventory management. This market encompasses a wide array of services, including inbound and outbound transportation, warehousing, packaging, material handling, and aftermarket logistics, all aimed at ensuring the seamless movement of parts and vehicles across the region.
A key factor fueling this growth is the rapid digital transformation across the automotive sector. Industry players are adopting smart logistics solutions such as real-time tracking systems, telematics, Internet of Things (IoT), and AI-driven analytics to optimize operations, minimize costs, and improve overall logistics efficiency. The integration of automation and robotics in warehouses, along with predictive maintenance technologies for transport fleets, is enhancing accuracy and throughput across the supply chain.
The proliferation of electric vehicles (EVs) and connected cars is further reshaping logistics needs, as they require specialized handling, reverse logistics for batteries, and temperature-sensitive transport. Additionally, growing cross-border trade under the USMCA agreement is boosting demand for robust logistics networks linking the United States, Canada, and Mexico. Automotive companies are now investing in multimodal transport solutions—combining road, rail, and maritime to manage fluctuating demand and ensure resilient delivery systems.
Cloud-based logistics platforms are also gaining traction, enabling real-time data sharing, fleet monitoring, and supply chain coordination. These platforms offer benefits such as scalability, faster deployment, cost-efficiency, and integration with enterprise resource planning (ERP) systems, making them particularly attractive to small and mid-sized logistics providers aiming to scale their services without large capital expenditure.
However, the market faces certain challenges. Driver shortages, fluctuating fuel prices, and infrastructure constraints in key transportation corridors pose operational risks. Additionally, regulatory compliance especially related to emissions, safety standards, and cross-border documentation adds complexity. The logistics sector must also manage legacy system integration, data silos, and the increasing demand for environmentally sustainable logistics solutions to remain competitive and compliant.
Despite these challenges, the North America automotive logistics market is poised for continued growth, driven by innovation, digitalization, and the ongoing evolution of the automotive industry. Companies that leverage technology, adopt sustainable practices, and invest in talent and infrastructure will be best positioned to lead in this dynamic and essential market.
Report Scope and North America Automotive Logistics Market Segmentation
|
Attributes |
North America Automotive logistics market Insights |
|
Segments Covered |
|
|
Countries Covered |
North America
|
|
Key Market Players |
|
|
Market Opportunities |
|
|
Value Added Data Infosets |
In addition to the insights on market scenarios such as market value, growth rate, segmentation, geographical coverage, and major players, the market reports curated by the Data Bridge Market Research also include in-depth expert analysis, pricing analysis, brand share analysis, consumer survey, demography analysis, supply chain analysis, value chain analysis, raw material/consumables overview, vendor selection criteria, PESTLE Analysis, Porter Analysis, and regulatory framework. |
North America Automotive Logistics Market Trends
“Smart Logistics Revolution: Driving Efficiency Through Advanced Technologies”
- A significant and accelerating trend in the North America automotive logistics market is the integration of smart technologies, including IoT sensors, telematics, GPS tracking, and cloud-based fleet management platforms. These advancements enable real-time shipment tracking, route optimization, and predictive analytics, enhancing operational efficiency and transparency across the supply chain.
- Logistics providers are increasingly adopting AI-driven predictive maintenance systems for fleet vehicles and warehouse equipment. These systems reduce unplanned downtime, improve asset utilization, and lower operational costs through data-driven diagnostics and self-monitoring capabilities.
- The use of automated and contactless logistics solutions is gaining traction, especially in the handling of sensitive automotive components like EV batteries, semiconductors, and electronic control units, where safety, precision, and hygiene are critical.
- The convergence of Industry 4.0, edge computing, and digital twins is transforming automotive logistics by enabling real-time data exchange between warehouses, transport fleets, and OEMs resulting in smarter, faster, and more responsive logistics ecosystems.
North America Automotive Logistics Market Dynamics
Driver
“Rising Demand for Efficiency, Visibility, and Technological Advancement”
- The increasing complexity of automotive supply chains, especially due to just-in-time (JIT) and just-in-sequence (JIS) manufacturing models, is driving the need for highly efficient, synchronized logistics systems that can ensure timely delivery of components with minimal inventory holding.
- The rapid growth in electric vehicle (EV) manufacturing across North America is creating a strong demand for specialized logistics services capable of handling hazardous and temperature-sensitive components like lithium-ion batteries, power electronics, and EV-specific parts.
- Strengthening cross-border automotive trade under the USMCA (United States–Mexico–Canada Agreement) is intensifying logistics activity across North America, requiring robust multimodal transportation networks and customs-efficient logistics solutions.
- Advancements in digital technologies—such as IoT sensors, AI-powered predictive analytics, and cloud-based transport management systems—are enabling real-time visibility, dynamic routing, and proactive risk management, transforming logistics into a strategic enabler for OEMs and suppliers.
- The rise of e-commerce in automotive spare parts and aftermarket segments is fueling the demand for agile, fast, and accurate logistics solutions, including last-mile delivery services, reverse logistics, and real-time tracking for both B2B and B2C customers.
Restraint/Challenge
“High Costs, Operational Complexities and Infrastructure Limitations”
- High capital investment required for deploying advanced logistics technologies—such as warehouse automation, telematics, AI-powered fleet management systems, and real-time tracking platforms acts as a significant barrier, particularly for small and mid-sized logistics providers that operate on thin margins.
- Technical complexity in integration is a persistent challenge. Many legacy systems used by automotive OEMs and Tier-1 suppliers are incompatible with newer logistics technologies. Achieving seamless communication across platforms and ensuring system-wide data visibility demands significant IT investment and expertise, which not all companies can afford.
- Shortage of skilled labor in logistics technology and operations hampers the ability to fully utilize modern tools. There is a growing need for workforce training in areas like predictive maintenance, data analytics, and cross-border compliance skills that are currently in short supply across the region.
- Regulatory fragmentation across North America such as varying environmental standards, customs documentation requirements, and road transport regulations—adds administrative complexity and delays to cross-border movement of automotive parts and vehicles under the USMCA agreement.
- Infrastructure challenges, including congestion at key ports and border crossings, lack of investment in aging transportation networks, and regional disparities in warehouse availability, limit scalability and efficiency especially for companies expanding into rural or high-growth urban areas.
- Vulnerability to global supply chain disruptions, such as semiconductor shortages, labor strikes, or geopolitical events, continues to expose weaknesses in automotive logistics, causing delays, increased costs, and the need for more resilient, diversified supply strategies.
North America Automotive Logistics Market Scope
The market is segmented on the basis of Logistics Service, Type of Goods, Mode of Transport and Function.
- By Logistics Service
The North America automotive logistics market covers a comprehensive range of logistics services that support the entire automotive value chain. This includes inbound logistics, which manages the transportation of raw materials and components to manufacturing plants using just-in-time (JIT) and just-in-sequence (JIS) models. Outbound logistics focuses on the movement of finished vehicles from factories to dealerships and export locations, involving multimodal transport solutions such as road, rail, and sea. Aftermarket logistics is another critical segment, dealing with the distribution of spare parts and accessories to service centers, retailers, and end users, requiring flexible and time-sensitive delivery networks. In addition, reverse logistics plays an essential role by handling product returns, recalls, and remanufacturing flows, ensuring cost efficiency and sustainability.
- By Type of Goods
The scope of the North America automotive logistics market, when categorized by type of goods, includes two major segments: finished vehicles and automobile parts/components. The finished goods segment involves the transportation, handling, and distribution of fully assembled vehicles from manufacturing plants to dealerships, export hubs, or end customers. This includes multimodal transportation services (road, rail, and sea), vehicle yard management, pre-delivery inspections, and customs clearance where applicable. On the other hand, the automobile parts/components segment encompasses the movement of raw materials, subassemblies, and individual automotive components such as engines, electronics, tires, and body panels throughout the supply chain. This covers both inbound logistics (from suppliers to OEMs) and aftermarket logistics (from parts manufacturers to retailers and service centers). With the rising demand for electric vehicles and just-in-time manufacturing models, this segment also includes the specialized handling of sensitive and high-value components like EV batteries, semiconductors, and electronics. Both segments are critical to maintaining production continuity and ensuring timely delivery across the automotive ecosystem.
- By Mode of Transport
The North America automotive logistics market, when segmented by mode of transport, includes road, rail, maritime, and air transport, each playing a vital role in different stages of the supply chain. Road transport holds the largest share, owing to its flexibility, cost-effectiveness, and ability to support both short and long-haul deliveries of automotive parts and finished vehicles. It is widely used for factory-to-dealer vehicle transport, last-mile delivery of spare parts, and time-sensitive inbound logistics. Rail transport is extensively used for the bulk movement of vehicles and heavy components across long distances, particularly in cross-border trade between the U.S., Canada, and Mexico. It offers high capacity and fuel efficiency, making it suitable for large-scale shipments in a cost-effective manner. Maritime transport supports the international shipping of finished vehicles and automotive parts, especially for exports and imports through major North American ports. It is essential for OEMs and Tier-1 suppliers engaged in global trade and offshore manufacturing. Air transport, though the least utilized in terms of volume, plays a critical role in high-value, time-sensitive shipments, such as electronic parts, semiconductors, or urgent replacement components. It is typically used in emergency logistics scenarios and for premium automotive brands with tight delivery schedules.
- By Function
The North America automotive logistics market, when analyzed by function, is broadly categorized into transportation, warehousing, management, and other support services. Transportation forms the core function, covering the movement of both automotive components and finished vehicles across the supply chain using various modes such as road, rail, maritime, and air. This function ensures timely delivery to manufacturing plants, distribution centers, dealerships, and end customers. Warehousing involves the storage, sorting, and inventory control of automotive parts and vehicles. It includes inbound storage for production components, distribution hubs for aftermarket parts, and vehicle yards for finished car storage and pre-delivery inspection. The growing demand for efficient inventory management and just-in-time delivery has amplified the need for strategically located and technologically enabled warehousing solutions. Management services encompass logistics planning, fleet management, route optimization, and IT-driven supply chain visibility tools. These services help manufacturers and logistics providers enhance operational efficiency, reduce costs, and improve delivery performance through real-time tracking and analytics. Other services include value-added offerings such as packaging, labeling, kitting, sequencing, sub-assembly, and customs brokerage. These functions support streamlined production workflows and ensure compliance with regional trade regulations. Collectively, these logistics functions enable a robust and responsive automotive supply chain across North America.
North America Automotive Logistics Market Regional Analysis
- The North America automotive logistics market is primarily driven by activity in the United States, which holds the largest market share due to its expansive automotive manufacturing base, established logistics infrastructure, and high adoption of advanced technologies such as telematics, IoT-enabled fleet management, and autonomous warehouse systems. Major automotive hubs like Michigan, Ohio, and Tennessee contribute significantly to inbound and outbound logistics flows, while key ports (e.g., Los Angeles, Houston) support international vehicle and parts trade.
- Canada plays a critical role in cross-border logistics, particularly as a supplier of automotive components and as a hub for finished vehicle distribution under the United States-Mexico-Canada Agreement (USMCA). Ontario, home to several OEM assembly plants and Tier-1 suppliers, is central to Canada’s automotive logistics network. The country’s emphasis on sustainable logistics practices and multimodal integration (rail and road) is also shaping market growth.
- Mexico has emerged as a vital player in the regional logistics ecosystem due to its rapidly growing automotive manufacturing sector, cost-competitive labor, and proximity to U.S. markets. States such as Nuevo León, Puebla, and Guanajuato are key manufacturing and export centers. Automotive logistics in Mexico heavily involves cross-border trucking, customs management, and specialized handling of components and finished vehicles.
- Together, these three countries form an integrated automotive logistics corridor with strong trade interconnectivity, supported by evolving infrastructure, policy alignment through USMCA, and growing investments in automation and digital supply chain management.
Automotive Logistics Market Share
The North America Automotive Logistics Industry is primarily led by well-established companies, including:
- DHL Supply Chain
- XPO Logistics
- Ryder System, Inc.
- Penske Logistics
- DB Schenker
- J.B. Hunt Transport Services
- Kuehne + Nagel
- CEVA Logistics
- Landstar System
- Toyota Tsusho America
- Honda Logistics North America
- Glovis America
- C.H. Robinson
- project44
- FourKites
- Jack Cooper Transport
- AutoTransport.com
Latest Developments in North America Automotive Logistics Market
- In May 2025, Aurora Innovation and Volvo Autonomous Solutions, in partnership with DHL Supply Chain, launched autonomous freight services along the Dallas-Houston corridor. This deployment of Level 4 driverless trucks represents a major milestone in commercializing self-driving logistics in North America, enhancing long-haul freight efficiency and safety.
- In April 2025, Ryder System Inc. announced the acquisition of Cardinal Logistics, strengthening its presence in dedicated transportation services and enhancing its automotive logistics capabilities across the U.S. The acquisition aligns with Ryder’s strategy to scale up capacity and offer integrated end-to-end logistics solutions.
- In March 2025, Proficient Auto Logistics expanded its footprint in the northeastern U.S. by acquiring Brothers Auto Transport, boosting its finished vehicle logistics services and increasing operational capacity across key high-demand regions.
- In February 2025, U.S. ports such as Port of Los Angeles and Port of Houston began infrastructure upgrades to accommodate increased electric vehicle (EV) imports. These include the development of specialized EV handling zones and cold storage warehousing to support battery logistics and temperature-sensitive components.
- In January 2025, Orange EV, a U.S.-based electric terminal truck manufacturer, deployed its electric yard tractors across major automotive logistics hubs in Michigan and Texas. This move is part of broader efforts to reduce carbon emissions and modernize yard operations within automotive supply chains.
- In December 2024, C.H. Robinson integrated AI-powered route optimization and digital freight matching into its automotive logistics platform, improving real-time visibility, reducing transit delays, and enhancing the responsiveness of just-in-time delivery systems for OEMs and Tier-1 suppliers.
SKU-
Get online access to the report on the World's First Market Intelligence Cloud
- Interactive Data Analysis Dashboard
- Company Analysis Dashboard for high growth potential opportunities
- Research Analyst Access for customization & queries
- Competitor Analysis with Interactive dashboard
- Latest News, Updates & Trend analysis
- Harness the Power of Benchmark Analysis for Comprehensive Competitor Tracking
Research Methodology
Data collection and base year analysis are done using data collection modules with large sample sizes. The stage includes obtaining market information or related data through various sources and strategies. It includes examining and planning all the data acquired from the past in advance. It likewise envelops the examination of information inconsistencies seen across different information sources. The market data is analysed and estimated using market statistical and coherent models. Also, market share analysis and key trend analysis are the major success factors in the market report. To know more, please request an analyst call or drop down your inquiry.
The key research methodology used by DBMR research team is data triangulation which involves data mining, analysis of the impact of data variables on the market and primary (industry expert) validation. Data models include Vendor Positioning Grid, Market Time Line Analysis, Market Overview and Guide, Company Positioning Grid, Patent Analysis, Pricing Analysis, Company Market Share Analysis, Standards of Measurement, Global versus Regional and Vendor Share Analysis. To know more about the research methodology, drop in an inquiry to speak to our industry experts.
Customization Available
Data Bridge Market Research is a leader in advanced formative research. We take pride in servicing our existing and new customers with data and analysis that match and suits their goal. The report can be customized to include price trend analysis of target brands understanding the market for additional countries (ask for the list of countries), clinical trial results data, literature review, refurbished market and product base analysis. Market analysis of target competitors can be analyzed from technology-based analysis to market portfolio strategies. We can add as many competitors that you require data about in the format and data style you are looking for. Our team of analysts can also provide you data in crude raw excel files pivot tables (Fact book) or can assist you in creating presentations from the data sets available in the report.