North America Cancer Supportive Care Products Market
Market Size in USD Billion
CAGR :
% 
 USD
13.27 Billion
USD
19.16 Billion
2024
2032
USD
13.27 Billion
USD
19.16 Billion
2024
2032
| 2025 –2032 | |
| USD 13.27 Billion | |
| USD 19.16 Billion | |
| % | |
|
Cancer Supportive Care Products Market Size
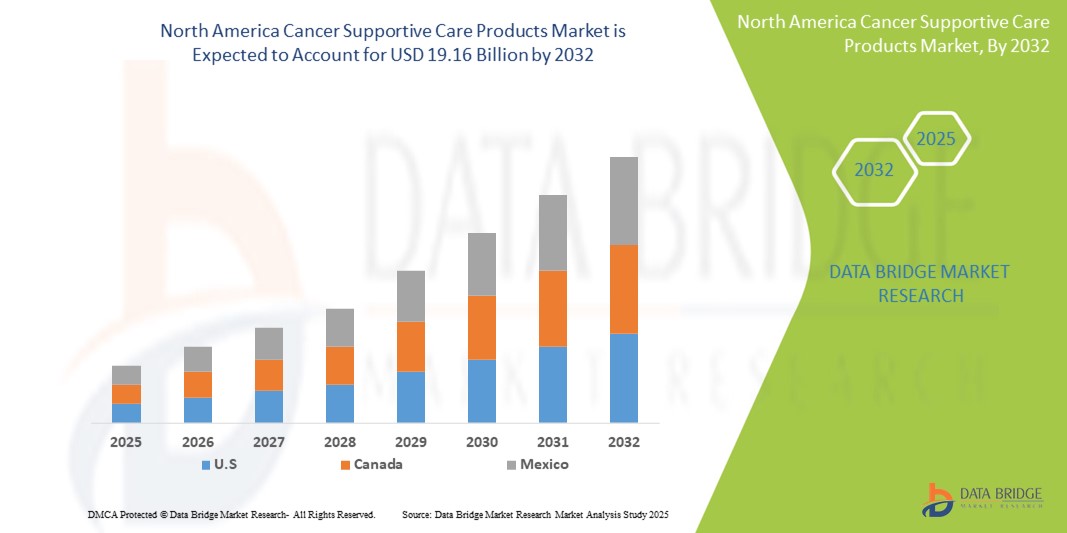
- The North America Cancer Supportive Care Products Market size was valued at USD 13.27 billion in 2024 and is expected to reach USD 19.16 billion by 2032, at a CAGR of 4.70% during the forecast period
- The market growth is largely fueled by the increasing prevalence of cancer and the growing demand for effective supportive therapies across North America, leading to enhanced focus on patient quality of life during treatment.
- Furthermore, rising awareness among healthcare providers and patients regarding the benefits of adjunct therapies—such as anti-emetics, GCSFs, and pain management drugs—is establishing supportive care products as a critical component of comprehensive cancer care. These converging factors are accelerating the adoption of cancer supportive care solutions, thereby significantly boosting the region’s market growth
Cancer Supportive Care Products Market Analysis
- Cancer supportive care products, which include therapies such as anti-emetics, erythropoietin-stimulating agents, GCSFs, and pain management solutions, are increasingly vital components of comprehensive oncology treatment protocols in both hospital and outpatient settings due to their role in minimizing treatment-related side effects, improving patient quality of life, and ensuring treatment adherence.
- The escalating demand for cancer supportive care products is primarily fueled by the rising cancer incidence across North America, growing emphasis on value-based care, and increased awareness among healthcare professionals regarding the importance of symptom management alongside primary cancer treatment.
- North America dominates the cancer supportive care products market with the largest revenue share in 2025, driven by high cancer prevalence rates, advanced healthcare infrastructure, favorable reimbursement frameworks, and the strong presence of leading pharmaceutical companies. The U.S., in particular, is experiencing substantial growth in the adoption of supportive care drugs, especially in academic institutions and specialty oncology centers, supported by ongoing clinical advancements and product innovations aimed at reducing treatment-related toxicity.
- Canada and Mexico are also contributing to regional market growth, supported by national cancer care programs, expanding oncology services, and rising patient access to biosimilars and generic supportive therapies.
- The Granulocyte Colony Stimulating Factor (GCSF) segment is expected to dominate the North America market in 2025, owing to its critical role in managing chemotherapy-induced neutropenia, high prescription volume, and established clinical efficacy in preventing infections during treatment cycles.
Report Scope and Cancer Supportive Care Products Market Segmentation
|
Attributes |
Cancer Supportive Care Products Key Market Insights |
|
Segments Covered |
|
|
Countries Covered |
North America
|
|
Key Market Players |
|
|
Market Opportunities |
|
|
Value Added Data Infosets |
In addition to the insights on market scenarios such as market value, growth rate, segmentation, geographical coverage, and major players, the market reports curated by the Data Bridge Market Research also include in-depth expert analysis, pricing analysis, brand share analysis, consumer survey, demography analysis, supply chain analysis, value chain analysis, raw material/consumables overview, vendor selection criteria, PESTLE Analysis, Porter Analysis, and regulatory framework. |
Cancer Supportive Care Products Market Trends
“Personalized Supportive Care Through Advanced Therapeutics and Digital Integration”
- A significant and accelerating trend in the North America cancer supportive care products market is the growing adoption of advanced therapeutic formulations and integration with digital health tools, which enhance patient monitoring, adherence, and symptom management throughout the cancer treatment journey. This evolution is significantly improving the overall quality of care and patient outcomes.
- For instance, Heron Therapeutics’ innovative formulation of sustained-release anti-emetics like Aponvie provides extended control of chemotherapy-induced nausea and vomiting (CINV), reducing the burden of frequent dosing. Similarly, Amgen’s Neulasta Onpro wearable device delivers GCSF automatically the day after chemotherapy, improving adherence and reducing hospital visits.
- Integration with digital health platforms allows for real-time monitoring of symptoms, personalized dose adjustments, and intelligent alerts to healthcare providers. For example, some oncology clinics in the U.S. are leveraging patient-reported outcomes platforms to track side effects and proactively modify supportive care regimens. These solutions enable earlier intervention and improved patient safety.
- The seamless coordination of supportive care medications with electronic health records (EHRs) and oncology-specific digital tools facilitates more holistic treatment planning. Through integrated platforms, oncologists can manage anti-nausea drugs, pain medications, and growth factors alongside primary therapies, ensuring a coordinated and patient-centric care approach.
- This trend toward personalized, technology-enabled supportive care is reshaping expectations in oncology. As a result, pharmaceutical and biotech companies like Pfizer and Helsinn Healthcare are focusing on next-generation supportive therapies that combine clinical efficacy with delivery innovations, such as long-acting injectables, subcutaneous formulations, and patient-friendly administration devices.
- The demand for supportive care products that align with personalized cancer management and digital monitoring tools is growing rapidly across hospitals, specialty clinics, and home-based care settings in North America, as providers and patients increasingly prioritize quality of life and treatment adherence.
Cancer Supportive Care Products Market Dynamics
Driver
“Rising Cancer Prevalence and Demand for Integrated Supportive Therapies”
- The increasing incidence of cancer across the U.S., Canada, and Mexico, along with the growing emphasis on improving patients’ quality of life during and after treatment, is a major driver of demand in the North America cancer supportive care products market.
- For instance, in March 2024, Amgen expanded access to its Neulasta Onpro Kit across more outpatient oncology centers in the U.S., reinforcing its commitment to improving neutropenia management while reducing hospital visits. Such initiatives from leading players are expected to significantly propel the growth of the cancer supportive care sector in the region.
- As cancer treatment regimens become more aggressive and complex, the need for effective supportive therapies—such as GCSFs, anti-emetics, and pain management drugs—is growing to mitigate side effects like nausea, fatigue, anemia, and infections. These products offer essential clinical support that allows patients to better tolerate and complete their treatment protocols.
- Furthermore, there is a growing demand for integrated oncology care, where supportive medications are delivered in alignment with primary therapies through coordinated care models. Hospitals and specialty clinics are increasingly adopting treatment pathways that include preventive and symptomatic supportive care as part of standard protocols.
- The rising focus on outpatient care, patient convenience, and home-based administration options—enabled by innovations like long-acting injectables and wearable drug delivery devices—is also driving adoption. The increasing availability of branded and generic formulations across hospital and retail pharmacies further supports market expansion in North America.
Restraint/Challenge
“High-Cost Burden and Limited Reimbursement for Supportive Therapies”
- One of the major challenges restraining growth in the North America cancer supportive care products market is the high cost associated with many supportive therapies, particularly biologics such as GCSFs and monoclonal antibodies, which can significantly increase the overall financial burden of cancer treatment.
- For instance, patients undergoing chemotherapy may require long-term supportive interventions for managing anemia, neutropenia, and nausea, and the cumulative cost of these adjunct therapies can be substantial, especially for those without comprehensive insurance coverage.
- Additionally, limited reimbursement policies for certain supportive care medications—especially newer, branded agents or off-label uses—can restrict access among patients from lower-income or underinsured groups. Payers often prioritize core oncologic therapies, leaving supportive agents subject to prior authorizations or coverage caps.
- Addressing this challenge requires broader inclusion of supportive care within cancer treatment reimbursement models, as well as policy initiatives to improve affordability and access through value-based pricing strategies and patient assistance programs.
- Moreover, even with the growing availability of generics, disparities in access to quality cancer care remain in parts of rural or underserved communities in the U.S. and Mexico, where oncology infrastructure and specialist access are limited.
- Overcoming these barriers through expanded coverage, pricing reforms, and targeted support initiatives will be essential to ensure equitable and consistent access to supportive care across North America.
Cancer Supportive Care Products Market Scope
The market is segmented on the basis of drug type, type (branded and generics), cancer type, end user, and distribution channel.
By Drug Type
On the basis of drug type, the North America cancer supportive care products market is segmented into granulocyte colony stimulating factors (G-CSFs), erythropoietin stimulating agents (ESAs), opioid analgesics, monoclonal antibodies, nonsteroidal anti-inflammatory drugs (NSAIDs), bisphosphonates, anti-emetics, antihistamines, and others. The G-CSFs segment dominates the largest market revenue share in 2025, driven by its critical role in reducing the risk of infection during chemotherapy-induced neutropenia. The high frequency of chemotherapy cycles and the clinical efficacy of G-CSFs in minimizing treatment disruptions continue to support its widespread use across oncology practices.
The anti-emetics segment is anticipated to witness the fastest growth rate from 2025 to 2032, fueled by the rising focus on improving patient quality of life during cancer treatment. These drugs play a pivotal role in managing chemotherapy-induced nausea and vomiting (CINV), a common and distressing side effect. Increasing approvals of novel formulations, along with expanding usage across various cancer types and treatment regimens, are contributing to the segment’s rapid growth in North America.
By Distribution Channel
On the basis of distribution channel, the North America cancer supportive care products market is segmented into hospital pharmacies, retail pharmacies, and compounding pharmacies. The hospital pharmacies segment held the largest market revenue share in 2025, driven by the high volume of oncology treatments administered in hospital settings and the immediate availability of supportive care medications for inpatients. The centralized nature of hospital procurement ensures consistent supply and clinical supervision, supporting patient adherence and safety.
The retail pharmacies segment is expected to witness the fastest CAGR from 2025 to 2032, fueled by the growing shift toward outpatient cancer treatment and increasing access to supportive medications through community pharmacies. Convenience, expanded insurance coverage, and patient preference for local fulfillment are driving adoption. Retail chains are also investing in pharmacist-led support programs to assist cancer patients in managing side effects, contributing to segment growth across North America.
By Route of Administration
On the basis of route of administration, the North America cancer supportive care products market is segmented into oral, parenteral, and others. The oral segment held the largest market revenue share in 2025, driven by patient preference for non-invasive treatment methods and the convenience of at-home medication administration. Oral supportive care drugs, including antiemetics, analgesics, and erythropoiesis-stimulating agents, allow for better compliance and reduce the need for frequent clinical visits, making them a widely adopted option across the region.
The parenteral segment is expected to witness the fastest CAGR from 2025 to 2032, supported by its rapid therapeutic action and necessity for certain supportive treatments like G-CSFs and monoclonal antibodies. Parenteral administration is preferred in acute care settings and for patients undergoing intensive chemotherapy, where immediate and controlled drug delivery is essential for managing treatment-related complications.
By Cancer Type
On the basis of cancer type, the North America cancer supportive care products market is segmented into lung cancer, breast cancer, prostate cancer, liver cancer, bladder cancer, leukemia, melanoma, ovarian cancer, and other cancers. The breast cancer segment accounted for the largest market revenue share in 2024, driven by the high incidence of breast cancer among women in the U.S. and Canada, as well as the need for comprehensive supportive therapies such as antiemetics, colony-stimulating factors, and pain management agents to address treatment-related complications. The strong presence of awareness campaigns and early screening programs has also contributed to increased treatment uptake, boosting demand for supportive care.
The lung cancer segment is projected to witness the fastest CAGR from 2025 to 2032, fueled by rising prevalence, late-stage diagnoses, and the growing use of aggressive chemotherapy and targeted therapies, which necessitate adjunct supportive care. Increased research focus and supportive reimbursement frameworks further aid in expanding access to supportive medications for lung cancer patients across North America.
Cancer Supportive Care Products Market Regional Analysis
- The United States dominates the North America cancer supportive care products market with the largest revenue share in 2024, driven by a high prevalence of cancer, increasing treatment rates, and the well-established healthcare infrastructure supporting advanced supportive therapies.
- Patients and healthcare providers in the region prioritize comprehensive supportive care to manage side effects associated with chemotherapy, radiotherapy, and targeted cancer treatments, resulting in strong demand for products such as antiemetics, colony-stimulating factors, and pain management drugs.
- This widespread usage is further supported by robust reimbursement policies, high awareness levels, and the availability of novel biologics and biosimilars, positioning cancer supportive care as an essential component of oncology treatment regimens across hospitals, clinics, and specialty centers.
U.S. Cancer Supportive Care Products Market Insight
The U.S. cancer supportive care products market captured the largest revenue share of approximately 85% within North America in 2024, driven by the country’s advanced healthcare infrastructure and high incidence of cancer diagnoses. Patients and healthcare providers increasingly emphasize comprehensive management of cancer treatment side effects, boosting demand for supportive therapies such as granulocyte colony-stimulating factors (GCSFs), antiemetics, and opioid analgesics. The growing adoption of innovative biologics and biosimilars, alongside strong reimbursement frameworks and awareness campaigns, further propels market growth. Moreover, the expanding oncology patient population and rising investment in cancer care research are significant contributors to the market’s sustained expansion in the U.S.
Canada Cancer Supportive Care Products Market Insight
The Canada cancer supportive care products market is expected to grow steadily during the forecast period, driven by rising cancer incidence and increasing investments in healthcare infrastructure. Government initiatives to improve cancer patient outcomes, coupled with widespread access to advanced therapies such as granulocyte colony-stimulating factors and opioid analgesics, support market expansion. Growing awareness about supportive care therapies and increasing focus on palliative care are fostering adoption across hospitals and specialty clinics. The country’s strong healthcare reimbursement frameworks and rising demand for personalized supportive treatments further contribute to market growth in both urban and rural areas.
Mexico Cancer Supportive Care Products Market Insight
The Mexico cancer supportive care products market is projected to grow at a significant CAGR over the forecast period, driven by increasing cancer prevalence and improving healthcare access across the country. Government initiatives aimed at expanding oncology services and enhancing supportive care are accelerating market adoption. The rising availability of generic supportive care medications, coupled with growing awareness about managing cancer-related symptoms and side effects, is fostering demand in hospitals, clinics, and specialty centers. Additionally, increasing investments in healthcare infrastructure and public-private partnerships are expected to strengthen the market’s growth trajectory in Mexico.
Cancer Supportive Care Products Market Share
The Cancer Supportive Care Products industry is primarily led by well-established companies, including:
- Amgen Inc. (USA)
- Janssen Pharmaceuticals, Inc. (A Subsidiary of Johnson & Johnson Services, Inc.) (USA)
- Pfizer Inc. (USA)
- APR (USA)
- Novartis AG (Switzerland)
- F. Hoffmann-La Roche Ltd. (Switzerland)
- Acacia Pharma Group Plc. (UK)
- Baxter (USA)
- Bayer AG (Germany)
- Helsinn Healthcare SA (Switzerland)
- Heron Therapeutics, Inc. (USA)
- Kyowa Kirin Co., Ltd. (Japan)
- Acrotech Biopharma (USA)
- Spectrum Pharmaceuticals, Inc. (USA)
- Oxford Pharmascience Ltd (UK)
- Merck Sharp & Dohme Corp. (A Subsidiary of Merck & Co., Inc.) (USA)
- Teva (A Subsidiary of Teva Pharmaceutical Industries Ltd.) (Israel)
- Tersera Therapeutics LLC (USA)
- Mylan N.V. (USA / Netherlands - Mylan was originally USA based, now part of Viatris headquartered in USA)
- Sun Pharmaceutical Industries Ltd. (India)
- Dr. Reddy’s Laboratories (India)
- Fresenius Kabi (Germany)
- Tolmar Inc. (USA)
- AbbVie Inc. (USA)
- Sanofi (France)
Latest Developments in North America Cancer Supportive Care Products Market
- In April 2025, Germany's Merck announced its acquisition of U.S.-based biotech firm SpringWorks Therapeutics for USD3.9 billion. This strategic move aims to bolster Merck's oncology portfolio, particularly in rare tumors, and is expected to enhance the company's presence in the U.S. market
- In March 2024, AstraZeneca agreed to acquire Canadian company Fusion Pharmaceuticals for USD2.4 billion. Fusion specializes in radioconjugates, a next-generation cancer treatment that targets cancer cells with radioactive isotopes, minimizing damage to healthy cells. This acquisition is set to enhance AstraZeneca's oncology pipeline and expand its presence in Canada
- In September 2023, Cardinal Health announced its plan to acquire Integrated Oncology Network for USD1.12 billion. This acquisition is part of Cardinal Health's strategy to expand into the oncology care sector, merging its cancer-focused unit Navista with Integrated Oncology Network's extensive network, which includes over 100 healthcare providers across 10 states and more than 50 practice sites
- In November 2023, AbbVie announced its agreement to acquire ImmunoGen, including its flagship cancer therapy ELAHERE® (mirvetuximab soravtansine-gynx), for approximately USD10.1 billion. This acquisition is expected to expand AbbVie's solid tumor portfolio and strengthen its position in the oncology market.
- In December 2022, the U.S. Food and Drug Administration (FDA) approved atezolizumab (Tecentriq), an immunotherapy drug developed by F. Hoffmann-La Roche Ltd., for treating Alveolar Soft Part Sarcoma (ASPS) in adults and children aged 2 and older if the disease has metastasized or is inoperable. This approval marked a significant advancement in cancer supportive care treatments
SKU-
Get online access to the report on the World's First Market Intelligence Cloud
- Interactive Data Analysis Dashboard
- Company Analysis Dashboard for high growth potential opportunities
- Research Analyst Access for customization & queries
- Competitor Analysis with Interactive dashboard
- Latest News, Updates & Trend analysis
- Harness the Power of Benchmark Analysis for Comprehensive Competitor Tracking
Research Methodology
Data collection and base year analysis are done using data collection modules with large sample sizes. The stage includes obtaining market information or related data through various sources and strategies. It includes examining and planning all the data acquired from the past in advance. It likewise envelops the examination of information inconsistencies seen across different information sources. The market data is analysed and estimated using market statistical and coherent models. Also, market share analysis and key trend analysis are the major success factors in the market report. To know more, please request an analyst call or drop down your inquiry.
The key research methodology used by DBMR research team is data triangulation which involves data mining, analysis of the impact of data variables on the market and primary (industry expert) validation. Data models include Vendor Positioning Grid, Market Time Line Analysis, Market Overview and Guide, Company Positioning Grid, Patent Analysis, Pricing Analysis, Company Market Share Analysis, Standards of Measurement, Global versus Regional and Vendor Share Analysis. To know more about the research methodology, drop in an inquiry to speak to our industry experts.
Customization Available
Data Bridge Market Research is a leader in advanced formative research. We take pride in servicing our existing and new customers with data and analysis that match and suits their goal. The report can be customized to include price trend analysis of target brands understanding the market for additional countries (ask for the list of countries), clinical trial results data, literature review, refurbished market and product base analysis. Market analysis of target competitors can be analyzed from technology-based analysis to market portfolio strategies. We can add as many competitors that you require data about in the format and data style you are looking for. Our team of analysts can also provide you data in crude raw excel files pivot tables (Fact book) or can assist you in creating presentations from the data sets available in the report.