



Asia-Pacific Augmented Reality (AR) & Mixed Reality (MR) Market, By Component (Hardware, Software, Services), Deployment Model (Cloud, On Premise), Distribution Channel (Offline, Online), Device Type (Head Up Display, Head Mounted Display, Projector & Display Wall, Gesture Tracking Devices), Technology (Mobile Augmented Reality, Monitor-Based Technology, Near Eye Based Technology), Application (Workflow Optimization, Marketing Collaboration, Enhanced 2-D & 3-D, Visualizations, 3D Modelling, Documentation, Navigation), End User (Retail & E-Commerce, IT & Telecommunication, Automotive, Aerospace & Defense, Healthcare, Animation, Travel & Tourism, Energy, Media & Entertainment, Education, Construction, Games & Sports, Banking) - Industry Trends and Forecast to 2029.
Asia-Pacific Augmented Reality (AR) and Mixed Reality (MR) Market Analysis and Insights
Augmented reality and mixed reality have brought a new change to digitalization. It has now become easier to experience the real world by setting different environmental conditions. Augmented reality & mixed reality has a wide range of applications, the growth of the market increased highly as the use of augmented reality and mixed reality became popular in driving simulators. The augmented reality and mixed reality provide the driver with a real sense of the road, driving conditions, car manuals, and road traffic that helps avoid accidents at an initial stage of learning and prepares the drivers for various situations. These attributes have led to an increased usage of augmented reality and mixed reality in defense and aerospace also. The army personnel used it for training in various conditions such as parachute jumping, submarine, combat situations, and driving in various environmental conditions.
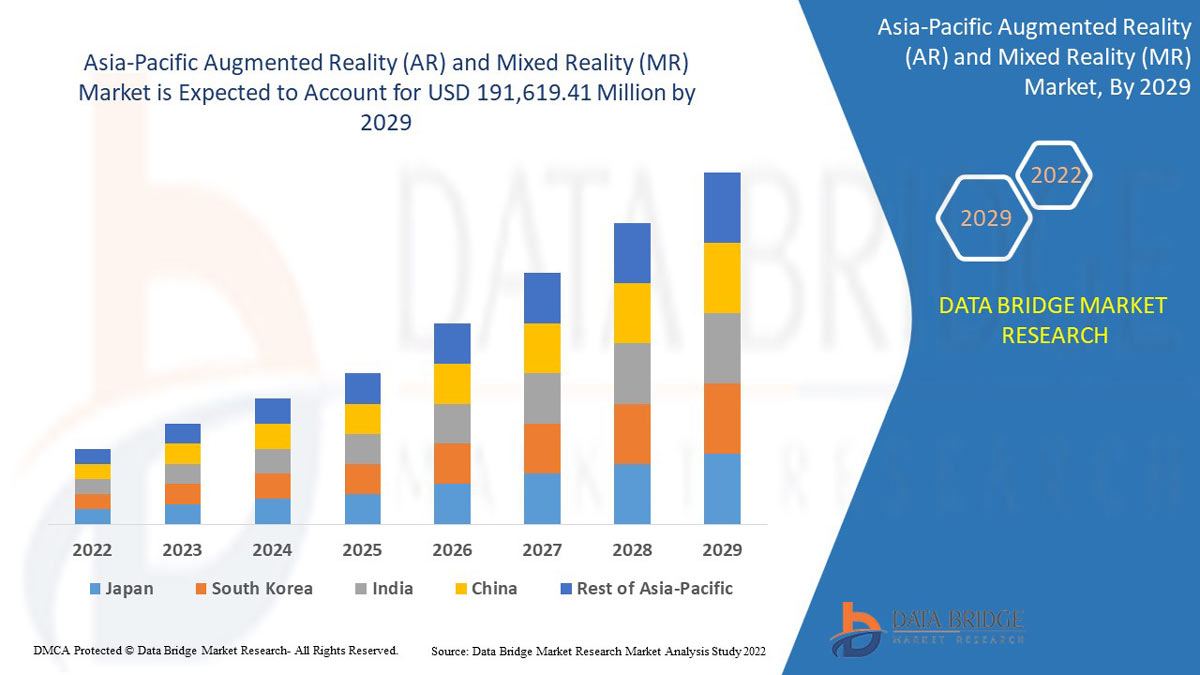
Data Bridge Market Research analyses that the Asia-Pacific augmented reality (AR) & mixed reality (MR) market is expected to reach the value of USD 191,619.41 million by 2029, at a CAGR of 51.9% during the forecast period. The hardware segment accounts for the largest component segment in the augmented reality (AR) & mixed reality (MR) market. The Asia-Pacific augmented reality (AR) & mixed reality (MR) market report also covers pricing analysis, patent analysis, and technological advancements in depth.
|
Report Metric |
Details |
|
Forecast Period |
2022 to 2029 |
|
Base Year |
2021 |
|
Historic Years |
2020 (Customizable to 2019 - 2014) |
|
Quantitative Units |
Revenue in USD Million, Pricing in USD |
|
Segments Covered |
By Component (Hardware, Software, and Services), Deployment Model (Cloud and On Premise), Distribution Channel (Offline, Online), Device Type (Head Up Display, Head Mounted Display, Projector & Display Wall, Gesture Tracking Devices), Technology (Mobile Augmented Reality, Monitor-Based Technology, Near Eye Based Technology), Application (Workflow Optimization, Marketing Collaboration, Enhanced 2-D & 3-D, Visualizations, 3D Modelling, Documentation, Navigation), End User (Retail & E-Commerce, IT & Telecommunication, Automotive, Aerospace & Defense, Healthcare, Animation, Travel & Tourism, Energy, Media & Entertainment, Education, Construction, Games & Sports, Banking) |
|
Countries Covered |
China, Japan, South Korea, Australia, India, Taiwan, Thailand, Singapore, Malaysia, Vietnam, New Zealand, Indonesia, Philippines, Rest of Asia Pacific |
|
Market Players Covered |
HP Development Company, LP, HTC Corporation, Autodesk Inc., Barco, Intel Corporation, PTC, Seiko Epson Corporation, Ultraleap Limited, ASUSTek Computer Inc., Dell, Google (a subsidiary of Alphabet Inc.), Sony Corporation, Lenovo, Microsoft, SAMSUNG ELECTRONICS CO., LTD., Panasonic Corporation, RealWear, Inc., Magic Leap, Inc., EON Reality, and TeamViewer among others. |
Market Definition
Augmented reality is a technology that uses the existing user's environment and overlays the digital or virtual content or information over it to offer an immersive digital experience in a real-time environment. Augmented reality applications are developed on special 3D programs, which enable developers to integrate contextual or digital content with the real world in real-time. Augmented reality offers interactive experiences through multiple sensory modalities, including haptic, auditory, visual, somatosensory, and more. The technology has a wide range of applications in entertainment, training, and educational areas. Industries such as manufacturing, healthcare, and logistics, among others, are more focusing on adopting this technology for training, maintenance, assistance, and monitoring applications.
Mixed reality symbolizes the controlled collision of the AR/VR and IoT trends. Mixed reality (MR), also referred to as hybrid reality, is the technology that is used to merge real and virtual worlds and produce new environments and visualizations where physical and digital objects co-exist and interact in real time. Mixed reality is an interdisciplinary field involving computer graphics, signal processing, computer apparition, user interfaces, mobile computing, wearable computing, information visualization, and the design of displays and sensors. Mixed reality concepts are increasingly being adopted by various industries, including automotive, healthcare, and office environments, among others.
Market Dynamics
This section deals with understanding the market drivers, advantages, opportunities, restraints, and challenges. All of this is discussed in detail as below:
Drivers
- Increasing penetration of smart devices and internet services
With the introduction of smart devices, AR has provided valuable opportunities for retailers to engage consumers, showcase their products, and create a competitive advantage, which is expected to drive the Asia-Pacific AR (augmented reality) & MR (mixed reality) market significantly.
- Rise in adoption of augmented reality by educational institutes
AR in education allows students to gain knowledge through rich visuals and immersion into the subject matter. Moreover, speech technology also engages students by providing comprehensive details about the topic in a voice format. Therefore, the concept of e-learning with AR has become an essential strategy for gathering information, which is expected to drive the Asia-Pacific AR (augmented reality) & MR (mixed reality) market significantly.
- Increasing focus on cyber-physical systems
Augmented reality (AR) enables intuitive and efficient human-machine interactions between humans and CPMT (Cyber-Physical Machine Tool). As cyber-physical security systems become model-based and leverage augmented, virtual, or mixed reality, the gaps between training, planning/analysis, and situational awareness simulations disappear. Through a model-driven contextual interface, users can experience a virtual representation of a real-world facility.
- More of technological advancement and digitization
The continuing convergence of digitalization in the real and the virtual worlds have become the main factor of innovation and change in all sectors of our economy. Augmented reality technology (AR) has become one of the critical digital transformation technologies in industrial and non-industrial areas. The rise of augmented reality has transformed lives and day-to-day operations in technology, hospitality, healthcare, and other sectors. The use of augmented reality helps the customers understand the product or the service with more ease and helps them make the decisions easier. In addition, augmented reality can also help build and improve the organization's brand image by giving the customers a seamless buying experience.
Opportunities
-
Increased deployment of AR and MR technology in numerous industries
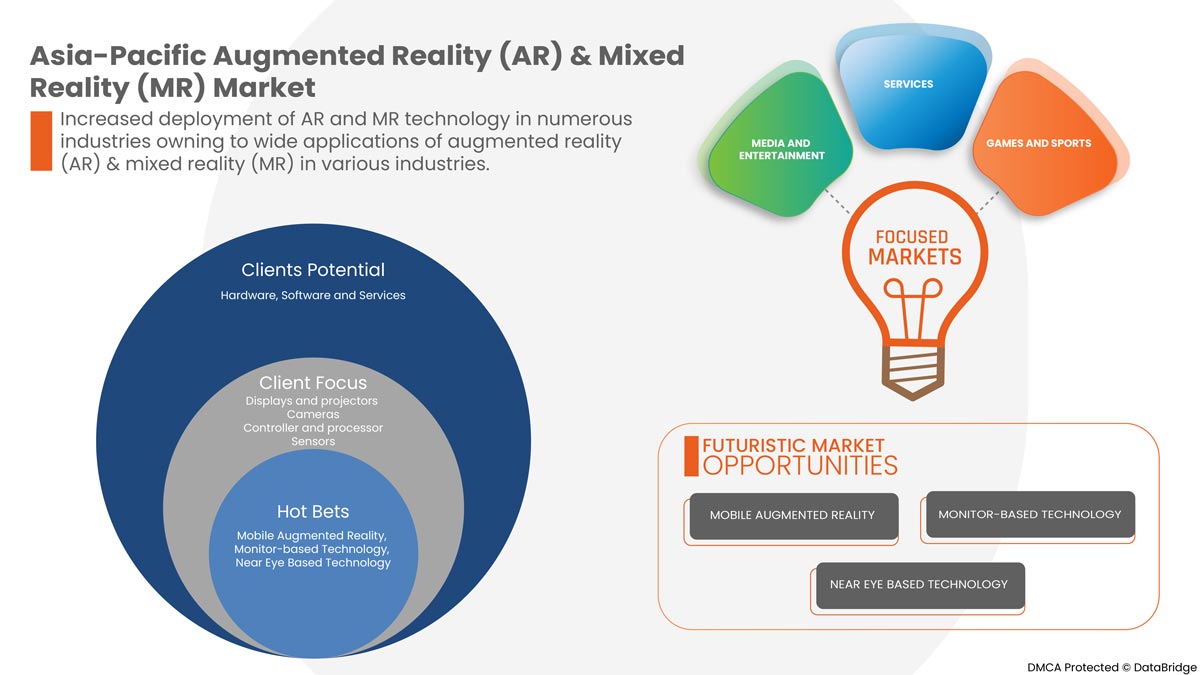
The applications in various industrial sectors, especially in the defense industry, extensively use augmented and mixed reality. It is expected to create opportunities for the Asia-Pacific AR (augmented reality) & MR (mixed reality) market.
Restraints/Challenges
- Stringent regulations of government for varied organizations
AR (augmented reality) and MR (mixed reality) devices and applications are already subject to several laws and regulations governing individual privacy and user data across the countries. However, the current regulatory landscape addresses only some of the risks of using augmented reality devices. Specific requirements complicate the data collection necessary to provide robust and secure immersive experiences across sectors.
COVID-19 Impact on Asia-Pacific Augmented Reality (AR) & Mixed Reality (MR) Market
COVID-19 created a major impact on various industries as almost every country has opted for the shutdown of every facility except the ones dealing in the essential goods segment. The government has taken some strict actions such as the shutdown of facilities and sale of non-essential goods, blocked international trade, and many more to prevent the spread of COVID-19. The only business which is dealing in this pandemic situation is the essential services that are allowed to open and run the processes.
The increased usage of augmented reality-based devices has provided significant opportunities amid the COVID-19 pandemic. Although consumer purchasing power has been greatly diminished as a result of the coronavirus-induced economic slump, resulting in the decline of profit margins in organizations. While many key marketers and leaders saw signs of improvement from past years, it remains difficult to ascertain the actual market situation as the pent-up demand may be covering up a lower intrinsic level of demand for AR-based devices. The increase in AR smartphone applications, the rise in demand for remote collaboration, and technological advancements in medical applications are some of the factors driving the growth of the augmented reality and mixed reality market.
Manufacturers are making various strategic decisions to meet the growing demand in the COVID-19 period. The players were involved in strategic activities such as partnerships, collaborations, acquisitions, and others to improve the technology involved in the augmented reality (AR) & mixed reality (MR) market. With this, the companies will bring advanced and accurate solutions to the market. In addition, the government initiatives to boost digitization across industries have led to the market's growth.
Recent Developments
- In April 2021, Microsoft announced a Pentagon contract with the U.S. military for augmented reality headgear for soldiers worth USD 21.88 billion. This HoloLens will deliver soldiers more efficient visibility, next-generation night vision, and situational awareness for any war. This has also helped the company to transcend the traditional boundaries of space and time in the field of AR, thereby expanding their products in the market
- In July 2021, SAMSUNG ELECTRONICS CO., LTD. expanded its contactless offerings for consumers with a new Augmented Reality (AR) enabled service for its flagship products. With this, consumers may virtually experience a product in their homes, check product dimensions, and make an informed selection with the AR service. This has also helped the company to expand its product portfolio in the augmented reality market
Asia-Pacific Augmented Reality (AR) & Mixed Reality (MR) Market Scope
Asia-Pacific augmented reality (AR) & mixed reality (MR) market is segmented on the basis of component, deployment model, distribution channel, device type, technology, application, and end user. The growth amongst these segments will help you analyze meager growth segments in the industries and provide the users with a valuable market overview and market insights to help them make strategic decisions for identifying core market applications.
By Component
- Hardware
- Software
- Services
On the basis of component, the Asia-Pacific augmented reality (AR) & mixed reality (MR) market is segmented into hardware, software, and services.
By Deployment Model
- On-Premise
- Cloud
On the basis of the deployment model, the Asia-Pacific augmented reality (AR) & mixed reality (MR) market is segmented into on-premise and cloud.
By Distribution Channel
- Offline
- Online
On the basis of organization size, the Asia-Pacific augmented reality (AR) & mixed reality (MR) market is segmented into offline and online.
By Device Type
- Desktop
- Head Up Display
- Head Mounted Display
- Projector And Display Wall
- Gesture Tracking Devices
On the basis of device type, the Asia-Pacific augmented reality (AR) & mixed reality (MR) market has been segmented into head up display, head mounted display, projector and display wall, and gesture tracking devices.
By Technology
- Mobile Augmented Reality
- Monitor-Based Technology
- Near Eye Based Technology
On the basis of technology, the Asia-Pacific augmented reality (AR) & mixed reality (MR) market has been segmented into mobile augmented reality, monitor-based technology, and near eye based technology.
By Application
- Banking, Financial Services, and Insurance (BFSI)
- Workflow Optimization
- Marketing Collaboration
- Enhanced 2-D And 3-D
- Visualizations
- 3d Modelling
- Documentation
- Navigation
On the basis of application, the Asia-Pacific augmented reality (AR) & mixed reality (MR) market has been segmented into workflow optimization, marketing collaboration, enhanced 2-D and 3-D, visualizations, 3D modeling, documentation, and navigation.
By End User
- Banking, Financial Services And Insurance (BFSI)
- Retail And E-Commerce
- IT And Telecommunication
- Automotive
- Aerospace And Defense
- Healthcare
- Animation
- Travel And Tourism
- Energy
- Media And Entertainment
- Education
- Construction
- Games And Sports
- Banking
- Others
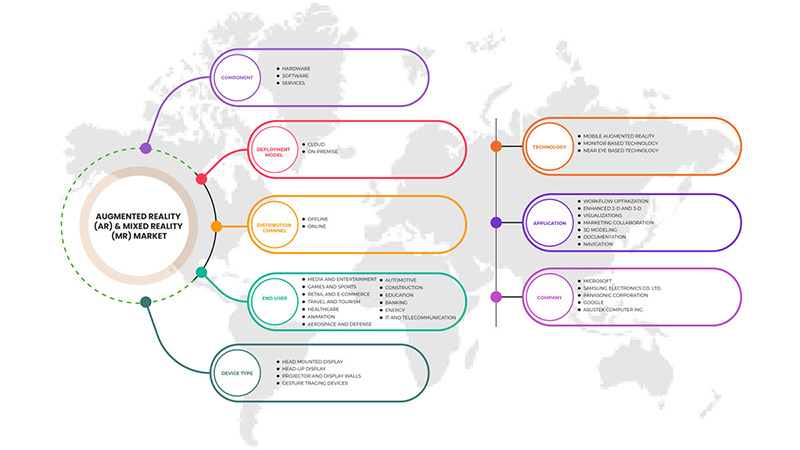
On the basis of end user, the Asia-Pacific augmented reality (AR) & mixed reality (MR) market is segmented into retail and e-commerce, IT and telecommunication, automotive, aerospace and defense, healthcare, travel and tourism, energy, media and entertainment, education, construction, games and sports, banking and others.
Asia-Pacific Augmented Reality (AR) & Mixed Reality (MR) Market Regional Analysis/Insights
Asia-Pacific augmented reality (AR) & mixed reality (MR) market is analyzed, and market size insights and trends are provided by country, component, deployment model, distribution channel, device type, technology, application, and end-user as referenced above.
Asia-Pacific augmented reality (AR) & mixed reality (MR) market covers countries such as China, Japan, South Korea, Australia, India, Taiwan, Thailand, Singapore, Malaysia, Vietnam, New Zealand, Indonesia, Philippines, Rest of Asia Pacific.
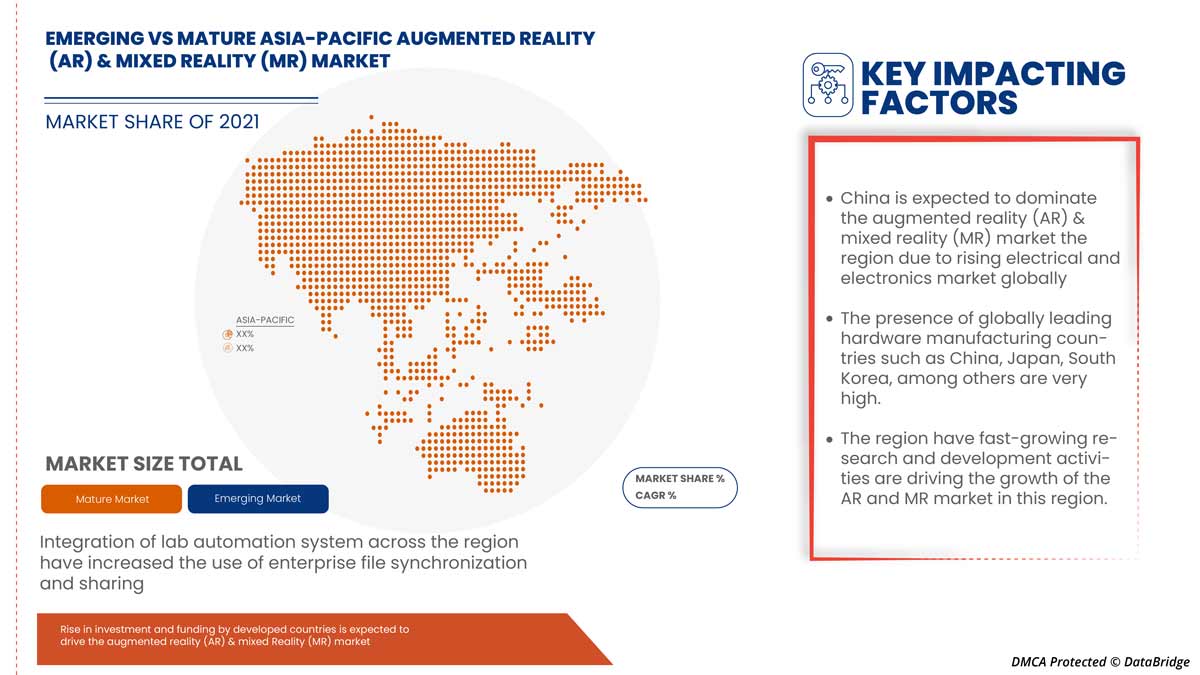
China is expected to dominate the Asia-Pacific augmented reality (AR) & mixed reality (MR) market to rise in the adoption of cloud-based solutions and emerging potential markets. However, stringent government regulations and emphasis of businesses on security aspects of corporate data, especially in developing countries, including India, Japan, China, and Indonesia, have led to the huge growth of the Asia-Pacific augmented reality (AR) & mixed reality (MR) market.
The country section of the Asia-Pacific augmented reality (AR) & mixed reality (MR) market report also provides individual market impacting factors and changes in regulations in the market domestically that impact the current and future trends of the market. Data points such as new sales, replacement sales, country demographics, disease epidemiology, and import-export tariffs are some of the significant pointers used to forecast the market scenario for individual countries. Also, the presence and availability of Asia-Pacific brands and their challenges faced due to large or scarce competition from local and domestic brands and the impact of sales channels are considered while providing forecast analysis of the country data.
Competitive Landscape and Augmented Reality (AR) & Mixed Reality (MR) Market Share Analysis
Asia-Pacific augmented reality (AR) & mixed reality (MR) market competitive landscape provides details of the competitor. Details included are company overview, company financials, revenue generated, market potential, investment in research and development, new market initiatives, global presence, production sites and facilities, production capacities, company strengths and weaknesses, solution launch, product width and breadth, application dominance. The above data points are only related to the companies focus on the Asia-Pacific augmented reality (AR) & mixed reality (MR) market.
Some of the major players operating in the Asia-Pacific augmented reality (AR) & mixed reality (MR) market are HP Development Company, LP, HTC Corporation, Autodesk Inc., Barco, Intel Corporation, PTC, Seiko Epson Corporation, Ultraleap Limited, ASUSTek Computer Inc., Dell, Google (a subsidiary of Alphabet Inc.), Sony Corporation, Lenovo, Microsoft, SAMSUNG ELECTRONICS CO., LTD., Panasonic Corporation, RealWear, Inc., Magic Leap, Inc., EON Reality, and TeamViewer among others.
SKU-
Erhalten Sie Online-Zugriff auf den Bericht zur weltweit ersten Market Intelligence Cloud

- Interaktives Datenanalyse-Dashboard
- Unternehmensanalyse-Dashboard für Chancen mit hohem Wachstumspotenzial
- Zugriff für Research-Analysten für Anpassungen und Abfragen
- Konkurrenzanalyse mit interaktivem Dashboard
- Aktuelle Nachrichten, Updates und Trendanalyse
- Nutzen Sie die Leistungsfähigkeit der Benchmark-Analyse für eine umfassende Konkurrenzverfolgung
Inhaltsverzeichnis
1 EINLEITUNG
1.1 ZIELE DER STUDIE
1.2 MARKTDEFINITION
1.3 ÜBERSICHT ÜBER DEN MARKT FÜR AUGMENTED REALITY (AR) UND MIXED REALITY (MR) IM ASIEN-PAZIFISCHEN RAUM
1.4 WÄHRUNG UND PREISE
1.5 EINSCHRÄNKUNGEN
1.6 ABGEDECKTE MÄRKTE
2 MARKTSEGMENTIERUNG
2.1 ABGEDECKTE MÄRKTE
2.2 GEOGRAFISCHER UMFANG
2,3 JAHRE FÜR DIE STUDIE
2.4 DBMR-Dreibeindatenvalidierungsmodell
2.5 PRIMÄRINTERVIEWS MIT WICHTIGEN MEINUNGSFÜHRERN
2.6 DBMR-Marktpositionsraster
2.7 ANALYSE DES LIEFERANTENANTEILS
2.8 MULTIVARIATE MODELLIERUNG
2.9 KOMPONENTEN-ZEITPLANKURVE
2.1 Marktanwendungs-Abdeckungsraster
2.11 SEKUNDÄRQUELLEN
2.12 ANNAHMEN
3 ZUSAMMENFASSUNG
4 PREMIUM-EINBLICKE
4.1 VORSCHRIFTEN
4.1.1 IEEE-STANDARDS
4.2 NACH COVID
4.3 MARKETING
4.4 PREISANALYSE/PREISSENSITIVITÄT
4.5 POPULARITÄT KOREANISCHER INHALTE
5 MARKTÜBERSICHT
5.1 TREIBER
5.1.1 Zunehmende Verbreitung von Smart Devices und Internetdiensten
5.1.2 Zunahme der Nutzung erweiterter Realität durch Bildungseinrichtungen
5.1.3 Zunehmender Fokus auf cyber-physische Systeme
5.1.4 MEHR TECHNOLOGISCHER FORTSCHRITT UND DIGITALISIERUNG
5.2 EINSCHRÄNKUNGEN
5.2.1 STRENGE REGIERUNGSVORSCHRIFTEN FÜR VERSCHIEDENE ORGANISATIONEN
5.2.2 Verlust von Daten und Privatsphäre
5.3 CHANCEN
5.3.1 VERSTÄRKTER EINSATZ VON AR- UND MR-TECHNOLOGIE IN ZAHLREICHEN BRANCHEN
5.3.2 Zunahme verschiedener strategischer Entscheidungen wie Partnerschaften und Akquisitionen
5.3.3 ENTWICKLUNG VON HARDWARE MIT HÖHERER VERARBEITUNGSGESCHWINDIGKEIT
5.3.4 Anstieg der Investitionen und Finanzierungen durch Industrieländer
5.4 HERAUSFORDERUNGEN
5.4.1 Konjunkturabschwächung im asiatisch-pazifischen Raum begrenzt die Marktentwicklung
5.4.2 KOMPLIKATIONEN BEIM BETRIEB VON AUF AUGMENTED REALITY (AR) UND MIXED REALITY (MR) BASIERENDEN PRODUKTEN
6. AUGMENTED REALITY (AR) & MIXED REALITY (MR) MARKT IM ASIEN-PAZIFIK-RAUM, NACH KOMPONENTEN
6.1 ÜBERBLICK
6.2 HARDWARE
6.2.1 DISPLAYS UND PROJEKTOREN
6.2.2 KAMERAS
6.2.3 VERANTWORTLICHER UND VERARBEITER
6.2.4 SENSOREN
6.2.4.1 BESCHLEUNIGUNGSMESSER
6.2.4.2 GYROSKOPE
6.2.5 NÄHERUNGSSENSOREN
6.2.6 MAGNETOMETER
6.2.7 SONSTIGES
6.2.8 POSITIONSTRACKER
6.2.9 SONSTIGES
6.3 SOFTWARE
6.4 DIENSTLEISTUNGEN
6.4.1 UMSETZUNG
6.4.2 SUPPORT UND WARTUNG
6.4.3 SCHULUNG
7. AUGMENTED REALITY (AR) & MIXED REALITY (MR) MARKT IM ASIEN-PAZIFIK, NACH BEREITSTELLUNGSMODELL
7.1 ÜBERSICHT
7.2 CLOUD
7.3 VOR ORT
8. AUGMENTED REALITY (AR) & MIXED REALITY (MR) MARKT IM ASIEN-PAZIFIK-RAUM, NACH GERÄTETYP
8.1 ÜBERSICHT
8.2 AM KOPF MOUNTED DISPLAY
8.2.1 DATENBRILLE
8.2.2 SMARTER HELM
8.3 Head-Up-Display
8.4 PROJEKTOR- UND DISPLAYWÄNDE
8.5 GESTENVERFOLGUNGSGERÄTE
9. AUGMENTED REALITY (AR) & MIXED REALITY (MR) MARKT IM ASIEN-PAZIFIK-RAUM, NACH TECHNOLOGIE
9.1 ÜBERSICHT
9.2 MOBILE ERWEITERTE REALITÄT
9.3 MONITORBASIERTE TECHNOLOGIE
9.4 NAHAUGENBASIERTE TECHNOLOGIE
10. AUGMENTED REALITY (AR) & MIXED REALITY (MR) MARKT IM ASIEN-PAZIFIK, NACH VERTRIEBSKANAL
10.1 ÜBERSICHT
10.2 OFFLINE
10.3 ONLINE
11 AUGMENTED REALITY (AR) & MIXED REALITY (MR) MARKT IM ASIEN-PAZIFIK, NACH ANWENDUNG
11.1 ÜBERSICHT
11.2 WORKFLOW-OPTIMIERUNG
11.3 VERBESSERTES 2D UND 3D
11.4 VISUALISIERUNGEN
11.5 MARKETING-ZUSAMMENARBEIT
11.6 3D-MODELLIERUNG
11.7 DOKUMENTATION
11.8 NAVIGATION
12. AUGMENTED REALITY (AR) & MIXED REALITY (MR) MARKT IM ASIEN-PAZIFIK-RAUM, NACH ENDBENUTZER
12.1 ÜBERSICHT
12.2 MEDIEN UND UNTERHALTUNG
12.2.1 BROADCAST
12.2.2 MUSIK
12.2.3 KUNSTGALERIEN UND AUSSTELLUNGEN
12.2.4 MUSEEN
12.2.5 FREIZEITPARKS
12.3 SPIELE UND SPORT
12.4 EINZELHANDEL UND E-COMMERCE
12.4.1 SCHMUCK
12.4.2 SCHÖNHEIT UND KOSMETIK
12.4.3 Passform der Kleidung
12.4.4 LEBENSMITTELEINKAUF
12.4.5 SCHUHE
12.4.6 MÖBEL- UND LICHTGESTALTUNG
12.5 REISEN UND TOURISMUS
12.6 GESUNDHEITSWESEN
12.6.1 CHIRURGIE
12.6.2 FITNESSMANAGEMENT
12.6.3 PATIENTENVERSORGUNGSMANAGEMENT
12.6.4 APOTHEKENMANAGEMENT
12.6.5 SONSTIGES
12.7 ANIMATION
12.7.1 CHARAKTER
12.7.2 CARTOON
12.8 LUFT- UND RAUMFAHRT UND VERTEIDIGUNG
12.9 AUTOMOBIL
12.1 KONSTRUKTION
12.11 BILDUNG
12.12 BANKGESCHÄFTE
12.13 ENERGIE
12.14 IT UND TELEKOMMUNIKATION
12.15 SONSTIGES
13 AUGMENTED REALITY (AR) & MIXED REALITY (MR) MARKT IM ASIEN-PAZIFIK-RAUM, NACH REGION
13.1 ASIEN-PAZIFIK
14 AUGMENTED REALITY (AR) & MIXED REALITY (MR) MARKT IM ASIEN-PAZIFIK-RAUM, UNTERNEHMENSLANDSCHAFT
14.1 UNTERNEHMENSAKTIENANALYSE: ASIEN-PAZIFIK
15 SWOT-ANALYSE
16 FIRMENPROFIL
16.1 MICROSOFT
16.1.1 UNTERNEHMENSÜBERSICHT
16.1.2 Umsatzanalyse
16.1.3 UNTERNEHMENSAKTIENANALYSE
16.1.4 PRODUKTPORTFOLIO
16.1.5 JÜNGSTE ENTWICKLUNGEN
16.2 GOOGLE (EINE TOCHTERGESELLSCHAFT VON ALPHABET INC.)
16.2.1 UNTERNEHMENSÜBERSICHT
16.2.2 Umsatzanalyse
16.2.3 UNTERNEHMENSAKTIENANALYSE
16.2.4 PRODUKTPORTFOLIO
16.2.5 JÜNGSTE ENTWICKLUNGEN
16.3 SAMSUNG ELECTRONICS CO., LTD.
16.3.1 UNTERNEHMENSÜBERSICHT
16.3.2 Umsatzanalyse
16.3.3 UNTERNEHMENSAKTIENANALYSE
16.3.4 PRODUKTPORTFOLIO
16.3.5 JÜNGSTE ENTWICKLUNGEN
16.4 PANASONIC CORPORATION
16.4.1 UNTERNEHMENSÜBERSICHT
16.4.2 Umsatzanalyse
16.4.3 UNTERNEHMENSAKTIENANALYSE
16.4.4 PRODUKTPORTFOLIO
16.4.5 JÜNGSTE ENTWICKLUNGEN
16.5 DELL
16.5.1 UNTERNEHMENSÜBERSICHT
16.5.2 Umsatzanalyse
16.5.3 PRODUKTPORTFOLIO
16.5.4 JÜNGSTE ENTWICKLUNGEN
16.6 LENOVO
16.6.1 UNTERNEHMENSÜBERSICHT
16.6.2 Umsatzanalyse
16.6.3 PRODUKTPORTFOLIO
16.6.4 JÜNGSTE ENTWICKLUNG
16.7 AUTODESK INC.
16.7.1 UNTERNEHMENSÜBERSICHT
16.7.2 Umsatzanalyse
16.7.3 PRODUKTPORTFOLIO
16.7.4 JÜNGSTE ENTWICKLUNGEN
16.8 ASUSTEK COMPUTER INC.
16.8.1 UNTERNEHMENSÜBERSICHT
16.8.2 Umsatzanalyse
16.8.3 PRODUKTPORTFOLIO
16.8.4 JÜNGSTE ENTWICKLUNG
16.9 BARCO
16.9.1 UNTERNEHMENSÜBERSICHT
16.9.2 UMSATZANALYSE
16.9.3 PRODUKTPORTFOLIO
16.9.4 JÜNGSTE ENTWICKLUNGEN
16.1 EON REALITY
16.10.1 UNTERNEHMENSÜBERSICHT
16.10.2 PRODUKTPORTFOLIO
16.10.3 JÜNGSTE ENTWICKLUNGEN
16.11 HP ENTWICKLUNGSUNTERNEHMEN, LP
16.11.1 UNTERNEHMENSÜBERSICHT
16.11.2 Umsatzanalyse
16.11.3 PRODUKTPORTFOLIO
16.11.4 NEUESTE ENTWICKLUNGEN
16.12 HTC CORPORATION
16.12.1 UNTERNEHMENSÜBERSICHT
16.12.2 Umsatzanalyse
16.12.3 PRODUKTPORTFOLIO
16.12.4 NEUESTE ENTWICKLUNGEN
16.13 Intel Corporation
16.13.1 UNTERNEHMENSÜBERSICHT
16.13.2 Umsatzanalyse
16.13.3 PRODUKTPORTFOLIO
16.13.4 NEUESTE ENTWICKLUNGEN
16.14 MAGIC LEAP, INC.
16.14.1 UNTERNEHMENSÜBERSICHT
16.14.2 PRODUKTPORTFOLIO
16.14.3 JÜNGSTE ENTWICKLUNGEN
16.15 PTC
16.15.1 UNTERNEHMENSÜBERSICHT
16.15.2 Umsatzanalyse
16.15.3 PRODUKTPORTFOLIO
16.15.4 NEUESTE ENTWICKLUNG
16.16 REALWEAR, INC.
16.16.1 UNTERNEHMENSÜBERSICHT
16.16.2 PRODUKTPORTFOLIO
16.16.3 JÜNGSTE ENTWICKLUNGEN
16.17 SEIKO EPSON CORPORATION
16.17.1 UNTERNEHMENSÜBERSICHT
16.17.2 Umsatzanalyse
16.17.3 PRODUKTPORTFOLIO
16.17.4 NEUESTE ENTWICKLUNGEN
16.18 SONY CORPORATION
16.18.1 UNTERNEHMENSÜBERSICHT
16.18.2 Umsatzanalyse
16.18.3 PRODUKTPORTFOLIO
16.18.4 NEUE ENTWICKLUNG
16.19 TEAMVIEWER
16.19.1 UNTERNEHMENSÜBERSICHT
16.19.2 Umsatzanalyse
16.19.3 PRODUKTPORTFOLIO
16.19.4 JÜNGSTE ENTWICKLUNGEN
16.2 ULTRALEAP LIMITED
16.20.1 UNTERNEHMENSÜBERSICHT
16.20.2 PRODUKTPORTFOLIO
16.20.3 JÜNGSTE ENTWICKLUNG
17 FRAGEBOGEN
18 VERWANDTE BERICHTE
Tabellenverzeichnis
TABELLE 1 DURCHSCHNITTLICHE ENTWICKLUNGSZEIT UND -KOSTEN FÜR AR:
TABELLE 2: MARKT FÜR AUGMENTED REALITY (AR) UND MIXED REALITY (MR) IM ASIEN-PAZIFIK-RAUM, NACH KOMPONENTE, 2020–2029 (MILLIONEN USD)
TABELLE 3: HARDWARE IM ASIEN-PAZIFIK-RAUM IM MARKT FÜR AUGMENTED REALITY (AR) UND MIXED REALITY (MR), NACH REGION, 2020–2029 (MILLIONEN USD)
TABELLE 4: HARDWARE IM ASIEN-PAZIFIK-RAUM FÜR AUGMENTED REALITY (AR) UND MIXED REALITY (MR) NACH TYP 2020–2029 (MILLIONEN USD)
TABELLE 5: SENSOREN IM MARKT FÜR AUGMENTED REALITY (AR) UND MIXED REALITY (MR) IM ASIEN-PAZIFIK-RAUM, NACH TYP 2020–2029 (MILLIONEN USD)
TABELLE 6: ASIEN-PAZIFIK-SOFTWARE IM MARKT FÜR AUGMENTED REALITY (AR) UND MIXED REALITY (MR), NACH REGION, 2020–2029 (MILLIONEN USD)
TABELLE 7: DIENSTLEISTUNGEN IM MARKT FÜR AUGMENTED REALITY (AR) UND MIXED REALITY (MR) IM ASIEN-PAZIFIK-RAUM, NACH REGION, 2020–2029 (MILLIONEN USD)
TABELLE 8: DIENSTLEISTUNGEN IM MARKT FÜR AUGMENTED REALITY (AR) UND MIXED REALITY (MR) IM ASIEN-PAZIFIK-RAUM, NACH TYP 2020–2029 (MILLIONEN USD)
TABELLE 9: MARKT FÜR AUGMENTED REALITY (AR) UND MIXED REALITY (MR) IM ASIEN-PAZIFIK-RAUM, NACH BEREITSTELLUNGSMODELL, 2020–2029 (MILLIONEN USD)
TABELLE 10: ASIEN-PAZIFIK-CLOUD IM MARKT FÜR AUGMENTED REALITY (AR) UND MIXED REALITY (MR), NACH REGION, 2020–2029 (MILLIONEN USD)
TABELLE 11: ASIEN-PAZIFIK – VOR-ORT-MARKT FÜR AUGMENTED REALITY (AR) UND MIXED REALITY (MR), NACH REGION, 2020–2029 (MILLIONEN USD)
TABELLE 12: MARKT FÜR AUGMENTED REALITY (AR) UND MIXED REALITY (MR) IM ASIEN-PAZIFIK-RAUM, NACH GERÄTETYP, 2020–2029 (MILLIONEN USD)
TABELLE 13: Markt für Head-Mounted-Displays im asiatisch-pazifischen Raum im Bereich Augmented Reality (AR) und Mixed Reality (MR), nach Region, 2020–2029 (Mio. USD)
TABELLE 14: Markt für Head-Mounted-Displays im asiatisch-pazifischen Raum im Bereich Augmented Reality (AR) und Mixed Reality (MR), nach Typ, 2020–2029 (Mio. USD)
TABELLE 15: Head-up-Displays im asiatisch-pazifischen Raum im Markt für erweiterte Realität (AR) und gemischte Realität (MR), nach Regionen, 2020–2029 (in Mio. USD)
TABELLE 16: PROJEKTOREN UND DISPLAYWÄNDE IM ASIEN-PAZIFIK-RAUM IM MARKT FÜR AUGMENTED REALITY (AR) UND MIXED REALITY (MR), NACH REGION, 2020–2029 (MILLIONEN USD)
TABELLE 17: GESTENVERFOLGUNGSGERÄTE IM ASIEN-PAZIFIK-MÄRKT FÜR AUGMENTED REALITY (AR) UND MIXED REALITY (MR) NACH REGION, 2020–2029 (MILLIONEN USD)
TABELLE 18: AUGMENTED REALITY (AR)- UND MIXED REALITY (MR)-MARKT IM ASIEN-PAZIFIK-RAUM, NACH TECHNOLOGIE, 2020–2029 (MILLIONEN USD)
TABELLE 19: MOBILE AUGMENTED REALITY IM ASIEN-PAZIFIK-RAUM IM MARKT FÜR AUGMENTED REALITY (AR) UND MIXED REALITY (MR), NACH REGION, 2020–2029 (MILLIONEN USD)
TABELLE 20: Monitorbasierte Technologie im asiatisch-pazifischen Raum im Markt für erweiterte Realität (AR) und gemischte Realität (MR), nach Regionen, 2020–2029 (Millionen USD)
TABELLE 21: ASIEN-PAZIFIK – MARKT FÜR NEAR-EYE-BASIERENDE TECHNOLOGIE IM BEREICH AUGMENTED REALITY (AR) UND MIXED REALITY (MR), NACH REGION, 2020–2029 (MILLIONEN USD)
TABELLE 22: MARKT FÜR AUGMENTED REALITY (AR) UND MIXED REALITY (MR) IM ASIEN-PAZIFIK-RAUM, NACH VERTRIEBSKANAL, 2020–2029 (MIO. USD)
TABELLE 23 ASIEN-PAZIFIK OFFLINE IM MARKT FÜR AUGMENTED REALITY (AR) UND MIXED REALITY (MR), NACH REGION, 2020–2029 (MILLIONEN USD)
TABELLE 24: ONLINE-MARKT IM ASIEN-PAZIFIK-RAUM FÜR AUGMENTED REALITY (AR) UND MIXED REALITY (MR), NACH REGION, 2020–2029 (MILLIONEN USD)
TABELLE 25: AUGMENTED REALITY (AR)- UND MIXED REALITY (MR)-MARKT IM ASIEN-PAZIFIK-RAUM, NACH ANWENDUNG, 2020–2029 (MILLIONEN USD)
TABELLE 26: WORKFLOW-OPTIMIERUNG IM ASIEN-PAZIFIK-RAUM IM MARKT FÜR AUGMENTED REALITY (AR) UND MIXED REALITY (MR), NACH REGION, 2020–2029 (MILLIONEN USD)
TABELLE 27: VERBESSERTES 2D UND 3D IN AUGMENTED REALITY (AR) UND MIXED REALITY (MR) IM ASIEN-PAZIFIK-RAUM, NACH REGION, 2020–2029 (MIO. USD)
TABELLE 28: VISUALISIERUNGEN IM ASIEN-PAZIFIK-RAUM IM MARKT FÜR AUGMENTED REALITY (AR) UND MIXED REALITY (MR), NACH REGION, 2020–2029 (MILLIONEN USD)
TABELLE 29: Marketingzusammenarbeit im asiatisch-pazifischen Raum im Markt für erweiterte Realität (AR) und gemischte Realität (MR), nach Region, 2020–2029 (in Mio. USD)
TABELLE 30: 3D-MODELLIERUNG IM ASIEN-PAZIFISCHEN MARKT FÜR AUGMENTED REALITY (AR) UND MIXED REALITY (MR) NACH REGIONEN, 2020–2029 (MILLIONEN USD)
TABELLE 31: DOKUMENTATION IM ASIEN-PAZIFIK-RAUM IM MARKT FÜR AUGMENTED REALITY (AR) UND MIXED REALITY (MR), NACH ANWENDUNG, 2020–2029 (MILLIONEN USD)
TABELLE 32: Navigation im asiatisch-pazifischen Raum im Markt für erweiterte Realität (AR) und gemischte Realität (MR), nach Regionen, 2020–2029 (in Mio. USD)
TABELLE 33: AUGMENTED REALITY (AR)- UND MIXED REALITY (MR)-MARKT IM ASIEN-PAZIFIK-RAUM, NACH ENDBENUTZER, 2020–2029 (MILLIONEN USD)
TABELLE 34: MEDIEN UND UNTERHALTUNG IM ASIEN-PAZIFIK-RAUM IM MARKT FÜR AUGMENTED REALITY (AR) UND MIXED REALITY (MR), NACH REGION, 2020–2029 (MILLIONEN USD)
TABELLE 35: MEDIEN UND UNTERHALTUNG IM ASIEN-PAZIFIK-RAUM IM MARKT FÜR AUGMENTED REALITY (AR) UND MIXED REALITY (MR), NACH TYP, 2020–2029 (MILLIONEN USD)
TABELLE 36: MARKT FÜR SPIELE UND SPORT IM ASIEN-PAZIFIK-RAUM IN AUGMENTED REALITY (AR) UND MIXED REALITY (MR), NACH REGION, 2020–2029 (MILLIONEN USD)
TABELLE 37: Einzelhandel und E-Commerce im asiatisch-pazifischen Raum im Markt für erweiterte Realität (AR) und gemischte Realität (MR), nach Regionen, 2020–2029 (in Mio. USD)
TABELLE 38: Einzelhandel und E-Commerce im asiatisch-pazifischen Raum im Markt für erweiterte Realität (AR) und gemischte Realität (MR), nach Typ, 2020–2029 (in Mio. USD)
TABELLE 39: REISEN UND TOURISMUS IM ASIEN-PAZIFIK-RAUM IM MARKT FÜR AUGMENTED REALITY (AR) UND MIXED REALITY (MR), NACH REGION, 2020–2029 (MILLIONEN USD)
TABELLE 40: GESUNDHEITSWESEN IM ASIEN-PAZIFISCHEN MÄRKTEN FÜR AUGMENTED REALITY (AR) UND MIXED REALITY (MR), NACH REGION, 2020–2029 (MILLIONEN USD)
TABELLE 41: GESUNDHEITSWESEN IM ASIEN-PAZIFISCHEN RAUM FÜR AUGMENTED REALITY (AR) UND MIXED REALITY (MR), NACH TYP, 2020–2029 (MILLIONEN USD)
TABELLE 42: MARKT FÜR ANIMATION IN AUGMENTED REALITY (AR) UND MIXED REALITY (MR) IM ASIEN-PAZIFIK-RAUM, NACH REGION, 2020–2029 (MILLIONEN USD)
TABELLE 43: MARKT FÜR ANIMATION IN AUGMENTED REALITY (AR) UND MIXED REALITY (MR) IM ASIEN-PAZIFIK-RAUM, NACH TYP, 2020–2029 (MILLIONEN USD)
TABELLE 44: LUFT- UND RAUMFAHRT UND VERTEIDIGUNG IM ASIEN-PAZIFISCHEN MÄRKTEN FÜR AUGMENTED REALITY (AR) UND MIXED REALITY (MR), NACH REGION, 2020–2029 (MILLIONEN USD)
TABELLE 45: AUTOMOBILMARKT IM ASIEN-PAZIFIK-RAUM FÜR AUGMENTED REALITY (AR) UND MIXED REALITY (MR), NACH REGION, 2020–2029 (MILLIONEN USD)
TABELLE 46: BAUMARKT IM ASIEN-PAZIFIK-RAUM FÜR AUGMENTED REALITY (AR) UND MIXED REALITY (MR), NACH REGION, 2020–2029 (MILLIONEN USD)
TABELLE 47: BILDUNG IM ASIEN-PAZIFIK-RAUM IM BEREICH AUGMENTED REALITY (AR) UND MIXED REALITY (MR), NACH REGION, 2020–2029 (MILLIONEN USD)
TABELLE 48: ASIEN-PAZIFIK-BANKEN IM MARKT FÜR AUGMENTED REALITY (AR) UND MIXED REALITY (MR), NACH REGION, 2020–2029 (MILLIONEN USD)
TABELLE 49: ENERGIE IM ASIEN-PAZIFIK-RAUM FÜR AUGMENTED REALITY (AR) UND MIXED REALITY (MR) NACH REGION, 2020–2029 (MILLIONEN USD)
TABELLE 50: IT UND TELEKOMMUNIKATION IM ASIEN-PAZIFISCHEN MÄRKTEN FÜR AUGMENTED REALITY (AR) UND MIXED REALITY (MR), NACH REGION, 2020–2029 (MILLIONEN USD)
TABELLE 51 ASIEN-PAZIFIK – ANDERE MARKTTEILNEHMER FÜR AUGMENTED REALITY (AR) UND MIXED REALITY (MR), NACH REGION, 2020–2029 (MILLIONEN USD)
TABELLE 52: MARKT FÜR AUGMENTED REALITY (AR) UND MIXED REALITY (MR) IM ASIEN-PAZIFIK-RAUM, NACH KOMPONENTE, 2020–2029 (MILLIONEN USD)
TABELLE 53 ASIEN-PAZIFIK-HARDWARE IM MARKT FÜR AUGMENTED REALITY (AR) UND MIXED REALITY (MR), NACH TYP, 2020–2029 (MILLIONEN USD)
TABELLE 54: SENSOREN IM ASIEN-PAZIFISCHEN MARKT FÜR AUGMENTED REALITY (AR) UND MIXED REALITY (MR), NACH TYP, 2020–2029 (MILLIONEN USD)
TABELLE 55: DIENSTLEISTUNGEN IM MARKT FÜR AUGMENTED REALITY (AR) UND MIXED REALITY (MR) IM ASIEN-PAZIFIK-RAUM, NACH TYP, 2020–2029 (MILLIONEN USD)
TABELLE 56: AUGMENTED REALITY (AR)- UND MIXED REALITY (MR)-MARKT IM ASIEN-PAZIFIK-RAUM, NACH EINSATZMODELL, 2020–2029 (MIO. USD)
TABELLE 57: AUGMENTED REALITY (AR)- UND MIXED REALITY (MR)-MARKT IM ASIEN-PAZIFIK-RAUM, NACH VERTRIEBSKANAL, 2020–2029 (MIO. USD)
TABELLE 58: AUGMENTED REALITY (AR)- UND MIXED REALITY (MR)-MARKT IM ASIEN-PAZIFIK-RAUM, NACH GERÄTETYP, 2020–2029 (MIO. USD)
TABELLE 59: ASIEN-PAZIFIK – MARKT FÜR HEAD MOUNTED DISPLAYS IM BEREICH AUGMENTED REALITY (AR) UND MIXED REALITY (MR), NACH TYP, 2020–2029 (MILLIONEN USD)
TABELLE 60: AUGMENTED REALITY (AR)- UND MIXED REALITY (MR)-MARKT IM ASIEN-PAZIFIK-RAUM, NACH TECHNOLOGIE, 2020–2029 (MILLIONEN USD)
TABELLE 61: AUGMENTED REALITY (AR) & MIXED REALITY (MR) MARKT IM ASIEN-PAZIFIK-RAUM, NACH ANWENDUNG, 2020–2029 (MIO. USD)
TABELLE 62: AUGMENTED REALITY (AR)- UND MIXED REALITY (MR)-MARKT IM ASIEN-PAZIFIK-RAUM, NACH ENDBENUTZER, 2020–2029 (MILLIONEN USD)
TABELLE 63: MEDIEN UND UNTERHALTUNG IM ASIEN-PAZIFISCHEN MARKT FÜR AUGMENTED REALITY (AR) UND MIXED REALITY (MR), NACH TYP, 2020–2029 (MILLIONEN USD)
TABELLE 64: Einzelhandel und E-Commerce im asiatisch-pazifischen Raum im Markt für erweiterte Realität (AR) und gemischte Realität (MR), nach Typ, 2020–2029 (in Mio. USD)
TABELLE 65: GESUNDHEITSWESEN IM ASIEN-PAZIFISCHEN MÄRKTEN FÜR AUGMENTED REALITY (AR) UND MIXED REALITY (MR), NACH TYP, 2020–2029 (MILLIONEN USD)
TABELLE 66: ASIEN-PAZIFIK-MARKT FÜR ANIMATION IN AUGMENTED REALITY (AR) UND MIXED REALITY (MR), NACH TYP, 2020–2029 (MILLIONEN USD)
Abbildungsverzeichnis
ABBILDUNG 1: AUGMENTED REALITY (AR) & MIXED REALITY (MR) MARKT IM ASIEN-PAZIFIK: SEGMENTIERUNG
ABBILDUNG 2: AUGMENTED REALITY (AR) & MIXED REALITY (MR) MARKT IM ASIEN-PAZIFIK-RAUM: DATENTRIANGULATION
ABBILDUNG 3: AUGMENTED REALITY (AR) & MIXED REALITY (MR) MARKT IM ASIEN-PAZIFIK: DROC-ANALYSE
ABBILDUNG 4: AUGMENTED REALITY (AR)- UND MIXED REALITY (MR)-MARKT IM ASIEN-PAZIFIK-RAUM: ANALYSE DES ASIEN-PAZIFIK-RAUMS IM VERGLEICH ZU REGIONALEN MÄRKTEN
ABBILDUNG 5: AUGMENTED REALITY (AR) & MIXED REALITY (MR) MARKT IM ASIEN-PAZIFIK-RAUM: UNTERNEHMENSFORSCHUNGSANALYSE
ABBILDUNG 6: AUGMENTED REALITY (AR) & MIXED REALITY (MR) MARKT IM ASIEN-PAZIFIK: DEMOGRAFISCHE INTERVIEWS
ABBILDUNG 7: AUGMENTED REALITY (AR) & MIXED REALITY (MR) MARKT IM ASIEN-PAZIFIK: DBMR-MARKTPOSITIONSRASTER
ABBILDUNG 8: AUGMENTED REALITY (AR) & MIXED REALITY (MR) MARKT IM ASIEN-PAZIFIK-RAUM: ANALYSE DER ANBIETERANTEILE
ABBILDUNG 9: AUGMENTED REALITY (AR) & MIXED REALITY (MR) MARKT IM ASIEN-PAZIFIK-RAUM: MULTIVARIATE MODELLIERUNG
ABBILDUNG 10 MARKT FÜR AUGMENTED REALITY (AR) UND MIXED REALITY (MR) IM ASIEN-PAZIFISCHEN RAUM: ZEITLICHE KOMPONENTENKURVE
ABBILDUNG 11 MARKT FÜR AUGMENTED REALITY (AR) UND MIXED REALITY (MR) IM ASIEN-PAZIFIK-RAUM: ABDECKUNGSRASTER FÜR MARKTANWENDUNGEN
ABBILDUNG 12: AUGMENTED REALITY (AR) & MIXED REALITY (MR) MARKT IM ASIEN-PAZIFIK-RAUM: SEGMENTIERUNG
ABBILDUNG 13: DIE ZUNEHMENDE DURCHDRINGUNG VON SMART-GERÄTEN UND INTERNETDIENSTEN WIRD DEN MARKT FÜR AUGMENTED REALITY (AR) UND MIXED REALITY (MR) IM ASIEN-PAZIFISCHEN MÄRKTE IM PROGNOSEZEITRAUM 2022 BIS 2029 VORAUSSICHTLICH ANTREIBEN
ABBILDUNG 14: DAS HARDWARE-SEGMENT WIRD VON 2022 BIS 2029 VORAUSSICHTLICH DEN GRÖSSTEN ANTEIL AM MARKTS FÜR AUGMENTED REALITY (AR) UND MIXED REALITY (MR) IM ASIEN-PAZIFISCHEN RAUM EINNEHMEN.
ABBILDUNG 15: NORDAMERIKA WIRD IM PROGNOSEZEITRAUM 2022 BIS 2029 VORAUSSICHTLICH DOMINIEREN, UND DER ASIEN-PAZIFIK-RAUM IST DIE AM SCHNELLSTEN WACHSENDE REGION IM MARKT FÜR AUGMENTED REALITY (AR) UND MIXED REALITY (MR) IM ASIEN-PAZIFIK-RAUM
ABBILDUNG 16: TREIBER, EINSCHRÄNKUNGEN, CHANCEN UND HERAUSFORDERUNGEN DES MARKTES FÜR AUGMENTED REALITY (AR) UND MIXED REALITY (MR) IM ASIEN-PAZIFISCHEN RAUM
ABBILDUNG 17 MARKT FÜR AUGMENTED REALITY (AR) UND MIXED REALITY (MR) IM ASIEN-PAZIFIK-RAUM: NACH KOMPONENTE, 2021
ABBILDUNG 18 MARKT FÜR AUGMENTED REALITY (AR) UND MIXED REALITY (MR) IM ASIEN-PAZIFIK-RAUM: NACH BEREITSTELLUNGSMODELL, 2021
ABBILDUNG 19 MARKT FÜR AUGMENTED REALITY (AR) UND MIXED REALITY (MR) IM ASIEN-PAZIFIK-RAUM: NACH GERÄTETYP, 2021
ABBILDUNG 20 MARKT FÜR AUGMENTED REALITY (AR) UND MIXED REALITY (MR) IM ASIEN-PAZIFIK-RAUM: NACH TECHNOLOGIE, 2021
ABBILDUNG 21 MARKT FÜR AUGMENTED REALITY (AR) UND MIXED REALITY (MR) IM ASIEN-PAZIFIK-RAUM: NACH VERTRIEBSKANAL, 2021
ABBILDUNG 22 MARKT FÜR AUGMENTED REALITY (AR) UND MIXED REALITY (MR) IM ASIEN-PAZIFIK-RAUM: NACH ANWENDUNG, 2021
ABBILDUNG 23 MARKT FÜR AUGMENTED REALITY (AR) UND MIXED REALITY (MR) IM ASIEN-PAZIFIK-RAUM: NACH ENDBENUTZER, 2021
ABBILDUNG 24 MARKT FÜR AUGMENTED REALITY (AR) UND MIXED REALITY (MR) IM ASIEN-PAZIFISCHEN RAUM: ÜBERBLICK (2021)
ABBILDUNG 25 MARKT FÜR AUGMENTED REALITY (AR) UND MIXED REALITY (MR) IM ASIEN-PAZIFISCHEN RAUM: NACH KOMPONENTE (2022 UND 2029)
ABBILDUNG 26 MARKT FÜR AUGMENTED REALITY (AR) UND MIXED REALITY (MR) IM ASIEN-PAZIFIK-RAUM: UNTERNEHMENSANTEIL 2021 (%)

Forschungsmethodik
Die Datenerfassung und Basisjahresanalyse werden mithilfe von Datenerfassungsmodulen mit großen Stichprobengrößen durchgeführt. Die Phase umfasst das Erhalten von Marktinformationen oder verwandten Daten aus verschiedenen Quellen und Strategien. Sie umfasst die Prüfung und Planung aller aus der Vergangenheit im Voraus erfassten Daten. Sie umfasst auch die Prüfung von Informationsinkonsistenzen, die in verschiedenen Informationsquellen auftreten. Die Marktdaten werden mithilfe von marktstatistischen und kohärenten Modellen analysiert und geschätzt. Darüber hinaus sind Marktanteilsanalyse und Schlüsseltrendanalyse die wichtigsten Erfolgsfaktoren im Marktbericht. Um mehr zu erfahren, fordern Sie bitte einen Analystenanruf an oder geben Sie Ihre Anfrage ein.
Die wichtigste Forschungsmethodik, die vom DBMR-Forschungsteam verwendet wird, ist die Datentriangulation, die Data Mining, die Analyse der Auswirkungen von Datenvariablen auf den Markt und die primäre (Branchenexperten-)Validierung umfasst. Zu den Datenmodellen gehören ein Lieferantenpositionierungsraster, eine Marktzeitlinienanalyse, ein Marktüberblick und -leitfaden, ein Firmenpositionierungsraster, eine Patentanalyse, eine Preisanalyse, eine Firmenmarktanteilsanalyse, Messstandards, eine globale versus eine regionale und Lieferantenanteilsanalyse. Um mehr über die Forschungsmethodik zu erfahren, senden Sie eine Anfrage an unsere Branchenexperten.
Anpassung möglich
Data Bridge Market Research ist ein führendes Unternehmen in der fortgeschrittenen formativen Forschung. Wir sind stolz darauf, unseren bestehenden und neuen Kunden Daten und Analysen zu bieten, die zu ihren Zielen passen. Der Bericht kann angepasst werden, um Preistrendanalysen von Zielmarken, Marktverständnis für zusätzliche Länder (fordern Sie die Länderliste an), Daten zu klinischen Studienergebnissen, Literaturübersicht, Analysen des Marktes für aufgearbeitete Produkte und Produktbasis einzuschließen. Marktanalysen von Zielkonkurrenten können von technologiebasierten Analysen bis hin zu Marktportfoliostrategien analysiert werden. Wir können so viele Wettbewerber hinzufügen, wie Sie Daten in dem von Ihnen gewünschten Format und Datenstil benötigen. Unser Analystenteam kann Ihnen auch Daten in groben Excel-Rohdateien und Pivot-Tabellen (Fact Book) bereitstellen oder Sie bei der Erstellung von Präsentationen aus den im Bericht verfügbaren Datensätzen unterstützen.











