Global Lyophilized Injectable Drugs Market
Marktgröße in Milliarden USD
CAGR :
% 
 USD
3.39 Billion
USD
5.49 Billion
2024
2032
USD
3.39 Billion
USD
5.49 Billion
2024
2032
| 2025 –2032 | |
| USD 3.39 Billion | |
| USD 5.49 Billion | |
| % | |
|
Globale Marktsegmentierung für lyophilisierte injizierbare Medikamente nach Verpackung (Fläschchen, Doppelkammerspritzen, Doppelkammerkartuschen, Spezialverpackungen, Point-of-Care-Rekonstitution, Einwegfläschchen und andere), Art der Verabreichung (Einzelschrittgeräte, Mehrschrittgeräte, vorgefüllte Verdünnungsspritzen und proprietäre Rekonstitutionsgeräte), Medikamentenklasse (Antiinfektiva, Antineoplastika, Diuretika, Protonenpumpenhemmer, Anästhetika, Antikoagulanzien, NSAIDs, Kortikosteroide und andere), Form (Pulver und Flüssigkeit), Indikation (Onkologie, Autoimmunerkrankungen, Hormonstörungen, Stoffwechselerkrankungen, Atemwegserkrankungen, Magen-Darm-Erkrankungen, Hauterkrankungen, Augenkrankheiten, Infektionskrankheiten und andere), Verabreichungsweg (intravenös/Infusion, intramuskulär und andere), Endbenutzer (Krankenhaus, Kliniken, Ambulante Operationszentren (ASCs), häusliche Gesundheitsversorgung und andere), Vertriebskanäle (direkte Ausschreibung, Einzelhandelsverkäufe und andere) – Branchentrends und Prognose bis 2032
Marktgröße für gefriergetrocknete injizierbare Medikamente
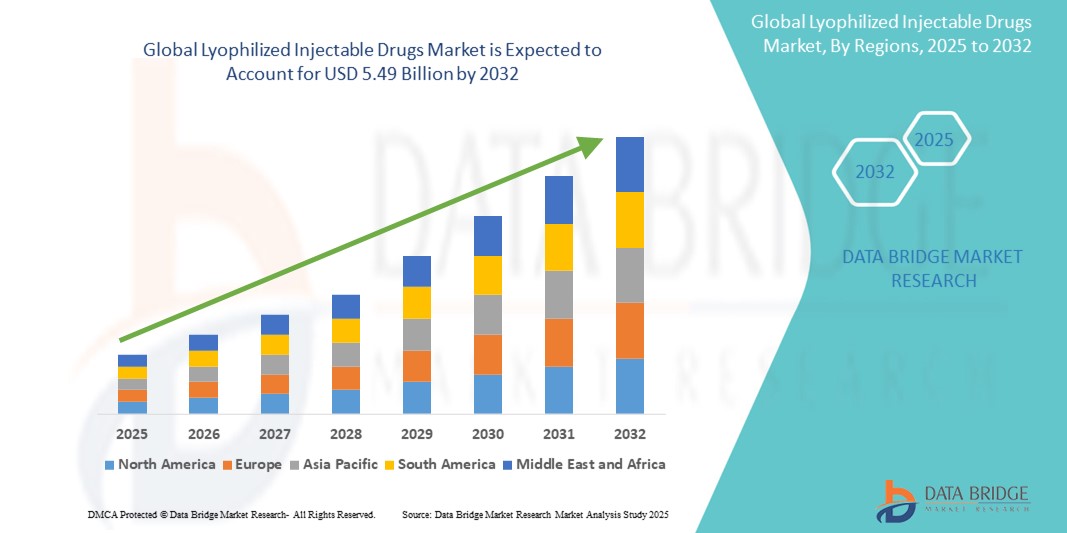
- Der globale Markt für gefriergetrocknete injizierbare Medikamente hatte im Jahr 2024 einen Wert von 3,39 Milliarden US-Dollar und dürfte bis 2032 einen Wert von 5,49 Milliarden US-Dollar erreichen, bei einer jährlichen Wachstumsrate von 6,2 % im Prognosezeitraum.
- Das Marktwachstum wird maßgeblich durch die zunehmende Einführung fortschrittlicher pharmazeutischer Formulierungen und den technologischen Fortschritt bei Gefriertrocknungstechniken vorangetrieben, was zu einer verbesserten Arzneimittelstabilität, längerer Haltbarkeit und verbesserter Transportfähigkeit im globalen Gesundheitswesen führt.
- Darüber hinaus führt die steigende Nachfrage nach stabileren und wirksameren Injektionsformulierungen – insbesondere für Biologika, Impfstoffe und Antiinfektiva – dazu, dass lyophilisierte Injektionspräparate bei Gesundheitsdienstleistern die erste Wahl sind. Diese Faktoren beschleunigen die Akzeptanz von lyophilisierten Injektionspräparaten und fördern damit das Wachstum der Branche erheblich.
Marktanalyse für lyophilisierte injizierbare Medikamente
- Lyophilisierte Injektionspräparate sind für ihre verbesserte Stabilität, längere Haltbarkeit und einfache Transportierbarkeit bekannt und werden aufgrund ihrer längeren Verwendbarkeit und geringeren Abhängigkeit von der Kühlkette zunehmend unverzichtbar für die Verabreichung von Biologika, Antibiotika , Impfstoffen und onkologischen Therapeutika in Krankenhäusern und Fachkliniken.
- Die steigende Nachfrage nach lyophilisierten injizierbaren Medikamenten wird vor allem durch die zunehmende Verbreitung chronischer Krankheiten, den zunehmenden Bedarf an parenteraler Verabreichung komplexer Biologika und die wachsende biopharmazeutische Pipeline zur Behandlung von Infektions- und Autoimmunerkrankungen angetrieben.
- Nordamerika dominierte den Markt für gefriergetrocknete Injektionspräparate mit dem größten Umsatzanteil von 38,7 % im Jahr 2024. Dies ist gekennzeichnet durch die starke Präsenz pharmazeutischer Produktionszentren, eine fortschrittliche Gesundheitsinfrastruktur und die weit verbreitete Einführung neuartiger Technologien zur Arzneimittelverabreichung, insbesondere in den USA, die bei FDA-Zulassungen für gefriergetrocknete Formulierungen und Investitionen in Alternativen zur Kühlkettenlogistik führend sind.
- Der asiatisch-pazifische Raum dürfte die am schnellsten wachsende Region im Markt für gefriergetrocknete Injektionspräparate sein und von 2025 bis 2032 voraussichtlich eine jährliche Wachstumsrate von 10,6 % erreichen. Grund hierfür sind die zunehmende Urbanisierung, das rasante Wachstum des Pharma-Outsourcings, die steigende Zahl an Infektionskrankheiten und der verbesserte Zugang zur Gesundheitsversorgung in Schwellenländern wie China und Indien.
- Das Segment der Antiinfektiva dominierte den Markt für gefriergetrocknete Injektionspräparate mit einem Marktanteil von 41,3 % im Jahr 2024. Dies ist auf die zunehmende Belastung durch antimikrobielle Resistenzen und die zunehmende Verwendung gefriergetrockneter Formulierungen in der Intensiv- und Notfallmedizin aufgrund ihrer langen Haltbarkeit und einfachen Rekonstitution zurückzuführen.
Berichtsumfang und Marktsegmentierung für lyophilisierte injizierbare Arzneimittel
|
Eigenschaften |
Wichtige Markteinblicke für lyophilisierte injizierbare Medikamente |
|
Abgedeckte Segmente |
|
|
Abgedeckte Länder |
Nordamerika
Europa
Asien-Pazifik
Naher Osten und Afrika
Südamerika
|
|
Wichtige Marktteilnehmer |
|
|
Marktchancen |
|
|
Wertschöpfungsdaten-Infosets |
Zusätzlich zu den Einblicken in Marktszenarien wie Marktwert, Wachstumsrate, Segmentierung, geografische Abdeckung und wichtige Akteure enthalten die von Data Bridge Market Research kuratierten Marktberichte auch ausführliche Expertenanalysen, Preisanalysen, Markenanteilsanalysen, Verbraucherumfragen, demografische Analysen, Lieferkettenanalysen, Wertschöpfungskettenanalysen, eine Übersicht über Rohstoffe/Verbrauchsmaterialien, Kriterien für die Lieferantenauswahl, PESTLE-Analysen, Porter-Analysen und regulatorische Rahmenbedingungen. |
Markttrends für gefriergetrocknete injizierbare Medikamente
„Fortschritte in der Arzneimittelverabreichungstechnologie treiben die Markttransformation voran“
- Ein bedeutender und zunehmender Trend auf dem globalen Markt für gefriergetrocknete Injektionspräparate ist die Integration innovativer Verabreichungstechnologien und Rekonstitutionssysteme, die den Patientenkomfort, die Compliance und die Arzneimittelstabilität verbessern sollen. Diese technologische Entwicklung verändert die Lagerung, Handhabung und Verabreichung von Injektionspräparaten, insbesondere im klinischen und häuslichen Bereich.
- Die Entwicklung von Doppelkammerspritzen und -kartuschen ermöglicht es beispielsweise, das gefriergetrocknete Medikament und das Verdünnungsmittel getrennt zu lagern und erst kurz vor der Verabreichung zu mischen. Dies gewährleistet die Wirksamkeit des Medikaments und vereinfacht die Zubereitung für medizinisches Personal und Patienten gleichermaßen. Unternehmen wie SCHOTT und West Pharmaceutical Services leisten Pionierarbeit bei der Entwicklung benutzerfreundlicher Rekonstitutionssysteme, um Fehler zu reduzieren und die Anwendung zu optimieren.
- Einstufige und proprietäre Rekonstitutionsgeräte erfreuen sich in der chronischen Therapie zunehmender Beliebtheit. Sie ermöglichen eine präzise Dosierung und minimieren den Bedarf an komplexer manueller Zubereitung. Diese Technologien sind besonders in der häuslichen Pflege nützlich, da sie es Patienten ermöglichen, sich Medikamente mit minimaler Aufsicht selbst zu verabreichen und so Krankenhausaufenthalte zu reduzieren.
- Intelligente Verpackungslösungen mit Indikatoren für die korrekte Rekonstitution und das Verfallsdatum gewinnen ebenfalls an Bedeutung und verbessern das Sicherheitsprofil gefriergetrockneter Injektionspräparate. Die Integration manipulationssicherer und nadelsicherer Designs unterstreicht die zunehmende Bedeutung von Anwendersicherheit und Produktintegrität.
- Darüber hinaus treibt der Fokus der Pharmaindustrie auf eine längere Haltbarkeit und verbesserte Hitzestabilität die Forschung an fortschrittlichen Gefriertrocknungstechniken voran. Verbesserte Formulierungen, die ohne Kühlung gelagert und transportiert werden können, sind entscheidend, um den Zugang zu lebenswichtigen Medikamenten in abgelegenen oder unterversorgten Regionen zu verbessern.
- Dieser Trend zu intelligenteren, bequemeren und hochstabilen Injektionssystemen setzt neue Maßstäbe in der Pharmabranche. Führende Unternehmen investieren daher massiv in Forschung und Entwicklung, um die nächste Generation gefriergetrockneter Injektionsmedikamente mit fortschrittlichen Verabreichungsmechanismen auf den Markt zu bringen, die auf die patientenzentrierte Versorgung zugeschnitten sind.
Marktdynamik für lyophilisierte injizierbare Medikamente
Treiber
„Steigender Bedarf aufgrund der steigenden Nachfrage nach stabilen und langwirksamen injizierbaren Therapien“
- Die weltweit zunehmende Belastung durch chronische Krankheiten und Infektionskrankheiten sowie der Bedarf an langfristig stabilen Arzneimittelformulierungen haben die Nachfrage nach lyophilisierten Injektionspräparaten deutlich erhöht. Diese Formulierungen bieten verbesserte Stabilität, längere Haltbarkeit sowie einfache Lagerung und Transport und eignen sich daher ideal für den Einsatz im klinischen und abgelegenen Gesundheitswesen.
- So führte Baxter International Inc. im April 2024 ein erweitertes Sortiment an lyophilisierten Antiinfektiva zur Injektion ein. Diese sind für den Einsatz im ambulanten und stationären Bereich konzipiert und bieten eine bessere Haltbarkeit und bessere Behandlungsergebnisse. Solche Initiativen dürften das Marktwachstum im Prognosezeitraum beschleunigen.
- Gesundheitssysteme auf der ganzen Welt setzen zunehmend auf gefriergetrocknete Injektionspräparate, da diese im Vergleich zu flüssigen Formulierungen eine höhere chemische und physikalische Stabilität aufweisen, insbesondere in Regionen mit eingeschränkter Kühlketteninfrastruktur.
- Darüber hinaus sind diese Medikamente in der Onkologie, bei Autoimmunerkrankungen und in der Notfallmedizin von entscheidender Bedeutung, da eine schnelle Rekonstitution und sofortige Verabreichung entscheidend sind.
- Die zunehmende Präferenz für gebrauchsfertige oder Point-of-Care-Rekonstitutionssysteme, unterstützt durch Innovationen bei Doppelkammerspritzen und -fläschchen, treibt den Markt weiter an und ermöglicht eine sicherere, schnellere und effizientere Arzneimittelverabreichung im Krankenhaus und in der häuslichen Pflege.
- Da Pharmahersteller ihre Produktlinien um gefriergetrocknete Versionen wichtiger Medikamente erweitern und Auftragshersteller (CMOs) ihre Gefriertrocknungskapazitäten verbessern, erlebt der Markt sowohl in Industrie- als auch in Entwicklungsländern einen starken Aufschwung.
Einschränkung/Herausforderung
„Komplexer Herstellungsprozess und hohe Produktionskosten“
- Trotz des starken Wachstums steht der Markt für gefriergetrocknete Injektionspräparate vor erheblichen Herausforderungen, die sich aus der Komplexität und den Kosten der Gefriertrocknungsprozesse ergeben. Spezialausrüstung, strenge aseptische Bedingungen und längere Produktionszeiten tragen zu höheren Kosten im Vergleich zu herkömmlichen Formulierungen bei.
- Beispielsweise erfordert die Einrichtung einer Lyophilisierungsanlage im kommerziellen Maßstab erhebliche Kapitalinvestitionen, was kleinere Pharmaunternehmen oder Startups vom Markteintritt abhalten kann.
- Darüber hinaus sind die gesetzlichen Anforderungen für sterile injizierbare Medikamente streng, was zusätzliche Ebenen der Qualitätskontrolle, Dokumentation und Prüfung erfordert – Faktoren, die die Produktentwicklungszeiträume verlängern und die Betriebskosten erhöhen.
- Der Bedarf an fortschrittlichen Verpackungstechnologien, wie beispielsweise Doppelkammersystemen, und die Notwendigkeit einer Kühlkettenlogistik in manchen Fällen trotz Gefriertrocknung können die Komplexität der Lieferkette und die Gesamtproduktkosten erhöhen.
- Um diese Hindernisse zu überwinden, investieren Hersteller in kontinuierliche Gefriertrocknungstechnologien und modulare Reinraumsysteme, um Abläufe zu optimieren und Kosten zu senken. Kooperationen mit CDMOs und staatliche Anreize für den Ausbau lokaler Produktionskapazitäten tragen ebenfalls dazu bei, diese Herausforderungen zu bewältigen.
- Dennoch ist die Überwindung dieser Einschränkungen durch Innovationen in der Fertigung, Prozessoptimierung und skalierbare Technologieeinführung unerlässlich, um das volle Wachstumspotenzial des Marktes für gefriergetrocknete injizierbare Medikamente weltweit auszuschöpfen.
Marktumfang für lyophilisierte injizierbare Arzneimittel
Der Markt ist nach Verpackung, Art der Verabreichung, Arzneimittelklasse, Form, Indikation, Verabreichungsweg, Endverbraucher und Vertriebskanal segmentiert.
• Durch Verpackung
Der Markt für gefriergetrocknete Injektionspräparate ist nach Verpackungen segmentiert: Fläschchen, Doppelkammerspritzen, Doppelkammerkarpulen, Spezialverpackungen, Point-of-Care-Rekonstitution, Einwegfläschchen und weitere. Fläschchen hatten im Jahr 2024 mit 36,5 % den größten Marktanteil, was auf ihre Kosteneffizienz und Kompatibilität mit verschiedenen Medikamentenklassen zurückzuführen ist.
Für Doppelkammerspritzen wird von 2025 bis 2032 mit einer durchschnittlichen jährlichen Wachstumsrate von 9,8 % das höchste Wachstum erwartet, angetrieben durch die Nachfrage nach gebrauchsfertigen, sterilen Verabreichungssystemen.
• Nach Lieferart
Der Markt für gefriergetrocknete Injektionspräparate ist nach der Art der Verabreichung segmentiert in Einstufengeräte, Mehrstufengeräte, vorgefüllte Verdünnungsspritzen und proprietäre Rekonstitutionsgeräte. Einstufengeräte machten im Jahr 2024 34,7 % des Marktanteils aus und wurden aufgrund ihrer Einfachheit und Zeiteffizienz bevorzugt.
Aufgrund ihrer fortschrittlichen Technologie und Sicherheitsfunktionen dürften proprietäre Rekonstitutionsgeräte zwischen 2025 und 2032 die höchste durchschnittliche jährliche Wachstumsrate (CAGR) von 10,1 % verzeichnen.
• Nach Arzneimittelklasse
Der Markt für gefriergetrocknete Injektionspräparate ist nach Wirkstoffklassen in Antiinfektiva, Antineoplastika, Diuretika, Protonenpumpenhemmer, Anästhetika, Antikoagulanzien, NSAR, Kortikosteroide und weitere unterteilt. Aufgrund der weltweiten Verbreitung von Infektionskrankheiten dominierten Antiinfektiva mit einem Marktanteil von 41,3 % im Jahr 2024.
Aufgrund der zunehmenden Krebsinzidenz und des Bedarfs an stabilen Formulierungen wird für antineoplastische Medikamente von 2025 bis 2032 ein durchschnittliches jährliches Wachstum von 9,6 % prognostiziert.
• Nach Formular
Der Markt für gefriergetrocknete Injektionspräparate ist nach Form in Pulver und Flüssigkeiten unterteilt. Die Pulverform machte im Jahr 2024 mit 65,4 % den größten Anteil aus, was auf die längere Haltbarkeit und bessere Transportstabilität zurückzuführen ist.
Aufgrund der einfachen Handhabung und der bevorzugten Verwendung in der Notfallversorgung wird für das Flüssigsegment von 2025 bis 2032 ein durchschnittliches jährliches Wachstum von 6,2 % erwartet.
• Nach Indikation
Der Markt für gefriergetrocknete Injektionspräparate ist nach Indikation in die Bereiche Onkologie, Autoimmunerkrankungen, Hormonstörungen, Stoffwechselerkrankungen, Atemwegserkrankungen, Magen-Darm-Erkrankungen, Hauterkrankungen, Augenerkrankungen, Infektionskrankheiten und weitere unterteilt. Aufgrund der hohen Nachfrage nach injizierbaren Chemotherapeutika führte die Onkologie den Markt im Jahr 2024 mit einem Anteil von 26,9 % an.
Es wird erwartet, dass Infektionskrankheiten zwischen 2025 und 2032 mit einer durchschnittlichen jährlichen Wachstumsrate von 8,8 % zunehmen, was durch die zunehmende Verwendung gefriergetrockneter antimikrobieller Mittel unterstützt wird.
• Nach Verabreichungsweg
Der Markt für gefriergetrocknete Injektionspräparate ist nach Arzneimittelklassen in intravenöse/Infusion, intramuskuläre und sonstige Arzneimittel unterteilt. Aufgrund der Verwendung in der Intensivpflege hatte die intravenöse/Infusionstherapie im Jahr 2024 mit 58,1 % den größten Marktanteil.
Für den intramuskulären Verabreichungsweg wird von 2025 bis 2032 ein durchschnittliches jährliches Wachstum von 6,4 % prognostiziert, das auf den Trend zur häuslichen und ambulanten Versorgung zurückzuführen ist.
• Durch Endbenutzer
Der Markt für gefriergetrocknete Injektionspräparate ist nach Arzneimittelklassen in Krankenhäuser, Kliniken, ambulante Operationszentren (ASCs), häusliche Pflege und andere Bereiche unterteilt. Krankenhäuser hatten im Jahr 2024 aufgrund des hohen Behandlungsvolumens und der fortschrittlichen Infrastruktur den größten Anteil von 42,7 %.
Die häusliche Gesundheitspflege dürfte zwischen 2025 und 2032 voraussichtlich mit einer durchschnittlichen jährlichen Wachstumsrate von 10,5 % wachsen, da die Patienten zunehmend eine Behandlung zu Hause und die Selbstverabreichung bevorzugen.
• Nach Vertriebskanal
Der Markt für gefriergetrocknete Injektionspräparate ist nach Arzneimittelklassen in Direktausschreibungen, Einzelhandelsverkäufe und andere Kanäle unterteilt. Direktausschreibungen waren mit einem Anteil von 53,2 % im Jahr 2024 der führende Kanal, unterstützt durch institutionelle Käufe von öffentlichen und privaten Krankenhäusern.
Es wird erwartet, dass die Einzelhandelsumsätze zwischen 2025 und 2032 mit einer durchschnittlichen jährlichen Wachstumsrate von 9,1 % wachsen werden, da im ambulanten Bereich und im E-Commerce immer mehr injizierbare Medikamente verfügbar werden.
Regionale Analyse des Marktes für lyophilisierte injizierbare Arzneimittel
- Nordamerika dominierte den Markt für gefriergetrocknete Injektionspräparate mit dem größten Umsatzanteil von 38,7 % im Jahr 2024, was auf eine starke pharmazeutische Produktionsbasis, die zunehmende Verbreitung chronischer Krankheiten und eine gut etablierte Gesundheitsinfrastruktur zurückzuführen ist.
- Das Wachstum der Region wird durch erhebliche Investitionen in fortschrittliche Arzneimittelverabreichungssysteme und eine hohe Akzeptanz gefriergetrockneter Formulierungen aufgrund ihrer längeren Haltbarkeit und Stabilität unterstützt.
- Darüber hinaus legen große Pharmaunternehmen in den USA und Kanada weiterhin Wert auf die Entwicklung gefriergetrockneter injizierbarer Medikamente für die Onkologie, Infektionskrankheiten und Autoimmunerkrankungen und tragen so zu einer nachhaltigen Marktexpansion bei.
Markteinblick für gefriergetrocknete injizierbare Medikamente in den USA
Der US-Markt für gefriergetrocknete Injektionspräparate erzielte 2024 mit 80,1 % den größten Umsatzanteil in Nordamerika. Dies ist auf eine robuste klinische Pipeline, eine fortschrittliche Produktionsinfrastruktur und die zunehmende Präferenz für stabile, langlebige Formulierungen zurückzuführen. Die zunehmende Verbreitung chronischer Erkrankungen wie Krebs und Autoimmunerkrankungen fördert den Einsatz gefriergetrockneter Injektionspräparate, die den Kühlbedarf reduzieren und die Produktstabilität gewährleisten. Darüber hinaus tragen die starke regulatorische Unterstützung durch die FDA und die Präsenz führender biopharmazeutischer Akteure maßgeblich zum Marktwachstum bei.
Markteinblick für gefriergetrocknete injizierbare Medikamente in Europa
Der europäische Markt für gefriergetrocknete Injektionspräparate wird voraussichtlich von 2025 bis 2032 mit einer durchschnittlichen jährlichen Wachstumsrate von 8,9 % wachsen. Dies wird durch die steigende Nachfrage nach temperatur- und lagerstabilen Formulierungen in verschiedenen Gesundheitseinrichtungen unterstützt. Der verstärkte Fokus auf die Optimierung der Kühlkettenlogistik und die Deckung ungedeckter Bedürfnisse in den Bereichen Onkologie und Infektionskrankheiten beschleunigt die Akzeptanz. Darüber hinaus stärkt die zunehmende Entwicklung von Biosimilars und das Outsourcing an Auftragshersteller (CMOs) das regionale Wachstum im Bereich gefriergetrockneter Injektionspräparate.
Markteinblick für gefriergetrocknete injizierbare Medikamente in Großbritannien
Der britische Markt für gefriergetrocknete Injektionspräparate wird im Prognosezeitraum voraussichtlich mit einer bemerkenswerten jährlichen Wachstumsrate von 9,1 % wachsen. Dies ist auf steigende Krankenhauseinweisungen aufgrund chronischer Erkrankungen und einen verstärkten Fokus auf pharmazeutische Innovationen zurückzuführen. Das britische Gesundheitssystem, angeführt vom NHS, bevorzugt zunehmend kostengünstige, stabile Formulierungen, die eine verbesserte Verabreichung und Lagerung von Medikamenten ermöglichen. Darüber hinaus treiben die steigende Zahl klinischer Studien und der Ausbau der Spezialmedikamentenproduktion die Marktdynamik voran.
Markteinblick für lyophilisierte injizierbare Medikamente in Deutschland
Der deutsche Markt für gefriergetrocknete Injektionspräparate wird voraussichtlich mit einer durchschnittlichen jährlichen Wachstumsrate (CAGR) von 8,5 % wachsen. Dies ist auf die fortschrittliche pharmazeutische Infrastruktur und steigende Investitionen in Biologika und Biosimilars zurückzuführen. Deutsche Krankenhäuser und ambulante Einrichtungen setzen verstärkt auf gefriergetrocknete Formulierungen, um die Stabilität zu verbessern, den Kühlbedarf zu reduzieren und die Haltbarkeit zu verlängern. Der Markt profitiert zudem vom Engagement Deutschlands für Nachhaltigkeit im Gesundheitswesen und Präzisionsmedizin .
Markteinblick für gefriergetrocknete injizierbare Medikamente im asiatisch-pazifischen Raum
Der Markt für gefriergetrocknete Injektionspräparate im asiatisch-pazifischen Raum dürfte von 2025 bis 2032 mit einer durchschnittlichen jährlichen Wachstumsrate von 10,6 % wachsen. Dies ist auf steigende Gesundheitsausgaben, die rasante Urbanisierung und den Ausbau der Arzneimittelproduktion in Ländern wie China, Indien und Japan zurückzuführen. Der Trend der Region zu kostengünstigen, stabilen Injektionstherapien, insbesondere in ressourcenarmen Regionen, beschleunigt die Akzeptanz deutlich. Darüber hinaus treiben staatliche Initiativen zur Unterstützung der inländischen Arzneimittelproduktion und klinischen Forschung das regionale Marktwachstum voran.
Markteinblick für gefriergetrocknete injizierbare Medikamente in Japan
Der japanische Markt für gefriergetrocknete Injektionspräparate gewinnt an Dynamik und wird 2024 18,2 % des Umsatzes im asiatisch-pazifischen Raum ausmachen. Begünstigt werden dies durch die alternde Bevölkerung, die hohe Prävalenz chronischer Erkrankungen und einen starken Fokus auf Innovationen im Gesundheitswesen. Gefriergetrocknete Formulierungen werden aufgrund ihrer längeren Haltbarkeit und der geringeren Abfallmenge zunehmend eingesetzt. Japans führende Rolle in der biopharmazeutischen Forschung und Entwicklung sowie strenge Qualitätsvorschriften fördern die Nachfrage nach stabilen Injektionslösungen, insbesondere in der Onkologie und der Behandlung von Stoffwechselerkrankungen.
Markteinblick für gefriergetrocknete injizierbare Medikamente in China
Der chinesische Markt für gefriergetrocknete Injektionspräparate erzielte 2024 mit 44,5 % den größten Umsatzanteil im asiatisch-pazifischen Raum. Dies ist auf das schnelle Wachstum der Arzneimittelproduktion, die starke Nachfrage nach onkologischen und antiinfektiösen Therapien sowie umfassende Gesundheitsreformen zurückzuführen. Als einer der führenden Märkte für biopharmazeutische Produktion und Auftragsfertigung verzeichnet China eine steigende Nachfrage nach gefriergetrockneten Injektionspräparaten in Krankenhäusern, Kliniken und im Einzelhandel. Staatliche Innovationsförderung und ein verbesserter Zugang zur Gesundheitsversorgung in Städten mit niedrigerem Einkommen beschleunigen das Marktwachstum zusätzlich.
Marktanteil gefriergetrockneter injizierbarer Medikamente
Die Branche der gefriergetrockneten Injektionsmedikamente wird hauptsächlich von etablierten Unternehmen angeführt, darunter:
- GENEX PHARMA (Indien)
- Aurobindo Pharma USA (USA)
- Astellas Pharma Inc. (USA)
- Pfizer Inc. (USA)
- Viatris Inc. (USA)
- Gilead Sciences, Inc. (USA)
- Cirondrugs (Indien)
- Amneal Pharmaceuticals LLC (USA)
- Jubilant Generics Limited (Indien)
- Novartis AG (Schweiz)
- Otsuka America Pharmaceutical, Inc. (USA)
- Zydus Group (Indien)
- Cipla Inc. (Indien)
- Merck & Co., Inc. (Deutschland)
- Fresenius Kabi AG (USA)
- Sanofi (Frankreich)
- CELON LABS (Indien)
- Baxter (USA)
Neueste Entwicklungen auf dem globalen Markt für gefriergetrocknete injizierbare Arzneimittel
- Im Mai 2024 kündigte Pfizer Inc. die Erweiterung seiner Gefriertrocknungsanlagen in seinem Werk in Kalamazoo, Michigan, an, um der steigenden Nachfrage nach stabilen injizierbaren Biologika und mRNA-basierten Therapien gerecht zu werden. Die Investition zielt darauf ab, die Skalierbarkeit der Produktion zu verbessern und die Abhängigkeit von der Kühlkette zu minimieren. Damit stärkt Pfizer seine Führungsrolle bei innovativen Technologien zur Arzneimittelverabreichung.
- Im April 2024 nahm Recipharm AB, ein führendes Auftragsentwicklungs- und -herstellungsunternehmen (CDMO), eine neue hochmoderne Gefriertrocknungslinie in seinem Werk in Brescia, Italien, in Betrieb. Diese Erweiterung soll der steigenden weltweiten Nachfrage nach gefriergetrockneten Injektionspräparaten, insbesondere in den Bereichen Onkologie und seltene Krankheiten, gerecht werden und stärkt Recipharms Präsenz auf dem europäischen Auftragsfertigungsmarkt.
- Im Februar 2024 kooperierte Baxter International Inc. mit der US-amerikanischen Biomedical Advanced Research and Development Authority (BARDA), um die inländische Produktion von gefriergetrockneten Injektionspräparaten für die Notfallvorsorge zu verbessern. Die Partnerschaft konzentriert sich auf die Verbesserung der Lieferkettenstabilität und die Erhöhung der nationalen Vorräte an temperaturstabilen, lebenswichtigen Medikamenten.
- Im Januar 2024 erhielt Aurobindo Pharma Limited die US-amerikanische FDA-Zulassung für seine gefriergetrocknete generische Version von Meropenem zur Injektion und erweiterte damit sein Portfolio an sterilen Injektionsprodukten für Krankenhäuser. Dieser Meilenstein stärkt die Position des Unternehmens im wettbewerbsintensiven Markt für injizierbare Generika und bietet kostengünstige Lösungen für die Intensivpflege.
- Im Dezember 2023 gab Cipla Limited die Vermarktung seines selbst entwickelten lyophilisierten Onkologiemedikaments Docetaxel Injection USP auf dem indischen Markt bekannt. Die Produkteinführung zielt darauf ab, erschwingliche, hochwertige Chemotherapien mit verbesserter Haltbarkeit und Lagervorteilen anzubieten und unterstreicht Ciplas Engagement für eine zugängliche Krebsbehandlung.
- Im November 2023 begann die Vetter Pharma-Fertigung GmbH & Co. KG, ein globaler Auftragshersteller (CDMO), mit dem Bau einer neuen Anlage in Österreich für die großtechnische Produktion gefriergetrockneter Injektionspräparate. Die Anlage wird Biotech- und Pharmapartner mit fortschrittlichen Abfüllanlagen für hochwertige Biologika und empfindliche Wirkstoffe unterstützen.
- Im Oktober 2023 erweiterte Hikma Pharmaceuticals PLC sein Angebot an gefriergetrockneten Injektionspräparaten in den USA mit der Einführung zusätzlicher generischer Antiinfektiva und Herz-Kreislauf-Medikamente. Dieser Schritt unterstützt Krankenhäuser bei der Bewältigung von Medikamentenengpässen, indem er zuverlässige Lieferalternativen mit verlängerter Haltbarkeit bietet.
SKU-
Erhalten Sie Online-Zugriff auf den Bericht zur weltweit ersten Market Intelligence Cloud

- Interaktives Datenanalyse-Dashboard
- Unternehmensanalyse-Dashboard für Chancen mit hohem Wachstumspotenzial
- Zugriff für Research-Analysten für Anpassungen und Abfragen
- Konkurrenzanalyse mit interaktivem Dashboard
- Aktuelle Nachrichten, Updates und Trendanalyse
- Nutzen Sie die Leistungsfähigkeit der Benchmark-Analyse für eine umfassende Konkurrenzverfolgung
Inhaltsverzeichnis
- introduction
- OBJECTIVES OF THE STUDY
- MARKET DEFINITION
- OVERVIEW of GLOBAL lyophilized injectable drugs market
- LIMITATIONs
- MARKETS COVERED
- MARKET SEGMENTATION
- MARKETS COVERED
- geographical scope
- years considered for the study
- currency and pricing
- DBMR TRIPOD DATA VALIDATION MODEL
- MULTIVARIATE MODELLING
- packaging LIFELINE CURVE
- primary interviews with key opinion leaders
- DBMR MARKET POSITION GRID
- vendor share analysis
- MARKET end user COVERAGE GRID
- secondary sourcEs
- assumptions
- EXECUTIVE SUMMARY
- GLOBAL LYOPHILIZED INJECTABLE DRUGS MARKET: REGULATORY FRAMEWORK
- Epidemiology
- Market Overview
- drivers
- rise in chronic health conditions
- safe transit and storage of these substances until their end-use
- increase in geriatric population with chronic diseases
- expansion of pipeline of lyophilized injectable drugs
- technological advancements
- Restraints
- Risk of needlestick injuries
- IncreasE IN number of product recalls for lyophilized drugs and packaging type
- OPPORTUNITIES
- RisE IN regulatory approvals for lyophilized drugs
- STRATEGIC INITIATIVES OF KEY MARKET PLAYERS
- quality concerns
- challenges
- challenges associated with manufacturing lyophilized vials for parenteral products
- Time-consuming process and high cost
- IMPACT OF COVID-19 ON THE GLOBAL LYOPHILIZED INJECTABLE DRUGS MARKET
- IMPACT ON PRICE
- IMPACT IN DEMAND
- IMPACT ON SUPPLY
- STRATEGIC INITIATIVE
- CONCLUSION
- Global lyophilized injectable drugs market, By packaging
- overview
- vials
- Dual-Chamber Syringes
- Dual-Chamber Cartridges
- Others
- global lyophilized injectable drugs market, By drug class
- overview
- Anti-Infective’s
- Antibiotics
- Azithromycin
- Doxycycline
- Vancomycin
- Polymyxin B
- Piperacillin
- Tazobactam
- Others
- Antifungal
- Mycamine
- Caspofungin Acetate
- Isavuconazonium Sulfate
- Amphotericin
- Others
- Antiviral
- Acyclovir
- Ganciclovir
- Remdesivir
- Others
- Others
- Antineoplastic
- Methotrexate
- Gemcitabine
- Cytarabine
- Fludarabine
- Doxorubicin
- Oxaliplatin
- Zoledronic Acid
- Others
- Diuretics
- Chlorothiazide
- Ethacrynic Acid
- Acetazolamide
- Others
- Proton Pump Inhibitor
- Esomeprazole Sodium
- Pantoprazole Sodium
- Omeprazole
- Others
- Anesthetic
- Vecuronium Bromide
- Sodium Thiopental
- Lidocaine
- Others
- Anticoagulant
- Coumadin
- Urokinase
- Antithrombin (Recombinant)
- Apixaban
- Rivaroxaban
- Others
- Nsaid’s
- Indomethacin
- Ibuprofen
- Diclofenac
- Ketorolac
- Others
- Corticosteroids
- Hydrocortisone
- Methylprednisolone
- Others
- Others
- global lyophilized injectable drugs market, By form
- overview
- Powder
- Liquid
- Global lyophilized injectable drugs market, By indication
- overview
- Oncology
- Autoimmune Diseases
- Hormonal Disorders
- Respiratory Diseases
- Gastrointestinal Disorders
- Dermatological Disorders
- Ophthalmic Diseases
- Others
- Global lyophilized injectable drugs market, By Route of administration
- overview
- Intravenous/Infusion
- Intramuscular
- Others
- Global lyophilized injectable drugs market, By end user
- overview
- Hospital
- Clinics
- Home Healthcare
- Others
- global lyophilized injectable drugs market, By distribution channel
- overview
- Direct Tenders
- Retail Sales
- Others
- global LYOPHILIZED INJECTABLE DRUGS MARKET, BY Region
- Overview
- north america
- u.s.
- Canada
- mexico
- europe
- Germany
- France
- U.K.
- ITALY
- SPAIN
- NETHERLANDS
- RUSSIA
- SWITZERLAND
- TURKEY
- AUSTRIA
- NORWAY
- HUNGARY
- LITHUANIA
- IRELAND
- POLAND
- REST OF EUROPE
- Asia-Pacific
- japan
- china
- south korea
- india
- australia
- singapore
- thailand
- malaysia
- indonesia
- philippines
- vietnam
- rest of asia-pacific
- South america
- Brazil
- argentina
- Peru
- rest of south america
- MIDDLE EAST & AFRICA
- South Africa
- Saudi Arabia
- U.A.E.
- EGYPT
- KUWAIT
- ISRAEL
- REST OF MIDDLE EAST & AFRICA
- Global Lyophilized Injectable Drugs Market: COMPANY landscape
- company share analysis: Global
- company share analysis: North America
- company share analysis: Europe
- company share analysis: Asia-Pacific
- Swot analysis
- Company profile
- pfizer Inc.
- COMPANY SNAPSHOT
- REVENUE ANALYSIS
- COMPANY SHARE ANALYSIS
- PRODUCT PORTFOLIO
- RECENT DEVELOPMENT
- Fresenius Kabi USA (A subsidiary of Fresenius Kabi AG)
- COMPANY SNAPSHOT
- REVENUE ANALYSIS
- COMPANY SHARE ANALYSIS
- PRODUCT PORTFOLIO
- RECENT DEVELOPMENTS
- Cipla Inc.
- COMPANY SNAPSHOT
- REVENUE ANALYSIS
- COMPANY SHARE ANALYSIS
- PRODUCT PORTFOLIO
- RECENT DEVELOPMENT
- Novartis AG
- COMPANY SNAPSHOT
- REVENUE ANALYSIS
- COMPANY SHARE ANALYSIS
- PRODUCT PORTFOLIO
- RECENT DEVELOPMENT
- Merck Sharp & Dohme Corp., A subsidiary of Merck & Co., Inc.
- COMPANY SNAPSHOT
- REVENUE ANALYSIS
- PRODUCT PORTFOLIO
- RECENT DEVELOPMENT
- Baxter
- COMPANY SNAPSHOT
- REVENUE ANALYSIS
- PRODUCT PORTFOLIO
- RECENT DEVELOPMENTS
- zydus cadila
- COMPANY SNAPSHOT
- REVENUE ANALYSIS
- PRODUCT PORTFOLIO
- RECENT DEVELOPMENT
- Affy Pharma Pvt Ltd.
- COMPANY SNAPSHOT
- PRODUCT PORTFOLIO
- RECENT DEVELOPMENT
- Amneal Pharmaceuticals LLC
- COMPANY SNAPSHOT
- REVENUE ANALYSIS
- PRODUCT PORTFOLIO
- RECENT DEVELOPMENTS
- Aristopharma Ltd.
- COMPANY SNAPSHOT
- PRODUCT PORTFOLIO
- RECENT DEVELOPMENT
- Astellas Pharma US, Inc. (A subsidiary of Astellas Pharma Inc.)
- COMPANY SNAPSHOT
- REVENUE ANALYSIS
- PRODUCT PORTFOLIO
- RECENT DEVELOPMENTS
- AuroMedics Pharma LLC (A subsidiary of Aurobindo Pharma)
- COMPANY SNAPSHOT
- REVENUE ANALYSIS
- PRODUCT PORTFOLIO
- RECENT DEVELOPMENTS
- celon laboratories pvt.ltd.
- COMPANY SNAPSHOT
- PRODUCT PORTFOLIO
- RECENT DEVELOPMENT
- Cirondrugs
- COMPANY SNAPSHOT
- PRODUCT PORTFOLIO
- RECENT DEVELOPMENT
- Genex Pharma
- COMPANY SNAPSHOT
- PRODUCT PORTFOLIO
- RECENT DEVELOPMENT
- Gilead Sciences, Inc.
- COMPANY SNAPSHOT
- REVENUE ANALYSIS
- PRODUCT PORTFOLIO
- RECENT DEVELOPMENTS
- Jubilant Generics Limited – A Jubilant Pharma Company
- COMPANY SNAPSHOT
- REVENUE ANALYSIS
- PRODUCT PORTFOLIO
- RECENT DEVELOPMENTS
- Otsuka America Pharmaceutical, Inc
- COMPANY SNAPSHOT
- PRODUCT PORTFOLIO
- RECENT DEVELOPMENTS
- sanofi
- COMPANY SNAPSHOT
- REVENUE ANALYSIS
- PRODUCT PORTFOLIO
- RECENT DEVELOPMENT
- viatris Inc.
- COMPANY SNAPSHOT
- REVENUE ANALYSIS
- PRODUCT PORTFOLIO
- RECENT DEVELOPMENT
- questionnaire
- related reports
Tabellenverzeichnis
TABELLE 1: Gefriergetrocknete injizierbare Arzneimittel in der Pipeline
TABELLE 2 Weltweiter Markt für gefriergetrocknete Injektionsmedikamente, nach Verpackung, 2019–2028 (Mio. USD)
TABELLE 3: Globaler Markt für Fläschchen in gefriergetrockneten Injektionsmedikamenten, nach Regionen, 2019–2028 (in Mio. USD)
TABELLE 4: Globaler Markt für Doppelkammerspritzen in gefriergetrockneten Injektionsmedikamenten, nach Regionen, 2019–2028 (in Mio. USD)
TABELLE 5: Globaler Markt für Doppelkammerkartuschen in gefriergetrockneten Injektionsmedikamenten, nach Regionen, 2019–2028 (in Mio. USD)
TABELLE 6: Globaler Markt für andere gefriergetrocknete injizierbare Arzneimittel, nach Regionen, 2019–2028 (in Mio. USD)
TABELLE 7: Weltweiter Markt für gefriergetrocknete Injektionsmedikamente, nach Medikamentenklasse, 2019–2028 (in Mio. USD)
TABELLE 8: Globaler Markt für gefriergetrocknete Injektionsmedikamente, nach Medikamentenklasse, 2019–2028 (Einheiten)
TABELLE 9 – Globaler Markt für Antiinfektiva in gefriergetrockneten Injektionspräparaten, nach Regionen, 2019–2028 (in Mio. USD)
TABELLE 10 – Globaler Markt für Antiinfektiva in gefriergetrockneten Injektionspräparaten, nach Arzneimittelklasse, 2019–2028 (in Mio. USD)
TABELLE 11 – Globaler Markt für Antibiotika in gefriergetrockneten Injektionsmedikamenten, nach Medikamentenklasse, 2019–2028 (in Mio. USD)
TABELLE 12 – Globaler Markt für Antimykotika in gefriergetrockneten Injektionspräparaten, nach Arzneimittelklasse, 2019–2028 (in Mio. USD)
TABELLE 13 – Globaler Markt für antivirale Medikamente in gefriergetrockneter Injektionsform, nach Medikamentenklasse, 2019–2028 (in Mio. USD)
TABELLE 14 – Globaler Markt für Antineoplastika in gefriergetrockneten Injektionspräparaten, nach Regionen, 2019–2028 (in Mio. USD)
TABELLE 15 – Globaler Markt für gefriergetrocknete injizierbare Antineoplastika, nach Medikamentenklasse, 2019–2028 (in Mio. USD)
TABELLE 16 – Globaler Markt für Diuretika in gefriergetrockneten Injektionsmedikamenten, nach Regionen, 2019–2028 (in Mio. USD)
TABELLE 17 – Globaler Markt für Diuretika in gefriergetrockneten Injektionspräparaten, nach Arzneimittelklasse, 2019–2028 (in Mio. USD)
TABELLE 18 – Globaler Markt für Protonenpumpenhemmer in gefriergetrockneten injizierbaren Arzneimitteln, nach Regionen, 2019–2028 (in Mio. USD)
TABELLE 19 – Globaler Markt für Protonenpumpenhemmer in gefriergetrockneten Injektionsmedikamenten, nach Medikamentenklasse, 2019–2028 (in Mio. USD)
TABELLE 20 – Globaler Markt für Anästhetika in gefriergetrockneten injizierbaren Arzneimitteln, nach Regionen, 2019–2028 (in Mio. USD)
TABELLE 21 – Globaler Markt für Anästhetika in gefriergetrockneten Injektionspräparaten, nach Arzneimittelklasse, 2019–2028 (in Mio. USD)
TABELLE 22 – Globaler Markt für Antikoagulanzien in gefriergetrockneten injizierbaren Arzneimitteln, nach Regionen, 2019–2028 (in Mio. USD)
TABELLE 23 – Globaler Markt für Antikoagulanzien in gefriergetrockneten Injektionsmedikamenten, nach Medikamentenklasse, 2019–2028 (in Mio. USD)
TABELLE 24 – Globaler Markt für NSAR in gefriergetrockneten Injektionsmedikamenten, nach Regionen, 2019–2028 (in Mio. USD)
TABELLE 25: Globaler Markt für NSAR in gefriergetrockneten Injektionsmedikamenten, nach Medikamentenklasse, 2019–2028 (in Mio. USD)
TABELLE 26 – Globaler Markt für Kortikosteroide in gefriergetrockneten injizierbaren Arzneimitteln, nach Regionen, 2019–2028 (in Mio. USD)
TABELLE 27 – Globaler Markt für Kortikosteroide in gefriergetrockneten Injektionsmedikamenten, nach Medikamentenklasse, 2019–2028 (in Mio. USD)
TABELLE 28 – Globaler Markt für andere gefriergetrocknete injizierbare Arzneimittel, nach Regionen, 2019–2028 (in Mio. USD)
TABELLE 29 – Globaler Markt für gefriergetrocknete injizierbare Arzneimittel, nach Form, 2019–2028 (in Mio. USD)
TABELLE 30 – Globaler Markt für Pulver in gefriergetrockneten Injektionsmedikamenten, nach Regionen, 2019–2028 (in Mio. USD)
TABELLE 31 – Globaler Markt für Flüssigkeiten in gefriergetrockneten Injektionspräparaten, nach Regionen, 2019–2028 (in Mio. USD)
TABELLE 32 Weltweiter Markt für gefriergetrocknete Injektionsmedikamente, nach Indikation, 2019–2028 (in Mio. USD)
TABELLE 33 Globaler Markt für Onkologie in gefriergetrockneten injizierbaren Arzneimitteln, nach Regionen, 2019–2028 (in Mio. USD)
TABELLE 34 – Globaler Markt für Autoimmunerkrankungen in gefriergetrockneten injizierbaren Arzneimitteln, nach Regionen, 2019–2028 (in Mio. USD)
TABELLE 35 – Globaler Markt für hormonelle Störungen bei gefriergetrockneten injizierbaren Arzneimitteln, nach Regionen, 2019–2028 (in Mio. USD)
TABELLE 36 – Globaler Markt für Atemwegserkrankungen in gefriergetrockneten injizierbaren Arzneimitteln, nach Regionen, 2019–2028 (in Mio. USD)
TABELLE 37 – Globaler Markt für gastrointestinale Störungen bei gefriergetrockneten injizierbaren Arzneimitteln, nach Regionen, 2019–2028 (in Mio. USD)
TABELLE 38 – Globaler Markt für dermatologische Erkrankungen in gefriergetrockneten injizierbaren Arzneimitteln, nach Regionen, 2019–2028 (in Mio. USD)
TABELLE 39 – Globaler Markt für ophthalmische Erkrankungen in gefriergetrockneten injizierbaren Arzneimitteln, nach Regionen, 2019–2028 (in Mio. USD)
TABELLE 40 – Globaler Markt für andere gefriergetrocknete injizierbare Arzneimittel, nach Regionen, 2019–2028 (in Mio. USD)
TABELLE 41 Weltweiter Markt für gefriergetrocknete injizierbare Arzneimittel, nach Verabreichungsweg, 2019–2028 (Mio. USD)
TABELLE 42 Globaler Markt für intravenöse/Infusions-injizierbare Medikamente in gefriergetrockneter Form, nach Regionen, 2019–2028 (in Mio. USD)
TABELLE 43 Globaler Markt für intramuskuläre, gefriergetrocknete Injektionsmedikamente, nach Regionen, 2019–2028 (in Mio. USD)
TABELLE 44 – Globaler Markt für andere gefriergetrocknete injizierbare Arzneimittel, nach Regionen, 2019–2028 (in Mio. USD)
TABELLE 45 Weltweiter Markt für gefriergetrocknete Injektionsmedikamente, nach Endverbraucher, 2019–2028 (Mio. USD)
TABELLE 46 Globaler Markt für gefriergetrocknete injizierbare Medikamente im Krankenhausbereich, nach Regionen, 2019–2028 (in Mio. USD)
TABELLE 47 – Globaler Markt für Kliniken im Bereich gefriergetrocknete injizierbare Medikamente, nach Regionen, 2019–2028 (in Mio. USD)
TABELLE 48 – Globaler Markt für häusliche Gesundheitspflege mit gefriergetrockneten injizierbaren Arzneimitteln, nach Regionen, 2019–2028 (in Mio. USD)
TABELLE 49 – Globaler Markt für andere gefriergetrocknete injizierbare Arzneimittel, nach Regionen, 2019–2028 (in Mio. USD)
TABELLE 50: Weltweiter Markt für gefriergetrocknete Injektionsmedikamente, nach Vertriebskanal, 2019–2028 (Mio. USD)
TABELLE 51 – Globale Direktausschreibungen auf dem Markt für gefriergetrocknete injizierbare Arzneimittel, nach Regionen, 2019–2028 (in Mio. USD)
TABELLE 52: Globale Einzelhandelsumsätze im Markt für gefriergetrocknete injizierbare Arzneimittel, nach Regionen, 2019–2028 (in Mio. USD)
TABELLE 53 – Globaler Markt für andere gefriergetrocknete injizierbare Arzneimittel, nach Regionen, 2019–2028 (in Mio. USD)
TABELLE 54: GLOBALER MARKT FÜR LYOPHILISIERTE INJEKTIONSMADINE, NACH REGION, 2019–2028 (MIO. USD)
TABELLE 55: Nordamerikanischer Markt für gefriergetrocknete injizierbare Arzneimittel, nach LAND, 2019–2028 (Mio. USD)
TABELLE 56: Nordamerikanischer Markt für gefriergetrocknete injizierbare Arzneimittel, nach Verpackung, 2019–2028 (in Mio. USD)
TABELLE 57: Nordamerikanischer Markt für gefriergetrocknete injizierbare Medikamente, nach Medikamentenklasse, 2019–2028 (in Mio. USD)
TABELLE 58 Nordamerikanischer Markt für gefriergetrocknete injizierbare Medikamente, nach Medikamentenklasse, 2019–2028 (Einheiten)
TABELLE 59: Nordamerikanischer Markt für Antiinfektiva in gefriergetrockneten Injektionsmedikamenten, nach Medikamentenklasse, 2019–2028 (in Mio. USD)
TABELLE 60: Nordamerikanischer Markt für Antibiotika in gefriergetrockneten Injektionsmedikamenten, nach Medikamentenklasse, 2019–2028 (in Mio. USD)
TABELLE 61 Nordamerikanischer Markt für Antimykotika in gefriergetrockneten Injektionspräparaten, nach Arzneimittelklasse, 2019–2028 (in Mio. USD)
TABELLE 62: Nordamerikanischer Markt für antivirale Mittel in gefriergetrockneten Injektionspräparaten, nach Arzneimittelklasse, 2019–2028 (in Mio. USD)
TABELLE 63 Nordamerikanischer Markt für Antineoplastika in gefriergetrockneten Injektionspräparaten, nach Arzneimittelklasse, 2019–2028 (in Mio. USD)
TABELLE 64: Nordamerikanischer Markt für Diuretika in gefriergetrockneten Injektionsmedikamenten, nach Medikamentenklasse, 2019–2028 (in Mio. USD)
TABELLE 65: Nordamerikanischer Markt für Protonenpumpenhemmer in gefriergetrockneten Injektionsmedikamenten, nach Medikamentenklasse, 2019–2028 (in Mio. USD)
TABELLE 66 Nordamerikanischer Markt für Anästhetika in gefriergetrockneten Injektionsmedikamenten, nach Medikamentenklasse, 2019–2028 (in Mio. USD)
TABELLE 67 Nordamerikanischer Markt für Antikoagulanzien in gefriergetrockneten Injektionsmedikamenten, nach Medikamentenklasse, 2019–2028 (in Mio. USD)
TABELLE 68: Nordamerikanischer Markt für NSAR in gefriergetrockneten Injektionsmedikamenten, nach Medikamentenklasse, 2019–2028 (in Mio. USD)
TABELLE 69: Nordamerikanischer Markt für Kortikosteroide in gefriergetrockneten Injektionsmedikamenten, nach Medikamentenklasse, 2019–2028 (in Mio. USD)
TABELLE 70: Nordamerikanischer Markt für gefriergetrocknete injizierbare Arzneimittel, nach Form, 2019–2028 (in Mio. USD)
TABELLE 71: Nordamerikanischer Markt für gefriergetrocknete injizierbare Arzneimittel, nach Indikation, 2019–2028 (in Mio. USD)
TABELLE 72: Nordamerikanischer Markt für gefriergetrocknete injizierbare Arzneimittel, nach Verabreichungsweg, 2019–2028 (in Mio. USD)
TABELLE 73 Nordamerikanischer Markt für gefriergetrocknete injizierbare Medikamente, nach Endverbraucher, 2019–2028 (in Mio. USD)
TABELLE 74: Nordamerikanischer Markt für gefriergetrocknete injizierbare Arzneimittel, nach Vertriebskanal, 2019–2028 (in Mio. USD)
TABELLE 75 – US-Markt für gefriergetrocknete injizierbare Medikamente, nach Verpackung, 2019–2028 (in Mio. USD)
TABELLE 76 – US-Markt für gefriergetrocknete injizierbare Medikamente, nach Medikamentenklasse, 2019–2028 (in Mio. USD)
TABELLE 77 US-Markt für gefriergetrocknete injizierbare Medikamente, nach Medikamentenklasse, 2019–2028 (Einheiten)
TABELLE 78 – US-Markt für Antiinfektiva in gefriergetrockneten Injektionspräparaten, nach Arzneimittelklasse, 2019–2028 (in Mio. USD)
TABELLE 79 – US-Markt für Antibiotika in gefriergetrockneten Injektionspräparaten, nach Arzneimittelklasse, 2019–2028 (in Mio. USD)
TABELLE 80 US-Markt für Antimykotika in gefriergetrockneten Injektionspräparaten, nach Arzneimittelklasse, 2019–2028 (in Mio. USD)
TABELLE 81 US-Markt für antivirale Mittel in gefriergetrockneten Injektionspräparaten, nach Arzneimittelklasse, 2019–2028 (in Mio. USD)
TABELLE 82 US-Markt für gefriergetrocknete injizierbare Antineoplastika, nach Arzneimittelklasse, 2019–2028 (in Mio. USD)
TABELLE 83 US-Markt für Diuretika in gefriergetrockneten Injektionsmedikamenten, nach Medikamentenklasse, 2019–2028 (in Mio. USD)
TABELLE 84 US-Markt für Protonenpumpenhemmer in gefriergetrockneten Injektionsmedikamenten, nach Medikamentenklasse, 2019–2028 (in Mio. USD)
TABELLE 85 US-Markt für Anästhetika in gefriergetrockneten Injektionspräparaten, nach Arzneimittelklasse, 2019–2028 (in Mio. USD)
TABELLE 86 US-Markt für Antikoagulanzien in gefriergetrockneten Injektionsmedikamenten, nach Medikamentenklasse, 2019–2028 (in Mio. USD)
TABELLE 87 US-Markt für NSAR in gefriergetrockneten Injektionsmedikamenten, nach Medikamentenklasse, 2019–2028 (in Mio. USD)
TABELLE 88 US-Markt für Kortikosteroide in gefriergetrockneten Injektionspräparaten, nach Arzneimittelklasse, 2019–2028 (in Mio. USD)
TABELLE 89 US-Markt für gefriergetrocknete injizierbare Medikamente, nach Form, 2019–2028 (in Mio. USD)
TABELLE 90 US-Markt für gefriergetrocknete injizierbare Medikamente, nach Indikation, 2019–2028 (in Mio. USD)
TABELLE 91 US-Markt für gefriergetrocknete injizierbare Medikamente, nach Verabreichungsweg, 2019–2028 (in Mio. USD)
TABELLE 92 US-Markt für gefriergetrocknete injizierbare Medikamente, nach Endverbraucher, 2019–2028 (in Mio. USD)
TABELLE 93 US-Markt für gefriergetrocknete injizierbare Medikamente, nach Vertriebskanal, 2019–2028 (in Mio. USD)
TABELLE 94 – Kanadischer Markt für gefriergetrocknete injizierbare Medikamente, nach Verpackung, 2019–2028 (in Mio. USD)
TABELLE 95 KANADISCHER Markt für gefriergetrocknete injizierbare Medikamente, nach Medikamentenklasse, 2019–2028 (in Mio. USD)
TABELLE 96 KANADISCHER Markt für gefriergetrocknete injizierbare Medikamente, nach Medikamentenklasse, 2019–2028 (Einheiten)
TABELLE 97 KANADISCHER Markt für Antiinfektiva in gefriergetrockneten Injektionsmedikamenten, nach Medikamentenklasse, 2019–2028 (in Mio. USD)
TABELLE 98 KANADA – Markt für Antibiotika in gefriergetrockneten Injektionsmedikamenten, nach Medikamentenklasse, 2019–2028 (in Mio. USD)
TABELLE 99 KANADISCHER Markt für Antimykotika in gefriergetrockneten Injektionspräparaten, nach Arzneimittelklasse, 2019–2028 (in Mio. USD)
TABELLE 100 KANADISCHER Markt für antivirale Mittel in gefriergetrockneten Injektionsmedikamenten, nach Medikamentenklasse, 2019–2028 (in Millionen USD)
TABELLE 101 KANADISCHER Markt für Antineoplastika in gefriergetrockneten Injektionspräparaten, nach Arzneimittelklasse, 2019–2028 (in Mio. USD)
TABELLE 102 KANADA – Markt für Diuretika in gefriergetrockneten Injektionsmedikamenten, nach Medikamentenklasse, 2019–2028 (in Mio. USD)
TABELLE 103 KANADA – Markt für Protonenpumpenhemmer in gefriergetrockneten injizierbaren Arzneimitteln, nach Arzneimittelklasse, 2019–2028 (in Mio. USD)
TABELLE 104 KANADA – Markt für Anästhetika in gefriergetrockneten Injektionsmedikamenten, nach Medikamentenklasse, 2019–2028 (in Mio. USD)
TABELLE 105 KANADISCHER Markt für Antikoagulanzien in gefriergetrockneten Injektionsmedikamenten, nach Medikamentenklasse, 2019–2028 (in Mio. USD)
TABELLE 106 KANADISCHER Markt für NSAR in gefriergetrockneten Injektionsmedikamenten, nach Medikamentenklasse, 2019–2028 (in Mio. USD)
TABELLE 107 KANADA: Markt für Kortikosteroide in gefriergetrockneten Injektionsmedikamenten, nach Medikamentenklasse, 2019–2028 (in Mio. USD)
TABELLE 108 KANADISCHER Markt für gefriergetrocknete injizierbare Medikamente, nach Form, 2019–2028 (in Mio. USD)
TABELLE 109 KANADISCHER Markt für gefriergetrocknete injizierbare Arzneimittel, nach Indikation, 2019–2028 (in Mio. USD)
TABELLE 110 KANADISCHER Markt für gefriergetrocknete injizierbare Arzneimittel, nach Verabreichungsweg, 2019–2028 (in Mio. USD)
TABELLE 111 KANADISCHER Markt für gefriergetrocknete injizierbare Medikamente, nach Endverbraucher, 2019–2028 (in Mio. USD)
TABELLE 112 KANADISCHER Markt für gefriergetrocknete injizierbare Medikamente, nach Vertriebskanal, 2019–2028 (in Mio. USD)
TABELLE 113 Mexikanischer Markt für gefriergetrocknete injizierbare Medikamente, nach Verpackung, 2019–2028 (in Mio. USD)
TABELLE 114 MEXIKO: Markt für gefriergetrocknete injizierbare Medikamente, nach Medikamentenklasse, 2019–2028 (in Mio. USD)
TABELLE 115 MEXIKO – Markt für gefriergetrocknete injizierbare Medikamente, nach Medikamentenklasse, 2019–2028 (Einheiten)
TABELLE 116 MEXIKO – Markt für Antiinfektiva in gefriergetrockneten Injektionsmedikamenten, nach Medikamentenklasse, 2019–2028 (in Mio. USD)
TABELLE 117 MEXIKO – Markt für Antibiotika in gefriergetrockneten Injektionsmedikamenten, nach Medikamentenklasse, 2019–2028 (in Mio. USD)
TABELLE 118 MEXIKO – Markt für Antimykotika in gefriergetrockneten Injektionspräparaten, nach Arzneimittelklasse, 2019–2028 (in Mio. USD)
TABELLE 119 MEXIKO – Markt für antivirale Mittel in gefriergetrockneten Injektionsmedikamenten, nach Medikamentenklasse, 2019–2028 (in Mio. USD)
TABELLE 120 MEXIKO – Markt für Antineoplastika in gefriergetrockneten Injektionspräparaten, nach Arzneimittelklasse, 2019–2028 (in Mio. USD)
TABELLE 121 MEXIKO – Markt für Diuretika in gefriergetrockneten Injektionsmedikamenten, nach Medikamentenklasse, 2019–2028 (in Mio. USD)
TABELLE 122 MEXIKO – Markt für Protonenpumpenhemmer in gefriergetrockneten injizierbaren Arzneimitteln, nach Arzneimittelklasse, 2019–2028 (in Mio. USD)
TABELLE 123 MEXIKO – Markt für Anästhetika in gefriergetrockneten Injektionsmedikamenten, nach Medikamentenklasse, 2019–2028 (in Mio. USD)
TABELLE 124 MEXIKO – Markt für Antikoagulanzien in gefriergetrockneten Injektionsmedikamenten, nach Medikamentenklasse, 2019–2028 (in Mio. USD)
TABELLE 125 MEXIKO – Markt für NSAR in gefriergetrockneten Injektionsmedikamenten, nach Medikamentenklasse, 2019–2028 (in Millionen USD)
TABELLE 126 MEXIKO – Markt für Kortikosteroide in gefriergetrockneten Injektionsmedikamenten, nach Medikamentenklasse, 2019–2028 (in Mio. USD)
TABELLE 127 MEXIKO – Markt für gefriergetrocknete injizierbare Medikamente, nach Form, 2019–2028 (in Mio. USD)
TABELLE 128 MEXIKO – Markt für lyophilisierte injizierbare Medikamente nach Indikation, 2019–2028 (in Mio. USD)
TABELLE 129 MEXIKO – Markt für gefriergetrocknete injizierbare Arzneimittel, nach Verabreichungsweg, 2019–2028 (in Mio. USD)
TABELLE 130 MEXIKO – Markt für gefriergetrocknete injizierbare Medikamente, nach Endverbraucher, 2019–2028 (in Mio. USD)
TABELLE 131 MEXIKO – Markt für gefriergetrocknete injizierbare Medikamente, nach Vertriebskanal, 2019–2028 (in Mio. USD)
TABELLE 132: Europäischer Markt für lyophilisierte, injizierbare Arzneimittel, nach Ländern, 2019–2028 (in Mio. USD)
TABELLE 133 Europäischer Markt für gefriergetrocknete injizierbare Arzneimittel, nach Verpackung, 2019–2028 (in Mio. USD)
TABELLE 134 – Europäischer Markt für gefriergetrocknete injizierbare Arzneimittel, nach Arzneimittelklasse, 2019–2028 (in Mio. USD)
TABELLE 135 – Europäischer Markt für gefriergetrocknete injizierbare Arzneimittel, nach Arzneimittelklasse, 2019–2028 (Einheiten)
TABELLE 136 – Europäischer Markt für Antiinfektiva in gefriergetrockneten Injektionspräparaten, nach Arzneimittelklasse, 2019–2028 (in Mio. USD)
TABELLE 137 – Europäischer Markt für Antibiotika in gefriergetrockneten Injektionsmedikamenten, nach Medikamentenklasse, 2019–2028 (in Mio. USD)
TABELLE 138 Europäischer Markt für Antimykotika in gefriergetrockneten Injektionspräparaten, nach Arzneimittelklasse, 2019–2028 (in Mio. USD)
TABELLE 139 Europäischer Markt für antivirale Mittel in gefriergetrockneten Injektionspräparaten, nach Arzneimittelklasse, 2019–2028 (in Mio. USD)
TABELLE 140 Europäischer Markt für Antineoplastika in gefriergetrockneten Injektionspräparaten, nach Arzneimittelklasse, 2019–2028 (in Mio. USD)
TABELLE 141 – Europäischer Markt für Diuretika in gefriergetrockneten Injektionsmedikamenten, nach Medikamentenklasse, 2019–2028 (in Mio. USD)
TABELLE 142 – Europäischer Markt für Protonenpumpenhemmer in gefriergetrockneten Injektionsmedikamenten, nach Medikamentenklasse, 2019–2028 (in Mio. USD)
TABELLE 143 Europäischer Markt für Anästhetika in gefriergetrockneten Injektionspräparaten, nach Arzneimittelklasse, 2019–2028 (in Mio. USD)
TABELLE 144 Europäischer Markt für Antikoagulanzien in gefriergetrockneten Injektionsmedikamenten, nach Medikamentenklasse, 2019–2028 (in Mio. USD)
TABELLE 145 – Europäischer Markt für NSAR in gefriergetrockneten Injektionsmedikamenten, nach Medikamentenklasse, 2019–2028 (in Mio. USD)
TABELLE 146 – Europäischer Markt für Kortikosteroide in gefriergetrockneten Injektionsmedikamenten, nach Medikamentenklasse, 2019–2028 (in Mio. USD)
TABELLE 147 Europäischer Markt für gefriergetrocknete injizierbare Arzneimittel, nach Form, 2019–2028 (in Mio. USD)
TABELLE 148 Europäischer Markt für gefriergetrocknete injizierbare Arzneimittel, nach Indikation, 2019–2028 (in Mio. USD)
TABELLE 149 Europäischer Markt für gefriergetrocknete injizierbare Arzneimittel, nach Verabreichungsweg, 2019–2028 (in Mio. USD)
TABELLE 150: Europäischer Markt für gefriergetrocknete injizierbare Arzneimittel, nach Endverbraucher, 2019–2028 (in Mio. USD)
TABELLE 151: Europäischer Markt für gefriergetrocknete injizierbare Arzneimittel, nach Vertriebskanal, 2019–2028 (in Mio. USD)
TABELLE 152 Deutscher Markt für gefriergetrocknete injizierbare Medikamente, nach Verpackung, 2019–2028 (in Mio. USD)
TABELLE 153 Deutscher Markt für gefriergetrocknete injizierbare Medikamente, nach Medikamentenklasse, 2019–2028 (in Mio. USD)
TABELLE 154 Deutscher Markt für gefriergetrocknete injizierbare Medikamente, nach Medikamentenklasse, 2019–2028 (Einheiten)
TABELLE 155 Deutscher Markt für Antiinfektiva in gefriergetrockneten Injektionsmedikamenten, nach Medikamentenklasse, 2019–2028 (in Mio. USD)
TABELLE 156 Deutscher Markt für Antibiotika in gefriergetrockneten Injektionsmedikamenten, nach Medikamentenklasse, 2019–2028 (in Mio. USD)
TABELLE 157 Deutscher Markt für Antimykotika in gefriergetrockneten Injektionspräparaten, nach Arzneimittelklasse, 2019–2028 (in Mio. USD)
TABELLE 158 Deutscher Markt für antivirale Mittel in gefriergetrockneten Injektionspräparaten, nach Arzneimittelklasse, 2019–2028 (in Mio. USD)
TABELLE 159 Deutscher Markt für Antineoplastika in gefriergetrockneten Injektionspräparaten, nach Arzneimittelklasse, 2019–2028 (in Mio. USD)
TABELLE 160 Deutscher Markt für Diuretika in gefriergetrockneten Injektionsmedikamenten, nach Medikamentenklasse, 2019–2028 (in Mio. USD)
TABELLE 161 Deutscher Markt für Protonenpumpenhemmer in gefriergetrockneten Injektionsmedikamenten, nach Medikamentenklasse, 2019–2028 (in Mio. USD)
TABELLE 162 Deutscher Markt für Anästhetika in gefriergetrockneten Injektionspräparaten, nach Arzneimittelklasse, 2019–2028 (in Mio. USD)
TABELLE 163 Deutscher Markt für Antikoagulanzien in gefriergetrockneten Injektionsmedikamenten, nach Medikamentenklasse, 2019–2028 (in Mio. USD)
TABELLE 164 Deutscher Markt für NSAR in gefriergetrockneten Injektionspräparaten, nach Arzneimittelklasse, 2019–2028 (in Mio. USD)
TABELLE 165 Deutscher Markt für Kortikosteroide in gefriergetrockneten Injektionspräparaten, nach Arzneimittelklasse, 2019–2028 (in Mio. USD)
TABELLE 166 Deutscher Markt für gefriergetrocknete injizierbare Medikamente, nach Form, 2019–2028 (in Mio. USD)
TABELLE 167 Deutscher Markt für gefriergetrocknete injizierbare Arzneimittel, nach Indikation, 2019–2028 (in Mio. USD)
TABELLE 168 Deutscher Markt für gefriergetrocknete injizierbare Arzneimittel, nach Verabreichungsweg, 2019–2028 (in Mio. USD)
TABELLE 169 Deutscher Markt für gefriergetrocknete injizierbare Medikamente, nach Endverbraucher, 2019–2028 (in Mio. USD)
TABELLE 170 Deutscher Markt für gefriergetrocknete injizierbare Medikamente, nach Vertriebskanal, 2019–2028 (in Mio. USD)
TABELLE 171: Französischer Markt für gefriergetrocknete injizierbare Arzneimittel, nach Verpackung, 2019–2028 (in Mio. USD)
TABELLE 172: Französischer Markt für gefriergetrocknete injizierbare Medikamente, nach Medikamentenklasse, 2019–2028 (in Mio. USD)
TABELLE 173: Französischer Markt für gefriergetrocknete injizierbare Medikamente, nach Medikamentenklasse, 2019–2028 (Einheiten)
TABELLE 174: Französischer Markt für Antiinfektiva in gefriergetrockneten Injektionsmedikamenten, nach Medikamentenklasse, 2019–2028 (in Mio. USD)
TABELLE 175: Französischer Markt für Antibiotika in gefriergetrockneten Injektionsmedikamenten, nach Medikamentenklasse, 2019–2028 (in Mio. USD)
TABELLE 176 Französischer Markt für Antimykotika in gefriergetrockneten Injektionspräparaten, nach Arzneimittelklasse, 2019–2028 (in Mio. USD)
TABELLE 177 Französischer Markt für antivirale Mittel in gefriergetrockneten Injektionspräparaten, nach Arzneimittelklasse, 2019–2028 (in Mio. USD)
TABELLE 178 Französischer Markt für Antineoplastika in gefriergetrockneten Injektionspräparaten, nach Arzneimittelklasse, 2019–2028 (in Mio. USD)
TABELLE 179: Französischer Markt für Diuretika in gefriergetrockneten Injektionsmedikamenten, nach Medikamentenklasse, 2019–2028 (in Mio. USD)
TABELLE 180 Französischer Markt für Protonenpumpenhemmer in gefriergetrockneten injizierbaren Arzneimitteln, nach Arzneimittelklasse, 2019–2028 (in Mio. USD)
TABELLE 181: Markt für Anästhetika in gefriergetrockneten Injektionspräparaten in Frankreich, nach Arzneimittelklasse, 2019–2028 (in Mio. USD)
TABELLE 182 Französischer Markt für Antikoagulanzien in gefriergetrockneten Injektionsmedikamenten, nach Medikamentenklasse, 2019–2028 (in Mio. USD)
TABELLE 183: Französischer Markt für NSAR in gefriergetrockneten Injektionsmedikamenten, nach Medikamentenklasse, 2019–2028 (in Mio. USD)
TABELLE 184: Markt für Kortikosteroide in gefriergetrockneten Injektionspräparaten in Frankreich, nach Arzneimittelklasse, 2019–2028 (in Mio. USD)
TABELLE 185: Französischer Markt für gefriergetrocknete injizierbare Arzneimittel, nach Form, 2019–2028 (in Mio. USD)
TABELLE 186: Französischer Markt für gefriergetrocknete injizierbare Arzneimittel, nach Indikation, 2019–2028 (in Mio. USD)
TABELLE 187 Französischer Markt für gefriergetrocknete injizierbare Arzneimittel, nach Verabreichungsweg, 2019–2028 (in Mio. USD)
TABELLE 188 Markt für gefriergetrocknete injizierbare Medikamente in Frankreich, nach Endverbraucher, 2019–2028 (in Mio. USD)
TABELLE 189 Markt für gefriergetrocknete injizierbare Arzneimittel in Frankreich, nach Vertriebskanal, 2019–2028 (in Mio. USD)
TABELLE 190 Britischer Markt für gefriergetrocknete injizierbare Medikamente, nach Verpackung, 2019–2028 (in Mio. USD)
TABELLE 191 Britischer Markt für gefriergetrocknete injizierbare Medikamente, nach Medikamentenklasse, 2019–2028 (in Mio. USD)
TABELLE 192 Britischer Markt für gefriergetrocknete injizierbare Medikamente, nach Medikamentenklasse, 2019–2028 (Einheiten)
TABELLE 193 Britischer Markt für Antiinfektiva in gefriergetrockneten Injektionsmedikamenten, nach Medikamentenklasse, 2019–2028 (in Mio. USD)
TABELLE 194 – Britischer Markt für Antibiotika in gefriergetrockneten Injektionsmedikamenten, nach Medikamentenklasse, 2019–2028 (in Mio. USD)
TABELLE 195 Britischer Markt für Antimykotika in gefriergetrockneten Injektionspräparaten, nach Arzneimittelklasse, 2019–2028 (in Mio. USD)
TABELLE 196 Britischer Markt für antivirale Mittel in gefriergetrockneten Injektionspräparaten, nach Arzneimittelklasse, 2019–2028 (in Mio. USD)
TABELLE 197 Britischer Markt für Antineoplastika in gefriergetrockneten Injektionspräparaten, nach Arzneimittelklasse, 2019–2028 (in Mio. USD)
TABELLE 198 – Britischer Markt für Diuretika in gefriergetrockneten Injektionsmedikamenten, nach Medikamentenklasse, 2019–2028 (in Mio. USD)
TABELLE 199 – Britischer Markt für Protonenpumpenhemmer in gefriergetrockneten Injektionsmedikamenten, nach Medikamentenklasse, 2019–2028 (in Mio. USD)
TABELLE 200 Britischer Markt für Anästhetika in gefriergetrockneten Injektionsmedikamenten, nach Medikamentenklasse, 2019–2028 (in Mio. USD)
TABELLE 201 Britischer Markt für Antikoagulanzien in gefriergetrockneten Injektionsmedikamenten, nach Medikamentenklasse, 2019–2028 (in Mio. USD)
TABELLE 202 Britischer Markt für NSAR in gefriergetrockneten Injektionsmedikamenten, nach Medikamentenklasse, 2019–2028 (in Mio. USD)
TABELLE 203 Britischer Markt für Kortikosteroide in gefriergetrockneten Injektionsmedikamenten, nach Medikamentenklasse, 2019–2028 (in Mio. USD)
TABELLE 204 Britischer Markt für gefriergetrocknete injizierbare Medikamente, nach Form, 2019–2028 (in Mio. USD)
TABELLE 205 Britischer Markt für gefriergetrocknete injizierbare Arzneimittel, nach Indikation, 2019–2028 (in Mio. USD)
TABELLE 206 Britischer Markt für gefriergetrocknete injizierbare Arzneimittel, nach Verabreichungsweg, 2019–2028 (in Mio. USD)
TABELLE 207 Britischer Markt für gefriergetrocknete injizierbare Medikamente, nach Endverbraucher, 2019–2028 (in Mio. USD)
TABELLE 208 Britischer Markt für gefriergetrocknete injizierbare Medikamente, nach Vertriebskanal, 2019–2028 (in Mio. USD)
TABELLE 209 ITALIEN – Markt für gefriergetrocknete injizierbare Medikamente, nach Verpackung, 2019–2028 (in Mio. USD)
TABELLE 210 ITALIEN – Markt für gefriergetrocknete injizierbare Medikamente, nach Medikamentenklasse, 2019–2028 (in Mio. USD)
TABELLE 211 ITALIEN – Markt für gefriergetrocknete injizierbare Medikamente, nach Medikamentenklasse, 2019–2028 (Einheiten)
TABELLE 212 ITALIEN – Markt für Antiinfektiva in gefriergetrockneten Injektionsmedikamenten, nach Medikamentenklasse, 2019–2028 (in Mio. USD)
TABELLE 213 ITALIEN – Markt für Antibiotika in gefriergetrockneten Injektionsmedikamenten, nach Medikamentenklasse, 2019–2028 (in Mio. USD)
TABELLE 214 ITALIEN – Markt für Antimykotika in gefriergetrockneten Injektionspräparaten, nach Arzneimittelklasse, 2019–2028 (in Mio. USD)
TABELLE 215 ITALIEN – Markt für antivirale Mittel in gefriergetrockneten Injektionsmedikamenten, nach Medikamentenklasse, 2019–2028 (in Mio. USD)
TABELLE 216 ITALIEN – Markt für Antineoplastika in gefriergetrockneten Injektionspräparaten, nach Arzneimittelklasse, 2019–2028 (in Mio. USD)
TABELLE 217 ITALIEN – Markt für Diuretika in gefriergetrockneten Injektionsmedikamenten, nach Medikamentenklasse, 2019–2028 (in Mio. USD)
TABELLE 218 ITALIEN – Markt für Protonenpumpenhemmer in gefriergetrockneten injizierbaren Arzneimitteln, nach Arzneimittelklasse, 2019–2028 (in Mio. USD)
TABELLE 219 ITALIEN – Markt für Anästhetika in gefriergetrockneten Injektionsmedikamenten, nach Medikamentenklasse, 2019–2028 (in Mio. USD)
TABELLE 220 ITALIEN – Markt für Antikoagulanzien in gefriergetrockneten Injektionsmedikamenten, nach Medikamentenklasse, 2019–2028 (in Mio. USD)
TABELLE 221 ITALIEN – Markt für NSAR im Bereich gefriergetrockneter injizierbarer Medikamente, nach Medikamentenklasse, 2019–2028 (in Millionen USD)
TABELLE 222 ITALIEN – Markt für Kortikosteroide im Bereich gefriergetrockneter injizierbarer Medikamente, nach Medikamentenklasse, 2019–2028 (in Mio. USD)
TABELLE 223 ITALIEN – Markt für gefriergetrocknete injizierbare Medikamente, nach Form, 2019–2028 (in Mio. USD)
TABELLE 224 ITALIEN – Markt für gefriergetrocknete injizierbare Arzneimittel, nach Indikation, 2019–2028 (in Mio. USD)
TABELLE 225 ITALIEN – Markt für gefriergetrocknete injizierbare Arzneimittel, nach Verabreichungsweg, 2019–2028 (in Mio. USD)
TABELLE 226 ITALIEN – Markt für gefriergetrocknete injizierbare Medikamente, nach Endverbraucher, 2019–2028 (in Mio. USD)
TABELLE 227 ITALIEN – Markt für gefriergetrocknete injizierbare Arzneimittel, nach Vertriebskanal, 2019–2028 (in Mio. USD)
TABELLE 228 SPANIEN: Markt für gefriergetrocknete injizierbare Arzneimittel, nach Verpackung, 2019–2028 (in Mio. USD)
TABELLE 229 SPANIEN: Markt für gefriergetrocknete injizierbare Medikamente, nach Medikamentenklasse, 2019–2028 (in Mio. USD)
TABELLE 230 SPANIEN – Markt für gefriergetrocknete injizierbare Medikamente, nach Medikamentenklasse, 2019–2028 (Einheiten)
TABELLE 231 SPANIEN – Markt für Antiinfektiva in gefriergetrockneten Injektionsmedikamenten, nach Medikamentenklasse, 2019–2028 (in Mio. USD)
TABELLE 232 SPANIEN – Markt für Antibiotika in gefriergetrockneten Injektionsmedikamenten, nach Medikamentenklasse, 2019–2028 (in Mio. USD)
TABELLE 233 SPANIEN – Markt für Antimykotika in gefriergetrockneten Injektionspräparaten, nach Arzneimittelklasse, 2019–2028 (in Mio. USD)
TABELLE 234 SPANIEN – Markt für antivirale Mittel in gefriergetrockneten Injektionsmedikamenten, nach Medikamentenklasse, 2019–2028 (in Mio. USD)
TABELLE 235 SPANIEN – Markt für Antineoplastika in gefriergetrockneten Injektionspräparaten, nach Arzneimittelklasse, 2019–2028 (in Mio. USD)
TABELLE 236 SPANIEN – Markt für Diuretika in gefriergetrockneten Injektionsmedikamenten, nach Medikamentenklasse, 2019–2028 (in Mio. USD)
TABELLE 237 SPANIEN – Markt für Protonenpumpenhemmer in gefriergetrockneten injizierbaren Arzneimitteln, nach Arzneimittelklasse, 2019–2028 (in Mio. USD)
TABELLE 238 SPANIEN – Markt für Anästhetika in gefriergetrockneten Injektionsmedikamenten, nach Medikamentenklasse, 2019–2028 (in Mio. USD)
TABELLE 239 SPANIEN – Markt für Antikoagulanzien in gefriergetrockneten injizierbaren Arzneimitteln, nach Arzneimittelklasse, 2019–2028 (in Mio. USD)
TABELLE 240 SPANIEN – Markt für NSAR im gefriergetrockneten injizierbaren Arzneimittel, nach Arzneimittelklasse, 2019–2028 (in Millionen USD)
TABELLE 241 SPANIEN – Markt für Kortikosteroide in gefriergetrockneten Injektionsmedikamenten, nach Medikamentenklasse, 2019–2028 (in Millionen USD)
TABELLE 242 SPANIEN: Markt für gefriergetrocknete injizierbare Medikamente, nach Form, 2019–2028 (in Mio. USD)
TABELLE 243 SPANIEN – Markt für gefriergetrocknete injizierbare Arzneimittel, nach Indikation, 2019–2028 (in Mio. USD)
TABELLE 244 SPANIEN: Markt für gefriergetrocknete injizierbare Arzneimittel, nach Verabreichungsweg, 2019–2028 (in Mio. USD)
TABELLE 245 SPANIEN – Markt für gefriergetrocknete injizierbare Medikamente, nach Endverbraucher, 2019–2028 (in Mio. USD)
TABELLE 246 SPANIEN – Markt für gefriergetrocknete injizierbare Medikamente, nach Vertriebskanal, 2019–2028 (in Mio. USD)
TABELLE 247 NIEDERLANDE – Markt für gefriergetrocknete injizierbare Arzneimittel, nach Verpackung, 2019–2028 (in Mio. USD)
TABELLE 248 NIEDERLANDE – Markt für gefriergetrocknete injizierbare Medikamente, nach Medikamentenklasse, 2019–2028 (in Mio. USD)
TABELLE 249 NIEDERLANDE – Markt für gefriergetrocknete injizierbare Arzneimittel, nach Arzneimittelklasse, 2019–2028 (Einheiten)
TABELLE 250 NIEDERLANDE – Markt für Antiinfektiva im gefriergetrockneten injizierbaren Arzneimitteln, nach Arzneimittelklasse, 2019–2028 (in Mio. USD)
TABELLE 251 NIEDERLANDE – Markt für Antibiotika in gefriergetrockneten injizierbaren Arzneimitteln, nach Arzneimittelklasse, 2019–2028 (in Mio. USD)
TABELLE 252 NIEDERLANDE – Markt für Antimykotika in gefriergetrockneten Injektionsmedikamenten, nach Medikamentenklasse, 2019–2028 (in Mio. USD)
TABELLE 253 NIEDERLANDE – Markt für antivirale Mittel in gefriergetrockneten Injektionsmedikamenten, nach Medikamentenklasse, 2019–2028 (in Mio. USD)
TABELLE 254 NIEDERLANDE – Markt für Antineoplastika in gefriergetrockneten Injektionspräparaten, nach Arzneimittelklasse, 2019–2028 (in Mio. USD)
TABELLE 255 NIEDERLANDE – Markt für Diuretika in gefriergetrockneten Injektionsmedikamenten, nach Medikamentenklasse, 2019–2028 (in Mio. USD)
TABELLE 256 NIEDERLANDE – Markt für Protonenpumpenhemmer in gefriergetrockneten injizierbaren Arzneimitteln, nach Arzneimittelklasse, 2019–2028 (in Mio. USD)
TABELLE 257 NIEDERLANDE – Markt für Anästhetika in gefriergetrockneten Injektionsmedikamenten, nach Medikamentenklasse, 2019–2028 (in Mio. USD)
TABELLE 258 NIEDERLANDE – Markt für Antikoagulanzien in gefriergetrockneten Injektionsmedikamenten, nach Medikamentenklasse, 2019–2028 (in Mio. USD)
TABELLE 259 NIEDERLANDE – Markt für NSAR im Bereich gefriergetrockneter Injektionsmedikamente, nach Medikamentenklasse, 2019–2028 (in Mio. USD)
TABELLE 260 NIEDERLANDE – Markt für Kortikosteroide im gefriergetrockneten injizierbaren Arzneimittel, nach Arzneimittelklasse, 2019–2028 (in Mio. USD)
TABELLE 261 NIEDERLANDE – Markt für gefriergetrocknete injizierbare Arzneimittel, nach Form, 2019–2028 (in Mio. USD)
TABELLE 262 NIEDERLANDE – Markt für gefriergetrocknete injizierbare Arzneimittel, nach Indikation, 2019–2028 (in Mio. USD)
TABELLE 263 NIEDERLANDE – Markt für gefriergetrocknete injizierbare Arzneimittel, nach Verabreichungsweg, 2019–2028 (in Mio. USD)
TABELLE 264 NIEDERLANDE – Markt für gefriergetrocknete injizierbare Medikamente, nach Endverbraucher, 2019–2028 (in Mio. USD)
TABELLE 265 NIEDERLANDE – Markt für gefriergetrocknete injizierbare Arzneimittel, nach Vertriebskanal, 2019–2028 (in Mio. USD)
TABELLE 266 RUSSLAND – Markt für gefriergetrocknete injizierbare Medikamente, nach Verpackung, 2019–2028 (in Mio. USD)
TABELLE 267 RUSSLAND – Markt für gefriergetrocknete injizierbare Medikamente, nach Medikamentenklasse, 2019–2028 (in Mio. USD)
TABELLE 268 RUSSLAND – Markt für gefriergetrocknete injizierbare Medikamente, nach Medikamentenklasse, 2019–2028 (Einheiten)
TABELLE 269 RUSSLAND – Markt für Antiinfektiva in gefriergetrockneten Injektionsmedikamenten, nach Medikamentenklasse, 2019–2028 (in Mio. USD)
TABELLE 270 RUSSLAND – Markt für Antibiotika in gefriergetrockneten Injektionsmedikamenten, nach Medikamentenklasse, 2019–2028 (in Millionen USD)
TABELLE 271 RUSSLAND – Markt für Antimykotika in gefriergetrockneten Injektionspräparaten, nach Arzneimittelklasse, 2019–2028 (in Mio. USD)
TABELLE 272 RUSSLAND – Markt für antivirale Mittel in gefriergetrockneten Injektionsmedikamenten, nach Medikamentenklasse, 2019–2028 (in Mio. USD)
TABELLE 273 RUSSLAND – Markt für Antineoplastika in gefriergetrockneten Injektionspräparaten, nach Arzneimittelklasse, 2019–2028 (in Mio. USD)
TABELLE 274 RUSSLAND: Markt für Diuretika in gefriergetrockneten Injektionsmedikamenten, nach Medikamentenklasse, 2019–2028 (in Mio. USD)
TABELLE 275 RUSSLAND – Markt für Protonenpumpenhemmer in gefriergetrockneten injizierbaren Arzneimitteln, nach Arzneimittelklasse, 2019–2028 (in Mio. USD)
TABELLE 276 RUSSLAND – Markt für Anästhetika in gefriergetrockneten Injektionsmedikamenten, nach Medikamentenklasse, 2019–2028 (in Mio. USD)
TABELLE 277 RUSSLAND – Markt für Antikoagulanzien in gefriergetrockneten injizierbaren Arzneimitteln, nach Arzneimittelklasse, 2019–2028 (in Mio. USD)
TABELLE 278 RUSSLAND – Markt für NSAR in gefriergetrockneten Injektionsmedikamenten, nach Medikamentenklasse, 2019–2028 (in Millionen USD)
TABELLE 279 RUSSLAND – Markt für Kortikosteroide in gefriergetrockneten injizierbaren Arzneimitteln, nach Arzneimittelklasse, 2019–2028 (in Mio. USD)
TABELLE 280 RUSSLAND – Markt für gefriergetrocknete injizierbare Medikamente, nach Form, 2019–2028 (in Mio. USD)
TABELLE 281 RUSSLAND – Markt für gefriergetrocknete injizierbare Arzneimittel, nach Indikation, 2019–2028 (in Mio. USD)
TABELLE 282 RUSSLAND – Markt für gefriergetrocknete injizierbare Arzneimittel, nach Verabreichungsweg, 2019–2028 (in Mio. USD)
TABELLE 283 RUSSLAND – Markt für gefriergetrocknete injizierbare Medikamente, nach Endverbraucher, 2019–2028 (in Mio. USD)
TABELLE 284 RUSSLAND – Markt für gefriergetrocknete injizierbare Medikamente, nach Vertriebskanal, 2019–2028 (in Mio. USD)
TABELLE 285 SCHWEIZ Markt für gefriergetrocknete injizierbare Arzneimittel, nach Verpackung, 2019–2028 (in Mio. USD)
TABELLE 286 SCHWEIZ – Markt für gefriergetrocknete injizierbare Medikamente, nach Medikamentenklasse, 2019–2028 (in Mio. USD)
TABELLE 287 SCHWEIZ – Markt für gefriergetrocknete injizierbare Medikamente, nach Medikamentenklasse, 2019–2028 (Einheiten)
TABELLE 288 SCHWEIZ – Markt für Antiinfektiva in gefriergetrockneten Injektionsmedikamenten, nach Medikamentenklasse, 2019–2028 (in Mio. USD)
TABELLE 289 SCHWEIZ – Markt für Antibiotika in gefriergetrockneten Injektionsmedikamenten, nach Medikamentenklasse, 2019–2028 (in Millionen USD)
TABELLE 290 SCHWEIZ – Markt für Antimykotika in gefriergetrockneten Injektionspräparaten, nach Arzneimittelklasse, 2019–2028 (in Mio. USD)
TABELLE 291 SCHWEIZ – Markt für antivirale Mittel in gefriergetrockneten Injektionspräparaten, nach Arzneimittelklasse, 2019–2028 (in Mio. USD)
TABELLE 292 SCHWEIZ – Markt für Antineoplastika in gefriergetrockneten Injektionspräparaten, nach Arzneimittelklasse, 2019–2028 (in Mio. USD)
TABELLE 293 SCHWEIZ: Markt für Diuretika in gefriergetrockneten Injektionsmedikamenten, nach Medikamentenklasse, 2019–2028 (in Mio. USD)
TABELLE 294 SCHWEIZ – Markt für Protonenpumpenhemmer in gefriergetrockneten injizierbaren Arzneimitteln, nach Arzneimittelklasse, 2019–2028 (in Millionen USD)
TABELLE 295 SCHWEIZ – Markt für Anästhetika in gefriergetrockneten Injektionsmedikamenten, nach Medikamentenklasse, 2019–2028 (in Mio. USD)
TABELLE 296 SCHWEIZ – Markt für Antikoagulanzien in gefriergetrockneten Injektionsmedikamenten, nach Medikamentenklasse, 2019–2028 (in Mio. USD)
TABELLE 297 SCHWEIZ – Markt für NSAR im Bereich gefriergetrockneter Injektionsmedikamente, nach Medikamentenklasse, 2019–2028 (in Millionen USD)
TABELLE 298 SCHWEIZ – Markt für Kortikosteroide in gefriergetrockneten Injektionsmedikamenten, nach Medikamentenklasse, 2019–2028 (in Millionen USD)
TABELLE 299 SCHWEIZ Markt für gefriergetrocknete injizierbare Arzneimittel, nach Form, 2019–2028 (in Mio. USD)
TABELLE 300 SCHWEIZ – Markt für gefriergetrocknete injizierbare Arzneimittel, nach Indikation, 2019–2028 (in Mio. USD)
TABELLE 301 SCHWEIZ Markt für gefriergetrocknete injizierbare Arzneimittel, nach Verabreichungsweg, 2019–2028 (in Mio. USD)
TABELLE 302 SCHWEIZ Markt für gefriergetrocknete injizierbare Medikamente, nach Endverbraucher, 2019–2028 (in Mio. USD)
TABELLE 303 SCHWEIZ Markt für gefriergetrocknete injizierbare Arzneimittel, nach Vertriebskanal, 2019–2028 (in Mio. USD)
TABELLE 304 TÜRKEI – Markt für gefriergetrocknete injizierbare Arzneimittel, nach Verpackung, 2019–2028 (in Mio. USD)
TABELLE 305 TÜRKEI – Markt für gefriergetrocknete injizierbare Medikamente, nach Medikamentenklasse, 2019–2028 (in Mio. USD)
TABELLE 306 TÜRKEI – Markt für gefriergetrocknete injizierbare Arzneimittel, nach Arzneimittelklasse, 2019–2028 (Einheiten)
TABELLE 307 TÜRKEI – Markt für Antiinfektiva im Bereich gefriergetrockneter Injektionsmedikamente, nach Medikamentenklasse, 2019–2028 (in Mio. USD)
TABELLE 308 TÜRKEI – Markt für Antibiotika im Bereich gefriergetrockneter injizierbarer Medikamente, nach Medikamentenklasse, 2019–2028 (in Mio. USD)
TABELLE 309 TÜRKEI – Markt für Antimykotika in gefriergetrockneten Injektionspräparaten, nach Arzneimittelklasse, 2019–2028 (in Mio. USD)
TABELLE 310 TÜRKEI – Markt für antivirale Mittel in gefriergetrockneten Injektionsmedikamenten, nach Medikamentenklasse, 2019–2028 (in Mio. USD)
TABELLE 311 TÜRKEI – Markt für Antineoplastika in gefriergetrockneten Injektionspräparaten, nach Arzneimittelklasse, 2019–2028 (in Mio. USD)
TABELLE 312 TÜRKEI – Markt für Diuretika im gefriergetrockneten Injektionsmedikamenten, nach Medikamentenklasse, 2019–2028 (in Mio. USD)
TABELLE 313 TÜRKEI – Markt für Protonenpumpenhemmer in gefriergetrockneten Injektionsmedikamenten, nach Medikamentenklasse, 2019–2028 (in Mio. USD)
TABELLE 314 TÜRKEI – Markt für Anästhetika in gefriergetrockneten Injektionsmedikamenten, nach Medikamentenklasse, 2019–2028 (in Mio. USD)
TABELLE 315 TÜRKEI – Markt für Antikoagulanzien in gefriergetrockneten Injektionsmedikamenten, nach Medikamentenklasse, 2019–2028 (in Mio. USD)
TABELLE 316 TÜRKEI – NSAR auf dem Markt für gefriergetrocknete Injektionsmedikamente, nach Medikamentenklasse, 2019–2028 (in Mio. USD)
TABELLE 317 TÜRKEI – Markt für Kortikosteroide im Bereich gefriergetrockneter injizierbarer Arzneimittel, nach Arzneimittelklasse, 2019–2028 (in Mio. USD)
TABELLE 318 TÜRKEI – Markt für gefriergetrocknete injizierbare Arzneimittel, nach Form, 2019–2028 (in Mio. USD)
TABELLE 319 – TÜRKEI – Markt für lyophilisierte injizierbare Arzneimittel, nach Indikation, 2019–2028 (in Mio. USD)
TABELLE 320 TÜRKEI – Markt für gefriergetrocknete injizierbare Arzneimittel, nach Verabreichungsweg, 2019–2028 (in Mio. USD)
TABELLE 321 TÜRKEI – Markt für gefriergetrocknete injizierbare Medikamente, nach Endverbraucher, 2019–2028 (in Mio. USD)
TABELLE 322 TÜRKEI – Markt für lyophilisierte injizierbare Arzneimittel, nach Vertriebskanal, 2019–2028 (in Mio. USD)
TABELLE 323 ÖSTERREICH – Markt für lyophilisierte injizierbare Arzneimittel, nach Verpackung, 2019–2028 (in Mio. USD)
TABELLE 324 ÖSTERREICH – Markt für gefriergetrocknete injizierbare Arzneimittel, nach Arzneimittelklasse, 2019–2028 (in Mio. USD)
TABELLE 325 ÖSTERREICH – Markt für lyophilisierte injizierbare Arzneimittel, nach Arzneimittelklasse, 2019–2028 (Einheiten)
TABELLE 326 ÖSTERREICH – Markt für Antiinfektiva in gefriergetrockneten Injektionspräparaten, nach Arzneimittelklasse, 2019–2028 (in Mio. USD)
TABELLE 327 ÖSTERREICH – Markt für Antibiotika in gefriergetrockneten injizierbaren Arzneimitteln, nach Arzneimittelklasse, 2019–2028 (in Mio. USD)
TABELLE 328 ÖSTERREICH – Markt für Antimykotika in gefriergetrockneten Injektionspräparaten, nach Arzneimittelklasse, 2019–2028 (in Mio. USD)
TABELLE 329 ÖSTERREICH – Markt für antivirale Mittel in gefriergetrockneten Injektionspräparaten, nach Arzneimittelklasse, 2019–2028 (in Millionen USD)
TABELLE 330 ÖSTERREICH – Markt für Antineoplastika in gefriergetrockneten Injektionspräparaten, nach Arzneimittelklasse, 2019–2028 (in Millionen USD)
TABELLE 331 ÖSTERREICH: Markt für Diuretika in gefriergetrockneten Injektionsmedikamenten, nach Medikamentenklasse, 2019–2028 (in Millionen USD)
TABELLE 332 ÖSTERREICH – Markt für Protonenpumpenhemmer in gefriergetrockneten injizierbaren Arzneimitteln, nach Arzneimittelklasse, 2019–2028 (in Millionen USD)
TABELLE 333 ÖSTERREICH – Markt für Anästhetika in gefriergetrockneten injizierbaren Arzneimitteln, nach Arzneimittelklasse, 2019–2028 (in Mio. USD)
TABELLE 334 ÖSTERREICH – Markt für Antikoagulanzien in gefriergetrockneten injizierbaren Arzneimitteln, nach Arzneimittelklasse, 2019–2028 (in Mio. USD)
TABELLE 335 ÖSTERREICH – Markt für NSAR im gefriergetrockneten injizierbaren Arzneimittel, nach Arzneimittelklasse, 2019–2028 (in Millionen USD)
TABELLE 336 ÖSTERREICH – Markt für Kortikosteroide in gefriergetrockneten injizierbaren Arzneimitteln, nach Arzneimittelklasse, 2019–2028 (in Millionen USD)
TABELLE 337 ÖSTERREICH – Markt für lyophilisierte injizierbare Arzneimittel, nach Form, 2019–2028 (in Mio. USD)
TABELLE 338 ÖSTERREICH – Markt für lyophilisierte injizierbare Arzneimittel, nach Indikation, 2019–2028 (in Mio. USD)
TABELLE 339 ÖSTERREICH – Markt für gefriergetrocknete injizierbare Arzneimittel, nach Verabreichungsweg, 2019–2028 (in Mio. USD)
TABELLE 340 ÖSTERREICH – Markt für lyophilisierte injizierbare Arzneimittel, nach Endverbraucher, 2019–2028 (in Mio. USD)
TABELLE 341 ÖSTERREICH – Markt für lyophilisierte injizierbare Arzneimittel, nach Vertriebskanal, 2019–2028 (in Mio. USD)
TABELLE 342 NORWEGEN – Markt für gefriergetrocknete injizierbare Medikamente, nach Verpackung, 2019–2028 (in Mio. USD)
TABELLE 343 NORWEGEN – Markt für gefriergetrocknete injizierbare Medikamente, nach Medikamentenklasse, 2019–2028 (in Mio. USD)
TABELLE 344 NORWEGEN – Markt für gefriergetrocknete injizierbare Medikamente, nach Medikamentenklasse, 2019–2028 (Einheiten)
TABELLE 345 NORWEGEN – Markt für Antiinfektiva in gefriergetrockneten Injektionsmedikamenten, nach Medikamentenklasse, 2019–2028 (in Mio. USD)
TABELLE 346 NORWEGEN – Markt für Antibiotika in gefriergetrockneten Injektionsmedikamenten, nach Medikamentenklasse, 2019–2028 (in Mio. USD)
TABELLE 347 NORWEGEN – Markt für Antimykotika in gefriergetrockneten Injektionspräparaten, nach Arzneimittelklasse, 2019–2028 (in Mio. USD)
TABELLE 348 NORWEGEN – Markt für antivirale Mittel in gefriergetrockneten Injektionsmedikamenten, nach Medikamentenklasse, 2019–2028 (in Mio. USD)
TABELLE 349 NORWEGEN – Markt für Antineoplastika in gefriergetrockneten Injektionspräparaten, nach Arzneimittelklasse, 2019–2028 (in Mio. USD)
TABELLE 350 NORWEGEN – Markt für Diuretika im gefriergetrockneten injizierbaren Arzneimitteln, nach Arzneimittelklasse, 2019–2028 (in Mio. USD)
TABELLE 351 NORWEGEN – Markt für Protonenpumpenhemmer in gefriergetrockneten injizierbaren Arzneimitteln, nach Arzneimittelklasse, 2019–2028 (in Mio. USD)
TABELLE 352 NORWEGEN – Markt für Anästhetika in gefriergetrockneten Injektionsmedikamenten, nach Medikamentenklasse, 2019–2028 (in Mio. USD)
TABELLE 353 NORWEGEN – Markt für Antikoagulanzien in gefriergetrockneten Injektionsmedikamenten, nach Medikamentenklasse, 2019–2028 (in Mio. USD)
TABELLE 354 NORWEGEN – Markt für NSAR im gefriergetrockneten injizierbaren Arzneimittel, nach Arzneimittelklasse, 2019–2028 (in Millionen USD)
TABELLE 355 NORWEGEN – Markt für Kortikosteroide in gefriergetrockneten Injektionsmedikamenten, nach Medikamentenklasse, 2019–2028 (in Mio. USD)
TABELLE 356 NORWEGEN – Markt für gefriergetrocknete injizierbare Arzneimittel, nach Form, 2019–2028 (in Mio. USD)
TABELLE 357 NORWEGEN – Markt für gefriergetrocknete injizierbare Arzneimittel, nach Indikation, 2019–2028 (in Mio. USD)
TABELLE 358 NORWEGEN – Markt für gefriergetrocknete injizierbare Arzneimittel, nach Verabreichungsweg, 2019–2028 (in Mio. USD)
TABELLE 359 NORWEGEN – Markt für gefriergetrocknete injizierbare Medikamente, nach Endverbraucher, 2019–2028 (in Mio. USD)
TABELLE 360 NORWEGEN – Markt für gefriergetrocknete injizierbare Medikamente, nach Vertriebskanal, 2019–2028 (in Mio. USD)
TABELLE 361 UNGARN Markt für gefriergetrocknete injizierbare Medikamente, nach Verpackung, 2019–2028 (in Mio. USD)
TABELLE 362 UNGARN Markt für gefriergetrocknete injizierbare Medikamente, nach Medikamentenklasse, 2019–2028 (in Mio. USD)
TABELLE 363 UNGARN Markt für gefriergetrocknete injizierbare Medikamente, nach Medikamentenklasse, 2019–2028 (Einheiten)
TABELLE 364 UNGARN – Markt für Antiinfektiva im gefriergetrockneten injizierbaren Arzneimitteln, nach Arzneimittelklasse, 2019–2028 (in Mio. USD)
TABELLE 365 UNGARN – Markt für Antibiotika im gefriergetrockneten Injektionspräparat, nach Arzneimittelklasse, 2019–2028 (in Mio. USD)
TABELLE 366 UNGARN Markt für Antimykotika in gefriergetrockneten Injektionsmedikamenten, nach Medikamentenklasse, 2019–2028 (in Mio. USD)
TABELLE 367 UNGARN Markt für antivirale Mittel in gefriergetrockneten Injektionsmedikamenten, nach Medikamentenklasse, 2019–2028 (in Mio. USD)
TABELLE 368 UNGARN – Markt für Antineoplastika in gefriergetrockneten Injektionspräparaten, nach Arzneimittelklasse, 2019–2028 (in Mio. USD)
TABELLE 369 UNGARN – Markt für Diuretika im gefriergetrockneten Injektionspräparat, nach Arzneimittelklasse, 2019–2028 (in Mio. USD)
TABELLE 370 UNGARN – Markt für Protonenpumpenhemmer in gefriergetrockneten Injektionsmedikamenten, nach Medikamentenklasse, 2019–2028 (in Mio. USD)
TABELLE 371 UNGARN Markt für Anästhetika in gefriergetrockneten Injektionsmedikamenten, nach Medikamentenklasse, 2019–2028 (in Mio. USD)
TABELLE 372 UNGARN – Markt für Antikoagulanzien in gefriergetrockneten Injektionsmedikamenten, nach Medikamentenklasse, 2019–2028 (in Mio. USD)
TABELLE 373 UNGARN – Markt für NSAR im Bereich gefriergetrockneter Injektionsmedikamente, nach Medikamentenklasse, 2019–2028 (in Mio. USD)
TABELLE 374 UNGARN Markt für Kortikosteroide im Bereich gefriergetrockneter injizierbarer Medikamente, nach Medikamentenklasse, 2019–2028 (in Mio. USD)
TABELLE 375 UNGARN Markt für gefriergetrocknete injizierbare Medikamente, nach Form, 2019–2028 (in Mio. USD)
TABELLE 376 UNGARN Markt für gefriergetrocknete injizierbare Arzneimittel, nach Indikation, 2019–2028 (in Mio. USD)
TABELLE 377 UNGARN Markt für gefriergetrocknete injizierbare Arzneimittel, nach Verabreichungsweg, 2019–2028 (in Mio. USD)
TABELLE 378 UNGARN – Markt für gefriergetrocknete injizierbare Medikamente, nach Endverbraucher, 2019–2028 (in Mio. USD)
TABELLE 379 UNGARN Markt für gefriergetrocknete injizierbare Medikamente, nach Vertriebskanal, 2019–2028 (in Mio. USD)
TABELLE 380 LITAUEN – Markt für gefriergetrocknete injizierbare Arzneimittel, nach Verpackung, 2019–2028 (in Mio. USD)
TABELLE 381 LITAUEN – Markt für gefriergetrocknete injizierbare Medikamente, nach Medikamentenklasse, 2019–2028 (in Mio. USD)
TABELLE 382 LITAUEN – Markt für gefriergetrocknete injizierbare Medikamente, nach Medikamentenklasse, 2019–2028 (Einheiten)
TABELLE 383 LITAUEN – Markt für Antiinfektiva in gefriergetrockneten Injektionsmedikamenten, nach Medikamentenklasse, 2019–2028 (in Mio. USD)
TABELLE 384 LITAUEN – Markt für Antibiotika im Bereich gefriergetrockneter injizierbarer Medikamente, nach Medikamentenklasse, 2019–2028 (in Mio. USD)
TABELLE 385 LITAUEN – Markt für Antimykotika in gefriergetrockneten Injektionspräparaten, nach Arzneimittelklasse, 2019–2028 (in Mio. USD)
TABELLE 386 LITAUEN – Markt für antivirale Mittel in gefriergetrockneten Injektionsmedikamenten, nach Medikamentenklasse, 2019–2028 (in Mio. USD)
TABELLE 387 LITAUEN – Markt für Antineoplastika in gefriergetrockneten Injektionspräparaten, nach Arzneimittelklasse, 2019–2028 (in Mio. USD)
TABELLE 388 LITAUEN – Markt für Diuretika in gefriergetrockneten Injektionsmedikamenten, nach Medikamentenklasse, 2019–2028 (in Mio. USD)
TABELLE 389 LITAUEN – Markt für Protonenpumpenhemmer in gefriergetrockneten injizierbaren Arzneimitteln, nach Arzneimittelklasse, 2019–2028 (in Mio. USD)
TABELLE 390 LITAUEN – Markt für Anästhetika in gefriergetrockneten Injektionsmedikamenten, nach Medikamentenklasse, 2019–2028 (in Mio. USD)
TABELLE 391 LITAUEN – Markt für Antikoagulanzien in gefriergetrockneten Injektionsmedikamenten, nach Medikamentenklasse, 2019–2028 (in Mio. USD)
TABELLE 392 LITAUEN – Markt für NSAR im Bereich gefriergetrockneter injizierbarer Arzneimittel, nach Arzneimittelklasse, 2019–2028 (in Mio. USD)
TABELLE 393 LITAUEN – Markt für Kortikosteroide im Bereich gefriergetrockneter injizierbarer Arzneimittel, nach Arzneimittelklasse, 2019–2028 (in Mio. USD)
TABELLE 394 LITAUEN – Markt für gefriergetrocknete injizierbare Arzneimittel, nach Form, 2019–2028 (in Mio. USD)
TABELLE 395 LITAUEN – Markt für gefriergetrocknete injizierbare Arzneimittel, nach Indikation, 2019–2028 (in Mio. USD)
TABELLE 396 LITAUEN – Markt für gefriergetrocknete injizierbare Arzneimittel, nach Verabreichungsweg, 2019–2028 (in Mio. USD)
TABELLE 397 LITAUEN – Markt für gefriergetrocknete injizierbare Medikamente, nach Endverbraucher, 2019–2028 (in Mio. USD)
TABELLE 398 LITAUEN – Markt für lyophilisierte injizierbare Arzneimittel, nach Vertriebskanal, 2019–2028 (in Mio. USD)
TABELLE 399 IRLAND – Markt für gefriergetrocknete injizierbare Arzneimittel, nach Verpackung, 2019–2028 (in Mio. USD)
TABELLE 400 IRLAND – Markt für gefriergetrocknete injizierbare Medikamente, nach Medikamentenklasse, 2019–2028 (in Mio. USD)
TABELLE 401 IRLAND – Markt für gefriergetrocknete injizierbare Medikamente, nach Medikamentenklasse, 2019–2028 (Einheiten)
TABELLE 402 IRLAND – Markt für Antiinfektiva in gefriergetrockneten Injektionsmedikamenten, nach Medikamentenklasse, 2019–2028 (in Mio. USD)
TABELLE 403 IRLAND – Markt für Antibiotika in gefriergetrockneten Injektionsmedikamenten, nach Medikamentenklasse, 2019–2028 (in Mio. USD)
TABELLE 404 IRLAND – Markt für Antimykotika in gefriergetrockneten Injektionspräparaten, nach Arzneimittelklasse, 2019–2028 (in Mio. USD)
TABELLE 405 IRLAND – Markt für antivirale Mittel in gefriergetrockneten Injektionsmedikamenten, nach Medikamentenklasse, 2019–2028 (in Mio. USD)
TABELLE 406 IRLAND – Markt für Antineoplastika in gefriergetrockneten Injektionspräparaten, nach Arzneimittelklasse, 2019–2028 (in Mio. USD)
TABELLE 407 IRLAND – Markt für Diuretika in gefriergetrockneten Injektionsmedikamenten, nach Medikamentenklasse, 2019–2028 (in Mio. USD)
TABELLE 408 IRLAND – Markt für Protonenpumpenhemmer in gefriergetrockneten injizierbaren Arzneimitteln, nach Arzneimittelklasse, 2019–2028 (in Mio. USD)
TABELLE 409 IRLAND – Markt für Anästhetika in gefriergetrockneten Injektionsmedikamenten, nach Medikamentenklasse, 2019–2028 (in Mio. USD)
TABELLE 410 IRLAND – Markt für Antikoagulanzien in gefriergetrockneten Injektionsmedikamenten, nach Medikamentenklasse, 2019–2028 (in Mio. USD)
TABELLE 411 IRLAND – Markt für NSAR im Bereich gefriergetrockneter injizierbarer Arzneimittel, nach Arzneimittelklasse, 2019–2028 (in Mio. USD)
TABELLE 412 IRLAND – Markt für Kortikosteroide in gefriergetrockneten injizierbaren Arzneimitteln, nach Arzneimittelklasse, 2019–2028 (in Mio. USD)
TABELLE 413 IRLAND – Markt für gefriergetrocknete injizierbare Arzneimittel, nach Form, 2019–2028 (in Mio. USD)
TABELLE 414 IRLAND – Markt für gefriergetrocknete injizierbare Arzneimittel, nach Indikation, 2019–2028 (in Mio. USD)
TABELLE 415 IRLAND – Markt für gefriergetrocknete injizierbare Arzneimittel, nach Verabreichungsweg, 2019–2028 (in Mio. USD)
TABELLE 416 IRLAND – Markt für gefriergetrocknete injizierbare Medikamente, nach Endverbraucher, 2019–2028 (in Mio. USD)
TABELLE 417 IRLAND – Markt für gefriergetrocknete injizierbare Arzneimittel, nach Vertriebskanal, 2019–2028 (in Mio. USD)
TABELLE 418 POLEN – Markt für gefriergetrocknete injizierbare Arzneimittel, nach Verpackung, 2019–2028 (in Mio. USD)
TABELLE 419 POLEN – Markt für gefriergetrocknete injizierbare Arzneimittel, nach Arzneimittelklasse, 2019–2028 (in Mio. USD)
TABELLE 420 POLEN – Markt für gefriergetrocknete injizierbare Arzneimittel, nach Arzneimittelklasse, 2019–2028 (Einheiten)
TABELLE 421 POLEN – Markt für Antiinfektiva in gefriergetrockneten Injektionsmedikamenten, nach Medikamentenklasse, 2019–2028 (in Mio. USD)
TABELLE 422 POLEN – Markt für Antibiotika in gefriergetrockneten Injektionsmedikamenten, nach Medikamentenklasse, 2019–2028 (in Mio. USD)
TABELLE 423 POLEN – Markt für Antimykotika in gefriergetrockneten Injektionsmedikamenten, nach Medikamentenklasse, 2019–2028 (in Mio. USD)
TABELLE 424 POLEN – Markt für antivirale Mittel in gefriergetrockneten Injektionsmedikamenten, nach Medikamentenklasse, 2019–2028 (in Mio. USD)
TABELLE 425 POLEN – Markt für Antineoplastika in gefriergetrockneten Injektionspräparaten, nach Arzneimittelklasse, 2019–2028 (in Mio. USD)
TABELLE 426 POLEN – Markt für Diuretika in gefriergetrockneten Injektionsmedikamenten, nach Medikamentenklasse, 2019–2028 (in Mio. USD)
TABELLE 427 POLEN – Markt für Protonenpumpenhemmer in gefriergetrockneten injizierbaren Arzneimitteln, nach Arzneimittelklasse, 2019–2028 (in Mio. USD)
TABELLE 428 POLEN – Markt für Anästhetika in gefriergetrockneten Injektionsmedikamenten, nach Medikamentenklasse, 2019–2028 (in Mio. USD)
TABELLE 429 POLEN – Markt für Antikoagulanzien in gefriergetrockneten injizierbaren Arzneimitteln, nach Arzneimittelklasse, 2019–2028 (in Mio. USD)
TABELLE 430 POLEN – Markt für NSAR im Bereich gefriergetrockneter Injektionsmedikamente, nach Medikamentenklasse, 2019–2028 (in Millionen USD)
TABELLE 431 POLEN – Markt für Kortikosteroide im gefriergetrockneten injizierbaren Arzneimittel, nach Arzneimittelklasse, 2019–2028 (in Mio. USD)
TABELLE 432 POLEN: Markt für gefriergetrocknete injizierbare Arzneimittel, nach Form, 2019–2028 (in Mio. USD)
TABELLE 433 POLEN – Markt für lyophilisierte injizierbare Arzneimittel nach Indikation, 2019–2028 (in Mio. USD)
TABELLE 434 POLEN Markt für gefriergetrocknete injizierbare Arzneimittel, nach Verabreichungsweg, 2019–2028 (in Mio. USD)
TABELLE 435 POLEN – Markt für gefriergetrocknete injizierbare Medikamente, nach Endverbraucher, 2019–2028 (in Mio. USD)
TABELLE 436 POLEN – Markt für lyophilisierte injizierbare Arzneimittel, nach Vertriebskanal, 2019–2028 (in Mio. USD)
TABELLE 437 RESTLICHES EUROPA: Markt für gefriergetrocknete injizierbare Arzneimittel, nach Verpackung, 2019–2028 (in Mio. USD)
TABELLE 438 Markt für gefriergetrocknete injizierbare Arzneimittel im asiatisch-pazifischen Raum, nach LAND, 2019–2028 (Mio. USD)
TABELLE 439 Markt für gefriergetrocknete injizierbare Medikamente im asiatisch-pazifischen Raum, nach Verpackung, 2019–2028 (in Mio. USD)
TABELLE 440 Markt für gefriergetrocknete injizierbare Medikamente im asiatisch-pazifischen Raum, nach Medikamentenklasse, 2019–2028 (in Mio. USD)
TABELLE 441 Markt für gefriergetrocknete injizierbare Medikamente im asiatisch-pazifischen Raum, nach Medikamentenklasse, 2019–2028 (Einheiten)
TABELLE 442 Markt für Antiinfektiva in gefriergetrockneten Injektionspräparaten im asiatisch-pazifischen Raum, nach Arzneimittelklasse, 2019–2028 (in Mio. USD)
TABELLE 443 Markt für Antibiotika in gefriergetrockneten Injektionsmedikamenten im asiatisch-pazifischen Raum, nach Medikamentenklasse, 2019–2028 (in Mio. USD)
TABELLE 444 Markt für Antimykotika in gefriergetrockneten Injektionspräparaten im asiatisch-pazifischen Raum, nach Arzneimittelklasse, 2019–2028 (in Mio. USD)
TABELLE 445 Markt für antivirale Mittel in gefriergetrockneten Injektionspräparaten im asiatisch-pazifischen Raum, nach Arzneimittelklasse, 2019–2028 (in Mio. USD)
TABELLE 446 Markt für gefriergetrocknete injizierbare Antineoplastika im asiatisch-pazifischen Raum, nach Arzneimittelklasse, 2019–2028 (in Mio. USD)
TABELLE 447 Markt für Diuretika in gefriergetrockneten Injektionsmedikamenten im asiatisch-pazifischen Raum, nach Medikamentenklasse, 2019–2028 (in Mio. USD)
TABELLE 448 Markt für Protonenpumpenhemmer in gefriergetrockneten Injektionsmedikamenten im asiatisch-pazifischen Raum, nach Medikamentenklasse, 2019–2028 (in Mio. USD)
TABELLE 449 Markt für Anästhetika in gefriergetrockneten Injektionsmedikamenten im asiatisch-pazifischen Raum, nach Medikamentenklasse, 2019–2028 (in Mio. USD)
TABELLE 450 Markt für Antikoagulanzien in gefriergetrockneten Injektionsmedikamenten im asiatisch-pazifischen Raum, nach Medikamentenklasse, 2019–2028 (in Mio. USD)
TABELLE 451 Markt für NSAR im asiatisch-pazifischen Raum in gefriergetrockneten Injektionsmedikamenten, nach Medikamentenklasse, 2019–2028 (in Mio. USD)
TABELLE 452 Markt für Kortikosteroide in gefriergetrockneten Injektionsmedikamenten im asiatisch-pazifischen Raum, nach Medikamentenklasse, 2019–2028 (in Mio. USD)
TABELLE 453 Markt für gefriergetrocknete injizierbare Arzneimittel im asiatisch-pazifischen Raum, nach Form, 2019–2028 (in Mio. USD)
TABELLE 454 Markt für gefriergetrocknete injizierbare Arzneimittel im asiatisch-pazifischen Raum, nach Indikation, 2019–2028 (in Mio. USD)
TABELLE 455 Markt für gefriergetrocknete injizierbare Arzneimittel im asiatisch-pazifischen Raum, nach Verabreichungsweg, 2019–2028 (in Mio. USD)
TABELLE 456 Markt für gefriergetrocknete injizierbare Medikamente im asiatisch-pazifischen Raum, nach Endverbraucher, 2019–2028 (in Mio. USD)
TABELLE 457 Markt für gefriergetrocknete injizierbare Arzneimittel im asiatisch-pazifischen Raum, nach Vertriebskanal, 2019–2028 (in Mio. USD)
TABELLE 458 Japanischer Markt für gefriergetrocknete injizierbare Medikamente, nach Verpackung, 2019–2028 (in Mio. USD)
TABELLE 459 JAPANISCHER Markt für gefriergetrocknete injizierbare Medikamente, nach Medikamentenklasse, 2019–2028 (in Mio. USD)
TABELLE 460 JAPANISCHER Markt für gefriergetrocknete injizierbare Medikamente, nach Medikamentenklasse, 2019–2028 (Einheiten)
TABELLE 461 JAPANISCHER Markt für Antiinfektiva in gefriergetrockneten Injektionsmedikamenten, nach Medikamentenklasse, 2019–2028 (in Mio. USD)
TABELLE 462 JAPANISCHER Markt für Antibiotika in gefriergetrockneten injizierbaren Arzneimitteln, nach Arzneimittelklasse, 2019–2028 (in Mio. USD)
TABELLE 463 JAPANISCHER Markt für Antimykotika in gefriergetrockneten Injektionspräparaten, nach Arzneimittelklasse, 2019–2028 (in Mio. USD)
TABELLE 464 JAPANISCHER Markt für antivirale Mittel in gefriergetrockneten Injektionsmedikamenten, nach Medikamentenklasse, 2019–2028 (in Mio. USD)
TABELLE 465 JAPANISCHER Markt für Antineoplastika in gefriergetrockneten Injektionspräparaten, nach Arzneimittelklasse, 2019–2028 (in Mio. USD)
TABELLE 466 JAPAN: Markt für Diuretika in gefriergetrockneten Injektionsmedikamenten, nach Medikamentenklasse, 2019–2028 (in Mio. USD)
TABELLE 467 JAPAN Protonenpumpenhemmer im Markt für gefriergetrocknete injizierbare Medikamente, nach Medikamentenklasse, 2019–2028 (in Mio. USD)
TABELLE 468 JAPANISCHER Markt für Anästhetika in gefriergetrockneten injizierbaren Arzneimitteln, nach Arzneimittelklasse, 2019–2028 (in Mio. USD)
TABELLE 469 JAPANISCHER Markt für Antikoagulanzien in gefriergetrockneten injizierbaren Arzneimitteln, nach Arzneimittelklasse, 2019–2028 (in Mio. USD)
TABELLE 470 JAPANISCHER Markt für NSAR im gefriergetrockneten injizierbaren Arzneimittel, nach Arzneimittelklasse, 2019–2028 (in Millionen USD)
TABELLE 471 JAPANISCHER Markt für Kortikosteroide im gefriergetrockneten injizierbaren Arzneimittel, nach Arzneimittelklasse, 2019–2028 (in Mio. USD)
TABELLE 472 JAPANISCHER Markt für gefriergetrocknete injizierbare Medikamente, nach Form, 2019–2028 (in Mio. USD)
TABELLE 473 JAPANISCHER Markt für gefriergetrocknete injizierbare Arzneimittel, nach Indikation, 2019–2028 (in Mio. USD)
TABELLE 474 JAPANISCHER Markt für gefriergetrocknete injizierbare Arzneimittel, nach Verabreichungsweg, 2019–2028 (in Mio. USD)
TABELLE 475 JAPANISCHER Markt für gefriergetrocknete injizierbare Medikamente, nach Endverbraucher, 2019–2028 (in Mio. USD)
TABELLE 476 JAPANISCHER Markt für gefriergetrocknete injizierbare Medikamente, nach Vertriebskanal, 2019–2028 (in Mio. USD)
TABELLE 477 Chinesischer Markt für gefriergetrocknete injizierbare Medikamente, nach Verpackung, 2019–2028 (in Mio. USD)
TABELLE 478 CHINA-Markt für gefriergetrocknete injizierbare Medikamente, nach Medikamentenklasse, 2019–2028 (in Mio. USD)
TABELLE 479 CHINA-Markt für gefriergetrocknete injizierbare Medikamente, nach Medikamentenklasse, 2019–2028 (Einheiten)
TABELLE 480 CHINA: Markt für Antiinfektiva in gefriergetrockneten Injektionsmedikamenten, nach Medikamentenklasse, 2019–2028 (in Mio. USD)
TABELLE 481 CHINA: Markt für Antibiotika in gefriergetrockneten Injektionsmedikamenten, nach Medikamentenklasse, 2019–2028 (in Millionen USD)
TABELLE 482 CHINA: Markt für Antimykotika in gefriergetrockneten Injektionspräparaten, nach Arzneimittelklasse, 2019–2028 (in Mio. USD)
TABELLE 483 CHINA: Markt für antivirale Mittel in gefriergetrockneten Injektionsmedikamenten, nach Medikamentenklasse, 2019–2028 (in Millionen USD)
TABELLE 484 CHINA: Markt für Antineoplastika in gefriergetrockneten Injektionspräparaten, nach Arzneimittelklasse, 2019–2028 (in Mio. USD)
TABELLE 485 CHINA: Markt für Diuretika in gefriergetrockneten Injektionsmedikamenten, nach Medikamentenklasse, 2019–2028 (in Millionen USD)
TABELLE 486 CHINA: Markt für Protonenpumpenhemmer in gefriergetrockneten Injektionsmedikamenten, nach Medikamentenklasse, 2019–2028 (in Millionen USD)
TABELLE 487 CHINA: Markt für Anästhetika in gefriergetrockneten Injektionsmedikamenten, nach Medikamentenklasse, 2019–2028 (in Mio. USD)
TABELLE 488 CHINA: Markt für Antikoagulanzien in gefriergetrockneten Injektionsmedikamenten, nach Medikamentenklasse, 2019–2028 (in Mio. USD)
TABELLE 489 CHINA: Markt für NSAR in gefriergetrockneten Injektionsmedikamenten, nach Medikamentenklasse, 2019–2028 (in Millionen USD)
TABELLE 490 CHINA: Markt für Kortikosteroide in gefriergetrockneten Injektionsmedikamenten, nach Medikamentenklasse, 2019–2028 (in Millionen USD)
TABELLE 491 CHINA-Markt für gefriergetrocknete injizierbare Medikamente, nach Form, 2019–2028 (in Mio. USD)
TABELLE 492 CHINA-Markt für gefriergetrocknete injizierbare Medikamente, nach Indikation, 2019–2028 (in Mio. USD)
TABELLE 493 CHINA-Markt für gefriergetrocknete injizierbare Arzneimittel, nach Verabreichungsweg, 2019–2028 (in Mio. USD)
TABELLE 494 CHINA-Markt für gefriergetrocknete injizierbare Medikamente, nach Endverbraucher, 2019–2028 (in Mio. USD)
TABELLE 495 CHINA-Markt für gefriergetrocknete injizierbare Medikamente, nach Vertriebskanal, 2019–2028 (in Mio. USD)
TABELLE 496 Südkoreanischer Markt für gefriergetrocknete injizierbare Medikamente, nach Verpackung, 2019–2028 (in Mio. USD)
TABELLE 497 SÜDKOREA – Markt für gefriergetrocknete injizierbare Medikamente, nach Medikamentenklasse, 2019–2028 (in Mio. USD)
TABELLE 498 SÜDKOREA – Markt für gefriergetrocknete injizierbare Medikamente, nach Medikamentenklasse, 2019–2028 (Einheiten)
TABELLE 499 SÜDKOREA – Markt für Antiinfektiva in gefriergetrockneten Injektionsmedikamenten, nach Medikamentenklasse, 2019–2028 (in Mio. USD)
TABELLE 500 SÜDKOREA – Markt für Antibiotika im Bereich gefriergetrockneter injizierbarer Medikamente, nach Medikamentenklasse, 2019–2028 (in Millionen USD)
TABELLE 501 SÜDKOREA – Markt für Antimykotika in gefriergetrockneten Injektionspräparaten, nach Arzneimittelklasse, 2019–2028 (in Mio. USD)
TABELLE 502 SÜDKOREA – Markt für antivirale Mittel in gefriergetrockneten Injektionsmedikamenten, nach Medikamentenklasse, 2019–2028 (in Mio. USD)
TABELLE 503 SÜDKOREA – Markt für Antineoplastika in gefriergetrockneten Injektionspräparaten, nach Arzneimittelklasse, 2019–2028 (in Mio. USD)
TABELLE 504 SÜDKOREA – Markt für Diuretika in gefriergetrockneten Injektionsmedikamenten, nach Medikamentenklasse, 2019–2028 (in Mio. USD)
TABELLE 505 SÜDKOREA – Markt für Protonenpumpenhemmer in gefriergetrockneten injizierbaren Arzneimitteln, nach Arzneimittelklasse, 2019–2028 (in Mio. USD)
TABELLE 506 SÜDKOREA – Markt für Anästhetika in gefriergetrockneten Injektionsmedikamenten, nach Medikamentenklasse, 2019–2028 (in Mio. USD)
TABELLE 507 SÜDKOREA – Markt für Antikoagulanzien in gefriergetrockneten Injektionsmedikamenten, nach Medikamentenklasse, 2019–2028 (in Mio. USD)
TABELLE 508 SÜDKOREA – NSAR auf dem Markt für gefriergetrocknete Injektionsmedikamente, nach Medikamentenklasse, 2019–2028 (in Millionen USD)
TABELLE 509 SÜDKOREA – Markt für Kortikosteroide in gefriergetrockneten Injektionsmedikamenten, nach Medikamentenklasse, 2019–2028 (in Mio. USD)
TABELLE 510 SÜDKOREA – Markt für gefriergetrocknete injizierbare Arzneimittel, nach Form, 2019–2028 (in Mio. USD)
TABELLE 511 SÜDKOREA – Markt für gefriergetrocknete injizierbare Arzneimittel, nach Indikation, 2019–2028 (in Mio. USD)
TABELLE 512 SÜDKOREA – Markt für gefriergetrocknete injizierbare Arzneimittel, nach Verabreichungsweg, 2019–2028 (in Mio. USD)
TABELLE 513 SÜDKOREA – Markt für gefriergetrocknete injizierbare Medikamente, nach Endverbraucher, 2019–2028 (in Mio. USD)
TABELLE 514 SÜDKOREA – Markt für gefriergetrocknete injizierbare Arzneimittel, nach Vertriebskanal, 2019–2028 (in Mio. USD)
TABELLE 515 Indischer Markt für gefriergetrocknete injizierbare Medikamente, nach Verpackung, 2019–2028 (in Mio. USD)
TABELLE 516 INDIEN: Markt für gefriergetrocknete injizierbare Medikamente, nach Medikamentenklasse, 2019–2028 (in Mio. USD)
TABELLE 517 INDIEN – Markt für gefriergetrocknete injizierbare Medikamente, nach Medikamentenklasse, 2019–2028 (Einheiten)
TABELLE 518 INDIEN – Markt für Antiinfektiva in gefriergetrockneten Injektionsmedikamenten, nach Medikamentenklasse, 2019–2028 (in Mio. USD)
TABELLE 519 INDIEN – Markt für Antibiotika in gefriergetrockneten Injektionsmedikamenten, nach Medikamentenklasse, 2019–2028 (in Mio. USD)
TABELLE 520 INDIEN – Markt für Antimykotika in gefriergetrockneten Injektionsmedikamenten, nach Medikamentenklasse, 2019–2028 (in Mio. USD)
TABELLE 521 INDIEN: Markt für antivirale Mittel in gefriergetrockneten Injektionsmedikamenten, nach Medikamentenklasse, 2019–2028 (in Millionen USD)
TABELLE 522 INDIEN: Markt für Antineoplastika in gefriergetrockneten Injektionspräparaten, nach Arzneimittelklasse, 2019–2028 (in Mio. USD)
TABELLE 523 INDIEN: Markt für Diuretika in gefriergetrockneten Injektionsmedikamenten, nach Medikamentenklasse, 2019–2028 (in Mio. USD)
TABELLE 524 INDIEN: Markt für Protonenpumpenhemmer in gefriergetrockneten injizierbaren Arzneimitteln, nach Arzneimittelklasse, 2019–2028 (in Millionen USD)
TABELLE 525 INDIEN: Markt für Anästhetika in gefriergetrockneten Injektionsmedikamenten, nach Medikamentenklasse, 2019–2028 (in Mio. USD)
TABELLE 526 INDIEN – Markt für Antikoagulanzien in gefriergetrockneten injizierbaren Arzneimitteln, nach Arzneimittelklasse, 2019–2028 (in Mio. USD)
TABELLE 527 INDIEN – Markt für NSAR im gefriergetrockneten injizierbaren Arzneimittel, nach Arzneimittelklasse, 2019–2028 (in Millionen USD)
TABELLE 528 INDIEN – Markt für Kortikosteroide in gefriergetrockneten injizierbaren Arzneimitteln, nach Arzneimittelklasse, 2019–2028 (in Mio. USD)
TABELLE 529 INDIEN: Markt für gefriergetrocknete injizierbare Medikamente, nach Form, 2019–2028 (in Mio. USD)
TABELLE 530 INDIEN – Markt für gefriergetrocknete injizierbare Arzneimittel, nach Indikation, 2019–2028 (in Mio. USD)
TABELLE 531 INDIEN: Markt für gefriergetrocknete injizierbare Arzneimittel, nach Verabreichungsweg, 2019–2028 (in Mio. USD)
TABELLE 532 INDIEN: Markt für gefriergetrocknete injizierbare Medikamente, nach Endverbraucher, 2019–2028 (in Mio. USD)
TABELLE 533 INDIEN: Markt für gefriergetrocknete injizierbare Medikamente, nach Vertriebskanal, 2019–2028 (in Mio. USD)
TABELLE 534 Australischer Markt für gefriergetrocknete injizierbare Medikamente, nach Verpackung, 2019–2028 (in Mio. USD)
TABELLE 535 AUSTRALIEN – Markt für gefriergetrocknete injizierbare Medikamente, nach Medikamentenklasse, 2019–2028 (in Mio. USD)
TABELLE 536 AUSTRALIEN – Markt für gefriergetrocknete injizierbare Medikamente, nach Medikamentenklasse, 2019–2028 (Einheiten)
TABELLE 537 AUSTRALIEN – Markt für Antiinfektiva in gefriergetrockneten Injektionsmedikamenten, nach Medikamentenklasse, 2019–2028 (in Mio. USD)
TABELLE 538 AUSTRALIEN – Markt für Antibiotika in gefriergetrockneten Injektionsmedikamenten, nach Medikamentenklasse, 2019–2028 (in Mio. USD)
TABELLE 539 AUSTRALIEN – Markt für Antimykotika in gefriergetrockneten Injektionspräparaten, nach Arzneimittelklasse, 2019–2028 (in Mio. USD)
TABELLE 540 AUSTRALIEN – Markt für antivirale Mittel in gefriergetrockneten Injektionsmedikamenten, nach Medikamentenklasse, 2019–2028 (in Mio. USD)
TABELLE 541 AUSTRALIEN – Markt für Antineoplastika in gefriergetrockneten Injektionspräparaten, nach Arzneimittelklasse, 2019–2028 (in Mio. USD)
TABELLE 542 AUSTRALIEN – Markt für Diuretika in gefriergetrockneten Injektionsmedikamenten, nach Medikamentenklasse, 2019–2028 (in Mio. USD)
TABELLE 543 AUSTRALIEN – Markt für Protonenpumpenhemmer in gefriergetrockneten injizierbaren Arzneimitteln, nach Arzneimittelklasse, 2019–2028 (in Mio. USD)
TABELLE 544 AUSTRALIEN – Markt für Anästhetika in gefriergetrockneten Injektionsmedikamenten, nach Medikamentenklasse, 2019–2028 (in Mio. USD)
TABELLE 545 AUSTRALIEN – Markt für Antikoagulanzien in gefriergetrockneten Injektionsmedikamenten, nach Medikamentenklasse, 2019–2028 (in Mio. USD)
TABELLE 546 AUSTRALIEN – Markt für NSAR in gefriergetrockneten Injektionsmedikamenten, nach Medikamentenklasse, 2019–2028 (in Mio. USD)
TABELLE 547 AUSTRALIEN – Markt für Kortikosteroide in gefriergetrockneten injizierbaren Arzneimitteln, nach Arzneimittelklasse, 2019–2028 (in Mio. USD)
TABELLE 548 AUSTRALIEN – Markt für gefriergetrocknete injizierbare Medikamente, nach Form, 2019–2028 (in Mio. USD)
TABELLE 549 AUSTRALIEN – Markt für gefriergetrocknete injizierbare Arzneimittel, nach Indikation, 2019–2028 (in Mio. USD)
TABELLE 550 AUSTRALIEN – Markt für gefriergetrocknete injizierbare Arzneimittel, nach Verabreichungsweg, 2019–2028 (in Mio. USD)
TABELLE 551 AUSTRALIEN – Markt für gefriergetrocknete injizierbare Medikamente, nach Endverbraucher, 2019–2028 (in Mio. USD)
TABELLE 552 AUSTRALIEN – Markt für gefriergetrocknete injizierbare Arzneimittel, nach Vertriebskanal, 2019–2028 (in Mio. USD)
TABELLE 553 Markt für gefriergetrocknete injizierbare Medikamente in Singapur, nach Verpackung, 2019–2028 (in Mio. USD)
TABELLE 554 SINGAPUR – Markt für gefriergetrocknete injizierbare Medikamente, nach Medikamentenklasse, 2019–2028 (in Mio. USD)
TABELLE 555 SINGAPUR – Markt für gefriergetrocknete injizierbare Medikamente, nach Medikamentenklasse, 2019–2028 (Einheiten)
TABELLE 556 SINGAPUR – Markt für Antiinfektiva in gefriergetrockneten Injektionsmedikamenten, nach Medikamentenklasse, 2019–2028 (in Mio. USD)
TABELLE 557 SINGAPUR – Markt für Antibiotika in gefriergetrockneten Injektionsmedikamenten, nach Medikamentenklasse, 2019–2028 (in Mio. USD)
TABELLE 558 SINGAPUR – Markt für Antimykotika in gefriergetrockneten Injektionsmedikamenten, nach Medikamentenklasse, 2019–2028 (in Mio. USD)
TABELLE 559 SINGAPUR – Markt für antivirale Mittel in gefriergetrockneten Injektionsmedikamenten, nach Medikamentenklasse, 2019–2028 (in Mio. USD)
TABELLE 560 SINGAPUR – Markt für Antineoplastika in gefriergetrockneten Injektionspräparaten, nach Arzneimittelklasse, 2019–2028 (in Mio. USD)
TABELLE 561 Singapur – Markt für Diuretika in gefriergetrockneten Injektionsmedikamenten, nach Medikamentenklasse, 2019–2028 (in Mio. USD)
TABELLE 562 SINGAPUR – Markt für Protonenpumpenhemmer in gefriergetrockneten Injektionsmedikamenten, nach Medikamentenklasse, 2019–2028 (in Mio. USD)
TABELLE 563 SINGAPUR – Markt für Anästhetika in gefriergetrockneten Injektionsmedikamenten, nach Medikamentenklasse, 2019–2028 (in Mio. USD)
TABELLE 564 SINGAPUR – Markt für Antikoagulanzien in gefriergetrockneten Injektionsmedikamenten, nach Medikamentenklasse, 2019–2028 (in Mio. USD)
TABELLE 565 SINGAPUR – NSAR auf dem Markt für gefriergetrocknete Injektionsmedikamente, nach Medikamentenklasse, 2019–2028 (in Millionen USD)
TABELLE 566 SINGAPUR – Markt für Kortikosteroide in gefriergetrockneten Injektionsmedikamenten, nach Medikamentenklasse, 2019–2028 (in Mio. USD)
TABELLE 567 SINGAPUR – Markt für gefriergetrocknete injizierbare Medikamente, nach Form, 2019–2028 (in Mio. USD)
TABELLE 568 SINGAPUR – Markt für gefriergetrocknete injizierbare Arzneimittel, nach Indikation, 2019–2028 (in Mio. USD)
TABELLE 569 SINGAPUR – Markt für gefriergetrocknete injizierbare Arzneimittel, nach Verabreichungsweg, 2019–2028 (in Mio. USD)
TABELLE 570 SINGAPUR – Markt für gefriergetrocknete injizierbare Medikamente, nach Endverbraucher, 2019–2028 (in Mio. USD)
TABELLE 571 SINGAPUR – Markt für gefriergetrocknete injizierbare Medikamente, nach Vertriebskanal, 2019–2028 (in Mio. USD)
TABELLE 572 Markt für gefriergetrocknete injizierbare Medikamente in Thailand, nach Verpackung, 2019–2028 (in Mio. USD)
TABELLE 573 THAILAND – Markt für gefriergetrocknete injizierbare Medikamente, nach Medikamentenklasse, 2019–2028 (in Mio. USD)
TABELLE 574 THAILAND – Markt für gefriergetrocknete injizierbare Medikamente, nach Medikamentenklasse, 2019–2028 (Einheiten)
TABELLE 575 THAILAND – Markt für Antiinfektiva im gefriergetrockneten injizierbaren Arzneimittel, nach Arzneimittelklasse, 2019–2028 (in Mio. USD)
TABELLE 576 THAILAND – Markt für Antibiotika im gefriergetrockneten Injektionspräparat, nach Arzneimittelklasse, 2019–2028 (in Mio. USD)
TABELLE 577 THAILAND – Markt für Antimykotika in gefriergetrockneten Injektionsmedikamenten, nach Medikamentenklasse, 2019–2028 (in Mio. USD)
TABELLE 578 THAILAND – Markt für antivirale Mittel in gefriergetrockneten Injektionsmedikamenten, nach Medikamentenklasse, 2019–2028 (in Mio. USD)
TABELLE 579 THAILAND – Markt für Antineoplastika in gefriergetrockneten Injektionspräparaten, nach Arzneimittelklasse, 2019–2028 (in Mio. USD)
TABELLE 580 THAILAND – Markt für Diuretika im gefriergetrockneten Injektionsmedikamenten, nach Medikamentenklasse, 2019–2028 (in Mio. USD)
TABELLE 581 THAILAND – Markt für Protonenpumpenhemmer in gefriergetrockneten Injektionsmedikamenten, nach Medikamentenklasse, 2019–2028 (in Mio. USD)
TABELLE 582 THAILAND – Markt für Anästhetika in gefriergetrockneten Injektionsmedikamenten, nach Medikamentenklasse, 2019–2028 (in Mio. USD)
TABELLE 583 THAILAND – Markt für Antikoagulanzien in gefriergetrockneten Injektionsmedikamenten, nach Medikamentenklasse, 2019–2028 (in Mio. USD)
TABELLE 584 THAILAND – Markt für NSAR im Bereich gefriergetrockneter Injektionsmedikamente, nach Medikamentenklasse, 2019–2028 (in Mio. USD)
TABELLE 585 THAILAND – Markt für Kortikosteroide im Bereich gefriergetrockneter injizierbarer Medikamente, nach Medikamentenklasse, 2019–2028 (in Mio. USD)
TABELLE 586 THAILAND – Markt für gefriergetrocknete injizierbare Medikamente, nach Form, 2019–2028 (in Mio. USD)
TABELLE 587 THAILAND – Markt für gefriergetrocknete injizierbare Arzneimittel, nach Indikation, 2019–2028 (in Mio. USD)
TABELLE 588 THAILAND – Markt für gefriergetrocknete injizierbare Arzneimittel, nach Verabreichungsweg, 2019–2028 (in Mio. USD)
TABELLE 589 THAILAND – Markt für gefriergetrocknete injizierbare Medikamente, nach Endverbraucher, 2019–2028 (in Mio. USD)
TABELLE 590 THAILAND – Markt für gefriergetrocknete injizierbare Medikamente, nach Vertriebskanal, 2019–2028 (in Mio. USD)
TABELLE 591 Malaysischer Markt für gefriergetrocknete injizierbare Medikamente, nach Verpackung, 2019–2028 (in Mio. USD)
TABELLE 592 MALAYSIA – Markt für gefriergetrocknete injizierbare Medikamente, nach Medikamentenklasse, 2019–2028 (in Mio. USD)
TABELLE 593 MALAYSIA – Markt für gefriergetrocknete injizierbare Medikamente, nach Medikamentenklasse, 2019–2028 (Einheiten)
TABELLE 594 MALAYSIA – Markt für Antiinfektiva in gefriergetrockneten Injektionsmedikamenten, nach Medikamentenklasse, 2019–2028 (in Mio. USD)
TABELLE 595 MALAYSIA – Markt für Antibiotika in gefriergetrockneten injizierbaren Arzneimitteln, nach Arzneimittelklasse, 2019–2028 (in Mio. USD)
TABELLE 596 MALAYSIA – Markt für Antimykotika in gefriergetrockneten Injektionsmedikamenten, nach Medikamentenklasse, 2019–2028 (in Mio. USD)
TABELLE 597 MALAYSIA – Markt für antivirale Mittel in gefriergetrockneten Injektionsmedikamenten, nach Medikamentenklasse, 2019–2028 (in Mio. USD)
TABELLE 598 MALAYSIA – Markt für Antineoplastika in gefriergetrockneten Injektionspräparaten, nach Arzneimittelklasse, 2019–2028 (in Mio. USD)
TABELLE 599 MALAYSIA – Markt für Diuretika in gefriergetrockneten injizierbaren Arzneimitteln, nach Arzneimittelklasse, 2019–2028 (in Mio. USD)
TABELLE 600 MALAYSIA – Markt für Protonenpumpenhemmer in gefriergetrockneten injizierbaren Arzneimitteln, nach Arzneimittelklasse, 2019–2028 (in Millionen USD)
TABELLE 601 MALAYSIA – Markt für Anästhetika in gefriergetrockneten injizierbaren Arzneimitteln, nach Arzneimittelklasse, 2019–2028 (in Mio. USD)
TABELLE 602 MALAYSIA – Markt für Antikoagulanzien in gefriergetrockneten injizierbaren Arzneimitteln, nach Arzneimittelklasse, 2019–2028 (in Mio. USD)
TABELLE 603 MALAYSIA – Markt für NSAR im Bereich gefriergetrockneter Injektionsmedikamente, nach Medikamentenklasse, 2019–2028 (in Millionen USD)
TABELLE 604 MALAYSIA – Markt für Kortikosteroide im gefriergetrockneten injizierbaren Arzneimittel, nach Arzneimittelklasse, 2019–2028 (in Mio. USD)
TABELLE 605 MALAYSIA – Markt für gefriergetrocknete injizierbare Medikamente, nach Form, 2019–2028 (in Mio. USD)
TABELLE 606 MALAYSIA – Markt für gefriergetrocknete injizierbare Arzneimittel, nach Indikation, 2019–2028 (in Mio. USD)
TABELLE 607 MALAYSIA – Markt für gefriergetrocknete injizierbare Arzneimittel, nach Verabreichungsweg, 2019–2028 (in Mio. USD)
TABELLE 608 MALAYSIA – Markt für gefriergetrocknete injizierbare Medikamente, nach Endverbraucher, 2019–2028 (in Mio. USD)
TABELLE 609 MALAYSIA – Markt für gefriergetrocknete injizierbare Medikamente, nach Vertriebskanal, 2019–2028 (in Mio. USD)
TABELLE 610 Indonesischer Markt für gefriergetrocknete injizierbare Medikamente, nach Verpackung, 2019–2028 (in Mio. USD)
TABELLE 611 INDONESIEN – Markt für gefriergetrocknete injizierbare Medikamente, nach Medikamentenklasse, 2019–2028 (in Mio. USD)
TABELLE 612 INDONESIEN – Markt für gefriergetrocknete injizierbare Medikamente, nach Medikamentenklasse, 2019–2028 (Einheiten)
TABELLE 613 INDONESIEN – Markt für Antiinfektiva in gefriergetrockneten Injektionsmedikamenten, nach Medikamentenklasse, 2019–2028 (in Mio. USD)
TABELLE 614 INDONESIEN – Markt für Antibiotika im gefriergetrockneten injizierbaren Arzneimittel, nach Arzneimittelklasse, 2019–2028 (in Mio. USD)
TABELLE 615 INDONESIEN – Markt für Antimykotika in gefriergetrockneten Injektionsmedikamenten, nach Medikamentenklasse, 2019–2028 (in Mio. USD)
TABELLE 616 INDONESIEN – Markt für antivirale Mittel in gefriergetrockneten Injektionsmedikamenten, nach Medikamentenklasse, 2019–2028 (in Mio. USD)
TABELLE 617 INDONESIEN – Markt für Antineoplastika in gefriergetrockneten Injektionspräparaten, nach Arzneimittelklasse, 2019–2028 (in Mio. USD)
TABELLE 618 INDONESIEN – Markt für Diuretika im gefriergetrockneten injizierbaren Arzneimittel, nach Arzneimittelklasse, 2019–2028 (in Mio. USD)
TABELLE 619 INDONESIEN – Markt für Protonenpumpenhemmer in gefriergetrockneten injizierbaren Arzneimitteln, nach Arzneimittelklasse, 2019–2028 (in Mio. USD)
TABELLE 620 INDONESIEN – Markt für Anästhetika in gefriergetrockneten Injektionsmedikamenten, nach Medikamentenklasse, 2019–2028 (in Mio. USD)
TABELLE 621 INDONESIEN – Markt für Antikoagulanzien in gefriergetrockneten Injektionsmedikamenten, nach Medikamentenklasse, 2019–2028 (in Mio. USD)
TABELLE 622 INDONESIEN – Markt für NSAR im Bereich gefriergetrockneter injizierbarer Arzneimittel, nach Arzneimittelklasse, 2019–2028 (in Mio. USD)
TABELLE 623 INDONESIEN – Markt für Kortikosteroide im Bereich gefriergetrockneter injizierbarer Arzneimittel, nach Arzneimittelklasse, 2019–2028 (in Mio. USD)
TABELLE 624 INDONESIEN – Markt für gefriergetrocknete injizierbare Arzneimittel, nach Form, 2019–2028 (in Mio. USD)
TABELLE 625 INDONESIEN – Markt für gefriergetrocknete injizierbare Arzneimittel, nach Indikation, 2019–2028 (in Mio. USD)
TABELLE 626 INDONESIEN – Markt für gefriergetrocknete injizierbare Arzneimittel, nach Verabreichungsweg, 2019–2028 (in Mio. USD)
TABELLE 627 INDONESIEN – Markt für gefriergetrocknete injizierbare Medikamente, nach Endverbraucher, 2019–2028 (in Mio. USD)
TABELLE 628 INDONESIEN – Markt für gefriergetrocknete injizierbare Arzneimittel, nach Vertriebskanal, 2019–2028 (in Mio. USD)
TABELLE 629 Markt für gefriergetrocknete injizierbare Medikamente auf den Philippinen, nach Verpackung, 2019–2028 (in Mio. USD)
TABELLE 630 PHILIPPINEN – Markt für gefriergetrocknete injizierbare Medikamente, nach Medikamentenklasse, 2019–2028 (in Mio. USD)
TABELLE 631 PHILIPPINEN – Markt für gefriergetrocknete injizierbare Medikamente, nach Medikamentenklasse, 2019–2028 (Einheiten)
TABELLE 632 PHILIPPINEN – Markt für Antiinfektiva im gefriergetrockneten injizierbaren Arzneimitteln, nach Arzneimittelklasse, 2019–2028 (in Mio. USD)
TABELLE 633 PHILIPPINEN – Markt für Antibiotika im Bereich gefriergetrockneter injizierbarer Medikamente, nach Medikamentenklasse, 2019–2028 (in Mio. USD)
TABELLE 634 PHILIPPINEN – Markt für Antimykotika in gefriergetrockneten Injektionsmedikamenten, nach Medikamentenklasse, 2019–2028 (in Mio. USD)
TABELLE 635 PHILIPPINEN – Markt für antivirale Mittel in gefriergetrockneten Injektionsmedikamenten, nach Medikamentenklasse, 2019–2028 (in Mio. USD)
TABELLE 636 PHILIPPINEN – Markt für Antineoplastika in gefriergetrockneten Injektionspräparaten, nach Arzneimittelklasse, 2019–2028 (in Mio. USD)
TABELLE 637 PHILIPPINEN – Markt für Diuretika im gefriergetrockneten injizierbaren Arzneimitteln, nach Arzneimittelklasse, 2019–2028 (in Mio. USD)
TABELLE 638 PHILIPPINEN – Markt für Protonenpumpenhemmer im Bereich gefriergetrockneter injizierbarer Medikamente, nach Medikamentenklasse, 2019–2028 (in Mio. USD)
TABELLE 639 PHILIPPINEN – Markt für Anästhetika in gefriergetrockneten Injektionsmedikamenten, nach Medikamentenklasse, 2019–2028 (in Mio. USD)
TABELLE 640 PHILIPPINEN – Markt für Antikoagulanzien in gefriergetrockneten injizierbaren Arzneimitteln, nach Arzneimittelklasse, 2019–2028 (in Mio. USD)
TABELLE 641 PHILIPPINEN – Markt für NSAR im Bereich gefriergetrockneter Injektionsmedikamente, nach Medikamentenklasse, 2019–2028 (in Millionen USD)
TABELLE 642 PHILIPPINEN – Markt für Kortikosteroide im Bereich gefriergetrockneter injizierbarer Medikamente, nach Medikamentenklasse, 2019–2028 (in Mio. USD)
TABELLE 643 PHILIPPINEN – Markt für gefriergetrocknete injizierbare Medikamente, nach Form, 2019–2028 (in Mio. USD)
TABELLE 644 PHILIPPINEN – Markt für gefriergetrocknete injizierbare Arzneimittel, nach Indikation, 2019–2028 (in Mio. USD)
TABELLE 645 PHILIPPINEN – Markt für gefriergetrocknete injizierbare Arzneimittel, nach Verabreichungsweg, 2019–2028 (in Mio. USD)
TABELLE 646 PHILIPPINEN – Markt für gefriergetrocknete injizierbare Medikamente, nach Endverbraucher, 2019–2028 (in Mio. USD)
TABELLE 647 PHILIPPINEN – Markt für gefriergetrocknete injizierbare Medikamente, nach Vertriebskanal, 2019–2028 (in Mio. USD)
TABELLE 648 Vietnamesischer Markt für gefriergetrocknete injizierbare Medikamente, nach Verpackung, 2019–2028 (in Mio. USD)
TABELLE 649 VIETNAM – Markt für gefriergetrocknete injizierbare Medikamente, nach Medikamentenklasse, 2019–2028 (in Mio. USD)
TABELLE 650 VIETNAM – Markt für gefriergetrocknete injizierbare Medikamente, nach Medikamentenklasse, 2019–2028 (Einheiten)
TABELLE 651 VIETNAM – Markt für Antiinfektiva in gefriergetrockneten Injektionsmedikamenten, nach Medikamentenklasse, 2019–2028 (in Mio. USD)
TABELLE 652 VIETNAM – Markt für Antibiotika in gefriergetrockneten Injektionsmedikamenten, nach Medikamentenklasse, 2019–2028 (in Mio. USD)
TABELLE 653 VIETNAM – Markt für Antimykotika in gefriergetrockneten Injektionspräparaten, nach Arzneimittelklasse, 2019–2028 (in Mio. USD)
TABELLE 654 VIETNAM – Markt für antivirale Mittel in gefriergetrockneten Injektionsmedikamenten, nach Medikamentenklasse, 2019–2028 (in Mio. USD)
TABELLE 655 VIETNAM – Markt für Antineoplastika in gefriergetrockneten Injektionspräparaten, nach Arzneimittelklasse, 2019–2028 (in Mio. USD)
TABELLE 656 VIETNAM: Markt für Diuretika in gefriergetrockneten Injektionsmedikamenten, nach Medikamentenklasse, 2019–2028 (in Mio. USD)
TABELLE 657 VIETNAM – Markt für Protonenpumpenhemmer in gefriergetrockneten injizierbaren Arzneimitteln, nach Arzneimittelklasse, 2019–2028 (in Mio. USD)
TABELLE 658 VIETNAM – Markt für Anästhetika in gefriergetrockneten Injektionsmedikamenten, nach Medikamentenklasse, 2019–2028 (in Mio. USD)
TABELLE 659 VIETNAM – Markt für Antikoagulanzien in gefriergetrockneten Injektionsmedikamenten, nach Medikamentenklasse, 2019–2028 (in Mio. USD)
TABELLE 660 VIETNAM – Markt für NSAR in gefriergetrockneten Injektionsmedikamenten, nach Medikamentenklasse, 2019–2028 (in Millionen USD)
TABELLE 661 VIETNAM: Markt für Kortikosteroide in gefriergetrockneten Injektionsmedikamenten, nach Medikamentenklasse, 2019–2028 (in Millionen USD)
TABELLE 662 VIETNAM – Markt für gefriergetrocknete injizierbare Medikamente, nach Form, 2019–2028 (in Mio. USD)
TABELLE 663 VIETNAM – Markt für gefriergetrocknete injizierbare Arzneimittel, nach Indikation, 2019–2028 (in Mio. USD)
TABELLE 664 VIETNAM – Markt für gefriergetrocknete injizierbare Arzneimittel, nach Verabreichungsweg, 2019–2028 (in Mio. USD)
TABELLE 665 VIETNAM – Markt für gefriergetrocknete injizierbare Medikamente, nach Endverbraucher, 2019–2028 (in Mio. USD)
TABELLE 666 VIETNAM – Markt für gefriergetrocknete injizierbare Medikamente, nach Vertriebskanal, 2019–2028 (in Mio. USD)
TABELLE 667 – Restlicher Markt für gefriergetrocknete injizierbare Arzneimittel im asiatisch-pazifischen Raum, nach Verpackung, 2019–2028 (in Mio. USD)
TABELLE 668 Südamerikanischer Markt für gefriergetrocknete injizierbare Medikamente, nach LAND, 2019–2028 (Mio. USD)
TABELLE 669 Südamerikanischer Markt für gefriergetrocknete injizierbare Medikamente, nach Verpackung, 2019–2028 (in Mio. USD)
TABELLE 670 Südamerikanischer Markt für gefriergetrocknete injizierbare Medikamente, nach Medikamentenklasse, 2019–2028 (in Mio. USD)
TABELLE 671 Südamerikanischer Markt für gefriergetrocknete injizierbare Medikamente, nach Medikamentenklasse, 2019–2028 (Einheiten)
TABELLE 672 Südamerikanischer Markt für Antiinfektiva in gefriergetrockneten Injektionsmedikamenten, nach Medikamentenklasse, 2019–2028 (in Mio. USD)
TABELLE 673 Südamerikanischer Markt für Antibiotika in gefriergetrockneten Injektionsmedikamenten, nach Medikamentenklasse, 2019–2028 (in Mio. USD)
TABELLE 674 Südamerikanischer Markt für Antimykotika in gefriergetrockneten Injektionspräparaten, nach Arzneimittelklasse, 2019–2028 (in Mio. USD)
TABELLE 675 Südamerikanischer Markt für antivirale Mittel in gefriergetrockneten Injektionspräparaten, nach Arzneimittelklasse, 2019–2028 (in Mio. USD)
TABELLE 676 Südamerikanischer Markt für Antineoplastika in gefriergetrockneten Injektionspräparaten, nach Arzneimittelklasse, 2019–2028 (in Mio. USD)
TABELLE 677 Südamerikanischer Markt für Diuretika in gefriergetrockneten Injektionsmedikamenten, nach Medikamentenklasse, 2019–2028 (in Mio. USD)
TABELLE 678 Südamerikanischer Markt für Protonenpumpenhemmer in gefriergetrockneten injizierbaren Arzneimitteln, nach Arzneimittelklasse, 2019–2028 (in Mio. USD)
TABELLE 679 Südamerikanischer Markt für Anästhetika in gefriergetrockneten Injektionsmedikamenten, nach Medikamentenklasse, 2019–2028 (in Mio. USD)
TABELLE 680 Südamerikanischer Markt für Antikoagulanzien in gefriergetrockneten injizierbaren Arzneimitteln, nach Arzneimittelklasse, 2019–2028 (in Mio. USD)
TABELLE 681 Südamerikanischer Markt für NSAR in gefriergetrockneten Injektionsmedikamenten, nach Medikamentenklasse, 2019–2028 (in Mio. USD)
TABELLE 682 Südamerikanischer Markt für Kortikosteroide in gefriergetrockneten injizierbaren Arzneimitteln, nach Arzneimittelklasse, 2019–2028 (in Mio. USD)
TABELLE 683 Südamerikanischer Markt für gefriergetrocknete injizierbare Medikamente, nach Form, 2019–2028 (in Mio. USD)
TABELLE 684 Südamerikanischer Markt für gefriergetrocknete injizierbare Medikamente, nach Indikation, 2019–2028 (in Mio. USD)
TABELLE 685 Südamerikanischer Markt für gefriergetrocknete injizierbare Arzneimittel, nach Verabreichungsweg, 2019–2028 (in Mio. USD)
TABELLE 686 Südamerikanischer Markt für gefriergetrocknete injizierbare Medikamente, nach Endverbraucher, 2019–2028 (in Mio. USD)
TABELLE 687 Südamerikanischer Markt für gefriergetrocknete injizierbare Medikamente, nach Vertriebskanal, 2019–2028 (in Mio. USD)
TABELLE 688 Brasilianischer Markt für gefriergetrocknete injizierbare Medikamente, nach Verpackung, 2019–2028 (in Mio. USD)
TABELLE 689 BRASILIEN – Markt für gefriergetrocknete injizierbare Medikamente, nach Medikamentenklasse, 2019–2028 (in Mio. USD)
TABELLE 690 BRASILIEN – Markt für gefriergetrocknete injizierbare Medikamente, nach Medikamentenklasse, 2019–2028 (Einheiten)
TABELLE 691 BRASILIEN – Markt für Antiinfektiva in gefriergetrockneten Injektionsmedikamenten, nach Medikamentenklasse, 2019–2028 (in Mio. USD)
TABELLE 692 BRASILIEN – Markt für Antibiotika in gefriergetrockneten Injektionsmedikamenten, nach Medikamentenklasse, 2019–2028 (in Mio. USD)
TABELLE 693 BRASILIEN – Markt für Antimykotika in gefriergetrockneten Injektionspräparaten, nach Arzneimittelklasse, 2019–2028 (in Mio. USD)
TABELLE 694 BRASILIEN – Markt für antivirale Mittel in gefriergetrockneten Injektionsmedikamenten, nach Medikamentenklasse, 2019–2028 (in Mio. USD)
TABELLE 695 BRASILIEN – Markt für Antineoplastika in gefriergetrockneten Injektionspräparaten, nach Arzneimittelklasse, 2019–2028 (in Mio. USD)
TABELLE 696 BRASILIEN – Markt für Diuretika in gefriergetrockneten Injektionsmedikamenten, nach Medikamentenklasse, 2019–2028 (in Mio. USD)
TABELLE 697 BRASILIEN – Markt für Protonenpumpenhemmer in gefriergetrockneten injizierbaren Arzneimitteln, nach Arzneimittelklasse, 2019–2028 (in Mio. USD)
TABELLE 698 BRASILIEN – Markt für Anästhetika in gefriergetrockneten Injektionsmedikamenten, nach Medikamentenklasse, 2019–2028 (in Mio. USD)
TABELLE 699 BRASILIEN – Markt für Antikoagulanzien in gefriergetrockneten injizierbaren Arzneimitteln, nach Arzneimittelklasse, 2019–2028 (in Mio. USD)
TABELLE 700 BRASILIEN – Markt für NSAR im Bereich gefriergetrockneter Injektionsmedikamente, nach Medikamentenklasse, 2019–2028 (in Millionen USD)
TABELLE 701 BRASILIEN – Markt für Kortikosteroide im gefriergetrockneten injizierbaren Arzneimittel, nach Arzneimittelklasse, 2019–2028 (in Mio. USD)
TABELLE 702 BRASILIEN – Markt für gefriergetrocknete injizierbare Medikamente, nach Form, 2019–2028 (in Mio. USD)
TABELLE 703 BRASILIEN – Markt für gefriergetrocknete injizierbare Arzneimittel, nach Indikation, 2019–2028 (in Mio. USD)
TABELLE 704 BRASILIEN – Markt für gefriergetrocknete injizierbare Arzneimittel, nach Verabreichungsweg, 2019–2028 (in Mio. USD)
TABELLE 705 BRASILIEN – Markt für gefriergetrocknete injizierbare Medikamente, nach Endverbraucher, 2019–2028 (in Mio. USD)
TABELLE 706 BRASILIEN – Markt für lyophilisierte injizierbare Medikamente, nach Vertriebskanal, 2019–2028 (in Mio. USD)
TABELLE 707 Argentinischer Markt für gefriergetrocknete injizierbare Medikamente, nach Verpackung, 2019–2028 (in Mio. USD)
TABELLE 708 ARGENTINIEN: Markt für gefriergetrocknete injizierbare Medikamente, nach Medikamentenklasse, 2019–2028 (in Mio. USD)
TABELLE 709 – ARGENTINIEN – Markt für gefriergetrocknete injizierbare Medikamente, nach Medikamentenklasse, 2019–2028 (Einheiten)
TABELLE 710 ARGENTINIEN – Markt für Antiinfektiva in gefriergetrockneten Injektionsmedikamenten, nach Medikamentenklasse, 2019–2028 (in Mio. USD)
TABELLE 711 ARGENTINIEN – Markt für Antibiotika in gefriergetrockneten Injektionsmedikamenten, nach Medikamentenklasse, 2019–2028 (in Mio. USD)
TABELLE 712 ARGENTINIEN – Markt für Antimykotika in gefriergetrockneten Injektionspräparaten, nach Arzneimittelklasse, 2019–2028 (in Mio. USD)
TABELLE 713 ARGENTINIEN – Markt für antivirale Mittel in gefriergetrockneten Injektionsmedikamenten, nach Medikamentenklasse, 2019–2028 (in Mio. USD)
TABELLE 714 ARGENTINIEN – Markt für Antineoplastika in gefriergetrockneten Injektionspräparaten, nach Arzneimittelklasse, 2019–2028 (in Mio. USD)
TABELLE 715 ARGENTINIEN – Markt für Diuretika in gefriergetrockneten Injektionsmedikamenten, nach Medikamentenklasse, 2019–2028 (in Mio. USD)
TABELLE 716 ARGENTINIEN – Markt für Protonenpumpenhemmer in gefriergetrockneten injizierbaren Arzneimitteln, nach Arzneimittelklasse, 2019–2028 (in Mio. USD)
TABELLE 717 ARGENTINIEN – Markt für Anästhetika in gefriergetrockneten injizierbaren Arzneimitteln, nach Arzneimittelklasse, 2019–2028 (in Mio. USD)
TABELLE 718 ARGENTINIEN – Markt für Antikoagulanzien in gefriergetrockneten injizierbaren Arzneimitteln, nach Arzneimittelklasse, 2019–2028 (in Mio. USD)
TABELLE 719 ARGENTINIEN – Markt für NSAR in gefriergetrockneten Injektionsmedikamenten, nach Medikamentenklasse, 2019–2028 (in Mio. USD)
TABELLE 720 ARGENTINIEN: Markt für Kortikosteroide in gefriergetrockneten injizierbaren Arzneimitteln, nach Arzneimittelklasse, 2019–2028 (in Mio. USD)
TABELLE 721 ARGENTINIEN: Markt für gefriergetrocknete injizierbare Arzneimittel, nach Form, 2019–2028 (in Mio. USD)
TABELLE 722 ARGENTINIEN – Markt für gefriergetrocknete injizierbare Arzneimittel, nach Indikation, 2019–2028 (in Mio. USD)
TABELLE 723 ARGENTINIEN: Markt für gefriergetrocknete injizierbare Arzneimittel, nach Verabreichungsweg, 2019–2028 (in Mio. USD)
TABELLE 724 ARGENTINIEN – Markt für gefriergetrocknete injizierbare Medikamente, nach Endverbraucher, 2019–2028 (in Mio. USD)
TABELLE 725 ARGENTINIEN: Markt für gefriergetrocknete injizierbare Arzneimittel, nach Vertriebskanal, 2019–2028 (in Mio. USD)
TABELLE 726 Peruanischer Markt für gefriergetrocknete injizierbare Medikamente, nach Verpackung, 2019–2028 (in Mio. USD)
TABELLE 727 PERU – Markt für gefriergetrocknete injizierbare Medikamente, nach Medikamentenklasse, 2019–2028 (in Mio. USD)
TABELLE 728 PERU – Markt für gefriergetrocknete injizierbare Medikamente, nach Medikamentenklasse, 2019–2028 (Einheiten)
TABELLE 729 PERU – Markt für Antiinfektiva in gefriergetrockneten Injektionsmedikamenten, nach Medikamentenklasse, 2019–2028 (in Mio. USD)
TABELLE 730 PERU – Markt für Antibiotika in gefriergetrockneten Injektionsmedikamenten, nach Medikamentenklasse, 2019–2028 (in Mio. USD)
TABELLE 731 PERU – Markt für Antimykotika in gefriergetrockneten Injektionspräparaten, nach Arzneimittelklasse, 2019–2028 (in Mio. USD)
TABELLE 732 PERU – Markt für antivirale Mittel in gefriergetrockneten Injektionsmedikamenten, nach Medikamentenklasse, 2019–2028 (in Mio. USD)
TABELLE 733 PERU – Markt für Antineoplastika in gefriergetrockneten Injektionspräparaten, nach Arzneimittelklasse, 2019–2028 (in Mio. USD)
TABELLE 734 PERU: Markt für Diuretika in gefriergetrockneten Injektionsmedikamenten, nach Medikamentenklasse, 2019–2028 (in Mio. USD)
TABELLE 735 PERU – Markt für Protonenpumpenhemmer in gefriergetrockneten Injektionsmedikamenten, nach Medikamentenklasse, 2019–2028 (in Mio. USD)
TABELLE 736 PERU – Markt für Anästhetika in gefriergetrockneten Injektionsmedikamenten, nach Medikamentenklasse, 2019–2028 (in Mio. USD)
TABELLE 737 PERU – Markt für Antikoagulanzien in gefriergetrockneten Injektionsmedikamenten, nach Medikamentenklasse, 2019–2028 (in Mio. USD)
TABELLE 738 PERU – Markt für NSAR in gefriergetrockneten Injektionsmedikamenten, nach Medikamentenklasse, 2019–2028 (in Mio. USD)
TABELLE 739 PERU – Markt für Kortikosteroide in gefriergetrockneten Injektionsmedikamenten, nach Medikamentenklasse, 2019–2028 (in Mio. USD)
TABELLE 740 PERU – Markt für gefriergetrocknete injizierbare Arzneimittel, nach Form, 2019–2028 (in Mio. USD)
TABELLE 741 PERU – Markt für gefriergetrocknete injizierbare Arzneimittel, nach Indikation, 2019–2028 (in Mio. USD)
TABELLE 742 PERU – Markt für gefriergetrocknete injizierbare Arzneimittel, nach Verabreichungsweg, 2019–2028 (in Mio. USD)
TABELLE 743 PERU – Markt für gefriergetrocknete injizierbare Medikamente, nach Endverbraucher, 2019–2028 (in Mio. USD)
TABELLE 744 PERU – Markt für gefriergetrocknete injizierbare Arzneimittel, nach Vertriebskanal, 2019–2028 (in Mio. USD)
TABELLE 745 Restlicher südamerikanischer Markt für gefriergetrocknete injizierbare Arzneimittel, nach Verpackung, 2019–2028 (in Mio. USD)
TABELLE 746 MARKT FÜR LYOPHILISIERTE INJEKTIONSMADINE IM NAHEN OSTEN UND IN AFRIKA, NACH LÄNDERN, 2019–2028 (MILLIONEN USD)
TABELLE 747 Markt für gefriergetrocknete Injektionsmedikamente im Nahen Osten und Afrika, nach Verpackung, 2019–2028 (in Mio. USD)
TABELLE 748 Markt für gefriergetrocknete Injektionsmedikamente im Nahen Osten und Afrika, nach Medikamentenklasse, 2019–2028 (in Mio. USD)
TABELLE 749 Markt für gefriergetrocknete injizierbare Medikamente im Nahen Osten und Afrika, nach Medikamentenklasse, 2019–2028 (Einheiten)
TABELLE 750 Markt für Antiinfektiva in gefriergetrockneten Injektionsmedikamenten im Nahen Osten und Afrika, nach Medikamentenklasse, 2019–2028 (in Mio. USD)
TABELLE 751 Markt für Antibiotika in gefriergetrockneten Injektionsmedikamenten im Nahen Osten und Afrika, nach Medikamentenklasse, 2019–2028 (in Mio. USD)
TABELLE 752 Markt für Antimykotika in gefriergetrockneten Injektionspräparaten im Nahen Osten und Afrika, nach Arzneimittelklasse, 2019–2028 (in Mio. USD)
TABELLE 753 Markt für antivirale Mittel in gefriergetrockneten Injektionsmedikamenten im Nahen Osten und Afrika, nach Medikamentenklasse, 2019–2028 (in Mio. USD)
TABELLE 754 Markt für Antineoplastika in gefriergetrockneten Injektionspräparaten im Nahen Osten und Afrika, nach Arzneimittelklasse, 2019–2028 (in Mio. USD)
TABELLE 755 Markt für Diuretika in gefriergetrockneten Injektionsmedikamenten im Nahen Osten und Afrika, nach Medikamentenklasse, 2019–2028 (in Mio. USD)
TABELLE 756 Markt für Protonenpumpenhemmer in gefriergetrockneten Injektionsmedikamenten im Nahen Osten und Afrika, nach Medikamentenklasse, 2019–2028 (in Mio. USD)
TABELLE 757 Markt für Anästhetika in gefriergetrockneten Injektionsmedikamenten im Nahen Osten und Afrika, nach Medikamentenklasse, 2019–2028 (in Mio. USD)
TABELLE 758 Markt für Antikoagulanzien in gefriergetrockneten Injektionsmedikamenten im Nahen Osten und Afrika, nach Medikamentenklasse, 2019–2028 (in Mio. USD)
TABELLE 759 Markt für NSAR im Nahen Osten und Afrika in gefriergetrockneten Injektionsmedikamenten, nach Medikamentenklasse, 2019–2028 (in Mio. USD)
TABELLE 760 Markt für Kortikosteroide in gefriergetrockneten Injektionsmedikamenten im Nahen Osten und Afrika, nach Medikamentenklasse, 2019–2028 (in Mio. USD)
TABELLE 761 Markt für gefriergetrocknete injizierbare Medikamente im Nahen Osten und Afrika, nach Form, 2019–2028 (in Mio. USD)
TABELLE 762 Markt für gefriergetrocknete injizierbare Arzneimittel im Nahen Osten und Afrika, nach Indikation, 2019–2028 (in Mio. USD)
TABELLE 763 Markt für gefriergetrocknete injizierbare Arzneimittel im Nahen Osten und Afrika, nach Verabreichungsweg, 2019–2028 (in Mio. USD)
TABELLE 764 Markt für gefriergetrocknete injizierbare Medikamente im Nahen Osten und Afrika, nach Endverbraucher, 2019–2028 (in Mio. USD)
TABELLE 765 Markt für gefriergetrocknete injizierbare Medikamente im Nahen Osten und Afrika, nach Vertriebskanal, 2019–2028 (in Mio. USD)
TABELLE 766 Südafrikanischer Markt für gefriergetrocknete injizierbare Medikamente, nach Verpackung, 2019–2028 (in Mio. USD)
TABELLE 767 Südafrikanischer Markt für gefriergetrocknete injizierbare Medikamente, nach Medikamentenklasse, 2019–2028 (in Mio. USD)
TABELLE 768 Südafrikanischer Markt für gefriergetrocknete injizierbare Medikamente, nach Medikamentenklasse, 2019–2028 (Einheiten)
TABELLE 769 Südafrikanischer Markt für Antiinfektiva in gefriergetrockneten Injektionsmedikamenten, nach Medikamentenklasse, 2019–2028 (in Mio. USD)
TABELLE 770 Südafrikanischer Markt für Antibiotika in gefriergetrockneten Injektionsmedikamenten, nach Medikamentenklasse, 2019–2028 (in Mio. USD)
TABELLE 771 Südafrikanischer Markt für Antimykotika in gefriergetrockneten Injektionspräparaten, nach Arzneimittelklasse, 2019–2028 (in Mio. USD)
TABELLE 772 Südafrikanischer Markt für antivirale Mittel in gefriergetrockneten Injektionspräparaten, nach Arzneimittelklasse, 2019–2028 (in Mio. USD)
TABELLE 773 Südafrikanischer Markt für Antineoplastika in gefriergetrockneten Injektionspräparaten, nach Arzneimittelklasse, 2019–2028 (in Mio. USD)
TABELLE 774 Südafrikanischer Markt für Diuretika in gefriergetrockneten Injektionsmedikamenten, nach Medikamentenklasse, 2019–2028 (in Mio. USD)
TABELLE 775 Südafrikanischer Markt für Protonenpumpenhemmer in gefriergetrockneten injizierbaren Arzneimitteln, nach Arzneimittelklasse, 2019–2028 (in Mio. USD)
TABELLE 776 Südafrikanischer Markt für Anästhetika in gefriergetrockneten injizierbaren Arzneimitteln, nach Arzneimittelklasse, 2019–2028 (in Mio. USD)
TABELLE 777 Südafrikanischer Markt für Antikoagulanzien in gefriergetrockneten injizierbaren Arzneimitteln, nach Arzneimittelklasse, 2019–2028 (in Mio. USD)
TABELLE 778 Südafrikanischer Markt für NSAR in gefriergetrockneten Injektionsmedikamenten, nach Medikamentenklasse, 2019–2028 (in Mio. USD)
TABELLE 779 Südafrikanischer Markt für Kortikosteroide in gefriergetrockneten Injektionsmedikamenten, nach Medikamentenklasse, 2019–2028 (in Mio. USD)
TABELLE 780 Südafrikanischer Markt für gefriergetrocknete injizierbare Medikamente, nach Form, 2019–2028 (in Mio. USD)
TABELLE 781 Südafrikanischer Markt für gefriergetrocknete injizierbare Medikamente, nach Indikation, 2019–2028 (in Mio. USD)
TABELLE 782 Südafrikanischer Markt für gefriergetrocknete injizierbare Arzneimittel, nach Verabreichungsweg, 2019–2028 (in Mio. USD)
TABELLE 783 Südafrikanischer Markt für gefriergetrocknete injizierbare Medikamente, nach Endverbraucher, 2019–2028 (in Mio. USD)
TABELLE 784 Südafrikanischer Markt für gefriergetrocknete injizierbare Medikamente, nach Vertriebskanal, 2019–2028 (in Mio. USD)
TABELLE 785 Saudi-Arabien: Markt für gefriergetrocknete injizierbare Medikamente, nach Verpackung, 2019–2028 (in Mio. USD)
TABELLE 786 Saudi-Arabien: Markt für gefriergetrocknete injizierbare Medikamente, nach Medikamentenklasse, 2019–2028 (in Mio. USD)
TABELLE 787 Saudi-Arabien: Markt für gefriergetrocknete injizierbare Medikamente, nach Medikamentenklasse, 2019–2028 (Einheiten)
TABELLE 788 Saudi-Arabien: Markt für Antiinfektiva in gefriergetrockneten Injektionsmedikamenten, nach Medikamentenklasse, 2019–2028 (in Mio. USD)
TABELLE 789 Saudi-Arabien: Markt für Antibiotika in gefriergetrockneten Injektionsmedikamenten, nach Medikamentenklasse, 2019–2028 (in Mio. USD)
TABELLE 790 Saudi-Arabien: Markt für Antimykotika in gefriergetrockneten Injektionspräparaten, nach Arzneimittelklasse, 2019–2028 (in Mio. USD)
TABELLE 791 Saudi-Arabien: Markt für antivirale Mittel in gefriergetrockneten Injektionspräparaten, nach Arzneimittelklasse, 2019–2028 (in Mio. USD)
TABELLE 792 Saudi-Arabien: Markt für Antineoplastika in gefriergetrockneten Injektionspräparaten, nach Arzneimittelklasse, 2019–2028 (in Mio. USD)
TABELLE 793 Saudi-Arabien: Markt für Diuretika in gefriergetrockneten Injektionsmedikamenten, nach Medikamentenklasse, 2019–2028 (in Mio. USD)
TABELLE 794 Saudi-Arabien: Markt für Protonenpumpenhemmer in gefriergetrockneten Injektionsmedikamenten, nach Medikamentenklasse, 2019–2028 (in Mio. USD)
TABELLE 795 Saudi-Arabien: Markt für Anästhetika in gefriergetrockneten Injektionsmedikamenten, nach Medikamentenklasse, 2019–2028 (in Mio. USD)
TABELLE 796 Saudi-Arabien: Markt für Antikoagulanzien in gefriergetrockneten Injektionsmedikamenten, nach Medikamentenklasse, 2019–2028 (in Mio. USD)
TABELLE 797 Saudi-Arabien: NSAR auf dem Markt für gefriergetrocknete Injektionsmedikamente, nach Medikamentenklasse, 2019–2028 (in Millionen USD)
TABELLE 798 Saudi-Arabien: Markt für Kortikosteroide in gefriergetrockneten Injektionsmedikamenten, nach Medikamentenklasse, 2019–2028 (in Mio. USD)
TABELLE 799 Saudi-Arabien: Markt für gefriergetrocknete injizierbare Medikamente, nach Form, 2019–2028 (in Mio. USD)
TABELLE 800 – Saudi-Arabien: Markt für gefriergetrocknete injizierbare Arzneimittel, nach Indikation, 2019–2028 (in Mio. USD)
TABELLE 801 Saudi-Arabien: Markt für gefriergetrocknete injizierbare Arzneimittel, nach Verabreichungsweg, 2019–2028 (in Mio. USD)
TABELLE 802 Markt für gefriergetrocknete injizierbare Medikamente in Saudi-Arabien, nach Endverbraucher, 2019–2028 (in Mio. USD)
TABELLE 803 Saudi-Arabien: Markt für gefriergetrocknete injizierbare Medikamente, nach Vertriebskanal, 2019–2028 (in Mio. USD)
TABELLE 804 Markt für gefriergetrocknete injizierbare Medikamente in den VAE, nach Verpackung, 2019–2028 (in Mio. USD)
TABELLE 805 Markt für gefriergetrocknete injizierbare Medikamente in den VAE, nach Medikamentenklasse, 2019–2028 (in Mio. USD)
TABELLE 806 Markt für gefriergetrocknete injizierbare Medikamente in den VAE, nach Medikamentenklasse, 2019–2028 (Einheiten)
TABELLE 807 Markt für Antiinfektiva in gefriergetrockneten Injektionsmedikamenten in den VAE, nach Medikamentenklasse, 2019–2028 (in Mio. USD)
TABELLE 808 Markt für Antibiotika in gefriergetrockneten Injektionsmedikamenten in den VAE, nach Medikamentenklasse, 2019–2028 (in Mio. USD)
TABELLE 809 Markt für Antimykotika in gefriergetrockneten Injektionspräparaten in den VAE, nach Arzneimittelklasse, 2019–2028 (in Mio. USD)
TABELLE 810 Markt für antivirale Mittel in gefriergetrockneten Injektionsmedikamenten in den VAE, nach Medikamentenklasse, 2019–2028 (in Mio. USD)
TABELLE 811 Markt für Antineoplastika in gefriergetrockneten Injektionspräparaten in den VAE, nach Arzneimittelklasse, 2019–2028 (in Mio. USD)
TABELLE 812 Markt für Diuretika in gefriergetrockneten Injektionsmedikamenten in den VAE, nach Medikamentenklasse, 2019–2028 (in Mio. USD)
TABELLE 813 Markt für Protonenpumpenhemmer in gefriergetrockneten Injektionsmedikamenten in den VAE, nach Medikamentenklasse, 2019–2028 (in Mio. USD)
TABELLE 814 Markt für Anästhetika in gefriergetrockneten Injektionsmedikamenten in den VAE, nach Medikamentenklasse, 2019–2028 (in Mio. USD)
TABELLE 815 Markt für Antikoagulanzien in gefriergetrockneten Injektionsmedikamenten in den VAE, nach Medikamentenklasse, 2019–2028 (in Mio. USD)
TABELLE 816 Markt für NSAR in gefriergetrockneten Injektionsmedikamenten in den VAE, nach Medikamentenklasse, 2019–2028 (in Mio. USD)
TABELLE 817 Markt für Kortikosteroide in gefriergetrockneten Injektionsmedikamenten in den VAE, nach Medikamentenklasse, 2019–2028 (in Mio. USD)
TABELLE 818 Markt für gefriergetrocknete injizierbare Medikamente in den VAE, nach Form, 2019–2028 (in Mio. USD)
TABELLE 819 Markt für gefriergetrocknete injizierbare Arzneimittel in den VAE, nach Indikation, 2019–2028 (in Mio. USD)
TABELLE 820 Markt für gefriergetrocknete injizierbare Arzneimittel in den VAE, nach Verabreichungsweg, 2019–2028 (in Mio. USD)
TABELLE 821 Markt für gefriergetrocknete injizierbare Medikamente in den VAE, nach Endverbraucher, 2019–2028 (in Mio. USD)
TABELLE 822 Markt für gefriergetrocknete injizierbare Arzneimittel in den VAE, nach Vertriebskanal, 2019–2028 (in Mio. USD)
TABELLE 823 ÄGYPTEN: Markt für gefriergetrocknete injizierbare Medikamente, nach Verpackung, 2019–2028 (in Mio. USD)
TABELLE 824 ÄGYPTEN: Markt für gefriergetrocknete injizierbare Medikamente, nach Medikamentenklasse, 2019–2028 (in Mio. USD)
TABELLE 825 ÄGYPTEN – Markt für gefriergetrocknete injizierbare Medikamente, nach Medikamentenklasse, 2019–2028 (Einheiten)
TABELLE 826 ÄGYPTEN – Markt für Antiinfektiva in gefriergetrockneten Injektionsmedikamenten, nach Medikamentenklasse, 2019–2028 (in Mio. USD)
TABELLE 827 ÄGYPTEN – Markt für Antibiotika in gefriergetrockneten Injektionsmedikamenten, nach Medikamentenklasse, 2019–2028 (in Mio. USD)
TABELLE 828 ÄGYPTEN – Markt für Antimykotika in gefriergetrockneten Injektionspräparaten, nach Arzneimittelklasse, 2019–2028 (in Mio. USD)
TABELLE 829 ÄGYPTEN – Markt für antivirale Mittel in gefriergetrockneten Injektionsmedikamenten, nach Medikamentenklasse, 2019–2028 (in Mio. USD)
TABELLE 830 ÄGYPTEN – Markt für Antineoplastika in gefriergetrockneten Injektionspräparaten, nach Arzneimittelklasse, 2019–2028 (in Mio. USD)
TABELLE 831 ÄGYPTEN: Markt für Diuretika in gefriergetrockneten Injektionsmedikamenten, nach Medikamentenklasse, 2019–2028 (in Mio. USD)
TABELLE 832 ÄGYPTEN – Markt für Protonenpumpenhemmer in gefriergetrockneten injizierbaren Arzneimitteln, nach Arzneimittelklasse, 2019–2028 (in Mio. USD)
TABELLE 833 ÄGYPTEN: Markt für Anästhetika in gefriergetrockneten Injektionsmedikamenten, nach Medikamentenklasse, 2019–2028 (in Mio. USD)
TABELLE 834 ÄGYPTEN – Markt für Antikoagulanzien in gefriergetrockneten Injektionsmedikamenten, nach Medikamentenklasse, 2019–2028 (in Mio. USD)
TABELLE 835 ÄGYPTEN – Markt für NSAR im Bereich gefriergetrockneter Injektionsmedikamente, nach Medikamentenklasse, 2019–2028 (in Mio. USD)
TABELLE 836 ÄGYPTEN – Markt für Kortikosteroide im gefriergetrockneten injizierbaren Arzneimittel, nach Arzneimittelklasse, 2019–2028 (in Mio. USD)
TABELLE 837 ÄGYPTEN: Markt für gefriergetrocknete injizierbare Medikamente, nach Form, 2019–2028 (in Mio. USD)
TABELLE 838 ÄGYPTEN – Markt für gefriergetrocknete injizierbare Arzneimittel, nach Indikation, 2019–2028 (in Mio. USD)
TABELLE 839 ÄGYPTEN: Markt für gefriergetrocknete injizierbare Arzneimittel, nach Verabreichungsweg, 2019–2028 (in Mio. USD)
TABELLE 840 ÄGYPTEN – Markt für gefriergetrocknete injizierbare Medikamente, nach Endverbraucher, 2019–2028 (in Mio. USD)
TABELLE 841 ÄGYPTEN: Markt für lyophilisierte injizierbare Medikamente, nach Vertriebskanal, 2019–2028 (in Mio. USD)
TABELLE 842 KUWAIT – Markt für gefriergetrocknete injizierbare Medikamente, nach Verpackung, 2019–2028 (in Mio. USD)
TABELLE 843 KUWAIT – Markt für gefriergetrocknete injizierbare Medikamente, nach Medikamentenklasse, 2019–2028 (in Mio. USD)
TABELLE 844 KUWAIT – Markt für gefriergetrocknete injizierbare Medikamente, nach Medikamentenklasse, 2019–2028 (Einheiten)
TABELLE 845 KUWAIT – Markt für Antiinfektiva im Bereich gefriergetrockneter injizierbarer Medikamente, nach Medikamentenklasse, 2019–2028 (in Mio. USD)
TABELLE 846 KUWAIT – Markt für Antibiotika im Bereich gefriergetrockneter injizierbarer Medikamente, nach Medikamentenklasse, 2019–2028 (in Mio. USD)
TABELLE 847 KUWAIT – Markt für Antimykotika in gefriergetrockneten Injektionspräparaten, nach Arzneimittelklasse, 2019–2028 (in Mio. USD)
TABELLE 848 KUWAIT – Markt für antivirale Mittel in gefriergetrockneten Injektionsmedikamenten, nach Medikamentenklasse, 2019–2028 (in Mio. USD)
TABELLE 849 KUWAIT – Markt für Antineoplastika in gefriergetrockneten Injektionspräparaten, nach Arzneimittelklasse, 2019–2028 (in Mio. USD)
TABELLE 850 KUWAIT – Markt für Diuretika im gefriergetrockneten Injektionspräparat, nach Arzneimittelklasse, 2019–2028 (in Mio. USD)
TABELLE 851 KUWAIT – Markt für Protonenpumpenhemmer in gefriergetrockneten injizierbaren Arzneimitteln, nach Arzneimittelklasse, 2019–2028 (in Mio. USD)
TABELLE 852 KUWAIT – Markt für Anästhetika in gefriergetrockneten Injektionsmedikamenten, nach Medikamentenklasse, 2019–2028 (in Mio. USD)
TABELLE 853 KUWAIT – Markt für Antikoagulanzien in gefriergetrockneten Injektionsmedikamenten, nach Medikamentenklasse, 2019–2028 (in Mio. USD)
TABELLE 854 KUWAIT – Markt für NSAR im Bereich gefriergetrocknete Injektionspräparate, nach Arzneimittelklasse, 2019–2028 (in Mio. USD)
TABELLE 855 KUWAIT – Markt für Kortikosteroide im Bereich gefriergetrockneter injizierbarer Medikamente, nach Medikamentenklasse, 2019–2028 (in Mio. USD)
TABELLE 856 KUWAIT – Markt für gefriergetrocknete injizierbare Medikamente, nach Form, 2019–2028 (in Mio. USD)
TABELLE 857 KUWAIT – Markt für gefriergetrocknete injizierbare Medikamente, nach Indikation, 2019–2028 (in Mio. USD)
TABELLE 858 KUWAIT – Markt für gefriergetrocknete injizierbare Medikamente, nach Verabreichungsweg, 2019–2028 (in Mio. USD)
TABELLE 859 KUWAIT – Markt für gefriergetrocknete injizierbare Medikamente, nach Endverbraucher, 2019–2028 (in Mio. USD)
TABELLE 860 KUWAIT – Markt für gefriergetrocknete injizierbare Medikamente, nach Vertriebskanal, 2019–2028 (in Mio. USD)
TABELLE 861 ISRAEL: Markt für gefriergetrocknete injizierbare Medikamente, nach Verpackung, 2019–2028 (in Mio. USD)
TABELLE 862 ISRAEL: Markt für gefriergetrocknete injizierbare Medikamente, nach Medikamentenklasse, 2019–2028 (in Mio. USD)
TABELLE 863 ISRAEL – Markt für gefriergetrocknete injizierbare Medikamente, nach Medikamentenklasse, 2019–2028 (Einheiten)
TABELLE 864 ISRAEL – Markt für Antiinfektiva in gefriergetrockneten Injektionsmedikamenten, nach Medikamentenklasse, 2019–2028 (in Mio. USD)
TABLE 865 ISRAEL Antibiotics in Lyophilized Injectable Drugs Market, By Drug Class, 2019-2028 (USD Million)
TABLE 866 ISRAEL Antifungal in Lyophilized Injectable Drugs Market, By Drug Class, 2019-2028 (USD Million)
TABLE 867 ISRAEL Antiviral in Lyophilized Injectable Drugs Market, By Drug Class, 2019-2028 (USD Million)
TABLE 868 ISRAEL Antineoplastic in Lyophilized Injectable Drugs Market, By Drug Class, 2019-2028 (USD Million)
TABLE 869 ISRAEL Diuretics in Lyophilized Injectable Drugs Market, By Drug Class, 2019-2028 (USD Million)
TABLE 870 ISRAEL Proton Pump Inhibitor in Lyophilized Injectable Drugs Market, By Drug Class, 2019-2028 (USD Million)
TABLE 871 ISRAEL Anesthetic in Lyophilized Injectable Drugs Market, By Drug Class, 2019-2028 (USD Million)
TABLE 872 ISRAEL Anticoagulant in Lyophilized Injectable Drugs Market, By Drug Class, 2019-2028 (USD Million)
TABLE 873 ISRAEL Nsaid’s in Lyophilized Injectable Drugs Market, By Drug Class, 2019-2028 (USD Million)
TABLE 874 ISRAEL Corticosteroids in Lyophilized Injectable Drugs Market, By Drug Class, 2019-2028 (USD Million)
TABLE 875 ISRAEL Lyophilized Injectable Drugs Market, By Form, 2019-2028 (USD Million)
TABLE 876 ISRAEL Lyophilized Injectable Drugs Market, By Indication, 2019-2028 (USD Million)
TABLE 877 ISRAEL Lyophilized Injectable Drugs Market, By Route of Administration, 2019-2028 (USD Million)
TABLE 878 ISRAEL Lyophilized Injectable Drugs Market, By End User, 2019-2028 (USD Million)
TABLE 879 ISRAEL Lyophilized Injectable Drugs Market, By Distribution Channel, 2019-2028 (USD Million)
TABLE 880 REST OF MIDDLE EAST & AFRICA Lyophilized Injectable Drugs Market, By Packaging, 2019-2028 (USD Million)
Abbildungsverzeichnis
FIGURE 1 Global LYOPHILIZED INJECTABLE DRUGS MARKET: SEGMENTATION
FIGURE 2 GLOBAL LYOPHILIZED INJECTABLE DRUGS MARKET: DATA TRIANGULATION
FIGURE 3 global Lyophilized injectable drugs market: DROC ANALYSIS
FIGURE 4 Global Lyophilized injectable drugs market: Global VS. REGIONAL MARKET ANALYSIS
FIGURE 5 Global Lyophilized injectable drugs market: COMPANY RESEARCH ANALYSIS
FIGURE 6 GLOBAL Lyophilized injectable drugs market: MULTIVARIATE MODELLING
FIGURE 7 GLOBAL Lyophilized injectable drugs market: INTERVIEW DEMOGRAPHICS
FIGURE 8 GLOBAL LYOPHILIZED INJECTABLE DRUGS MARKET: DBMR MARKET POSITION GRID
FIGURE 9 GLOBAL LYOPHILIZED INJECTABLE DRUGS MARKET: VENDOR SHARE ANALYSIS
FIGURE 10 GLOBAL lyophilized injectable drugs market: MARKET end user COVERAGE GRID
FIGURE 11 Global Lyophilized injectable drugs market: SEGMENTATION
FIGURE 12 NORTH AMERICA is expected to DOMINATE THE GLOBAL Lyophilized injectable drugs market AND ASIA-PACIFIC IS EXPECTED TO GROW WITH THE HIGHEST CAGR IN THE FORECAST PERIOD OF 2021 TO 2028
FIGURE 13 rise in chronic health conditions is expected to DRIVe THE global Lyophilized injectable drugs market IN THE FORECAST PERIOD OF 2021 to 2028
FIGURE 14 vials SEGMENT is expected to account for the largest share of the global LYOPHILIZED INJECTABLE DRUGS MARKET in 2021 & 2028
FIGURE 15 ASIA-PACIFIC is the fastest growing market FOR the Lyophilized injectable drugs MANUFACTURERS IN THE FORECAST PERIOD OF 2021 TO 2028
FIGURE 16 DRIVERS, RESTRAINTS, OPPORTUNITIES, AND CHALLENGES OF Global LYOPHILIZED INJECTABLE DRUGS Market
FIGURE 17 Global lyophilized injectable drugs market: By packaging, 2020
FIGURE 18 Global lyophilized injectable drugs market: By packaging, 2021-2028 (USD Million)
FIGURE 19 Global lyophilized injectable drugs market: By packaging, CAGR (2021-2028)
FIGURE 20 Global lyophilized injectable drugs market: By packaging, LIFELINE CURVE
FIGURE 21 global lyophilized injectable drugs market: By drug class, 2020
FIGURE 22 global lyophilized injectable drugs market: By drug class, 2021-2028 (USD Million)
FIGURE 23 global lyophilized injectable drugs market: By drug class, CAGR (2021-2028)
FIGURE 24 global lyophilized injectable drugs market: By drug class, LIFELINE CURVE
FIGURE 25 global lyophilized injectable drugs market: By form, 2020
FIGURE 26 global lyophilized injectable drugs market: By form, 2021-2028 (USD Million)
FIGURE 27 global lyophilized injectable drugs market: By form, CAGR (2021-2028)
FIGURE 28 global lyophilized injectable drugs market: By form, LIFELINE CURVE
FIGURE 29 Global lyophilized injectable drugs market: By indication, 2020
FIGURE 30 Global lyophilized injectable drugs market: By indication, 2021-2028 (USD Million)
FIGURE 31 Global lyophilized injectable drugs market: By indication, CAGR (2021-2028)
FIGURE 32 Global lyophilized injectable drugs market: By indication, LIFELINE CURVE
FIGURE 33 Global lyophilized injectable drugs market: By Route of administration, 2020
FIGURE 34 Global lyophilized injectable drugs market: By Route of administration, 2021-2028 (USD Million)
FIGURE 35 Global lyophilized injectable drugs market: By Route of administration, CAGR (2021-2028)
FIGURE 36 Global lyophilized injectable drugs market: By Route of administration, LIFELINE CURVE
FIGURE 37 Global lyophilized injectable drugs market: By end user, 2020
FIGURE 38 Global lyophilized injectable drugs market: By end user, 2021-2028 (USD Million)
FIGURE 39 Global lyophilized injectable drugs market: By end user, CAGR (2021-2028)
FIGURE 40 Global lyophilized injectable drugs market: By end user, LIFELINE CURVE
FIGURE 41 global lyophilized injectable drugs market: By distribution channel, 2020
FIGURE 42 global lyophilized injectable drugs market: By distribution channel, 2021-2028 (USD Million)
FIGURE 43 global lyophilized injectable drugs market: By distribution channel, CAGR (2021-2028)
FIGURE 44 global lyophilized injectable drugs market: By distribution channel, LIFELINE CURVE
FIGURE 45 global lyophilized injectable drugs MARKET: SNAPSHOT (2020)
FIGURE 46 global lyophilized injectable drugs MARKET: BY REGION (2020)
FIGURE 47 global lyophilized injectable drugs MARKET: BY REGION (2021 & 2028)
FIGURE 48 global lyophilized injectable drugs MARKET: BY REGION (2020 & 2028)
FIGURE 49 global lyophilized injectable drugs MARKET: BY Packaging (2021-2028)
FIGURE 50 North America lyophilized injectable drugs MARKET: SNAPSHOT (2020)
FIGURE 51 North America lyophilized injectable drugs MARKET: BY COUNTRY (2020)
FIGURE 52 North America lyophilized injectable drugs MARKET: BY COUNTRY (2021 & 2028)
FIGURE 53 North America lyophilized injectable drugs MARKET: BY COUNTRY (2020 & 2028)
FIGURE 54 North America lyophilized injectable drugs MARKET: BY packaging (2021-2028)
FIGURE 55 EUROPE LYOPHILIZED INJECTABLE DRUGS MARKET: SNAPSHOT (2020)
FIGURE 56 EUROPE LYOPHILIZED INJECTABLE DRUGS MARKET: BY COUNTRY (2020)
FIGURE 57 EUROPE LYOPHILIZED INJECTABLE DRUGS MARKET: BY COUNTRY (2021 & 2028)
FIGURE 58 EUROPE LYOPHILIZED INJECTABLE DRUGS MARKET: BY COUNTRY (2020 & 2028)
FIGURE 59 EUROPE LYOPHILIZED INJECTABLE DRUGS MARKET: BY TYPE (2021-2028)
FIGURE 60 Asia-Pacific lyophilized injectable drugs MARKET: SNAPSHOT (2020)
FIGURE 61 Asia-Pacific lyophilized injectable drugs MARKET: BY COUNTRY (2020)
FIGURE 62 Asia-Pacific lyophilized injectable drugs MARKET: BY COUNTRY (2021 & 2028)
FIGURE 63 Asia-Pacific lyophilized injectable drugs MARKET: BY COUNTRY (2020 & 2028)
FIGURE 64 Asia-Pacific lyophilized injectable drugs MARKET: BY packaging (2021-2028)
FIGURE 65 South America lyophilized injectable drugs MARKET: SNAPSHOT (2020)
FIGURE 66 South America lyophilized injectable drugs MARKET: BY COUNTRY (2020)
FIGURE 67 South America lyophilized injectable drugs MARKET: BY COUNTRY (2021 & 2028)
FIGURE 68 South America lyophilized injectable drugs MARKET: BY COUNTRY (2020 & 2028)
FIGURE 69 South America lyophilized injectable drugs MARKET: BY packaging (2021-2028)
FIGURE 70 MIDDLE EAST & AFRICA Lyophilized injectable drugs market: SNAPSHOT (2020)
FIGURE 71 MIDDLE EAST & AFRICA Lyophilized injectable drugs market: BY COUNTRY (2020)
FIGURE 72 MIDDLE EAST & AFRICA Lyophilized injectable drugs market: BY COUNTRY (2021 & 2028)
FIGURE 73 MIDDLE EAST & AFRICA Lyophilized injectable drugs market: BY COUNTRY (2020 & 2028)
FIGURE 74 MIDDLE EAST & AFRICA Lyophilized injectable drugs market: BY Packaging (2021-2028)
FIGURE 75 Global Lyophilized Injectable Drugs Market: company share 2020 (%)
FIGURE 76 North America Lyophilized Injectable Drugs Market: company share 2020 (%)
FIGURE 77 Europe Lyophilized Injectable Drugs Market: company share 2020 (%)
FIGURE 78 Asia-Pacific Lyophilized Injectable Drugs Market: company share 2020 (%)
Forschungsmethodik
Die Datenerfassung und Basisjahresanalyse werden mithilfe von Datenerfassungsmodulen mit großen Stichprobengrößen durchgeführt. Die Phase umfasst das Erhalten von Marktinformationen oder verwandten Daten aus verschiedenen Quellen und Strategien. Sie umfasst die Prüfung und Planung aller aus der Vergangenheit im Voraus erfassten Daten. Sie umfasst auch die Prüfung von Informationsinkonsistenzen, die in verschiedenen Informationsquellen auftreten. Die Marktdaten werden mithilfe von marktstatistischen und kohärenten Modellen analysiert und geschätzt. Darüber hinaus sind Marktanteilsanalyse und Schlüsseltrendanalyse die wichtigsten Erfolgsfaktoren im Marktbericht. Um mehr zu erfahren, fordern Sie bitte einen Analystenanruf an oder geben Sie Ihre Anfrage ein.
Die wichtigste Forschungsmethodik, die vom DBMR-Forschungsteam verwendet wird, ist die Datentriangulation, die Data Mining, die Analyse der Auswirkungen von Datenvariablen auf den Markt und die primäre (Branchenexperten-)Validierung umfasst. Zu den Datenmodellen gehören ein Lieferantenpositionierungsraster, eine Marktzeitlinienanalyse, ein Marktüberblick und -leitfaden, ein Firmenpositionierungsraster, eine Patentanalyse, eine Preisanalyse, eine Firmenmarktanteilsanalyse, Messstandards, eine globale versus eine regionale und Lieferantenanteilsanalyse. Um mehr über die Forschungsmethodik zu erfahren, senden Sie eine Anfrage an unsere Branchenexperten.
Anpassung möglich
Data Bridge Market Research ist ein führendes Unternehmen in der fortgeschrittenen formativen Forschung. Wir sind stolz darauf, unseren bestehenden und neuen Kunden Daten und Analysen zu bieten, die zu ihren Zielen passen. Der Bericht kann angepasst werden, um Preistrendanalysen von Zielmarken, Marktverständnis für zusätzliche Länder (fordern Sie die Länderliste an), Daten zu klinischen Studienergebnissen, Literaturübersicht, Analysen des Marktes für aufgearbeitete Produkte und Produktbasis einzuschließen. Marktanalysen von Zielkonkurrenten können von technologiebasierten Analysen bis hin zu Marktportfoliostrategien analysiert werden. Wir können so viele Wettbewerber hinzufügen, wie Sie Daten in dem von Ihnen gewünschten Format und Datenstil benötigen. Unser Analystenteam kann Ihnen auch Daten in groben Excel-Rohdateien und Pivot-Tabellen (Fact Book) bereitstellen oder Sie bei der Erstellung von Präsentationen aus den im Bericht verfügbaren Datensätzen unterstützen.

