Global Lyophilized Injectable Drugs Market
حجم السوق بالمليار دولار أمريكي
CAGR :
% 
 USD
3.39 Billion
USD
5.49 Billion
2024
2032
USD
3.39 Billion
USD
5.49 Billion
2024
2032
| 2025 –2032 | |
| USD 3.39 Billion | |
| USD 5.49 Billion | |
| % | |
|
تجزئة سوق الأدوية المجففة بالتجميد القابلة للحقن عالميًا، حسب التعبئة والتغليف (القوارير، والمحاقن ثنائية الغرف، والخراطيش ثنائية الغرف، والتعبئة والتغليف المتخصصة، وإعادة التركيب في نقطة الرعاية، والقوارير للاستخدام مرة واحدة، وغيرها)، ونوع التسليم (أجهزة أحادية الخطوة، وأجهزة متعددة الخطوات، ومحاقن مخففة مسبقة التعبئة، وأجهزة إعادة التركيب الملكية)، وفئة الدواء (مضاد للعدوى، ومضاد للأورام، ومدر للبول، ومثبط لمضخة البروتون، ومخدر، ومضاد للتخثر، ومضادات الالتهاب غير الستيرويدية، والكورتيكوستيرويدات، وغيرها)، والشكل (مسحوق وسائل)، والمؤشر (الأورام، وأمراض المناعة الذاتية، والاضطرابات الهرمونية، والحالات الأيضية، وأمراض الجهاز التنفسي، واضطرابات الجهاز الهضمي، والاضطرابات الجلدية، وأمراض العيون، والأمراض المعدية ، وغيرها)، ومسار العلاج. الإدارة (الوريدية/الحقن الوريدي، العضلية وغيرها)، المستخدم النهائي (المستشفيات، العيادات، مراكز الجراحة الخارجية ، الرعاية الصحية المنزلية وغيرها)، قناة التوزيع (العطاء المباشر، مبيعات التجزئة وغيرها) - اتجاهات الصناعة وتوقعاتها حتى عام 2032
حجم سوق الأدوية المجففة بالتجميد القابلة للحقن
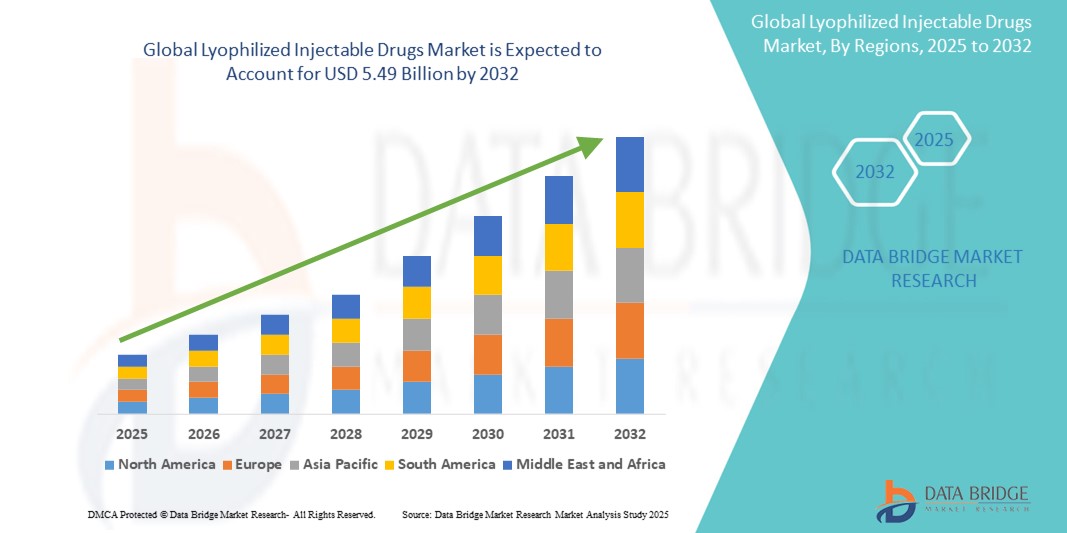
- تم تقييم حجم سوق الأدوية المجففة بالتجميد القابلة للحقن العالمية بنحو 3.39 مليار دولار أمريكي في عام 2024 ومن المتوقع أن يصل إلى 5.49 مليار دولار أمريكي بحلول عام 2032، بمعدل نمو سنوي مركب قدره 6.2٪ خلال الفترة المتوقعة.
- يتم دعم نمو السوق إلى حد كبير من خلال التبني المتزايد للمستحضرات الصيدلانية المتقدمة والتقدم التكنولوجي في تقنيات التجفيف بالتجميد، مما يؤدي إلى تعزيز استقرار الدواء وإطالة مدة الصلاحية وتحسين قابلية النقل عبر إعدادات الرعاية الصحية العالمية.
- علاوة على ذلك، فإن الطلب المتزايد على تركيبات حقن أكثر استقرارًا وفعالية - وخاصةً للأدوية البيولوجية واللقاحات والعلاجات المضادة للعدوى - يُرسّخ مكانة الأدوية المجففة بالتجميد القابلة للحقن كخيار مفضل لدى مقدمي الرعاية الصحية. تُسرّع هذه العوامل المتقاربة من الإقبال على حلول الأدوية المجففة بالتجميد القابلة للحقن، مما يُعزز نمو هذه الصناعة بشكل كبير.
تحليل سوق الأدوية المجففة بالتجميد القابلة للحقن
- أصبحت الأدوية المجففة بالتجميد القابلة للحقن، والمعروفة بثباتها المعزز وعمرها الافتراضي الأطول وسهولة نقلها، ضرورية بشكل متزايد في توصيل المواد البيولوجية والمضادات الحيوية واللقاحات وعلاجات الأورام في كل من المستشفيات ومؤسسات الرعاية المتخصصة بسبب قابليتها للاستخدام على نطاق واسع وتقليل الاعتماد على سلسلة التبريد.
- الطلب المتزايد على الأدوية المجففة بالتجميد القابلة للحقن مدفوع في المقام الأول بالانتشار المتزايد للأمراض المزمنة، والحاجة المتزايدة للإعطاء الوريدي للبيولوجيا المعقدة، وخط أنابيب الأدوية الحيوية المتنامي الذي يستهدف الأمراض المعدية والمناعة الذاتية.
- سيطرت أمريكا الشمالية على سوق الأدوية القابلة للحقن المجففة بالتجميد بأكبر حصة إيرادات بلغت 38.7% في عام 2024، وهو ما تميز بالحضور القوي لمراكز تصنيع الأدوية والبنية التحتية المتقدمة للرعاية الصحية والاعتماد الواسع النطاق على تقنيات توصيل الأدوية الجديدة، وخاصة في الولايات المتحدة، التي تقود موافقات إدارة الغذاء والدواء على التركيبات المجففة بالتجميد والاستثمارات في بدائل لوجستيات سلسلة التبريد.
- من المتوقع أن تكون منطقة آسيا والمحيط الهادئ أسرع المناطق نموًا في سوق الأدوية القابلة للحقن المجففة بالتجميد، ومن المتوقع أن تتوسع بمعدل نمو سنوي مركب قدره 10.6٪ من عام 2025 إلى عام 2032، مدفوعة بالتوسع الحضري المتزايد، والنمو السريع في الاستعانة بمصادر خارجية للأدوية، وارتفاع معدل الإصابة بالأمراض المعدية، وتحسين الوصول إلى الرعاية الصحية في الاقتصادات الناشئة مثل الصين والهند.
- هيمن قطاع الأدوية المضادة للعدوى على سوق الأدوية القابلة للحقن المجففة بالتجميد بحصة سوقية بلغت 41.3% في عام 2024، مدفوعًا بالعبء المتزايد لمقاومة مضادات الميكروبات والاستخدام المتزايد للمستحضرات المجففة بالتجميد في الرعاية الحرجة والحالات الطارئة نظرًا لعمرها الافتراضي الطويل وسهولة إعادة تكوينها.
نطاق التقرير وتجزئة سوق الأدوية المجففة بالتجميد القابلة للحقن
|
صفات |
رؤى رئيسية حول سوق الأدوية المجففة بالتجميد القابلة للحقن |
|
القطاعات المغطاة |
|
|
الدول المغطاة |
أمريكا الشمالية
أوروبا
آسيا والمحيط الهادئ
الشرق الأوسط وأفريقيا
أمريكا الجنوبية
|
|
اللاعبون الرئيسيون في السوق |
|
|
فرص السوق |
|
|
مجموعات معلومات البيانات ذات القيمة المضافة |
بالإضافة إلى الرؤى حول سيناريوهات السوق مثل القيمة السوقية ومعدل النمو والتجزئة والتغطية الجغرافية واللاعبين الرئيسيين، فإن تقارير السوق التي تم تنظيمها بواسطة Data Bridge Market Research تشمل أيضًا تحليلًا متعمقًا من الخبراء، وتحليل التسعير، وتحليل حصة العلامة التجارية، واستطلاع رأي المستهلكين، وتحليل التركيبة السكانية، وتحليل سلسلة التوريد، وتحليل سلسلة القيمة، ونظرة عامة على المواد الخام / المواد الاستهلاكية، ومعايير اختيار البائعين، وتحليل PESTLE، وتحليل Porter، والإطار التنظيمي. |
اتجاهات سوق الأدوية المجففة بالتجميد القابلة للحقن
"التطورات في تقنيات توصيل الأدوية تُحفّز تحوّل السوق"
- من الاتجاهات المهمة والمتسارعة في سوق الأدوية المجففة بالتجميد القابلة للحقن عالميًا دمج تقنيات توصيل الأدوية المبتكرة وأنظمة إعادة التركيب، بهدف تحسين راحة المرضى والتزامهم بالعلاج واستقرار الدواء. يُحدث هذا التطور التكنولوجي تحولًا في طريقة تخزين الأدوية القابلة للحقن وتداولها وإعطائها، لا سيما في البيئات السريرية والرعاية المنزلية.
- على سبيل المثال، يتيح تطوير المحاقن والخراطيش ثنائية الغرف تخزين الدواء المجفف بالتجميد والمخفف بشكل منفصل وخلطهما قبل الاستخدام مباشرةً. يضمن هذا فعالية الدواء ويُبسّط عملية التحضير لمقدمي الرعاية الصحية والمرضى على حد سواء. تُعدّ شركات مثل SCHOTT وWest Pharmaceutical Services رائدة في أنظمة إعادة التحضير سهلة الاستخدام لتقليل الأخطاء وتبسيط الاستخدام.
- تزداد شعبية أجهزة إعادة التركيب ذات الخطوة الواحدة والمسجلة الملكية في علاجات الأمراض المزمنة، حيث توفر جرعات دقيقة وتقلل الحاجة إلى تحضير يدوي معقد. تُعد هذه التقنيات مفيدة بشكل خاص في حالات الرعاية الصحية المنزلية، حيث تُمكّن المرضى من إعطاء العلاجات بأنفسهم مع الحد الأدنى من الإشراف، مما يُقلل من زيارات المستشفى.
- تكتسب حلول التغليف الذكية، التي توفر مؤشراتٍ على إعادة التكوين وانتهاء الصلاحية بشكل صحيح، زخمًا متزايدًا، مما يعزز مستوى سلامة الحقن المجففة بالتجميد. ويدعم دمج التصاميم المقاومة للعبث والآمنة للإبر التركيز المتزايد على سلامة المستخدم وسلامة المنتج.
- علاوة على ذلك، يُسهم تركيز صناعة الأدوية على إطالة مدة الصلاحية وتحسين استقرار الحرارة في دفع عجلة البحث في تقنيات التجفيف بالتجميد المتقدمة. وتُعدّ التركيبات المُحسّنة التي يُمكن تخزينها ونقلها دون تبريد أمرًا بالغ الأهمية في توسيع نطاق الوصول إلى الأدوية الحيوية في المناطق النائية أو شحيحة الموارد.
- هذا التوجه نحو أنظمة حقن أدوية أكثر ذكاءً وسهولةً واستقرارًا يُرسي معايير جديدة في قطاع الأدوية. ونتيجةً لذلك، تُضخّ الشركات الرائدة استثماراتٍ ضخمةً في البحث والتطوير لإطلاق الجيل التالي من الأدوية المُجفّفة بالتجميد القابلة للحقن، والمُزوّدة بآليات توصيل متطورة مُصمّمة خصيصًا لرعايةٍ تُركّز على المريض.
ديناميكيات سوق الأدوية المجففة بالتجميد القابلة للحقن
سائق
"الحاجة المتزايدة نتيجة الطلب المتزايد على العلاجات القابلة للحقن المستقرة وطويلة المفعول"
- أدى تزايد العبء العالمي للأمراض المزمنة والأمراض المعدية، والحاجة إلى تركيبات دوائية مستقرة وطويلة الأمد، إلى زيادة كبيرة في الطلب على الأدوية المجففة بالتجميد القابلة للحقن. تتميز هذه التركيبات بثباتية عالية، ومدة صلاحية أطول، وسهولة في التخزين والنقل، مما يجعلها مثالية للاستخدامات السريرية والرعاية الصحية عن بُعد.
- على سبيل المثال، في أبريل 2024، طرحت شركة باكستر الدولية مجموعةً موسعةً من الأدوية المُجَفَّدة المُضادة للعدوى، القابلة للحقن، والمُصممة للاستخدام في العيادات الخارجية والمستشفيات، مع التركيز على تحسين ثباتية المنتج على الرفوف وتحسين نتائج المرضى. ومن المتوقع أن تُسرّع هذه المبادرات نمو السوق خلال فترة التوقعات.
- تعتمد أنظمة الرعاية الصحية في جميع أنحاء العالم بشكل متزايد على المواد القابلة للحقن المجففة بالتجميد نظرًا لاستقرارها الكيميائي والفيزيائي المتفوق مقارنة بالمستحضرات السائلة، وخاصة في المناطق ذات البنية التحتية المحدودة لسلسلة التبريد
- بالإضافة إلى ذلك، تعتبر هذه الأدوية ضرورية في علم الأورام وأمراض المناعة الذاتية وطب الطوارئ، حيث يعد إعادة التكوين السريع والإدارة الفورية أمرًا بالغ الأهمية
- إن التفضيل المتزايد لأنظمة إعادة التكوين الجاهزة للاستخدام أو في نقطة الرعاية، بدعم من الابتكارات في الحقن والقوارير ذات الحجرتين المزدوجتين، يدفع السوق إلى الأمام بشكل أكبر، مما يتيح توصيل الأدوية بشكل أكثر أمانًا وسرعة وكفاءة في المستشفيات ومرافق الرعاية المنزلية.
- مع قيام مصنعي الأدوية بتوسيع خطوط منتجاتهم لتشمل إصدارات مجففة بالتجميد من الأدوية الحيوية، وتعزيز منظمات التصنيع التعاقدية (CMOs) لقدراتها على التجفيف بالتجميد، يشهد السوق دفعة قوية في كل من البلدان المتقدمة والنامية
ضبط النفس/التحدي
"عملية التصنيع المعقدة وتكاليف الإنتاج المرتفعة"
- على الرغم من مسار النمو القوي، يواجه سوق الأدوية المجففة بالتجميد القابلة للحقن تحديات كبيرة ناجمة عن تعقيد عمليات التجفيف بالتجميد وارتفاع تكلفتها. وتساهم المعدات المتخصصة، وظروف التعقيم الصارمة، وجداول الإنتاج الطويلة في ارتفاع التكاليف مقارنةً بالتركيبات التقليدية.
- على سبيل المثال، يتطلب إنشاء منشأة تجفيف بالتجميد على نطاق تجاري استثمارًا رأسماليًا كبيرًا، وهو ما قد يثني شركات الأدوية الصغيرة أو الشركات الناشئة عن دخول السوق.
- علاوة على ذلك، فإن المتطلبات التنظيمية للأدوية المعقمة القابلة للحقن صارمة، مما يضيف طبقات من مراقبة الجودة والتوثيق والاختبار - وهي عوامل تطيل جداول تطوير المنتج وتزيد من النفقات العامة التشغيلية.
- إن متطلبات تقنيات التعبئة والتغليف المتقدمة، مثل أنظمة الغرف المزدوجة، والحاجة إلى لوجستيات سلسلة التبريد في بعض الحالات على الرغم من التجفيف بالتجميد، يمكن أن تزيد من تعقيد سلسلة التوريد والتكلفة الإجمالية للمنتج
- لمعالجة هذه العوائق، يستثمر المصنعون في تقنيات التجفيف المستمر بالتجميد وأنظمة الغرف النظيفة المعيارية لتبسيط العمليات وخفض التكاليف. كما أن التعاون مع شركات تصنيع وتسويق المنتجات (CDMOs) والحوافز الحكومية لتوسيع قدرات التصنيع المحلية يُسهم في التخفيف من هذه التحديات.
- ومع ذلك، فإن التغلب على هذه القيود من خلال الابتكار في التصنيع وتحسين العمليات وتبني التكنولوجيا القابلة للتطوير أمر ضروري لإطلاق العنان لإمكانات النمو الكاملة لسوق الأدوية القابلة للحقن المجففة بالتجميد على مستوى العالم.
نطاق سوق الأدوية المجففة بالتجميد القابلة للحقن
يتم تقسيم السوق على أساس التعبئة والتغليف، ونوع التسليم، وفئة الدواء، والشكل، والمؤشر، وطريقة الإدارة، والمستخدم النهائي، وقناة التوزيع.
• حسب التعبئة والتغليف
بناءً على التعبئة والتغليف، يُقسّم سوق الأدوية المجففة بالتجميد إلى قوارير، وحقن ثنائية الغرف، وخراطيش ثنائية الغرف، والتغليف المتخصص، وإعادة التركيب في نقطة الرعاية، وقوارير للاستخدام مرة واحدة، وغيرها. وقد استحوذت القوارير على أكبر حصة من إيرادات السوق بنسبة 36.5% في عام 2024، بفضل فعاليتها من حيث التكلفة وتوافقها مع مختلف فئات الأدوية.
من المتوقع أن ينمو سوق الحقن ذات الغرفتين بأسرع معدل نمو سنوي مركب بنسبة 9.8% من عام 2025 إلى عام 2032، مدفوعًا بالطلب على أنظمة التوصيل المعقمة الجاهزة للاستخدام.
• حسب نوع التسليم
بناءً على طريقة التوصيل، يُقسّم سوق الأدوية المجففة بالتجميد إلى أجهزة أحادية الخطوة، وأجهزة متعددة الخطوات، وحقن مخففة معبأة مسبقًا، وأجهزة إعادة تكوين خاصة. شكلت الأجهزة أحادية الخطوة 34.7% من حصة السوق في عام 2024، بفضل بساطتها وكفاءتها في استهلاك الوقت.
ومن المتوقع أن تسجل أجهزة إعادة البناء الملكية أسرع معدل نمو سنوي مركب بنسبة 10.1% من عام 2025 إلى عام 2032، وذلك بفضل التكنولوجيا المتقدمة وميزات السلامة.
• حسب فئة الدواء
بناءً على فئة الدواء، يُقسّم سوق الأدوية المجففة بالتجميد القابلة للحقن إلى مضادات العدوى، ومضادات الأورام، ومدرّات البول، ومثبطات مضخة البروتون، والمخدر، ومضادات التخثر، ومضادات الالتهاب غير الستيرويدية، والكورتيكوستيرويدات، وغيرها. وقد هيمنت الأدوية المضادة للعدوى على حصة سوقية بلغت 41.3% في عام 2024، نظرًا لانتشار الأمراض المعدية عالميًا.
من المتوقع أن ينمو قطاع الأدوية المضادة للأورام بمعدل نمو سنوي مركب نسبته 9.6% من عام 2025 إلى عام 2032، وذلك بسبب زيادة حالات الإصابة بالسرطان واحتياجات التركيبة المستقرة.
• حسب النموذج
بناءً على الشكل، يُقسّم سوق الأدوية المجففة بالتجميد القابلة للحقن إلى مسحوق وسائل. وقد استحوذ المسحوق على الحصة الأكبر بنسبة 65.4% في عام 2024، بفضل مدة صلاحيته الأطول واستقراره الأفضل في النقل.
ومن المتوقع أن ينمو قطاع السوائل بمعدل نمو سنوي مركب قدره 6.2% من عام 2025 إلى عام 2032، وذلك بسبب سهولة استخدامه وتفضيله في الرعاية الطارئة.
• حسب الإشارة
بناءً على دواعي الاستعمال، يُقسّم سوق الأدوية المجففة بالتجميد القابلة للحقن إلى: الأورام، وأمراض المناعة الذاتية، والاضطرابات الهرمونية، والحالات الأيضية، وأمراض الجهاز التنفسي، واضطرابات الجهاز الهضمي، والاضطرابات الجلدية، وأمراض العيون، والأمراض المعدية، وغيرها. وقد تصدّرت الأورام السوق بحصة بلغت 26.9% في عام 2024، نظرًا للطلب المرتفع على عوامل العلاج الكيميائي القابلة للحقن.
من المتوقع أن تنمو الأمراض المعدية بمعدل نمو سنوي مركب قدره 8.8% من عام 2025 إلى عام 2032، بدعم من الاستخدام المتزايد للمضادات الحيوية المجففة بالتجميد.
• عن طريق الإدارة
بناءً على فئة الدواء، يُقسّم سوق الأدوية المجففة بالتجميد القابلة للحقن إلى أدوية وريدية/مُستخلصة، وعضلية، وغيرها. وقد استحوذت الأدوية الوريدية/المُستخلصة على أكبر حصة سوقية بنسبة 58.1% في عام 2024، نظرًا لاستخدامها في مراكز الرعاية الحرجة.
من المتوقع أن ينمو الطريق العضلي بمعدل نمو سنوي مركب قدره 6.4% من عام 2025 إلى عام 2032، مدفوعًا باتجاهات الرعاية المنزلية والرعاية الخارجية.
• حسب المستخدم النهائي
بناءً على فئة الدواء، يُقسّم سوق الأدوية المجففة بالتجميد القابلة للحقن إلى مستشفيات، وعيادات، ومراكز جراحة خارجية، وخدمات رعاية صحية منزلية، وغيرها. وقد استحوذت المستشفيات على الحصة الأكبر بنسبة 42.7% في عام 2024، بفضل حجم الإجراءات الكبير وبنيتها التحتية المتطورة.
من المتوقع أن يتوسع قطاع الرعاية الصحية المنزلية بأسرع معدل نمو سنوي مركب بنسبة 10.5% من عام 2025 إلى عام 2032، وذلك بسبب تفضيل المرضى المتزايد للعلاج المنزلي والإدارة الذاتية.
• حسب قناة التوزيع
بناءً على فئة الدواء، يُقسّم سوق الأدوية المجففة بالتجميد القابلة للحقن إلى مناقصة مباشرة، ومبيعات التجزئة، وغيرها. وقد شكّلت المناقصة المباشرة القناة الرائدة بحصة بلغت 53.2% في عام 2024، مدعومةً بعمليات الشراء المؤسسية من المستشفيات العامة والخاصة.
ومن المتوقع أن تنمو مبيعات التجزئة بمعدل نمو سنوي مركب نسبته 9.1% من عام 2025 إلى عام 2032، مع توفر المزيد من المواد القابلة للحقن في قنوات العيادات الخارجية والتجارة الإلكترونية.
تحليل إقليمي لسوق الأدوية المجففة بالتجميد القابلة للحقن
- سيطرت أمريكا الشمالية على سوق الأدوية القابلة للحقن المجففة بالتجميد بأكبر حصة إيرادات بلغت 38.7% في عام 2024، مدفوعة بقاعدة تصنيع قوية للأدوية، وانتشار متزايد للأمراض المزمنة، وبنية تحتية راسخة للرعاية الصحية.
- يتم دعم نمو المنطقة من خلال الاستثمارات الكبيرة في أنظمة توصيل الأدوية المتقدمة ومعدل التبني المرتفع للمستحضرات المجففة بالتجميد بسبب عمرها الافتراضي الممتد واستقرارها
- علاوة على ذلك، تواصل شركات الأدوية الكبرى العاملة في الولايات المتحدة وكندا إعطاء الأولوية لتطوير الأدوية المجففة بالتجميد القابلة للحقن لعلاج الأورام والأمراض المعدية والاضطرابات المناعية الذاتية، مما يساهم في التوسع المستدام للسوق.
نظرة عامة على سوق الأدوية المجففة بالتجميد القابلة للحقن في الولايات المتحدة
استحوذ سوق الأدوية المجففة بالتجميد القابلة للحقن في الولايات المتحدة على أكبر حصة من الإيرادات، بنسبة 80.1% في عام 2024، في أمريكا الشمالية، بفضل سلسلة التوريد السريرية القوية، والبنية التحتية التصنيعية المتطورة، والتفضيل المتزايد للتركيبات المستقرة وطويلة العمر الافتراضي. ويشجع الانتشار المتزايد للأمراض المزمنة، مثل السرطان واضطرابات المناعة الذاتية، على استخدام الأدوية المجففة بالتجميد القابلة للحقن، مما يقلل الحاجة إلى التبريد ويضمن استقرار المنتج. علاوة على ذلك، يُسهم الدعم التنظيمي القوي من إدارة الغذاء والدواء الأمريكية (FDA) ووجود شركات رائدة في مجال الأدوية الحيوية بشكل كبير في توسع السوق.
نظرة عامة على سوق الأدوية المجففة بالتجميد القابلة للحقن في أوروبا
من المتوقع أن ينمو سوق الأدوية المجففة بالتجميد القابلة للحقن في أوروبا بمعدل نمو سنوي مركب كبير قدره 8.9% بين عامي 2025 و2032، مدعومًا بالطلب المتزايد على التركيبات المستقرة في درجات الحرارة ومدة الصلاحية في مختلف مرافق الرعاية الصحية. ويساهم التركيز المتزايد على تحسين لوجستيات سلسلة التبريد وتلبية الاحتياجات غير الملباة في مجال الأورام والأمراض المعدية في تسريع وتيرة تبني هذه الأدوية. علاوة على ذلك، يُعزز ازدياد تطوير المستحضرات الحيوية المماثلة والاستعانة بمصادر خارجية من شركات التصنيع التعاقدي (CMOs) النمو الإقليمي في مجال الأدوية المجففة بالتجميد القابلة للحقن.
نظرة عامة على سوق الأدوية المجففة بالتجميد القابلة للحقن في المملكة المتحدة
من المتوقع أن ينمو سوق الأدوية المجففة بالتجميد القابلة للحقن في المملكة المتحدة بمعدل نمو سنوي مركب ملحوظ قدره 9.1% خلال الفترة المتوقعة، مدفوعًا بارتفاع حالات دخول المستشفيات بسبب الأمراض المزمنة وزيادة التركيز على الابتكار الدوائي. ويميل نظام الرعاية الصحية في البلاد، بقيادة هيئة الخدمات الصحية الوطنية، بشكل متزايد إلى استخدام تركيبات فعالة من حيث التكلفة ومستقرة تدعم تحسين توصيل الأدوية وتخزينها. كما أن العدد المتزايد من التجارب السريرية وتوسع تصنيع الأدوية المتخصصة يُعززان زخم السوق.
نظرة عامة على سوق الأدوية المجففة بالتجميد القابلة للحقن في ألمانيا
من المتوقع أن يشهد سوق الأدوية المجففة بالتجميد القابلة للحقن في ألمانيا نموًا بمعدل نمو سنوي مركب كبير يبلغ 8.5%، بفضل بنيتها التحتية الدوائية المتطورة واستثماراتها المتنامية في المستحضرات البيولوجية والأدوية الحيوية المماثلة. وتعتمد المستشفيات ومرافق العيادات الخارجية الألمانية بشكل نشط التركيبات المجففة بالتجميد لتعزيز ثباتها، وتقليل متطلبات التخزين البارد، وإطالة مدة صلاحيتها. كما يستفيد السوق من التزام الدولة باستدامة الرعاية الصحية والطب الدقيق .
نظرة عامة على سوق الأدوية المجففة بالتجميد القابلة للحقن في منطقة آسيا والمحيط الهادئ
من المتوقع أن يشهد سوق الأدوية المجففة بالتجميد القابلة للحقن في منطقة آسيا والمحيط الهادئ نموًا بمعدل نمو سنوي مركب يبلغ 10.6% بين عامي 2025 و2032، مدفوعًا بتزايد الإنفاق على الرعاية الصحية، والتوسع الحضري السريع، وتوسع إنتاج الأدوية في دول مثل الصين والهند واليابان. ويُسهم توجه المنطقة نحو العلاجات القابلة للحقن الفعالة من حيث التكلفة والمستقرة، لا سيما في البيئات محدودة الموارد، في تسريع وتيرة تبني هذه العلاجات بشكل كبير. علاوة على ذلك، تُسهم المبادرات الحكومية الداعمة لتصنيع الأدوية المحلية والبحوث السريرية في دفع نمو السوق الإقليمية.
نظرة عامة على سوق الأدوية المجففة بالتجميد القابلة للحقن في اليابان
يشهد سوق الأدوية المجففة بالتجميد القابلة للحقن في اليابان نموًا ملحوظًا، حيث سيشكل 18.2% من إيرادات منطقة آسيا والمحيط الهادئ بحلول عام 2024، مدفوعًا بارتفاع معدلات الشيخوخة السكانية، وارتفاع معدل انتشار الأمراض المزمنة، والتركيز الكبير على الابتكار في مجال الرعاية الصحية. ويتزايد اعتماد التركيبات المجففة بالتجميد نظرًا لعمرها الافتراضي الطويل وتقليل هدرها. كما أن ريادة اليابان في البحث والتطوير في مجال الأدوية الحيوية ، ولوائح الجودة الصارمة، تشجعان الطلب على محاليل الحقن المستقرة، لا سيما في علاج الأورام والأمراض الأيضية.
نظرة على سوق الأدوية المجففة بالتجميد القابلة للحقن في الصين
استحوذ سوق الأدوية المجففة بالتجميد القابلة للحقن في الصين على أكبر حصة من الإيرادات، بنسبة 44.5% في منطقة آسيا والمحيط الهادئ في عام 2024، مدعومًا بالنمو السريع في تصنيع الأدوية، والطلب القوي على علاجات الأورام والمضادات الحيوية، والإصلاحات الشاملة في قطاع الرعاية الصحية. وبصفتها إحدى الأسواق الرائدة في إنتاج الأدوية الحيوية والتصنيع التعاقدي، تشهد الصين طلبًا متزايدًا على الأدوية المجففة بالتجميد القابلة للحقن في المستشفيات والعيادات ومراكز البيع بالتجزئة. ويساهم الدعم الحكومي للابتكار وزيادة فرص الحصول على الرعاية الصحية في المدن ذات الدخل المنخفض في تسريع نمو السوق.
حصة سوق الأدوية المجففة بالتجميد القابلة للحقن
وتتولى شركات راسخة قيادة صناعة الأدوية المجففة بالتجميد القابلة للحقن في المقام الأول، بما في ذلك:
- جينكس فارما (الهند)
- أوروبيندو فارما الولايات المتحدة الأمريكية (الولايات المتحدة)
- شركة أستيلاس فارما (الولايات المتحدة)
- شركة فايزر (الولايات المتحدة)
- شركة فياتريس (الولايات المتحدة)
- شركة جيلياد للعلوم (الولايات المتحدة)
- سيروندراغس (الهند)
- شركة أمنيل للأدوية ذ.م.م (الولايات المتحدة)
- شركة جوبيلانت جينيريكس المحدودة (الهند)
- شركة نوفارتيس إيه جي (سويسرا)
- شركة أوتسوكا أمريكا للأدوية (الولايات المتحدة)
- مجموعة زيدوس (الهند)
- شركة سيبلا (الهند)
- شركة ميرك وشركاه المحدودة (ألمانيا)
- شركة فريسينيوس كابي إيه جي (الولايات المتحدة)
- سانوفي (فرنسا)
- مختبرات سيلون (الهند)
- باكستر (الولايات المتحدة)
أحدث التطورات في سوق الأدوية المجففة بالتجميد القابلة للحقن العالمية
- في مايو 2024، أعلنت شركة فايزر عن توسيع مرافق التجفيف بالتجميد في مصنعها بكالامازو، ميشيغان، لتلبية الطلب المتزايد على الأدوية البيولوجية المستقرة القابلة للحقن والعلاجات القائمة على الحمض النووي الريبوزي المرسال (mRNA). ويهدف هذا الاستثمار إلى تعزيز قابلية التوسع في الإنتاج وتقليل الاعتماد على سلسلة التبريد، مما يعزز ريادة فايزر في تقنيات توصيل الأدوية المبتكرة.
- في أبريل 2024، أطلقت شركة ريسيفارم إيه بي، الشركة الرائدة في مجال تطوير وتصنيع العقود (CDMO)، خط إنتاج جديد ومتطور للتجفيف بالتجميد في منشأتها بمدينة بريشيا الإيطالية. صُمم هذا التوسع لتلبية الطلب العالمي المتزايد على الحقن المجففة بالتجميد، لا سيما في قطاعي الأورام والأمراض النادرة، ويعزز حضور ريسيفارم في سوق التصنيع التعاقدي الأوروبي.
- في فبراير 2024، تعاونت شركة باكستر الدولية مع هيئة البحث والتطوير الطبي الحيوي المتقدمة الأمريكية (BARDA) لتعزيز التصنيع المحلي للحقن المجففة بالتجميد المستخدمة في التأهب لحالات الطوارئ. تركز الشراكة على تحسين مرونة سلسلة التوريد وزيادة المخزونات الوطنية من الأدوية الأساسية المستقرة في درجات الحرارة.
- في يناير 2024، حصلت شركة أوروبيندو فارما المحدودة على موافقة إدارة الغذاء والدواء الأمريكية (FDA) على نسختها الجنيسة المجففة بالتجميد من دواء ميروبينيم للحقن، مما وسّع نطاق منتجاتها المعقمة القابلة للحقن والمخصصة للمستشفيات. يُعزز هذا الإنجاز مكانة الشركة في سوق الأدوية الجنيسة القابلة للحقن التنافسية، مقدمًا حلولاً فعالة من حيث التكلفة لعلاجات الرعاية الحرجة.
- في ديسمبر 2023، أعلنت شركة سيبلا المحدودة عن تسويق دواء الأورام المجفف بالتجميد، دوسيتاكسيل حقن USP، الذي طورته الشركة، في السوق الهندية. يهدف إطلاق المنتج إلى توفير علاجات كيميائية عالية الجودة وبأسعار معقولة، مع تحسين مدة الصلاحية ومزايا التخزين، مما يعزز التزام سيبلا بتوفير رعاية صحية سهلة المنال للسرطان.
- في نوفمبر 2023، بدأت شركة فيتر فارما-فيرتيجونج المحدودة وشركاؤها، وهي شركة عالمية متخصصة في تطوير وتصنيع الأدوية، بناء منشأة جديدة في النمسا مخصصة لإنتاج الأدوية المجففة بالتجميد القابلة للحقن على نطاق واسع. ستدعم المنشأة شركاء التكنولوجيا الحيوية والأدوية بقدرات تعبئة وتشطيب متقدمة للمستحضرات البيولوجية عالية القيمة والمركبات الحساسة.
- في أكتوبر 2023، وسّعت شركة حكمة للأدوية عروضها من الأدوية المجففة بالتجميد القابلة للحقن في الولايات المتحدة الأمريكية بإطلاق أدوية عامة إضافية مضادة للعدوى وعلاجات لأمراض القلب والأوعية الدموية. تدعم هذه الخطوة المستشفيات في إدارة نقص الأدوية من خلال توفير بدائل إمداد موثوقة ذات مدة صلاحية أطول.
SKU-
احصل على إمكانية الوصول عبر الإنترنت إلى التقرير الخاص بأول سحابة استخبارات سوقية في العالم

- لوحة معلومات تحليل البيانات التفاعلية
- لوحة معلومات تحليل الشركة للفرص ذات إمكانات النمو العالية
- إمكانية وصول محلل الأبحاث للتخصيص والاستعلامات
- تحليل المنافسين باستخدام لوحة معلومات تفاعلية
- آخر الأخبار والتحديثات وتحليل الاتجاهات
- استغل قوة تحليل المعايير لتتبع المنافسين بشكل شامل
Table of Content
- مقدمة
- أهداف الدراسة
- تعريف السوق
- نظرة عامة على سوق الأدوية المجففة بالتجميد القابلة للحقن العالمية
- القيود
- الأسواق المغطاة
- تقسيم السوق
- الأسواق المغطاة
- النطاق الجغرافي
- السنوات المعتبرة للدراسة
- العملة والتسعير
- نموذج التحقق من صحة بيانات DBMR TRIPOD
- النمذجة متعددة المتغيرات
- تغليف لايف لاين كيرف
- المقابلات الأولية مع قادة الرأي الرئيسيين
- شبكة موقف السوق DBMR
- تحليل حصة البائع
- شبكة تغطية المستخدم النهائي للسوق
- المصادر الثانوية
- الافتراضات
- الملخص التنفيذي
- السوق العالمية للأدوية المجففة بالتجميد القابلة للحقن: الإطار التنظيمي
- علم الأوبئة
- نظرة عامة على السوق
- السائقين
- ارتفاع في الحالات الصحية المزمنة
- النقل الآمن والتخزين لهذه المواد حتى الاستخدام النهائي لها
- زيادة في عدد السكان المسنين المصابين بأمراض مزمنة
- توسيع خط أنابيب الأدوية المجففة بالتجميد القابلة للحقن
- التقدم التكنولوجي
- القيود
- خطر إصابات وخز الإبرة
- زيادة في عدد عمليات سحب المنتجات للأدوية المجففة بالتجميد ونوع التغليف
- فرص
- الموافقة التنظيمية لشركة RisE IN على الأدوية المجففة بالتجميد
- المبادرات الاستراتيجية للاعبين الرئيسيين في السوق
- مخاوف بشأن الجودة
- التحديات
- التحديات المرتبطة بتصنيع القوارير المجففة بالتجميد للمنتجات الوريدية
- عملية تستغرق وقتا طويلا وتكلفة عالية
- تأثير جائحة كوفيد-19 على سوق الأدوية المجففة بالتجميد القابلة للحقن العالمية
- التأثير على السعر
- التأثير في الطلب
- التأثير على العرض
- مبادرة استراتيجية
- خاتمة
- السوق العالمية للأدوية المجففة بالتجميد القابلة للحقن، حسب التعبئة والتغليف
- ملخص
- قوارير
- محاقن ذات حجرتين
- خراطيش ذات غرفتين
- آحرون
- السوق العالمية للأدوية المجففة بالتجميد القابلة للحقن، حسب فئة الدواء
- ملخص
- مضادات العدوى
- المضادات الحيوية
- أزيثروميسين
- دوكسيسيكلين
- فانكومايسين
- بوليميكسين ب
- بيبيراسيلين
- تازوباكتام
- آحرون
- مضاد للفطريات
- ميكامين
- أسيتات كاسبوفونجين
- كبريتات إيزافوكونازونيوم
- أمفوتريسين
- آحرون
- مضاد فيروسات
- أسيكلوفير
- غانسيكلوفير
- ريمديسيفير
- آحرون
- آحرون
- مضاد للأورام
- ميثوتريكسات
- جيمسيتابين
- سيتارابين
- فلودارابين
- دوكسوروبيسين
- أوكساليبلاتين
- حمض الزوليدرونيك
- آحرون
- مدرات البول
- كلوروثيازيد
- حمض الإيثاكرينيك
- أسيتازولاميد
- آحرون
- مثبط مضخة البروتون
- إيزوميبرازول الصوديوم
- بانتوبرازول الصوديوم
- أوميبرازول
- آحرون
- مخدر
- بروميد فيكورونيوم
- ثيوبنتال الصوديوم
- ليدوكايين
- آحرون
- مضاد تخثر
- الكومادين
- يوروكيناز
- مضاد الثرومبين (معاد التركيب)
- أبيكسابان
- ريفاروكسابان
- آحرون
- مضادات الالتهاب غير الستيرويدية
- إندوميثاسين
- ايبوبروفين
- ديكلوفيناك
- كيتورولاك
- آحرون
- الكورتيكوستيرويدات
- هيدروكورتيزون
- ميثيل بريدنيزولون
- آحرون
- آحرون
- السوق العالمية للأدوية المجففة بالتجميد القابلة للحقن، حسب الشكل
- ملخص
- مسحوق
- سائل
- السوق العالمية للأدوية المجففة بالتجميد القابلة للحقن، حسب المؤشر
- ملخص
- علم الأورام
- أمراض المناعة الذاتية
- الاضطرابات الهرمونية
- أمراض الجهاز التنفسي
- اضطرابات الجهاز الهضمي
- الاضطرابات الجلدية
- أمراض العيون
- آحرون
- السوق العالمية للأدوية المجففة بالتجميد القابلة للحقن، حسب طريقة الإدارة
- ملخص
- وريدي/حقن
- عضلي
- آحرون
- السوق العالمية للأدوية المجففة بالتجميد القابلة للحقن، حسب المستخدم النهائي
- ملخص
- مستشفى
- العيادات
- الرعاية الصحية المنزلية
- آحرون
- السوق العالمية للأدوية المجففة بالتجميد القابلة للحقن، حسب قنوات التوزيع
- ملخص
- العطاءات المباشرة
- مبيعات التجزئة
- آحرون
- السوق العالمية للأدوية المجففة بالتجميد القابلة للحقن، حسب المنطقة
- ملخص
- أمريكا الشمالية
- نحن
- كندا
- المكسيك
- أوروبا
- ألمانيا
- فرنسا
- المملكة المتحدة
- إيطاليا
- إسبانيا
- هولندا
- روسيا
- سويسرا
- ديك رومى
- النمسا
- النرويج
- هنغاريا
- ليتوانيا
- أيرلندا
- بولندا
- بقية أوروبا
- آسيا والمحيط الهادئ
- اليابان
- الصين
- كوريا الجنوبية
- الهند
- أستراليا
- سنغافورة
- تايلاند
- ماليزيا
- أندونيسيا
- فيلبيني
- فيتنام
- بقية منطقة آسيا والمحيط الهادئ
- أمريكا الجنوبية
- البرازيل
- الأرجنتين
- بيرو
- بقية أمريكا الجنوبية
- الشرق الأوسط وأفريقيا
- جنوب أفريقيا
- المملكة العربية السعودية
- الإمارات العربية المتحدة
- مصر
- الكويت
- إسرائيل
- بقية الشرق الأوسط وأفريقيا
- السوق العالمية للأدوية المجففة بالتجميد القابلة للحقن: نظرة عامة على الشركة
- تحليل أسهم الشركة: عالميًا
- تحليل أسهم الشركة: أمريكا الشمالية
- تحليل أسهم الشركة: أوروبا
- تحليل أسهم الشركة: منطقة آسيا والمحيط الهادئ
- تحليل SWOT
- نبذة عن الشركة
- شركة فايزر
- لمحة عن الشركة
- تحليل الإيرادات
- تحليل أسهم الشركة
- محفظة المنتجات
- التطورات الأخيرة
- فريسينيوس كابي الولايات المتحدة الأمريكية (شركة تابعة لشركة فريسينيوس كابي إيه جي)
- لمحة عن الشركة
- تحليل الإيرادات
- تحليل أسهم الشركة
- محفظة المنتجات
- التطورات الأخيرة
- شركة سيبلا
- لمحة عن الشركة
- تحليل الإيرادات
- تحليل أسهم الشركة
- محفظة المنتجات
- التطورات الأخيرة
- شركة نوفارتيس ايه جي
- لمحة عن الشركة
- تحليل الإيرادات
- تحليل أسهم الشركة
- محفظة المنتجات
- التطورات الأخيرة
- شركة ميرك شارب آند دوم كورب، وهي شركة تابعة لشركة ميرك آند كو، المحدودة.
- لمحة عن الشركة
- تحليل الإيرادات
- محفظة المنتجات
- التطورات الأخيرة
- باكستر
- لمحة عن الشركة
- تحليل الإيرادات
- محفظة المنتجات
- التطورات الأخيرة
- زيدوس كاديلا
- لمحة عن الشركة
- تحليل الإيرادات
- محفظة المنتجات
- التطورات الأخيرة
- شركة أفي فارما المحدودة
- لمحة عن الشركة
- محفظة المنتجات
- التطورات الأخيرة
- شركة أمنيل للأدوية ذ.م.م
- لمحة عن الشركة
- تحليل الإيرادات
- محفظة المنتجات
- التطورات الأخيرة
- شركة أريستوفارما المحدودة
- لمحة عن الشركة
- محفظة المنتجات
- التطورات الأخيرة
- Astellas Pharma US, Inc. (شركة تابعة لشركة Astellas Pharma Inc.)
- لمحة عن الشركة
- تحليل الإيرادات
- محفظة المنتجات
- التطورات الأخيرة
- شركة أوروميدكس فارما ذ.م.م (شركة تابعة لشركة أوروبيندو فارما)
- لمحة عن الشركة
- تحليل الإيرادات
- محفظة المنتجات
- التطورات الأخيرة
- مختبرات سيلون المحدودة
- لمحة عن الشركة
- محفظة المنتجات
- التطورات الأخيرة
- سييروندرجز
- لمحة عن الشركة
- محفظة المنتجات
- التطورات الأخيرة
- جينكس فارما
- لمحة عن الشركة
- محفظة المنتجات
- التطورات الأخيرة
- شركة جيلياد للعلوم
- لمحة عن الشركة
- تحليل الإيرادات
- محفظة المنتجات
- التطورات الأخيرة
- شركة جوبيلانت جينيريكس المحدودة - شركة تابعة لشركة جوبيلانت فارما
- لمحة عن الشركة
- تحليل الإيرادات
- محفظة المنتجات
- التطورات الأخيرة
- شركة أوتسوكا أمريكا للأدوية
- لمحة عن الشركة
- محفظة المنتجات
- التطورات الأخيرة
- سانوفي
- لمحة عن الشركة
- تحليل الإيرادات
- محفظة المنتجات
- التطورات الأخيرة
- شركة فياتريس
- لمحة عن الشركة
- تحليل الإيرادات
- محفظة المنتجات
- التطورات الأخيرة
- استبيان
- التقارير ذات الصلة
List of Table
الجدول 1 الأدوية القابلة للحقن المجففة بالتجميد عبر الأنابيب
الجدول 2 السوق العالمية للأدوية المجففة بالتجميد القابلة للحقن، حسب العبوة، 2019-2028 (مليون دولار أمريكي)
الجدول 3: سوق القوارير العالمية للأدوية المجففة بالتجميد القابلة للحقن، حسب المنطقة، 2019-2028 (مليون دولار أمريكي)
الجدول 4: السوق العالمية للحقن ثنائية الغرف في الأدوية المجففة بالتجميد، حسب المنطقة، 2019-2028 (مليون دولار أمريكي)
الجدول 5: السوق العالمية لخراطيش الغرفتين المزدوجة في الأدوية المجففة بالتجميد القابلة للحقن، حسب المنطقة، 2019-2028 (مليون دولار أمريكي)
الجدول 6: سوق الأدوية المجففة بالتجميد القابلة للحقن العالمية، حسب المنطقة، 2019-2028 (مليون دولار أمريكي)
الجدول 7: سوق الأدوية المجففة بالتجميد القابلة للحقن العالمية، حسب فئة الدواء، 2019-2028 (مليون دولار أمريكي)
الجدول 8: سوق الأدوية المجففة بالتجميد القابلة للحقن العالمية، حسب فئة الدواء، 2019-2028 (الوحدات)
الجدول 9: سوق الأدوية المضادة للعدوى في الأدوية المجففة بالتجميد القابلة للحقن العالمية، حسب المنطقة، 2019-2028 (مليون دولار أمريكي)
الجدول 10: سوق الأدوية المضادة للعدوى في الأدوية المجففة بالتجميد القابلة للحقن العالمية، حسب فئة الدواء، 2019-2028 (مليون دولار أمريكي)
الجدول 11: سوق المضادات الحيوية العالمية في الأدوية المجففة بالتجميد القابلة للحقن، حسب فئة الدواء، 2019-2028 (مليون دولار أمريكي)
الجدول 12 السوق العالمية للأدوية المضادة للفطريات في الأدوية المجففة بالتجميد القابلة للحقن، حسب فئة الدواء، 2019-2028 (مليون دولار أمريكي)
الجدول 13 السوق العالمية للأدوية المضادة للفيروسات في الأدوية المجففة بالتجميد القابلة للحقن، حسب فئة الدواء، 2019-2028 (مليون دولار أمريكي)
الجدول 14: سوق الأدوية المضادة للأورام في الحقن المجففة بالتجميد العالمية، حسب المنطقة، 2019-2028 (مليون دولار أمريكي)
الجدول 15 السوق العالمية لمضادات الأورام في الأدوية المجففة بالتجميد القابلة للحقن، حسب فئة الدواء، 2019-2028 (مليون دولار أمريكي)
الجدول 16: سوق مدرات البول العالمية في الأدوية المجففة بالتجميد القابلة للحقن، حسب المنطقة، 2019-2028 (مليون دولار أمريكي)
الجدول 17 السوق العالمية لمدرات البول في الأدوية المجففة بالتجميد القابلة للحقن، حسب فئة الدواء، 2019-2028 (مليون دولار أمريكي)
الجدول 18: سوق مثبطات مضخة البروتون العالمية في الأدوية المجففة بالتجميد القابلة للحقن، حسب المنطقة، 2019-2028 (مليون دولار أمريكي)
الجدول 19: سوق مثبطات مضخة البروتون العالمية في الأدوية القابلة للحقن المجففة بالتجميد، حسب فئة الدواء، 2019-2028 (مليون دولار أمريكي)
الجدول 20: سوق التخدير العالمي في الأدوية المجففة بالتجميد القابلة للحقن، حسب المنطقة، 2019-2028 (مليون دولار أمريكي)
الجدول 21: سوق التخدير العالمي في الأدوية المجففة بالتجميد القابلة للحقن، حسب فئة الدواء، 2019-2028 (مليون دولار أمريكي)
الجدول 22: سوق مضادات التخثر العالمية في الأدوية المجففة بالتجميد القابلة للحقن، حسب المنطقة، 2019-2028 (مليون دولار أمريكي)
الجدول 23: السوق العالمية لمضادات التخثر في الأدوية المجففة بالتجميد القابلة للحقن، حسب فئة الدواء، 2019-2028 (مليون دولار أمريكي)
الجدول 24: سوق مضادات الالتهاب غير الستيرويدية العالمية في الأدوية المجففة بالتجميد القابلة للحقن، حسب المنطقة، 2019-2028 (مليون دولار أمريكي)
الجدول 25: سوق الأدوية العالمية المضادة للالتهابات غير الستيرويدية المجففة بالتجميد القابلة للحقن، حسب فئة الدواء، 2019-2028 (مليون دولار أمريكي)
الجدول 26: سوق الكورتيكوستيرويدات العالمية في الأدوية المجففة بالتجميد القابلة للحقن، حسب المنطقة، 2019-2028 (مليون دولار أمريكي)
الجدول 27: سوق الكورتيكوستيرويدات العالمية في الأدوية المجففة بالتجميد القابلة للحقن، حسب فئة الدواء، 2019-2028 (مليون دولار أمريكي)
الجدول 28: سوق الأدوية الأخرى المجففة بالتجميد القابلة للحقن عالميًا، حسب المنطقة، 2019-2028 (مليون دولار أمريكي)
الجدول 29: سوق الأدوية المجففة بالتجميد القابلة للحقن العالمية، حسب الشكل، 2019-2028 (مليون دولار أمريكي)
الجدول 30: سوق الأدوية القابلة للحقن المجففة بالتجميد العالمية، حسب المنطقة، 2019-2028 (مليون دولار أمريكي)
الجدول 31: سوق الأدوية السائلة المجففة بالتجميد القابلة للحقن العالمية، حسب المنطقة، 2019-2028 (مليون دولار أمريكي)
الجدول 32 السوق العالمية للأدوية المجففة بالتجميد القابلة للحقن، حسب المؤشرات، 2019-2028 (مليون دولار أمريكي)
الجدول 33: سوق علاج الأورام العالمي بالأدوية المجففة بالتجميد القابلة للحقن، حسب المنطقة، 2019-2028 (مليون دولار أمريكي)
الجدول 34: الأمراض المناعية الذاتية العالمية في سوق الأدوية المجففة بالتجميد القابلة للحقن، حسب المنطقة، 2019-2028 (مليون دولار أمريكي)
الجدول 35: الاضطرابات الهرمونية العالمية في سوق الأدوية المجففة بالتجميد القابلة للحقن، حسب المنطقة، 2019-2028 (مليون دولار أمريكي)
الجدول 36: سوق الأدوية المجففة بالتجميد لعلاج أمراض الجهاز التنفسي العالمية، حسب المنطقة، 2019-2028 (مليون دولار أمريكي)
الجدول 37: اضطرابات الجهاز الهضمي العالمية في سوق الأدوية المجففة بالتجميد القابلة للحقن، حسب المنطقة، 2019-2028 (مليون دولار أمريكي)
الجدول 38: الاضطرابات الجلدية العالمية في سوق الأدوية المجففة بالتجميد القابلة للحقن، حسب المنطقة، 2019-2028 (مليون دولار أمريكي)
الجدول 39: سوق الأدوية المجففة بالتجميد لعلاج أمراض العيون العالمية، حسب المنطقة، 2019-2028 (مليون دولار أمريكي)
الجدول 40: سوق الأدوية العالمية الأخرى المجففة بالتجميد القابلة للحقن، حسب المنطقة، 2019-2028 (مليون دولار أمريكي)
الجدول 41 السوق العالمية للأدوية المجففة بالتجميد القابلة للحقن، حسب طريقة الإدارة، 2019-2028 (مليون دولار أمريكي)
الجدول 42: السوق العالمية للأدوية الوريدية/الحقنية المجففة بالتجميد، حسب المنطقة، 2019-2028 (مليون دولار أمريكي)
الجدول 43: السوق العالمية للأدوية القابلة للحقن العضلية المجففة بالتجميد، حسب المنطقة، 2019-2028 (مليون دولار أمريكي)
الجدول 44: سوق الأدوية المجففة بالتجميد القابلة للحقن العالمية، حسب المنطقة، 2019-2028 (مليون دولار أمريكي)
الجدول 45 السوق العالمية للأدوية المجففة بالتجميد القابلة للحقن، حسب المستخدم النهائي، 2019-2028 (مليون دولار أمريكي)
الجدول 46: المستشفيات العالمية في سوق الأدوية المجففة بالتجميد القابلة للحقن، حسب المنطقة، 2019-2028 (مليون دولار أمريكي)
الجدول 47: العيادات العالمية في سوق الأدوية المجففة بالتجميد القابلة للحقن، حسب المنطقة، 2019-2028 (مليون دولار أمريكي)
الجدول 48: سوق الرعاية الصحية المنزلية العالمية في الأدوية المجففة بالتجميد القابلة للحقن، حسب المنطقة، 2019-2028 (مليون دولار أمريكي)
الجدول 49: سوق الأدوية الأخرى المجففة بالتجميد القابلة للحقن عالميًا، حسب المنطقة، 2019-2028 (مليون دولار أمريكي)
الجدول 50: سوق الأدوية المجففة بالتجميد القابلة للحقن العالمية، حسب قنوات التوزيع، 2019-2028 (مليون دولار أمريكي)
الجدول 51: سوق الأدوية المجففة بالتجميد القابلة للحقن العالمية (العطاءات المباشرة)، حسب المنطقة، 2019-2028 (مليون دولار أمريكي)
الجدول 52: مبيعات التجزئة العالمية لسوق الأدوية المجففة بالتجميد القابلة للحقن، حسب المنطقة، 2019-2028 (مليون دولار أمريكي)
الجدول 53: سوق الأدوية الأخرى المجففة بالتجميد القابلة للحقن عالميًا، حسب المنطقة، 2019-2028 (مليون دولار أمريكي)
الجدول 54: سوق الأدوية المجففة بالتجميد القابلة للحقن العالمية، حسب المنطقة، 2019-2028 (مليون دولار أمريكي)
الجدول 55: سوق الأدوية المجففة بالتجميد القابلة للحقن في أمريكا الشمالية، حسب البلد، 2019-2028 (مليون دولار أمريكي)
الجدول 56 سوق الأدوية المجففة بالتجميد القابلة للحقن في أمريكا الشمالية، حسب العبوة، 2019-2028 (مليون دولار أمريكي)
الجدول 57 سوق الأدوية المجففة بالتجميد القابلة للحقن في أمريكا الشمالية، حسب فئة الدواء، 2019-2028 (مليون دولار أمريكي)
الجدول 58: سوق الأدوية المجففة بالتجميد القابلة للحقن في أمريكا الشمالية، حسب فئة الدواء، 2019-2028 (وحدات)
الجدول 59: سوق مضادات العدوى في الأدوية المجففة بالتجميد القابلة للحقن في أمريكا الشمالية، حسب فئة الدواء، 2019-2028 (مليون دولار أمريكي)
الجدول 60: سوق المضادات الحيوية في الأدوية المجففة بالتجميد القابلة للحقن في أمريكا الشمالية، حسب فئة الدواء، 2019-2028 (مليون دولار أمريكي)
الجدول 61 سوق مضادات الفطريات في الأدوية المجففة بالتجميد القابلة للحقن في أمريكا الشمالية، حسب فئة الدواء، 2019-2028 (مليون دولار أمريكي)
الجدول 62: سوق الأدوية المضادة للفيروسات في أمريكا الشمالية، المجففة بالتجميد، حسب فئة الدواء، 2019-2028 (مليون دولار أمريكي)
الجدول 63 سوق الأدوية المضادة للأورام في أمريكا الشمالية، حسب فئة الدواء، 2019-2028 (مليون دولار أمريكي)
الجدول 64: سوق مدرات البول في الأدوية المجففة بالتجميد القابلة للحقن في أمريكا الشمالية، حسب فئة الدواء، 2019-2028 (مليون دولار أمريكي)
الجدول 65: سوق مثبطات مضخة البروتون في الأدوية المجففة بالتجميد القابلة للحقن في أمريكا الشمالية، حسب فئة الدواء، 2019-2028 (مليون دولار أمريكي)
الجدول 66: سوق التخدير في الأدوية المجففة بالتجميد القابلة للحقن في أمريكا الشمالية، حسب فئة الدواء، 2019-2028 (مليون دولار أمريكي)
الجدول 67: سوق مضادات التخثر في الأدوية المجففة بالتجميد القابلة للحقن في أمريكا الشمالية، حسب فئة الدواء، 2019-2028 (مليون دولار أمريكي)
الجدول 68: سوق مضادات الالتهاب غير الستيرويدية في أمريكا الشمالية للأدوية المجففة بالتجميد القابلة للحقن، حسب فئة الدواء، 2019-2028 (مليون دولار أمريكي)
الجدول 69: سوق الكورتيكوستيرويدات في الأدوية المجففة بالتجميد القابلة للحقن في أمريكا الشمالية، حسب فئة الدواء، 2019-2028 (مليون دولار أمريكي)
الجدول 70: سوق الأدوية المجففة بالتجميد القابلة للحقن في أمريكا الشمالية، حسب الشكل، 2019-2028 (مليون دولار أمريكي)
الجدول 71: سوق الأدوية المجففة بالتجميد القابلة للحقن في أمريكا الشمالية، حسب المؤشرات، 2019-2028 (مليون دولار أمريكي)
الجدول 72: سوق الأدوية المجففة بالتجميد القابلة للحقن في أمريكا الشمالية، حسب طريقة الإعطاء، 2019-2028 (مليون دولار أمريكي)
الجدول 73 سوق الأدوية المجففة بالتجميد القابلة للحقن في أمريكا الشمالية، حسب المستخدم النهائي، 2019-2028 (مليون دولار أمريكي)
الجدول 74 سوق الأدوية المجففة بالتجميد القابلة للحقن في أمريكا الشمالية، حسب قنوات التوزيع، 2019-2028 (مليون دولار أمريكي)
الجدول 75: سوق الأدوية المجففة بالتجميد القابلة للحقن في الولايات المتحدة، حسب العبوة، 2019-2028 (مليون دولار أمريكي)
الجدول 76: سوق الأدوية المجففة بالتجميد القابلة للحقن في الولايات المتحدة، حسب فئة الدواء، 2019-2028 (مليون دولار أمريكي)
الجدول 77: سوق الأدوية المجففة بالتجميد القابلة للحقن في الولايات المتحدة، حسب فئة الدواء، 2019-2028 (وحدات)
الجدول 78: سوق الأدوية المضادة للعدوى في الولايات المتحدة الأمريكية، حسب فئة الدواء، 2019-2028 (مليون دولار أمريكي)
الجدول 79: سوق المضادات الحيوية الأمريكية في الأدوية المجففة بالتجميد القابلة للحقن، حسب فئة الدواء، 2019-2028 (مليون دولار أمريكي)
الجدول 80: سوق مضادات الفطريات في الأدوية المجففة بالتجميد القابلة للحقن في الولايات المتحدة، حسب فئة الدواء، 2019-2028 (مليون دولار أمريكي)
الجدول 81 سوق الأدوية المضادة للفيروسات في الولايات المتحدة الأمريكية، حسب فئة الدواء، 2019-2028 (مليون دولار أمريكي)
الجدول 82 سوق الأدوية المضادة للأورام في الولايات المتحدة الأمريكية، حسب فئة الدواء، 2019-2028 (مليون دولار أمريكي)
الجدول 83: سوق مدرات البول في الولايات المتحدة الأمريكية في الأدوية المجففة بالتجميد القابلة للحقن، حسب فئة الدواء، 2019-2028 (مليون دولار أمريكي)
الجدول 84: سوق مثبطات مضخة البروتون في الأدوية المجففة بالتجميد القابلة للحقن في الولايات المتحدة، حسب فئة الدواء، 2019-2028 (مليون دولار أمريكي)
الجدول 85 سوق التخدير في الولايات المتحدة الأمريكية في الأدوية المجففة بالتجميد القابلة للحقن، حسب فئة الدواء، 2019-2028 (مليون دولار أمريكي)
الجدول 86 سوق مضادات التخثر الأمريكية في الأدوية المجففة بالتجميد القابلة للحقن، حسب فئة الدواء، 2019-2028 (مليون دولار أمريكي)
الجدول 87 مضادات الالتهاب غير الستيرويدية الأمريكية في سوق الأدوية المجففة بالتجميد القابلة للحقن، حسب فئة الدواء، 2019-2028 (مليون دولار أمريكي)
الجدول 88: سوق الكورتيكوستيرويدات في الأدوية المجففة بالتجميد في الولايات المتحدة، حسب فئة الدواء، 2019-2028 (مليون دولار أمريكي)
الجدول 89: سوق الأدوية المجففة بالتجميد القابلة للحقن في الولايات المتحدة، حسب الشكل، 2019-2028 (مليون دولار أمريكي)
الجدول 90: سوق الأدوية المجففة بالتجميد القابلة للحقن في الولايات المتحدة، حسب المؤشرات، 2019-2028 (مليون دولار أمريكي)
الجدول 91: سوق الأدوية المجففة بالتجميد القابلة للحقن في الولايات المتحدة، حسب طريقة الإدارة، 2019-2028 (مليون دولار أمريكي)
الجدول 92: سوق الأدوية المجففة بالتجميد القابلة للحقن في الولايات المتحدة، حسب المستخدم النهائي، 2019-2028 (مليون دولار أمريكي)
الجدول 93: سوق الأدوية المجففة بالتجميد القابلة للحقن في الولايات المتحدة، حسب قنوات التوزيع، 2019-2028 (مليون دولار أمريكي)
الجدول 94: سوق الأدوية المجففة بالتجميد القابلة للحقن في كندا، حسب العبوة، 2019-2028 (مليون دولار أمريكي)
الجدول 95: سوق الأدوية المجففة بالتجميد القابلة للحقن في كندا، حسب فئة الدواء، 2019-2028 (مليون دولار أمريكي)
الجدول 96: سوق الأدوية المجففة بالتجميد القابلة للحقن في كندا، حسب فئة الدواء، 2019-2028 (وحدات)
الجدول 97: سوق مضادات العدوى في الأدوية المجففة بالتجميد القابلة للحقن في كندا، حسب فئة الدواء، 2019-2028 (مليون دولار أمريكي)
الجدول 98: سوق المضادات الحيوية في الأدوية المجففة بالتجميد القابلة للحقن في كندا، حسب فئة الدواء، 2019-2028 (مليون دولار أمريكي)
الجدول 99: سوق مضادات الفطريات في الأدوية المجففة بالتجميد القابلة للحقن في كندا، حسب فئة الدواء، 2019-2028 (مليون دولار أمريكي)
الجدول 100: سوق الأدوية المضادة للفيروسات في كندا، المجففة بالتجميد، حسب فئة الدواء، 2019-2028 (مليون دولار أمريكي)
الجدول 101 سوق الأدوية المضادة للأورام في كندا، المجففة بالتجميد، حسب فئة الدواء، 2019-2028 (مليون دولار أمريكي)
الجدول 102: سوق مدرات البول في الأدوية المجففة بالتجميد القابلة للحقن في كندا، حسب فئة الدواء، 2019-2028 (مليون دولار أمريكي)
الجدول 103: سوق مثبطات مضخة البروتون في الأدوية المجففة بالتجميد القابلة للحقن في كندا، حسب فئة الدواء، 2019-2028 (مليون دولار أمريكي)
الجدول 104: سوق التخدير في الأدوية المجففة بالتجميد القابلة للحقن في كندا، حسب فئة الدواء، 2019-2028 (مليون دولار أمريكي)
الجدول 105 سوق مضادات التخثر في الأدوية المجففة بالتجميد القابلة للحقن في كندا، حسب فئة الدواء، 2019-2028 (مليون دولار أمريكي)
الجدول 106: مضادات الالتهاب غير الستيرويدية في سوق الأدوية المجففة بالتجميد في كندا، حسب فئة الدواء، 2019-2028 (مليون دولار أمريكي)
الجدول 107: سوق الكورتيكوستيرويدات في الأدوية المجففة بالتجميد القابلة للحقن في كندا، حسب فئة الدواء، 2019-2028 (مليون دولار أمريكي)
الجدول 108: سوق الأدوية المجففة بالتجميد القابلة للحقن في كندا، حسب الشكل، 2019-2028 (مليون دولار أمريكي)
الجدول 109: سوق الأدوية المجففة بالتجميد القابلة للحقن في كندا، حسب المؤشرات، 2019-2028 (مليون دولار أمريكي)
الجدول 110: سوق الأدوية المجففة بالتجميد القابلة للحقن في كندا، حسب طريقة الإدارة، 2019-2028 (مليون دولار أمريكي)
الجدول ١١١: سوق الأدوية المجففة بالتجميد القابلة للحقن في كندا، حسب المستخدم النهائي، ٢٠١٩-٢٠٢٨ (مليون دولار أمريكي)
الجدول ١١٢: سوق الأدوية المجففة بالتجميد القابلة للحقن في كندا، حسب قنوات التوزيع، ٢٠١٩-٢٠٢٨ (مليون دولار أمريكي)
الجدول 113 سوق الأدوية المجففة بالتجميد القابلة للحقن في المكسيك، حسب العبوة، 2019-2028 (مليون دولار أمريكي)
الجدول 114: سوق الأدوية المجففة بالتجميد القابلة للحقن في المكسيك، حسب فئة الدواء، 2019-2028 (مليون دولار أمريكي)
الجدول 115: سوق الأدوية المجففة بالتجميد القابلة للحقن في المكسيك، حسب فئة الدواء، 2019-2028 (وحدات)
الجدول 116: سوق مضادات العدوى في الأدوية المجففة بالتجميد القابلة للحقن في المكسيك، حسب فئة الدواء، 2019-2028 (مليون دولار أمريكي)
الجدول 117: سوق المضادات الحيوية في الأدوية المجففة بالتجميد القابلة للحقن في المكسيك، حسب فئة الدواء، 2019-2028 (مليون دولار أمريكي)
الجدول 118 سوق مضادات الفطريات في الأدوية المجففة بالتجميد القابلة للحقن في المكسيك، حسب فئة الدواء، 2019-2028 (مليون دولار أمريكي)
الجدول 119: سوق الأدوية المضادة للفيروسات في الأدوية المجففة بالتجميد القابلة للحقن في المكسيك، حسب فئة الدواء، 2019-2028 (مليون دولار أمريكي)
الجدول 120: سوق الأدوية المضادة للأورام في المكسيك، حسب فئة الدواء، 2019-2028 (مليون دولار أمريكي)
الجدول 121: سوق مدرات البول في الأدوية المجففة بالتجميد القابلة للحقن في المكسيك، حسب فئة الدواء، 2019-2028 (مليون دولار أمريكي)
الجدول 122: سوق مثبطات مضخة البروتون في الأدوية المجففة بالتجميد القابلة للحقن في المكسيك، حسب فئة الدواء، 2019-2028 (مليون دولار أمريكي)
الجدول 123: سوق التخدير في الأدوية المجففة بالتجميد القابلة للحقن في المكسيك، حسب فئة الدواء، 2019-2028 (مليون دولار أمريكي)
الجدول 124: سوق مضادات التخثر في الأدوية المجففة بالتجميد القابلة للحقن في المكسيك، حسب فئة الدواء، 2019-2028 (مليون دولار أمريكي)
الجدول 125: مضادات الالتهاب غير الستيرويدية في سوق الأدوية المجففة بالتجميد في المكسيك، حسب فئة الدواء، 2019-2028 (مليون دولار أمريكي)
الجدول 126: سوق الكورتيكوستيرويدات في الأدوية المجففة بالتجميد القابلة للحقن في المكسيك، حسب فئة الدواء، 2019-2028 (مليون دولار أمريكي)
الجدول 127: سوق الأدوية المجففة بالتجميد القابلة للحقن في المكسيك، حسب الشكل، 2019-2028 (مليون دولار أمريكي)
الجدول 128: سوق الأدوية القابلة للحقن المجففة باليوفيليز في المكسيك، حسب المؤشرات، 2019-2028 (مليون دولار أمريكي)
الجدول 129: سوق الأدوية المجففة بالتجميد القابلة للحقن في المكسيك، حسب طريقة الإعطاء، 2019-2028 (مليون دولار أمريكي)
الجدول 130: سوق الأدوية المجففة بالتجميد القابلة للحقن في المكسيك، حسب المستخدم النهائي، 2019-2028 (مليون دولار أمريكي)
الجدول 131: سوق الأدوية المجففة بالتجميد القابلة للحقن في المكسيك، حسب قنوات التوزيع، 2019-2028 (مليون دولار أمريكي)
الجدول 132 سوق الأدوية المجففة بالتجميد القابلة للحقن في أوروبا، حسب البلد، 2019-2028 (مليون دولار أمريكي)
الجدول 133: سوق الأدوية المجففة بالتجميد القابلة للحقن في أوروبا، حسب العبوة، 2019-2028 (مليون دولار أمريكي)
الجدول 134 سوق الأدوية المجففة بالتجميد القابلة للحقن في أوروبا، حسب فئة الدواء، 2019-2028 (مليون دولار أمريكي)
الجدول 135: سوق الأدوية المجففة بالتجميد القابلة للحقن في أوروبا، حسب فئة الدواء، 2019-2028 (وحدات)
الجدول 136 سوق مضادات العدوى في أوروبا في الأدوية المجففة بالتجميد القابلة للحقن، حسب فئة الدواء، 2019-2028 (مليون دولار أمريكي)
الجدول 137 سوق المضادات الحيوية في الأدوية المجففة بالتجميد في أوروبا، حسب فئة الدواء، 2019-2028 (مليون دولار أمريكي)
الجدول 138: سوق الأدوية المضادة للفطريات في أوروبا، المجففة بالتجميد، حسب فئة الدواء، 2019-2028 (مليون دولار أمريكي)
الجدول 139 سوق الأدوية المضادة للفيروسات في أوروبا، المجففة بالتجميد، حسب فئة الدواء، 2019-2028 (مليون دولار أمريكي)
الجدول 140 سوق الأدوية المضادة للأورام في أوروبا، حسب فئة الدواء، 2019-2028 (مليون دولار أمريكي)
الجدول 141 سوق مدرات البول في الأدوية المجففة بالتجميد في أوروبا، حسب فئة الدواء، 2019-2028 (مليون دولار أمريكي)
الجدول 142 سوق مثبطات مضخة البروتون في الأدوية المجففة بالتجميد في أوروبا، حسب فئة الدواء، 2019-2028 (مليون دولار أمريكي)
الجدول 143 سوق التخدير في الأدوية المجففة بالتجميد في أوروبا، حسب فئة الدواء، 2019-2028 (مليون دولار أمريكي)
الجدول 144 سوق مضادات التخثر في الأدوية المجففة بالتجميد في أوروبا، حسب فئة الدواء، 2019-2028 (مليون دولار أمريكي)
الجدول 145: سوق مضادات الالتهاب غير الستيرويدية في أوروبا في الأدوية المجففة بالتجميد القابلة للحقن، حسب فئة الدواء، 2019-2028 (مليون دولار أمريكي)
الجدول 146 سوق الكورتيكوستيرويدات في الأدوية المجففة بالتجميد في أوروبا، حسب فئة الدواء، 2019-2028 (مليون دولار أمريكي)
الجدول 147: سوق الأدوية المجففة بالتجميد القابلة للحقن في أوروبا، حسب الشكل، 2019-2028 (مليون دولار أمريكي)
الجدول 148: سوق الأدوية المجففة بالتجميد القابلة للحقن في أوروبا، حسب المؤشرات، 2019-2028 (مليون دولار أمريكي)
الجدول 149: سوق الأدوية المجففة بالتجميد القابلة للحقن في أوروبا، حسب طريقة الإدارة، 2019-2028 (مليون دولار أمريكي)
الجدول 150: سوق الأدوية المجففة بالتجميد القابلة للحقن في أوروبا، حسب المستخدم النهائي، 2019-2028 (مليون دولار أمريكي)
الجدول 151 سوق الأدوية المجففة بالتجميد القابلة للحقن في أوروبا، حسب قنوات التوزيع، 2019-2028 (مليون دولار أمريكي)
الجدول 152 سوق الأدوية المجففة بالتجميد القابلة للحقن في ألمانيا، حسب العبوة، 2019-2028 (مليون دولار أمريكي)
الجدول 153 سوق الأدوية المجففة بالتجميد القابلة للحقن في ألمانيا، حسب فئة الدواء، 2019-2028 (مليون دولار أمريكي)
الجدول 154: سوق الأدوية المجففة بالتجميد القابلة للحقن في ألمانيا، حسب فئة الدواء، 2019-2028 (وحدات)
الجدول 155 سوق الأدوية المضادة للعدوى المجففة بالتجميد القابلة للحقن في ألمانيا، حسب فئة الدواء، 2019-2028 (مليون دولار أمريكي)
الجدول 156 سوق المضادات الحيوية في ألمانيا للأدوية المجففة بالتجميد القابلة للحقن، حسب فئة الدواء، 2019-2028 (مليون دولار أمريكي)
الجدول 157 سوق مضادات الفطريات في الأدوية المجففة بالتجميد القابلة للحقن في ألمانيا، حسب فئة الدواء، 2019-2028 (مليون دولار أمريكي)
الجدول 158 سوق الأدوية المضادة للفيروسات في ألمانيا، حسب فئة الدواء، 2019-2028 (مليون دولار أمريكي)
الجدول 159 سوق الأدوية المضادة للأورام في ألمانيا، حسب فئة الدواء، 2019-2028 (مليون دولار أمريكي)
الجدول 160 سوق مدرات البول في ألمانيا في الأدوية المجففة بالتجميد القابلة للحقن، حسب فئة الدواء، 2019-2028 (مليون دولار أمريكي)
الجدول 161 سوق مثبطات مضخة البروتون في الأدوية المجففة بالتجميد القابلة للحقن في ألمانيا، حسب فئة الدواء، 2019-2028 (مليون دولار أمريكي)
الجدول 162 سوق التخدير في ألمانيا في الأدوية المجففة بالتجميد القابلة للحقن، حسب فئة الدواء، 2019-2028 (مليون دولار أمريكي)
الجدول 163 سوق مضادات التخثر في الأدوية المجففة بالتجميد القابلة للحقن في ألمانيا، حسب فئة الدواء، 2019-2028 (مليون دولار أمريكي)
الجدول 164 مضادات الالتهاب غير الستيرويدية في سوق الأدوية المجففة بالتجميد القابلة للحقن في ألمانيا، حسب فئة الدواء، 2019-2028 (مليون دولار أمريكي)
الجدول 165 سوق الكورتيكوستيرويدات في الأدوية المجففة بالتجميد القابلة للحقن في ألمانيا، حسب فئة الدواء، 2019-2028 (مليون دولار أمريكي)
الجدول 166 سوق الأدوية المجففة بالتجميد القابلة للحقن في ألمانيا، حسب الشكل، 2019-2028 (مليون دولار أمريكي)
الجدول 167: سوق الأدوية المجففة بالتجميد القابلة للحقن في ألمانيا، حسب المؤشرات، 2019-2028 (مليون دولار أمريكي)
الجدول 168 سوق الأدوية المجففة بالتجميد القابلة للحقن في ألمانيا، حسب طريقة الإدارة، 2019-2028 (مليون دولار أمريكي)
الجدول 169 سوق الأدوية المجففة بالتجميد القابلة للحقن في ألمانيا، حسب المستخدم النهائي، 2019-2028 (مليون دولار أمريكي)
الجدول 170 سوق الأدوية المجففة بالتجميد القابلة للحقن في ألمانيا، حسب قنوات التوزيع، 2019-2028 (مليون دولار أمريكي)
الجدول 171 سوق الأدوية المجففة بالتجميد القابلة للحقن في فرنسا، حسب العبوة، 2019-2028 (مليون دولار أمريكي)
الجدول 172 سوق الأدوية المجففة بالتجميد القابلة للحقن في فرنسا، حسب فئة الدواء، 2019-2028 (مليون دولار أمريكي)
الجدول 173: سوق الأدوية المجففة بالتجميد القابلة للحقن في فرنسا، حسب فئة الدواء، 2019-2028 (وحدات)
الجدول 174 سوق مضادات العدوى في الأدوية المجففة بالتجميد القابلة للحقن في فرنسا، حسب فئة الدواء، 2019-2028 (مليون دولار أمريكي)
الجدول 175: سوق المضادات الحيوية في الأدوية المجففة بالتجميد القابلة للحقن في فرنسا، حسب فئة الدواء، 2019-2028 (مليون دولار أمريكي)
الجدول 176 سوق مضادات الفطريات في الأدوية المجففة بالتجميد القابلة للحقن في فرنسا، حسب فئة الدواء، 2019-2028 (مليون دولار أمريكي)
الجدول 177 سوق الأدوية المضادة للفيروسات في فرنسا، المجففة بالتجميد، حسب فئة الدواء، 2019-2028 (مليون دولار أمريكي)
الجدول 178 سوق الأدوية المضادة للأورام في فرنسا، حسب فئة الدواء، 2019-2028 (مليون دولار أمريكي)
الجدول 179 سوق مدرات البول في الأدوية المجففة بالتجميد القابلة للحقن في فرنسا، حسب فئة الدواء، 2019-2028 (مليون دولار أمريكي)
الجدول 180: سوق مثبطات مضخة البروتون في الأدوية المجففة بالتجميد القابلة للحقن في فرنسا، حسب فئة الدواء، 2019-2028 (مليون دولار أمريكي)
الجدول 181 سوق التخدير في فرنسا في الأدوية المجففة بالتجميد القابلة للحقن، حسب فئة الدواء، 2019-2028 (مليون دولار أمريكي)
الجدول 182 سوق مضادات التخثر في الأدوية المجففة بالتجميد القابلة للحقن في فرنسا، حسب فئة الدواء، 2019-2028 (مليون دولار أمريكي)
الجدول 183: مضادات الالتهاب غير الستيرويدية في سوق الأدوية المجففة بالتجميد في فرنسا، حسب فئة الدواء، 2019-2028 (مليون دولار أمريكي)
الجدول 184 سوق الكورتيكوستيرويدات في الأدوية المجففة بالتجميد في فرنسا، حسب فئة الدواء، 2019-2028 (مليون دولار أمريكي)
الجدول 185 سوق الأدوية المجففة بالتجميد القابلة للحقن في فرنسا، حسب الشكل، 2019-2028 (مليون دولار أمريكي)
الجدول 186: سوق الأدوية المجففة بالتجميد القابلة للحقن في فرنسا، حسب المؤشرات، 2019-2028 (مليون دولار أمريكي)
الجدول 187: سوق الأدوية المجففة بالتجميد القابلة للحقن في فرنسا، حسب طريقة الإدارة، 2019-2028 (مليون دولار أمريكي)
الجدول 188 سوق الأدوية المجففة بالتجميد القابلة للحقن في فرنسا، حسب المستخدم النهائي، 2019-2028 (مليون دولار أمريكي)
الجدول 189 سوق الأدوية المجففة بالتجميد القابلة للحقن في فرنسا، حسب قنوات التوزيع، 2019-2028 (مليون دولار أمريكي)
الجدول 190 سوق الأدوية المجففة بالتجميد القابلة للحقن في المملكة المتحدة، حسب العبوة، 2019-2028 (مليون دولار أمريكي)
الجدول 191 سوق الأدوية المجففة بالتجميد القابلة للحقن في المملكة المتحدة، حسب فئة الدواء، 2019-2028 (مليون دولار أمريكي)
الجدول 192: سوق الأدوية المجففة بالتجميد القابلة للحقن في المملكة المتحدة، حسب فئة الدواء، 2019-2028 (وحدات)
الجدول 193 سوق مضادات العدوى في المملكة المتحدة في الأدوية المجففة بالتجميد القابلة للحقن، حسب فئة الدواء، 2019-2028 (مليون دولار أمريكي)
الجدول 194: سوق المضادات الحيوية في المملكة المتحدة في مجال الأدوية المجففة بالتجميد القابلة للحقن، حسب فئة الدواء، 2019-2028 (مليون دولار أمريكي)
الجدول 195: سوق مضادات الفطريات في الأدوية المجففة بالتجميد القابلة للحقن في المملكة المتحدة، حسب فئة الدواء، 2019-2028 (مليون دولار أمريكي)
الجدول 196 سوق الأدوية المضادة للفيروسات في المملكة المتحدة، حسب فئة الدواء، 2019-2028 (مليون دولار أمريكي)
الجدول 197 سوق الأدوية المضادة للأورام في المملكة المتحدة، حسب فئة الدواء، 2019-2028 (مليون دولار أمريكي)
الجدول 198 سوق مدرات البول في المملكة المتحدة ضمن الأدوية المجففة بالتجميد القابلة للحقن، حسب فئة الدواء، 2019-2028 (مليون دولار أمريكي)
الجدول 199 سوق مثبطات مضخة البروتون في المملكة المتحدة للأدوية المجففة بالتجميد القابلة للحقن، حسب فئة الدواء، 2019-2028 (مليون دولار أمريكي)
الجدول 200: سوق التخدير في المملكة المتحدة في الأدوية المجففة بالتجميد القابلة للحقن، حسب فئة الدواء، 2019-2028 (مليون دولار أمريكي)
الجدول ٢٠١ سوق مضادات التخثر في الأدوية المجففة بالتجميد القابلة للحقن في المملكة المتحدة، حسب فئة الدواء، ٢٠١٩-٢٠٢٨ (مليون دولار أمريكي)
الجدول 202: مضادات الالتهاب غير الستيرويدية في سوق الأدوية المجففة بالتجميد في المملكة المتحدة، حسب فئة الدواء، 2019-2028 (مليون دولار أمريكي)
الجدول 203: سوق الكورتيكوستيرويدات في المملكة المتحدة في الأدوية المجففة بالتجميد القابلة للحقن، حسب فئة الدواء، 2019-2028 (مليون دولار أمريكي)
الجدول 204: سوق الأدوية المجففة بالتجميد القابلة للحقن في المملكة المتحدة، حسب الشكل، 2019-2028 (مليون دولار أمريكي)
الجدول 205: سوق الأدوية المجففة بالتجميد القابلة للحقن في المملكة المتحدة، حسب المؤشرات، 2019-2028 (مليون دولار أمريكي)
الجدول 206: سوق الأدوية المجففة بالتجميد القابلة للحقن في المملكة المتحدة، حسب طريقة الإدارة، 2019-2028 (مليون دولار أمريكي)
الجدول 207 سوق الأدوية المجففة بالتجميد القابلة للحقن في المملكة المتحدة، حسب المستخدم النهائي، 2019-2028 (مليون دولار أمريكي)
الجدول 208 سوق الأدوية المجففة بالتجميد القابلة للحقن في المملكة المتحدة، حسب قنوات التوزيع، 2019-2028 (مليون دولار أمريكي)
الجدول 209: سوق الأدوية المجففة بالتجميد القابلة للحقن في إيطاليا، حسب العبوة، 2019-2028 (مليون دولار أمريكي)
الجدول 210: سوق الأدوية المجففة بالتجميد القابلة للحقن في إيطاليا، حسب فئة الدواء، 2019-2028 (مليون دولار أمريكي)
الجدول 211: سوق الأدوية المجففة بالتجميد القابلة للحقن في إيطاليا، حسب فئة الدواء، 2019-2028 (وحدات)
الجدول 212 - سوق مضادات العدوى في الأدوية المجففة بالتجميد القابلة للحقن في إيطاليا، حسب فئة الدواء، 2019-2028 (مليون دولار أمريكي)
الجدول 213: سوق المضادات الحيوية في الأدوية المجففة بالتجميد القابلة للحقن في إيطاليا، حسب فئة الدواء، 2019-2028 (مليون دولار أمريكي)
الجدول 214: سوق مضادات الفطريات في الأدوية المجففة بالتجميد القابلة للحقن في إيطاليا، حسب فئة الدواء، 2019-2028 (مليون دولار أمريكي)
الجدول 215: سوق الأدوية المضادة للفيروسات في إيطاليا، المجففة بالتجميد، حسب فئة الدواء، 2019-2028 (مليون دولار أمريكي)
الجدول 216 - سوق الأدوية المضادة للأورام في إيطاليا، حسب فئة الدواء، 2019-2028 (مليون دولار أمريكي)
الجدول 217 - سوق مدرات البول في الأدوية المجففة بالتجميد القابلة للحقن في إيطاليا، حسب فئة الدواء، 2019-2028 (مليون دولار أمريكي)
الجدول 218: سوق مثبطات مضخة البروتون في الأدوية المجففة بالتجميد القابلة للحقن في إيطاليا، حسب فئة الدواء، 2019-2028 (مليون دولار أمريكي)
الجدول 219: سوق التخدير في الأدوية المجففة بالتجميد القابلة للحقن في إيطاليا، حسب فئة الدواء، 2019-2028 (مليون دولار أمريكي)
الجدول 220 - سوق مضادات التخثر في الأدوية المجففة بالتجميد القابلة للحقن في إيطاليا، حسب فئة الدواء، 2019-2028 (مليون دولار أمريكي)
الجدول 221 إيطاليا: مضادات الالتهاب غير الستيرويدية في سوق الأدوية المجففة بالتجميد القابلة للحقن، حسب فئة الدواء، 2019-2028 (مليون دولار أمريكي)
الجدول 222 إيطاليا: سوق الكورتيكوستيرويدات في الأدوية المجففة بالتجميد القابلة للحقن، حسب فئة الدواء، 2019-2028 (مليون دولار أمريكي)
الجدول 223: سوق الأدوية المجففة بالتجميد القابلة للحقن في إيطاليا، حسب الشكل، 2019-2028 (مليون دولار أمريكي)
الجدول 224: سوق الأدوية المجففة بالتجميد القابلة للحقن في إيطاليا، حسب المؤشرات، 2019-2028 (مليون دولار أمريكي)
الجدول 225: سوق الأدوية المجففة بالتجميد القابلة للحقن في إيطاليا، حسب طريقة الإدارة، 2019-2028 (مليون دولار أمريكي)
الجدول 226 سوق الأدوية المجففة بالتجميد القابلة للحقن في إيطاليا، حسب المستخدم النهائي، 2019-2028 (مليون دولار أمريكي)
الجدول 227: سوق الأدوية المجففة بالتجميد القابلة للحقن في إيطاليا، حسب قنوات التوزيع، 2019-2028 (مليون دولار أمريكي)
الجدول 228 سوق الأدوية المجففة بالتجميد القابلة للحقن في إسبانيا، حسب العبوة، 2019-2028 (مليون دولار أمريكي)
الجدول 229 سوق الأدوية المجففة بالتجميد القابلة للحقن في إسبانيا، حسب فئة الدواء، 2019-2028 (مليون دولار أمريكي)
الجدول 230: سوق الأدوية المجففة بالتجميد القابلة للحقن في إسبانيا، حسب فئة الدواء، 2019-2028 (وحدات)
الجدول 231 - سوق مضادات العدوى في الأدوية المجففة بالتجميد القابلة للحقن في إسبانيا، حسب فئة الدواء، 2019-2028 (مليون دولار أمريكي)
الجدول 232 إسبانيا: المضادات الحيوية في سوق الأدوية المجففة بالتجميد القابلة للحقن، حسب فئة الدواء، 2019-2028 (مليون دولار أمريكي)
الجدول 233 - سوق مضادات الفطريات في الأدوية المجففة بالتجميد القابلة للحقن في إسبانيا، حسب فئة الدواء، 2019-2028 (مليون دولار أمريكي)
الجدول 234 سوق الأدوية المضادة للفيروسات في إسبانيا، المجففة بالتجميد، حسب فئة الدواء، 2019-2028 (مليون دولار أمريكي)
الجدول 235 - سوق الأدوية المضادة للأورام في إسبانيا، المجففة بالتجميد، حسب فئة الدواء، 2019-2028 (مليون دولار أمريكي)
الجدول 236 - سوق مدرات البول في الأدوية المجففة بالتجميد القابلة للحقن في إسبانيا، حسب فئة الدواء، 2019-2028 (مليون دولار أمريكي)
الجدول 237 - سوق مثبطات مضخة البروتون في الأدوية المجففة بالتجميد القابلة للحقن في إسبانيا، حسب فئة الدواء، 2019-2028 (مليون دولار أمريكي)
الجدول 238 - سوق التخدير في الأدوية المجففة بالتجميد القابلة للحقن في إسبانيا، حسب فئة الدواء، 2019-2028 (مليون دولار أمريكي)
الجدول 239 - سوق مضادات التخثر في الأدوية المجففة بالتجميد القابلة للحقن في إسبانيا، حسب فئة الدواء، 2019-2028 (مليون دولار أمريكي)
الجدول 240 إسبانيا: مضادات الالتهاب غير الستيرويدية في سوق الأدوية المجففة بالتجميد القابلة للحقن، حسب فئة الدواء، 2019-2028 (مليون دولار أمريكي)
الجدول 241 - إسبانيا - سوق الكورتيكوستيرويدات في الأدوية المجففة بالتجميد القابلة للحقن، حسب فئة الدواء، 2019-2028 (مليون دولار أمريكي)
الجدول ٢٤٢ سوق الأدوية المجففة بالتجميد القابلة للحقن في إسبانيا، حسب الشكل، ٢٠١٩-٢٠٢٨ (مليون دولار أمريكي)
الجدول 243: سوق الأدوية المجففة بالتجميد القابلة للحقن في إسبانيا، حسب المؤشرات، 2019-2028 (مليون دولار أمريكي)
الجدول 244 سوق الأدوية المجففة بالتجميد القابلة للحقن في إسبانيا، حسب طريقة الإدارة، 2019-2028 (مليون دولار أمريكي)
الجدول 245 سوق الأدوية المجففة بالتجميد القابلة للحقن في إسبانيا، حسب المستخدم النهائي، 2019-2028 (مليون دولار أمريكي)
الجدول 246 سوق الأدوية المجففة بالتجميد القابلة للحقن في إسبانيا، حسب قنوات التوزيع، 2019-2028 (مليون دولار أمريكي)
الجدول 247: سوق الأدوية المجففة بالتجميد القابلة للحقن في هولندا، حسب العبوة، 2019-2028 (مليون دولار أمريكي)
الجدول 248: سوق الأدوية المجففة بالتجميد القابلة للحقن في هولندا، حسب فئة الدواء، 2019-2028 (مليون دولار أمريكي)
الجدول 249: سوق الأدوية المجففة بالتجميد القابلة للحقن في هولندا، حسب فئة الدواء، 2019-2028 (الوحدات)
الجدول 250 - سوق مضادات العدوى في الأدوية المجففة بالتجميد القابلة للحقن في هولندا، حسب فئة الدواء، 2019-2028 (مليون دولار أمريكي)
الجدول 251 هولندا: المضادات الحيوية في سوق الأدوية المجففة بالتجميد القابلة للحقن، حسب فئة الدواء، 2019-2028 (مليون دولار أمريكي)
الجدول 252 - سوق مضادات الفطريات في الأدوية المجففة بالتجميد القابلة للحقن في هولندا، حسب فئة الدواء، 2019-2028 (مليون دولار أمريكي)
الجدول 253 - سوق الأدوية المضادة للفيروسات في هولندا، المجففة بالتجميد، حسب فئة الدواء، 2019-2028 (مليون دولار أمريكي)
الجدول 254 - سوق الأدوية المضادة للأورام في هولندا، حسب فئة الدواء، 2019-2028 (مليون دولار أمريكي)
الجدول 255 - هولندا: سوق مدرات البول في الأدوية المجففة بالتجميد القابلة للحقن، حسب فئة الدواء، 2019-2028 (مليون دولار أمريكي)
الجدول 256 - سوق مثبطات مضخة البروتون في الأدوية المجففة بالتجميد القابلة للحقن في هولندا، حسب فئة الدواء، 2019-2028 (مليون دولار أمريكي)
الجدول 257: سوق التخدير في الأدوية المجففة بالتجميد القابلة للحقن في هولندا، حسب فئة الدواء، 2019-2028 (مليون دولار أمريكي)
الجدول 258 - سوق مضادات التخثر في الأدوية المجففة بالتجميد القابلة للحقن في هولندا، حسب فئة الدواء، 2019-2028 (مليون دولار أمريكي)
الجدول 259 - هولندا: مضادات الالتهاب غير الستيرويدية في سوق الأدوية المجففة بالتجميد القابلة للحقن، حسب فئة الدواء، 2019-2028 (مليون دولار أمريكي)
الجدول 260 - سوق الكورتيكوستيرويدات في الأدوية المجففة بالتجميد القابلة للحقن في هولندا، حسب فئة الدواء، 2019-2028 (مليون دولار أمريكي)
الجدول 261: سوق الأدوية المجففة بالتجميد القابلة للحقن في هولندا، حسب الشكل، 2019-2028 (مليون دولار أمريكي)
الجدول 262: سوق الأدوية المجففة بالتجميد القابلة للحقن في هولندا، حسب المؤشرات، 2019-2028 (مليون دولار أمريكي)
الجدول 263: سوق الأدوية المجففة بالتجميد القابلة للحقن في هولندا، حسب طريقة الإدارة، 2019-2028 (مليون دولار أمريكي)
الجدول 264: سوق الأدوية المجففة بالتجميد القابلة للحقن في هولندا، حسب المستخدم النهائي، 2019-2028 (مليون دولار أمريكي)
الجدول 265: سوق الأدوية المجففة بالتجميد القابلة للحقن في هولندا، حسب قنوات التوزيع، 2019-2028 (مليون دولار أمريكي)
الجدول 266 سوق الأدوية المجففة بالتجميد القابلة للحقن في روسيا، حسب العبوة، 2019-2028 (مليون دولار أمريكي)
الجدول 267: سوق الأدوية المجففة بالتجميد القابلة للحقن في روسيا، حسب فئة الدواء، 2019-2028 (مليون دولار أمريكي)
الجدول 268: سوق الأدوية المجففة بالتجميد القابلة للحقن في روسيا، حسب فئة الدواء، 2019-2028 (الوحدات)
الجدول 269: سوق مضادات العدوى في الأدوية المجففة بالتجميد القابلة للحقن في روسيا، حسب فئة الدواء، 2019-2028 (مليون دولار أمريكي)
الجدول 270: المضادات الحيوية في سوق الأدوية المجففة بالتجميد القابلة للحقن في روسيا، حسب فئة الدواء، 2019-2028 (مليون دولار أمريكي)
الجدول 271 سوق مضادات الفطريات في الأدوية المجففة بالتجميد القابلة للحقن في روسيا، حسب فئة الدواء، 2019-2028 (مليون دولار أمريكي)
الجدول 272 سوق الأدوية المضادة للفيروسات في روسيا، حسب فئة الدواء، 2019-2028 (مليون دولار أمريكي)
الجدول 273 سوق الأدوية المضادة للأورام في روسيا، حسب فئة الدواء، 2019-2028 (مليون دولار أمريكي)
الجدول 274: سوق مدرات البول في الأدوية المجففة بالتجميد القابلة للحقن في روسيا، حسب فئة الدواء، 2019-2028 (مليون دولار أمريكي)
الجدول 275: سوق مثبطات مضخة البروتون في الأدوية المجففة بالتجميد القابلة للحقن في روسيا، حسب فئة الدواء، 2019-2028 (مليون دولار أمريكي)
الجدول 276: سوق التخدير في الأدوية المجففة بالتجميد القابلة للحقن في روسيا، حسب فئة الدواء، 2019-2028 (مليون دولار أمريكي)
الجدول 277 سوق مضادات التخثر في الأدوية المجففة بالتجميد القابلة للحقن في روسيا، حسب فئة الدواء، 2019-2028 (مليون دولار أمريكي)
الجدول 278 مضادات الالتهاب غير الستيرويدية في سوق الأدوية المجففة بالتجميد القابلة للحقن في روسيا، حسب فئة الدواء، 2019-2028 (مليون دولار أمريكي)
الجدول 279: سوق الكورتيكوستيرويدات في الأدوية المجففة بالتجميد القابلة للحقن في روسيا، حسب فئة الدواء، 2019-2028 (مليون دولار أمريكي)
الجدول 280: سوق الأدوية المجففة بالتجميد القابلة للحقن في روسيا، حسب الشكل، 2019-2028 (مليون دولار أمريكي)
الجدول 281: سوق الأدوية المجففة بالتجميد القابلة للحقن في روسيا، حسب المؤشرات، 2019-2028 (مليون دولار أمريكي)
الجدول 282 سوق الأدوية المجففة بالتجميد القابلة للحقن في روسيا، حسب طريقة الإدارة، 2019-2028 (مليون دولار أمريكي)
الجدول 283 سوق الأدوية المجففة بالتجميد القابلة للحقن في روسيا، حسب المستخدم النهائي، 2019-2028 (مليون دولار أمريكي)
الجدول 284: سوق الأدوية المجففة بالتجميد القابلة للحقن في روسيا، حسب قنوات التوزيع، 2019-2028 (مليون دولار أمريكي)
الجدول 285: سوق الأدوية المجففة بالتجميد القابلة للحقن في سويسرا، حسب العبوة، 2019-2028 (مليون دولار أمريكي)
الجدول 286: سوق الأدوية المجففة بالتجميد القابلة للحقن في سويسرا، حسب فئة الدواء، 2019-2028 (مليون دولار أمريكي)
الجدول 287: سوق الأدوية المجففة بالتجميد القابلة للحقن في سويسرا، حسب فئة الدواء، 2019-2028 (وحدات)
الجدول 288: سوق مضادات العدوى في الأدوية المجففة بالتجميد القابلة للحقن في سويسرا، حسب فئة الدواء، 2019-2028 (مليون دولار أمريكي)
الجدول 289: سوق المضادات الحيوية في الأدوية المجففة بالتجميد القابلة للحقن في سويسرا، حسب فئة الدواء، 2019-2028 (مليون دولار أمريكي)
الجدول 290: سوق مضادات الفطريات في الأدوية المجففة بالتجميد القابلة للحقن في سويسرا، حسب فئة الدواء، 2019-2028 (مليون دولار أمريكي)
الجدول 291: سوق الأدوية المضادة للفيروسات في سويسرا، المجففة بالتجميد، حسب فئة الدواء، 2019-2028 (مليون دولار أمريكي)
الجدول 292: سوق الأدوية المضادة للأورام في سويسرا، حسب فئة الدواء، 2019-2028 (مليون دولار أمريكي)
الجدول 293: سوق مدرات البول في الأدوية المجففة بالتجميد القابلة للحقن في سويسرا، حسب فئة الدواء، 2019-2028 (مليون دولار أمريكي)
الجدول 294: سوق مثبطات مضخة البروتون في الأدوية المجففة بالتجميد القابلة للحقن في سويسرا، حسب فئة الدواء، 2019-2028 (مليون دولار أمريكي)
الجدول 295: سوق التخدير في الأدوية المجففة بالتجميد القابلة للحقن في سويسرا، حسب فئة الدواء، 2019-2028 (مليون دولار أمريكي)
الجدول 296: سوق مضادات التخثر في الأدوية المجففة بالتجميد القابلة للحقن في سويسرا، حسب فئة الدواء، 2019-2028 (مليون دولار أمريكي)
الجدول 297: مضادات الالتهاب غير الستيرويدية في سوق الأدوية المجففة بالتجميد القابلة للحقن في سويسرا، حسب فئة الدواء، 2019-2028 (مليون دولار أمريكي)
الجدول 298: سوق الكورتيكوستيرويدات في الأدوية المجففة بالتجميد القابلة للحقن في سويسرا، حسب فئة الدواء، 2019-2028 (مليون دولار أمريكي)
الجدول 299: سوق الأدوية المجففة بالتجميد القابلة للحقن في سويسرا، حسب النموذج، 2019-2028 (مليون دولار أمريكي)
الجدول 300: سوق الأدوية المجففة بالتجميد القابلة للحقن في سويسرا، حسب المؤشرات، 2019-2028 (مليون دولار أمريكي)
الجدول 301: سوق الأدوية المجففة بالتجميد القابلة للحقن في سويسرا، حسب طريقة الإدارة، 2019-2028 (مليون دولار أمريكي)
الجدول 302: سوق الأدوية المجففة بالتجميد القابلة للحقن في سويسرا، حسب المستخدم النهائي، 2019-2028 (مليون دولار أمريكي)
الجدول 303: سوق الأدوية المجففة بالتجميد القابلة للحقن في سويسرا، حسب قنوات التوزيع، 2019-2028 (مليون دولار أمريكي)
الجدول 304: سوق الأدوية المجففة بالتجميد القابلة للحقن في تركيا، حسب العبوة، 2019-2028 (مليون دولار أمريكي)
الجدول 305: سوق الأدوية المجففة بالتجميد القابلة للحقن في تركيا، حسب فئة الدواء، 2019-2028 (مليون دولار أمريكي)
الجدول 306: سوق الأدوية المجففة بالتجميد القابلة للحقن في تركيا، حسب فئة الدواء، 2019-2028 (وحدات)
الجدول 307: سوق مضادات العدوى في الأدوية المجففة بالتجميد القابلة للحقن في تركيا، حسب فئة الدواء، 2019-2028 (مليون دولار أمريكي)
الجدول 308: سوق المضادات الحيوية في تركيا، حسب فئة الدواء، 2019-2028 (مليون دولار أمريكي)
الجدول 309: سوق مضادات الفطريات في الأدوية المجففة بالتجميد القابلة للحقن في تركيا، حسب فئة الدواء، 2019-2028 (مليون دولار أمريكي)
الجدول 310: سوق الأدوية المضادة للفيروسات في تركيا، المجففة بالتجميد، حسب فئة الدواء، 2019-2028 (مليون دولار أمريكي)
الجدول 311 سوق الأدوية المضادة للأورام في تركيا، حسب فئة الدواء، 2019-2028 (مليون دولار أمريكي)
الجدول 312: سوق مدرات البول في تركيا، حسب فئة الدواء، 2019-2028 (مليون دولار أمريكي)
الجدول 313: سوق مثبطات مضخة البروتون في الأدوية المجففة بالتجميد القابلة للحقن في تركيا، حسب فئة الدواء، 2019-2028 (مليون دولار أمريكي)
الجدول 314: سوق التخدير في تركيا في الأدوية المجففة بالتجميد القابلة للحقن، حسب فئة الدواء، 2019-2028 (مليون دولار أمريكي)
الجدول 315: سوق مضادات التخثر في الأدوية المجففة بالتجميد القابلة للحقن في تركيا، حسب فئة الدواء، 2019-2028 (مليون دولار أمريكي)
الجدول 316: مضادات الالتهاب غير الستيرويدية في سوق الأدوية المجففة بالتجميد القابلة للحقن في تركيا، حسب فئة الدواء، 2019-2028 (مليون دولار أمريكي)
الجدول 317: سوق الكورتيكوستيرويدات في الأدوية المجففة بالتجميد في تركيا، حسب فئة الدواء، 2019-2028 (مليون دولار أمريكي)
الجدول 318: سوق الأدوية المجففة بالتجميد القابلة للحقن في تركيا، حسب الشكل، 2019-2028 (مليون دولار أمريكي)
الجدول 319: سوق الأدوية المجففة بالتجميد القابلة للحقن في تركيا، حسب المؤشرات، 2019-2028 (مليون دولار أمريكي)
الجدول 320: سوق الأدوية المجففة بالتجميد القابلة للحقن في تركيا، حسب طريقة الإدارة، 2019-2028 (مليون دولار أمريكي)
الجدول 321 سوق الأدوية المجففة بالتجميد القابلة للحقن في تركيا، حسب المستخدم النهائي، 2019-2028 (مليون دولار أمريكي)
الجدول 322: سوق الأدوية المجففة بالتجميد القابلة للحقن في تركيا، حسب قنوات التوزيع، 2019-2028 (مليون دولار أمريكي)
الجدول 323: سوق الأدوية المجففة بالتجميد القابلة للحقن في النمسا، حسب العبوة، 2019-2028 (مليون دولار أمريكي)
الجدول 324: سوق الأدوية المجففة بالتجميد القابلة للحقن في النمسا، حسب فئة الدواء، 2019-2028 (مليون دولار أمريكي)
الجدول 325: سوق الأدوية المجففة بالتجميد القابلة للحقن في النمسا، حسب فئة الدواء، 2019-2028 (وحدات)
الجدول 326: سوق مضادات العدوى في الأدوية المجففة بالتجميد القابلة للحقن في النمسا، حسب فئة الدواء، 2019-2028 (مليون دولار أمريكي)
الجدول 327 - سوق المضادات الحيوية في الأدوية المجففة بالتجميد القابلة للحقن في النمسا، حسب فئة الدواء، 2019-2028 (مليون دولار أمريكي)
الجدول 328 سوق مضادات الفطريات في الأدوية المجففة بالتجميد القابلة للحقن في النمسا، حسب فئة الدواء، 2019-2028 (مليون دولار أمريكي)
الجدول 329 سوق الأدوية المضادة للفيروسات في النمسا، المجففة بالتجميد، حسب فئة الدواء، 2019-2028 (مليون دولار أمريكي)
الجدول 330 - سوق الأدوية المضادة للأورام في النمسا، حسب فئة الدواء، 2019-2028 (مليون دولار أمريكي)
الجدول 331 - النمسا: سوق مدرات البول في الأدوية المجففة بالتجميد القابلة للحقن، حسب فئة الدواء، 2019-2028 (مليون دولار أمريكي)
الجدول 332 - سوق مثبطات مضخة البروتون في الأدوية المجففة بالتجميد القابلة للحقن في النمسا، حسب فئة الدواء، 2019-2028 (مليون دولار أمريكي)
الجدول 333 - سوق التخدير في الأدوية المجففة بالتجميد القابلة للحقن في النمسا، حسب فئة الدواء، 2019-2028 (مليون دولار أمريكي)
الجدول 334 - سوق مضادات التخثر في الأدوية المجففة بالتجميد القابلة للحقن في النمسا، حسب فئة الدواء، 2019-2028 (مليون دولار أمريكي)
الجدول 335: مضادات الالتهاب غير الستيرويدية في سوق الأدوية المجففة بالتجميد القابلة للحقن في النمسا، حسب فئة الدواء، 2019-2028 (مليون دولار أمريكي)
الجدول 336 - سوق الكورتيكوستيرويدات في الأدوية المجففة بالتجميد القابلة للحقن في النمسا، حسب فئة الدواء، 2019-2028 (مليون دولار أمريكي)
الجدول 337 سوق الأدوية المجففة بالتجميد القابلة للحقن في النمسا، حسب الشكل، 2019-2028 (مليون دولار أمريكي)
الجدول 338: سوق الأدوية المجففة بالتجميد القابلة للحقن في النمسا، حسب المؤشرات، 2019-2028 (مليون دولار أمريكي)
الجدول 339 سوق الأدوية المجففة بالتجميد القابلة للحقن في النمسا، حسب طريقة الإدارة، 2019-2028 (مليون دولار أمريكي)
الجدول 340 سوق الأدوية المجففة بالتجميد القابلة للحقن في النمسا، حسب المستخدم النهائي، 2019-2028 (مليون دولار أمريكي)
الجدول 341 سوق الأدوية المجففة بالتجميد القابلة للحقن في النمسا، حسب قنوات التوزيع، 2019-2028 (مليون دولار أمريكي)
الجدول 342: سوق الأدوية المجففة بالتجميد القابلة للحقن في النرويج، حسب العبوة، 2019-2028 (مليون دولار أمريكي)
الجدول 343: سوق الأدوية المجففة بالتجميد القابلة للحقن في النرويج، حسب فئة الدواء، 2019-2028 (مليون دولار أمريكي)
الجدول 344: سوق الأدوية المجففة بالتجميد القابلة للحقن في النرويج، حسب فئة الدواء، 2019-2028 (وحدات)
الجدول 345: سوق مضادات العدوى في الأدوية المجففة بالتجميد القابلة للحقن في النرويج، حسب فئة الدواء، 2019-2028 (مليون دولار أمريكي)
الجدول 346: سوق المضادات الحيوية في الأدوية المجففة بالتجميد القابلة للحقن في النرويج، حسب فئة الدواء، 2019-2028 (مليون دولار أمريكي)
الجدول 347: سوق الأدوية المضادة للفطريات في النرويج، المجففة بالتجميد، حسب فئة الدواء، 2019-2028 (مليون دولار أمريكي)
الجدول 348: سوق الأدوية المضادة للفيروسات في الأدوية المجففة بالتجميد القابلة للحقن في النرويج، حسب فئة الدواء، 2019-2028 (مليون دولار أمريكي)
الجدول 349 سوق الأدوية المضادة للأورام في النرويج، المجففة بالتجميد، حسب فئة الدواء، 2019-2028 (مليون دولار أمريكي)
الجدول 350: سوق مدرات البول في الأدوية المجففة بالتجميد القابلة للحقن في النرويج، حسب فئة الدواء، 2019-2028 (مليون دولار أمريكي)
الجدول 351: سوق مثبطات مضخة البروتون في الأدوية المجففة بالتجميد القابلة للحقن في النرويج، حسب فئة الدواء، 2019-2028 (مليون دولار أمريكي)
الجدول 352: سوق التخدير في الأدوية المجففة بالتجميد القابلة للحقن في النرويج، حسب فئة الدواء، 2019-2028 (مليون دولار أمريكي)
الجدول 353: سوق مضادات التخثر في الأدوية المجففة بالتجميد القابلة للحقن في النرويج، حسب فئة الدواء، 2019-2028 (مليون دولار أمريكي)
الجدول 354: مضادات الالتهاب غير الستيرويدية في سوق الأدوية المجففة بالتجميد القابلة للحقن في النرويج، حسب فئة الدواء، 2019-2028 (مليون دولار أمريكي)
الجدول 355: سوق الكورتيكوستيرويدات في الأدوية المجففة بالتجميد في النرويج، حسب فئة الدواء، 2019-2028 (مليون دولار أمريكي)
الجدول 356: سوق الأدوية المجففة بالتجميد القابلة للحقن في النرويج، حسب الشكل، 2019-2028 (مليون دولار أمريكي)
الجدول 357: سوق الأدوية المجففة بالتجميد القابلة للحقن في النرويج، حسب المؤشرات، 2019-2028 (مليون دولار أمريكي)
الجدول 358: سوق الأدوية المجففة بالتجميد القابلة للحقن في النرويج، حسب طريقة الإدارة، 2019-2028 (مليون دولار أمريكي)
الجدول 359: سوق الأدوية المجففة بالتجميد القابلة للحقن في النرويج، حسب المستخدم النهائي، 2019-2028 (مليون دولار أمريكي)
الجدول 360: سوق الأدوية المجففة بالتجميد القابلة للحقن في النرويج، حسب قنوات التوزيع، 2019-2028 (مليون دولار أمريكي)
الجدول 361 - سوق الأدوية المجففة بالتجميد القابلة للحقن في المجر، حسب العبوة، 2019-2028 (مليون دولار أمريكي)
الجدول 362: سوق الأدوية المجففة بالتجميد القابلة للحقن في المجر، حسب فئة الدواء، 2019-2028 (مليون دولار أمريكي)
الجدول 363: سوق الأدوية المجففة بالتجميد القابلة للحقن في المجر، حسب فئة الدواء، 2019-2028 (وحدات)
الجدول 364 - سوق مضادات العدوى في الأدوية المجففة بالتجميد القابلة للحقن في المجر، حسب فئة الدواء، 2019-2028 (مليون دولار أمريكي)
الجدول 365 - سوق المضادات الحيوية في الأدوية المجففة بالتجميد القابلة للحقن في المجر، حسب فئة الدواء، 2019-2028 (مليون دولار أمريكي)
الجدول 366 - سوق مضادات الفطريات في الأدوية المجففة بالتجميد القابلة للحقن في المجر، حسب فئة الدواء، 2019-2028 (مليون دولار أمريكي)
الجدول 367 - سوق الأدوية المضادة للفيروسات في العقاقير المجففة بالتجميد القابلة للحقن في المجر، حسب فئة الدواء، 2019-2028 (مليون دولار أمريكي)
الجدول 368 - سوق الأدوية المضادة للأورام في المجر، حسب فئة الدواء، 2019-2028 (مليون دولار أمريكي)
الجدول 369 - سوق مدرات البول في الأدوية المجففة بالتجميد القابلة للحقن في المجر، حسب فئة الدواء، 2019-2028 (مليون دولار أمريكي)
الجدول 370 - سوق مثبطات مضخة البروتون في الأدوية المجففة بالتجميد القابلة للحقن في المجر، حسب فئة الدواء، 2019-2028 (مليون دولار أمريكي)
الجدول 371 - سوق التخدير في الأدوية المجففة بالتجميد القابلة للحقن في المجر، حسب فئة الدواء، 2019-2028 (مليون دولار أمريكي)
الجدول 372 - سوق مضادات التخثر في الأدوية المجففة بالتجميد القابلة للحقن في المجر، حسب فئة الدواء، 2019-2028 (مليون دولار أمريكي)
الجدول 373 - مضادات الالتهاب غير الستيرويدية في سوق الأدوية المجففة بالتجميد القابلة للحقن في المجر، حسب فئة الدواء، 2019-2028 (مليون دولار أمريكي)
الجدول 374 - سوق الكورتيكوستيرويدات في الأدوية المجففة بالتجميد القابلة للحقن في المجر، حسب فئة الدواء، 2019-2028 (مليون دولار أمريكي)
الجدول 375: سوق الأدوية المجففة بالتجميد القابلة للحقن في المجر، حسب الشكل، 2019-2028 (مليون دولار أمريكي)
الجدول 376: سوق الأدوية المجففة بالتجميد القابلة للحقن في المجر، حسب المؤشرات، 2019-2028 (مليون دولار أمريكي)
الجدول 377: سوق الأدوية المجففة بالتجميد القابلة للحقن في المجر، حسب طريقة الإدارة، 2019-2028 (مليون دولار أمريكي)
الجدول 378 - سوق الأدوية المجففة بالتجميد القابلة للحقن في المجر، حسب المستخدم النهائي، 2019-2028 (مليون دولار أمريكي)
الجدول 379: سوق الأدوية المجففة بالتجميد القابلة للحقن في المجر، حسب قنوات التوزيع، 2019-2028 (مليون دولار أمريكي)
الجدول 380: سوق الأدوية المجففة بالتجميد القابلة للحقن في ليتوانيا، حسب العبوة، 2019-2028 (مليون دولار أمريكي)
الجدول 381: سوق الأدوية المجففة بالتجميد القابلة للحقن في ليتوانيا، حسب فئة الدواء، 2019-2028 (مليون دولار أمريكي)
الجدول 382: سوق الأدوية المجففة بالتجميد القابلة للحقن في ليتوانيا، حسب فئة الدواء، 2019-2028 (وحدات)
الجدول 383 سوق مضادات العدوى في الأدوية المجففة بالتجميد القابلة للحقن في ليتوانيا، حسب فئة الدواء، 2019-2028 (مليون دولار أمريكي)
الجدول 384: سوق المضادات الحيوية في الأدوية المجففة بالتجميد القابلة للحقن في ليتوانيا، حسب فئة الدواء، 2019-2028 (مليون دولار أمريكي)
الجدول 385 سوق الأدوية المضادة للفطريات في ليتوانيا، حسب فئة الدواء، 2019-2028 (مليون دولار أمريكي)
الجدول 386 سوق الأدوية المضادة للفيروسات في الأدوية المجففة بالتجميد القابلة للحقن في ليتوانيا، حسب فئة الدواء، 2019-2028 (مليون دولار أمريكي)
الجدول 387 سوق الأدوية المضادة للأورام في ليتوانيا، حسب فئة الدواء، 2019-2028 (مليون دولار أمريكي)
الجدول 388: سوق مدرات البول في الأدوية المجففة بالتجميد القابلة للحقن في ليتوانيا، حسب فئة الدواء، 2019-2028 (مليون دولار أمريكي)
الجدول 389: سوق مثبطات مضخة البروتون في الأدوية المجففة بالتجميد القابلة للحقن في ليتوانيا، حسب فئة الدواء، 2019-2028 (مليون دولار أمريكي)
الجدول 390: سوق التخدير في الأدوية المجففة بالتجميد القابلة للحقن في ليتوانيا، حسب فئة الدواء، 2019-2028 (مليون دولار أمريكي)
الجدول 391 سوق مضادات التخثر في الأدوية المجففة بالتجميد القابلة للحقن في ليتوانيا، حسب فئة الدواء، 2019-2028 (مليون دولار أمريكي)
الجدول 392 - مضادات الالتهاب غير الستيرويدية في سوق الأدوية المجففة بالتجميد القابلة للحقن في ليتوانيا، حسب فئة الدواء، 2019-2028 (مليون دولار أمريكي)
الجدول 393: سوق الكورتيكوستيرويدات في الأدوية المجففة بالتجميد القابلة للحقن في ليتوانيا، حسب فئة الدواء، 2019-2028 (مليون دولار أمريكي)
الجدول 394: سوق الأدوية المجففة بالتجميد القابلة للحقن في ليتوانيا، حسب الشكل، 2019-2028 (مليون دولار أمريكي)
الجدول 395: سوق الأدوية المجففة بالتجميد القابلة للحقن في ليتوانيا، حسب المؤشرات، 2019-2028 (مليون دولار أمريكي)
الجدول 396: سوق الأدوية المجففة بالتجميد القابلة للحقن في ليتوانيا، حسب طريقة الإدارة، 2019-2028 (مليون دولار أمريكي)
الجدول 397: سوق الأدوية المجففة بالتجميد القابلة للحقن في ليتوانيا، حسب المستخدم النهائي، 2019-2028 (مليون دولار أمريكي)
الجدول 398: سوق الأدوية المجففة بالتجميد القابلة للحقن في ليتوانيا، حسب قنوات التوزيع، 2019-2028 (مليون دولار أمريكي)
الجدول 399: سوق الأدوية المجففة بالتجميد القابلة للحقن في أيرلندا، حسب العبوة، 2019-2028 (مليون دولار أمريكي)
الجدول 400: سوق الأدوية المجففة بالتجميد القابلة للحقن في أيرلندا، حسب فئة الدواء، 2019-2028 (مليون دولار أمريكي)
الجدول 401: سوق الأدوية المجففة بالتجميد القابلة للحقن في أيرلندا، حسب فئة الدواء، 2019-2028 (وحدات)
الجدول 402: سوق الأدوية المضادة للعدوى المجففة بالتجميد في أيرلندا، حسب فئة الدواء، 2019-2028 (مليون دولار أمريكي)
الجدول 403: سوق المضادات الحيوية في الأدوية المجففة بالتجميد القابلة للحقن في أيرلندا، حسب فئة الدواء، 2019-2028 (مليون دولار أمريكي)
الجدول 404: سوق الأدوية المضادة للفطريات في أيرلندا، حسب فئة الدواء، 2019-2028 (مليون دولار أمريكي)
الجدول 405: سوق الأدوية المضادة للفيروسات في أيرلندا، المجففة بالتجميد، حسب فئة الدواء، 2019-2028 (مليون دولار أمريكي)
الجدول 406 سوق الأدوية المضادة للأورام في أيرلندا، حسب فئة الدواء، 2019-2028 (مليون دولار أمريكي)
الجدول 407: سوق مدرات البول في الأدوية المجففة بالتجميد القابلة للحقن في أيرلندا، حسب فئة الدواء، 2019-2028 (مليون دولار أمريكي)
الجدول 408: سوق مثبطات مضخة البروتون في الأدوية المجففة بالتجميد القابلة للحقن في أيرلندا، حسب فئة الدواء، 2019-2028 (مليون دولار أمريكي)
الجدول 409: سوق التخدير في الأدوية المجففة بالتجميد القابلة للحقن في أيرلندا، حسب فئة الدواء، 2019-2028 (مليون دولار أمريكي)
الجدول 410: سوق مضادات التخثر في الأدوية المجففة بالتجميد القابلة للحقن في أيرلندا، حسب فئة الدواء، 2019-2028 (مليون دولار أمريكي)
الجدول 411: مضادات الالتهاب غير الستيرويدية في سوق الأدوية المجففة بالتجميد في أيرلندا، حسب فئة الدواء، 2019-2028 (مليون دولار أمريكي)
الجدول 412: سوق الكورتيكوستيرويدات في الأدوية المجففة بالتجميد في أيرلندا، حسب فئة الدواء، 2019-2028 (مليون دولار أمريكي)
الجدول 413: سوق الأدوية المجففة بالتجميد القابلة للحقن في أيرلندا، حسب الشكل، 2019-2028 (مليون دولار أمريكي)
الجدول 414: سوق الأدوية المجففة بالتجميد القابلة للحقن في أيرلندا، حسب المؤشرات، 2019-2028 (مليون دولار أمريكي)
الجدول 415: سوق الأدوية المجففة بالتجميد القابلة للحقن في أيرلندا، حسب طريقة الإدارة، 2019-2028 (مليون دولار أمريكي)
الجدول 416: سوق الأدوية المجففة بالتجميد القابلة للحقن في أيرلندا، حسب المستخدم النهائي، 2019-2028 (مليون دولار أمريكي)
الجدول 417: سوق الأدوية المجففة بالتجميد القابلة للحقن في أيرلندا، حسب قنوات التوزيع، 2019-2028 (مليون دولار أمريكي)
الجدول 418: سوق الأدوية المجففة بالتجميد القابلة للحقن في بولندا، حسب العبوة، 2019-2028 (مليون دولار أمريكي)
الجدول 419: سوق الأدوية المجففة بالتجميد القابلة للحقن في بولندا، حسب فئة الدواء، 2019-2028 (مليون دولار أمريكي)
الجدول 420: سوق الأدوية المجففة بالتجميد القابلة للحقن في بولندا، حسب فئة الدواء، 2019-2028 (وحدات)
الجدول 421 سوق الأدوية المضادة للعدوى في بولندا، حسب فئة الدواء، 2019-2028 (مليون دولار أمريكي)
الجدول 422: سوق المضادات الحيوية في الأدوية المجففة بالتجميد القابلة للحقن في بولندا، حسب فئة الدواء، 2019-2028 (مليون دولار أمريكي)
الجدول 423 سوق الأدوية المضادة للفطريات في بولندا، المجففة بالتجميد، حسب فئة الدواء، 2019-2028 (مليون دولار أمريكي)
الجدول 424 سوق الأدوية المضادة للفيروسات في بولندا، المجففة بالتجميد، حسب فئة الدواء، 2019-2028 (مليون دولار أمريكي)
الجدول 425 سوق الأدوية المضادة للأورام في بولندا، حسب فئة الدواء، 2019-2028 (مليون دولار أمريكي)
الجدول 426: سوق مدرات البول في الأدوية المجففة بالتجميد القابلة للحقن في بولندا، حسب فئة الدواء، 2019-2028 (مليون دولار أمريكي)
الجدول 427: سوق مثبطات مضخة البروتون في الأدوية المجففة بالتجميد القابلة للحقن في بولندا، حسب فئة الدواء، 2019-2028 (مليون دولار أمريكي)
الجدول 428: سوق التخدير في الأدوية المجففة بالتجميد القابلة للحقن في بولندا، حسب فئة الدواء، 2019-2028 (مليون دولار أمريكي)
الجدول 429: سوق مضادات التخثر في الأدوية المجففة بالتجميد القابلة للحقن في بولندا، حسب فئة الدواء، 2019-2028 (مليون دولار أمريكي)
الجدول 430: مضادات الالتهاب غير الستيرويدية في سوق الأدوية المجففة بالتجميد القابلة للحقن في بولندا، حسب فئة الدواء، 2019-2028 (مليون دولار أمريكي)
الجدول 431: سوق الكورتيكوستيرويدات في الأدوية المجففة بالتجميد القابلة للحقن في بولندا، حسب فئة الدواء، 2019-2028 (مليون دولار أمريكي)
الجدول 432: سوق الأدوية المجففة بالتجميد القابلة للحقن في بولندا، حسب النموذج، 2019-2028 (مليون دولار أمريكي)
الجدول 433: سوق الأدوية المجففة بالتجميد القابلة للحقن في بولندا، حسب المؤشرات، 2019-2028 (مليون دولار أمريكي)
الجدول 434: سوق الأدوية المجففة بالتجميد القابلة للحقن في بولندا، حسب طريقة الإدارة، 2019-2028 (مليون دولار أمريكي)
الجدول 435: سوق الأدوية المجففة بالتجميد القابلة للحقن في بولندا، حسب المستخدم النهائي، 2019-2028 (مليون دولار أمريكي)
الجدول 436: سوق الأدوية المجففة بالتجميد القابلة للحقن في بولندا، حسب قنوات التوزيع، 2019-2028 (مليون دولار أمريكي)
الجدول 437: سوق الأدوية المجففة بالتجميد القابلة للحقن في بقية أوروبا، حسب العبوة، 2019-2028 (مليون دولار أمريكي)
الجدول 438 سوق الأدوية المجففة بالتجميد القابلة للحقن في منطقة آسيا والمحيط الهادئ، حسب البلد، 2019-2028 (مليون دولار أمريكي)
الجدول 439: سوق الأدوية المجففة بالتجميد القابلة للحقن في منطقة آسيا والمحيط الهادئ، حسب العبوة، 2019-2028 (مليون دولار أمريكي)
الجدول 440: سوق الأدوية المجففة بالتجميد القابلة للحقن في منطقة آسيا والمحيط الهادئ، حسب فئة الدواء، 2019-2028 (مليون دولار أمريكي)
الجدول 441: سوق الأدوية المجففة بالتجميد القابلة للحقن في منطقة آسيا والمحيط الهادئ، حسب فئة الدواء، 2019-2028 (وحدات)
الجدول 442: سوق مضادات العدوى في الأدوية المجففة بالتجميد القابلة للحقن في منطقة آسيا والمحيط الهادئ، حسب فئة الدواء، 2019-2028 (مليون دولار أمريكي)
الجدول 443: سوق المضادات الحيوية في الأدوية المجففة بالتجميد القابلة للحقن في منطقة آسيا والمحيط الهادئ، حسب فئة الدواء، 2019-2028 (مليون دولار أمريكي)
الجدول 444: سوق الأدوية المضادة للفطريات المجففة بالتجميد في منطقة آسيا والمحيط الهادئ، حسب فئة الدواء، 2019-2028 (مليون دولار أمريكي)
الجدول 445: سوق الأدوية المضادة للفيروسات في الحقن المجففة بالتجميد في منطقة آسيا والمحيط الهادئ، حسب فئة الدواء، 2019-2028 (مليون دولار أمريكي)
الجدول 446 سوق الأدوية المضادة للأورام في آسيا والمحيط الهادئ، حسب فئة الدواء، 2019-2028 (مليون دولار أمريكي)
الجدول 447: سوق مدرات البول في الأدوية المجففة بالتجميد القابلة للحقن في منطقة آسيا والمحيط الهادئ، حسب فئة الدواء، 2019-2028 (مليون دولار أمريكي)
الجدول 448: سوق مثبطات مضخة البروتون في الأدوية المجففة بالتجميد القابلة للحقن في منطقة آسيا والمحيط الهادئ، حسب فئة الدواء، 2019-2028 (مليون دولار أمريكي)
الجدول 449: سوق أدوية التخدير المجففة بالتجميد في منطقة آسيا والمحيط الهادئ، حسب فئة الدواء، 2019-2028 (مليون دولار أمريكي)
الجدول 450: سوق مضادات التخثر في الأدوية المجففة بالتجميد القابلة للحقن في منطقة آسيا والمحيط الهادئ، حسب فئة الدواء، 2019-2028 (مليون دولار أمريكي)
الجدول 451: مضادات الالتهاب غير الستيرويدية في سوق الأدوية المجففة بالتجميد في منطقة آسيا والمحيط الهادئ، حسب فئة الدواء، 2019-2028 (مليون دولار أمريكي)
الجدول 452: سوق الكورتيكوستيرويدات في الأدوية المجففة بالتجميد القابلة للحقن في منطقة آسيا والمحيط الهادئ، حسب فئة الدواء، 2019-2028 (مليون دولار أمريكي)
الجدول 453: سوق الأدوية المجففة بالتجميد القابلة للحقن في منطقة آسيا والمحيط الهادئ، حسب الشكل، 2019-2028 (مليون دولار أمريكي)
الجدول 454: سوق الأدوية المجففة بالتجميد القابلة للحقن في منطقة آسيا والمحيط الهادئ، حسب المؤشرات، 2019-2028 (مليون دولار أمريكي)
الجدول 455: سوق الأدوية المجففة بالتجميد القابلة للحقن في منطقة آسيا والمحيط الهادئ، حسب طريقة الاستخدام، 2019-2028 (مليون دولار أمريكي)
الجدول 456: سوق الأدوية المجففة بالتجميد القابلة للحقن في منطقة آسيا والمحيط الهادئ، حسب المستخدم النهائي، 2019-2028 (مليون دولار أمريكي)
الجدول 457: سوق الأدوية المجففة بالتجميد القابلة للحقن في منطقة آسيا والمحيط الهادئ، حسب قنوات التوزيع، 2019-2028 (مليون دولار أمريكي)
الجدول 458 سوق الأدوية المجففة بالتجميد القابلة للحقن في اليابان، حسب العبوة، 2019-2028 (مليون دولار أمريكي)
الجدول 459: سوق الأدوية المجففة بالتجميد القابلة للحقن في اليابان، حسب فئة الدواء، 2019-2028 (مليون دولار أمريكي)
الجدول 460: سوق الأدوية المجففة بالتجميد القابلة للحقن في اليابان، حسب فئة الدواء، 2019-2028 (وحدات)
الجدول 461: سوق الأدوية المضادة للعدوى في اليابان، حسب فئة الدواء، 2019-2028 (مليون دولار أمريكي)
الجدول 462: سوق المضادات الحيوية في الأدوية المجففة بالتجميد القابلة للحقن في اليابان، حسب فئة الدواء، 2019-2028 (مليون دولار أمريكي)
الجدول 463: سوق مضادات الفطريات في الأدوية المجففة بالتجميد القابلة للحقن في اليابان، حسب فئة الدواء، 2019-2028 (مليون دولار أمريكي)
الجدول 464: سوق الأدوية المضادة للفيروسات في اليابان، المجففة بالتجميد، حسب فئة الدواء، 2019-2028 (مليون دولار أمريكي)
الجدول 465 سوق الأدوية المضادة للأورام في اليابان، حسب فئة الدواء، 2019-2028 (مليون دولار أمريكي)
الجدول 466: سوق مدرات البول في الأدوية المجففة بالتجميد القابلة للحقن في اليابان، حسب فئة الدواء، 2019-2028 (مليون دولار أمريكي)
الجدول 467: سوق مثبطات مضخة البروتون في الأدوية المجففة بالتجميد القابلة للحقن في اليابان، حسب فئة الدواء، 2019-2028 (مليون دولار أمريكي)
الجدول 468: سوق التخدير في الأدوية المجففة بالتجميد القابلة للحقن في اليابان، حسب فئة الدواء، 2019-2028 (مليون دولار أمريكي)
الجدول 469 سوق مضادات التخثر في الأدوية المجففة بالتجميد القابلة للحقن في اليابان، حسب فئة الدواء، 2019-2028 (مليون دولار أمريكي)
الجدول 470: مضادات الالتهاب غير الستيرويدية في سوق الأدوية المجففة بالتجميد القابلة للحقن في اليابان، حسب فئة الدواء، 2019-2028 (مليون دولار أمريكي)
الجدول 471: سوق الكورتيكوستيرويدات في الأدوية المجففة بالتجميد في اليابان، حسب فئة الدواء، 2019-2028 (مليون دولار أمريكي)
الجدول 472: سوق الأدوية المجففة بالتجميد القابلة للحقن في اليابان، حسب الشكل، 2019-2028 (مليون دولار أمريكي)
الجدول 473: سوق الأدوية المجففة بالتجميد القابلة للحقن في اليابان، حسب المؤشرات، 2019-2028 (مليون دولار أمريكي)
الجدول 474: سوق الأدوية المجففة بالتجميد القابلة للحقن في اليابان، حسب طريقة الإعطاء، 2019-2028 (مليون دولار أمريكي)
الجدول 475: سوق الأدوية المجففة بالتجميد القابلة للحقن في اليابان، حسب المستخدم النهائي، 2019-2028 (مليون دولار أمريكي)
الجدول 476: سوق الأدوية المجففة بالتجميد القابلة للحقن في اليابان، حسب قنوات التوزيع، 2019-2028 (مليون دولار أمريكي)
الجدول 477: سوق الأدوية المجففة بالتجميد القابلة للحقن في الصين، حسب العبوة، 2019-2028 (مليون دولار أمريكي)
الجدول 478: سوق الأدوية المجففة بالتجميد القابلة للحقن في الصين، حسب فئة الدواء، 2019-2028 (مليون دولار أمريكي)
الجدول 479: سوق الأدوية المجففة بالتجميد القابلة للحقن في الصين، حسب فئة الدواء، 2019-2028 (الوحدات)
الجدول 480: سوق مضادات العدوى في الأدوية المجففة بالتجميد القابلة للحقن في الصين، حسب فئة الدواء، 2019-2028 (مليون دولار أمريكي)
الجدول 481: سوق المضادات الحيوية في الصين للأدوية المجففة بالتجميد القابلة للحقن، حسب فئة الدواء، 2019-2028 (مليون دولار أمريكي)
الجدول 482: سوق مضادات الفطريات في الأدوية المجففة بالتجميد القابلة للحقن في الصين، حسب فئة الدواء، 2019-2028 (مليون دولار أمريكي)
الجدول 483: سوق الأدوية المضادة للفيروسات في الصين، المجففة بالتجميد، حسب فئة الدواء، 2019-2028 (مليون دولار أمريكي)
الجدول 484: سوق الأدوية المضادة للأورام في الصين، المجففة بالتجميد، حسب فئة الدواء، 2019-2028 (مليون دولار أمريكي)
الجدول 485: سوق مدرات البول في الأدوية المجففة بالتجميد القابلة للحقن في الصين، حسب فئة الدواء، 2019-2028 (مليون دولار أمريكي)
الجدول 486: سوق مثبطات مضخة البروتون في الأدوية المجففة بالتجميد القابلة للحقن في الصين، حسب فئة الدواء، 2019-2028 (مليون دولار أمريكي)
الجدول 487: سوق التخدير في الأدوية المجففة بالتجميد في الصين، حسب فئة الدواء، 2019-2028 (مليون دولار أمريكي)
الجدول 488: سوق مضادات التخثر في الأدوية المجففة بالتجميد القابلة للحقن في الصين، حسب فئة الدواء، 2019-2028 (مليون دولار أمريكي)
الجدول 489: مضادات الالتهاب غير الستيرويدية في سوق الأدوية المجففة بالتجميد في الصين، حسب فئة الدواء، 2019-2028 (مليون دولار أمريكي)
الجدول 490: سوق الكورتيكوستيرويدات في الأدوية المجففة بالتجميد في الصين، حسب فئة الدواء، 2019-2028 (مليون دولار أمريكي)
الجدول 491: سوق الأدوية المجففة بالتجميد القابلة للحقن في الصين، حسب الشكل، 2019-2028 (مليون دولار أمريكي)
الجدول 492: سوق الأدوية المجففة بالتجميد القابلة للحقن في الصين، حسب المؤشرات، 2019-2028 (مليون دولار أمريكي)
الجدول 493: سوق الأدوية المجففة بالتجميد القابلة للحقن في الصين، حسب طريقة الإدارة، 2019-2028 (مليون دولار أمريكي)
الجدول 494: سوق الأدوية المجففة بالتجميد القابلة للحقن في الصين، حسب المستخدم النهائي، 2019-2028 (مليون دولار أمريكي)
الجدول 495: سوق الأدوية المجففة بالتجميد القابلة للحقن في الصين، حسب قنوات التوزيع، 2019-2028 (مليون دولار أمريكي)
الجدول 496 سوق الأدوية المجففة بالتجميد القابلة للحقن في كوريا الجنوبية، حسب العبوة، 2019-2028 (مليون دولار أمريكي)
الجدول 497: سوق الأدوية المجففة بالتجميد القابلة للحقن في كوريا الجنوبية، حسب فئة الدواء، 2019-2028 (مليون دولار أمريكي)
الجدول 498: سوق الأدوية المجففة بالتجميد القابلة للحقن في كوريا الجنوبية، حسب فئة الدواء، 2019-2028 (وحدات)
الجدول 499: سوق مضادات العدوى في كوريا الجنوبية للأدوية المجففة بالتجميد القابلة للحقن، حسب فئة الدواء، 2019-2028 (مليون دولار أمريكي)
الجدول 500: المضادات الحيوية في سوق الأدوية المجففة بالتجميد القابلة للحقن في كوريا الجنوبية، حسب فئة الدواء، 2019-2028 (مليون دولار أمريكي)
الجدول 501 سوق مضادات الفطريات في الأدوية المجففة بالتجميد القابلة للحقن في كوريا الجنوبية، حسب فئة الدواء، 2019-2028 (مليون دولار أمريكي)
الجدول 502: سوق الأدوية المضادة للفيروسات في كوريا الجنوبية، المجففة بالتجميد، حسب فئة الدواء، 2019-2028 (مليون دولار أمريكي)
الجدول 503 سوق الأدوية المضادة للأورام في كوريا الجنوبية، حسب فئة الدواء، 2019-2028 (مليون دولار أمريكي)
الجدول 504: سوق مدرات البول في كوريا الجنوبية، حسب فئة الدواء، 2019-2028 (مليون دولار أمريكي)
الجدول 505: سوق مثبطات مضخة البروتون في كوريا الجنوبية للأدوية المجففة بالتجميد القابلة للحقن، حسب فئة الدواء، 2019-2028 (مليون دولار أمريكي)
الجدول 506: سوق التخدير في كوريا الجنوبية في الأدوية المجففة بالتجميد القابلة للحقن، حسب فئة الدواء، 2019-2028 (مليون دولار أمريكي)
الجدول 507: سوق مضادات التخثر في الأدوية المجففة بالتجميد القابلة للحقن في كوريا الجنوبية، حسب فئة الدواء، 2019-2028 (مليون دولار أمريكي)
الجدول 508: مضادات الالتهاب غير الستيرويدية في سوق الأدوية المجففة بالتجميد في كوريا الجنوبية، حسب فئة الدواء، 2019-2028 (مليون دولار أمريكي)
الجدول 509: سوق الكورتيكوستيرويدات في الأدوية المجففة بالتجميد في كوريا الجنوبية، حسب فئة الدواء، 2019-2028 (مليون دولار أمريكي)
الجدول 510: سوق الأدوية المجففة بالتجميد القابلة للحقن في كوريا الجنوبية، حسب الشكل، 2019-2028 (مليون دولار أمريكي)
الجدول 511: سوق الأدوية المجففة بالتجميد القابلة للحقن في كوريا الجنوبية، حسب المؤشرات، 2019-2028 (مليون دولار أمريكي)
الجدول 512 سوق الأدوية المجففة بالتجميد القابلة للحقن في كوريا الجنوبية، حسب طريقة الإدارة، 2019-2028 (مليون دولار أمريكي)
الجدول 513: سوق الأدوية المجففة بالتجميد القابلة للحقن في كوريا الجنوبية، حسب المستخدم النهائي، 2019-2028 (مليون دولار أمريكي)
الجدول 514: سوق الأدوية المجففة بالتجميد القابلة للحقن في كوريا الجنوبية، حسب قنوات التوزيع، 2019-2028 (مليون دولار أمريكي)
الجدول 515 سوق الأدوية المجففة بالتجميد القابلة للحقن في الهند، حسب العبوة، 2019-2028 (مليون دولار أمريكي)
الجدول 516: سوق الأدوية المجففة بالتجميد القابلة للحقن في الهند، حسب فئة الدواء، 2019-2028 (مليون دولار أمريكي)
الجدول 517: سوق الأدوية المجففة بالتجميد القابلة للحقن في الهند، حسب فئة الدواء، 2019-2028 (وحدات)
الجدول 518: سوق مضادات العدوى في الأدوية المجففة بالتجميد القابلة للحقن في الهند، حسب فئة الدواء، 2019-2028 (مليون دولار أمريكي)
الجدول 519: سوق المضادات الحيوية في الأدوية المجففة بالتجميد القابلة للحقن في الهند، حسب فئة الدواء، 2019-2028 (مليون دولار أمريكي)
الجدول 520: سوق مضادات الفطريات في الأدوية المجففة بالتجميد القابلة للحقن في الهند، حسب فئة الدواء، 2019-2028 (مليون دولار أمريكي)
الجدول 521 سوق الأدوية المضادة للفيروسات في الهند، المجففة بالتجميد، حسب فئة الدواء، 2019-2028 (مليون دولار أمريكي)
الجدول 522 سوق الأدوية المضادة للأورام في الهند، حسب فئة الدواء، 2019-2028 (مليون دولار أمريكي)
الجدول 523: سوق مدرات البول في الأدوية المجففة بالتجميد القابلة للحقن في الهند، حسب فئة الدواء، 2019-2028 (مليون دولار أمريكي)
الجدول 524: سوق مثبطات مضخة البروتون في الأدوية المجففة بالتجميد القابلة للحقن في الهند، حسب فئة الدواء، 2019-2028 (مليون دولار أمريكي)
الجدول 525: سوق التخدير في الأدوية المجففة بالتجميد القابلة للحقن في الهند، حسب فئة الدواء، 2019-2028 (مليون دولار أمريكي)
الجدول 526: سوق مضادات التخثر في الأدوية المجففة بالتجميد القابلة للحقن في الهند، حسب فئة الدواء، 2019-2028 (مليون دولار أمريكي)
الجدول 527: مضادات الالتهاب غير الستيرويدية في سوق الأدوية المجففة بالتجميد في الهند، حسب فئة الدواء، 2019-2028 (مليون دولار أمريكي)
الجدول 528: سوق الكورتيكوستيرويدات في الأدوية المجففة بالتجميد القابلة للحقن في الهند، حسب فئة الدواء، 2019-2028 (مليون دولار أمريكي)
الجدول 529: سوق الأدوية المجففة بالتجميد القابلة للحقن في الهند، حسب الشكل، 2019-2028 (مليون دولار أمريكي)
الجدول 530: سوق الأدوية المجففة بالتجميد القابلة للحقن في الهند، حسب المؤشرات، 2019-2028 (مليون دولار أمريكي)
الجدول 531: سوق الأدوية المجففة بالتجميد القابلة للحقن في الهند، حسب طريقة الإدارة، 2019-2028 (مليون دولار أمريكي)
الجدول 532: سوق الأدوية المجففة بالتجميد القابلة للحقن في الهند، حسب المستخدم النهائي، 2019-2028 (مليون دولار أمريكي)
الجدول 533: سوق الأدوية المجففة بالتجميد القابلة للحقن في الهند، حسب قنوات التوزيع، 2019-2028 (مليون دولار أمريكي)
الجدول 534 سوق الأدوية المجففة بالتجميد القابلة للحقن في أستراليا، حسب العبوة، 2019-2028 (مليون دولار أمريكي)
الجدول 535: سوق الأدوية المجففة بالتجميد القابلة للحقن في أستراليا، حسب فئة الدواء، 2019-2028 (مليون دولار أمريكي)
الجدول 536: سوق الأدوية المجففة بالتجميد القابلة للحقن في أستراليا، حسب فئة الدواء، 2019-2028 (وحدات)
الجدول 537: سوق مضادات العدوى في الأدوية المجففة بالتجميد القابلة للحقن في أستراليا، حسب فئة الدواء، 2019-2028 (مليون دولار أمريكي)
الجدول 538: سوق المضادات الحيوية في الأدوية المجففة بالتجميد القابلة للحقن في أستراليا، حسب فئة الدواء، 2019-2028 (مليون دولار أمريكي)
الجدول 539: سوق مضادات الفطريات في الأدوية المجففة بالتجميد القابلة للحقن في أستراليا، حسب فئة الدواء، 2019-2028 (مليون دولار أمريكي)
الجدول 540: سوق الأدوية المضادة للفيروسات في أستراليا، المجففة بالتجميد، حسب فئة الدواء، 2019-2028 (مليون دولار أمريكي)
الجدول 541 سوق الأدوية المضادة للأورام في أستراليا، حسب فئة الدواء، 2019-2028 (مليون دولار أمريكي)
الجدول 542: سوق مدرات البول في الأدوية المجففة بالتجميد القابلة للحقن في أستراليا، حسب فئة الدواء، 2019-2028 (مليون دولار أمريكي)
الجدول 543: سوق مثبطات مضخة البروتون في الأدوية المجففة بالتجميد القابلة للحقن في أستراليا، حسب فئة الدواء، 2019-2028 (مليون دولار أمريكي)
الجدول 544: سوق التخدير في الأدوية المجففة بالتجميد القابلة للحقن في أستراليا، حسب فئة الدواء، 2019-2028 (مليون دولار أمريكي)
الجدول 545: سوق مضادات التخثر في الأدوية المجففة بالتجميد القابلة للحقن في أستراليا، حسب فئة الدواء، 2019-2028 (مليون دولار أمريكي)
الجدول 546: مضادات الالتهاب غير الستيرويدية في سوق الأدوية المجففة بالتجميد القابلة للحقن في أستراليا، حسب فئة الدواء، 2019-2028 (مليون دولار أمريكي)
الجدول 547: سوق الكورتيكوستيرويدات في الأدوية المجففة بالتجميد القابلة للحقن في أستراليا، حسب فئة الدواء، 2019-2028 (مليون دولار أمريكي)
الجدول 548: سوق الأدوية المجففة بالتجميد القابلة للحقن في أستراليا، حسب النموذج، 2019-2028 (مليون دولار أمريكي)
الجدول 549: سوق الأدوية المجففة بالتجميد القابلة للحقن في أستراليا، حسب المؤشرات، 2019-2028 (مليون دولار أمريكي)
الجدول 550: سوق الأدوية المجففة بالتجميد القابلة للحقن في أستراليا، حسب طريقة الإدارة، 2019-2028 (مليون دولار أمريكي)
الجدول 551: سوق الأدوية المجففة بالتجميد القابلة للحقن في أستراليا، حسب المستخدم النهائي، 2019-2028 (مليون دولار أمريكي)
الجدول 552: سوق الأدوية المجففة بالتجميد القابلة للحقن في أستراليا، حسب قنوات التوزيع، 2019-2028 (مليون دولار أمريكي)
الجدول 553 سوق الأدوية المجففة بالتجميد القابلة للحقن في سنغافورة، حسب العبوة، 2019-2028 (مليون دولار أمريكي)
الجدول 554: سوق الأدوية المجففة بالتجميد القابلة للحقن في سنغافورة، حسب فئة الدواء، 2019-2028 (مليون دولار أمريكي)
الجدول 555: سوق الأدوية المجففة بالتجميد القابلة للحقن في سنغافورة، حسب فئة الدواء، 2019-2028 (وحدات)
الجدول 556: سوق مضادات العدوى في سنغافورة، حسب فئة الدواء، 2019-2028 (مليون دولار أمريكي)
الجدول 557: المضادات الحيوية في سوق الأدوية المجففة بالتجميد القابلة للحقن في سنغافورة، حسب فئة الدواء، 2019-2028 (مليون دولار أمريكي)
الجدول 558 سوق الأدوية المضادة للفطريات في سنغافورة، حسب فئة الدواء، 2019-2028 (مليون دولار أمريكي)
الجدول 559 سوق الأدوية المضادة للفيروسات في سنغافورة، المجففة بالتجميد، حسب فئة الدواء، 2019-2028 (مليون دولار أمريكي)
الجدول 560 سوق الأدوية المضادة للأورام في سنغافورة، حسب فئة الدواء، 2019-2028 (مليون دولار أمريكي)
الجدول 561: مدرات البول في سوق الأدوية المجففة بالتجميد القابلة للحقن في سنغافورة، حسب فئة الدواء، 2019-2028 (مليون دولار أمريكي)
الجدول 562: سوق مثبطات مضخة البروتون في سنغافورة للأدوية المجففة بالتجميد القابلة للحقن، حسب فئة الدواء، 2019-2028 (مليون دولار أمريكي)
الجدول 563: سوق التخدير في سنغافورة، الأدوية المجففة بالتجميد، حسب فئة الدواء، 2019-2028 (مليون دولار أمريكي)
الجدول 564: سوق مضادات التخثر في الأدوية المجففة بالتجميد القابلة للحقن في سنغافورة، حسب فئة الدواء، 2019-2028 (مليون دولار أمريكي)
الجدول 565: مضادات الالتهاب غير الستيرويدية في سوق الأدوية المجففة بالتجميد القابلة للحقن في سنغافورة، حسب فئة الدواء، 2019-2028 (مليون دولار أمريكي)
الجدول 566: سوق الكورتيكوستيرويدات في الأدوية المجففة بالتجميد القابلة للحقن في سنغافورة، حسب فئة الدواء، 2019-2028 (مليون دولار أمريكي)
الجدول 567: سوق الأدوية المجففة بالتجميد القابلة للحقن في سنغافورة، حسب الشكل، 2019-2028 (مليون دولار أمريكي)
الجدول 568: سوق الأدوية المجففة بالتجميد القابلة للحقن في سنغافورة، حسب المؤشرات، 2019-2028 (مليون دولار أمريكي)
الجدول 569: سوق الأدوية المجففة بالتجميد القابلة للحقن في سنغافورة، حسب طريقة الإدارة، 2019-2028 (مليون دولار أمريكي)
الجدول 570: سوق الأدوية المجففة بالتجميد القابلة للحقن في سنغافورة، حسب المستخدم النهائي، 2019-2028 (مليون دولار أمريكي)
الجدول 571: سوق الأدوية المجففة بالتجميد القابلة للحقن في سنغافورة، حسب قنوات التوزيع، 2019-2028 (مليون دولار أمريكي)
الجدول 572 سوق الأدوية المجففة بالتجميد القابلة للحقن في تايلاند، حسب العبوة، 2019-2028 (مليون دولار أمريكي)
الجدول 573: سوق الأدوية المجففة بالتجميد القابلة للحقن في تايلاند، حسب فئة الدواء، 2019-2028 (مليون دولار أمريكي)
الجدول 574: سوق الأدوية المجففة بالتجميد القابلة للحقن في تايلاند، حسب فئة الدواء، 2019-2028 (وحدات)
الجدول 575: سوق مضادات العدوى في الأدوية المجففة بالتجميد القابلة للحقن في تايلاند، حسب فئة الدواء، 2019-2028 (مليون دولار أمريكي)
الجدول 576: سوق المضادات الحيوية في تايلاند، حسب فئة الدواء، 2019-2028 (مليون دولار أمريكي)
الجدول 577: سوق مضادات الفطريات في الأدوية المجففة بالتجميد القابلة للحقن في تايلاند، حسب فئة الدواء، 2019-2028 (مليون دولار أمريكي)
الجدول 578 سوق الأدوية المضادة للفيروسات في تايلاند، حسب فئة الدواء، 2019-2028 (مليون دولار أمريكي)
الجدول 579 سوق الأدوية المضادة للأورام في تايلاند، حسب فئة الدواء، 2019-2028 (مليون دولار أمريكي)
الجدول 580: سوق مدرات البول في الأدوية المجففة بالتجميد القابلة للحقن في تايلاند، حسب فئة الدواء، 2019-2028 (مليون دولار أمريكي)
الجدول 581: سوق مثبطات مضخة البروتون في الأدوية المجففة بالتجميد القابلة للحقن في تايلاند، حسب فئة الدواء، 2019-2028 (مليون دولار أمريكي)
الجدول 582: سوق التخدير في الأدوية المجففة بالتجميد القابلة للحقن في تايلاند، حسب فئة الدواء، 2019-2028 (مليون دولار أمريكي)
الجدول 583: سوق مضادات التخثر في الأدوية المجففة بالتجميد القابلة للحقن في تايلاند، حسب فئة الدواء، 2019-2028 (مليون دولار أمريكي)
الجدول 584: مضادات الالتهاب غير الستيرويدية في سوق الأدوية المجففة بالتجميد في تايلاند، حسب فئة الدواء، 2019-2028 (مليون دولار أمريكي)
الجدول 585: سوق الكورتيكوستيرويدات في الأدوية المجففة بالتجميد القابلة للحقن في تايلاند، حسب فئة الدواء، 2019-2028 (مليون دولار أمريكي)
الجدول 586: سوق الأدوية المجففة بالتجميد القابلة للحقن في تايلاند، حسب النموذج، 2019-2028 (مليون دولار أمريكي)
الجدول 587: سوق الأدوية المجففة بالتجميد القابلة للحقن في تايلاند، حسب المؤشرات، 2019-2028 (مليون دولار أمريكي)
الجدول 588: سوق الأدوية المجففة بالتجميد القابلة للحقن في تايلاند، حسب طريقة الإدارة، 2019-2028 (مليون دولار أمريكي)
الجدول 589: سوق الأدوية المجففة بالتجميد القابلة للحقن في تايلاند، حسب المستخدم النهائي، 2019-2028 (مليون دولار أمريكي)
الجدول 590: سوق الأدوية المجففة بالتجميد القابلة للحقن في تايلاند، حسب قنوات التوزيع، 2019-2028 (مليون دولار أمريكي)
الجدول 591 سوق الأدوية المجففة بالتجميد القابلة للحقن في ماليزيا، حسب العبوة، 2019-2028 (مليون دولار أمريكي)
الجدول 592: سوق الأدوية المجففة بالتجميد القابلة للحقن في ماليزيا، حسب فئة الدواء، 2019-2028 (مليون دولار أمريكي)
الجدول 593: سوق الأدوية المجففة بالتجميد القابلة للحقن في ماليزيا، حسب فئة الدواء، 2019-2028 (وحدات)
الجدول 594: سوق مضادات العدوى في الأدوية المجففة بالتجميد القابلة للحقن في ماليزيا، حسب فئة الدواء، 2019-2028 (مليون دولار أمريكي)
الجدول 595: سوق المضادات الحيوية في ماليزيا، حسب فئة الدواء، 2019-2028 (مليون دولار أمريكي)
الجدول 596: سوق مضادات الفطريات في الأدوية المجففة بالتجميد القابلة للحقن في ماليزيا، حسب فئة الدواء، 2019-2028 (مليون دولار أمريكي)
الجدول 597: سوق الأدوية المضادة للفيروسات في ماليزيا، المجففة بالتجميد، حسب فئة الدواء، 2019-2028 (مليون دولار أمريكي)
الجدول 598: سوق الأدوية المضادة للأورام في ماليزيا، حسب فئة الدواء، 2019-2028 (مليون دولار أمريكي)
الجدول 599: سوق مدرات البول في الأدوية المجففة بالتجميد القابلة للحقن في ماليزيا، حسب فئة الدواء، 2019-2028 (مليون دولار أمريكي)
الجدول 600: سوق مثبطات مضخة البروتون في ماليزيا للأدوية المجففة بالتجميد القابلة للحقن، حسب فئة الدواء، 2019-2028 (مليون دولار أمريكي)
الجدول 601: سوق التخدير في الأدوية المجففة بالتجميد القابلة للحقن في ماليزيا، حسب فئة الدواء، 2019-2028 (مليون دولار أمريكي)
الجدول 602: سوق مضادات التخثر في الأدوية المجففة بالتجميد القابلة للحقن في ماليزيا، حسب فئة الدواء، 2019-2028 (مليون دولار أمريكي)
الجدول 603: مضادات الالتهاب غير الستيرويدية في سوق الأدوية المجففة بالتجميد القابلة للحقن في ماليزيا، حسب فئة الدواء، 2019-2028 (مليون دولار أمريكي)
الجدول 604: سوق الكورتيكوستيرويدات في الأدوية المجففة بالتجميد القابلة للحقن في ماليزيا، حسب فئة الدواء، 2019-2028 (مليون دولار أمريكي)
الجدول 605: سوق الأدوية المجففة بالتجميد القابلة للحقن في ماليزيا، حسب النموذج، 2019-2028 (مليون دولار أمريكي)
الجدول 606: سوق الأدوية المجففة بالتجميد القابلة للحقن في ماليزيا، حسب المؤشرات، 2019-2028 (مليون دولار أمريكي)
الجدول 607: سوق الأدوية المجففة بالتجميد القابلة للحقن في ماليزيا، حسب طريقة الإعطاء، 2019-2028 (مليون دولار أمريكي)
الجدول 608: سوق الأدوية المجففة بالتجميد القابلة للحقن في ماليزيا، حسب المستخدم النهائي، 2019-2028 (مليون دولار أمريكي)
الجدول 609: سوق الأدوية المجففة بالتجميد القابلة للحقن في ماليزيا، حسب قنوات التوزيع، 2019-2028 (مليون دولار أمريكي)
الجدول 610 سوق الأدوية المجففة بالتجميد القابلة للحقن في إندونيسيا، حسب العبوة، 2019-2028 (مليون دولار أمريكي)
الجدول 611: سوق الأدوية المجففة بالتجميد القابلة للحقن في إندونيسيا، حسب فئة الدواء، 2019-2028 (مليون دولار أمريكي)
الجدول 612: سوق الأدوية المجففة بالتجميد القابلة للحقن في إندونيسيا، حسب فئة الدواء، 2019-2028 (وحدات)
الجدول 613: سوق مضادات العدوى في الأدوية المجففة بالتجميد القابلة للحقن في إندونيسيا، حسب فئة الدواء، 2019-2028 (مليون دولار أمريكي)
الجدول 614: سوق المضادات الحيوية في الأدوية المجففة بالتجميد القابلة للحقن في إندونيسيا، حسب فئة الدواء، 2019-2028 (مليون دولار أمريكي)
الجدول 615: سوق مضادات الفطريات في الأدوية المجففة بالتجميد القابلة للحقن في إندونيسيا، حسب فئة الدواء، 2019-2028 (مليون دولار أمريكي)
الجدول 616: سوق الأدوية المضادة للفيروسات في إندونيسيا، حسب فئة الدواء، 2019-2028 (مليون دولار أمريكي)
الجدول 617: سوق الأدوية المضادة للأورام في إندونيسيا، حسب فئة الدواء، 2019-2028 (مليون دولار أمريكي)
الجدول 618: سوق مدرات البول في الأدوية المجففة بالتجميد القابلة للحقن في إندونيسيا، حسب فئة الدواء، 2019-2028 (مليون دولار أمريكي)
الجدول 619: سوق مثبطات مضخة البروتون في الأدوية المجففة بالتجميد القابلة للحقن في إندونيسيا، حسب فئة الدواء، 2019-2028 (مليون دولار أمريكي)
الجدول 620: سوق التخدير في الأدوية المجففة بالتجميد القابلة للحقن في إندونيسيا، حسب فئة الدواء، 2019-2028 (مليون دولار أمريكي)
الجدول 621: سوق مضادات التخثر في الأدوية المجففة بالتجميد القابلة للحقن في إندونيسيا، حسب فئة الدواء، 2019-2028 (مليون دولار أمريكي)
الجدول 622: مضادات الالتهاب غير الستيرويدية في سوق الأدوية المجففة بالتجميد القابلة للحقن في إندونيسيا، حسب فئة الدواء، 2019-2028 (مليون دولار أمريكي)
الجدول 623: سوق الكورتيكوستيرويدات في الأدوية المجففة بالتجميد القابلة للحقن في إندونيسيا، حسب فئة الدواء، 2019-2028 (مليون دولار أمريكي)
الجدول 624: سوق الأدوية المجففة بالتجميد القابلة للحقن في إندونيسيا، حسب النموذج، 2019-2028 (مليون دولار أمريكي)
الجدول 625: سوق الأدوية المجففة بالتجميد القابلة للحقن في إندونيسيا، حسب المؤشرات، 2019-2028 (مليون دولار أمريكي)
الجدول 626: سوق الأدوية المجففة بالتجميد القابلة للحقن في إندونيسيا، حسب طريقة الإدارة، 2019-2028 (مليون دولار أمريكي)
الجدول 627: سوق الأدوية المجففة بالتجميد القابلة للحقن في إندونيسيا، حسب المستخدم النهائي، 2019-2028 (مليون دولار أمريكي)
الجدول 628: سوق الأدوية المجففة بالتجميد القابلة للحقن في إندونيسيا، حسب قنوات التوزيع، 2019-2028 (مليون دولار أمريكي)
الجدول 629 سوق الأدوية المجففة بالتجميد القابلة للحقن في الفلبين، حسب العبوة، 2019-2028 (مليون دولار أمريكي)
الجدول 630: سوق الأدوية المجففة بالتجميد القابلة للحقن في الفلبين، حسب فئة الدواء، 2019-2028 (مليون دولار أمريكي)
الجدول 631: سوق الأدوية المجففة بالتجميد القابلة للحقن في الفلبين، حسب فئة الدواء، 2019-2028 (وحدات)
الجدول 632: سوق مضادات العدوى في الأدوية المجففة بالتجميد القابلة للحقن في الفلبين، حسب فئة الدواء، 2019-2028 (مليون دولار أمريكي)
الجدول 633 الفلبين: المضادات الحيوية في سوق الأدوية المجففة بالتجميد القابلة للحقن، حسب فئة الدواء، 2019-2028 (مليون دولار أمريكي)
الجدول 634: سوق مضادات الفطريات في الأدوية المجففة بالتجميد القابلة للحقن في الفلبين، حسب فئة الدواء، 2019-2028 (مليون دولار أمريكي)
الجدول 635 سوق الأدوية المضادة للفيروسات في الفلبين، حسب فئة الدواء، 2019-2028 (مليون دولار أمريكي)
الجدول 636 سوق الأدوية المضادة للأورام في الفلبين، حسب فئة الدواء، 2019-2028 (مليون دولار أمريكي)
الجدول 637: سوق مدرات البول في الأدوية المجففة بالتجميد القابلة للحقن في الفلبين، حسب فئة الدواء، 2019-2028 (مليون دولار أمريكي)
الجدول 638: سوق مثبطات مضخة البروتون في الأدوية المجففة بالتجميد القابلة للحقن في الفلبين، حسب فئة الدواء، 2019-2028 (مليون دولار أمريكي)
الجدول 639: سوق التخدير في الأدوية المجففة بالتجميد القابلة للحقن في الفلبين، حسب فئة الدواء، 2019-2028 (مليون دولار أمريكي)
الجدول 640: سوق مضادات التخثر في الأدوية المجففة بالتجميد القابلة للحقن في الفلبين، حسب فئة الدواء، 2019-2028 (مليون دولار أمريكي)
الجدول 641: مضادات الالتهاب غير الستيرويدية في سوق الأدوية المجففة بالتجميد القابلة للحقن في الفلبين، حسب فئة الدواء، 2019-2028 (مليون دولار أمريكي)
الجدول 642: سوق الكورتيكوستيرويدات في الأدوية المجففة بالتجميد القابلة للحقن في الفلبين، حسب فئة الدواء، 2019-2028 (مليون دولار أمريكي)
الجدول 643: سوق الأدوية المجففة بالتجميد القابلة للحقن في الفلبين، حسب الشكل، 2019-2028 (مليون دولار أمريكي)
الجدول 644: سوق الأدوية المجففة بالتجميد القابلة للحقن في الفلبين، حسب المؤشرات، 2019-2028 (مليون دولار أمريكي)
الجدول 645: سوق الأدوية المجففة بالتجميد القابلة للحقن في الفلبين، حسب طريقة الاستخدام، 2019-2028 (مليون دولار أمريكي)
الجدول 646: سوق الأدوية المجففة بالتجميد القابلة للحقن في الفلبين، حسب المستخدم النهائي، 2019-2028 (مليون دولار أمريكي)
الجدول 647: سوق الأدوية المجففة بالتجميد القابلة للحقن في الفلبين، حسب قنوات التوزيع، 2019-2028 (مليون دولار أمريكي)
الجدول 648 سوق الأدوية المجففة بالتجميد القابلة للحقن في فيتنام، حسب العبوة، 2019-2028 (مليون دولار أمريكي)
الجدول 649: سوق الأدوية المجففة بالتجميد القابلة للحقن في فيتنام، حسب فئة الدواء، 2019-2028 (مليون دولار أمريكي)
الجدول 650: سوق الأدوية المجففة بالتجميد القابلة للحقن في فيتنام، حسب فئة الدواء، 2019-2028 (وحدات)
الجدول 651: سوق مضادات العدوى في فيتنام في مجال الأدوية المجففة بالتجميد القابلة للحقن، حسب فئة الدواء، 2019-2028 (مليون دولار أمريكي)
الجدول 652: سوق المضادات الحيوية في فيتنام في مجال الأدوية المجففة بالتجميد القابلة للحقن، حسب فئة الدواء، 2019-2028 (مليون دولار أمريكي)
الجدول 653: سوق مضادات الفطريات في الأدوية المجففة بالتجميد القابلة للحقن في فيتنام، حسب فئة الدواء، 2019-2028 (مليون دولار أمريكي)
الجدول 654: سوق الأدوية المضادة للفيروسات في فيتنام، المجففة بالتجميد، حسب فئة الدواء، 2019-2028 (مليون دولار أمريكي)
الجدول 655 سوق الأدوية المضادة للأورام في فيتنام، حسب فئة الدواء، 2019-2028 (مليون دولار أمريكي)
الجدول 656: سوق مدرات البول في فيتنام، حسب فئة الدواء، 2019-2028 (مليون دولار أمريكي)
الجدول 657: سوق مثبطات مضخة البروتون في فيتنام في الأدوية المجففة بالتجميد القابلة للحقن، حسب فئة الدواء، 2019-2028 (مليون دولار أمريكي)
الجدول 658: سوق التخدير في فيتنام في الأدوية المجففة بالتجميد القابلة للحقن، حسب فئة الدواء، 2019-2028 (مليون دولار أمريكي)
الجدول 659: سوق مضادات التخثر في الأدوية المجففة بالتجميد القابلة للحقن في فيتنام، حسب فئة الدواء، 2019-2028 (مليون دولار أمريكي)
الجدول 660: مضادات الالتهاب غير الستيرويدية في سوق الأدوية المجففة بالتجميد في فيتنام، حسب فئة الدواء، 2019-2028 (مليون دولار أمريكي)
الجدول 661: سوق الكورتيكوستيرويدات في الأدوية المجففة بالتجميد في فيتنام، حسب فئة الدواء، 2019-2028 (مليون دولار أمريكي)
الجدول 662: سوق الأدوية المجففة بالتجميد القابلة للحقن في فيتنام، حسب النموذج، 2019-2028 (مليون دولار أمريكي)
الجدول 663: سوق الأدوية المجففة بالتجميد القابلة للحقن في فيتنام، حسب المؤشرات، 2019-2028 (مليون دولار أمريكي)
الجدول 664: سوق الأدوية المجففة بالتجميد القابلة للحقن في فيتنام، حسب طريقة الاستخدام، 2019-2028 (مليون دولار أمريكي)
الجدول 665: سوق الأدوية المجففة بالتجميد القابلة للحقن في فيتنام، حسب المستخدم النهائي، 2019-2028 (مليون دولار أمريكي)
الجدول 666: سوق الأدوية المجففة بالتجميد القابلة للحقن في فيتنام، حسب قنوات التوزيع، 2019-2028 (مليون دولار أمريكي)
الجدول 667: سوق الأدوية المجففة بالتجميد القابلة للحقن في بقية منطقة آسيا والمحيط الهادئ، حسب العبوة، 2019-2028 (مليون دولار أمريكي)
الجدول 668 سوق الأدوية المجففة بالتجميد القابلة للحقن في أمريكا الجنوبية، حسب البلد، 2019-2028 (مليون دولار أمريكي)
الجدول 669 سوق الأدوية المجففة بالتجميد القابلة للحقن في أمريكا الجنوبية، حسب العبوة، 2019-2028 (مليون دولار أمريكي)
الجدول 670: سوق الأدوية المجففة بالتجميد القابلة للحقن في أمريكا الجنوبية، حسب فئة الدواء، 2019-2028 (مليون دولار أمريكي)
الجدول 671: سوق الأدوية المجففة بالتجميد القابلة للحقن في أمريكا الجنوبية، حسب فئة الدواء، 2019-2028 (وحدات)
الجدول 672: سوق مضادات العدوى في الأدوية المجففة بالتجميد القابلة للحقن في أمريكا الجنوبية، حسب فئة الدواء، 2019-2028 (مليون دولار أمريكي)
الجدول 673: سوق المضادات الحيوية في الأدوية المجففة بالتجميد القابلة للحقن في أمريكا الجنوبية، حسب فئة الدواء، 2019-2028 (مليون دولار أمريكي)
الجدول 674: سوق مضادات الفطريات في الأدوية المجففة بالتجميد القابلة للحقن في أمريكا الجنوبية، حسب فئة الدواء، 2019-2028 (مليون دولار أمريكي)
الجدول 675 سوق الأدوية المضادة للفيروسات في أمريكا الجنوبية، حسب فئة الدواء، 2019-2028 (مليون دولار أمريكي)
الجدول 676 سوق الأدوية المضادة للأورام في أمريكا الجنوبية، حسب فئة الدواء، 2019-2028 (مليون دولار أمريكي)
الجدول 677: سوق مدرات البول في الأدوية المجففة بالتجميد القابلة للحقن في أمريكا الجنوبية، حسب فئة الدواء، 2019-2028 (مليون دولار أمريكي)
الجدول 678: سوق مثبطات مضخة البروتون في الأدوية المجففة بالتجميد القابلة للحقن في أمريكا الجنوبية، حسب فئة الدواء، 2019-2028 (مليون دولار أمريكي)
الجدول 679: سوق التخدير في الأدوية المجففة بالتجميد القابلة للحقن في أمريكا الجنوبية، حسب فئة الدواء، 2019-2028 (مليون دولار أمريكي)
الجدول 680: سوق مضادات التخثر في الأدوية المجففة بالتجميد القابلة للحقن في أمريكا الجنوبية، حسب فئة الدواء، 2019-2028 (مليون دولار أمريكي)
الجدول 681: سوق مضادات الالتهاب غير الستيرويدية في أمريكا الجنوبية للأدوية المجففة بالتجميد القابلة للحقن، حسب فئة الدواء، 2019-2028 (مليون دولار أمريكي)
الجدول 682: سوق الكورتيكوستيرويدات في الأدوية المجففة بالتجميد القابلة للحقن في أمريكا الجنوبية، حسب فئة الدواء، 2019-2028 (مليون دولار أمريكي)
الجدول 683: سوق الأدوية المجففة بالتجميد القابلة للحقن في أمريكا الجنوبية، حسب الشكل، 2019-2028 (مليون دولار أمريكي)
الجدول 684: سوق الأدوية المجففة بالتجميد القابلة للحقن في أمريكا الجنوبية، حسب المؤشرات، 2019-2028 (مليون دولار أمريكي)
الجدول 685: سوق الأدوية المجففة بالتجميد القابلة للحقن في أمريكا الجنوبية، حسب طريقة الإدارة، 2019-2028 (مليون دولار أمريكي)
الجدول 686: سوق الأدوية المجففة بالتجميد القابلة للحقن في أمريكا الجنوبية، حسب المستخدم النهائي، 2019-2028 (مليون دولار أمريكي)
الجدول 687: سوق الأدوية المجففة بالتجميد القابلة للحقن في أمريكا الجنوبية، حسب قنوات التوزيع، 2019-2028 (مليون دولار أمريكي)
الجدول 688 سوق الأدوية المجففة بالتجميد القابلة للحقن في البرازيل، حسب العبوة، 2019-2028 (مليون دولار أمريكي)
الجدول 689: سوق الأدوية المجففة بالتجميد القابلة للحقن في البرازيل، حسب فئة الدواء، 2019-2028 (مليون دولار أمريكي)
الجدول 690: سوق الأدوية المجففة بالتجميد القابلة للحقن في البرازيل، حسب فئة الدواء، 2019-2028 (وحدات)
الجدول 691: سوق مضادات العدوى في الأدوية المجففة بالتجميد القابلة للحقن في البرازيل، حسب فئة الدواء، 2019-2028 (مليون دولار أمريكي)
الجدول 692: سوق المضادات الحيوية في الأدوية المجففة بالتجميد القابلة للحقن في البرازيل، حسب فئة الدواء، 2019-2028 (مليون دولار أمريكي)
الجدول 693: سوق مضادات الفطريات في الأدوية المجففة بالتجميد القابلة للحقن في البرازيل، حسب فئة الدواء، 2019-2028 (مليون دولار أمريكي)
الجدول 694: سوق الأدوية المضادة للفيروسات في البرازيل، المجففة بالتجميد، حسب فئة الدواء، 2019-2028 (مليون دولار أمريكي)
الجدول 695: سوق الأدوية المضادة للأورام في البرازيل، المجففة بالتجميد، حسب فئة الدواء، 2019-2028 (مليون دولار أمريكي)
الجدول 696: سوق مدرات البول في الأدوية المجففة بالتجميد القابلة للحقن في البرازيل، حسب فئة الدواء، 2019-2028 (مليون دولار أمريكي)
الجدول 697: سوق مثبطات مضخة البروتون في الأدوية المجففة بالتجميد القابلة للحقن في البرازيل، حسب فئة الدواء، 2019-2028 (مليون دولار أمريكي)
الجدول 698: سوق التخدير في الأدوية المجففة بالتجميد القابلة للحقن في البرازيل، حسب فئة الدواء، 2019-2028 (مليون دولار أمريكي)
الجدول 699: سوق مضادات التخثر في الأدوية المجففة بالتجميد القابلة للحقن في البرازيل، حسب فئة الدواء، 2019-2028 (مليون دولار أمريكي)
الجدول 700: مضادات الالتهاب غير الستيرويدية في سوق الأدوية المجففة بالتجميد في البرازيل، حسب فئة الدواء، 2019-2028 (مليون دولار أمريكي)
الجدول 701: سوق الكورتيكوستيرويدات في الأدوية المجففة بالتجميد في البرازيل، حسب فئة الدواء، 2019-2028 (مليون دولار أمريكي)
الجدول 702: سوق الأدوية المجففة بالتجميد القابلة للحقن في البرازيل، حسب النموذج، 2019-2028 (مليون دولار أمريكي)
الجدول 703: سوق الأدوية المجففة بالتجميد القابلة للحقن في البرازيل، حسب المؤشرات، 2019-2028 (مليون دولار أمريكي)
الجدول 704: سوق الأدوية المجففة بالتجميد القابلة للحقن في البرازيل، حسب طريقة الاستخدام، 2019-2028 (مليون دولار أمريكي)
الجدول 705: سوق الأدوية المجففة بالتجميد القابلة للحقن في البرازيل، حسب المستخدم النهائي، 2019-2028 (مليون دولار أمريكي)
الجدول 706: سوق الأدوية المجففة بالتجميد القابلة للحقن في البرازيل، حسب قنوات التوزيع، 2019-2028 (مليون دولار أمريكي)
الجدول 707 سوق الأدوية المجففة بالتجميد القابلة للحقن في الأرجنتين، حسب العبوة، 2019-2028 (مليون دولار أمريكي)
الجدول 708: سوق الأدوية المجففة بالتجميد القابلة للحقن في الأرجنتين، حسب فئة الدواء، 2019-2028 (مليون دولار أمريكي)
الجدول 709: سوق الأدوية المجففة بالتجميد القابلة للحقن في الأرجنتين، حسب فئة الدواء، 2019-2028 (وحدات)
الجدول 710: سوق مضادات العدوى في الأدوية المجففة بالتجميد القابلة للحقن في الأرجنتين، حسب فئة الدواء، 2019-2028 (مليون دولار أمريكي)
الجدول 711: سوق المضادات الحيوية في الأدوية المجففة بالتجميد القابلة للحقن في الأرجنتين، حسب فئة الدواء، 2019-2028 (مليون دولار أمريكي)
الجدول 712: سوق مضادات الفطريات في الأدوية المجففة بالتجميد القابلة للحقن في الأرجنتين، حسب فئة الدواء، 2019-2028 (مليون دولار أمريكي)
الجدول 713: سوق الأدوية المضادة للفيروسات في الأدوية المجففة بالتجميد القابلة للحقن في الأرجنتين، حسب فئة الدواء، 2019-2028 (مليون دولار أمريكي)
الجدول 714: سوق الأدوية المضادة للأورام في الأرجنتين، المجففة بالتجميد، حسب فئة الدواء، 2019-2028 (مليون دولار أمريكي)
الجدول 715: سوق مدرات البول في الأدوية المجففة بالتجميد في الأرجنتين، حسب فئة الدواء، 2019-2028 (مليون دولار أمريكي)
الجدول 716: سوق مثبطات مضخة البروتون في الأدوية المجففة بالتجميد القابلة للحقن في الأرجنتين، حسب فئة الدواء، 2019-2028 (مليون دولار أمريكي)
الجدول 717: سوق التخدير في الأدوية المجففة بالتجميد في الأرجنتين، حسب فئة الدواء، 2019-2028 (مليون دولار أمريكي)
الجدول 718: سوق مضادات التخثر في الأدوية المجففة بالتجميد القابلة للحقن في الأرجنتين، حسب فئة الدواء، 2019-2028 (مليون دولار أمريكي)
الجدول 719: مضادات الالتهاب غير الستيرويدية في سوق الأدوية المجففة بالتجميد في الأرجنتين، حسب فئة الدواء، 2019-2028 (مليون دولار أمريكي)
الجدول 720: سوق الكورتيكوستيرويدات في الأدوية المجففة بالتجميد في الأرجنتين، حسب فئة الدواء، 2019-2028 (مليون دولار أمريكي)
الجدول 721: سوق الأدوية المجففة بالتجميد القابلة للحقن في الأرجنتين، حسب الشكل، 2019-2028 (مليون دولار أمريكي)
الجدول 722: سوق الأدوية المجففة بالتجميد القابلة للحقن في الأرجنتين، حسب المؤشرات، 2019-2028 (مليون دولار أمريكي)
الجدول 723: سوق الأدوية المجففة بالتجميد القابلة للحقن في الأرجنتين، حسب طريقة الإدارة، 2019-2028 (مليون دولار أمريكي)
الجدول 724: سوق الأدوية المجففة بالتجميد القابلة للحقن في الأرجنتين، حسب المستخدم النهائي، 2019-2028 (مليون دولار أمريكي)
الجدول 725: سوق الأدوية المجففة بالتجميد القابلة للحقن في الأرجنتين، حسب قنوات التوزيع، 2019-2028 (مليون دولار أمريكي)
الجدول 726 سوق الأدوية المجففة بالتجميد القابلة للحقن في بيرو، حسب العبوة، 2019-2028 (مليون دولار أمريكي)
الجدول 727 سوق الأدوية المجففة بالتجميد القابلة للحقن في بيرو، حسب فئة الدواء، 2019-2028 (مليون دولار أمريكي)
الجدول 728: سوق الأدوية المجففة بالتجميد القابلة للحقن في بيرو، حسب فئة الدواء، 2019-2028 (وحدات)
الجدول 729 سوق مضادات العدوى في الأدوية المجففة بالتجميد القابلة للحقن في بيرو، حسب فئة الدواء، 2019-2028 (مليون دولار أمريكي)
الجدول 730 - سوق المضادات الحيوية في الأدوية المجففة بالتجميد القابلة للحقن في بيرو، حسب فئة الدواء، 2019-2028 (مليون دولار أمريكي)
الجدول 731 سوق مضادات الفطريات في الأدوية المجففة بالتجميد القابلة للحقن في بيرو، حسب فئة الدواء، 2019-2028 (مليون دولار أمريكي)
الجدول 732 سوق الأدوية المضادة للفيروسات في الأدوية المجففة بالتجميد القابلة للحقن في بيرو، حسب فئة الدواء، 2019-2028 (مليون دولار أمريكي)
الجدول 733 سوق الأدوية المضادة للأورام في الأدوية المجففة بالتجميد القابلة للحقن في بيرو، حسب فئة الدواء، 2019-2028 (مليون دولار أمريكي)
الجدول 734 سوق مدرات البول في الأدوية المجففة بالتجميد القابلة للحقن في بيرو، حسب فئة الدواء، 2019-2028 (مليون دولار أمريكي)
الجدول 735 سوق مثبطات مضخة البروتون في الأدوية المجففة بالتجميد القابلة للحقن في بيرو، حسب فئة الدواء، 2019-2028 (مليون دولار أمريكي)
الجدول 736 سوق التخدير في الأدوية المجففة بالتجميد في بيرو، حسب فئة الدواء، 2019-2028 (مليون دولار أمريكي)
الجدول 737 سوق مضادات التخثر في الأدوية المجففة بالتجميد القابلة للحقن في بيرو، حسب فئة الدواء، 2019-2028 (مليون دولار أمريكي)
الجدول 738: مضادات الالتهاب غير الستيرويدية في سوق الأدوية المجففة بالتجميد القابلة للحقن في بيرو، حسب فئة الدواء، 2019-2028 (مليون دولار أمريكي)
الجدول 739 - سوق الكورتيكوستيرويدات في الأدوية المجففة بالتجميد القابلة للحقن في بيرو، حسب فئة الدواء، 2019-2028 (مليون دولار أمريكي)
الجدول 740 سوق الأدوية المجففة بالتجميد القابلة للحقن في بيرو، حسب الشكل، 2019-2028 (مليون دولار أمريكي)
الجدول 741: سوق الأدوية المجففة بالتجميد القابلة للحقن في بيرو، حسب المؤشرات، 2019-2028 (مليون دولار أمريكي)
الجدول 742: سوق الأدوية المجففة بالتجميد القابلة للحقن في بيرو، حسب طريقة الإدارة، 2019-2028 (مليون دولار أمريكي)
الجدول 743 سوق الأدوية المجففة بالتجميد القابلة للحقن في بيرو، حسب المستخدم النهائي، 2019-2028 (مليون دولار أمريكي)
الجدول 744 سوق الأدوية المجففة بالتجميد القابلة للحقن في بيرو، حسب قنوات التوزيع، 2019-2028 (مليون دولار أمريكي)
الجدول 745: سوق الأدوية المجففة بالتجميد القابلة للحقن في بقية أمريكا الجنوبية، حسب العبوة، 2019-2028 (مليون دولار أمريكي)
الجدول 746: سوق الأدوية المجففة بالتجميد القابلة للحقن في الشرق الأوسط وأفريقيا، حسب البلد، 2019-2028 (مليون دولار أمريكي)
الجدول 747 سوق الأدوية المجففة بالتجميد القابلة للحقن في الشرق الأوسط وأفريقيا، حسب العبوة، 2019-2028 (مليون دولار أمريكي)
الجدول 748: سوق الأدوية المجففة بالتجميد القابلة للحقن في الشرق الأوسط وأفريقيا، حسب فئة الدواء، 2019-2028 (مليون دولار أمريكي)
الجدول 749: سوق الأدوية المجففة بالتجميد القابلة للحقن في الشرق الأوسط وأفريقيا، حسب فئة الدواء، 2019-2028 (وحدات)
الجدول 750: سوق مضادات العدوى في الأدوية المجففة بالتجميد القابلة للحقن في الشرق الأوسط وأفريقيا، حسب فئة الدواء، 2019-2028 (مليون دولار أمريكي)
الجدول 751: سوق المضادات الحيوية في الأدوية المجففة بالتجميد القابلة للحقن في الشرق الأوسط وأفريقيا، حسب فئة الدواء، 2019-2028 (مليون دولار أمريكي)
الجدول 752 سوق الأدوية المضادة للفطريات في الشرق الأوسط وأفريقيا، حسب فئة الدواء، 2019-2028 (مليون دولار أمريكي)
الجدول 753 سوق الأدوية المضادة للفيروسات في الأدوية المجففة بالتجميد القابلة للحقن في الشرق الأوسط وأفريقيا، حسب فئة الدواء، 2019-2028 (مليون دولار أمريكي)
الجدول 754 سوق الأدوية المضادة للأورام في الشرق الأوسط وأفريقيا، حسب فئة الدواء، 2019-2028 (مليون دولار أمريكي)
الجدول 755 سوق مدرات البول في الأدوية المجففة بالتجميد القابلة للحقن في الشرق الأوسط وأفريقيا، حسب فئة الدواء، 2019-2028 (مليون دولار أمريكي)
الجدول 756: سوق مثبطات مضخة البروتون في الأدوية المجففة بالتجميد القابلة للحقن في الشرق الأوسط وأفريقيا، حسب فئة الدواء، 2019-2028 (مليون دولار أمريكي)
الجدول 757: سوق التخدير في الأدوية المجففة بالتجميد القابلة للحقن في الشرق الأوسط وأفريقيا، حسب فئة الدواء، 2019-2028 (مليون دولار أمريكي)
الجدول 758 سوق مضادات التخثر في الأدوية المجففة بالتجميد القابلة للحقن في الشرق الأوسط وأفريقيا، حسب فئة الدواء، 2019-2028 (مليون دولار أمريكي)
الجدول 759: مضادات الالتهاب غير الستيرويدية في سوق الأدوية المجففة بالتجميد في الشرق الأوسط وأفريقيا، حسب فئة الدواء، 2019-2028 (مليون دولار أمريكي)
الجدول 760: سوق الكورتيكوستيرويدات في الأدوية المجففة بالتجميد القابلة للحقن في الشرق الأوسط وأفريقيا، حسب فئة الدواء، 2019-2028 (مليون دولار أمريكي)
الجدول 761: سوق الأدوية المجففة بالتجميد القابلة للحقن في الشرق الأوسط وأفريقيا، حسب الشكل، 2019-2028 (مليون دولار أمريكي)
الجدول 762: سوق الأدوية المجففة بالتجميد القابلة للحقن في الشرق الأوسط وأفريقيا، حسب المؤشرات، 2019-2028 (مليون دولار أمريكي)
الجدول 763: سوق الأدوية المجففة بالتجميد القابلة للحقن في الشرق الأوسط وأفريقيا، حسب طريقة الإدارة، 2019-2028 (مليون دولار أمريكي)
الجدول 764: سوق الأدوية المجففة بالتجميد القابلة للحقن في الشرق الأوسط وأفريقيا، حسب المستخدم النهائي، 2019-2028 (مليون دولار أمريكي)
الجدول 765: سوق الأدوية المجففة بالتجميد القابلة للحقن في الشرق الأوسط وأفريقيا، حسب قنوات التوزيع، 2019-2028 (مليون دولار أمريكي)
الجدول 766 سوق الأدوية المجففة بالتجميد القابلة للحقن في جنوب أفريقيا، حسب العبوة، 2019-2028 (مليون دولار أمريكي)
الجدول 767: سوق الأدوية المجففة بالتجميد القابلة للحقن في جنوب أفريقيا، حسب فئة الدواء، 2019-2028 (مليون دولار أمريكي)
الجدول 768: سوق الأدوية المجففة بالتجميد القابلة للحقن في جنوب أفريقيا، حسب فئة الدواء، 2019-2028 (وحدات)
الجدول 769 سوق مضادات العدوى في جنوب أفريقيا في الأدوية المجففة بالتجميد القابلة للحقن، حسب فئة الدواء، 2019-2028 (مليون دولار أمريكي)
الجدول 770: سوق المضادات الحيوية المجففة بالتجميد في جنوب أفريقيا، حسب فئة الدواء، 2019-2028 (مليون دولار أمريكي)
الجدول 771 سوق مضادات الفطريات في الأدوية المجففة بالتجميد القابلة للحقن في جنوب أفريقيا، حسب فئة الدواء، 2019-2028 (مليون دولار أمريكي)
الجدول 772 سوق الأدوية المضادة للفيروسات في جنوب أفريقيا، حسب فئة الدواء، 2019-2028 (مليون دولار أمريكي)
الجدول 773 سوق الأدوية المضادة للأورام في جنوب أفريقيا، حسب فئة الدواء، 2019-2028 (مليون دولار أمريكي)
الجدول 774: سوق مدرات البول في الأدوية المجففة بالتجميد القابلة للحقن في جنوب أفريقيا، حسب فئة الدواء، 2019-2028 (مليون دولار أمريكي)
الجدول 775: سوق مثبطات مضخة البروتون في الأدوية المجففة بالتجميد القابلة للحقن في جنوب أفريقيا، حسب فئة الدواء، 2019-2028 (مليون دولار أمريكي)
الجدول 776 سوق التخدير في الأدوية المجففة بالتجميد القابلة للحقن في جنوب أفريقيا، حسب فئة الدواء، 2019-2028 (مليون دولار أمريكي)
الجدول 777 سوق مضادات التخثر في الأدوية المجففة بالتجميد القابلة للحقن في جنوب أفريقيا، حسب فئة الدواء، 2019-2028 (مليون دولار أمريكي)
الجدول 778: مضادات الالتهاب غير الستيرويدية في سوق الأدوية المجففة بالتجميد في جنوب أفريقيا، حسب فئة الدواء، 2019-2028 (مليون دولار أمريكي)
الجدول 779: سوق الكورتيكوستيرويدات في الأدوية المجففة بالتجميد القابلة للحقن في جنوب أفريقيا، حسب فئة الدواء، 2019-2028 (مليون دولار أمريكي)
الجدول 780 سوق الأدوية المجففة بالتجميد القابلة للحقن في جنوب أفريقيا، حسب الشكل، 2019-2028 (مليون دولار أمريكي)
الجدول 781: سوق الأدوية المجففة بالتجميد القابلة للحقن في جنوب أفريقيا، حسب المؤشرات، 2019-2028 (مليون دولار أمريكي)
الجدول 782: سوق الأدوية المجففة بالتجميد القابلة للحقن في جنوب أفريقيا، حسب طريقة الإدارة، 2019-2028 (مليون دولار أمريكي)
الجدول 783 سوق الأدوية المجففة بالتجميد القابلة للحقن في جنوب أفريقيا، حسب المستخدم النهائي، 2019-2028 (مليون دولار أمريكي)
الجدول 784 سوق الأدوية المجففة بالتجميد القابلة للحقن في جنوب أفريقيا، حسب قنوات التوزيع، 2019-2028 (مليون دولار أمريكي)
الجدول 785 سوق الأدوية المجففة بالتجميد القابلة للحقن في المملكة العربية السعودية، حسب العبوة، 2019-2028 (مليون دولار أمريكي)
الجدول 786 سوق الأدوية المجففة بالتجميد القابلة للحقن في المملكة العربية السعودية، حسب فئة الدواء، 2019-2028 (مليون دولار أمريكي)
الجدول 787: سوق الأدوية المجففة بالتجميد القابلة للحقن في المملكة العربية السعودية، حسب فئة الدواء، 2019-2028 (وحدات)
الجدول 788 سوق مضادات العدوى في المملكة العربية السعودية في الأدوية المجففة بالتجميد القابلة للحقن، حسب فئة الدواء، 2019-2028 (مليون دولار أمريكي)
الجدول 789: المضادات الحيوية في سوق الأدوية المجففة بالتجميد القابلة للحقن في المملكة العربية السعودية، حسب فئة الدواء، 2019-2028 (مليون دولار أمريكي)
الجدول 790 سوق مضادات الفطريات في المملكة العربية السعودية في الأدوية المجففة بالتجميد القابلة للحقن، حسب فئة الدواء، 2019-2028 (مليون دولار أمريكي)
الجدول 791 سوق الأدوية المضادة للفيروسات في المملكة العربية السعودية، حسب فئة الدواء، 2019-2028 (مليون دولار أمريكي)
الجدول 792 سوق الأدوية المضادة للأورام في المملكة العربية السعودية، حسب فئة الدواء، 2019-2028 (مليون دولار أمريكي)
الجدول 793 سوق مدرات البول في المملكة العربية السعودية في الأدوية المجففة بالتجميد القابلة للحقن، حسب فئة الدواء، 2019-2028 (مليون دولار أمريكي)
الجدول 794 سوق مثبطات مضخة البروتون في الأدوية المجففة بالتجميد القابلة للحقن في المملكة العربية السعودية، حسب فئة الدواء، 2019-2028 (مليون دولار أمريكي)
الجدول 795 سوق التخدير في المملكة العربية السعودية في الأدوية المجففة بالتجميد القابلة للحقن، حسب فئة الدواء، 2019-2028 (مليون دولار أمريكي)
الجدول 796 سوق مضادات التخثر في الأدوية المجففة بالتجميد القابلة للحقن في المملكة العربية السعودية، حسب فئة الدواء، 2019-2028 (مليون دولار أمريكي)
الجدول 797 مضادات الالتهاب غير الستيرويدية في سوق الأدوية المجففة بالتجميد في المملكة العربية السعودية، حسب فئة الدواء، 2019-2028 (مليون دولار أمريكي)
الجدول 798: سوق الكورتيكوستيرويدات في الأدوية المجففة بالتجميد القابلة للحقن في المملكة العربية السعودية، حسب فئة الدواء، 2019-2028 (مليون دولار أمريكي)
الجدول 799 سوق الأدوية المجففة بالتجميد القابلة للحقن في المملكة العربية السعودية، حسب النموذج، 2019-2028 (مليون دولار أمريكي)
الجدول 800: سوق الأدوية المجففة بالتجميد القابلة للحقن في المملكة العربية السعودية، حسب المؤشرات، 2019-2028 (مليون دولار أمريكي)
الجدول 801: سوق الأدوية المجففة بالتجميد القابلة للحقن في المملكة العربية السعودية، حسب طريقة الإدارة، 2019-2028 (مليون دولار أمريكي)
الجدول 802 سوق الأدوية المجففة بالتجميد القابلة للحقن في المملكة العربية السعودية، حسب المستخدم النهائي، 2019-2028 (مليون دولار أمريكي)
الجدول 803 سوق الأدوية المجففة بالتجميد القابلة للحقن في المملكة العربية السعودية، حسب قنوات التوزيع، 2019-2028 (مليون دولار أمريكي)
الجدول 804 سوق الأدوية المجففة بالتجميد القابلة للحقن في الإمارات العربية المتحدة، حسب العبوة، 2019-2028 (مليون دولار أمريكي)
الجدول 805 سوق الأدوية المجففة بالتجميد القابلة للحقن في الإمارات العربية المتحدة، حسب فئة الدواء، 2019-2028 (مليون دولار أمريكي)
الجدول 806: سوق الأدوية المجففة بالتجميد القابلة للحقن في الإمارات العربية المتحدة، حسب فئة الدواء، 2019-2028 (وحدات)
الجدول 807: سوق مضادات العدوى في الإمارات العربية المتحدة في الأدوية المجففة بالتجميد القابلة للحقن، حسب فئة الدواء، 2019-2028 (مليون دولار أمريكي)
الجدول 808: المضادات الحيوية في سوق الأدوية المجففة بالتجميد القابلة للحقن في دولة الإمارات العربية المتحدة، حسب فئة الدواء، 2019-2028 (مليون دولار أمريكي)
الجدول 809 سوق مضادات الفطريات في الأدوية المجففة بالتجميد القابلة للحقن في الإمارات العربية المتحدة، حسب فئة الدواء، 2019-2028 (مليون دولار أمريكي)
الجدول 810 سوق الأدوية المضادة للفيروسات في الإمارات العربية المتحدة، حسب فئة الدواء، 2019-2028 (مليون دولار أمريكي)
الجدول 811 سوق الأدوية المضادة للأورام في الإمارات العربية المتحدة، حسب فئة الدواء، 2019-2028 (مليون دولار أمريكي)
الجدول 812 سوق مدرات البول في الإمارات العربية المتحدة في الأدوية المجففة بالتجميد القابلة للحقن، حسب فئة الدواء، 2019-2028 (مليون دولار أمريكي)
الجدول 813 سوق مثبطات مضخة البروتون في الأدوية المجففة بالتجميد القابلة للحقن في الإمارات العربية المتحدة، حسب فئة الدواء، 2019-2028 (مليون دولار أمريكي)
الجدول 814 سوق التخدير في الإمارات العربية المتحدة في الأدوية المجففة بالتجميد القابلة للحقن، حسب فئة الدواء، 2019-2028 (مليون دولار أمريكي)
الجدول 815 سوق مضادات التخثر في الأدوية المجففة بالتجميد القابلة للحقن في دولة الإمارات العربية المتحدة، حسب فئة الدواء، 2019-2028 (مليون دولار أمريكي)
الجدول 816 مضادات الالتهاب غير الستيرويدية في سوق الأدوية المجففة بالتجميد في دولة الإمارات العربية المتحدة، حسب فئة الدواء، 2019-2028 (مليون دولار أمريكي)
الجدول 817: سوق الكورتيكوستيرويدات في الأدوية المجففة بالتجميد القابلة للحقن في الإمارات العربية المتحدة، حسب فئة الدواء، 2019-2028 (مليون دولار أمريكي)
الجدول 818 سوق الأدوية المجففة بالتجميد القابلة للحقن في الإمارات العربية المتحدة، حسب الشكل، 2019-2028 (مليون دولار أمريكي)
الجدول 819: سوق الأدوية المجففة بالتجميد القابلة للحقن في الإمارات العربية المتحدة، حسب المؤشرات، 2019-2028 (مليون دولار أمريكي)
الجدول 820: سوق الأدوية المجففة بالتجميد القابلة للحقن في الإمارات العربية المتحدة، حسب طريقة الإدارة، 2019-2028 (مليون دولار أمريكي)
الجدول 821 سوق الأدوية المجففة بالتجميد القابلة للحقن في الإمارات العربية المتحدة، حسب المستخدم النهائي، 2019-2028 (مليون دولار أمريكي)
الجدول 822 سوق الأدوية المجففة بالتجميد القابلة للحقن في الإمارات العربية المتحدة، حسب قنوات التوزيع، 2019-2028 (مليون دولار أمريكي)
الجدول 823: سوق الأدوية المجففة بالتجميد القابلة للحقن في مصر، حسب العبوة، 2019-2028 (مليون دولار أمريكي)
الجدول 824: سوق الأدوية المجففة بالتجميد القابلة للحقن في مصر، حسب فئة الدواء، 2019-2028 (مليون دولار أمريكي)
الجدول 825: سوق الأدوية المجففة بالتجميد القابلة للحقن في مصر، حسب فئة الدواء، 2019-2028 (وحدات)
الجدول 826 - سوق مضادات العدوى في مصر للأدوية المجففة بالتجميد القابلة للحقن، حسب فئة الدواء، 2019-2028 (مليون دولار أمريكي)
الجدول 827 مصر: المضادات الحيوية في سوق الأدوية المجففة بالتجميد القابلة للحقن، حسب فئة الدواء، 2019-2028 (مليون دولار أمريكي)
الجدول 828 سوق مضادات الفطريات في الأدوية المجففة بالتجميد القابلة للحقن في مصر، حسب فئة الدواء، 2019-2028 (مليون دولار أمريكي)
الجدول 829 سوق الأدوية المضادة للفيروسات في مصر، المجففة بالتجميد، حسب فئة الدواء، 2019-2028 (مليون دولار أمريكي)
الجدول 830 سوق الأدوية المضادة للأورام في مصر، حسب فئة الدواء، 2019-2028 (مليون دولار أمريكي)
الجدول 831 مصر: مدرات البول في سوق الأدوية المجففة بالتجميد القابلة للحقن، حسب فئة الدواء، 2019-2028 (مليون دولار أمريكي)
الجدول 832 سوق مثبطات مضخة البروتون في مصر للأدوية المجففة بالتجميد القابلة للحقن، حسب فئة الدواء، 2019-2028 (مليون دولار أمريكي)
الجدول 833 مصر: سوق التخدير في الأدوية المجففة بالتجميد القابلة للحقن، حسب فئة الدواء، 2019-2028 (مليون دولار أمريكي)
الجدول 834 سوق مضادات التخثر في الأدوية المجففة بالتجميد القابلة للحقن في مصر، حسب فئة الدواء، 2019-2028 (مليون دولار أمريكي)
الجدول 835 مضادات الالتهاب غير الستيرويدية في سوق الأدوية المجففة بالتجميد في مصر، حسب فئة الدواء، 2019-2028 (مليون دولار أمريكي)
الجدول 836: سوق الكورتيكوستيرويدات في مصر للأدوية المجففة بالتجميد القابلة للحقن، حسب فئة الدواء، 2019-2028 (مليون دولار أمريكي)
الجدول 837: سوق الأدوية المجففة بالتجميد القابلة للحقن في مصر، حسب الشكل، 2019-2028 (مليون دولار أمريكي)
الجدول 838 سوق الأدوية المجففة بالتجميد القابلة للحقن في مصر، حسب المؤشرات، 2019-2028 (مليون دولار أمريكي)
الجدول 839 سوق الأدوية المجففة بالتجميد القابلة للحقن في مصر، حسب طريقة الإعطاء، 2019-2028 (مليون دولار أمريكي)
الجدول 840 سوق الأدوية المجففة بالتجميد القابلة للحقن في مصر، حسب المستخدم النهائي، 2019-2028 (مليون دولار أمريكي)
الجدول 841 سوق الأدوية المجففة بالتجميد القابلة للحقن في مصر، حسب قناة التوزيع، 2019-2028 (مليون دولار أمريكي)
الجدول 842 سوق الأدوية المجففة بالتجميد القابلة للحقن في الكويت، حسب العبوة، 2019-2028 (مليون دولار أمريكي)
الجدول 843 سوق الأدوية المجففة بالتجميد القابلة للحقن في الكويت، حسب فئة الدواء، 2019-2028 (مليون دولار أمريكي)
الجدول 844 سوق الأدوية المجففة بالتجميد القابلة للحقن في الكويت، حسب فئة الدواء، 2019-2028 (وحدات)
الجدول 845 سوق مضادات العدوى في الكويت للأدوية المجففة بالتجميد القابلة للحقن، حسب فئة الدواء، 2019-2028 (مليون دولار أمريكي)
الجدول 846 - المضادات الحيوية في سوق الأدوية المجففة بالتجميد القابلة للحقن في الكويت، حسب فئة الدواء، 2019-2028 (مليون دولار أمريكي)
الجدول 847 سوق الأدوية المضادة للفطريات في الكويت، المجففة بالتجميد، حسب فئة الدواء، 2019-2028 (مليون دولار أمريكي)
الجدول 848 سوق الأدوية المضادة للفيروسات في الكويت، المجففة بالتجميد، حسب فئة الدواء، 2019-2028 (مليون دولار أمريكي)
الجدول 849 سوق الأدوية المضادة للأورام في الكويت، حسب فئة الدواء، 2019-2028 (مليون دولار أمريكي)
الجدول 850 - الكويت: مدرات البول في سوق الأدوية المجففة بالتجميد القابلة للحقن، حسب فئة الدواء، 2019-2028 (مليون دولار أمريكي)
الجدول 851 سوق مثبطات مضخة البروتون في الكويت للأدوية المجففة بالتجميد القابلة للحقن، حسب فئة الدواء، 2019-2028 (مليون دولار أمريكي)
الجدول 852 الكويت: سوق التخدير في الأدوية المجففة بالتجميد القابلة للحقن، حسب فئة الدواء، 2019-2028 (مليون دولار أمريكي)
الجدول 853 سوق مضادات التخثر في الأدوية المجففة بالتجميد القابلة للحقن في الكويت، حسب فئة الدواء، 2019-2028 (مليون دولار أمريكي)
الجدول 854 الكويت: مضادات الالتهاب غير الستيرويدية في سوق الأدوية المجففة بالتجميد القابلة للحقن، حسب فئة الدواء، 2019-2028 (مليون دولار أمريكي)
الجدول 855 - سوق الكورتيكوستيرويدات في الأدوية المجففة بالتجميد القابلة للحقن في الكويت، حسب فئة الدواء، 2019-2028 (مليون دولار أمريكي)
الجدول 856 سوق الأدوية المجففة بالتجميد القابلة للحقن في الكويت، حسب النموذج، 2019-2028 (مليون دولار أمريكي)
الجدول 857 سوق الأدوية المجففة بالتجميد القابلة للحقن في الكويت، حسب المؤشرات، 2019-2028 (مليون دولار أمريكي)
الجدول 858 سوق الأدوية المجففة بالتجميد القابلة للحقن في الكويت، حسب طريقة الإدارة، 2019-2028 (مليون دولار أمريكي)
الجدول 859 سوق الأدوية المجففة بالتجميد القابلة للحقن في الكويت، حسب المستخدم النهائي، 2019-2028 (مليون دولار أمريكي)
الجدول 860 سوق الأدوية المجففة بالتجميد القابلة للحقن في الكويت، حسب قناة التوزيع، 2019-2028 (مليون دولار أمريكي)
الجدول 861: سوق الأدوية المجففة بالتجميد القابلة للحقن في إسرائيل، حسب العبوة، 2019-2028 (مليون دولار أمريكي)
الجدول 862: سوق الأدوية المجففة بالتجميد القابلة للحقن في إسرائيل، حسب فئة الدواء، 2019-2028 (مليون دولار أمريكي)
الجدول 863: سوق الأدوية المجففة بالتجميد القابلة للحقن في إسرائيل، حسب فئة الدواء، 2019-2028 (وحدات)
الجدول 864: سوق مضادات العدوى في الأدوية المجففة بالتجميد القابلة للحقن في إسرائيل، حسب فئة الدواء، 2019-2028 (مليون دولار أمريكي)
الجدول 865: المضادات الحيوية في سوق الأدوية المجففة بالتجميد القابلة للحقن في إسرائيل، حسب فئة الدواء، 2019-2028 (مليون دولار أمريكي)
الجدول 866: سوق الأدوية المضادة للفطريات في إسرائيل، المجففة بالتجميد، حسب فئة الدواء، 2019-2028 (مليون دولار أمريكي)
الجدول 867: سوق الأدوية المضادة للفيروسات في إسرائيل، المجففة بالتجميد، للحقن، حسب فئة الدواء، 2019-2028 (مليون دولار أمريكي)
الجدول 868 سوق الأدوية المضادة للأورام في إسرائيل، المجففة بالتجميد، للحقن، حسب فئة الدواء، 2019-2028 (مليون دولار أمريكي)
الجدول 869: سوق مدرات البول في الأدوية المجففة بالتجميد القابلة للحقن في إسرائيل، حسب فئة الدواء، 2019-2028 (مليون دولار أمريكي)
الجدول 870: سوق مثبطات مضخة البروتون في الأدوية المجففة بالتجميد القابلة للحقن في إسرائيل، حسب فئة الدواء، 2019-2028 (مليون دولار أمريكي)
الجدول 871: سوق التخدير في الأدوية المجففة بالتجميد القابلة للحقن في إسرائيل، حسب فئة الدواء، 2019-2028 (مليون دولار أمريكي)
الجدول 872 سوق مضادات التخثر في الأدوية المجففة بالتجميد القابلة للحقن في إسرائيل، حسب فئة الدواء، 2019-2028 (مليون دولار أمريكي)
الجدول 873: مضادات الالتهاب غير الستيرويدية في سوق الأدوية المجففة بالتجميد القابلة للحقن في إسرائيل، حسب فئة الدواء، 2019-2028 (مليون دولار أمريكي)
الجدول 874: سوق الكورتيكوستيرويدات في الأدوية المجففة بالتجميد في إسرائيل، حسب فئة الدواء، 2019-2028 (مليون دولار أمريكي)
الجدول 875: سوق الأدوية المجففة بالتجميد القابلة للحقن في إسرائيل، حسب النموذج، 2019-2028 (مليون دولار أمريكي)
الجدول 876: سوق الأدوية المجففة بالتجميد القابلة للحقن في إسرائيل، حسب المؤشرات، 2019-2028 (مليون دولار أمريكي)
الجدول 877: سوق الأدوية المجففة بالتجميد القابلة للحقن في إسرائيل، حسب طريقة الإدارة، 2019-2028 (مليون دولار أمريكي)
الجدول 878: سوق الأدوية المجففة بالتجميد القابلة للحقن في إسرائيل، حسب المستخدم النهائي، 2019-2028 (مليون دولار أمريكي)
الجدول 879: سوق الأدوية المجففة بالتجميد القابلة للحقن في إسرائيل، حسب قنوات التوزيع، 2019-2028 (مليون دولار أمريكي)
الجدول 880: سوق الأدوية المجففة بالتجميد القابلة للحقن في بقية دول الشرق الأوسط وأفريقيا، حسب العبوة، 2019-2028 (مليون دولار أمريكي)
List of Figure
الشكل 1: سوق الأدوية المجففة بالتجميد القابلة للحقن العالمية: التجزئة
الشكل 2: سوق الأدوية المجففة بالتجميد القابلة للحقن العالمية: تحليل البيانات المثلثية
الشكل 3: سوق الأدوية المجففة بالتجميد القابلة للحقن العالمية: تحليل DROC
الشكل 4: سوق الأدوية المجففة بالتجميد القابلة للحقن العالمية: تحليل السوق العالمي مقابل الإقليمي
الشكل 5: سوق الأدوية المجففة بالتجميد القابلة للحقن العالمية: تحليل أبحاث الشركة
الشكل 6: السوق العالمية للأدوية المجففة بالتجميد القابلة للحقن: النمذجة متعددة المتغيرات
الشكل 7: سوق الأدوية المجففة بالتجميد القابلة للحقن العالمية: التركيبة السكانية للمقابلة
الشكل 8 سوق الأدوية المجففة بالتجميد القابلة للحقن العالمية: شبكة مواقع سوق DBMR
الشكل 9: سوق الأدوية المجففة بالتجميد القابلة للحقن العالمية: تحليل حصة البائعين
الشكل 10 السوق العالمية للأدوية المجففة بالتجميد القابلة للحقن: شبكة تغطية المستخدم النهائي للسوق
الشكل 11 السوق العالمية للأدوية المجففة بالتجميد القابلة للحقن: التجزئة
الشكل 12 من المتوقع أن تهيمن أمريكا الشمالية على سوق الأدوية المجففة بالتجميد القابلة للحقن العالمية، ومن المتوقع أن تنمو منطقة آسيا والمحيط الهادئ بأعلى معدل نمو سنوي مركب في الفترة المتوقعة من 2021 إلى 2028
الشكل 13 من المتوقع أن يؤدي ارتفاع الحالات الصحية المزمنة إلى دفع سوق الأدوية المجففة بالتجميد القابلة للحقن العالمية في الفترة المتوقعة من 2021 إلى 2028
من المتوقع أن يستحوذ قطاع القوارير (الشكل 14) على أكبر حصة في سوق الأدوية المجففة بالتجميد القابلة للحقن العالمية في عامي 2021 و2028
الشكل 15: منطقة آسيا والمحيط الهادئ هي أسرع الأسواق نموًا لمصنعي الأدوية المجففة بالتجميد القابلة للحقن في الفترة المتوقعة من 2021 إلى 2028
الشكل 16: العوامل المحركة والمعوقات والفرص والتحديات التي تواجه سوق الأدوية المجففة بالتجميد القابلة للحقن العالمية
الشكل 17: السوق العالمية للأدوية المجففة بالتجميد القابلة للحقن: حسب العبوة، 2020
الشكل 18: السوق العالمية للأدوية المجففة بالتجميد القابلة للحقن: حسب العبوة، 2021-2028 (مليون دولار أمريكي)
الشكل 19: السوق العالمية للأدوية المجففة بالتجميد القابلة للحقن: حسب العبوة، معدل النمو السنوي المركب (2021-2028)
الشكل 20 السوق العالمية للأدوية المجففة بالتجميد القابلة للحقن: حسب التعبئة والتغليف، منحنى لايف لاين
الشكل 21: سوق الأدوية المجففة بالتجميد القابلة للحقن العالمية: حسب فئة الدواء، 2020
الشكل 22: سوق الأدوية المجففة بالتجميد القابلة للحقن العالمية: حسب فئة الدواء، 2021-2028 (مليون دولار أمريكي)
الشكل 23: سوق الأدوية المجففة بالتجميد القابلة للحقن العالمية: حسب فئة الدواء، معدل النمو السنوي المركب (2021-2028)
الشكل 24 السوق العالمية للأدوية المجففة بالتجميد القابلة للحقن: حسب فئة الدواء، منحنى لايف لاين
الشكل 25: سوق الأدوية المجففة بالتجميد القابلة للحقن العالمية: حسب الشكل، 2020
الشكل 26: سوق الأدوية المجففة بالتجميد القابلة للحقن العالمية: حسب الشكل، 2021-2028 (مليون دولار أمريكي)
الشكل 27: السوق العالمية للأدوية المجففة بالتجميد القابلة للحقن: حسب الشكل، ومعدل النمو السنوي المركب (2021-2028)
الشكل 28 السوق العالمية للأدوية المجففة بالتجميد القابلة للحقن: حسب الشكل، منحنى لايف لاين
الشكل 29: سوق الأدوية المجففة بالتجميد القابلة للحقن العالمية: حسب المؤشرات، 2020
الشكل 30: سوق الأدوية المجففة بالتجميد القابلة للحقن العالمية: حسب المؤشرات، 2021-2028 (مليون دولار أمريكي)
الشكل 31 السوق العالمية للأدوية المجففة بالتجميد القابلة للحقن: حسب المؤشرات، معدل النمو السنوي المركب (2021-2028)
الشكل 32 السوق العالمية للأدوية المجففة بالتجميد القابلة للحقن: حسب المؤشر، منحنى لايف لاين
الشكل 33: السوق العالمية للأدوية المجففة بالتجميد القابلة للحقن: حسب طريقة الإدارة، 2020
الشكل 34: السوق العالمية للأدوية المجففة بالتجميد القابلة للحقن: حسب طريقة الإدارة، 2021-2028 (مليون دولار أمريكي)
الشكل 35: السوق العالمية للأدوية المجففة بالتجميد القابلة للحقن: حسب طريقة الإدارة، معدل النمو السنوي المركب (2021-2028)
الشكل 36 السوق العالمية للأدوية المجففة بالتجميد القابلة للحقن: حسب طريقة الإدارة، منحنى لايف لاين
الشكل 37 السوق العالمية للأدوية المجففة بالتجميد القابلة للحقن: حسب المستخدم النهائي، 2020
الشكل 38 السوق العالمية للأدوية المجففة بالتجميد القابلة للحقن: حسب المستخدم النهائي، 2021-2028 (مليون دولار أمريكي)
الشكل 39 السوق العالمية للأدوية المجففة بالتجميد القابلة للحقن: حسب المستخدم النهائي، معدل النمو السنوي المركب (2021-2028)
الشكل 40 السوق العالمية للأدوية المجففة بالتجميد القابلة للحقن: حسب المستخدم النهائي، LIFELINE CURVE
الشكل 41: سوق الأدوية المجففة بالتجميد القابلة للحقن العالمية: حسب قنوات التوزيع، 2020
الشكل 42: سوق الأدوية المجففة بالتجميد القابلة للحقن العالمية: حسب قنوات التوزيع، 2021-2028 (مليون دولار أمريكي)
الشكل 43: سوق الأدوية المجففة بالتجميد القابلة للحقن العالمية: حسب قناة التوزيع، معدل النمو السنوي المركب (2021-2028)
الشكل 44 السوق العالمية للأدوية المجففة بالتجميد القابلة للحقن: حسب قناة التوزيع، منحنى لايف لاين
الشكل 45: السوق العالمية للأدوية المجففة بالتجميد القابلة للحقن: لمحة عامة (2020)
الشكل 46 السوق العالمية للأدوية المجففة بالتجميد القابلة للحقن: حسب المنطقة (2020)
الشكل 47: سوق الأدوية المجففة بالتجميد القابلة للحقن العالمية: حسب المنطقة (2021 و2028)
الشكل 48: سوق الأدوية المجففة بالتجميد القابلة للحقن العالمية: حسب المنطقة (2020 و2028)
الشكل 49 السوق العالمية للأدوية المجففة بالتجميد القابلة للحقن: حسب التعبئة والتغليف (2021-2028)
الشكل 50: سوق الأدوية المجففة بالتجميد القابلة للحقن في أمريكا الشمالية: لمحة عامة (2020)
الشكل 51 سوق الأدوية المجففة بالتجميد القابلة للحقن في أمريكا الشمالية: حسب البلد (2020)
الشكل 52 سوق الأدوية المجففة بالتجميد القابلة للحقن في أمريكا الشمالية: حسب البلد (2021 و2028)
الشكل 53: سوق الأدوية المجففة بالتجميد القابلة للحقن في أمريكا الشمالية: حسب البلد (2020 و2028)
الشكل 54 سوق الأدوية المجففة بالتجميد القابلة للحقن في أمريكا الشمالية: حسب التعبئة والتغليف (2021-2028)
الشكل 55: سوق الأدوية المجففة بالتجميد القابلة للحقن في أوروبا: لمحة عامة (2020)
الشكل 56 سوق الأدوية المجففة بالتجميد القابلة للحقن في أوروبا: حسب البلد (2020)
الشكل 57: سوق الأدوية المجففة بالتجميد القابلة للحقن في أوروبا: حسب البلد (2021 و2028)
الشكل 58 سوق الأدوية المجففة بالتجميد القابلة للحقن في أوروبا: حسب البلد (2020 و2028)
الشكل 59 سوق الأدوية المجففة بالتجميد القابلة للحقن في أوروبا: حسب النوع (2021-2028)
الشكل 60: سوق الأدوية المجففة بالتجميد القابلة للحقن في منطقة آسيا والمحيط الهادئ: لمحة عامة (2020)
الشكل 61 سوق الأدوية المجففة بالتجميد القابلة للحقن في منطقة آسيا والمحيط الهادئ: حسب البلد (2020)
الشكل 62 سوق الأدوية المجففة بالتجميد القابلة للحقن في منطقة آسيا والمحيط الهادئ: حسب البلد (2021 و2028)
الشكل 63 سوق الأدوية المجففة بالتجميد القابلة للحقن في منطقة آسيا والمحيط الهادئ: حسب البلد (2020 و2028)
الشكل 64 سوق الأدوية المجففة بالتجميد القابلة للحقن في منطقة آسيا والمحيط الهادئ: حسب التعبئة والتغليف (2021-2028)
الشكل 65: سوق الأدوية المجففة بالتجميد القابلة للحقن في أمريكا الجنوبية: لمحة عامة (2020)
الشكل 66 سوق الأدوية المجففة بالتجميد القابلة للحقن في أمريكا الجنوبية: حسب البلد (2020)
الشكل 67 سوق الأدوية المجففة بالتجميد القابلة للحقن في أمريكا الجنوبية: حسب البلد (2021 و2028)
الشكل 68 سوق الأدوية المجففة بالتجميد القابلة للحقن في أمريكا الجنوبية: حسب البلد (2020 و2028)
الشكل 69 سوق الأدوية المجففة بالتجميد القابلة للحقن في أمريكا الجنوبية: حسب التعبئة والتغليف (2021-2028)
الشكل 70 سوق الأدوية المجففة بالتجميد القابلة للحقن في الشرق الأوسط وأفريقيا: لمحة عامة (2020)
الشكل 71 سوق الأدوية المجففة بالتجميد القابلة للحقن في الشرق الأوسط وأفريقيا: حسب البلد (2020)
الشكل 72 سوق الأدوية المجففة بالتجميد القابلة للحقن في الشرق الأوسط وأفريقيا: حسب البلد (2021 و2028)
الشكل 73 سوق الأدوية المجففة بالتجميد القابلة للحقن في الشرق الأوسط وأفريقيا: حسب البلد (2020 و2028)
الشكل 74 سوق الأدوية المجففة بالتجميد القابلة للحقن في الشرق الأوسط وأفريقيا: حسب التعبئة والتغليف (2021-2028)
الشكل 75 السوق العالمية للأدوية المجففة بالتجميد القابلة للحقن: حصة الشركة 2020 (%)
الشكل 76 سوق الأدوية المجففة بالتجميد القابلة للحقن في أمريكا الشمالية: حصة الشركة 2020 (%)
الشكل 77 سوق الأدوية المجففة بالتجميد القابلة للحقن في أوروبا: حصة الشركة 2020 (%)
الشكل 78 سوق الأدوية المجففة بالتجميد القابلة للحقن في منطقة آسيا والمحيط الهادئ: حصة الشركة 2020 (%)
منهجية البحث
يتم جمع البيانات وتحليل سنة الأساس باستخدام وحدات جمع البيانات ذات أحجام العينات الكبيرة. تتضمن المرحلة الحصول على معلومات السوق أو البيانات ذات الصلة من خلال مصادر واستراتيجيات مختلفة. تتضمن فحص وتخطيط جميع البيانات المكتسبة من الماضي مسبقًا. كما تتضمن فحص التناقضات في المعلومات التي شوهدت عبر مصادر المعلومات المختلفة. يتم تحليل بيانات السوق وتقديرها باستخدام نماذج إحصائية ومتماسكة للسوق. كما أن تحليل حصة السوق وتحليل الاتجاهات الرئيسية هي عوامل النجاح الرئيسية في تقرير السوق. لمعرفة المزيد، يرجى طلب مكالمة محلل أو إرسال استفسارك.
منهجية البحث الرئيسية التي يستخدمها فريق بحث DBMR هي التثليث البيانات والتي تتضمن استخراج البيانات وتحليل تأثير متغيرات البيانات على السوق والتحقق الأولي (من قبل خبراء الصناعة). تتضمن نماذج البيانات شبكة تحديد موقف البائعين، وتحليل خط زمني للسوق، ونظرة عامة على السوق ودليل، وشبكة تحديد موقف الشركة، وتحليل براءات الاختراع، وتحليل التسعير، وتحليل حصة الشركة في السوق، ومعايير القياس، وتحليل حصة البائعين على المستوى العالمي مقابل الإقليمي. لمعرفة المزيد عن منهجية البحث، أرسل استفسارًا للتحدث إلى خبراء الصناعة لدينا.
التخصيص متاح
تعد Data Bridge Market Research رائدة في مجال البحوث التكوينية المتقدمة. ونحن نفخر بخدمة عملائنا الحاليين والجدد بالبيانات والتحليلات التي تتطابق مع هدفهم. ويمكن تخصيص التقرير ليشمل تحليل اتجاه الأسعار للعلامات التجارية المستهدفة وفهم السوق في بلدان إضافية (اطلب قائمة البلدان)، وبيانات نتائج التجارب السريرية، ومراجعة الأدبيات، وتحليل السوق المجدد وقاعدة المنتج. ويمكن تحليل تحليل السوق للمنافسين المستهدفين من التحليل القائم على التكنولوجيا إلى استراتيجيات محفظة السوق. ويمكننا إضافة عدد كبير من المنافسين الذين تحتاج إلى بيانات عنهم بالتنسيق وأسلوب البيانات الذي تبحث عنه. ويمكن لفريق المحللين لدينا أيضًا تزويدك بالبيانات في ملفات Excel الخام أو جداول البيانات المحورية (كتاب الحقائق) أو مساعدتك في إنشاء عروض تقديمية من مجموعات البيانات المتوفرة في التقرير.

