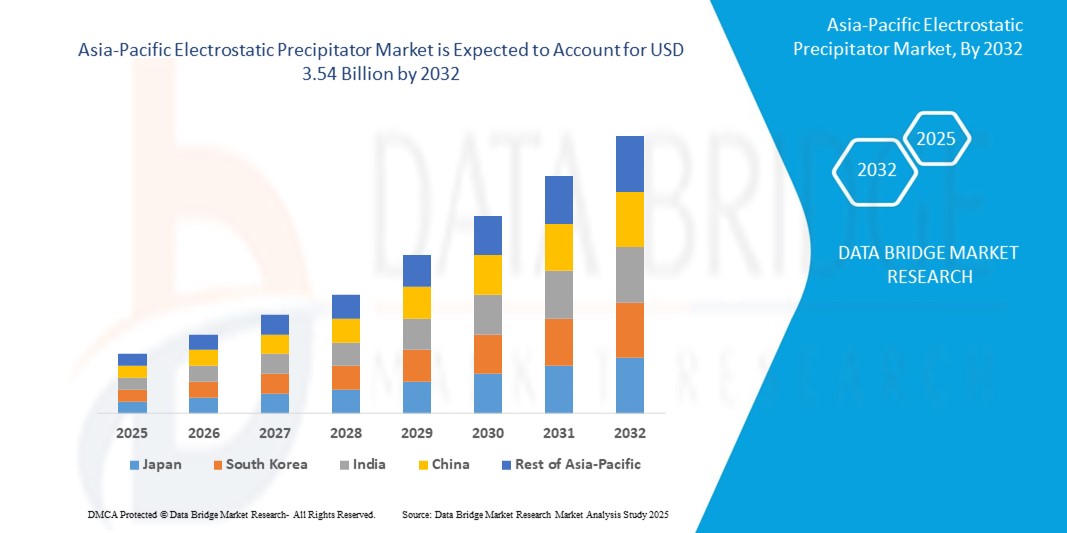
Asia Pacific Electrostatic Precipitator Market
Marktgröße in Milliarden USD
CAGR :
% 
 USD
2.29 Billion
USD
3.54 Billion
2024
2032
USD
2.29 Billion
USD
3.54 Billion
2024
2032
| 2025 –2032 | |
| USD 2.29 Billion | |
| USD 3.54 Billion | |
| % | |
|
Marktsegmentierung für Elektrofilter im asiatisch-pazifischen Raum nach Typ (Trocken-ESP und Nass-ESP), Angebot (Hardware, Software und Dienstleistungen), Anwendung (Kohlekraftwerke, Lichtbogenöfen, Gasturbinen, Müllverbrennungsanlagen, Industriekraftwerke und andere), Endverbraucher (Stromerzeugung, Metallverarbeitung, Zement, Fertigung, Chemie, Petrochemie, Marine und andere) – Branchentrends und Prognose bis 2032
Marktgröße für Elektrofilter im asiatisch-pazifischen Raum
- Der Markt für Elektrofilter im asiatisch-pazifischen Raum wird im Jahr 2024 auf 2,29 Milliarden US-Dollar geschätzt und soll bis 2032 3,54 Milliarden US-Dollar erreichen , bei einer jährlichen Wachstumsrate von 5,60 % im Prognosezeitraum.
- Das Marktwachstum wird maßgeblich durch die Verschärfung der Luftreinhaltevorschriften in den wichtigsten Volkswirtschaften, den Ausbau der industriellen Infrastruktur, einschließlich der Stromerzeugung und der Zementherstellung, und den verstärkten Fokus der Regierungen auf die Reduzierung der Partikelemissionen zur Verbesserung der öffentlichen Gesundheit und der Umweltqualität in der gesamten Region vorangetrieben.
- Darüber hinaus beschleunigen das steigende öffentliche Bewusstsein für die gesundheitlichen Auswirkungen der Luftverschmutzung und die zunehmende Einführung fortschrittlicher Emissionskontrolltechnologien in Schwellenländern wie Indien, China und Südostasien die Wachstumskurve des Marktes erheblich.
Marktanalyse für Elektrofilter im asiatisch-pazifischen Raum
- Der Markt für Elektrofilter im asiatisch-pazifischen Raum verzeichnet ein stetiges Wachstum aufgrund der steigenden Nachfrage nach fortschrittlicher Luftfilterung in Industriezweigen wie der Stromerzeugung und der Zementherstellung.
- Investitionen in die Modernisierung von Umweltschutzsystemen in allen Produktionsstätten fördern die konsequente Einführung von Elektrofiltern in der Region.
- China hatte im Jahr 2024 den größten Marktanteil im asiatisch-pazifischen Markt für Elektrofilter, was auf die groß angelegten Industriebetriebe des Landes, den wachsenden Energiebedarf und strenge Richtlinien zur Luftqualitätskontrolle zurückzuführen ist.
- Japan wird voraussichtlich die höchste durchschnittliche jährliche Wachstumsrate (CAGR) im asiatisch-pazifischen Markt für Elektrofilter verzeichnen. Dies ist auf die strengen Umweltvorschriften, den starken Fokus auf saubere Technologien und die zunehmenden Initiativen zur Modernisierung von Industrieanlagen mit energieeffizienten und emissionsarmen Geräten zurückzuführen.
- Das Segment der Trocken-ESP dominierte den Markt mit dem größten Umsatzanteil von 68,5 % im Jahr 2024, was auf die weit verbreitete Verwendung in Hochtemperatur-Industrieanwendungen wie Kraftwerken, Zementöfen und Stahlwerken zurückzuführen ist. Trocken-ESP entfernen effektiv Feinstaub aus Rauchgasen ohne Wassereinsatz, was den Aufwand bei der Abfallbehandlung minimiert und die Wartungskosten senkt. Die starke Nachfrage nach effizienter Partikelkontrolle in der Kohleenergieerzeugung unterstützt weiterhin das Segmentwachstum.
Berichtsumfang und Marktsegmentierung für Elektrofilter im asiatisch-pazifischen Raum
|
Eigenschaften |
Wichtige Markteinblicke für Elektrofilter im asiatisch-pazifischen Raum |
|
Abgedeckte Segmente |
|
|
Abgedeckte Länder |
Asien-Pazifik
|
|
Wichtige Marktteilnehmer |
|
|
Marktchancen |
• Steigender Einsatz im Schiffs- und Schienenverkehr zur Einhaltung der Emissionsnormen |
|
Wertschöpfungsdaten-Infosets |
Zusätzlich zu den Einblicken in Marktszenarien wie Marktwert, Wachstumsrate, Segmentierung, geografische Abdeckung und wichtige Akteure enthalten die von Data Bridge Market Research kuratierten Marktberichte auch ausführliche Expertenanalysen, geografisch dargestellte Produktion und Kapazität nach Unternehmen, Netzwerklayouts von Distributoren und Partnern, detaillierte und aktuelle Preistrendanalysen und Defizitanalysen der Lieferkette und Nachfrage. |
Markttrends für Elektrofilter im asiatisch-pazifischen Raum
„Zunehmender Trend zu hybriden Elektrofiltern in industriellen Anwendungen“
- Hybride Elektrofilter (ESPs), die elektrostatische und mechanische Filtermethoden integrieren, werden zunehmend aufgrund ihrer Fähigkeit eingesetzt, ultrafeine Partikel effizient zu entfernen.
- So haben beispielsweise in indischen Kraftwerken installierte Hybrid-ESPs eine deutliche Verbesserung bei der PM2,5-Abscheidung gezeigt.
- Die Nachfrage nach Hybrid-ESPs steigt in Branchen wie der Zement- und Wärmekraftindustrie aufgrund ihrer hohen Emissionswerte rasant an. Große Zementhersteller in Südostasien haben begonnen, auf Hybridanlagen umzusteigen, um die neuen Emissionsgrenzwerte einzuhalten.
- Hybridsysteme bieten eine gleichmäßigere Partikelentfernung, selbst bei schwankender Anlagenleistung, und sind daher ideal für Anlagen mit variabler Betriebslast.
- Strengere Luftqualitätsvorschriften in Ländern wie China und Indien zwingen die Industrie dazu, fortschrittliche Lösungen wie Hybrid-ESPs einzusetzen, um die Vorschriften einzuhalten.
- Industrien in der gesamten Region investieren in die Nachrüstung alter ESPs mit Hybridtechnologien, um die Effizienz zu verbessern und den sich entwickelnden Umweltstandards gerecht zu werden.
Marktdynamik für Elektrofilter im asiatisch-pazifischen Raum
Treiber
„Der regulatorische Druck zur Eindämmung der industriellen Luftverschmutzung nimmt zu“
- Der Markt für Elektrofilter im asiatisch-pazifischen Raum wird vor allem durch die zunehmenden Bemühungen zur Eindämmung der industriellen Luftverschmutzung in sich schnell entwickelnden Ländern wie China, Indien und Indonesien angetrieben.
- Regulatorische Rahmenbedingungen wie die chinesische Kampagne zum Schutz des blauen Himmels und das indische National Clean Air Programme (NCAP) schreiben die Installation fortschrittlicher Emissionskontrolltechnologien, einschließlich ESPs, in Sektoren mit hoher Umweltverschmutzung vor.
- Branchen wie die Energieerzeugung, Zementindustrie, Metallverarbeitung und Chemieindustrie stehen zunehmend unter Druck, ihre Filtersysteme zu modernisieren, um Emissionsstandards einzuhalten und gesetzliche Sanktionen zu vermeiden.
- Die steigende Nachfrage nach Systemen zur Erfassung ultrafeiner Partikel (PM2,5 und kleiner) beschleunigt den Einsatz hocheffizienter ESPs in öffentlichen und privaten Einrichtungen.
- Verpflichtungen zur ökologischen Nachhaltigkeit und ESG-Ziele veranlassen Unternehmen dazu, in saubere Technologien zu investieren, während inländische ESP-Hersteller ihr Angebot erweitern, um den regionalen Bedarf zu decken und Kostenbarrieren abzubauen.
Einschränkung/Herausforderung
„Hohe Kapital- und Wartungskosten behindern die Einführung“
- Die hohen Kapitalkosten für Elektrofiltersysteme (ESP) stellen weiterhin eine große Herausforderung auf dem asiatisch-pazifischen Markt dar, insbesondere für kostensensible und kleine bis mittelgroße Industrien.
- ESPs, insbesondere fortschrittliche oder Hybridmodelle, erfordern erhebliche Investitionen in Komponenten wie Hochspannungsaggregate, Entladungselektroden und komplexe Steuerungssysteme, was die anfänglichen Anschaffungskosten erhöht.
- KMU in Entwicklungsländern haben oft Schwierigkeiten, diese Ausgaben trotz Umweltauflagen zu rechtfertigen, was zu Widerstand oder verzögerter Einführung führt.
- Die Betriebskosten steigen zusätzlich durch den Bedarf an Fachkräften, die regelmäßige Wartung des Systems und den Austausch kritischer Teile wie Elektroden, insbesondere bei staubintensiven Anwendungen wie der Stahl- oder Zementherstellung.
- In Regionen mit unzuverlässiger Strominfrastruktur kann eine inkonsistente Stromversorgung die Leistung und Lebensdauer des ESP beeinträchtigen. Dies veranlasst einige Branchen dazu, sich für kostengünstigere Alternativen wie Schlauchfilter zu entscheiden, die zwar einfacher zu warten sind, aber mit der Zeit weniger effizient bei der Partikelentfernung sind.
Marktumfang für Elektrofilter im asiatisch-pazifischen Raum
Der Markt für Elektrofilter im asiatisch-pazifischen Raum ist nach Typ, Angebot, Anwendung und Endbenutzer segmentiert.
- Nach Typ
Der Markt für Elektrofilter im asiatisch-pazifischen Raum ist nach Typ in Trocken-ESP und Nass-ESP unterteilt. Das Trocken-ESP-Segment dominierte den Markt mit dem größten Umsatzanteil von 68,5 % im Jahr 2024, was auf die weit verbreitete Verwendung in Hochtemperatur-Industrieanwendungen wie Kraftwerken, Zementöfen und Stahlwerken zurückzuführen ist. Trocken-ESP entfernen effektiv Feinstaub aus Rauchgasen ohne Wassereinsatz, was die Abfallbehandlung minimiert und die Wartungskosten senkt. Die starke Nachfrage nach effizienter Partikelkontrolle in der Kohleenergieerzeugung unterstützt weiterhin das Segmentwachstum.
Das Segment der Nass-ESPs wird voraussichtlich zwischen 2025 und 2032 das höchste Wachstum verzeichnen. Dies ist auf die Eignung der Systeme zur Handhabung klebriger oder feuchter Partikel in Branchen wie der Müllverbrennung, Metallveredelung und der chemischen Produktion zurückzuführen. Nass-ESPs bieten eine hervorragende Leistung bei der Erfassung von Submikronpartikeln, Säurenebeln und Dämpfen und erfüllen so die strengen Emissionsvorschriften in der gesamten Region.
- Durch das Angebot
Der Markt für Elektrofilter im asiatisch-pazifischen Raum ist nach Angebot in Hardware, Software und Dienstleistungen segmentiert. Das Hardwaresegment hielt 2024 den größten Umsatzanteil, unterstützt durch den anhaltenden Einsatz von Elektrofilteranlagen im Energie- und Industriesektor. Der wachsende Bedarf, veraltete ESP-Infrastruktur durch fortschrittliche Hardwarelösungen zu ersetzen, beschleunigt das Wachstum zusätzlich.
Das Dienstleistungssegment dürfte zwischen 2025 und 2032 die höchste Wachstumsrate aufweisen, getrieben durch die steigende Nachfrage nach regelmäßiger Wartung, Nachrüstung und Leistungsoptimierung, um die Einhaltung der Emissionsstandards zu gewährleisten und die Lebensdauer der Geräte zu verlängern.
- Nach Anwendung
Der Markt für Elektrofilter im asiatisch-pazifischen Raum ist nach Anwendungsbereichen unterteilt in Kohlekraftwerke, Lichtbogenöfen, Gasturbinen, Müllverbrennungsanlagen, Industriekraftwerke und weitere. Das Segment der Kohlekraftwerke dominierte 2024 aufgrund der hohen Anzahl in Betrieb befindlicher Wärmekraftwerke in Ländern wie China und Indien. Elektrofilter spielen eine entscheidende Rolle bei der Reduzierung der Partikelemissionen dieser Anlagen und entsprechen den regionalen Umweltschutzbestimmungen.
Das Segment der Müllverbrennungsanlagen dürfte zwischen 2025 und 2032 das höchste Wachstum verzeichnen, getrieben durch die zunehmende Urbanisierung und den steigenden Bedarf an effektiven Lösungen zur Energiegewinnung aus Abfall. Da Regierungen in sauberere Verbrennungstechnologien investieren, steigt die Nachfrage nach leistungsstarken ESP-Systemen stetig.
- Nach Endbenutzer
Der Markt für Elektrofilter im asiatisch-pazifischen Raum ist nach Endverbrauchern in die Bereiche Stromerzeugung, Metallverarbeitung, Zement, Fertigung, Chemie, Petrochemie, Schifffahrt und andere unterteilt. Das Segment Stromerzeugung hatte 2024 den größten Marktanteil, da es auf ESPs zur Reduzierung der Partikelemissionen in Kohlekraftwerken setzt. Strenge Emissionsvorschriften ermutigen Energieversorger, effiziente ESP-Systeme zu modernisieren oder zu installieren.
Der Chemiesektor dürfte zwischen 2025 und 2032 das höchste Wachstum verzeichnen, unterstützt durch die zunehmende Betonung sauberer Produktionsmethoden und der Schadstoffbekämpfung. Chemieanlagen setzen derzeit Elektrofilter ein, um die Emissionen von Feinstaub, Säurenebeln und Prozessdämpfen zu kontrollieren und so den sich entwickelnden Umweltrichtlinien der Region gerecht zu werden.
Regionale Analyse des Marktes für Elektrofilter im asiatisch-pazifischen Raum
- China hatte im Jahr 2024 den größten Marktanteil im asiatisch-pazifischen Markt für Elektrofilter, was auf die groß angelegten Industriebetriebe des Landes, den wachsenden Energiebedarf und strenge Richtlinien zur Luftqualitätskontrolle zurückzuführen ist.
- Die aggressiven Bemühungen der chinesischen Regierung, die Industrieemissionen im Rahmen ihrer Luftreinhalteinitiativen zu reduzieren, fördern den großflächigen Einsatz von Elektrofiltern in der Zement-, Metall- und Stromerzeugungsbranche.
- Die Präsenz großer inländischer Hersteller und laufende Infrastrukturprojekte verstärken die Nachfrage zusätzlich. Darüber hinaus fördert das zunehmende Bewusstsein für die gesundheitlichen Auswirkungen der Luftverschmutzung eine schnellere Einführung im öffentlichen und privaten Sektor.
Markteinblick für Elektrofilter in Japan
Der japanische Markt für Elektrofilter wird voraussichtlich zwischen 2025 und 2032 das schnellste Wachstum verzeichnen. Dies ist auf die strengen Umweltstandards des Landes und den Fokus auf energieeffiziente und saubere Industrieprozesse zurückzuführen. Als technologieorientiertes Land legt Japan Wert auf die Modernisierung seiner industriellen Infrastruktur mit fortschrittlichen Emissionskontrollsystemen. Der Wandel hin zu einer umweltbewussten Produktion, insbesondere in der Stromerzeugung und im verarbeitenden Gewerbe, unterstützt das Marktwachstum. Staatlich geförderte Initiativen zur Reduzierung der Partikelemissionen und Investitionen in die Nachrüstung bestehender Kraftwerke wirken sich zudem positiv auf die Verbreitung von Elektrofiltern auf dem japanischen Markt aus.
Marktanteil von Elektrofiltern im asiatisch-pazifischen Raum
Die Elektrofilterbranche im asiatisch-pazifischen Raum wird hauptsächlich von etablierten Unternehmen angeführt, darunter:
- Thermax Limited (Indien)
- Sumitomo Heavy Industries, Ltd (Japan)
- Fujian Longking Co., Ltd. (China)
- Mitsubishi Power, Ltd. (Japan)
- KC Cottrell (Südkorea)
- KLEAN (Südkorea)
- Bharat Heavy Electricals Limited (Indien)
- Pennar Industries Limited (Indien)
SKU-
Erhalten Sie Online-Zugriff auf den Bericht zur weltweit ersten Market Intelligence Cloud

- Interaktives Datenanalyse-Dashboard
- Unternehmensanalyse-Dashboard für Chancen mit hohem Wachstumspotenzial
- Zugriff für Research-Analysten für Anpassungen und Abfragen
- Konkurrenzanalyse mit interaktivem Dashboard
- Aktuelle Nachrichten, Updates und Trendanalyse
- Nutzen Sie die Leistungsfähigkeit der Benchmark-Analyse für eine umfassende Konkurrenzverfolgung
Inhaltsverzeichnis
- Einführung
- ZIELE DER STUDIE
- MARKTDEFINITION
- ÜBERBLICK ÜBER DEN Markt für Elektrofilter im asiatisch-pazifischen Raum
- Währung und Preise
- EINSCHRÄNKUNGEN
- ABGEDECKTE MÄRKTE
- Marktsegmentierung
- ABGEDECKTE MÄRKTE
- Geografischer Umfang
- Jahre, die für die Studie berücksichtigt wurden
- DBMR-Dreibeindatenvalidierungsmodell
- Primärinterviews mit wichtigen Meinungsführern
- DBMR-Marktpositionsraster
- Lieferantenanteilsanalyse
- MARKTTYP ABDECKUNGSRASTER
- Multivariate Modellierung
- Typ Zeitachsenkurve
- Sekundärquellen
- Annahmen
- ZUSAMMENFASSUNG
- Premium-Einblicke
- Marktübersicht
- TREIBER
- Zunehmende Bautätigkeiten weltweit
- TECHNOLOGISCHE FORTSCHRITTE BEI EMISSIONSKONTROLLLÖSUNGEN
- Steigender Strombedarf in Schwellenländern aufgrund der rasanten Urbanisierung
- EINSCHRÄNKUNGEN
- Strenge staatliche Vorschriften
- HOHE INSTALLATIONSKOSTEN FÜR ESP
- GELEGENHEITEN
- STRATEGISCHE ALLIANZEN UND PARTNERSCHAFTEN ZWISCHEN ORGANISATIONEN
- Zunahme staatlicher Initiativen zur Umweltverschmutzungskontrolle
- UMFANGREICHE F&E-INVESTITIONEN DURCH DIE REGIERUNG
- HERAUSFORDERUNGEN
- Mangelndes Bewusstsein für das Abgaskontrollsystem
- Betriebsprobleme und Fehlfunktionen des Geräts
- ungünstige wirtschaftliche Bedingungen und das Aufkommen alternativer Energiequellen
- AUSWIRKUNGSANALYSE VON COVID-19 AUF DEN MARKT
- NACHWIRKUNGEN DES MARKTES FÜR ELEKTROSTATISCHE FILTER
- CHANCEN FÜR DEN MARKT NACH DER COVID-19-PANDEMIE
- AUSWIRKUNGEN AUF ANGEBOT, NACHFRAGE UND PREIS
- ABSCHLUSS
- Markt für Elektrofilter im asiatisch-pazifischen Raum nach Typ
- Überblick
- TROCKENES ESP
- nass, besonders
- Markt für Elektrofilter im asiatisch-pazifischen Raum durch das Angebot
- Überblick
- HARDWARE & SOFTWARE
- Entladungselektroden
- HOCHSPANNUNGSELEKTRISCHE SYSTEME
- SAMMELELEKTRODEN
- RAPPERS
- Hoppers
- HÜLSE
- Sonstiges
- DIENSTLEISTUNGEN
- Markt für Elektrofilter im asiatisch-pazifischen Raum nach Anwendung
- Überblick
- Kohlekraftwerke
- Lichtbogenöfen
- GASTURBINEN
- INDUSTRIELLE LEISTUNG
- Müllverbrennungsanlagen
- ANDERE
- Markt für Elektrofilter im asiatisch-pazifischen Raum nach Endverbraucher
- Überblick
- STROMERZEUGUNG
- NACH Typ
- Kohlekraftwerk
- ERDÖLRAFINERIE UND KRAFTWERKE
- NACH ESP-Typ
- TROCKENES ESP
- NASSES ESP
- METALLBEARBEITUNG
- NACH Typ
- EISEN- UND STAHLHERSTELLUNG
- NE-METALLPRODUKTION UND -VERARBEITUNG
- Gießereien
- Aluminiumschmelze
- NACH ESP-Typ
- TROCKENES ESP
- NASSES ESP
- ZEMENT
- NACH ESP-Typ
- TROCKENES ESP
- NASSES ESP
- Chemie und Petrochemie
- NACH Typ
- Grundstoffchemie
- Hersteller von Spezialchemikalien
- Hersteller von Konsumchemikalien
- NACH ESP-Typ
- TROCKENES ESP
- NASSES ESP
- HERSTELLUNG
- NACH ESP-Typ
- TROCKENES ESP
- NASSES ESP
- MARINE
- NACH ESP-Typ
- TROCKENES ESP
- NASSES ESP
- ANDERE
- Markt für Elektrofilter im asiatisch-pazifischen Raum, nach Ländern
- China
- Indien
- Japan
- Südkorea
- INDONESIEN
- Australien
- Thailand
- Malaysia
- Philippinen
- Singapur
- Restlicher Asien-Pazifik-Raum
- Markt für Elektrofilter im asiatisch-pazifischen Raum: Unternehmenslandschaft
- Unternehmensaktienanalyse: Asien-Pazifik
- SWOT-Analyse
- Unternehmensprofil
- FUJIAN LONGKING CO., LTD.
- UNTERNEHMENSÜBERSICHT
- GESCHÄFTSPORTFOLIO
- JÜNGSTE ENTWICKLUNG
- MITSUBISHI POWER, LTD. (EINE TOCHTERGESELLSCHAFT VON MITSUBISHI HEAVY INDUSTRIES, LTD.)
- UNTERNEHMENSÜBERSICHT
- Umsatzanalyse
- PRODUKTPORTFOLIO
- JÜNGSTE ENTWICKLUNGEN
- BHARAT HEAVY ELECTRICALS LIMITED
- UNTERNEHMENSÜBERSICHT
- Umsatzanalyse
- PRODUKTPORTFOLIO
- JÜNGSTE ENTWICKLUNGEN
- SUMITOMO HEAVY INDUSTRIES, LTD.
- UNTERNEHMENSÜBERSICHT
- Umsatzanalyse
- PRODUKTPORTFOLIO
- JÜNGSTE ENTWICKLUNGEN
- ALLGEMEINE ELEKTRO
- UNTERNEHMENSÜBERSICHT
- Umsatzanalyse
- PRODUKTPORTFOLIO
- JÜNGSTE ENTWICKLUNG
- BABCOCK & WILCOX ENTERPRISES, INC.
- UNTERNEHMENSÜBERSICHT
- Umsatzanalyse
- PRODUKTPORTFOLIO
- JÜNGSTE ENTWICKLUNGEN
- FLSMIDTH
- UNTERNEHMENSÜBERSICHT
- Umsatzanalyse
- PRODUKTPORTFOLIO
- JÜNGSTE ENTWICKLUNGEN
- GEA GROUP AKTIENGESELLSCHAFT
- UNTERNEHMENSÜBERSICHT
- Umsatzanalyse
- PRODUKTPORTFOLIO
- JÜNGSTE ENTWICKLUNG
- JOHN WOOD GROUP PLC
- UNTERNEHMENSÜBERSICHT
- Umsatzanalyse
- PRODUKTPORTFOLIO
- JÜNGSTE ENTWICKLUNG
- KC CORTTREL
- UNTERNEHMENSÜBERSICHT
- Umsatzanalyse
- PRODUKTPORTFOLIO
- JÜNGSTE ENTWICKLUNG
- KLEAN
- UNTERNEHMENSÜBERSICHT
- PRODUKTPORTFOLIO
- JÜNGSTE ENTWICKLUNG
- PENNAR INDUSTRIES LIMITED
- UNTERNEHMENSÜBERSICHT
- Umsatzanalyse
- PRODUKTPORTFOLIO
- JÜNGSTE ENTWICKLUNG
- SIEMENS ENERGY
- UNTERNEHMENSÜBERSICHT
- Umsatzanalyse
- PRODUKTPORTFOLIO
- JÜNGSTE ENTWICKLUNGEN
- SA HAMON
- UNTERNEHMENSÜBERSICHT
- Umsatzanalyse
- PRODUKTPORTFOLIO
- JÜNGSTE ENTWICKLUNGEN
- THERMAX LIMITED
- UNTERNEHMENSÜBERSICHT
- Umsatzanalyse
- PRODUKTPORTFOLIO
- JÜNGSTE ENTWICKLUNG
- Fragebogen
- zugehörige Berichte
Tabellenverzeichnis
TABELLE 1 EMISSIONSSTANDARDS FÜR KOHLEKRAFTWERKE
TABELLE 2 Durchschnittliche Kosten des Elektrofilters in einem Kraftwerk
TABELLE 3: Markt für Elektrofilter im asiatisch-pazifischen Raum, nach Typ, 2019–2028 (TAUSEND USD)
TABELLE 4: MARKT FÜR ELEKTROSTATISCHE FILTER IM ASIEN-PAZIFIK-RAUM, NACH ANGEBOT, 2019–2028 (TAUSEND USD)
TABELLE 5: Hardware und Software im asiatisch-pazifischen Markt für Elektrofilter, nach Typ, 2019–2028 (TAUSEND USD)
TABELLE 6: MARKT FÜR ELEKTROSTATISCHE FILTER IM ASIEN-PAZIFIK-RAUM, NACH ANWENDUNG, 2019–2028 (TAUSEND USD)
TABELLE 7: Markt für Elektrofilter im asiatisch-pazifischen Raum, nach Endverbraucher, 2019–2028 (in TAUSEND USD)
TABELLE 8: Markt für Stromerzeugung im asiatisch-pazifischen Raum mit Elektrofiltern, nach Typ, 2019–2028 (TAUSEND USD)
TABELLE 9: Stromerzeugung im asiatisch-pazifischen Markt im Bereich Elektrofilter, nach ESP-Typ, 2019–2028 (TAUSEND USD)
TABELLE 10: Asien-Pazifik-Markt für METALLVERARBEITUNG im Elektrofilter, nach Typ, 2019–2028 (TAUSEND USD)
TABELLE 11: METALLVERARBEITUNG im asiatisch-pazifischen Markt für Elektrofilter, nach ESP-Typ, 2019–2028 (TAUSEND USD)
TABELLE 12. Markt für Zement im asiatisch-pazifischen Raum im Bereich Elektrofilter, nach ESP-Typ, 2019–2028 (TAUSEND USD)
TABELLE 13: Chemie und Petrochemie im asiatisch-pazifischen Raum auf dem Markt für Elektrofilter, nach Typ, 2019–2028 (in TAUSEND USD)
TABELLE 14: Chemie und Petrochemie im asiatisch-pazifischen Raum auf dem Markt für Elektrofilter, nach ESP-Typ, 2019–2028 (in TAUSEND USD)
TABELLE 15: Fertigung im asiatisch-pazifischen Markt für Elektrofilter, nach ESP-Typ, 2019–2028 (TAUSEND USD)
TABELLE 16: Marine im asiatisch-pazifischen Markt für Elektrofilter, nach ESP-Typ, 2019–2028 (TAUSEND USD)
TABELLE 17 Markt für Elektrofilter im asiatisch-pazifischen Raum, nach Ländern, 2019–2028 (in Tausend USD)
TABELLE 18 CHINA-Markt für Elektrofilter, NACH Typ, 2019–2028 (in Tausend USD)
TABELLE 19 CHINA-Markt für Elektrofilter, nach Angebot, 2019–2028 (in Tausend USD)
TABELLE 20. Chinesischer Markt für Hardware und Software im Bereich Elektrofilter, nach Typ, 2019–2028 (in Tausend USD)
TABELLE 21: Chinesischer Markt für Elektrofilter, nach Anwendung, 2019–2028 (in Tausend USD)
TABELLE 22. Chinesischer Markt für Elektrofilter, nach Endverbraucher, 2019–2028 (in Tausend USD)
TABELLE 23: Chinesischer Markt für Stromerzeugung im Elektrofilter, nach Typ, 2019–2028 (in Tausend USD)
TABELLE 24: Stromerzeugung im chinesischen Markt für Elektrofilter, nach ESP-Typ, 2019–2028 (in Tausend USD)
TABELLE 25: Chinesischer Markt für Metallverarbeitung im Elektrofilter, nach Typ, 2019–2028 (in Tausend USD)
TABELLE 26: Chinesischer Markt für Metallverarbeitung im Elektrofilter, nach ESP-Typ, 2019–2028 (in Tausend USD)
TABELLE 27: Zement im Elektrofiltermarkt in China, nach ESP-Typ, 2019–2028 (in Tausend USD)
TABELLE 28 Chinesischer Markt für Chemie und Petrochemie im Elektrofilter, nach Typ, 2019–2028 (in Tausend USD)
TABELLE 29: Chinesischer Markt für Chemie und Petrochemie im Elektrofilter, nach ESP-Typ, 2019–2028 (in Tausend USD)
TABELLE 30: Produktion im chinesischen Markt für Elektrofilter, nach ESP-Typ, 2019–2028 (in Tausend USD)
TABELLE 31: Chinesischer Markt für Marine-Elektrofilter, nach ESP-Typ, 2019–2028 (in Tausend USD)
TABELLE 32 Markt für Elektrofilter in Indien, NACH Typ, 2019–2028 (in Tausend USD)
TABELLE 33: Indischer Markt für Elektrofilter, nach Angebot, 2019–2028 (in Tausend USD)
TABELLE 34: Hardware und Software im indischen Markt für Elektrofilter, nach Typ, 2019–2028 (in Tausend USD)
TABELLE 35: Markt für Elektrofilter in Indien, nach Anwendung, 2019–2028 (in Tausend USD)
TABELLE 36: Markt für Elektrofilter in Indien, nach Endverbraucher, 2019–2028 (in Tausend USD)
TABELLE 37: Indischer Markt für Stromerzeugung im Elektrofilter, nach Typ, 2019–2028 (in Tausend USD)
TABELLE 38: Stromerzeugung im indischen Markt für Elektrofilter, nach ESP-Typ, 2019–2028 (in Tausend USD)
TABELLE 39: Indischer Markt für Metallverarbeitung im Elektrofilter, nach Typ, 2019–2028 (in Tausend USD)
TABELLE 40: Metallverarbeitung im indischen Markt für Elektrofilter, nach ESP-Typ, 2019–2028 (in Tausend USD)
TABELLE 41: Zement im indischen Markt für Elektrofilter, nach ESP-Typ, 2019–2028 (in Tausend USD)
TABELLE 42: Indischer Markt für Chemie und Petrochemie im Elektrofilter, nach Typ, 2019–2028 (in Tausend USD)
TABELLE 43: Chemie und Petrochemie im indischen Markt für Elektrofilter, nach ESP-Typ, 2019–2028 (in Tausend USD)
TABELLE 44: Produktion im indischen Markt für Elektrofilter, nach ESP-Typ, 2019–2028 (in Tausend USD)
TABELLE 45: Marine-Elektrofiltermarkt in Indien, nach ESP-Typ, 2019–2028 (in Tausend USD)
TABELLE 46 Japanischer Markt für Elektrofilter, NACH Typ, 2019–2028 (in Tausend USD)
TABELLE 47 JAPANISCHER Markt für Elektrofilter, nach Angebot, 2019–2028 (in Tausend USD)
TABELLE 48 Japanischer Markt für Hardware und Software im Bereich Elektrofilter, nach Typ, 2019–2028 (in Tausend USD)
TABELLE 49 Japanischer Markt für Elektrofilter, nach Anwendung, 2019–2028 (in Tausend USD)
TABELLE 50 Japanischer Markt für Elektrofilter, nach Endverbraucher, 2019–2028 (in Tausend USD)
TABELLE 51: Japanischer Markt für Stromerzeugung im Elektrofilter, nach Typ, 2019–2028 (in Tausend USD)
TABELLE 52: Japanischer Markt für Stromerzeugung im Elektrofilter, nach ESP-Typ, 2019–2028 (in Tausend USD)
TABELLE 53 Japanischer Markt für Metallverarbeitung im Elektrofilter, nach Typ, 2019–2028 (in Tausend USD)
TABELLE 54 Japanischer Markt für Metallverarbeitung im Elektrofilter, nach ESP-Typ, 2019–2028 (in Tausend USD)
TABELLE 55: Zement im japanischen Markt für Elektrofilter, nach ESP-Typ, 2019–2028 (in Tausend USD)
TABELLE 56 Japanischer Markt für Chemie und Petrochemie im Elektrofilter, nach Typ, 2019–2028 (in Tausend USD)
TABELLE 57: Japanischer Markt für Chemie und Petrochemie im Elektrofilter, nach ESP-Typ, 2019–2028 (in Tausend USD)
TABELLE 58 Japanische Produktion auf dem Markt für Elektrofilter, nach ESP-Typ, 2019–2028 (in Tausend USD)
TABELLE 59 Japan Marine im Markt für Elektrofilter, nach ESP-Typ, 2019–2028 (in Tausend USD)
TABELLE 60 SÜDKOREA – Markt für Elektrofilter, NACH Typ, 2019–2028 (in Tausend USD)
TABELLE 61 SÜDKOREA – Markt für Elektrofilter, nach Angebot, 2019–2028 (in Tausend USD)
TABELLE 62 Südkoreanischer Markt für Hardware und Software im Bereich Elektrofilter, nach Typ, 2019–2028 (in Tausend USD)
TABELLE 63 Südkoreanischer Markt für Elektrofilter, nach Anwendung, 2019–2028 (in Tausend USD)
TABELLE 64 Südkoreanischer Markt für Elektrofilter, nach Endverbraucher, 2019–2028 (in Tausend USD)
TABELLE 65 Südkoreanischer Markt für Stromerzeugung im Elektrofilter, nach Typ, 2019–2028 (in Tausend USD)
TABELLE 66: Südkoreanische Stromerzeugung im Markt für Elektrofilter, nach ESP-Typ, 2019–2028 (in Tausend USD)
TABELLE 67 Südkoreanischer Markt für Metallverarbeitung im Elektrofilter, nach Typ, 2019–2028 (in Tausend USD)
TABELLE 68 Südkoreanischer Markt für Metallverarbeitung im Elektrofilter, nach ESP-Typ, 2019–2028 (in Tausend USD)
TABELLE 69 Südkoreanischer Markt für Zement im Elektrofilter, nach ESP-Typ, 2019–2028 (in Tausend USD)
TABELLE 70 Südkoreanischer Markt für Chemie und Petrochemie im Elektrofilter, nach Typ, 2019–2028 (in Tausend USD)
TABELLE 71 Südkoreanischer Markt für Chemie und Petrochemie im Elektrofilter, nach ESP-Typ, 2019–2028 (in Tausend USD)
TABELLE 72 Südkoreanische Produktion auf dem Markt für Elektrofilter, nach ESP-Typ, 2019–2028 (in Tausend USD)
TABELLE 73 Südkoreanischer Markt für Marine-Elektrofilter, nach ESP-Typ, 2019–2028 (in Tausend USD)
TABELLE 74 INDONESIEN – Markt für Elektrofilter, NACH Typ, 2019–2028 (in Tausend USD)
TABELLE 75 INDONESIEN – Markt für Elektrofilter, nach Angebot, 2019–2028 (in Tausend USD)
TABELLE 76 Indonesische Hardware und Software auf dem Markt für Elektrofilter, nach Typ, 2019–2028 (in Tausend USD)
TABELLE 77 Indonesischer Markt für Elektrofilter, nach Anwendung, 2019–2028 (in Tausend USD)
TABELLE 78 Indonesischer Markt für Elektrofilter, nach Endverbraucher, 2019–2028 (in Tausend USD)
TABELLE 79 – Indonesischer Markt für Stromerzeugung im Elektrofilter, nach Typ, 2019–2028 (in Tausend USD)
TABELLE 80: Indonesischer Markt für Stromerzeugung im Elektrofilter, nach ESP-Typ, 2019–2028 (in Tausend USD)
TABELLE 81 Indonesischer Markt für Metallverarbeitung im Elektrofilter, nach Typ, 2019–2028 (in Tausend USD)
TABELLE 82 Indonesischer Markt für Metallverarbeitung im Elektrofilter, nach ESP-Typ, 2019–2028 (in Tausend USD)
TABELLE 83 Indonesischer Zementmarkt im Elektrofilter, nach ESP-Typ, 2019–2028 (in Tausend USD)
TABELLE 84 Indonesischer Markt für Chemikalien und Petrochemikalien im Elektrofilter, nach Typ, 2019–2028 (in Tausend USD)
TABELLE 85 Indonesischer Markt für Chemie und Petrochemie im Elektrofilter, nach ESP-Typ, 2019–2028 (in Tausend USD)
TABELLE 86 Indonesische Produktion auf dem Markt für Elektrofilter, nach ESP-Typ, 2019–2028 (in Tausend USD)
TABELLE 87 Indonesischer Markt für Marine-Elektrofilter, nach ESP-Typ, 2019–2028 (in Tausend USD)
TABELLE 88 AUSTRALIEN Markt für Elektrofilter, NACH Typ, 2019–2028 (in Tausend USD)
TABELLE 89 AUSTRALIEN Markt für Elektrofilter, nach Angebot, 2019–2028 (in Tausend USD)
TABELLE 90 – Australischer Markt für Hardware und Software im Bereich Elektrofilter, nach Typ, 2019–2028 (in Tausend USD)
TABELLE 91: Australischer Markt für Elektrofilter, nach Anwendung, 2019–2028 (in Tausend USD)
TABELLE 92: Australischer Markt für Elektrofilter, nach Endverbraucher, 2019–2028 (in Tausend USD)
TABELLE 93 – Australischer Markt für Stromerzeugung im Elektrofilter, nach Typ, 2019–2028 (in Tausend USD)
TABELLE 94: Stromerzeugung im australischen Markt für Elektrofilter, nach ESP-Typ, 2019–2028 (in Tausend USD)
TABELLE 95 – Australischer Markt für Metallverarbeitung im Elektrofilter, nach Typ, 2019–2028 (in Tausend USD)
TABELLE 96: Australischer Markt für Metallverarbeitung im Elektrofilter, nach ESP-Typ, 2019–2028 (in Tausend USD)
TABELLE 97 – Australischer Markt für Zement im Elektrofilter, nach ESP-Typ, 2019–2028 (in Tausend USD)
TABELLE 98 – Australischer Markt für Chemikalien und Petrochemikalien im Elektrofilter, nach Typ, 2019–2028 (in Tausend USD)
TABELLE 99 – Australischer Markt für Chemie und Petrochemie im Elektrofilter, nach ESP-Typ, 2019–2028 (in Tausend USD)
TABELLE 100: Australische Produktion im Markt für Elektrofilter, nach ESP-Typ, 2019–2028 (in Tausend USD)
TABELLE 101 Australien Marine im Markt für Elektrofilter, nach ESP-Typ, 2019–2028 (in Tausend USD)
TABELLE 102 Markt für Elektrofilter in Thailand, NACH Typ, 2019–2028 (in Tausend USD)
TABELLE 103 THAILAND – Markt für Elektrofilter, nach Angebot, 2019–2028 (in Tausend USD)
TABELLE 104: Hardware und Software im thailändischen Markt für Elektrofilter, nach Typ, 2019–2028 (in Tausend USD)
TABELLE 105 Markt für Elektrofilter in Thailand, nach Anwendung, 2019–2028 (in Tausend USD)
TABELLE 106 Markt für Elektrofilter in Thailand, nach Endverbraucher, 2019–2028 (in Tausend USD)
TABELLE 107: Stromerzeugung im thailändischen Markt für Elektrofilter, nach Typ, 2019–2028 (in Tausend USD)
TABELLE 108 Stromerzeugung im thailändischen Markt für Elektrofilter, nach ESP-Typ, 2019–2028 (in Tausend USD)
TABELLE 109 Thailand: Markt für Metallverarbeitung im Elektrofilter, nach Typ, 2019–2028 (in Tausend USD)
TABELLE 110: Metallverarbeitung im thailändischen Markt für Elektrofilter, nach ESP-Typ, 2019–2028 (in Tausend USD)
TABELLE 111: Markt für Zement im thailändischen Elektrofilter, nach ESP-Typ, 2019–2028 (in Tausend USD)
TABELLE 112 Thailand – Markt für Chemikalien und Petrochemikalien im Elektrofilter, nach Typ, 2019–2028 (in Tausend USD)
TABELLE 113 Thailand: Chemie und Petrochemie im Markt für Elektrofilter, nach ESP-Typ, 2019–2028 (in Tausend USD)
TABELLE 114: Produktion im thailändischen Markt für Elektrofilter, nach ESP-Typ, 2019–2028 (in Tausend USD)
TABELLE 115 Thailand Marine im Markt für Elektrofilter, nach ESP-Typ, 2019–2028 (in Tausend USD)
TABELLE 116 Malaysischer Markt für Elektrofilter, NACH Typ, 2019–2028 (in Tausend USD)
TABELLE 117 MALAYSIA – Markt für Elektrofilter, nach Angebot, 2019–2028 (in Tausend USD)
TABELLE 118 – Hardware und Software im malaysischen Markt für Elektrofilter, nach Typ, 2019–2028 (in Tausend USD)
TABELLE 119 Malaysischer Markt für Elektrofilter, nach Anwendung, 2019–2028 (in Tausend USD)
TABELLE 120 Malaysischer Markt für Elektrofilter, nach Endverbraucher, 2019–2028 (in Tausend USD)
TABELLE 121 – Malaysischer Markt für Stromerzeugung im Elektrofilter, nach Typ, 2019–2028 (in Tausend USD)
TABELLE 122 – Stromerzeugung im malaysischen Markt für Elektrofilter, nach ESP-Typ, 2019–2028 (in Tausend USD)
TABELLE 123 Malaysia: Markt für Metallverarbeitung im Elektrofilter, nach Typ, 2019–2028 (in Tausend USD)
TABELLE 124 – Malaysia: Markt für Metallverarbeitung im Elektrofilter, nach ESP-Typ, 2019–2028 (in Tausend USD)
TABELLE 125 – Malaysia: Zement im Elektrofiltermarkt, nach ESP-Typ, 2019–2028 (in Tausend USD)
TABELLE 126 Malaysia: Chemie und Petrochemie im Elektrofiltermarkt, nach Typ, 2019–2028 (in Tausend USD)
TABELLE 127 Malaysia Chemie und Petrochemie im Markt für Elektrofilter, nach ESP-Typ, 2019–2028 (in Tausend USD)
TABELLE 128 Malaysia: Produktion auf dem Markt für Elektrofilter, nach ESP-Typ, 2019–2028 (in Tausend USD)
TABELLE 129 Malaysia Marine im Markt für Elektrofilter, nach ESP-Typ, 2019–2028 (in Tausend USD)
TABELLE 130 Markt für Elektrofilter auf den Philippinen, NACH Typ, 2019–2028 (in Tausend USD)
TABELLE 131 PHILIPPINEN – Markt für Elektrofilter, nach Angebot, 2019–2028 (in Tausend USD)
TABELLE 132: Philippinische Hardware und Software im Markt für Elektrofilter, nach Typ, 2019–2028 (in Tausend USD)
TABELLE 133 Markt für Elektrofilter auf den Philippinen, nach Anwendung, 2019–2028 (in Tausend USD)
TABELLE 134 Markt für Elektrofilter auf den Philippinen, nach Endverbraucher, 2019–2028 (in Tausend USD)
TABELLE 135 – Markt für Stromerzeugung im Elektrofilter auf den Philippinen, nach Typ, 2019–2028 (in Tausend USD)
TABELLE 136: Stromerzeugung im Markt für Elektrofilter auf den Philippinen, nach ESP-Typ, 2019–2028 (in Tausend USD)
TABELLE 137: Philippinen: Markt für Metallverarbeitung im Elektrofilter, nach Typ, 2019–2028 (in Tausend USD)
TABELLE 138 – Philippinen: Metallverarbeitung im Markt für Elektrofilter, nach ESP-Typ, 2019–2028 (in Tausend USD)
TABELLE 139 – Philippinen: Zement im Elektrofiltermarkt, nach ESP-Typ, 2019–2028 (in Tausend USD)
TABELLE 140 Philippinen: Chemie und Petrochemie im Elektrofiltermarkt, nach Typ, 2019–2028 (in Tausend USD)
TABELLE 141: Chemie und Petrochemie auf den Philippinen im Markt für Elektrofilter, nach ESP-Typ, 2019–2028 (in Tausend USD)
TABELLE 142: Herstellung von Elektrofiltern auf den Philippinen, nach ESP-Typ, 2019–2028 (in Tausend USD)
TABELLE 143. Philippinischer Markt für Marine-Elektrofilter, nach ESP-Typ, 2019–2028 (in Tausend USD)
TABELLE 144 Markt für Elektrofilter in Singapur, NACH Typ, 2019–2028 (in Tausend USD)
TABELLE 145 – Markt für Elektrofilter in Singapur, nach Angebot, 2019–2028 (in Tausend USD)
TABELLE 146 Singapur: Hardware und Software im Markt für Elektrofilter, nach Typ, 2019–2028 (in Tausend USD)
TABELLE 147 Markt für Elektrofilter in Singapur, nach Anwendung, 2019–2028 (in Tausend USD)
TABELLE 148 Markt für Elektrofilter in Singapur, nach Endverbraucher, 2019–2028 (in Tausend USD)
TABELLE 149 Singapur – Markt für Stromerzeugung im Elektrofilter, nach Typ, 2019–2028 (in Tausend USD)
TABELLE 150: Stromerzeugung im Markt für Elektrofilter in Singapur, nach ESP-Typ, 2019–2028 (in Tausend USD)
TABELLE 151 Singapurer Markt für Metallverarbeitung im Elektrofilter, nach Typ, 2019–2028 (in Tausend USD)
TABELLE 152: Singapurs Markt für Metallverarbeitung im Elektrofilter, nach ESP-Typ, 2019–2028 (in Tausend USD)
TABELLE 153 Singapurischer Zementmarkt im Elektrofilter, nach ESP-Typ, 2019–2028 (in Tausend USD)
TABELLE 154 Singapurs Markt für Chemie und Petrochemie im Elektrofilter, nach Typ, 2019–2028 (in Tausend USD)
TABELLE 155 Singapurs Chemie- und Petrochemiemarkt im Elektrofilter, nach ESP-Typ, 2019–2028 (in Tausend USD)
TABELLE 156 Singapurische Produktion im Markt für Elektrofilter, nach ESP-Typ, 2019–2028 (in Tausend USD)
TABELLE 157 Singapur Marine im Markt für Elektrofilter, nach ESP-Typ, 2019–2028 (in Tausend USD)
TABELLE 158 Restlicher Markt für Elektrofilter im asiatisch-pazifischen Raum, NACH Typ, 2019–2028 (in Tausend USD)
Abbildungsverzeichnis
ABBILDUNG 1: Marktsegmentierung für Elektrofilter im asiatisch-pazifischen Raum
ABBILDUNG 2 Markt für Elektrofilter im asiatisch-pazifischen Raum: Datentriangulation
ABBILDUNG 3 Markt für Elektrofilter im asiatisch-pazifischen Raum: DROC-ANALYSE
ABBILDUNG 4 Markt für Elektrofilter im asiatisch-pazifischen Raum: REGIONALE MARKTANALYSE IM VERGLEICH ZU DEN LÄNDERN
ABBILDUNG 5 Markt für Elektrofilter im asiatisch-pazifischen Raum: UNTERNEHMENSFORSCHUNGSANALYSE
ABBILDUNG 6 Markt für Elektrofilter im asiatisch-pazifischen Raum: DEMOGRAFISCHE INTERVIEWDATEN
ABBILDUNG 7 Markt für Elektrofilter im asiatisch-pazifischen Raum: DBMR-MARKTPOSITIONSRASTER
ABBILDUNG 8 Markt für Elektrofilter im asiatisch-pazifischen Raum: Analyse der Anbieteranteile
ABBILDUNG 9 Markt für Elektrofilter im asiatisch-pazifischen Raum: TYPENABDECKUNGSRASTER
ABBILDUNG 10 Marktsegmentierung für Elektrofilter im asiatisch-pazifischen Raum
ABBILDUNG 11 Es wird erwartet, dass die zunehmende Bautätigkeit weltweit den Markt für Elektrofilter im asiatisch-pazifischen Raum ankurbelt. DER PROGNOSEZEITRAUM VON 2021 BIS 2028
ABBILDUNG 12 Das Segment DRY ESP wird voraussichtlich den größten Anteil am Markt für Elektrofilter im asiatisch-pazifischen Raum 2021 und 2028 ausmachen
ABBILDUNG 13 TREIBER, EINSCHRÄNKUNGEN, CHANCEN und HERAUSFORDERUNGEN FÜR DEN ELEKTROSTATISCHEN FILTERMARKT IM ASIEN-PAZIFISCHEN RAUM
ABBILDUNG 14 ENERGIEBEDINGTE KOHLENDIOXID-EMISSIONEN AUS VERSCHIEDENEN INDUSTRIEBEREICHEN (in Prozent), 2020
ABBILDUNG 15: WICHTIGSTE KAPAZITÄTSBETEILIGTE IM ASIEN-PAZIFISCHEN RAUM, 2018
ABBILDUNG 16 Markt für Elektrofilter im asiatisch-pazifischen Raum, nach Typ, 2020
ABBILDUNG 17 Markt für Elektrofilter im asiatisch-pazifischen Raum, nach ANGEBOT, 2020
ABBILDUNG 18 Markt für Elektrofilter im asiatisch-pazifischen Raum, nach ANWENDUNG, 2020
ABBILDUNG 19 Markt für Elektrofilter im asiatisch-pazifischen Raum, nach ENDBENUTZER, 2020
ABBILDUNG 20 Markt für Elektrofilter im asiatisch-pazifischen Raum: ÜBERBLICK (2020)
ABBILDUNG 21 Markt für Elektrofilter im asiatisch-pazifischen Raum: nach Ländern (2020)
ABBILDUNG 22 Markt für Elektrofilter im asiatisch-pazifischen Raum: nach Ländern (2021 und 2028)
ABBILDUNG 23 Markt für Elektrofilter im asiatisch-pazifischen Raum: nach Ländern (2020 und 2028)
ABBILDUNG 24 Markt für Elektrofilter im asiatisch-pazifischen Raum: nach Typ (2021–2028)
ABBILDUNG 25 Markt für ELEKTROSTATISCHE FILTER im asiatisch-pazifischen Raum: Unternehmensanteil 2020 (%)
Forschungsmethodik
Die Datenerfassung und Basisjahresanalyse werden mithilfe von Datenerfassungsmodulen mit großen Stichprobengrößen durchgeführt. Die Phase umfasst das Erhalten von Marktinformationen oder verwandten Daten aus verschiedenen Quellen und Strategien. Sie umfasst die Prüfung und Planung aller aus der Vergangenheit im Voraus erfassten Daten. Sie umfasst auch die Prüfung von Informationsinkonsistenzen, die in verschiedenen Informationsquellen auftreten. Die Marktdaten werden mithilfe von marktstatistischen und kohärenten Modellen analysiert und geschätzt. Darüber hinaus sind Marktanteilsanalyse und Schlüsseltrendanalyse die wichtigsten Erfolgsfaktoren im Marktbericht. Um mehr zu erfahren, fordern Sie bitte einen Analystenanruf an oder geben Sie Ihre Anfrage ein.
Die wichtigste Forschungsmethodik, die vom DBMR-Forschungsteam verwendet wird, ist die Datentriangulation, die Data Mining, die Analyse der Auswirkungen von Datenvariablen auf den Markt und die primäre (Branchenexperten-)Validierung umfasst. Zu den Datenmodellen gehören ein Lieferantenpositionierungsraster, eine Marktzeitlinienanalyse, ein Marktüberblick und -leitfaden, ein Firmenpositionierungsraster, eine Patentanalyse, eine Preisanalyse, eine Firmenmarktanteilsanalyse, Messstandards, eine globale versus eine regionale und Lieferantenanteilsanalyse. Um mehr über die Forschungsmethodik zu erfahren, senden Sie eine Anfrage an unsere Branchenexperten.
Anpassung möglich
Data Bridge Market Research ist ein führendes Unternehmen in der fortgeschrittenen formativen Forschung. Wir sind stolz darauf, unseren bestehenden und neuen Kunden Daten und Analysen zu bieten, die zu ihren Zielen passen. Der Bericht kann angepasst werden, um Preistrendanalysen von Zielmarken, Marktverständnis für zusätzliche Länder (fordern Sie die Länderliste an), Daten zu klinischen Studienergebnissen, Literaturübersicht, Analysen des Marktes für aufgearbeitete Produkte und Produktbasis einzuschließen. Marktanalysen von Zielkonkurrenten können von technologiebasierten Analysen bis hin zu Marktportfoliostrategien analysiert werden. Wir können so viele Wettbewerber hinzufügen, wie Sie Daten in dem von Ihnen gewünschten Format und Datenstil benötigen. Unser Analystenteam kann Ihnen auch Daten in groben Excel-Rohdateien und Pivot-Tabellen (Fact Book) bereitstellen oder Sie bei der Erstellung von Präsentationen aus den im Bericht verfügbaren Datensätzen unterstützen.

