
Asia Pacific Electrostatic Precipitator Market
Market Size in USD Billion
 USD
2.29 Billion
USD
3.54 Billion
2024
2032
USD
2.29 Billion
USD
3.54 Billion
2024
2032
| 2025 - 2032 | |
| USD 2.29 Billion | |
| USD 3.54 Billion | |
| % | |
|
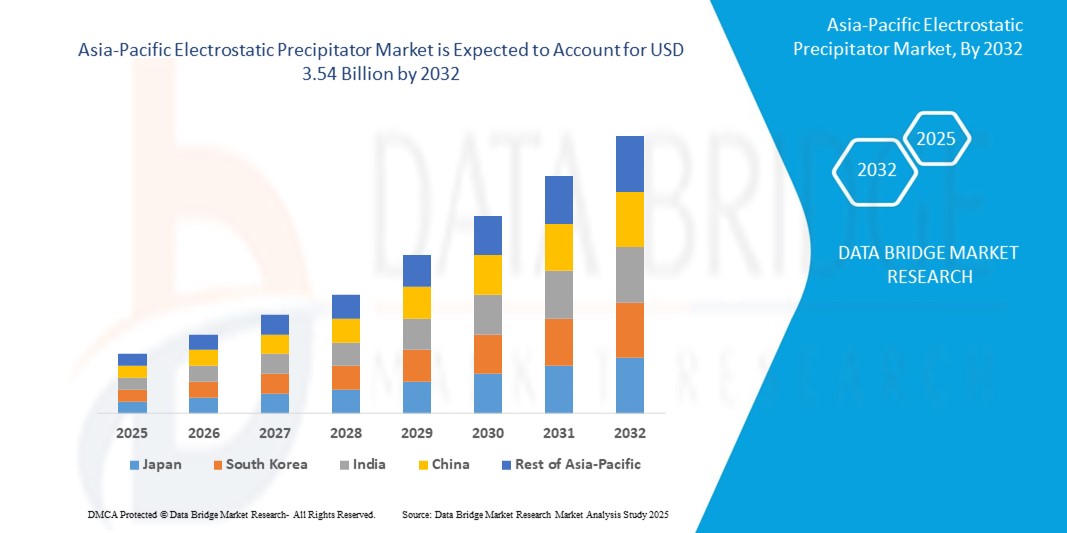
Asia-Pacific Electrostatic Precipitator Market Size
- The Asia-Pacific electrostatic precipitator market size was valued at USD 2.29 billion in 2024 and is expected to reach USD 3.54 billion by 2032, at a CAGR of 5.60% during the forecast period
- The market growth is largely fuelled by the tightening air pollution control regulations across major economies, the expansion of industrial infrastructure including power generation and cement manufacturing, and increased governmental focus on mitigating particulate emissions to improve public health and environmental quality across the region
- In addition, rising public awareness regarding the health impacts of air pollution and the growing adoption of advanced emission control technologies in emerging economies such as India, China, and Southeast Asia are significantly accelerating the market’s growth trajectory
Asia-Pacific Electrostatic Precipitator Market Analysis
- The Asia-Pacific electrostatic precipitator market is witnessing steady growth due to increasing demand for advanced air filtration in industrial sectors such as power generation and cement manufacturing
- Investments in modernizing pollution control systems across manufacturing units are driving consistent adoption of electrostatic precipitators in the region
- China accounted for the largest market revenue share in the Asia-Pacific electrostatic precipitator market in 2024, driven by the nation's large-scale industrial operations, growing energy demand, and strict air quality control policies
- Japan is expected to witness the highest compound annual growth rate (CAGR) in the Asia-Pacific electrostatic precipitator market due to its stringent environmental regulations, strong focus on clean technologies, and growing initiatives to modernize industrial facilities with energy-efficient and low-emission equipment
- The dry ESP segment dominated the market with the largest revenue share of 68.5% in 2024, driven by its widespread use in high-temperature industrial applications such as power plants, cement kilns, and steel mills. Dry ESPs are effective in removing fine particulates from flue gases without the use of water, which minimizes waste handling issues and reduces maintenance costs. The strong demand for efficient particulate control in coal-based energy production continues to support segment growth
Report Scope and Asia-Pacific Electrostatic Precipitator Market Segmentation
|
Attributes |
Asia-Pacific Electrostatic Precipitator Key Market Insights |
|
Segments Covered |
|
|
Countries Covered |
Asia-Pacific
|
|
Key Market Players |
|
|
Market Opportunities |
• Rising Use in Marine and Rail Sectors to Meet Emission Norms |
|
Value Added Data Infosets |
In addition to the insights on market scenarios such as market value, growth rate, segmentation, geographical coverage, and major players, the market reports curated by the Data Bridge Market Research also include in-depth expert analysis, geographically represented company-wise production and capacity, network layouts of distributors and partners, detailed and updated price trend analysis and deficit analysis of supply chain and demand. |
Asia-Pacific Electrostatic Precipitator Market Trends
“Growing Shift Toward Hybrid Electrostatic Precipitators in Industrial Applications”
- Hybrid electrostatic precipitators (ESPs), which integrate electrostatic and mechanical filtration methods, are increasingly being adopted for their ability to efficiently remove ultra-fine particles
- For instance, hybrid ESPs installed in Indian power plants have shown notable improvement in PM2.5 capture
- The demand for hybrid ESPs is surging in sectors such as cement and thermal power due to their large emission outputs. Major cement manufacturers in Southeast Asia have begun upgrading to hybrid units to comply with newer emission limits
- Hybrid systems offer more consistent particulate removal even when plant output fluctuates, making them ideal for facilities with variable operational loads
- Stricter air quality regulations in countries such as China and India are pushing industries to adopt advanced solutions such as hybrid ESPs to stay compliant
- Industries across the region are investing in retrofitting old ESPs with hybrid technologies to improve efficiency and meet evolving environmental standards
Asia-Pacific Electrostatic Precipitator Market Dynamics
Driver
“Intensifying Regulatory Pressure to Curb Industrial Air Pollution”
- The Asia-Pacific electrostatic precipitator market is primarily driven by escalating efforts to curb industrial air pollution in rapidly developing nations such as China, India, and Indonesia
- Regulatory frameworks such as China’s Blue Sky Protection Campaign and India’s National Clean Air Programme (NCAP) are mandating the installation of advanced emission control technologies, including ESPs, across high-polluting sectors
- Industries such as power generation, cement, metal processing, and chemicals are facing increasing pressure to upgrade their filtration systems to meet emission standards and avoid regulatory penalties
- The rising demand for systems capable of capturing ultra-fine particulates (PM2.5 and smaller) is accelerating the deployment of high-efficiency ESPs across both public and private facilities
- Environmental sustainability commitments and ESG objectives are prompting firms to invest in clean technologies, while domestic ESP manufacturers are expanding offerings to meet regional needs and reduce cost barriers
Restraint/Challenge
“High Capital and Maintenance Costs Hindering Adoption”
- The high capital cost of electrostatic precipitator (ESP) systems continues to present a key challenge in the Asia-Pacific market, particularly for cost-sensitive and small-to-mid-sized industries
- ESPs, especially advanced or hybrid models, require substantial investment in components such as high-voltage power units, discharge electrodes, and sophisticated control systems, which raises initial procurement costs
- SMEs in developing economies often struggle to justify these expenses despite environmental mandates, leading to resistance or delayed adoption
- Operational costs are further elevated due to the requirement for skilled labor, regular system maintenance, and replacement of critical parts such as electrodes, especially in high-dust applications such as steel or cement manufacturing
- In regions with unreliable electricity infrastructure, inconsistent power supply can impair ESP performance and lifespan, prompting some industries to opt for less expensive alternatives such as baghouse filters, which are easier to maintain but less efficient in particulate removal over time
Asia-Pacific Electrostatic Precipitator Market Scope
The Asia-Pacific electrostatic precipitator market is segmented on the basis of type, offering, application, and end user.
- By Type
On the basis of type, the Asia-Pacific electrostatic precipitator market is segmented into dry ESP and wet ESP. The dry ESP segment dominated the market with the largest revenue share of 68.5% in 2024, driven by its widespread use in high-temperature industrial applications such as power plants, cement kilns, and steel mills. Dry ESPs are effective in removing fine particulates from flue gases without the use of water, which minimizes waste handling issues and reduces maintenance costs. The strong demand for efficient particulate control in coal-based energy production continues to support segment growth.
The wet ESP segment is expected to witness the fastest growth rate from 2025 to 2032, fueled by its suitability for handling sticky or moist particles in industries such as waste incineration, metal refining, and chemical manufacturing. Wet ESPs provide superior performance in capturing submicron particles, acid mists, and fumes, thereby addressing strict emission regulations across the region.
- By Offering
On the basis of offering, the Asia-Pacific electrostatic precipitator market is segmented into hardware, software, and services. The hardware segment held the largest revenue share in 2024, supported by the continued deployment of electrostatic precipitator units in energy and industrial sectors. The growing need for replacing aging ESP infrastructure with advanced hardware solutions is further accelerating growth.
The services segment is expected to witness the fastest growth rate from 2025 to 2032, driven by the increasing demand for regular maintenance, retrofitting, and performance optimization to ensure compliance with emission standards and to extend equipment lifespan.
- By Application
On the basis of application, the Asia-Pacific electrostatic precipitator market is segmented into coal-fired generation, electric arc furnaces, gas turbines, solid-waste incinerators, industrial powers, and others. The coal-fired generation segment dominated in 2024, owing to the large number of operational thermal power plants across countries such as China and India. Electrostatic precipitators play a crucial role in reducing particulate emissions from these plants, aligning with regional pollution control mandates.
The solid-waste incinerators segment is expected to witness the fastest growth rate from 2025 to 2032, driven by increasing urbanization and the rising need for effective waste-to-energy solutions. As governments invest in cleaner incineration technologies, the demand for high-performance ESP systems is rising steadily.
- By End User
On the basis of end user, the Asia-Pacific electrostatic precipitator market is segmented into power generation, metal processing, cement, manufacturing, chemical, petrochemical, marine, and others. The power generation segment held the largest market share in 2024 due to its reliance on ESPs for reducing particulate emissions in coal-based energy production facilities. Stringent regulatory frameworks regarding emissions are encouraging utilities to upgrade or install efficient ESP systems.
The chemical segment is expected to witness the fastest growth rate from 2025 to 2032, supported by increased emphasis on cleaner production methods and pollution control. Chemical plants are adopting ESPs to control emissions of fine particulates, acid mists, and process vapors, aligning with the region’s evolving environmental policies.
Asia-Pacific Electrostatic Precipitator Market Regional Analysis
- China accounted for the largest market revenue share in the Asia-Pacific electrostatic precipitator market in 2024, driven by the nation's large-scale industrial operations, growing energy demand, and strict air quality control policies
- The Chinese government’s aggressive push toward reducing industrial emissions under its clean air initiatives is fueling widespread deployment of electrostatic precipitators across cement, metal, and power generation sectors
- The presence of major domestic manufacturers and ongoing infrastructure development projects further amplify demand. In addition, rising awareness about health impacts of air pollution is encouraging faster adoption across both public and private sectors
Japan Electrostatic Precipitator Market Insight
The Japan electrostatic precipitator market is expected to witness the fastest growth rate from 2025 to 2032, due to the country’s strong environmental compliance standards and focus on energy-efficient and clean industrial practices. As a technology-driven nation, Japan is emphasizing modernization of industrial infrastructure with advanced emission control systems. The country’s shift towards eco-conscious production, especially in the power generation and manufacturing sectors, supports market expansion. Moreover, government-backed initiatives for reducing particulate emissions and investments in retrofitting existing power plants are positively impacting the adoption of electrostatic precipitators in the Japanese market.
Asia-Pacific Electrostatic Precipitator Market Share
The Asia-Pacific Electrostatic Precipitator industry is primarily led by well-established companies, including:
- Thermax Limited (India)
- Sumitomo Heavy Industries, Ltd (Japan)
- Fujian Longking Co., Ltd. (China)
- Mitsubishi Power, Ltd. (Japan)
- KC Cottrell (South Korea)
- KLEAN (South Korea)
- Bharat Heavy Electricals Limited (India)
- Pennar Industries Limited (India)
SKU-

- Interactive Data Analysis Dashboard
- Company Analysis Dashboard for high growth potential opportunities
- Research Analyst Access for customization & queries
- Competitor Analysis with Interactive dashboard
- Latest News, Updates & Trend analysis
- Harness the Power of Benchmark Analysis for Comprehensive Competitor Tracking
Table of Content
- introduction
- OBJECTIVES OF THE STUDY
- MARKET DEFINITION
- OVERVIEW OF Asia-Pacific electrostatic precipitator market
- Currency and Pricing
- LIMITATIONS
- MARKETS COVERED
- MARKET SEGMENTATION
- MARKETS COVERED
- geographicAL scope
- years considered for the study
- DBMR TRIPOD DATA VALIDATION MODEL
- primary interviews with key opinion leaders
- DBMR MARKET POSITION GRID
- vendor share analysis
- MARKET type COVERAGE GRID
- Multivariate Modeling
- type timeline curve
- secondary sourcEs
- assumptions
- EXECUTIVE SUMMARY
- premium insights
- market overview
- DRIVERS
- Increasing Construction activities across the globe
- TECHNOLOGICAL ADVANCEMENTS IN EMISSION CONTROL SOLUTIONS
- INCREASING ELECTRICITY DEMAND ACROSS EMERGING NATIONS ON ACCOUNT OF RAPID URBANIZATION
- RESTRAINTS
- Stringent government regulations
- HIGH INSTALLATION COST OF ESP
- OPPORTUNITIES
- STRATEGIC ALLIANCES And PARTNERSHIPS BETWEEN ORGANIZATIONS
- RISE IN INITIATIVES OF POLLUTION CONTROL PROGRAMS BY GOVERNMENT
- EXTENSIVE R&D INVESTMENT BY THE GOVERNMENT
- CHALLENGES
- LACK OF AWARENESS ABOUT THE EMISSION CONTROL SYSTEM
- Operational challenges and Malfunction of the device
- unfavorable economic conditions and the advent of alternate energy sources
- IMPACT ANALYSIS OF COVID-19 ON THE MARKET
- AFTERMATH OF ELECTROSTATIC PRECIPITATOR MARKET
- OPPORTUNITIES FOR THE MARKET AFTER COVID-19 PANDEMIC
- IMPACT ON SUPPLY, DEMAND, AND PRICE
- CONCLUSION
- ASIA-PACIFIC ELECTROSTATIC PRECIPITATOR MARKET, BY TYPE
- overview
- DRY ESP
- wet esp
- ASIA-PACIFIC ELECTROSTATIC PRECIPITATOR MARKET, BY OFFERING
- overview
- HARDWARE & SOFTWARE
- DISCHARGE ELECTRODES
- HIGH VOLTAGE ELECTRICAL SYSTEMS
- COLLECTION ELECTRODES
- RAPPERS
- HoPPERS
- SHELL
- Others
- SERVICES
- ASIA-PACIFIC ELECTROSTATIC PRECIPITATOR MARKET, BY APPLICATION
- overview
- COAL FIRED GENERATION
- Electric Arc Furnaces
- GAS TURBINES
- INDUSTRIAL POWER
- Solid-Waste Incinerators
- OTHERS
- ASIA-PACIFIC ELECTROSTATIC PRECIPITATOR MARKET, BY END USER
- overview
- POWER GENERATION
- BY Type
- COAL POWER PLANT
- PETROLEUM REFINERIES AND POWER PLANTS
- BY ESP Type
- DRY ESP
- WET ESP
- METAL PROCESSING
- BY Type
- IRON & STEEL MANUFACTURING
- NONFERROUS METAL PRODUCTION AND PROCESSING
- FOUNDRIES
- ALUMINIUM SMELTING
- BY ESP Type
- DRY ESP
- WET ESP
- CEMENT
- BY ESP Type
- DRY ESP
- WET ESP
- chemical & petrochemical
- BY Type
- BASIC CHEMICAL MANUFACTURES
- SPECIALITY CHEMICAL MANUFACTURERS
- CONSUMER CHEMICAL MANUFACTURERS
- BY ESP Type
- DRY ESP
- WET ESP
- MANUFACTURING
- BY ESP Type
- DRY ESP
- WET ESP
- MARINE
- BY ESP Type
- DRY ESP
- WET ESP
- OTHERS
- ASIA-PACIFIC electrostatic precipitator market, BY Country
- China
- india
- Japan
- South Korea
- INDONESIA
- Australia
- Thailand
- Malaysia
- Philippines
- Singapore
- Rest of Asia-Pacific
- Asia-pacific ELECTROSTATIC PRECIPITATOR market: COMPANY landscape
- company share analysis: Asia-pacific
- swot analysis
- company profile
- FUJIAN LONGKING CO., LTD.
- COMPANY SNAPSHOT
- BUSINESS PORTFOLIO
- RECENT DEVELOPMENT
- MITSUBISHI POWER, LTD. (A SUBSIDIARY OF MITSUBISHI HEAVY INDUSTRIES, LTD.)
- COMPANY SNAPSHOT
- REVENUE ANALYSIS
- PRODUCT PORTFOLIO
- RECENT DEVELOPMENTS
- BHARAT HEAVY ELECTRICALS LIMITED
- COMPANY SNAPSHOT
- REVENUE ANALYSIS
- PRODUCT PORTFOLIO
- RECENT DEVELOPMENTS
- SUMITOMO HEAVY INDUSTRIES, LTD.
- COMPANY SNAPSHOT
- REVENUE ANALYSIS
- PRODUCT PORTFOLIO
- RECENT DEVELOPMENTS
- GENERAL ELECTRIC
- COMPANY SNAPSHOT
- REVENUE ANALYSIS
- PRODUCT PORTFOLIO
- RECENT DEVELOPMENT
- BABCOCK & WILCOX ENTERPRISES, INC.
- COMPANY SNAPSHOT
- REVENUE ANALYSIS
- PRODUCT PORTFOLIO
- RECENT DEVELOPMENTS
- FLSMIDTH
- COMPANY SNAPSHOT
- REVENUE ANALYSIS
- PRODUCT PORTFOLIO
- RECENT DEVELOPMENTS
- GEA GROUP AKTIENGESELLSCHAFT
- COMPANY SNAPSHOT
- REVENUE ANALYSIS
- PRODUCT PORTFOLIO
- RECENT DEVELOPMENT
- JOHN WOOD GROUP PLC
- COMPANY SNAPSHOT
- REVENUE ANALYSIS
- PRODUCT PORTFOLIO
- RECENT DEVELOPMENT
- KC CORTTREL
- COMPANY SNAPSHOT
- REVENUE ANALYSIS
- PRODUCT PORTFOLIO
- RECENT DEVELOPMENT
- KLEAN
- COMPANY SNAPSHOT
- PRDOUCT PORTFOLIO
- RECENT DEVELOPMENT
- PENNAR INDUSTRIES LIMITED
- COMPANY SNAPSHOT
- REVENUE ANALYSIS
- PRODUCT PORTFOLIO
- RECENT DEVELOPMENT
- SIEMENS ENERGY
- COMPANY SNAPSHOT
- REVENUE ANALYSIS
- PRODUCT PORTFOLIO
- RECENT DEVELOPMENTS
- S.A HAMON
- COMPANY SNAPSHOT
- REVENUE ANALYSIS
- PRODUCT PORTFOLIO
- RECENT DEVELOPMENTS
- THERMAX LIMITED
- COMPANY SNAPSHOT
- REVENUE ANALYSIS
- PRODUCT PORTFOLIO
- RECENT DEVELOPMENT
- questionnaire
- related reports
List of Table
TABLE 1 EMISSION STANDARDS FOR COAL-FIRED POWER PLANTS
TABLE 2 Average Cost of The Electrostatic Precipitator In A Power Plant
TABLE 3 Asia-Pacific Electrostatic Precipitator Market, By Type, 2019-2028 (USD THOUSAND)
TABLE 4 ASIA-PACIFIC ELECTROSTATIC PRECIPITATOR MARKET, BY OFFERING, 2019-2028 (USD THOUSAND)
TABLE 5 Asia-Pacific Hardware & Software in Electrostatic Precipitator Market, By Type, 2019-2028 (USD THOUSAND)
TABLE 6 ASIA-PACIFIC ELECTROSTATIC PRECIPITATOR MARKET, BY APPLICATION, 2019-2028 (USD THOUSAND)
TABLE 7 ASIA-PACIFIC ELECTROSTATIC PRECIPITATOR MARKET, BY END USER, 2019-2028 (USD THOUSAND)
TABLE 8 Asia-Pacific Power Generation in Electrostatic Precipitator Market, By Type, 2019-2028 (USD THOUSAND)
TABLE 9 Asia-Pacific Power Generation in Electrostatic Precipitator Market, By ESP Type, 2019-2028 (USD THOUSAND)
TABLE 10 Asia-Pacific METAL PROCESSING in Electrostatic Precipitator Market, By Type, 2019-2028 (USD THOUSAND)
TABLE 11 Asia-Pacific METAL PROCESSING in Electrostatic Precipitator Market, By ESP Type, 2019-2028 (USD THOUSAND)
TABLE 12 Asia-Pacific cement in Electrostatic Precipitator Market, By ESP Type, 2019-2028 (USD THOUSAND)
TABLE 13 Asia-Pacific CHEMICAL & PETROCHEMICAL in Electrostatic Precipitator Market, By Type, 2019-2028 (USD THOUSAND)
TABLE 14 Asia-Pacific CHEMICAL & PETROCHEMICAL in Electrostatic Precipitator Market, By ESP Type, 2019-2028 (USD THOUSAND)
TABLE 15 Asia-Pacific MANUFACTURING in Electrostatic Precipitator Market, By ESP Type, 2019-2028 (USD THOUSAND)
TABLE 16 Asia-Pacific Marine in Electrostatic Precipitator Market, By ESP Type, 2019-2028 (USD THOUSAND)
TABLE 17 Asia-Pacific Electrostatic precipitator Market, By Country, 2019-2028 (USD Thousand)
TABLE 18 CHINA Electrostatic precipitator Market, BY Type, 2019-2028 (USD Thousand)
TABLE 19 CHINA Electrostatic precipitator Market, By Offering, 2019-2028 (USD Thousand)
TABLE 20 China Hardware & Software in Electrostatic Precipitator Market, By Type, 2019-2028 (USD Thousand)
TABLE 21 China Electrostatic Precipitator Market, By Application, 2019-2028 (USD Thousand)
TABLE 22 China Electrostatic Precipitator Market, By End User, 2019-2028 (USD Thousand)
TABLE 23 China Power Generation in Electrostatic Precipitator Market, By Type, 2019-2028 (USD Thousand)
TABLE 24 China Power Generation in Electrostatic Precipitator Market, By ESP Type, 2019-2028 (USD Thousand)
TABLE 25 China Metal Processing in Electrostatic Precipitator Market, By Type, 2019-2028 (USD Thousand)
TABLE 26 China Metal Processing in Electrostatic Precipitator Market, By ESP Type, 2019-2028 (USD Thousand)
TABLE 27 China Cement in Electrostatic Precipitator Market, By ESP Type, 2019-2028 (USD Thousand)
TABLE 28 China Chemical and Petrochemical in Electrostatic Precipitator Market, By Type, 2019-2028 (USD Thousand)
TABLE 29 China Chemical and Petrochemical in Electrostatic Precipitator Market, By ESP Type, 2019-2028 (USD Thousand)
TABLE 30 China Manufacturing in Electrostatic Precipitator Market, By ESP Type, 2019-2028 (USD Thousand)
TABLE 31 China Marine in Electrostatic Precipitator Market, By ESP Type, 2019-2028 (USD Thousand)
TABLE 32 India Electrostatic precipitator Market, BY Type, 2019-2028 (USD Thousand)
TABLE 33 India Electrostatic precipitator Market, By Offering, 2019-2028 (USD Thousand)
TABLE 34 India Hardware & Software in Electrostatic Precipitator Market, By Type, 2019-2028 (USD Thousand)
TABLE 35 India Electrostatic Precipitator Market, By Application, 2019-2028 (USD Thousand)
TABLE 36 India Electrostatic Precipitator Market, By End User, 2019-2028 (USD Thousand)
TABLE 37 India Power Generation in Electrostatic Precipitator Market, By Type, 2019-2028 (USD Thousand)
TABLE 38 India Power Generation in Electrostatic Precipitator Market, By ESP Type, 2019-2028 (USD Thousand)
TABLE 39 India Metal Processing in Electrostatic Precipitator Market, By Type, 2019-2028 (USD Thousand)
TABLE 40 India Metal Processing in Electrostatic Precipitator Market, By ESP Type, 2019-2028 (USD Thousand)
TABLE 41 India Cement in Electrostatic Precipitator Market, By ESP Type, 2019-2028 (USD Thousand)
TABLE 42 India Chemical and Petrochemical in Electrostatic Precipitator Market, By Type, 2019-2028 (USD Thousand)
TABLE 43 India Chemical and Petrochemical in Electrostatic Precipitator Market, By ESP Type, 2019-2028 (USD Thousand)
TABLE 44 India Manufacturing in Electrostatic Precipitator Market, By ESP Type, 2019-2028 (USD Thousand)
TABLE 45 India Marine in Electrostatic Precipitator Market, By ESP Type, 2019-2028 (USD Thousand)
TABLE 46 Japan Electrostatic precipitator Market, BY Type, 2019-2028 (USD Thousand)
TABLE 47 JAPAN Electrostatic precipitator Market, By Offering, 2019-2028 (USD Thousand)
TABLE 48 Japan Hardware & Software in Electrostatic Precipitator Market, By Type, 2019-2028 (USD Thousand)
TABLE 49 Japan Electrostatic Precipitator Market, By Application, 2019-2028 (USD Thousand)
TABLE 50 Japan Electrostatic Precipitator Market, By End User, 2019-2028 (USD Thousand)
TABLE 51 Japan Power Generation in Electrostatic Precipitator Market, By Type, 2019-2028 (USD Thousand)
TABLE 52 Japan Power Generation in Electrostatic Precipitator Market, By ESP Type, 2019-2028 (USD Thousand)
TABLE 53 Japan Metal Processing in Electrostatic Precipitator Market, By Type, 2019-2028 (USD Thousand)
TABLE 54 Japan Metal Processing in Electrostatic Precipitator Market, By ESP Type, 2019-2028 (USD Thousand)
TABLE 55 Japan Cement in Electrostatic Precipitator Market, By ESP Type, 2019-2028 (USD Thousand)
TABLE 56 Japan Chemical and Petrochemical in Electrostatic Precipitator Market, By Type, 2019-2028 (USD Thousand)
TABLE 57 Japan Chemical and Petrochemical in Electrostatic Precipitator Market, By ESP Type, 2019-2028 (USD Thousand)
TABLE 58 Japan Manufacturing in Electrostatic Precipitator Market, By ESP Type, 2019-2028 (USD Thousand)
TABLE 59 Japan Marine in Electrostatic Precipitator Market, By ESP Type, 2019-2028 (USD Thousand)
TABLE 60 SOUTH KOREA Electrostatic precipitator Market, BY Type, 2019-2028 (USD Thousand)
TABLE 61 SOUTH KOREA Electrostatic precipitator Market, By Offering, 2019-2028 (USD Thousand)
TABLE 62 South Korea Hardware & Software in Electrostatic Precipitator Market, By Type, 2019-2028 (USD Thousand)
TABLE 63 South Korea Electrostatic Precipitator Market, By Application, 2019-2028 (USD Thousand)
TABLE 64 South Korea Electrostatic Precipitator Market, By End User, 2019-2028 (USD Thousand)
TABLE 65 South Korea Power Generation in Electrostatic Precipitator Market, By Type, 2019-2028 (USD Thousand)
TABLE 66 South Korea Power Generation in Electrostatic Precipitator Market, By ESP Type, 2019-2028 (USD Thousand)
TABLE 67 South Korea Metal Processing in Electrostatic Precipitator Market, By Type, 2019-2028 (USD Thousand)
TABLE 68 South Korea Metal Processing in Electrostatic Precipitator Market, By ESP Type, 2019-2028 (USD Thousand)
TABLE 69 South Korea Cement in Electrostatic Precipitator Market, By ESP Type, 2019-2028 (USD Thousand)
TABLE 70 South Korea Chemical and Petrochemical in Electrostatic Precipitator Market, By Type, 2019-2028 (USD Thousand)
TABLE 71 South Korea Chemical and Petrochemical in Electrostatic Precipitator Market, By ESP Type, 2019-2028 (USD Thousand)
TABLE 72 South Korea Manufacturing in Electrostatic Precipitator Market, By ESP Type, 2019-2028 (USD Thousand)
TABLE 73 South Korea Marine in Electrostatic Precipitator Market, By ESP Type, 2019-2028 (USD Thousand)
TABLE 74 INDONESIA Electrostatic precipitator Market, BY Type, 2019-2028 (USD Thousand)
TABLE 75 INDONESIA Electrostatic precipitator Market, By Offering, 2019-2028 (USD Thousand)
TABLE 76 Indonesia Hardware & Software in Electrostatic Precipitator Market, By Type, 2019-2028 (USD Thousand)
TABLE 77 Indonesia Electrostatic Precipitator Market, By Application, 2019-2028 (USD Thousand)
TABLE 78 Indonesia Electrostatic Precipitator Market, By End User, 2019-2028 (USD Thousand)
TABLE 79 Indonesia Power Generation in Electrostatic Precipitator Market, By Type, 2019-2028 (USD Thousand)
TABLE 80 Indonesia Power Generation in Electrostatic Precipitator Market, By ESP Type, 2019-2028 (USD Thousand)
TABLE 81 Indonesia Metal Processing in Electrostatic Precipitator Market, By Type, 2019-2028 (USD Thousand)
TABLE 82 Indonesia Metal Processing in Electrostatic Precipitator Market, By ESP Type, 2019-2028 (USD Thousand)
TABLE 83 Indonesia Cement in Electrostatic Precipitator Market, By ESP Type, 2019-2028 (USD Thousand)
TABLE 84 Indonesia Chemical and Petrochemical in Electrostatic Precipitator Market, By Type, 2019-2028 (USD Thousand)
TABLE 85 Indonesia Chemical and Petrochemical in Electrostatic Precipitator Market, By ESP Type, 2019-2028 (USD Thousand)
TABLE 86 Indonesia Manufacturing in Electrostatic Precipitator Market, By ESP Type, 2019-2028 (USD Thousand)
TABLE 87 Indonesia Marine in Electrostatic Precipitator Market, By ESP Type, 2019-2028 (USD Thousand)
TABLE 88 AUSTRALIA Electrostatic precipitator Market, BY Type, 2019-2028 (USD Thousand)
TABLE 89 AUSTRALIA Electrostatic precipitator Market, By Offering, 2019-2028 (USD Thousand)
TABLE 90 Australia Hardware & Software in Electrostatic Precipitator Market, By Type, 2019-2028 (USD Thousand)
TABLE 91 Australia Electrostatic Precipitator Market, By Application, 2019-2028 (USD Thousand)
TABLE 92 Australia Electrostatic Precipitator Market, By End User, 2019-2028 (USD Thousand)
TABLE 93 Australia Power Generation in Electrostatic Precipitator Market, By Type, 2019-2028 (USD Thousand)
TABLE 94 Australia Power Generation in Electrostatic Precipitator Market, By ESP Type, 2019-2028 (USD Thousand)
TABLE 95 Australia Metal Processing in Electrostatic Precipitator Market, By Type, 2019-2028 (USD Thousand)
TABLE 96 Australia Metal Processing in Electrostatic Precipitator Market, By ESP Type, 2019-2028 (USD Thousand)
TABLE 97 Australia Cement in Electrostatic Precipitator Market, By ESP Type, 2019-2028 (USD Thousand)
TABLE 98 Australia Chemical and Petrochemical in Electrostatic Precipitator Market, By Type, 2019-2028 (USD Thousand)
TABLE 99 Australia Chemical and Petrochemical in Electrostatic Precipitator Market, By ESP Type, 2019-2028 (USD Thousand)
TABLE 100 Australia Manufacturing in Electrostatic Precipitator Market, By ESP Type, 2019-2028 (USD Thousand)
TABLE 101 Australia Marine in Electrostatic Precipitator Market, By ESP Type, 2019-2028 (USD Thousand)
TABLE 102 Thailand Electrostatic precipitator Market, BY Type, 2019-2028 (USD Thousand)
TABLE 103 THAILAND Electrostatic precipitator Market, By Offering, 2019-2028 (USD Thousand)
TABLE 104 Thailand Hardware & Software in Electrostatic Precipitator Market, By Type, 2019-2028 (USD Thousand)
TABLE 105 Thailand Electrostatic Precipitator Market, By Application, 2019-2028 (USD Thousand)
TABLE 106 Thailand Electrostatic Precipitator Market, By End User, 2019-2028 (USD Thousand)
TABLE 107 Thailand Power Generation in Electrostatic Precipitator Market, By Type, 2019-2028 (USD Thousand)
TABLE 108 Thailand Power Generation in Electrostatic Precipitator Market, By ESP Type, 2019-2028 (USD Thousand)
TABLE 109 Thailand Metal Processing in Electrostatic Precipitator Market, By Type, 2019-2028 (USD Thousand)
TABLE 110 Thailand Metal Processing in Electrostatic Precipitator Market, By ESP Type, 2019-2028 (USD Thousand)
TABLE 111 Thailand Cement in Electrostatic Precipitator Market, By ESP Type, 2019-2028 (USD Thousand)
TABLE 112 Thailand Chemical and Petrochemical in Electrostatic Precipitator Market, By Type, 2019-2028 (USD Thousand)
TABLE 113 Thailand Chemical and Petrochemical in Electrostatic Precipitator Market, By ESP Type, 2019-2028 (USD Thousand)
TABLE 114 Thailand Manufacturing in Electrostatic Precipitator Market, By ESP Type, 2019-2028 (USD Thousand)
TABLE 115 Thailand Marine in Electrostatic Precipitator Market, By ESP Type, 2019-2028 (USD Thousand)
TABLE 116 Malaysia Electrostatic precipitator Market, BY Type, 2019-2028 (USD Thousand)
TABLE 117 MALAYSIA Electrostatic precipitator Market, By Offering, 2019-2028 (USD Thousand)
TABLE 118 Malaysia Hardware & Software in Electrostatic Precipitator Market, By Type, 2019-2028 (USD Thousand)
TABLE 119 Malaysia Electrostatic Precipitator Market, By Application, 2019-2028 (USD Thousand)
TABLE 120 Malaysia Electrostatic Precipitator Market, By End User, 2019-2028 (USD Thousand)
TABLE 121 Malaysia Power Generation in Electrostatic Precipitator Market, By Type, 2019-2028 (USD Thousand)
TABLE 122 Malaysia Power Generation in Electrostatic Precipitator Market, By ESP Type, 2019-2028 (USD Thousand)
TABLE 123 Malaysia Metal Processing in Electrostatic Precipitator Market, By Type, 2019-2028 (USD Thousand)
TABLE 124 Malaysia Metal Processing in Electrostatic Precipitator Market, By ESP Type, 2019-2028 (USD Thousand)
TABLE 125 Malaysia Cement in Electrostatic Precipitator Market, By ESP Type, 2019-2028 (USD Thousand)
TABLE 126 Malaysia Chemical and Petrochemical in Electrostatic Precipitator Market, By Type, 2019-2028 (USD Thousand)
TABLE 127 Malaysia Chemical and Petrochemical in Electrostatic Precipitator Market, By ESP Type, 2019-2028 (USD Thousand)
TABLE 128 Malaysia Manufacturing in Electrostatic Precipitator Market, By ESP Type, 2019-2028 (USD Thousand)
TABLE 129 Malaysia Marine in Electrostatic Precipitator Market, By ESP Type, 2019-2028 (USD Thousand)
TABLE 130 Philippines Electrostatic precipitator Market, BY Type, 2019-2028 (USD Thousand)
TABLE 131 PHILIPPINES Electrostatic precipitator Market, By Offering, 2019-2028 (USD Thousand)
TABLE 132 Philippines Hardware & Software in Electrostatic Precipitator Market, By Type, 2019-2028 (USD Thousand)
TABLE 133 Philippines Electrostatic Precipitator Market, By Application, 2019-2028 (USD Thousand)
TABLE 134 Philippines Electrostatic Precipitator Market, By End User, 2019-2028 (USD Thousand)
TABLE 135 Philippines Power Generation in Electrostatic Precipitator Market, By Type, 2019-2028 (USD Thousand)
TABLE 136 Philippines Power Generation in Electrostatic Precipitator Market, By ESP Type, 2019-2028 (USD Thousand)
TABLE 137 Philippines Metal Processing in Electrostatic Precipitator Market, By Type, 2019-2028 (USD Thousand)
TABLE 138 Philippines Metal Processing in Electrostatic Precipitator Market, By ESP Type, 2019-2028 (USD Thousand)
TABLE 139 Philippines Cement in Electrostatic Precipitator Market, By ESP Type, 2019-2028 (USD Thousand)
TABLE 140 Philippines Chemical and Petrochemical in Electrostatic Precipitator Market, By Type, 2019-2028 (USD Thousand)
TABLE 141 Philippines Chemical and Petrochemical in Electrostatic Precipitator Market, By ESP Type, 2019-2028 (USD Thousand)
TABLE 142 Philippines Manufacturing in Electrostatic Precipitator Market, By ESP Type, 2019-2028 (USD Thousand)
TABLE 143 Philippines Marine in Electrostatic Precipitator Market, By ESP Type, 2019-2028 (USD Thousand)
TABLE 144 Singapore Electrostatic precipitator Market, BY Type, 2019-2028 (USD Thousand)
TABLE 145 SINGAPORE Electrostatic precipitator Market, By Offering, 2019-2028 (USD Thousand)
TABLE 146 Singapore Hardware & Software in Electrostatic Precipitator Market, By Type, 2019-2028 (USD Thousand)
TABLE 147 Singapore Electrostatic Precipitator Market, By Application, 2019-2028 (USD Thousand)
TABLE 148 Singapore Electrostatic Precipitator Market, By End User, 2019-2028 (USD Thousand)
TABLE 149 Singapore Power Generation in Electrostatic Precipitator Market, By Type, 2019-2028 (USD Thousand)
TABLE 150 Singapore Power Generation in Electrostatic Precipitator Market, By ESP Type, 2019-2028 (USD Thousand)
TABLE 151 Singapore Metal Processing in Electrostatic Precipitator Market, By Type, 2019-2028 (USD Thousand)
TABLE 152 Singapore Metal Processing in Electrostatic Precipitator Market, By ESP Type, 2019-2028 (USD Thousand)
TABLE 153 Singapore Cement in Electrostatic Precipitator Market, By ESP Type, 2019-2028 (USD Thousand)
TABLE 154 Singapore Chemical and Petrochemical in Electrostatic Precipitator Market, By Type, 2019-2028 (USD Thousand)
TABLE 155 Singapore Chemical and Petrochemical in Electrostatic Precipitator Market, By ESP Type, 2019-2028 (USD Thousand)
TABLE 156 Singapore Manufacturing in Electrostatic Precipitator Market, By ESP Type, 2019-2028 (USD Thousand)
TABLE 157 Singapore Marine in Electrostatic Precipitator Market, By ESP Type, 2019-2028 (USD Thousand)
TABLE 158 Rest of Asia-Pacific Electrostatic precipitator Market, BY Type, 2019-2028 (USD Thousand)
List of Figure
FIGURE 1 ASIA-PACIFIC ELECTROSTATIC PRECIPItatoR MARKET segmentation
FIGURE 2 Asia-Pacific electrostatic precipitator market: data triangulation
FIGURE 3 Asia-Pacific electrostatic precipitator market: DROC ANALYSIS
FIGURE 4 Asia-Pacific electrostatic precipitator market: REGIONAL vs Country MARKET ANALYSIS
FIGURE 5 Asia-Pacific electrostatic precipitator market: COMPANY RESEARCH ANALYSIS
FIGURE 6 Asia-Pacific electrostatic precipitator market: INTERVIEW DEMOGRAPHICS
FIGURE 7 Asia-Pacific electrostatic precipitator market: DBMR MARKET POSITION GRID
FIGURE 8 Asia-Pacific electrostatic precipitator market: vendor share analysis
FIGURE 9 Asia-Pacific electrostatic precipitator market: TYPE COVERAGE GRID
FIGURE 10 Asia-Pacific electrostatic precipitator market segmentation
FIGURE 11 Increasing construction activities across the globe is EXPECTED TO DRIVE THE Asia-Pacific electrostatic precipitator market THE FORECAST PERIOD OF 2021 TO 2028
FIGURE 12 DRY ESP segment is expected to account for the largest share of THE Asia-Pacific electrostatic precipitator market 2021 & 2028
FIGURE 13 DRIVERS, RESTRAINTs, OPPORTUNITIES, and CHALLENGES FOR ASIA-PACIFIC ELECTROSTATIC PRECIPITATOR MARKET
FIGURE 14 ENERGY-RELATED CARBON DIOXIDE EMISSIONS FROM VARIOUS INDUSTRY (in percentage), 2020
FIGURE 15 KEY COAL CAPACITY CONTRIBUTORS IN ASIA-PACIFIC REGION, 2018
FIGURE 16 Asia-Pacific Electrostatic Precipitator Market, By Type, 2020
FIGURE 17 Asia-Pacific Electrostatic Precipitator Market, By OFFERING, 2020
FIGURE 18 Asia-Pacific Electrostatic Precipitator Market, By APPLICATION, 2020
FIGURE 19 Asia-Pacific Electrostatic Precipitator Market, By END-USER, 2020
FIGURE 20 ASIA-PACIFIC Electrostatic precipitator Market: SNAPSHOT (2020)
FIGURE 21 ASIA-PACIFIC Electrostatic precipitator Market: by Country (2020)
FIGURE 22 ASIA-PACIFIC Electrostatic precipitator Market: by Country (2021 & 2028)
FIGURE 23 ASIA-PACIFIC Electrostatic precipitator Market: by Country (2020 & 2028)
FIGURE 24 ASIA-PACIFIC Electrostatic precipitator Market: by Type (2021-2028)
FIGURE 25 Asia-Pacific ELECTROSTATIC PRECIPITATOR market: company share 2020 (%)
Asia Pacific Electrostatic Precipitator Market, Supply Chain Analysis and Ecosystem Framework
To support market growth and help clients navigate the impact of geopolitical shifts, DBMR has integrated in-depth supply chain analysis into its Asia Pacific Electrostatic Precipitator Market research reports. This addition empowers clients to respond effectively to global changes affecting their industries. The supply chain analysis section includes detailed insights such as Asia Pacific Electrostatic Precipitator Market consumption and production by country, price trend analysis, the impact of tariffs and geopolitical developments, and import and export trends by country and HSN code. It also highlights major suppliers with data on production capacity and company profiles, as well as key importers and exporters. In addition to research, DBMR offers specialized supply chain consulting services backed by over a decade of experience, providing solutions like supplier discovery, supplier risk assessment, price trend analysis, impact evaluation of inflation and trade route changes, and comprehensive market trend analysis.
Data collection and base year analysis are done using data collection modules with large sample sizes. The stage includes obtaining market information or related data through various sources and strategies. It includes examining and planning all the data acquired from the past in advance. It likewise envelops the examination of information inconsistencies seen across different information sources. The market data is analysed and estimated using market statistical and coherent models. Also, market share analysis and key trend analysis are the major success factors in the market report. To know more, please request an analyst call or drop down your inquiry.
The key research methodology used by DBMR research team is data triangulation which involves data mining, analysis of the impact of data variables on the market and primary (industry expert) validation. Data models include Vendor Positioning Grid, Market Time Line Analysis, Market Overview and Guide, Company Positioning Grid, Patent Analysis, Pricing Analysis, Company Market Share Analysis, Standards of Measurement, Global versus Regional and Vendor Share Analysis. To know more about the research methodology, drop in an inquiry to speak to our industry experts.
Data Bridge Market Research is a leader in advanced formative research. We take pride in servicing our existing and new customers with data and analysis that match and suits their goal. The report can be customized to include price trend analysis of target brands understanding the market for additional countries (ask for the list of countries), clinical trial results data, literature review, refurbished market and product base analysis. Market analysis of target competitors can be analyzed from technology-based analysis to market portfolio strategies. We can add as many competitors that you require data about in the format and data style you are looking for. Our team of analysts can also provide you data in crude raw excel files pivot tables (Fact book) or can assist you in creating presentations from the data sets available in the report.


