Europe Shower Enclosure And Cubicles Market
Marktgröße in Milliarden USD
CAGR :
% 
 USD
175.54 Million
USD
233.08 Million
2024
2032
USD
175.54 Million
USD
233.08 Million
2024
2032
| 2025 –2032 | |
| USD 175.54 Million | |
| USD 233.08 Million | |
| % | |
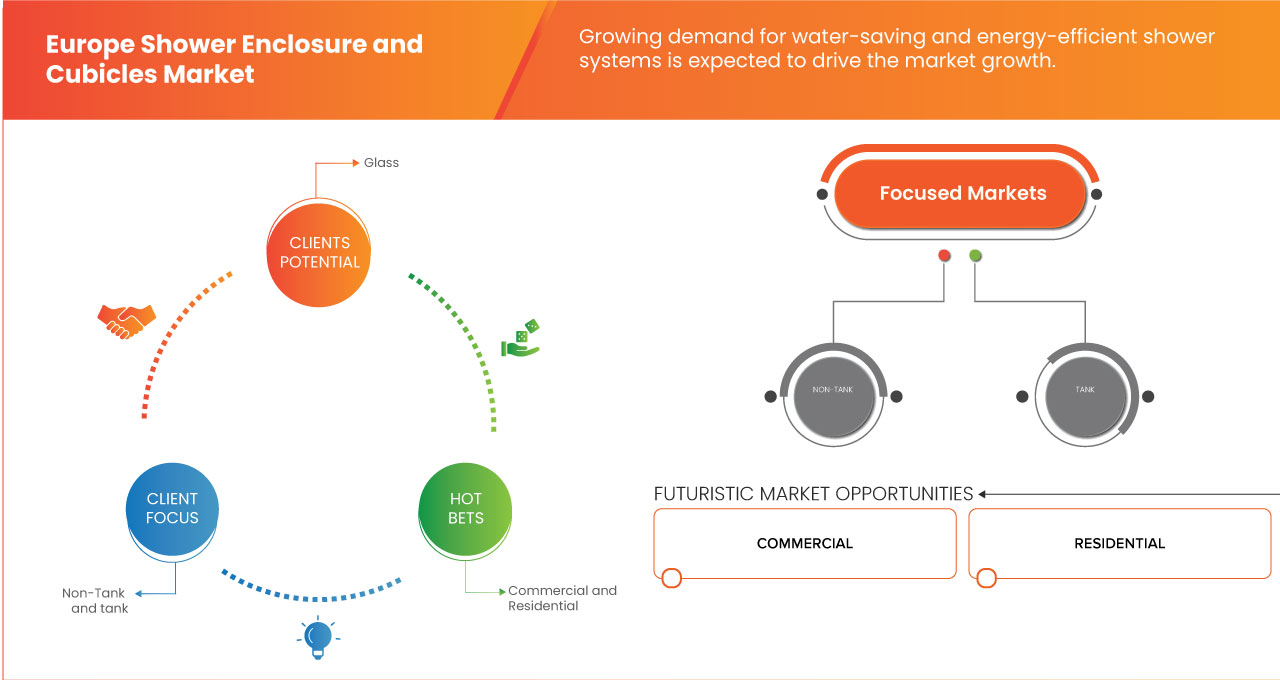
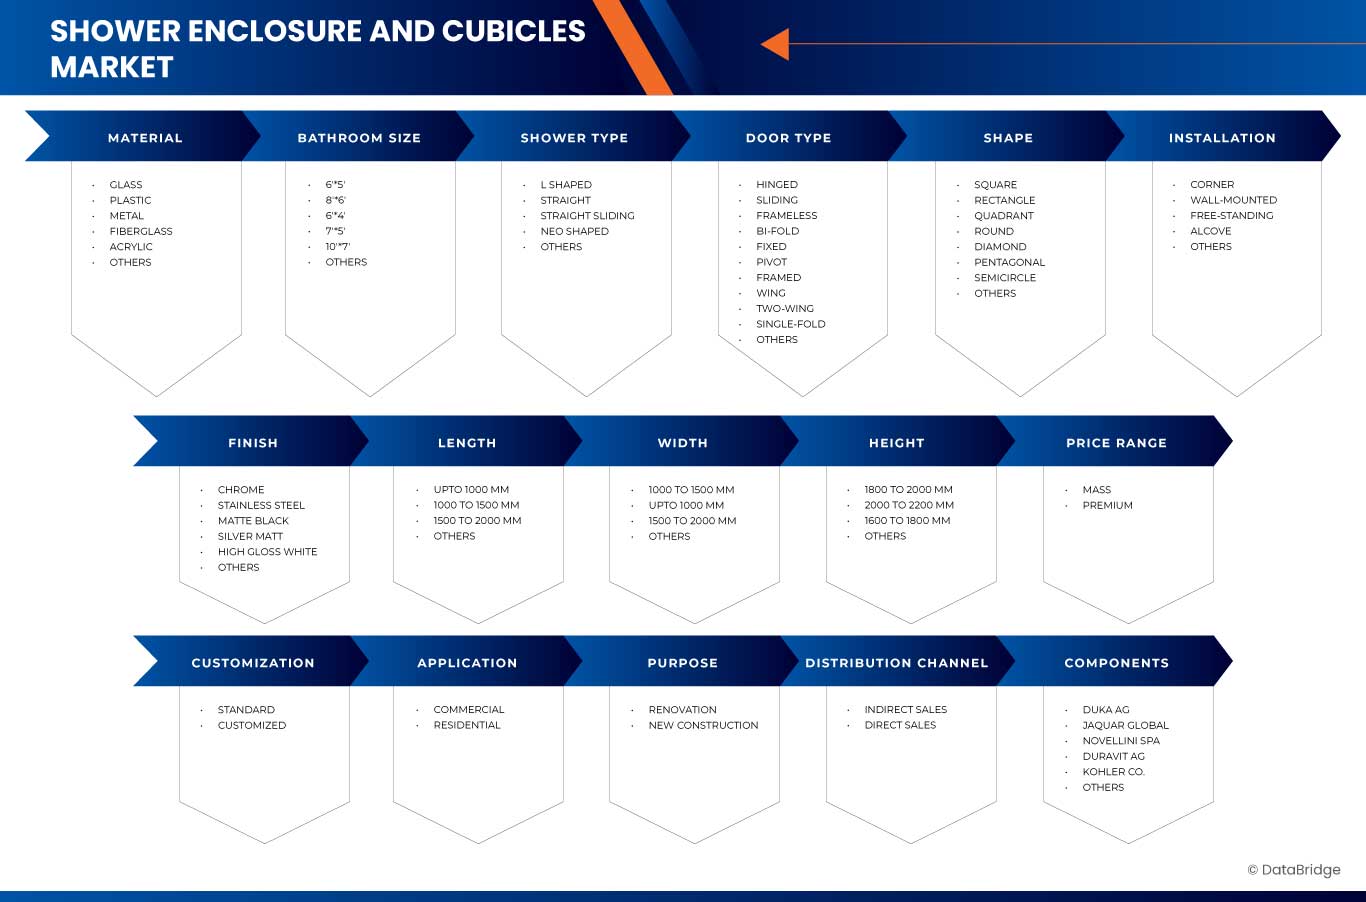
Europe Shower Enclosure and Cubicles Market Segmentation, By Material (Glass, Plastic, Metal, Fiberglass, Acrylic, and Others), Bathroom Size (6'*5', 8'*6', 6'*4', 7'*5', 10'*7', and Others), Shower Type (L Shaped, Straight, Straight Sliding, Neo Shaped, and Others), Door Type (Hinged, Sliding, Frameless, Bi-Fold, Fixed, Pivot, Framed, Wing, Two-Wing, Single-Fold, and Others), Shape (Square, Rectangle, Quadrant, Round, Diamond, Pentagonal, Semicircle, and Others), Installation (Corner, Wall-Mounted, Free-Standing, Alcove, and Others), Finish (Chrome, Stainless Steel, Matte Black, Silver Matt, High Gloss White, and Others), Length (Upto 1000 Mm, 1000 To 1500 Mm, 1500 To 2000 Mm, and Others), By Width (1000 To 1500 Mm, Upto 1000 Mm, 1500 To 2000 Mm, and Others), Height (1800 To 2000 Mm, 2000 To 2200 Mm, 1600 To 1800 Mm, and Others), Price Range (Mass and Premium), Customization (Standard and Customized), Application (Commercial and Residential), Purpose (Renovation and New Construction), Distribution Channel (Indirect Sales and Direct Sales) – Industry Trends and Forecast to 2032
Shower Enclosure and Cubicles Market Analysis
Shower enclosures and cubicles are essential elements in modern bathroom design, offering privacy, water containment, and aesthetic appeal. These enclosures come in various forms, including framed, frameless, bi-fold, and corner units, catering to different space and style preferences. Materials commonly used include tempered glass, acrylic, and PVC, ensuring durability, ease of maintenance, and water resistance. The global market for shower enclosures is influenced by factors such as rising demand for luxury bathrooms, urbanization, and increasing awareness of bathroom hygiene. Technological advancements in designs, such as anti-fog coatings and smart features, are expected to further drive market growth in the coming years.
Shower Enclosure and Cubicles Market Size
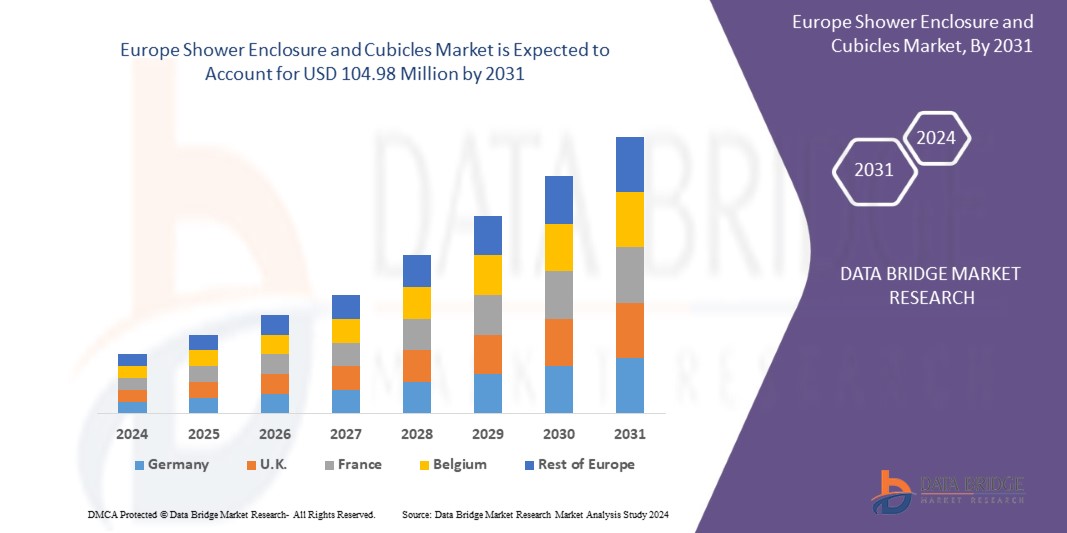
Europe shower enclosure and cubicles market size was valued at USD 175.54 million in 2024 and is projected to reach USD 233.08 million by 2032, growing with a CAGR of 3.7% during the forecast period of 2025 to 2032.
Shower Enclosure and Cubicles Market
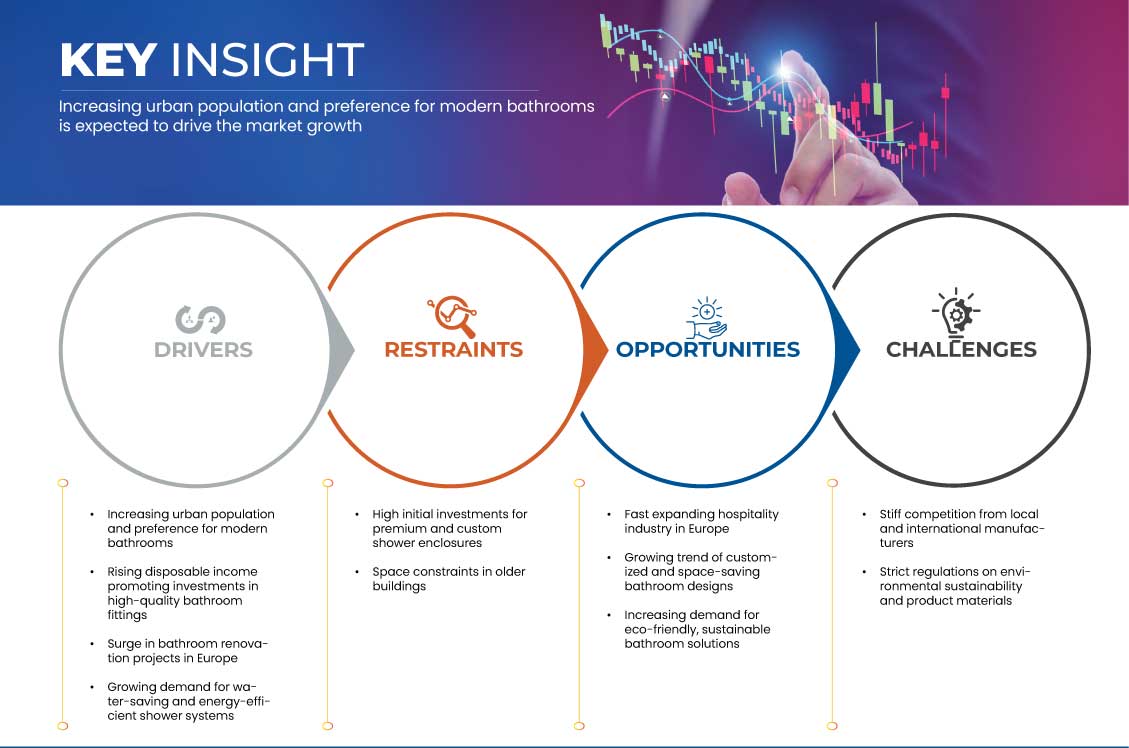
“Increasing Urban Population and Preference for Modern Bathrooms”
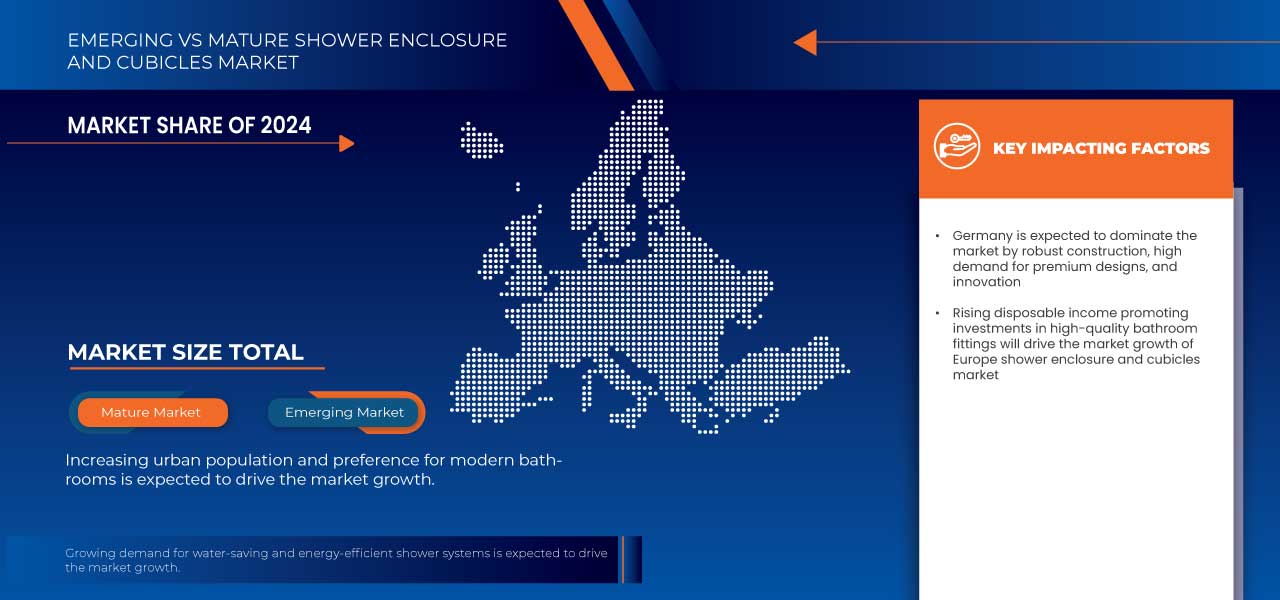
Europe has seen a steady rise in urbanization over the past few decades, with more people moving to cities in search of better employment opportunities, education, and quality of life. This trend has led to the development of new housing complexes, high-rise apartments, and commercial spaces. As urban areas become more densely populated, there is an increasing demand for efficient and space-saving bathroom solutions. Shower enclosures and cubicles, with their compact and versatile design, are an ideal choice for urban dwellings, particularly in apartments and smaller homes where maximizing space is crucial. This growing population in urban centers directly fuels the demand for bathroom fixtures that combine functionality with style.
In addition to urbanization, there is a marked shift in consumer preferences towards modern and luxury bathroom products. As people’s disposable incomes rise and lifestyles become more affluent, there is a growing desire for upgraded and aesthetically appealing bathrooms. Modern shower enclosures and cubicles offer both luxury and practicality, appealing to a wide demographic, including young professionals, families, and retirees. Consumers today are not only looking for products that are efficient in terms of water usage and space management but also ones that contribute to a sophisticated and high-end bathroom ambiance.
Shower enclosures with features like frameless glass designs, customizable sizes, innovative materials, and easy-to-clean surfaces are particularly sought after. Furthermore, advances in shower technology, such as hydromassage systems and multi-functional showerheads, have enhanced the appeal of shower enclosures, further driving demand. These contemporary bathroom features are becoming an essential part of home renovation projects and new construction, contributing to market growth.
Report Scope and Market Segmentation
|
Attributes |
Shower Enclosure and Cubicles Ingredients Key Market Insights |
|
Segments Covered |
By Material: Glass, Plastic, Metal, Fiberglass, Acrylic, and Others By Bathroom Size: 6'*5', 8'*6', 6'*4', 7'*5', 10'*7', and Others By Shower Type: L Shaped, Straight, Straight Sliding, Neo Shaped, and Others By Door Type: Hinged, Sliding, Frameless, Bi-Fold, Fixed, Pivot, Framed, Wing, Two-Wing, Single-Fold, and Others By Shape: Square, Rectangle, Quadrant, Round, Diamond, Pentagonal, Semicircle, and Others By Installation: Corner, Wall-Mounted, Free-Standing, Alcove, Others By Finish: Chrome, Stainless Steel, Matte Black, Silver Matt, High Gloss White, and Others By Length: Upto 1000 Mm, 1000 To 1500 Mm, 1500 To 2000 Mm, and Others By Width: 1000 To 1500 Mm, Upto 1000 Mm, 1500 To 2000 Mm, and Others Height: 1800 To 2000 Mm, 2000 To 2200 Mm, 1600 To 1800 Mm, and Others Price Range: Mass and Premium Customization: Standard and Customized Application: Commercial and Residential Purpose: Renovation and New Construction Distribution Channel: Indirect Sales and Direct Sales |
|
Countries Covered |
Germany, France, U.K., Turkey, Russia, Italy, Spain, Switzerland, Belgium, Netherlands, Sweden, Luxemburg, Norway, Finland, Denmark, Poland, and Rest of Europe |
|
Key Market Players |
LIXIL Corporation., Arblu, AWAL Bath Systems, Calibe srl, Jaquar Global, Duka AG, FOSHAN KORRA BATH WARE CO., LTD., Gruppo Geromin, HOESCH, Kudos Shower Products Ltd, The Majestic Shower Company, Megius S.p.A., Novellini Spa, Duravit AG, HÜPPE GmbH, Kohler Co. , PORCELANOSA Grupo A.I.E, Bohle Ltd. |
|
Market Opportunities |
|
|
Value Added Data Infosets |
In addition to the insights on market scenarios such as market value, growth rate, segmentation, geographical coverage, and major players, the market reports curated by the Data Bridge Market Research also include import export analysis, production capacity overview, production consumption analysis, price trend analysis, climate change scenario, supply chain analysis, value chain analysis, raw material/consumables overview, vendor selection criteria, PESTLE Analysis, Porter Analysis, and regulatory framework. |
Shower Enclosure and Cubicles Market Definition
A shower enclosure is a specialized structure designed to contain water within a designated shower area, preventing it from spilling onto the rest of the bathroom. It typically features walls made of glass, acrylic, or other waterproof materials and can be framed or frameless. Shower cubicles, on the other hand, are standalone units that provide a fully enclosed space for showering, often including a door, walls, and a floor tray. Both shower enclosures and cubicles are designed to enhance privacy, prevent water damage, and improve the overall functionality and aesthetics of a bathroom, with various design options available to suit different needs.
Shower Enclosure and Cubicles Market Dynamics
Drivers
- Rising Disposable Income Promoting Investments in High-Quality Bathroom Fittings
The Europe Shower Enclosure and Cubicles Market is witnessing significant growth, largely driven by the rising disposable income of consumers across the continent. As individuals' purchasing power increases, particularly in economically advanced regions like Western Europe, there is a clear shift towards investing in high-quality, durable, and aesthetically pleasing bathroom fittings. This trend is shaping the demand for shower enclosures and cubicles, which combine luxury, functionality, and design innovation to meet the evolving preferences of modern consumers.
Over the past decade, European economies have seen a steady rise in disposable income, spurred by economic recovery and steady employment rates in countries such as Germany, France, and the UK. As household incomes grow, consumers are willing to allocate a greater portion of their budgets to home improvement projects, including bathroom renovations. This shift is particularly evident in the increasing demand for high-end bathroom fittings, such as designer shower enclosures and cubicles, which offer both luxury and practicality.
For instance,
- In March 2024, according to an article by hygree, the growing popularity of glass shower enclosures, highlighting their sleek, modern design, and functional benefits. Glass enclosures are praised for their ability to enhance bathroom aesthetics while offering easy maintenance and customization options. These features make them a desirable choice for luxury bathroom renovations
Surge in Bathroom Renovation Projects in Europe
The Europe Shower Enclosure and Cubicles Market is experiencing significant growth, largely fueled by the surge in bathroom renovation projects across the continent. As European homeowners increasingly prioritize home improvement and aesthetic upgrades, particularly in older properties, there has been a notable shift toward modern, space-efficient, and stylish bathroom solutions. Shower enclosures and cubicles, with their versatility and ability to maximize space, are particularly in demand, serving as a focal point in renovation projects. This surge in bathroom renovations, driven by both consumer preferences and market trends, is a primary driver of the market’s expansion.
In recent years, there has been a marked increase in the number of bathroom renovation projects in Europe. With many homes—especially those in older buildings—featuring outdated, inefficient bathroom layouts, homeowners are opting for renovations to improve both functionality and aesthetics. Bathrooms are increasingly seen not just as functional spaces, but as personal sanctuaries where homeowners seek relaxation, luxury, and wellness. The growing trend of creating spa-like bathrooms has led to a significant uptick in the demand for high-end fixtures, including modern shower enclosures and cubicles.
For instance,
- In February 2023, according to an article by NCBI, urbanization and changing lifestyles drive an increase in home renovation projects, including bathroom upgrades. As consumers seek modern, efficient, and aesthetically pleasing bathroom solutions, there is a surge in demand for products like shower enclosures, boosting the market for high-quality, space-saving bathroom fixtures
Opportunities
- Fast Expanding Hospitality Industry in Europe
One of the key drivers of growth in the Europe Shower Enclosure and Cubicles Market is the fast-expanding hospitality industry across the region. As tourism continues to rebound and hotel and resort construction projects flourish, the demand for high-quality bathroom solutions, including shower enclosures and cubicles, has surged.
Europe is one of the world's largest and most visited tourist destinations, with cities like Paris, Rome, London, and Barcelona attracting millions of visitors each year. This influx of tourists fuels the growth of the hospitality sector, which includes hotels, resorts, vacation rentals, and spas. In response, hospitality providers are increasingly investing in modernizing and upgrading their facilities, with a strong focus on enhancing guest experiences through luxurious and functional bathroom designs. Shower enclosures and cubicles are central to this effort, offering sleek, stylish, and space-efficient solutions that cater to the evolving preferences of travelers.
For instance,
- In 2024, a report from Economy Middle East highlights that Europe's rapidly growing hospitality sector is being propelled by a surge in tourism, with top cities like Paris, London, Rome, and Barcelona continuing to attract millions of visitors annually. This increase in global travel is driving the demand for upscale hotel accommodations, which in turn is spurring a need for high-end bathroom solutions, including shower enclosures and cubicles
Growing Trend of Customized and Space-Saving Bathroom Designs
A major driver of growth in the market is the rapid expansion of the hospitality industry across the region. With tourism rebounding and an increase in hotel and resort developments, there has been a significant rise in demand for premium bathroom solutions, including shower enclosures and cubicles.
Customized shower enclosures, whether in terms of size, design, or material, allow homeowners and businesses to create a bathroom that suits their unique space and style. Frameless glass enclosures, for example, offer a sleek, contemporary look and can be designed to fit into odd or non-standard bathroom layouts, making them ideal for smaller spaces. Furthermore, the ability to personalize the enclosure with features like built-in storage, specific glass types (e.g., frosted or clear), or innovative door mechanisms (sliding, hinged, or bi-fold) enables consumers to create a bathroom that not only maximizes space but also enhances their overall living experience.
In addition to customization, there is a growing demand for space-saving shower cubicles. With the increasing trend of compact apartments, particularly in major European cities, space efficiency is paramount. Shower cubicles with corner installations or bi-fold doors allow for more efficient use of limited space, without sacrificing comfort. These compact designs help optimize available square footage, making them perfect for smaller bathrooms while maintaining functionality and style.
For instance,
- In January 2024, according to a blog published by Glasxperts, the benefits of glass shower cubicles include sleek, modern designs that maximize space while ensuring functionality, durability, and providing a stylish bathroom upgrade for compact living spaces
Restraints/Challenges
- Strict Regulations on Environmental Sustainability and Product Materials
The market is increasingly influenced by strict regulations on environmental sustainability and product materials. As environmental concerns continue to grow, both consumers and governments are demanding higher standards for sustainability in all industries, including bathroom solutions. These regulations aim to reduce environmental impact, improve resource efficiency, and ensure that products meet increasingly stringent environmental and health standards.
One of the primary regulatory drivers in this market is the push for eco-friendly materials in the production of shower enclosures and cubicles. Manufacturers are being required to use more sustainable materials, such as recyclable glass, eco-friendly acrylics, and aluminum, in their products. These materials not only help reduce waste and promote recycling but also comply with the European Union’s Circular Economy Action Plan, which focuses on reducing resource consumption and encouraging recycling within the construction and manufacturing sectors.
For instance,
- In January 2024, according to a blog published by Greenlam Sturdo, eco-friendly materials in the production of shower enclosures and cubicles can significantly enhance restroom sustainability. The blog emphasizes the use of durable, recyclable, and low-impact materials, which help reduce waste, conserve resources, and minimize carbon footprints, thereby promoting greener, more sustainable restroom designs
Stiff Competition from Local and International Manufacturers
The Europe Shower Enclosure and Cubicles Market faces significant challenges due to the stiff competition from both local and international manufacturers. This highly competitive environment is characterized by a large number of players, each offering a wide range of products and solutions aimed at satisfying varying consumer demands. The competition is further intensified by the presence of both regional specialists and global brands, creating a dynamic market where innovation, pricing strategies, and brand reputation are crucial to success.
Local manufacturers often benefit from their deep understanding of regional preferences, local building standards, and consumer behaviors. They can tailor products to suit specific market needs, offering customization options that appeal to local tastes. In addition, local companies may enjoy cost advantages due to shorter supply chains, lower transportation costs, and the ability to react more quickly to market trends. This allows them to compete effectively on price and provide quicker delivery times compared to their international counterparts.
On the other hand, international manufacturers bring significant advantages in terms of scale, technology, and brand recognition. These companies can leverage their global presence to offer a broader product range, often introducing advanced technologies such as smart shower systems, water-saving features, and high-quality, durable materials. Their ability to operate on a larger scale allows them to achieve economies of scale, which can lead to more competitive pricing despite higher production costs. Additionally, global brands benefit from extensive marketing resources and the ability to establish strong relationships with large retailers and distributors.
For instance,
- In February 2024, according to a blog published by SHKL, local and international manufacturers are vying for market share, focusing on product quality, innovation, and pricing strategies. The competition is intensifying as companies strive to meet evolving consumer demands and adapt to emerging market trends in the shower enclosure industry
Impact and Current Market Scenario of Raw Material Shortage and Shipping Delays
Data Bridge Market Research offers a high-level analysis of the market and delivers information by keeping in account the impact and current market environment of raw material shortage and shipping delays. This translates into assessing strategic possibilities, creating effective action plans, and assisting businesses in making important decisions.
Apart from the standard report, we also offer in-depth analysis of the procurement level from forecasted shipping delays, distributor mapping by region, commodity analysis, production analysis, price mapping trends, sourcing, category performance analysis, supply chain risk management solutions, advanced benchmarking, and other services for procurement and strategic support.
Expected Impact of Economic Slowdown on the Pricing and Availability of Products
When economic activity slows, industries begin to suffer. The forecasted effects of the economic downturn on the pricing and accessibility of the products are taken into account in the market insight reports and intelligence services provided by DBMR. With this, our clients can typically keep one step ahead of their competitors, project their sales and revenue, and estimate their profit and loss expenditures.
Europe Shower Enclosure and Cubicles Market Scope
Der Markt ist segmentiert nach Material, Badezimmergröße, Duschtyp, Türtyp , Form, Installation, Verarbeitung, Länge, Breite, Höhe, Preisspanne, Anpassung, Anwendung, Zweck und Vertriebskanal. Das Wachstum dieser Segmente hilft Ihnen bei der Analyse schwacher Wachstumssegmente in den Branchen und bietet den Benutzern einen wertvollen Marktüberblick und Markteinblicke, die ihnen bei der strategischen Entscheidungsfindung zur Identifizierung der wichtigsten Marktanwendungen helfen.
Material
- Glas
- Plastik
- Metall
- Glasfaser
- Acryl
- Sonstiges
- Glas, nach Typ
- Gehärtetes Glas
- Verbundglas
- Klares Glas
- Eisenarmes Glas
- Getöntes Glas
- Milchglas
- Strukturiertes Glas
- Selbstreinigendes Glas/Leicht zu reinigendes (hydrophobes) Glas
- Korrosionsschutzglas
- Sonstiges
- Metall, nach Typ
- Edelstahl
- Aluminium
- Sonstiges
- Glas, nach Typ
Badezimmergröße
- 6'*5'
- 8'*6'
- 6'*4'
- 7'*5'
- 10'*7'
- Sonstiges
Duschtyp
- L-förmig
- Gerade
- Geradeaus gleitend
- Neo-Form
- Sonstiges
Türtyp
- Aufklappbar
- Schiebesysteme
- Rahmenlos
- Zweifach gefaltet
- Behoben
- Drehpunkt
- Gerahmt
- Flügel
- Zweiflügel
- Einfach gefaltet
- Sonstiges
Form
- Quadrat
- Rechteck
- Quadrant
- Runden
- Diamant
- Fünfeckig
- Halbkreis
- Sonstiges
Installation
- Ecke
- Wandmontage
- Freistehend
- Alkoven
- Sonstiges
Beenden
- Chrom
- Edelstahl
- Mattschwarz
- Silber Matt
- Hochglanzweiß
- Sonstiges
Länge
- Bis 1000 mm
- 1000 bis 1500 mm
- 1500 bis 2000 mm
- Sonstiges
Nach Breite
- 1000 bis 1500 mm
- Bis 1000 mm
- 1500 bis 2000 mm
- Sonstiges
Höhe
- 1800 bis 2000 mm
- 2000 bis 2200 mm
- 1600 bis 1800 mm
- Sonstiges
Preisklasse
- Masse
- Prämie
Anpassung
- Standard
- Individuell
Anwendung
- Kommerziell
- Wohnen
- Kommerziell, nach Kategorie
- Hotels
- Resorts
- Spas & Wellnesszentren
- Krankenhäuser und Gesundheitseinrichtungen
- Golfplätze
- Standorte
- Sonstiges
- Kommerziell, nach Kategorie
Zweck
- Renovierung
- Neubau
Vertriebskanal
- Indirekter Vertrieb
- Direktvertrieb
- Indirekter Vertrieb nach Vertriebskanal
- Offline
- Online
- Offline, nach Vertriebskanal
- Fachgeschäfte
- Supermärkte/Hypermärkte
- Convenience-Stores
- Sonstiges
- Online, nach Vertriebskanal
- Websites von Drittanbietern
- Firmeneigene Websites
- Indirekter Vertrieb nach Vertriebskanal
Europa: Regionale Analyse des Marktes für Duschabtrennungen und -kabinen
Der Markt wird analysiert und Erkenntnisse und Trends zur Marktgröße werden anhand von Material, Badezimmergröße, Duschtyp, Türtyp, Form, Installation, Verarbeitung, Länge, Breite, Höhe, Preisspanne, Anpassung, Anwendung, Zweck und Vertriebskanal bereitgestellt.
Die vom Markt abgedeckten Länder sind Deutschland, Frankreich, Großbritannien, Türkei, Russland, Italien, Spanien, Schweiz, Belgien, Niederlande, Schweden, Luxemburg, Norwegen, Finnland, Dänemark, Polen und der Rest von Europa.
Deutschland dominiert den europäischen Markt für Duschabtrennungen und -kabinen aufgrund seiner fortschrittlichen Fertigungstechnologie, der starken Nachfrage nach qualitativ hochwertigen Badezimmerprodukten, Innovationen im Design sowie eines robusten Bau- und Immobiliensektors.
Der Länderabschnitt des Berichts enthält auch Angaben zu einzelnen marktbeeinflussenden Faktoren und Änderungen der Regulierung auf dem Inlandsmarkt, die sich auf die aktuellen und zukünftigen Trends des Marktes auswirken. Datenpunkte wie Downstream- und Upstream-Wertschöpfungskettenanalysen, technische Trends und Porters Fünf-Kräfte-Analyse sowie Fallstudien sind einige der Anhaltspunkte, die zur Prognose des Marktszenarios für einzelne Länder verwendet werden. Bei der Bereitstellung von Prognoseanalysen der Länderdaten werden auch die Präsenz und Verfügbarkeit globaler Marken und ihre Herausforderungen aufgrund großer oder geringer Konkurrenz durch lokale und inländische Marken sowie die Auswirkungen inländischer Zölle und Handelsrouten berücksichtigt.
Marktanteil für Duschabtrennungen und -kabinen in Europa
Die Wettbewerbslandschaft des Marktes liefert Einzelheiten zu den Wettbewerbern. Zu den enthaltenen Einzelheiten gehören Unternehmensübersicht, Unternehmensfinanzen, erzielter Umsatz, Marktpotenzial, Investitionen in Forschung und Entwicklung, neue Marktinitiativen, globale Präsenz, Produktionsstandorte und -anlagen, Produktionskapazitäten, Stärken und Schwächen des Unternehmens, Produkteinführung, Produktbreite und -umfang, Anwendungsdominanz. Die oben angegebenen Datenpunkte beziehen sich nur auf den Fokus der Unternehmen in Bezug auf den Markt.
Die auf dem europäischen Markt tätigen Marktführer für Duschabtrennungen und -kabinen sind:
- LIXIL Corporation.
- Arblu
- AWAL Badsysteme
- Calibe srl
- Jaquar Global
- Duka AG
- FOSHAN KORRA BATH WARE CO., LTD.
- Gruppo Geromin
- HOESCH
- Kudos Shower Products Ltd
- Die Majestic Shower Company
- Megius SpA
- Novellini Spa
- Duravit AG
- HÜPPE GmbH
- Kohler Co.
- PORCELANOSA Grupo AIE
- Bohle Ltd.
Neueste Entwicklungen auf dem europäischen Markt für Duschabtrennungen und -kabinen
- Laut einem Blog von Momentum Refresh sollen im Juni 2024 innovative Toilettenprodukte entwickelt werden, um die Umweltbelastung zu verringern, die Wassereffizienz zu steigern und die Zugänglichkeit zu verbessern. Diese Lösungen erfüllen sowohl Nachhaltigkeitsziele als auch benutzerfreundliche Designs und entsprechen den Bedürfnissen moderner, umweltbewusster Verbraucher
- Im August 2023 gab es laut einem von Kerovit veröffentlichten Blog eine wachsende Nachfrage nach umweltfreundlichen, nachhaltigen Badezimmerlösungen. Der Blog präsentiert innovative Produkte, die den Wasserverbrauch senken, Abfall minimieren und die Energieeffizienz fördern sollen. Kerovit betont, wie wichtig es ist, stilvolle, umweltbewusste Badezimmer zu schaffen, die sowohl Nachhaltigkeitszielen als auch modernen Designvorlieben gerecht werden.
- Laut einem im September 2024 von GharPedia veröffentlichten Blog helfen verschiedene innovative Ideen wie wassersparende Armaturen, energieeffiziente Beleuchtung und nachhaltige Materialien dabei, umweltfreundliche Badezimmer zu schaffen, ohne Kompromisse bei Stil oder Funktionalität einzugehen.
SKU-
Erhalten Sie Online-Zugriff auf den Bericht zur weltweit ersten Market Intelligence Cloud

- Interaktives Datenanalyse-Dashboard
- Unternehmensanalyse-Dashboard für Chancen mit hohem Wachstumspotenzial
- Zugriff für Research-Analysten für Anpassungen und Abfragen
- Konkurrenzanalyse mit interaktivem Dashboard
- Aktuelle Nachrichten, Updates und Trendanalyse
- Nutzen Sie die Leistungsfähigkeit der Benchmark-Analyse für eine umfassende Konkurrenzverfolgung
Inhaltsverzeichnis
1 EINLEITUNG
1.1 ZIELE DER STUDIE
1.2 MARKTDEFINITION
1.3 ÜBERBLICK
1.4 EINSCHRÄNKUNGEN
1.5 ABGEDECKTE MÄRKTE
2 MARKTSEGMENTIERUNG
2.1 ABGEDECKTE MÄRKTE
2.2 GEOGRAFISCHER UMFANG
2,3 JAHRE FÜR DIE STUDIE
2.4 WÄHRUNG UND PREISE
2.5 DBMR-Dreibeindatenvalidierungsmodell
2.6 MULTIVARIATE MODELLIERUNG
2.7 PRIMÄRINTERVIEWS MIT WICHTIGEN MEINUNGSFÜHRERN
2.8 DBMR-Marktpositionsraster
2.9 Marktanwendungs-Abdeckungsraster
2.1 DBMR-Lieferantenanteilsanalyse
2.11 SEKUNDÄRQUELLEN
2.12 ANNAHMEN
3 ZUSAMMENFASSUNG
4 PREMIUM-EINBLICKE
4.1 PORTERS FÜNF-KRÄFTE-ANALYSE
4.1.1 Bedrohung durch neue Marktteilnehmer
4.1.2 Verhandlungsmacht der Lieferanten
4.1.3 VERHANDLUNGSMACHT DER KÄUFER
4.1.4 Bedrohung durch Ersatzstoffe
4.1.5 INTERNER WETTBEWERB
4.2 IMPORT-EXPORT-SZENARIO
4.3 PREISINDEX
4.4 MARKENAUSBLICK
4.4.1 MARKENVERGLEICHSANALYSE
4.4.2 PRODUKT- UND MARKENÜBERSICHT
4.5 KAUFVERHALTEN DER VERBRAUCHER
4.5.1 Verschiebung hin zu Luxus und Ästhetik
4.5.2 FUNKTIONALITÄT UND PLATZOPTIMIERUNG
4.5.3 ÖKOLOGISCHES BEWUSSTSEIN
4.5.4 Preissensitivität und Preis-Leistungs-Verhältnis
4.5.5 ONLINE-SHOPPING UND DIGITALER EINFLUSS
4.5.6 ANPASSUNG UND PERSONALISIERUNG
4.5.7 SCHLUSSFOLGERUNG
4.6 Auswirkungen der Konjunkturabschwächung
4.6.1 AUSWIRKUNGEN AUF DEN PREIS
4.6.2 AUSWIRKUNGEN AUF DIE LIEFERKETTE
4.6.3 AUSWIRKUNGEN AUF DEN VERSAND
4.6.4 AUSWIRKUNGEN AUF DIE NACHFRAGE
4.6.5 AUSWIRKUNGEN AUF STRATEGISCHE ENTSCHEIDUNGEN
4.6.6 SCHLUSSFOLGERUNG
4.7 AUSBLICK AUF DIE PRODUKTIONSKAPAZITÄT
4.7.1 Marktnachfrage und Verbraucherpräferenzen
4.7.2 TECHNOLOGISCHE INNOVATIONEN UND AUTOMATISIERUNG
4.7.3 NACHHALTIGKEIT UND MATERIALBESCHAFFUNG
4.7.4 WIRTSCHAFTLICHE UND LIEFERKETTENFAKTOREN
4.7.5 SCHLUSSFOLGERUNG
4.8 PRODUKTANNAHME-SZENARIO
4.8.1 Markttreiber für die Produktakzeptanz
4.8.1.1 Veränderter Lebensstil und Vorlieben der Verbraucher
4.8.1.2 Steigende Nachfrage nach platzsparenden Lösungen
4.8.1.3 WACHSTUM DES RENOVIERUNGS- UND UMBAUMARKTES
4.8.1.4 TECHNOLOGISCHE FORTSCHRITTE
4.8.2 HINDERNISSE FÜR DIE PRODUKTANNAHME
4.8.2.1 HOHE ANFANGSKOSTEN
4.8.2.2 HERAUSFORDERUNGEN BEI INSTALLATION UND WARTUNG
4.8.2.3 EINGESCHRÄNKTES BEWUSSTSEIN IN BESTIMMTEN REGIONEN
4.8.3 Trends, die die Akzeptanz fördern
4.8.3.1 ANPASSUNG UND PERSONALISIERUNG
4.8.3.2 NACHHALTIGKEIT UND UMWELTFREUNDLICHE PRODUKTE
4.8.3.3 LUXUS- UND WELLNESS-TRENDS
4.8.4 REGIONALE UNTERSCHIEDE BEI DER ANNAHM
4.8.4.1 WEST- UND NORDEUROPA
4.8.4.2 SÜDEUROPA
4.8.4.3 OSTEUROPA
4.8.5 SCHLUSSFOLGERUNG
4.9 ANALYSE DER ROHSTOFFBESCHAFFUNG
4.9.1 WICHTIGE ROHSTOFFE FÜR DUSCHKABINEN UND -ABTRENNUNGEN
4.9.1.1 GLAS
4.9.1.2 METALL (ALUMINIUM, EDELSTAHL UND MESSING)
4.9.1.3 ACRYL UND POLYMERE
4.9.1.4 GUMMI UND SILIKON
4.9.1.5 HOLZ UND VERBUNDWERKSTOFFE
4.9.2 Herausforderungen bei der Beschaffung von Rohstoffen
4.9.2.1 Unterbrechungen in der Lieferkette
4.9.2.2 Preisvolatilität
4.9.2.3 Umwelt- und Nachhaltigkeitsaspekte
4.9.2.4 Einhaltung gesetzlicher Vorschriften
4.9.3 Trends in der Rohstoffbeschaffung
4.9.3.1 LOKALE BESCHAFFUNG FÜR EINEN REDUZIERTEN CO2-FUSSABDRUCK
4.9.3.2 Intelligente Materialien
4.9.4 SCHLUSSFOLGERUNG
4.1 LIEFERKETTENANALYSE
4.10.1 ÜBERSICHT
4.10.2 Logistikkostenszenario
4.10.3 Bedeutung der Logistikdienstleister
5 REGULIERUNGSABDECKUNG
6 MARKTÜBERSICHT
6.1 TREIBER
6.1.1 Wachsende Stadtbevölkerung und Vorliebe für moderne Badezimmer
6.1.2 Steigendes verfügbares Einkommen fördert Investitionen in hochwertige Badezimmerausstattung
6.1.3 Anstieg der Badezimmer-Renovierungsprojekte in Europa
6.1.4 Wachsende Nachfrage nach wassersparenden und energieeffizienten Duschsystemen
6.2 EINSCHRÄNKUNGEN
6.2.1 HOHE ANFANGSINVESTITIONEN FÜR PREMIUM- UND INDIVIDUAL-DUSCHKABINEN
6.2.2 Platzbeschränkungen im Altbau
6.3 CHANCEN
6.3.1 SCHNELL WACHSENDES HOTELGEWERBE IN EUROPA
6.3.2 Wachsender Trend zu maßgeschneiderten und platzsparenden Badezimmerdesigns
6.3.3 Steigende Nachfrage nach umweltfreundlichen, nachhaltigen Badezimmerlösungen
6.4 HERAUSFORDERUNGEN
6.4.1 Starker Wettbewerb durch lokale und internationale Hersteller
6.4.2 STRENGE VORSCHRIFTEN ZUR ÖKOLOGISCHEN VERTRÄGLICHKEIT UND ZU PRODUKTMATERIALIEN
7. EUROPA-MARKT FÜR DUSCHKABINEN UND -ABTRENNUNGEN, NACH MATERIAL
7.1 ÜBERSICHT
7.2 GLAS
7.3 KUNSTSTOFF
7.4 METALL
7.5 GLASFASER
7.6 ACRYL
7.7 SONSTIGES
8 EUROPÄISCHER MARKT FÜR DUSCHKABINEN UND -ABTRENNUNGEN, NACH BADEZIMMERGRÖSSE
8.1 ÜBERSICHT
8.2 6'*5'
8,3 8'*6'
8,4 6'*4'
8,5 7'*5'
8,6 10'*7'
8.7 SONSTIGES
9 EUROPÄISCHER MARKT FÜR DUSCHKABINEN UND -ABTRENNUNGEN, NACH DUSCHTYP
9.1 ÜBERSICHT
9,2 L-FORM
9.3 GERADE
9.4 GERADEAUSGLEICH
9,5 NEO-FORM
9.6 SONSTIGES
10 EUROPA-MARKT FÜR DUSCHKABINEN UND -ABTRENNUNGEN, NACH TÜRTYP
10.1 ÜBERSICHT
10.2 KLAPPBAR
10.3 GLEITEN
10.4 RAHMENLOS
10,5 ZWEIFACH
10.6 BEHOBEN
10.7 PIVOT
10.8 GERAHMT
10.9 FLÜGEL
10.1 ZWEIFLÜGELIG
10.11 EINFACHFALTEN
10.12 SONSTIGES
11 EUROPÄISCHER MARKT FÜR DUSCHKABINEN UND -ABTRENNUNGEN, NACH FORM
11.1 ÜBERSICHT
11.2 QUADRAT
11.3 RECHTECK
11.4 QUADRANT
11,5 RUNDE
11.6 DIAMANT
11.7 Fünfeck
11.8 Halbkreis
11.9 SONSTIGES
12 EUROPÄISCHER MARKT FÜR DUSCHKABINEN UND -ABTRENNUNGEN, NACH INSTALLATION
12.1 ÜBERSICHT
12.2 ECKE
12.3 WANDMONTAGE
12.4 FREISTEHEND
12.5 NISCHE
12.6 SONSTIGES
13 EUROPÄISCHER MARKT FÜR DUSCHKABINEN UND -ABTRENNUNGEN, NACH AUSFÜHRUNG
13.1 ÜBERSICHT
13.2 CHROM
13.3 EDELSTAHL
13.4 MATTSCHWARZ
13.5 SILBER MATT
13.6 HOCHGLANZWEISS
13.7 SONSTIGES
14 EUROPÄISCHER MARKT FÜR DUSCHKABINEN UND -ABTRENNUNGEN, NACH LÄNGE
14.1 ÜBERSICHT
14.2 BIS 1000 MM
14.3 1000 BIS 1500 MM
14.4 1500 BIS 2000 MM
14.5 SONSTIGES
15 EUROPÄISCHER MARKT FÜR DUSCHKABINEN UND -ABTRENNUNGEN, NACH BREITE
15.1 ÜBERSICHT
15.2 1000 BIS 1500 MM
15,3 BIS 1000 MM
15.4 1500 BIS 2000 MM
15.5 SONSTIGES
16 EUROPA-MARKT FÜR DUSCHKABINEN UND -ABTRENNUNGEN, NACH HÖHE
16.1 ÜBERSICHT
16.2 1800 BIS 2000 MM
16.3 2000 BIS 2200 MM
16.4 1600 BIS 1800 MM
16.5 SONSTIGES
17 EUROPA-MARKT FÜR DUSCHKABINEN UND -ABTRENNUNGEN, NACH PREISKLASSE
17.1 ÜBERSICHT
17.2 MASSE
17.3 PRÄMIE
18 EUROPA-MARKT FÜR DUSCHKABINEN UND -ABTRENNUNGEN, NACH ANPASSUNG
18.1 ÜBERSICHT
18.2 STANDARD
18.3 ANGEPASST
19 EUROPÄISCHER MARKT FÜR DUSCHKABINEN UND -ABTRENNUNGEN, NACH ANWENDUNG
19.1 ÜBERSICHT
19.2 KOMMERZIELL
19.3 WOHNGEBÄUDE
20 EUROPÄISCHER MARKT FÜR DUSCHKABINEN UND -ABTRENNUNGEN, NACH ZWECK
20.1 ÜBERBLICK
20.2 RENOVIERUNG
20.3 NEUBAU
21 EUROPÄISCHER MARKT FÜR DUSCHKABINEN UND -ABTRENNUNGEN, NACH VERTRIEBSKANAL
21.1 ÜBERBLICK
21.2 INDIREKTE VERKÄUFE
21.3 DIREKTVERKAUF
22 EUROPÄISCHER MARKT FÜR DUSCHKABINEN UND -ABTRENNUNGEN NACH LÄNDERN
22.1 EUROPA
22.1.1 DEUTSCHLAND
22.1.2 FRANKREICH
22.1.3 Vereinigtes Königreich
22.1.4 TÜRKEI
22.1.5 RUSSLAND
22.1.6 ITALIEN
22.1.7 SPANIEN
22.1.8 SCHWEIZ
22.1.9 BELGIEN
22.1.10 NIEDERLANDE
22.1.11 SCHWEDEN
22.1.12 LUXEMBURG
22.1.13 NORWEGEN
22.1.14 FINNLAND
22.1.15 DÄNEMARK
22.1.16 POLEN
22.1.17 RESTLICHES EUROPA
23 EUROPA-MARKT FÜR DUSCHKABINEN UND -SCHRÄNKE: FIRMENLANDSCHAFT
23.1 UNTERNEHMENSAKTIENANALYSE: EUROPA
24 SWOT-ANALYSE
25 FIRMENPROFILE
25.1 DUKA AG
25.1.1 UNTERNEHMENSÜBERSICHT
25.1.2 PRODUKTPORTFOLIO
25.1.3 JÜNGSTE ENTWICKLUNG
25.2 JAQUAR GLOBAL
25.2.1 UNTERNEHMENSÜBERSICHT
25.2.2 PRODUKTPORTFOLIO
25.2.3 JÜNGSTE ENTWICKLUNG
25.3 NOVELLINI SPA
25.3.1 UNTERNEHMENSÜBERSICHT
25.3.2 PRODUKTPORTFOLIO
25.3.3 JÜNGSTE ENTWICKLUNG
25.4 DURAVIT AG
25.4.1 UNTERNEHMENSÜBERSICHT
25.4.2 PRODUKTPORTFOLIO
25.4.3 JÜNGSTE ENTWICKLUNG
25.5 KOHLER CO.
25.5.1 UNTERNEHMENSÜBERSICHT
25.5.2 PRODUKTPORTFOLIO
25.5.3 JÜNGSTE ENTWICKLUNG
25.6 ARBLU
25.6.1 UNTERNEHMENSÜBERSICHT
25.6.2 PRODUKTPORTFOLIO
25.6.3 JÜNGSTE ENTWICKLUNG
25.7 AWAL BADSYSTEME
25.7.1 UNTERNEHMENSÜBERSICHT
25.7.2 PRODUKTPORTFOLIO
25.7.3 JÜNGSTE ENTWICKLUNG
25.8 BOHLE LTD.
25.8.1 UNTERNEHMENSÜBERSICHT
25.8.2 PRODUKTPORTFOLIO
25.8.3 JÜNGSTE ENTWICKLUNG
25.9 CALIBE SRL
25.9.1 UNTERNEHMENSÜBERSICHT
25.9.2 PRODUKTPORTFOLIO
25.9.3 JÜNGSTE ENTWICKLUNG
25.1 FOSHAN KORRA BATH WARE CO., LTD.
25.10.1 UNTERNEHMENSÜBERSICHT
25.10.2 PRODUKTPORTFOLIO
25.10.3 JÜNGSTE ENTWICKLUNG
25.11 GRUPPE GEROMIN
25.11.1 UNTERNEHMENSÜBERSICHT
25.11.2 PRODUKTPORTFOLIO
25.11.3 JÜNGSTE ENTWICKLUNG
25.12 HOESCH
25.12.1 UNTERNEHMENSÜBERSICHT
25.12.2 PRODUKTPORTFOLIO
25.12.3 NEUE ENTWICKLUNG
25.13 HUPPE GMBH
25.13.1 UNTERNEHMENSÜBERSICHT
25.13.2 PRODUKTPORTFOLIO
25.13.3 JÜNGSTE ENTWICKLUNG
25.14 LIXIL CORPORATION
25.14.1 UNTERNEHMENSÜBERSICHT
25.14.2 Umsatzanalyse
25.14.3 PRODUKTPORTFOLIO
25.14.4 NEUESTE ENTWICKLUNG
25.15 KUDOS SHOWER PRODUCTS LTD
25.15.1 UNTERNEHMENSÜBERSICHT
25.15.2 PRODUKTPORTFOLIO
25.15.3 NEUE ENTWICKLUNG
25.16 MEGIUS SPA
25.16.1 UNTERNEHMENSÜBERSICHT
25.16.2 PRODUKTPORTFOLIO
25.16.3 NEUE ENTWICKLUNG
25.17 PORCELANOSA GRUPO AIE
25.17.1 UNTERNEHMENSÜBERSICHT
25.17.2 PRODUKTPORTFOLIO
25.17.3 NEUE ENTWICKLUNG
25.18 DIE MAJESTIC SHOWER COMPANY
25.18.1 UNTERNEHMENSÜBERSICHT
25.18.2 PRODUKTPORTFOLIO
25.18.3 NEUE ENTWICKLUNG
26 FRAGEBOGEN
27 VERWANDTE BERICHTE
Tabellenverzeichnis
TABELLE 1 MARKENVERGLEICHSANALYSE
TABELLE 2: PRODUKT- UND MARKENÜBERSICHT
TABELLE 3 REGULIERUNGSABDECKUNG
TABELLE 4: EUROPÄISCHER MARKT FÜR DUSCHKABINEN UND -ABTRENNUNGEN, NACH MATERIAL, 2018–2032 (TAUSEND USD)
TABELLE 5: EUROPÄISCHER MARKT FÜR DUSCHKABINEN UND -ABTRENNUNGEN, NACH MATERIAL, 2018–2032 (TAUSEND EINHEITEN)
TABELLE 6: EUROPÄISCHER MARKT FÜR GLAS IN DUSCHKABINEN UND -ABTRENNUNGEN, NACH TYP, 2018–2032 (TAUSEND USD)
TABELLE 7: EUROPÄISCHER MARKT FÜR METALL IN DUSCHKABINEN UND -ABTRENNUNGEN, NACH TYP, 2018–2032 (TAUSEND USD)
TABELLE 8: EUROPÄISCHER MARKT FÜR DUSCHKABINEN UND -ABTRENNUNGEN, NACH BADEZIMMERGRÖSSE, 2018–2032 (TAUSEND USD)
TABELLE 9: EUROPÄISCHER MARKT FÜR DUSCHKABINEN UND -ABTRENNUNGEN, NACH DUSCHTYP, 2018–2032 (TAUSEND USD)
TABELLE 10: EUROPÄISCHER MARKT FÜR DUSCHKABINEN UND -ABTRENNUNGEN, NACH TÜRTYP, 2018–2032 (TAUSEND USD)
TABELLE 11: EUROPÄISCHER MARKT FÜR DUSCHKABINEN UND -ABTRENNUNGEN, NACH FORM, 2018–2032 (TAUSEND USD)
TABELLE 12: EUROPÄISCHER MARKT FÜR DUSCHKABINEN UND -ABTRENNUNGEN, NACH INSTALLATION, 2018–2032 (TAUSEND USD)
TABELLE 13: EUROPÄISCHER MARKT FÜR DUSCHKABINEN UND -ABTRENNUNGEN, NACH AUSFÜHRUNG, 2018–2032 (TAUSEND USD)
TABELLE 14: EUROPÄISCHER MARKT FÜR DUSCHKABINEN UND -ABTRENNUNGEN, NACH LÄNGE, 2018–2032 (TAUSEND USD)
TABELLE 15: EUROPÄISCHER MARKT FÜR DUSCHKABINEN UND -ABTRENNUNGEN, NACH BREITE, 2018–2032 (TAUSEND USD)
TABELLE 16: EUROPÄISCHER MARKT FÜR DUSCHKABINEN UND -ABTRENNUNGEN, NACH GRÖSSE, 2018–2032 (TAUSEND USD)
TABELLE 17: EUROPÄISCHER MARKT FÜR DUSCHKABINEN UND -ABTRENNUNGEN, NACH PREISKLASSE, 2018–2032 (TAUSEND USD)
TABELLE 18: EUROPÄISCHER MARKT FÜR DUSCHKABINEN UND -ABTRENNUNGEN, NACH ANPASSUNG, 2018–2032 (TAUSEND USD)
TABELLE 19: EUROPÄISCHER MARKT FÜR DUSCHKABINEN UND -ABTRENNUNGEN, NACH ANWENDUNG, 2018–2032 (TAUSEND USD)
TABELLE 20: EUROPÄISCHER MARKT FÜR GEWERBLICHE DUSCHKABINEN UND -ABTRENNUNGEN, NACH KATEGORIE, 2018–2032 (TAUSEND USD)
TABELLE 21: EUROPÄISCHER MARKT FÜR DUSCHKABINEN UND -ABTRENNUNGEN, NACH ZWECK, 2018–2032 (TAUSEND USD)
TABELLE 22: EUROPÄISCHER MARKT FÜR DUSCHKABINEN UND -ABTRENNUNGEN, NACH VERTRIEBSKANAL, 2018–2032 (TAUSEND USD)
TABELLE 23: INDIREKTE VERKÄUFE IM MARKT FÜR DUSCHKABINEN UND -ABTRENNUNGEN IN EUROPA, NACH VERTRIEBSKANAL, 2018–2032 (TAUSEND USD)
TABELLE 24 EUROPA OFFLINE IM MARKT FÜR DUSCHKABINEN UND -ABTRENNUNGEN, NACH VERTRIEBSKANAL, 2018–2032 (TAUSEND USD)
TABELLE 25 EUROPA ONLINE IM MARKT FÜR DUSCHKABINEN UND -ABTRENNUNGEN, NACH VERTRIEBSKANAL, 2018-2032 (TAUSEND USD)
TABELLE 26: EUROPÄISCHER MARKT FÜR DUSCHKABINEN UND -ABTRENNUNGEN, NACH LÄNDERN, 2018–2032 (TAUSEND USD)
TABELLE 27: EUROPÄISCHER MARKT FÜR DUSCHKABINEN UND -ABTRENNUNGEN, NACH LÄNDERN, 2018–2032 (TAUSEND EINHEITEN)
TABELLE 28 DEUTSCHER MARKT FÜR DUSCHKABINEN UND -ABTRENNUNGEN, NACH MATERIAL, 2018–2032 (TAUSEND USD)
TABELLE 29 DEUTSCHER MARKT FÜR DUSCHKABINEN UND -ABTRENNUNGEN, NACH MATERIAL, 2018–2032 (TAUSEND EINHEITEN)
TABELLE 30 DEUTSCHER MARKT FÜR GLAS IN DUSCHKABINEN UND -ABTRENNUNGEN, NACH TYP, 2018–2032 (TAUSEND USD)
TABELLE 31 DEUTSCHER MARKT FÜR METALL IN DUSCHKABINEN UND -ABTRENNUNGEN, NACH TYP, 2018–2032 (TAUSEND USD)
TABELLE 32 DEUTSCHER MARKT FÜR DUSCHKABINEN UND -ABTRENNUNGEN, NACH BADEZIMMERGRÖSSE, 2018–2032 (TAUSEND USD)
TABELLE 33 DEUTSCHER MARKT FÜR DUSCHKABINEN UND -ABTRENNUNGEN, NACH DUSCHTYP, 2018–2032 (TAUSEND USD)
TABELLE 34 DEUTSCHER MARKT FÜR DUSCHKABINEN UND -ABTRENNUNGEN, NACH TÜRTYP, 2018–2032 (TAUSEND USD)
TABELLE 35 DEUTSCHER MARKT FÜR DUSCHKABINEN UND -ABTRENNUNGEN, NACH FORM, 2018–2032 (TAUSEND USD)
TABELLE 36 DEUTSCHER MARKT FÜR DUSCHKABINEN UND -ABTRENNUNGEN, NACH INSTALLATION, 2018–2032 (TAUSEND USD)
TABELLE 37 DEUTSCHER MARKT FÜR DUSCHKABINEN UND -ABTRENNUNGEN, NACH AUSFÜHRUNG, 2018–2032 (TAUSEND USD)
TABELLE 38 DEUTSCHER MARKT FÜR DUSCHKABINEN UND -ABTRENNUNGEN, NACH LÄNGE, 2018–2032 (TAUSEND USD)
TABELLE 39 DEUTSCHER MARKT FÜR DUSCHKABINEN UND -ABTRENNUNGEN, NACH BREITE, 2018–2032 (TAUSEND USD)
TABELLE 40 DEUTSCHER MARKT FÜR DUSCHKABINEN UND -ABTRENNUNGEN, NACH GRÖSSE, 2018–2032 (TAUSEND USD)
TABELLE 41 DEUTSCHER MARKT FÜR DUSCHKABINEN UND -ABTRENNUNGEN, NACH PREISKLASSE, 2018–2032 (TAUSEND USD)
TABELLE 42 DEUTSCHER MARKT FÜR DUSCHKABINEN UND -ABTRENNUNGEN, NACH ANPASSUNG, 2018–2032 (TAUSEND USD)
TABELLE 43 DEUTSCHER MARKT FÜR DUSCHKABINEN UND -ABTRENNUNGEN, NACH ANWENDUNG, 2018–2032 (TAUSEND USD)
TABELLE 44 DEUTSCHER MARKT FÜR GEWERBLICHE DUSCHKABINEN UND -ABTRENNUNGEN, NACH KATEGORIE, 2018–2032 (TAUSEND USD)
TABELLE 45 DEUTSCHER MARKT FÜR DUSCHKABINEN UND -ABTRENNUNGEN, NACH ZWECK, 2018–2032 (TAUSEND USD)
TABELLE 46 DEUTSCHER MARKT FÜR DUSCHKABINEN UND -ABTRENNUNGEN, NACH VERTRIEBSKANAL, 2018–2032 (TAUSEND USD)
TABELLE 47: INDIREKTE VERKÄUFE AUF DEM MARKT FÜR DUSCHKABINEN UND -ABTRENNUNGEN IN DEUTSCHLAND, NACH VERTRIEBSKANAL, 2018–2032 (TAUSEND USD)
TABELLE 48 DEUTSCHLAND OFFLINE IM MARKT FÜR DUSCHKABINEN UND -ABTRENNUNGEN, NACH VERTRIEBSKANAL, 2018–2032 (TAUSEND USD)
TABELLE 49 DEUTSCHLAND ONLINE IM MARKT FÜR DUSCHKABINEN UND -ABTRENNUNGEN, NACH VERTRIEBSKANAL, 2018-2032 (TAUSEND USD)
TABELLE 50: FRANKREICH: MARKT FÜR DUSCHKABINEN UND -ABTRENNUNGEN, NACH MATERIAL, 2018–2032 (TAUSEND USD)
TABELLE 51: FRANKREICH: MARKT FÜR DUSCHKABINEN UND -ABTRENNUNGEN, NACH MATERIAL, 2018–2032 (TAUSEND EINHEITEN)
TABELLE 52: FRANKREICH: MARKT FÜR GLAS IN DUSCHKABINEN UND -ABTRENNUNGEN, NACH TYP, 2018–2032 (TAUSEND USD)
TABELLE 53: FRANKREICH: METALLMARKT FÜR DUSCHKABINEN UND -ABTRENNUNGEN, NACH TYP, 2018–2032 (TAUSEND USD)
TABELLE 54: FRANKREICH: MARKT FÜR DUSCHKABINEN UND -ABTRENNUNGEN, NACH BADEZIMMERGRÖSSE, 2018–2032 (TAUSEND USD)
TABELLE 55: FRANKREICH: MARKT FÜR DUSCHKABINEN UND -ABTRENNUNGEN, NACH DUSCHTYP, 2018–2032 (TAUSEND USD)
TABELLE 56: FRANKREICH: MARKT FÜR DUSCHKABINEN UND -ABTRENNUNGEN, NACH TÜRTYP, 2018–2032 (TAUSEND USD)
TABELLE 57: FRANKREICH: MARKT FÜR DUSCHKABINEN UND -ABTRENNUNGEN, NACH FORM, 2018–2032 (TAUSEND USD)
TABELLE 58: FRANKREICH: MARKT FÜR DUSCHKABINEN UND -ABTRENNUNGEN, NACH INSTALLATION, 2018–2032 (TAUSEND USD)
TABELLE 59: FRANKREICH: MARKT FÜR DUSCHKABINEN UND -ABTRENNUNGEN, NACH AUSFÜHRUNG, 2018–2032 (TAUSEND USD)
TABELLE 60: FRANKREICH: MARKT FÜR DUSCHKABINEN UND -ABTRENNUNGEN, NACH LÄNGE, 2018–2032 (TAUSEND USD)
TABELLE 61: FRANKREICH: MARKT FÜR DUSCHKABINEN UND -ABTRENNUNGEN, NACH BREITE, 2018–2032 (TAUSEND USD)
TABELLE 62: FRANKREICH: MARKT FÜR DUSCHKABINEN UND -ABTRENNUNGEN, NACH GRÖSSE, 2018–2032 (TAUSEND USD)
TABELLE 63: FRANKREICH: MARKT FÜR DUSCHKABINEN UND -ABTRENNUNGEN, NACH PREISKLASSE, 2018–2032 (TAUSEND USD)
TABELLE 64: FRANKREICH: MARKT FÜR DUSCHKABINEN UND -ABTRENNUNGEN, NACH ANPASSUNG, 2018–2032 (TAUSEND USD)
TABELLE 65: FRANKREICH: MARKT FÜR DUSCHKABINEN UND -ABTRENNUNGEN, NACH ANWENDUNG, 2018–2032 (TAUSEND USD)
TABELLE 66: FRANKREICH: GEWERBLICHER MARKT FÜR DUSCHKABINEN UND -ABTRENNUNGEN, NACH KATEGORIE, 2018–2032 (TAUSEND USD)
TABELLE 67: FRANKREICH: MARKT FÜR DUSCHKABINEN UND -ABTRENNUNGEN, NACH ZWECK, 2018–2032 (TAUSEND USD)
TABELLE 68: FRANKREICH: MARKT FÜR DUSCHKABINEN UND -ABTRENNUNGEN, NACH VERTRIEBSKANAL, 2018–2032 (TAUSEND USD)
TABELLE 69 INDIREKTE VERKÄUFE AUF DEM MARKT FÜR DUSCHKABINEN UND -ABTRENNUNGEN IN FRANKREICH, NACH VERTRIEBSKANAL, 2018–2032 (TAUSEND USD)
TABELLE 70: FRANKREICH OFFLINE AUF DEM MARKT FÜR DUSCHKABINEN UND -ABTRENNUNGEN, NACH VERTRIEBSKANAL, 2018–2032 (TAUSEND USD)
TABELLE 71: FRANKREICH ONLINE AUF DEM MARKT FÜR DUSCHKABINEN UND -ABTRENNUNGEN, NACH VERTRIEBSKANAL, 2018–2032 (TAUSEND USD)
TABELLE 72: BRITISCHER MARKT FÜR DUSCHKABINEN UND -ABTRENNUNGEN, NACH MATERIAL, 2018–2032 (TAUSEND USD)
TABELLE 73 BRITISCHER MARKT FÜR DUSCHKABINEN UND -ABTRENNUNGEN, NACH MATERIAL, 2018–2032 (TAUSEND EINHEITEN)
TABELLE 74: MARKT FÜR GLAS IN DUSCHKABINEN UND -ABTRENNUNGEN IN GROSSBRITANNIEN, NACH TYP, 2018–2032 (TAUSEND USD)
TABELLE 75 – BRITISCHER MARKT FÜR METALL IN DUSCHKABINEN UND -ABTRENNUNGEN, NACH TYP, 2018–2032 (TAUSEND USD)
TABELLE 76: BRITISCHER MARKT FÜR DUSCHKABINEN UND -ABTRENNUNGEN, NACH BADEZIMMERGRÖSSE, 2018–2032 (TAUSEND USD)
TABELLE 77 BRITISCHER MARKT FÜR DUSCHKABINEN UND -ABTRENNUNGEN, NACH DUSCHTYP, 2018–2032 (TAUSEND USD)
TABELLE 78: BRITISCHER MARKT FÜR DUSCHKABINEN UND -ABTRENNUNGEN, NACH TÜRTYP, 2018–2032 (TAUSEND USD)
TABELLE 79: BRITISCHER MARKT FÜR DUSCHKABINEN UND -ABTRENNUNGEN, NACH FORM, 2018–2032 (TAUSEND USD)
TABELLE 80 BRITISCHER MARKT FÜR DUSCHKABINEN UND -ABTRENNUNGEN, NACH INSTALLATION, 2018–2032 (TAUSEND USD)
TABELLE 81 BRITISCHER MARKT FÜR DUSCHKABINEN UND -ABTRENNUNGEN, NACH AUSFÜHRUNG, 2018–2032 (TAUSEND USD)
TABELLE 82: BRITISCHER MARKT FÜR DUSCHKABINEN UND -ABTRENNUNGEN, NACH LÄNGE, 2018–2032 (TAUSEND USD)
TABELLE 83 BRITISCHER MARKT FÜR DUSCHKABINEN UND -ABTRENNUNGEN, NACH BREITE, 2018–2032 (TAUSEND USD)
TABELLE 84 BRITISCHER MARKT FÜR DUSCHKABINEN UND -ABTRENNUNGEN, NACH HÖHE, 2018–2032 (TAUSEND USD)
TABELLE 85: BRITISCHER MARKT FÜR DUSCHKABINEN UND -ABTRENNUNGEN, NACH PREISKLASSE, 2018–2032 (TAUSEND USD)
TABELLE 86 BRITISCHER MARKT FÜR DUSCHKABINEN UND -ABTRENNUNGEN, NACH ANPASSUNG, 2018–2032 (TAUSEND USD)
TABELLE 87 BRITISCHER MARKT FÜR DUSCHKABINEN UND -ABTRENNUNGEN, NACH ANWENDUNG, 2018–2032 (TAUSEND USD)
TABELLE 88: BRITISCHER GEWERBLICHER MARKT FÜR DUSCHKABINEN UND -ABTRENNUNGEN, NACH KATEGORIE, 2018–2032 (TAUSEND USD)
TABELLE 89 BRITISCHER MARKT FÜR DUSCHKABINEN UND -ABTRENNUNGEN, NACH ZWECK, 2018–2032 (TAUSEND USD)
TABELLE 90: BRITISCHER MARKT FÜR DUSCHKABINEN UND -ABTRENNUNGEN, NACH VERTRIEBSKANAL, 2018–2032 (TAUSEND USD)
TABELLE 91: INDIREKTE VERKÄUFE IM MARKT FÜR DUSCHKABINEN UND -ABTRENNUNGEN IN GROSSBRITANNIEN, NACH VERTRIEBSKANAL, 2018–2032 (TAUSEND USD)
TABELLE 92: OFFLINE-MARKT FÜR DUSCHKABINEN UND -ABTRENNUNGEN IN GROSSBRITANNIEN, NACH VERTRIEBSKANAL, 2018–2032 (TAUSEND USD)
TABELLE 93: UK-Online-Markt für Duschkabinen und -abtrennungen, nach Vertriebskanal, 2018–2032 (in TAUSEND USD)
TABELLE 94: TÜRKISCHER MARKT FÜR DUSCHKABINEN UND -ABTRENNUNGEN, NACH MATERIAL, 2018–2032 (TAUSEND USD)
TABELLE 95: TÜRKISCHER MARKT FÜR DUSCHKABINEN UND -ABTRENNUNGEN, NACH MATERIAL, 2018–2032 (TAUSEND EINHEITEN)
TABELLE 96 MARKT FÜR GLAS IN DUSCHKABINEN UND -ABTRENNUNGEN IN DER TÜRKEI, NACH TYP, 2018–2032 (TAUSEND USD)
TABELLE 97 TÜRKEI: METALLMARKT FÜR DUSCHKABINEN UND -ABTRENNUNGEN, NACH TYP, 2018–2032 (TAUSEND USD)
TABELLE 98: TÜRKISCHER MARKT FÜR DUSCHKABINEN UND -ABTRENNUNGEN, NACH BADEZIMMERGRÖSSE, 2018–2032 (TAUSEND USD)
TABELLE 99: TÜRKISCHER MARKT FÜR DUSCHKABINEN UND -ABTRENNUNGEN, NACH DUSCHTYP, 2018–2032 (TAUSEND USD)
TABELLE 100: TÜRKISCHER MARKT FÜR DUSCHKABINEN UND -ABTRENNUNGEN, NACH TÜRTYP, 2018–2032 (TAUSEND USD)
TABELLE 101: TÜRKISCHER MARKT FÜR DUSCHKABINEN UND -ABTRENNUNGEN, NACH FORM, 2018–2032 (TAUSEND USD)
TABELLE 102 MARKT FÜR DUSCHKABINEN UND -ABTRENNUNGEN IN DER TÜRKEI, NACH INSTALLATION, 2018–2032 (TAUSEND USD)
TABELLE 103 MARKT FÜR DUSCHKABINEN UND -ABTRENNUNGEN IN DER TÜRKEI, NACH AUSFÜHRUNG, 2018–2032 (TAUSEND USD)
TABELLE 104: TÜRKISCHER MARKT FÜR DUSCHKABINEN UND -ABTRENNUNGEN, NACH LÄNGE, 2018–2032 (TAUSEND USD)
TABELLE 105: TÜRKISCHER MARKT FÜR DUSCHKABINEN UND -ABTRENNUNGEN, NACH BREITE, 2018–2032 (TAUSEND USD)
TABELLE 106 MARKT FÜR DUSCHKABINEN UND -ABTRENNUNGEN IN DER TÜRKEI, NACH HÖHE, 2018–2032 (TAUSEND USD)
TABELLE 107 MARKT FÜR DUSCHKABINEN UND -ABTRENNUNGEN IN DER TÜRKEI, NACH PREISKLASSE, 2018–2032 (TAUSEND USD)
TABELLE 108 MARKT FÜR DUSCHKABINEN UND -ABTRENNUNGEN IN DER TÜRKEI, NACH ANPASSUNG, 2018–2032 (TAUSEND USD)
TABELLE 109 MARKT FÜR DUSCHKABINEN UND -ABTRENNUNGEN IN DER TÜRKEI, NACH ANWENDUNG, 2018–2032 (TAUSEND USD)
TABELLE 110: TÜRKISCHER MARKT FÜR DUSCHKABINEN UND -ABTRENNUNGEN, NACH KATEGORIE, 2018–2032 (TAUSEND USD)
TABELLE 111 MARKT FÜR DUSCHKABINEN UND -ABTRENNUNGEN IN DER TÜRKEI, NACH ZWECK, 2018–2032 (TAUSEND USD)
TABELLE 112: TÜRKISCHER MARKT FÜR DUSCHKABINEN UND -ABTRENNUNGEN, NACH VERTRIEBSKANAL, 2018–2032 (TAUSEND USD)
TABELLE 113 INDIREKTE VERKÄUFE AUF DEM MARKT FÜR DUSCHKABINEN UND -ABTRENNUNGEN IN DER TÜRKEI, NACH VERTRIEBSKANAL, 2018–2032 (TAUSEND USD)
TABELLE 114 TÜRKEI OFFLINE IM MARKT FÜR DUSCHKABINEN UND -ABTRENNUNGEN, NACH VERTRIEBSKANAL, 2018–2032 (TAUSEND USD)
TABELLE 115 TÜRKEI ONLINE AUF DEM MARKT FÜR DUSCHKABINEN UND -ABTRENNUNGEN, NACH VERTRIEBSKANAL, 2018–2032 (TAUSEND USD)
TABELLE 116 RUSSISCHER MARKT FÜR DUSCHKABINEN UND -ABTRENNUNGEN, NACH MATERIAL, 2018–2032 (TAUSEND USD)
TABELLE 117 RUSSISCHER MARKT FÜR DUSCHKABINEN UND -ABTRENNUNGEN, NACH MATERIAL, 2018–2032 (TAUSEND EINHEITEN)
TABELLE 118 RUSSLAND: MARKT FÜR GLAS IN DUSCHKABINEN UND -ABTRENNUNGEN, NACH TYP, 2018–2032 (TAUSEND USD)
TABELLE 119 RUSSISCHER MARKT FÜR METALL IN DUSCHKABINEN UND -ABTRENNUNGEN, NACH TYP, 2018–2032 (TAUSEND USD)
TABELLE 120 RUSSISCHER MARKT FÜR DUSCHKABINEN UND -ABTRENNUNGEN, NACH BADEZIMMERGRÖSSE, 2018–2032 (TAUSEND USD)
TABELLE 121 RUSSISCHER MARKT FÜR DUSCHKABINEN UND -ABTRENNUNGEN, NACH DUSCHTYP, 2018–2032 (TAUSEND USD)
TABELLE 122 RUSSISCHER MARKT FÜR DUSCHKABINEN UND -ABTRENNUNGEN, NACH TÜRTYP, 2018–2032 (TAUSEND USD)
TABELLE 123 RUSSISCHER MARKT FÜR DUSCHKABINEN UND -ABTRENNUNGEN, NACH FORM, 2018–2032 (TAUSEND USD)
TABELLE 124 RUSSISCHER MARKT FÜR DUSCHKABINEN UND -ABTRENNUNGEN, NACH INSTALLATION, 2018–2032 (TAUSEND USD)
TABELLE 125 RUSSISCHER MARKT FÜR DUSCHKABINEN UND -ABTRENNUNGEN, NACH AUSFÜHRUNG, 2018–2032 (TAUSEND USD)
TABELLE 126 RUSSISCHER MARKT FÜR DUSCHKABINEN UND -ABTRENNUNGEN, NACH LÄNGE, 2018–2032 (TAUSEND USD)
TABELLE 127 RUSSISCHER MARKT FÜR DUSCHKABINEN UND -ABTRENNUNGEN, NACH BREITE, 2018–2032 (TAUSEND USD)
TABELLE 128 RUSSISCHER MARKT FÜR DUSCHKABINEN UND -ABTRENNUNGEN, NACH GRÖSSE, 2018–2032 (TAUSEND USD)
TABELLE 129 RUSSISCHER MARKT FÜR DUSCHKABINEN UND -ABTRENNUNGEN, NACH PREISKLASSE, 2018–2032 (TAUSEND USD)
TABELLE 130 RUSSISCHER MARKT FÜR DUSCHKABINEN UND -ABTRENNUNGEN, NACH ANPASSUNG, 2018–2032 (TAUSEND USD)
TABELLE 131 RUSSISCHER MARKT FÜR DUSCHKABINEN UND -ABTRENNUNGEN, NACH ANWENDUNG, 2018–2032 (TAUSEND USD)
TABELLE 132 RUSSLAND – GEWERBLICHER MARKT FÜR DUSCHKABINEN UND -ABTRENNUNGEN, NACH KATEGORIE, 2018–2032 (TAUSEND USD)
TABELLE 133 RUSSISCHER MARKT FÜR DUSCHKABINEN UND -ABTRENNUNGEN, NACH ZWECK, 2018–2032 (TAUSEND USD)
TABELLE 134 RUSSISCHER MARKT FÜR DUSCHKABINEN UND -ABTRENNUNGEN, NACH VERTRIEBSKANAL, 2018–2032 (TAUSEND USD)
TABELLE 135: INDIREKTE VERKÄUFE AUF DEM MARKT FÜR DUSCHKABINEN UND -ABTRENNUNGEN IN RUSSLAND, NACH VERTRIEBSKANAL, 2018–2032 (TAUSEND USD)
TABELLE 136 RUSSLAND OFFLINE AUF DEM MARKT FÜR DUSCHKABINEN UND -ABTRENNUNGEN, NACH VERTRIEBSKANAL, 2018–2032 (TAUSEND USD)
TABELLE 137 RUSSLAND ONLINE-MARKT FÜR DUSCHKABINEN UND -ABTRENNUNGEN, NACH VERTRIEBSKANAL, 2018–2032 (TAUSEND USD)
TABELLE 138: ITALIENISCHER MARKT FÜR DUSCHKABINEN UND -ABTRENNUNGEN, NACH MATERIAL, 2018–2032 (TAUSEND USD)
TABELLE 139: ITALIENISCHER MARKT FÜR DUSCHKABINEN UND -ABTRENNUNGEN, NACH MATERIAL, 2018–2032 (TAUSEND EINHEITEN)
TABELLE 140 ITALIENISCHER MARKT FÜR GLAS IN DUSCHKABINEN UND -ABTRENNUNGEN, NACH TYP, 2018–2032 (TAUSEND USD)
TABELLE 141 ITALIENISCHER MARKT FÜR METALL IN DUSCHKABINEN UND -ABTRENNUNGEN, NACH TYP, 2018–2032 (TAUSEND USD)
TABELLE 142: ITALIENISCHER MARKT FÜR DUSCHKABINEN UND -ABTRENNUNGEN, NACH BADEZIMMERGRÖSSE, 2018–2032 (TAUSEND USD)
TABELLE 143: ITALIENISCHER MARKT FÜR DUSCHKABINEN UND -ABTRENNUNGEN, NACH DUSCHTYP, 2018–2032 (TAUSEND USD)
TABELLE 144: ITALIENISCHER MARKT FÜR DUSCHKABINEN UND -ABTRENNUNGEN, NACH TÜRTYP, 2018–2032 (TAUSEND USD)
TABELLE 145: ITALIENISCHER MARKT FÜR DUSCHKABINEN UND -ABTRENNUNGEN, NACH FORM, 2018–2032 (TAUSEND USD)
TABELLE 146: ITALIENISCHER MARKT FÜR DUSCHKABINEN UND -ABTRENNUNGEN, NACH INSTALLATION, 2018–2032 (TAUSEND USD)
TABELLE 147: ITALIENISCHER MARKT FÜR DUSCHKABINEN UND -ABTRENNUNGEN, NACH AUSFÜHRUNG, 2018–2032 (TAUSEND USD)
TABELLE 148: ITALIENISCHER MARKT FÜR DUSCHKABINEN UND -ABTRENNUNGEN, NACH LÄNGE, 2018–2032 (TAUSEND USD)
TABELLE 149: ITALIENISCHER MARKT FÜR DUSCHKABINEN UND -ABTRENNUNGEN, NACH BREITE, 2018–2032 (TAUSEND USD)
TABELLE 150: ITALIENISCHER MARKT FÜR DUSCHKABINEN UND -ABTRENNUNGEN, NACH GRÖSSE, 2018–2032 (TAUSEND USD)
TABELLE 151: ITALIENISCHER MARKT FÜR DUSCHKABINEN UND -ABTRENNUNGEN, NACH PREISKLASSE, 2018–2032 (TAUSEND USD)
TABELLE 152: ITALIENISCHER MARKT FÜR DUSCHKABINEN UND -ABTRENNUNGEN, NACH ANPASSUNG, 2018–2032 (TAUSEND USD)
TABELLE 153: ITALIENISCHER MARKT FÜR DUSCHKABINEN UND -ABTRENNUNGEN, NACH ANWENDUNG, 2018–2032 (TAUSEND USD)
TABELLE 154 ITALIENISCHER MARKT FÜR GEWERBLICHE DUSCHKABINEN UND -ABTRENNUNGEN, NACH KATEGORIE, 2018–2032 (TAUSEND USD)
TABELLE 155: ITALIENISCHER MARKT FÜR DUSCHKABINEN UND -ABTRENNUNGEN, NACH ZWECK, 2018–2032 (TAUSEND USD)
TABELLE 156: ITALIENISCHER MARKT FÜR DUSCHKABINEN UND -ABTRENNUNGEN, NACH VERTRIEBSKANAL, 2018–2032 (TAUSEND USD)
TABELLE 157 ITALIENISCHER INDIREKTER VERKAUF AUF DEM MARKT FÜR DUSCHKABINEN UND -ABTRENNUNGEN, NACH VERTRIEBSKANAL, 2018–2032 (TAUSEND USD)
TABELLE 158 ITALIEN OFFLINE AUF DEM MARKT FÜR DUSCHKABINEN UND -ABTRENNUNGEN, NACH VERTRIEBSKANAL, 2018–2032 (TAUSEND USD)
TABELLE 159 ITALIEN ONLINE AUF DEM MARKT FÜR DUSCHKABINEN UND -ABTRENNUNGEN, NACH VERTRIEBSKANAL, 2018–2032 (TAUSEND USD)
TABELLE 160 SPANISCHER MARKT FÜR DUSCHKABINEN UND -ABTRENNUNGEN, NACH MATERIAL, 2018–2032 (TAUSEND USD)
TABELLE 161 SPANISCHER MARKT FÜR DUSCHKABINEN UND -ABTRENNUNGEN, NACH MATERIAL, 2018–2032 (TAUSEND EINHEITEN)
TABELLE 162 SPANISCHER MARKT FÜR GLAS IN DUSCHKABINEN UND -ABTRENNUNGEN, NACH TYP, 2018–2032 (TAUSEND USD)
TABELLE 163 SPANISCHER MARKT FÜR METALL IN DUSCHKABINEN UND -ABTRENNUNGEN, NACH TYP, 2018–2032 (TAUSEND USD)
TABELLE 164 SPANISCHER MARKT FÜR DUSCHKABINEN UND -ABTRENNUNGEN, NACH BADEZIMMERGRÖSSE, 2018–2032 (TAUSEND USD)
TABELLE 165 SPANISCHER MARKT FÜR DUSCHKABINEN UND -ABTRENNUNGEN, NACH DUSCHTYP, 2018–2032 (TAUSEND USD)
TABELLE 166 SPANISCHER MARKT FÜR DUSCHKABINEN UND -ABTRENNUNGEN, NACH TÜRTYP, 2018–2032 (TAUSEND USD)
TABELLE 167 SPANISCHER MARKT FÜR DUSCHKABINEN UND -ABTRENNUNGEN, NACH FORM, 2018–2032 (TAUSEND USD)
TABELLE 168 SPANISCHER MARKT FÜR DUSCHKABINEN UND -ABTRENNUNGEN, NACH INSTALLATION, 2018–2032 (TAUSEND USD)
TABELLE 169 SPANISCHER MARKT FÜR DUSCHKABINEN UND -ABTRENNUNGEN, NACH AUSFÜHRUNG, 2018–2032 (TAUSEND USD)
TABELLE 170 SPANISCHER MARKT FÜR DUSCHKABINEN UND -ABTRENNUNGEN, NACH LÄNGE, 2018–2032 (TAUSEND USD)
TABELLE 171 SPANISCHER MARKT FÜR DUSCHKABINEN UND -ABTRENNUNGEN, NACH BREITE, 2018–2032 (TAUSEND USD)
TABELLE 172 SPANISCHER MARKT FÜR DUSCHKABINEN UND -ABTRENNUNGEN, NACH GRÖSSE, 2018–2032 (TAUSEND USD)
TABELLE 173 SPANISCHER MARKT FÜR DUSCHKABINEN UND -ABTRENNUNGEN, NACH PREISKLASSE, 2018–2032 (TAUSEND USD)
TABELLE 174 SPANISCHER MARKT FÜR DUSCHKABINEN UND -ABTRENNUNGEN, NACH ANPASSUNG, 2018–2032 (TAUSEND USD)
TABELLE 175 SPANISCHER MARKT FÜR DUSCHKABINEN UND -ABTRENNUNGEN, NACH ANWENDUNG, 2018–2032 (TAUSEND USD)
TABELLE 176 SPANISCHER MARKT FÜR GEWERBLICHE DUSCHKABINEN UND -ABTRENNUNGEN, NACH KATEGORIE, 2018–2032 (TAUSEND USD)
TABELLE 177 SPANISCHER MARKT FÜR DUSCHKABINEN UND -ABTRENNUNGEN, NACH ZWECK, 2018–2032 (TAUSEND USD)
TABELLE 178 SPANISCHER MARKT FÜR DUSCHKABINEN UND -ABTRENNUNGEN, NACH VERTRIEBSKANAL, 2018–2032 (TAUSEND USD)
TABELLE 179 SPANIEN: INDIREKTE VERKÄUFE AUF DEM MARKT FÜR DUSCHKABINEN UND -ABTRENNUNGEN, NACH VERTRIEBSKANAL, 2018–2032 (TAUSEND USD)
TABELLE 180 SPANIEN OFFLINE IM MARKT FÜR DUSCHKABINEN UND -ABTRENNUNGEN, NACH VERTRIEBSKANAL, 2018–2032 (TAUSEND USD)
TABELLE 181 SPANIEN ONLINE AUF DEM MARKT FÜR DUSCHKABINEN UND -ABTRENNUNGEN, NACH VERTRIEBSKANAL, 2018–2032 (TAUSEND USD)
TABELLE 182 SCHWEIZER MARKT FÜR DUSCHKABINEN UND -ABTRENNUNGEN, NACH MATERIAL, 2018–2032 (TAUSEND USD)
TABELLE 183 SCHWEIZER MARKT FÜR DUSCHKABINEN UND -ABTRENNUNGEN, NACH MATERIAL, 2018–2032 (TAUSEND EINHEITEN)
TABELLE 184 SCHWEIZER MARKT FÜR GLAS IN DUSCHKABINEN UND -ABTRENNUNGEN, NACH TYP, 2018–2032 (TAUSEND USD)
TABELLE 185 SCHWEIZER MARKT FÜR METALL IN DUSCHKABINEN UND -ABTRENNUNGEN, NACH TYP, 2018–2032 (TAUSEND USD)
TABELLE 186 SCHWEIZER MARKT FÜR DUSCHKABINEN UND -ABTRENNUNGEN, NACH BADEZIMMERGRÖSSE, 2018–2032 (TAUSEND USD)
TABELLE 187 SCHWEIZER MARKT FÜR DUSCHKABINEN UND -ABTRENNUNGEN, NACH DUSCHTYP, 2018–2032 (TAUSEND USD)
TABELLE 188 SCHWEIZER MARKT FÜR DUSCHKABINEN UND -ABTRENNUNGEN, NACH TÜRTYP, 2018–2032 (TAUSEND USD)
TABELLE 189 SCHWEIZER MARKT FÜR DUSCHKABINEN UND -ABTRENNUNGEN, NACH FORM, 2018–2032 (TAUSEND USD)
TABELLE 190 SCHWEIZER MARKT FÜR DUSCHKABINEN UND -ABTRENNUNGEN, NACH INSTALLATION, 2018–2032 (TAUSEND USD)
TABELLE 191 SCHWEIZER MARKT FÜR DUSCHKABINEN UND -ABTRENNUNGEN, NACH AUSFÜHRUNG, 2018–2032 (TAUSEND USD)
TABELLE 192 SCHWEIZER MARKT FÜR DUSCHKABINEN UND -ABTRENNUNGEN, NACH LÄNGE, 2018–2032 (TAUSEND USD)
TABELLE 193 SCHWEIZER MARKT FÜR DUSCHKABINEN UND -ABTRENNUNGEN, NACH BREITE, 2018–2032 (TAUSEND USD)
TABELLE 194 SCHWEIZER MARKT FÜR DUSCHKABINEN UND -ABTRENNUNGEN, NACH GRÖSSE, 2018–2032 (TAUSEND USD)
TABELLE 195 SCHWEIZER MARKT FÜR DUSCHKABINEN UND -ABTRENNUNGEN, NACH PREISKLASSE, 2018–2032 (TAUSEND USD)
TABELLE 196 SCHWEIZER MARKT FÜR DUSCHKABINEN UND -ABTRENNUNGEN, NACH ANPASSUNG, 2018–2032 (TAUSEND USD)
TABELLE 197 SCHWEIZER MARKT FÜR DUSCHKABINEN UND -ABTRENNUNGEN, NACH ANWENDUNG, 2018–2032 (TAUSEND USD)
TABELLE 198 SCHWEIZER MARKT FÜR GEWERBLICHE DUSCHKABINEN UND -ABTRENNUNGEN, NACH KATEGORIE, 2018–2032 (TAUSEND USD)
TABELLE 199 SCHWEIZER MARKT FÜR DUSCHKABINEN UND -ABTRENNUNGEN, NACH ZWECK, 2018–2032 (TAUSEND USD)
TABELLE 200 SCHWEIZER MARKT FÜR DUSCHKABINEN UND -ABTRENNUNGEN, NACH VERTRIEBSKANAL, 2018–2032 (TAUSEND USD)
TABELLE 201 INDIREKTE VERKÄUFE IN DER SCHWEIZ AUF DEM MARKT FÜR DUSCHKABINEN UND -ABTRENNUNGEN, NACH VERTRIEBSKANAL, 2018–2032 (TAUSEND USD)
TABELLE 202 SCHWEIZ OFFLINE IM MARKT FÜR DUSCHKABINEN UND -ABTRENNUNGEN, NACH VERTRIEBSKANAL, 2018–2032 (TAUSEND USD)
TABELLE 203 SCHWEIZ ONLINE IM MARKT FÜR DUSCHKABINEN UND -ABTRENNUNGEN, NACH VERTRIEBSKANAL, 2018-2032 (TAUSEND USD)
TABELLE 204: BELGISCHER MARKT FÜR DUSCHKABINEN UND -ABTRENNUNGEN, NACH MATERIAL, 2018–2032 (TAUSEND USD)
TABELLE 205: BELGISCHER MARKT FÜR DUSCHKABINEN UND -ABTRENNUNGEN, NACH MATERIAL, 2018–2032 (TAUSEND EINHEITEN)
TABELLE 206 BELGISCHER MARKT FÜR GLAS IN DUSCHKABINEN UND -ABTRENNUNGEN, NACH TYP, 2018–2032 (TAUSEND USD)
TABELLE 207 BELGISCHER MARKT FÜR METALL IN DUSCHKABINEN UND -ABTRENNUNGEN, NACH TYP, 2018–2032 (TAUSEND USD)
TABELLE 208: BELGISCHER MARKT FÜR DUSCHKABINEN UND -ABTRENNUNGEN, NACH BADEZIMMERGRÖSSE, 2018–2032 (TAUSEND USD)
TABELLE 209: BELGISCHER MARKT FÜR DUSCHKABINEN UND -ABTRENNUNGEN, NACH DUSCHTYP, 2018–2032 (TAUSEND USD)
TABELLE 210: BELGISCHER MARKT FÜR DUSCHKABINEN UND -ABTRENNUNGEN, NACH TÜRTYP, 2018–2032 (TAUSEND USD)
TABELLE 211: BELGISCHER MARKT FÜR DUSCHKABINEN UND -ABTRENNUNGEN, NACH FORM, 2018–2032 (TAUSEND USD)
TABELLE 212: BELGISCHER MARKT FÜR DUSCHKABINEN UND -ABTRENNUNGEN, NACH INSTALLATION, 2018–2032 (TAUSEND USD)
TABELLE 213: BELGISCHER MARKT FÜR DUSCHKABINEN UND -ABTRENNUNGEN, NACH AUSFÜHRUNG, 2018–2032 (TAUSEND USD)
TABELLE 214: BELGISCHER MARKT FÜR DUSCHKABINEN UND -ABTRENNUNGEN, NACH LÄNGE, 2018–2032 (TAUSEND USD)
TABELLE 215: BELGISCHER MARKT FÜR DUSCHKABINEN UND -ABTRENNUNGEN, NACH BREITE, 2018–2032 (TAUSEND USD)
TABELLE 216: BELGISCHER MARKT FÜR DUSCHKABINEN UND -ABTRENNUNGEN, NACH HÖHE, 2018–2032 (TAUSEND USD)
TABELLE 217: BELGISCHER MARKT FÜR DUSCHKABINEN UND -ABTRENNUNGEN, NACH PREISKLASSE, 2018–2032 (TAUSEND USD)
TABELLE 218: BELGISCHER MARKT FÜR DUSCHKABINEN UND -ABTRENNUNGEN, NACH ANPASSUNG, 2018–2032 (TAUSEND USD)
TABELLE 219: BELGISCHER MARKT FÜR DUSCHKABINEN UND -ABTRENNUNGEN, NACH ANWENDUNG, 2018–2032 (TAUSEND USD)
TABELLE 220 BELGISCHER MARKT FÜR GEWERBLICHE DUSCHKABINEN UND -ABTRENNUNGEN, NACH KATEGORIE, 2018–2032 (TAUSEND USD)
TABELLE 221: BELGISCHER MARKT FÜR DUSCHKABINEN UND -ABTRENNUNGEN, NACH ZWECK, 2018–2032 (TAUSEND USD)
TABELLE 222: BELGISCHER MARKT FÜR DUSCHKABINEN UND -ABTRENNUNGEN, NACH VERTRIEBSKANAL, 2018–2032 (TAUSEND USD)
TABELLE 223 INDIREKTE VERKÄUFE IN BELGIEN AUF DEM MARKT FÜR DUSCHKABINEN UND -ABTRENNUNGEN, NACH VERTRIEBSKANAL, 2018–2032 (TAUSEND USD)
TABELLE 224 BELGIEN OFFLINE IM MARKT FÜR DUSCHKABINEN UND -ABTRENNUNGEN, NACH VERTRIEBSKANAL, 2018–2032 (TAUSEND USD)
TABELLE 225 BELGIEN ONLINE AUF DEM MARKT FÜR DUSCHKABINEN UND -ABTRENNUNGEN, NACH VERTRIEBSKANAL, 2018–2032 (TAUSEND USD)
TABELLE 226 NIEDERLÄNDISCHER MARKT FÜR DUSCHKABINEN UND -ABTRENNUNGEN, NACH MATERIAL, 2018–2032 (TAUSEND USD)
TABELLE 227 NIEDERLÄNDISCHER MARKT FÜR DUSCHKABINEN UND -ABTRENNUNGEN, NACH MATERIAL, 2018–2032 (TAUSEND EINHEITEN)
TABELLE 228 NIEDERLANDE – MARKT FÜR GLAS IN DUSCHKABINEN UND -ABTRENNUNGEN, NACH TYP, 2018–2032 (TAUSEND USD)
TABELLE 229 NIEDERLANDE – MARKT FÜR METALL IN DUSCHKABINEN UND -ABTRENNUNGEN, NACH TYP, 2018–2032 (TAUSEND USD)
TABELLE 230 NIEDERLÄNDISCHER MARKT FÜR DUSCHKABINEN UND -ABTRENNUNGEN, NACH BADEZIMMERGRÖSSE, 2018–2032 (TAUSEND USD)
TABELLE 231 NIEDERLÄNDISCHER MARKT FÜR DUSCHKABINEN UND -ABTRENNUNGEN, NACH DUSCHTYP, 2018–2032 (TAUSEND USD)
TABELLE 232 NIEDERLÄNDISCHER MARKT FÜR DUSCHKABINEN UND -ABTRENNUNGEN, NACH TÜRTYP, 2018–2032 (TAUSEND USD)
TABELLE 233 NIEDERLÄNDISCHER MARKT FÜR DUSCHKABINEN UND -ABTRENNUNGEN, NACH FORM, 2018–2032 (TAUSEND USD)
TABELLE 234 NIEDERLÄNDISCHER MARKT FÜR DUSCHKABINEN UND -ABTRENNUNGEN, NACH INSTALLATION, 2018–2032 (TAUSEND USD)
TABELLE 235 NIEDERLÄNDISCHER MARKT FÜR DUSCHKABINEN UND -ABTRENNUNGEN, NACH AUSFÜHRUNG, 2018–2032 (TAUSEND USD)
TABELLE 236 NIEDERLÄNDISCHER MARKT FÜR DUSCHKABINEN UND -ABTRENNUNGEN, NACH LÄNGE, 2018–2032 (TAUSEND USD)
TABELLE 237 NIEDERLÄNDISCHER MARKT FÜR DUSCHKABINEN UND -ABTRENNUNGEN, NACH BREITE, 2018–2032 (TAUSEND USD)
TABELLE 238 NIEDERLÄNDISCHER MARKT FÜR DUSCHKABINEN UND -ABTRENNUNGEN, NACH HÖHE, 2018–2032 (TAUSEND USD)
TABELLE 239 NIEDERLÄNDISCHER MARKT FÜR DUSCHKABINEN UND -ABTRENNUNGEN, NACH PREISKLASSE, 2018–2032 (TAUSEND USD)
TABELLE 240 NIEDERLÄNDISCHER MARKT FÜR DUSCHKABINEN UND -ABTRENNUNGEN, NACH ANPASSUNG, 2018–2032 (TAUSEND USD)
TABELLE 241 NIEDERLÄNDISCHER MARKT FÜR DUSCHKABINEN UND -ABTRENNUNGEN, NACH ANWENDUNG, 2018–2032 (TAUSEND USD)
TABELLE 242 NIEDERLANDE – GEWERBLICHER MARKT FÜR DUSCHKABINEN UND -ABTRENNUNGEN, NACH KATEGORIE, 2018–2032 (TAUSEND USD)
TABELLE 243 NIEDERLÄNDISCHER MARKT FÜR DUSCHKABINEN UND -ABTRENNUNGEN, NACH ZWECK, 2018–2032 (TAUSEND USD)
TABELLE 244 NIEDERLÄNDISCHER MARKT FÜR DUSCHKABINEN UND -ABTRENNUNGEN, NACH VERTRIEBSKANAL, 2018–2032 (TAUSEND USD)
TABELLE 245: INDIREKTE VERKÄUFE IN DEN NIEDERLANDEN AUF DEM MARKT FÜR DUSCHKABINEN UND -ABTRENNUNGEN, NACH VERTRIEBSKANAL, 2018–2032 (TAUSEND USD)
TABELLE 246 NIEDERLANDE OFFLINE IM MARKT FÜR DUSCHKABINEN UND -ABTRENNUNGEN, NACH VERTRIEBSKANAL, 2018–2032 (TAUSEND USD)
TABELLE 247 NIEDERLANDE ONLINE IM MARKT FÜR DUSCHKABINEN UND -ABTRENNUNGEN, NACH VERTRIEBSKANAL, 2018-2032 (TAUSEND USD)
TABELLE 248 SCHWEDEN: MARKT FÜR DUSCHKABINEN UND -ABTRENNUNGEN, NACH MATERIAL, 2018–2032 (TAUSEND USD)
TABELLE 249 SCHWEDEN: MARKT FÜR DUSCHKABINEN UND -ABTRENNUNGEN, NACH MATERIAL, 2018–2032 (TAUSEND EINHEITEN)
TABELLE 250 SCHWEDEN: MARKT FÜR GLAS IN DUSCHKABINEN UND -ABTRENNUNGEN, NACH TYP, 2018–2032 (TAUSEND USD)
TABELLE 251 SCHWEDEN – METALLMARKT FÜR DUSCHKABINEN UND -ABTRENNUNGEN, NACH TYP, 2018–2032 (TAUSEND USD)
TABELLE 252 SCHWEDEN MARKT FÜR DUSCHKABINEN UND -ABTRENNUNGEN, NACH BADEZIMMERGRÖSSE, 2018–2032 (TAUSEND USD)
TABELLE 253 SCHWEDEN: MARKT FÜR DUSCHKABINEN UND -ABTRENNUNGEN, NACH DUSCHTYP, 2018–2032 (TAUSEND USD)
TABELLE 254 SCHWEDEN MARKT FÜR DUSCHKABINEN UND -ABTRENNUNGEN, NACH TÜRTYP, 2018–2032 (TAUSEND USD)
TABELLE 255 SCHWEDEN MARKT FÜR DUSCHKABINEN UND -ABTRENNUNGEN, NACH FORM, 2018–2032 (TAUSEND USD)
TABELLE 256 SCHWEDEN MARKT FÜR DUSCHKABINEN UND -ABTRENNUNGEN, NACH INSTALLATION, 2018–2032 (TAUSEND USD)
TABELLE 257 SCHWEDEN: MARKT FÜR DUSCHKABINEN UND -ABTRENNUNGEN, NACH AUSFÜHRUNG, 2018–2032 (TAUSEND USD)
TABELLE 258 SCHWEDEN MARKT FÜR DUSCHKABINEN UND -ABTRENNUNGEN, NACH LÄNGE, 2018–2032 (TAUSEND USD)
TABELLE 259 SCHWEDEN MARKT FÜR DUSCHKABINEN UND -ABTRENNUNGEN, NACH BREITE, 2018–2032 (TAUSEND USD)
TABELLE 260 SCHWEDEN MARKT FÜR DUSCHKABINEN UND -ABTRENNUNGEN, NACH HÖHE, 2018–2032 (TAUSEND USD)
TABELLE 261 SCHWEDEN MARKT FÜR DUSCHKABINEN UND -ABTRENNUNGEN, NACH PREISKLASSE, 2018–2032 (TAUSEND USD)
TABELLE 262 SCHWEDEN MARKT FÜR DUSCHKABINEN UND -ABTRENNUNGEN, NACH ANPASSUNG, 2018–2032 (TAUSEND USD)
TABELLE 263 SCHWEDEN MARKT FÜR DUSCHKABINEN UND -ABTRENNUNGEN, NACH ANWENDUNG, 2018–2032 (TAUSEND USD)
TABELLE 264 – SCHWEDEN – GEWERBLICHER MARKT FÜR DUSCHKABINEN UND -ABTRENNUNGEN, NACH KATEGORIE, 2018–2032 (TAUSEND USD)
TABELLE 265 SCHWEDEN MARKT FÜR DUSCHKABINEN UND -ABTRENNUNGEN, NACH ZWECK, 2018–2032 (TAUSEND USD)
TABELLE 266 SCHWEDEN MARKT FÜR DUSCHKABINEN UND -ABTRENNUNGEN, NACH VERTRIEBSKANAL, 2018–2032 (TAUSEND USD)
TABELLE 267 INDIREKTE VERKÄUFE IN SCHWEDEN AUF DEM MARKT FÜR DUSCHKABINEN UND -ABTRENNUNGEN, NACH VERTRIEBSKANAL, 2018–2032 (TAUSEND USD)
TABELLE 268 SCHWEDEN OFFLINE AUF DEM MARKT FÜR DUSCHKABINEN UND -ABTRENNUNGEN, NACH VERTRIEBSKANAL, 2018–2032 (TAUSEND USD)
TABELLE 269 SCHWEDEN ONLINE AUF DEM MARKT FÜR DUSCHKABINEN UND -ABTRENNUNGEN, NACH VERTRIEBSKANAL, 2018–2032 (TAUSEND USD)
TABELLE 270 LUXEMBURGISCHER MARKT FÜR DUSCHKABINEN UND -ABTRENNUNGEN, NACH MATERIAL, 2018–2032 (TAUSEND USD)
TABELLE 271 LUXEMBURGISCHER MARKT FÜR DUSCHKABINEN UND -ABTRENNUNGEN, NACH MATERIAL, 2018–2032 (TAUSEND EINHEITEN)
TABELLE 272 LUXEMBURGISCHER MARKT FÜR GLAS IN DUSCHKABINEN UND -ABTRENNUNGEN, NACH TYP, 2018–2032 (TAUSEND USD)
TABELLE 273 LUXEMBURGISCHER MARKT FÜR METALL IN DUSCHKABINEN UND -ABTRENNUNGEN, NACH TYP, 2018–2032 (TAUSEND USD)
TABELLE 274 LUXEMBURGISCHER MARKT FÜR DUSCHKABINEN UND -ABTRENNUNGEN, NACH BADEZIMMERGRÖSSE, 2018–2032 (TAUSEND USD)
TABELLE 275 LUXEMBURGISCHER MARKT FÜR DUSCHKABINEN UND -ABTRENNUNGEN, NACH DUSCHTYP, 2018–2032 (TAUSEND USD)
TABELLE 276 LUXEMBURGISCHER MARKT FÜR DUSCHKABINEN UND -ABTRENNUNGEN, NACH TÜRTYP, 2018–2032 (TAUSEND USD)
TABELLE 277 LUXEMBURGISCHER MARKT FÜR DUSCHKABINEN UND -ABTRENNUNGEN, NACH FORM, 2018–2032 (TAUSEND USD)
TABELLE 278 LUXEMBURGISCHER MARKT FÜR DUSCHKABINEN UND -ABTRENNUNGEN, NACH INSTALLATION, 2018–2032 (TAUSEND USD)
TABELLE 279 LUXEMBURGISCHER MARKT FÜR DUSCHKABINEN UND -ABTRENNUNGEN, NACH AUSFÜHRUNG, 2018–2032 (TAUSEND USD)
TABELLE 280 LUXEMBURGISCHER MARKT FÜR DUSCHKABINEN UND -ABTRENNUNGEN, NACH LÄNGE, 2018–2032 (TAUSEND USD)
TABELLE 281 LUXEMBURGISCHER MARKT FÜR DUSCHKABINEN UND -ABTRENNUNGEN, NACH BREITE, 2018–2032 (TAUSEND USD)
TABELLE 282 LUXEMBURGISCHER MARKT FÜR DUSCHKABINEN UND -ABTRENNUNGEN, NACH HÖHE, 2018–2032 (TAUSEND USD)
TABELLE 283 LUXEMBURGISCHER MARKT FÜR DUSCHKABINEN UND -ABTRENNUNGEN, NACH PREISKLASSE, 2018–2032 (TAUSEND USD)
TABELLE 284 LUXEMBURGISCHER MARKT FÜR DUSCHKABINEN UND -ABTRENNUNGEN, NACH ANPASSUNG, 2018–2032 (TAUSEND USD)
TABELLE 285 LUXEMBURGISCHER MARKT FÜR DUSCHKABINEN UND -ABTRENNUNGEN, NACH ANWENDUNG, 2018–2032 (TAUSEND USD)
TABELLE 286 LUXEMBURGISCHER MARKT FÜR GEWERBLICHE DUSCHKABINEN UND -ABTRENNUNGEN, NACH KATEGORIE, 2018–2032 (TAUSEND USD)
TABELLE 287 LUXEMBURGISCHER MARKT FÜR DUSCHKABINEN UND -ABTRENNUNGEN, NACH ZWECK, 2018–2032 (TAUSEND USD)
TABELLE 288 LUXEMBURGISCHER MARKT FÜR DUSCHKABINEN UND -ABTRENNUNGEN, NACH VERTRIEBSKANAL, 2018–2032 (TAUSEND USD)
TABELLE 289 LUXEMBURGISCHER INDIREKTER UMSATZ AUF DEM MARKT FÜR DUSCHKABINEN UND -ABTRENNUNGEN, NACH VERTRIEBSKANAL, 2018–2032 (TAUSEND USD)
TABELLE 290 LUXEMBURG OFFLINE IM MARKT FÜR DUSCHKABINEN UND -ABTRENNUNGEN, NACH VERTRIEBSKANAL, 2018–2032 (TAUSEND USD)
TABELLE 291 LUXEMBURG ONLINE IM MARKT FÜR DUSCHKABINEN UND -ABTRENNUNGEN, NACH VERTRIEBSKANAL, 2018–2032 (TAUSEND USD)
TABELLE 292 NORWEGEN: MARKT FÜR DUSCHKABINEN UND -ABTRENNUNGEN, NACH MATERIAL, 2018–2032 (TAUSEND USD)
TABELLE 293 NORWEGEN: MARKT FÜR DUSCHKABINEN UND -ABTRENNUNGEN, NACH MATERIAL, 2018–2032 (TAUSEND EINHEITEN)
TABELLE 294 NORWEGEN – MARKT FÜR GLAS IN DUSCHKABINEN UND -ABTRENNUNGEN, NACH TYP, 2018–2032 (TAUSEND USD)
TABELLE 295 – NORWEGEN: METALL IM MARKT FÜR DUSCHKABINEN UND -ABTRENNUNGEN, NACH TYP, 2018–2032 (TAUSEND USD)
TABELLE 296 NORWEGEN: MARKT FÜR DUSCHKABINEN UND -ABTRENNUNGEN, NACH BADEZIMMERGRÖSSE, 2018–2032 (TAUSEND USD)
TABELLE 297 NORWEGEN: MARKT FÜR DUSCHKABINEN UND -ABTRENNUNGEN, NACH DUSCHTYP, 2018–2032 (TAUSEND USD)
TABELLE 298 NORWEGEN: MARKT FÜR DUSCHKABINEN UND -ABTRENNUNGEN, NACH TÜRTYP, 2018–2032 (TAUSEND USD)
TABELLE 299 NORWEGEN: MARKT FÜR DUSCHKABINEN UND -ABTRENNUNGEN, NACH FORM, 2018–2032 (TAUSEND USD)
TABELLE 300 NORWEGEN: MARKT FÜR DUSCHKABINEN UND -ABTRENNUNGEN, NACH INSTALLATION, 2018–2032 (TAUSEND USD)
TABELLE 301 NORWEGEN: MARKT FÜR DUSCHKABINEN UND -ABTRENNUNGEN, NACH AUSFÜHRUNG, 2018–2032 (TAUSEND USD)
TABELLE 302 NORWEGEN: MARKT FÜR DUSCHKABINEN UND -ABTRENNUNGEN, NACH LÄNGE, 2018–2032 (TAUSEND USD)
TABELLE 303 NORWEGEN: MARKT FÜR DUSCHKABINEN UND -ABTRENNUNGEN, NACH BREITE, 2018–2032 (TAUSEND USD)
TABELLE 304 NORWEGEN: MARKT FÜR DUSCHKABINEN UND -ABTRENNUNGEN, NACH HÖHE, 2018–2032 (TAUSEND USD)
TABELLE 305: NORWEGEN: MARKT FÜR DUSCHKABINEN UND -ABTRENNUNGEN, NACH PREISKLASSE, 2018–2032 (TAUSEND USD)
TABELLE 306 NORWEGEN: MARKT FÜR DUSCHKABINEN UND -ABTRENNUNGEN, NACH ANPASSUNG, 2018–2032 (TAUSEND USD)
TABELLE 307 NORWEGEN: MARKT FÜR DUSCHKABINEN UND -ABTRENNUNGEN, NACH ANWENDUNG, 2018–2032 (TAUSEND USD)
TABELLE 308 NORWEGEN – GEWERBLICHER MARKT FÜR DUSCHKABINEN UND -ABTRENNUNGEN, NACH KATEGORIE, 2018–2032 (TAUSEND USD)
TABELLE 309 NORWEGEN: MARKT FÜR DUSCHKABINEN UND -ABTRENNUNGEN, NACH ZWECK, 2018–2032 (TAUSEND USD)
TABELLE 310: NORWEGEN: MARKT FÜR DUSCHKABINEN UND -ABTRENNUNGEN, NACH VERTRIEBSKANAL, 2018–2032 (TAUSEND USD)
TABELLE 311 NORWEGEN INDIREKTE VERKÄUFE AUF DEM MARKT FÜR DUSCHKABINEN UND -ABTRENNUNGEN, NACH VERTRIEBSKANAL, 2018–2032 (TAUSEND USD)
TABELLE 312 NORWEGEN OFFLINE IM MARKT FÜR DUSCHKABINEN UND -ABTRENNUNGEN, NACH VERTRIEBSKANAL, 2018–2032 (TAUSEND USD)
TABELLE 313 NORWEGEN ONLINE AUF DEM MARKT FÜR DUSCHKABINEN UND -ABTRENNUNGEN, NACH VERTRIEBSKANAL, 2018–2032 (TAUSEND USD)
TABELLE 314: FINNISCHER MARKT FÜR DUSCHKABINEN UND -ABTRENNUNGEN, NACH MATERIAL, 2018–2032 (TAUSEND USD)
TABELLE 315: FINNISCHER MARKT FÜR DUSCHKABINEN UND -ABTRENNUNGEN, NACH MATERIAL, 2018–2032 (TAUSEND EINHEITEN)
TABELLE 316 FINNLAND: MARKT FÜR GLAS IN DUSCHKABINEN UND -ABTRENNUNGEN, NACH TYP, 2018–2032 (TAUSEND USD)
TABELLE 317 FINNLAND – METALLMARKT FÜR DUSCHKABINEN UND -ABTRENNUNGEN, NACH TYP, 2018–2032 (TAUSEND USD)
TABELLE 318 FINNLAND: MARKT FÜR DUSCHKABINEN UND -ABTRENNUNGEN, NACH BADEZIMMERGRÖSSE, 2018–2032 (TAUSEND USD)
TABELLE 319 FINNLAND: MARKT FÜR DUSCHKABINEN UND -ABTRENNUNGEN, NACH DUSCHTYP, 2018–2032 (TAUSEND USD)
TABELLE 320 FINNLAND: MARKT FÜR DUSCHKABINEN UND -ABTRENNUNGEN, NACH TÜRTYP, 2018–2032 (TAUSEND USD)
TABELLE 321 FINNLAND: MARKT FÜR DUSCHKABINEN UND -ABTRENNUNGEN, NACH FORM, 2018–2032 (TAUSEND USD)
TABELLE 322 FINNLAND MARKT FÜR DUSCHKABINEN UND -ABTRENNUNGEN, NACH INSTALLATION, 2018–2032 (TAUSEND USD)
TABELLE 323 FINNLAND: MARKT FÜR DUSCHKABINEN UND -ABTRENNUNGEN, NACH OBERFLÄCHE, 2018–2032 (TAUSEND USD)
TABELLE 324 FINNLAND MARKT FÜR DUSCHKABINEN UND -ABTRENNUNGEN, NACH LÄNGE, 2018–2032 (TAUSEND USD)
TABELLE 325: FINNISCHER MARKT FÜR DUSCHKABINEN UND -ABTRENNUNGEN, NACH BREITE, 2018–2032 (TAUSEND USD)
TABELLE 326: FINNISCHER MARKT FÜR DUSCHKABINEN UND -ABTRENNUNGEN, NACH GRÖSSE, 2018–2032 (TAUSEND USD)
TABELLE 327 FINNLAND: MARKT FÜR DUSCHKABINEN UND -ABTRENNUNGEN, NACH PREISKLASSE, 2018–2032 (TAUSEND USD)
TABELLE 328 FINNLAND: MARKT FÜR DUSCHKABINEN UND -ABTRENNUNGEN, NACH ANPASSUNG, 2018–2032 (TAUSEND USD)
TABELLE 329 FINNLAND: MARKT FÜR DUSCHKABINEN UND -ABTRENNUNGEN, NACH ANWENDUNG, 2018–2032 (TAUSEND USD)
TABELLE 330: FINNLAND – GEWERBLICHER MARKT FÜR DUSCHKABINEN UND -ABTRENNUNGEN, NACH KATEGORIE, 2018–2032 (TAUSEND USD)
TABELLE 331 FINNLAND: MARKT FÜR DUSCHKABINEN UND -ABTRENNUNGEN, NACH ZWECK, 2018–2032 (TAUSEND USD)
TABELLE 332 FINNLAND: MARKT FÜR DUSCHKABINEN UND -ABTRENNUNGEN, NACH VERTRIEBSKANAL, 2018–2032 (TAUSEND USD)
TABELLE 333 INDIREKTE VERKÄUFE IN FINNLAND AUF DEM MARKT FÜR DUSCHKABINEN UND -ABTRENNUNGEN, NACH VERTRIEBSKANAL, 2018–2032 (TAUSEND USD)
TABELLE 334 FINNLAND OFFLINE IM MARKT FÜR DUSCHKABINEN UND -ABTRENNUNGEN, NACH VERTRIEBSKANAL, 2018–2032 (TAUSEND USD)
TABELLE 335: FINNLAND ONLINE AUF DEM MARKT FÜR DUSCHKABINEN UND -ABTRENNUNGEN, NACH VERTRIEBSKANAL, 2018–2032 (TAUSEND USD)
TABELLE 336 DÄNEMARK MARKT FÜR DUSCHKABINEN UND -ABTRENNUNGEN, NACH MATERIAL, 2018–2032 (TAUSEND USD)
TABELLE 337 DÄNEMARK MARKT FÜR DUSCHKABINEN UND -ABTRENNUNGEN, NACH MATERIAL, 2018–2032 (TAUSEND EINHEITEN)
TABELLE 338 DÄNEMARK: MARKT FÜR GLAS IN DUSCHKABINEN UND -ABTRENNUNGEN, NACH TYP, 2018–2032 (TAUSEND USD)
TABELLE 339 DÄNEMARK – MARKT FÜR METALL IN DUSCHKABINEN UND -ABTRENNUNGEN, NACH TYP, 2018–2032 (TAUSEND USD)
TABELLE 340 DÄNEMARK: MARKT FÜR DUSCHKABINEN UND -ABTRENNUNGEN, NACH BADEZIMMERGRÖSSE, 2018–2032 (TAUSEND USD)
TABELLE 341 DÄNEMARK MARKT FÜR DUSCHKABINEN UND -ABTRENNUNGEN, NACH DUSCHTYP, 2018–2032 (TAUSEND USD)
TABELLE 342 DÄNEMARK MARKT FÜR DUSCHKABINEN UND -ABTRENNUNGEN, NACH TÜRTYP, 2018–2032 (TAUSEND USD)
TABELLE 343 DÄNEMARK MARKT FÜR DUSCHKABINEN UND -ABTRENNUNGEN, NACH FORM, 2018–2032 (TAUSEND USD)
TABELLE 344 DÄNEMARK MARKT FÜR DUSCHKABINEN UND -ABTRENNUNGEN, NACH INSTALLATION, 2018–2032 (TAUSEND USD)
TABELLE 345 DÄNEMARK MARKT FÜR DUSCHKABINEN UND -ABTRENNUNGEN, NACH AUSFÜHRUNG, 2018–2032 (TAUSEND USD)
TABELLE 346 DÄNEMARK MARKT FÜR DUSCHKABINEN UND -ABTRENNUNGEN, NACH LÄNGE, 2018–2032 (TAUSEND USD)
TABELLE 347 DÄNEMARK MARKT FÜR DUSCHKABINEN UND -ABTRENNUNGEN, NACH BREITE, 2018–2032 (TAUSEND USD)
TABELLE 348 DÄNEMARK MARKT FÜR DUSCHKABINEN UND -ABTRENNUNGEN, NACH HÖHE, 2018–2032 (TAUSEND USD)
TABELLE 349 DÄNEMARK MARKT FÜR DUSCHKABINEN UND -ABTRENNUNGEN, NACH PREISKLASSE, 2018–2032 (TAUSEND USD)
TABELLE 350 DÄNEMARK MARKT FÜR DUSCHKABINEN UND -ABTRENNUNGEN, NACH ANPASSUNG, 2018-2032 (TAUSEND USD)
TABELLE 351 DÄNEMARK MARKT FÜR DUSCHKABINEN UND -ABTRENNUNGEN, NACH ANWENDUNG, 2018–2032 (TAUSEND USD)
TABELLE 352 DÄNEMARK – GEWERBLICHER MARKT FÜR DUSCHKABINEN UND -ABTRENNUNGEN, NACH KATEGORIE, 2018–2032 (TAUSEND USD)
TABELLE 353 DÄNEMARK MARKT FÜR DUSCHKABINEN UND -ABTRENNUNGEN, NACH ZWECK, 2018–2032 (TAUSEND USD)
TABELLE 354 DÄNEMARK MARKT FÜR DUSCHKABINEN UND -ABTRENNUNGEN, NACH VERTRIEBSKANAL, 2018–2032 (TAUSEND USD)
TABELLE 355 DÄNEMARK: INDIREKTE VERKÄUFE AUF DEM MARKT FÜR DUSCHKABINEN UND -ABTRENNUNGEN, NACH VERTRIEBSKANAL, 2018–2032 (TAUSEND USD)
TABELLE 356 DÄNEMARK OFFLINE IM MARKT FÜR DUSCHKABINEN UND -ABTRENNUNGEN, NACH VERTRIEBSKANAL, 2018–2032 (TAUSEND USD)
TABELLE 357 DÄNEMARK ONLINE IM MARKT FÜR DUSCHKABINEN UND -ABTRENNUNGEN, NACH VERTRIEBSKANAL, 2018–2032 (TAUSEND USD)
TABELLE 358 POLEN: MARKT FÜR DUSCHKABINEN UND -ABTRENNUNGEN, NACH MATERIAL, 2018–2032 (TAUSEND USD)
TABELLE 359 POLEN: MARKT FÜR DUSCHKABINEN UND -ABTRENNUNGEN, NACH MATERIAL, 2018–2032 (TAUSEND EINHEITEN)
TABELLE 360 POLEN: MARKT FÜR GLAS IN DUSCHKABINEN UND -ABTRENNUNGEN, NACH TYP, 2018–2032 (TAUSEND USD)
TABELLE 361 POLEN – MARKT FÜR METALL IN DUSCHKABINEN UND -ABTRENNUNGEN, NACH TYP, 2018–2032 (TAUSEND USD)
TABELLE 362 POLEN: MARKT FÜR DUSCHKABINEN UND -ABTRENNUNGEN, NACH BADEZIMMERGRÖSSE, 2018–2032 (TAUSEND USD)
TABELLE 363 POLEN: MARKT FÜR DUSCHKABINEN UND -ABTRENNUNGEN, NACH DUSCHTYP, 2018–2032 (TAUSEND USD)
TABELLE 364 POLEN: MARKT FÜR DUSCHKABINEN UND -ABTRENNUNGEN, NACH TÜRTYP, 2018–2032 (TAUSEND USD)
TABELLE 365: POLEN, MARKT FÜR DUSCHKABINEN UND -ABTRENNUNGEN, NACH FORM, 2018–2032 (TAUSEND USD)
TABELLE 366 POLEN: MARKT FÜR DUSCHKABINEN UND -ABTRENNUNGEN, NACH INSTALLATION, 2018–2032 (TAUSEND USD)
TABELLE 367 POLEN: MARKT FÜR DUSCHKABINEN UND -ABTRENNUNGEN, NACH AUSFÜHRUNG, 2018–2032 (TAUSEND USD)
TABELLE 368 POLEN: MARKT FÜR DUSCHKABINEN UND -ABTRENNUNGEN, NACH LÄNGE, 2018–2032 (TAUSEND USD)
TABELLE 369 POLEN: MARKT FÜR DUSCHKABINEN UND -ABTRENNUNGEN, NACH BREITE, 2018–2032 (TAUSEND USD)
TABELLE 370 POLEN: MARKT FÜR DUSCHKABINEN UND -ABTRENNUNGEN, NACH GRÖSSE, 2018–2032 (TAUSEND USD)
TABELLE 371 POLEN: MARKT FÜR DUSCHKABINEN UND -ABTRENNUNGEN, NACH PREISKLASSE, 2018–2032 (TAUSEND USD)
TABELLE 372 POLEN: MARKT FÜR DUSCHKABINEN UND -ABTRENNUNGEN, NACH ANPASSUNG, 2018–2032 (TAUSEND USD)
TABELLE 373 POLEN MARKT FÜR DUSCHKABINEN UND -ABTRENNUNGEN, NACH ANWENDUNG, 2018–2032 (TAUSEND USD)
TABELLE 374 POLEN – GEWERBLICHER MARKT FÜR DUSCHKABINEN UND -ABTRENNUNGEN, NACH KATEGORIE, 2018–2032 (TAUSEND USD)
TABELLE 375 POLEN: MARKT FÜR DUSCHKABINEN UND -ABTRENNUNGEN, NACH ZWECK, 2018–2032 (TAUSEND USD)
TABELLE 376 POLEN: MARKT FÜR DUSCHKABINEN UND -ABTRENNUNGEN, NACH VERTRIEBSKANAL, 2018–2032 (TAUSEND USD)
TABELLE 377 POLEN INDIREKTE VERKÄUFE AUF DEM MARKT FÜR DUSCHKABINEN UND -ABTRENNUNGEN, NACH VERTRIEBSKANAL, 2018–2032 (TAUSEND USD)
TABELLE 378 POLEN OFFLINE AUF DEM MARKT FÜR DUSCHKABINEN UND -ABTRENNUNGEN, NACH VERTRIEBSKANAL, 2018–2032 (TAUSEND USD)
TABELLE 379 POLEN ONLINE AUF DEM MARKT FÜR DUSCHKABINEN UND -ABTRENNUNGEN, NACH VERTRIEBSKANAL, 2018–2032 (TAUSEND USD)
TABELLE 380 ÜBRIGER MARKT FÜR DUSCHKABINEN UND -ABTRENNUNGEN IN EUROPA, NACH MATERIAL, 2018–2032 (TAUSEND USD)
TABELLE 381 ÜBRIGER MARKT FÜR DUSCHKABINEN UND -ABTRENNUNGEN IN EUROPA, NACH MATERIAL, 2018–2032 (TAUSEND EINHEITEN)
Abbildungsverzeichnis
ABBILDUNG 1: EUROPÄISCHER MARKT FÜR DUSCHKABINEN UND -ABTRENNUNGEN
ABBILDUNG 2 EUROPÄISCHER MARKT FÜR DUSCHKABINEN UND -ABTRENNUNGEN: DATENTRIANGULATION
ABBILDUNG 3 EUROPÄISCHER MARKT FÜR DUSCHKABINEN UND -ABTRENNUNGEN: DROC-ANALYSE
ABBILDUNG 4 EUROPÄISCHER MARKT FÜR DUSCHKABINEN UND -ABTRENNUNGEN: EUROPA IM VERGLEICH ZUR REGIONALEN MARKTANALYSE
ABBILDUNG 5 EUROPÄISCHER MARKT FÜR DUSCHKABINEN UND -ABTRENNUNGEN: UNTERNEHMENSFORSCHUNGSANALYSE
ABBILDUNG 6 EUROPÄISCHER MARKT FÜR DUSCHKABINEN UND -ABTRENNUNGEN: MULTIVARIATE MODELLIERUNG
ABBILDUNG 7 EUROPÄISCHER MARKT FÜR DUSCHKABINEN UND -ABTRENNUNGEN: DEMOGRAFISCHE INTERVIEWS
ABBILDUNG 8 EUROPÄISCHER MARKT FÜR DUSCHKABINEN UND -ABTRENNUNGEN: DBMR-MARKTPOSITIONSRASTER
ABBILDUNG 9 EUROPÄISCHER MARKT FÜR DUSCHKABINEN UND -ABTRENNUNGEN: MARKTANWENDUNGS-ABDECKUNGSRASTER
ABBILDUNG 10 EUROPÄISCHER MARKT FÜR DUSCHKABINEN UND -ABTRENNUNGEN: ANALYSE DER ANBIETERANTEILE
ABBILDUNG 11 EUROPÄISCHER MARKT FÜR DUSCHKABINEN UND -ABTRENNUNGEN: SEGMENTIERUNG
ABBILDUNG 12 EUROPÄISCHER MARKT FÜR DUSCHKABINEN UND -ABTRENNUNGEN: NACH MATERIAL
ABBILDUNG 13 EUROPÄISCHER MARKT FÜR DUSCHKABINEN UND -ABTRENNUNGEN: ZUSAMMENFASSUNG
ABBILDUNG 14: DIE STEIGENDE NACHFRAGE NACH PREMIUM- UND LUXUSBADEZIMMERN WIRD DEN EUROPÄISCHEN MARKT FÜR DUSCHKABINEN UND -ABTRENNUNGEN IM PROGNOSEZEITRAUM VORAUSSICHTLICH ANTREIBEN
ABBILDUNG 15: DAS GLASSEGMENT WIRD IN DEN JAHREN 2025 UND 2032 ERWARTET, DASS ES DEN GRÖSSTEN ANTEIL AM EUROPÄISCHEN MARKT FÜR DUSCHKABINEN UND -ABTRENNUNGEN AUSMACHEN WIRD
ABBILDUNG 16 PORTERS FÜNF-KRÄFTE-ANALYSE
ABBILDUNG 17 IMPORT-EXPORT-SZENARIO (TAUSEND USD)
ABBILDUNG 18 EUROPÄISCHER MARKT FÜR DUSCHKABINEN UND -ABTRENNUNGEN, 2018–2032, DURCHSCHNITTLICHER VERKAUFSPREIS (USD/EINHEIT)
ABBILDUNG 19 TREIBER, EINSCHRÄNKUNGEN, CHANCEN UND HERAUSFORDERUNGEN FÜR DEN EUROPÄISCHEN MARKT FÜR DUSCHKABINEN UND -ABTRENNUNGEN
ABBILDUNG 20 EUROPÄISCHER MARKT FÜR DUSCHKABINEN UND -ABTRENNUNGEN: NACH MATERIAL, 2024
ABBILDUNG 21 EUROPÄISCHER MARKT FÜR DUSCHKABINEN UND -ABTRENNUNGEN: NACH BADEZIMMERGRÖSSE, 2024
ABBILDUNG 22 EUROPÄISCHER MARKT FÜR DUSCHKABINEN UND -ABTRENNUNGEN: NACH DUSCHTYP, 2024
ABBILDUNG 23 EUROPÄISCHER MARKT FÜR DUSCHKABINEN UND -ABTRENNUNGEN: NACH TÜRTYP, 2024
ABBILDUNG 24 EUROPÄISCHER MARKT FÜR DUSCHKABINEN UND -ABTRENNUNGEN: NACH FORM, 2024
ABBILDUNG 25 EUROPÄISCHER MARKT FÜR DUSCHKABINEN UND -ABTRENNUNGEN: NACH INSTALLATION, 2024
ABBILDUNG 26 EUROPÄISCHER MARKT FÜR DUSCHKABINEN UND -ABTRENNUNGEN: NACH FINISH, 2024
ABBILDUNG 27 EUROPÄISCHER MARKT FÜR DUSCHKABINEN UND -ABTRENNUNGEN: NACH LÄNGE, 2024
ABBILDUNG 28 EUROPÄISCHER MARKT FÜR DUSCHKABINEN UND -ABTRENNUNGEN: NACH BREITE, 2024
ABBILDUNG 29 EUROPÄISCHER MARKT FÜR DUSCHKABINEN UND -ABTRENNUNGEN: NACH HÖHE, 2024
ABBILDUNG 30 EUROPÄISCHER MARKT FÜR DUSCHKABINEN UND -ABTRENNUNGEN: NACH PREISKLASSE, 2024
ABBILDUNG 31 EUROPÄISCHER MARKT FÜR DUSCHKABINEN UND -ABTRENNUNGEN: NACH ANPASSUNG, 2024
ABBILDUNG 32 EUROPÄISCHER MARKT FÜR DUSCHKABINEN UND -ABTRENNUNGEN: NACH ANWENDUNG, 2024
ABBILDUNG 33 EUROPÄISCHER MARKT FÜR DUSCHKABINEN UND -ABTRENNUNGEN: NACH ZWECK, 2024
ABBILDUNG 34 EUROPÄISCHER MARKT FÜR DUSCHKABINEN UND -ABTRENNUNGEN: NACH VERTRIEBSKANAL, 2024
ABBILDUNG 35 EUROPÄISCHER MARKT FÜR DUSCHKABINEN UND -ABTRENNUNGEN: ÜBERSICHT (2024)
ABBILDUNG 36 EUROPÄISCHER MARKT FÜR DUSCHKABINEN UND -SCHRÄNKE: UNTERNEHMENSANTEIL 2024 (%)
Forschungsmethodik
Die Datenerfassung und Basisjahresanalyse werden mithilfe von Datenerfassungsmodulen mit großen Stichprobengrößen durchgeführt. Die Phase umfasst das Erhalten von Marktinformationen oder verwandten Daten aus verschiedenen Quellen und Strategien. Sie umfasst die Prüfung und Planung aller aus der Vergangenheit im Voraus erfassten Daten. Sie umfasst auch die Prüfung von Informationsinkonsistenzen, die in verschiedenen Informationsquellen auftreten. Die Marktdaten werden mithilfe von marktstatistischen und kohärenten Modellen analysiert und geschätzt. Darüber hinaus sind Marktanteilsanalyse und Schlüsseltrendanalyse die wichtigsten Erfolgsfaktoren im Marktbericht. Um mehr zu erfahren, fordern Sie bitte einen Analystenanruf an oder geben Sie Ihre Anfrage ein.
Die wichtigste Forschungsmethodik, die vom DBMR-Forschungsteam verwendet wird, ist die Datentriangulation, die Data Mining, die Analyse der Auswirkungen von Datenvariablen auf den Markt und die primäre (Branchenexperten-)Validierung umfasst. Zu den Datenmodellen gehören ein Lieferantenpositionierungsraster, eine Marktzeitlinienanalyse, ein Marktüberblick und -leitfaden, ein Firmenpositionierungsraster, eine Patentanalyse, eine Preisanalyse, eine Firmenmarktanteilsanalyse, Messstandards, eine globale versus eine regionale und Lieferantenanteilsanalyse. Um mehr über die Forschungsmethodik zu erfahren, senden Sie eine Anfrage an unsere Branchenexperten.
Anpassung möglich
Data Bridge Market Research ist ein führendes Unternehmen in der fortgeschrittenen formativen Forschung. Wir sind stolz darauf, unseren bestehenden und neuen Kunden Daten und Analysen zu bieten, die zu ihren Zielen passen. Der Bericht kann angepasst werden, um Preistrendanalysen von Zielmarken, Marktverständnis für zusätzliche Länder (fordern Sie die Länderliste an), Daten zu klinischen Studienergebnissen, Literaturübersicht, Analysen des Marktes für aufgearbeitete Produkte und Produktbasis einzuschließen. Marktanalysen von Zielkonkurrenten können von technologiebasierten Analysen bis hin zu Marktportfoliostrategien analysiert werden. Wir können so viele Wettbewerber hinzufügen, wie Sie Daten in dem von Ihnen gewünschten Format und Datenstil benötigen. Unser Analystenteam kann Ihnen auch Daten in groben Excel-Rohdateien und Pivot-Tabellen (Fact Book) bereitstellen oder Sie bei der Erstellung von Präsentationen aus den im Bericht verfügbaren Datensätzen unterstützen.

