Global Effervescent Tablet Market
Marktgröße in Milliarden USD
CAGR :
% 
 USD
9.78 Billion
USD
19.06 Billion
2023
2031
USD
9.78 Billion
USD
19.06 Billion
2023
2031
| 2024 –2031 | |
| USD 9.78 Billion | |
| USD 19.06 Billion | |
| % | |
Globaler Markt für Brausetabletten, nach Produkten (Medikamente und Nahrungsergänzungsmittel), Methoden (Trockenmethoden und Nassgranulierung), Typ (verschreibungspflichtig und rezeptfrei), Indikation (Diuretika, Schmerzbehandlung, Magenbeschwerden, Atemwegserkrankungen und andere), Bevölkerungstyp (Kinder und Erwachsene), Anwendung (Zahnmedizinische Produkte, Nahrungsergänzungsmittel, Pharmazeutika und andere), Endbenutzer (Krankenhäuser, häusliche Pflege, Fachkliniken und andere), Vertriebskanal (Krankenhausapotheke, Online-Apotheke und Einzelhandelsapotheke) – Branchentrends und Prognose bis 2031.
Brausetabletten-Marktanalyse und -größe
Der Markt für Brausetabletten verzeichnet ein starkes Wachstum, das von mehreren Schlüsselfaktoren angetrieben wird. Einer der Haupttreiber ist die zunehmende Vorliebe der Verbraucher für praktische Darreichungsformen, da Brausetabletten eine tragbare und einfach zu verwendende Alternative zu herkömmlichen Tabletten oder Kapseln darstellen. Der angenehme Geschmack und die sprudelnde Natur von Brausetabletten machen sie für Verbraucher, insbesondere Kinder und ältere Erwachsene, attraktiver. Ein weiterer Faktor, der das Marktwachstum antreibt, ist die steigende Nachfrage nach Nahrungsergänzungsmitteln und Vitaminen. Brausetabletten sind aufgrund ihrer schnellen Auflösung und hohen Bioverfügbarkeit beliebt, um diese Nährstoffe zu liefern. Das steigende Gesundheitsbewusstsein und die Betonung der vorbeugenden Gesundheitsfürsorge tragen ebenfalls zur steigenden Nachfrage nach Brausetabletten bei.
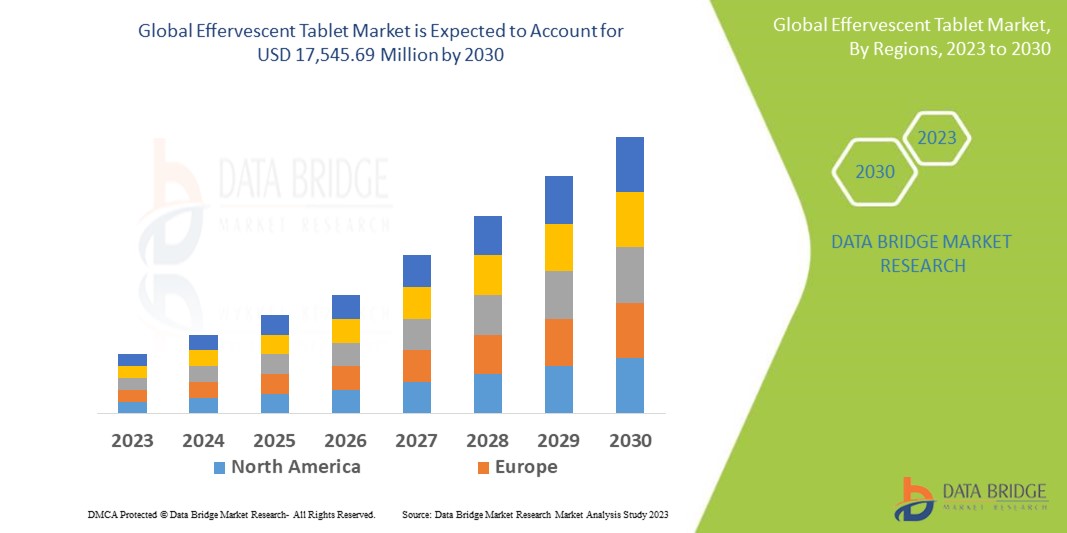
Der weltweite Markt für Brausetabletten wurde im Jahr 2023 auf 9,78 Milliarden US-Dollar geschätzt und soll bis 2031 19,06 Milliarden US-Dollar erreichen, mit einer durchschnittlichen jährlichen Wachstumsrate von 8,7 % im Prognosezeitraum von 2024 bis 2031. Neben Einblicken in Marktszenarien wie Marktwert, Wachstumsrate, Segmentierung, geografische Abdeckung und wichtige Akteure enthalten die von Data Bridge Market Research kuratierten Marktberichte auch eingehende Expertenanalysen, Patientenepidemiologie, Pipeline-Analysen, Preisanalysen und regulatorische Rahmenbedingungen.
Berichtsumfang und Marktsegmentierung
|
Berichtsmetrik |
Details |
|
Prognosezeitraum |
2024 bis 2031 |
|
Basisjahr |
2023 |
|
Historische Jahre |
2022 (Anpassbar auf 2016 – 2021) |
|
Quantitative Einheiten |
Umsatz in Mrd. USD, Volumen in Einheiten, Preise in USD |
|
Abgedeckte Segmente |
Produkte (Medikamente und Nahrungsergänzungsmittel), Methoden (Trockenmethoden und Nassgranulierung), Typ (verschreibungspflichtig und rezeptfrei), Indikation (Diuretika, Schmerzbehandlung, Magenbeschwerden, Atemwegserkrankungen und andere), Bevölkerungstyp (Kinder und Erwachsene), Anwendung (Zahnmedizinische Produkte, Nahrungsergänzungsmittel , Pharmazeutika und andere), Endverbraucher (Krankenhäuser, häusliche Pflege, Fachkliniken und andere), Vertriebskanal (Krankenhausapotheke, Online-Apotheke und Einzelhandelsapotheke) |
|
Abgedeckte Länder |
USA, Kanada, Mexiko, Deutschland, Frankreich, Großbritannien, Niederlande, Schweiz, Belgien, Russland, Italien, Spanien, Türkei, Restliches Europa, China, Japan, Indien, Südkorea, Singapur, Malaysia, Australien, Thailand, Indonesien, Philippinen, Restlicher Asien-Pazifik-Raum, Saudi-Arabien, Vereinigte Arabische Emirate, Südafrika, Ägypten, Israel, Restlicher Naher Osten und Afrika, Brasilien, Argentinien und Restliches Südamerika |
|
Abgedeckte Marktteilnehmer |
Pfizer Inc. (USA), GSK plc (Großbritannien), Novartis AG (Schweiz), Bayer AG (Deutschland), Perrigo Company plc (Irland), Reckitt Benckiser Group PLC (Großbritannien), Bristol-Myers Squibb Company (USA), CHIESI SAS (Frankreich), Hermes Pharma (Österreich), SG Biopharm Pvt. Ltd (Indien), Bliss GVS Pharma Limited (Indien), SCITECH (Indien), Alpex Solar (Schweiz), Vovantis Laboratories (Indien), Herbalife International of America, Inc. (USA), Swisse Wellness PTY LTD (Australien), Nuun (USA), Natur Produkt Zdrovit Sp ZOO (Polen), Vitabiotics Ltd (Großbritannien), Amerilab Technologies Inc. (USA) und HERMES ARZNEIMITTEL (Deutschland) |
|
Marktchancen |
|
Marktdefinition
Brausetabletten sind so formuliert, dass sie sich schnell in Wasser auflösen und dabei Kohlendioxidgas freisetzen. Dadurch entsteht eine sprudelnde oder sprudelnde Lösung, die häufig für medizinische Zwecke oder als Nahrungsergänzungsmittel verwendet wird. Brausetabletten werden normalerweise verwendet, um Vitamine , Mineralien und andere Wirkstoffe zu liefern und sind wegen ihres angenehmen Geschmacks und ihrer einfachen Einnahme beliebt.
Marktdynamik für Brausetabletten
Treiber
- Steigende Nachfrage nach praktischen Darreichungsformen
Die Nachfrage nach praktischen Darreichungsformen wie Brausetabletten steigt, da Verbraucher nach einfach zu handhabenden und tragbaren Optionen suchen. Brausetabletten bieten eine bequeme Möglichkeit, Medikamente und Nahrungsergänzungsmittel einzunehmen, da sie in Wasser aufgelöst und als erfrischendes Getränk eingenommen werden können. Diese einfache Handhabung macht Brausetabletten besonders bei vielbeschäftigten Menschen beliebt, die nach praktischen Lösungen für ihre Gesundheitsbedürfnisse suchen. Darüber hinaus sind Brausetabletten aufgrund ihrer Tragbarkeit ideal für den Verzehr unterwegs geeignet, sodass Verbraucher ihre Medikamente oder Nahrungsergänzungsmittel bequem unterwegs einnehmen können, ohne Wasser oder andere Getränke zu benötigen. Daher wird erwartet, dass der Markt für Brausetabletten weiter wächst.
- Steigendes Gesundheitsbewusstsein
Der wachsende Fokus auf Gesundheit und Wohlbefinden treibt die Nachfrage nach Nahrungsergänzungsmitteln und Vitaminen an, die üblicherweise in Brausetabletten angeboten werden. Verbraucher werden sich zunehmend der Bedeutung eines gesunden Lebensstils bewusst und suchen aktiv nach Möglichkeiten, ihr allgemeines Wohlbefinden zu verbessern. Dieser Trend ist besonders bei der alternden Bevölkerung ausgeprägt, die nach Möglichkeiten sucht, ihre Gesundheit und Vitalität im Alter zu erhalten. Brausetabletten bieten eine bequeme und effektive Möglichkeit, wichtige Nährstoffe zuzuführen, und sind daher bei gesundheitsbewussten Verbrauchern beliebt. Darüber hinaus machen der angenehme Geschmack und die sprudelnde Wirkung von Brausetabletten sie für Verbraucher attraktiver, was ihre Beliebtheit auf dem Markt weiter steigert.
Gelegenheiten
- Zunehmende Urbanisierung
Die Urbanisierung verändert Lebensstile und Ernährungsgewohnheiten. Wenn Menschen in städtische Regionen ziehen, sind sie mit einem schnelleren Tagesablauf und einem höheren Stresslevel konfrontiert, was zu einem stärkeren Fokus auf Gesundheit und Wohlbefinden führt. Brausetabletten bieten eine schnelle und einfache Möglichkeit, wichtige Nährstoffe zuzuführen, was sie zu einer attraktiven Option für Stadtbewohner macht, die trotz ihres vollen Terminkalenders ihre Gesundheit bewahren wollen, was Chancen für Marktwachstum schafft.
- Wachsende geriatrische Bevölkerung
Brausetabletten eignen sich gut für ältere Menschen, da sie leicht einzunehmen und zu verdauen sind. Mit zunehmendem Alter haben viele Menschen Schwierigkeiten, Tabletten oder Kapseln zu schlucken, sodass Brausetabletten eine geeignetere Alternative darstellen. Darüber hinaus können Brausetabletten so formuliert werden, dass sie häufige Gesundheitsprobleme älterer Menschen wie Knochengesundheit, Gelenkschmerzen und kognitive Funktionen behandeln. Da die geriatrische Bevölkerung wächst, wird die Nachfrage nach leicht einzunehmenden und wirksamen Darreichungsformen wie Brausetabletten voraussichtlich steigen.
Einschränkungen/Herausforderungen
- Konkurrenz durch andere Darreichungsformen
Brausetabletten bieten einzigartige Vorteile wie schnelle Löslichkeit und angenehmen Geschmack. Traditionelle Darreichungsformen sind auf dem Markt gut etabliert und werden von Verbrauchern aufgrund ihrer Vertrautheit und wahrgenommenen Wirksamkeit oft bevorzugt. Darüber hinaus sind traditionelle Tabletten und Kapseln möglicherweise länger haltbar und kostengünstiger in der Herstellung, was sie für Hersteller zu einer attraktiveren Option macht. Hersteller von Brausetabletten müssen ständig Innovationen entwickeln, um ihre Produkte zu differenzieren und Verbraucher von den Vorteilen ihrer einzigartigen Darreichungsform zu überzeugen. Diese Tabletten sind einer starken Konkurrenz durch traditionelle Tabletten, Kapseln und andere Darreichungsformen ausgesetzt, was das Marktwachstum behindert.
- Umweltbedenken
Die Verpackung und Produktion von Brausetabletten kann zu Umweltproblemen beitragen, die umweltbewusste Verbraucher beunruhigen können. Bei der Produktion von Brausetabletten werden häufig Kunststoffe und andere Materialien verwendet, die nicht leicht recycelbar sind, was zur Abfallerzeugung führt. Darüber hinaus kann die Verpackung von Brausetabletten, wie z. B. einzelne Folienpackungen oder Tuben, zu übermäßigem Verpackungsmüll führen. Da sich Verbraucher der Umweltprobleme immer stärker bewusst werden, suchen sie möglicherweise nach Produkten mit minimalen Umweltauswirkungen, was möglicherweise zu einer Abkehr von Brausetabletten führt, was eine Herausforderung für den Markt darstellen kann.
Dieser Marktbericht enthält Einzelheiten zu neuen Entwicklungen, Handelsvorschriften, Import-Export-Analysen, Produktionsanalysen, Optimierung der Wertschöpfungskette, Marktanteilen, Auswirkungen inländischer und lokaler Marktteilnehmer, analysiert Chancen in Bezug auf neue Einnahmequellen, Änderungen der Marktvorschriften, strategische Marktwachstumsanalysen, Marktgröße, Kategoriemarktwachstum, Anwendungsnischen und -dominanz, Produktzulassungen, Produkteinführungen, geografische Expansionen und technologische Innovationen auf dem Markt. Um weitere Informationen zum Markt für Brausetabletten zu erhalten, wenden Sie sich an Data Bridge Market Research, um einen Analystenbericht zu erhalten. Unser Team hilft Ihnen dabei, eine fundierte Marktentscheidung zu treffen, um Marktwachstum zu erzielen.
Jüngste Entwicklungen
- Im Juli 2023 gab Bristol Myers Squibb (NYSE: BMY) bekannt, dass der Ausschuss für Humanarzneimittel (CHMP) der Europäischen Arzneimittel-Agentur (EMA) die Zulassung von Opdivo (Nivolumab) als Monotherapie zur adjuvanten Behandlung von Erwachsenen und Jugendlichen ab 12 Jahren mit vollständig reseziertem Melanom im Stadium IIB oder IIC empfohlen hat. Im Falle einer Zulassung wäre Opdivo der einzige PD-1-Inhibitor, der als adjuvante Behandlung für Patienten mit reseziertem Melanom im Stadium IIB, IIC, III und Stadium IV indiziert ist. Dies ist eine der zwei Zulassungen
- Im Juli 2023 gaben Bayer und das Schweizerische Tropen- und Public Health-Institut (Swiss TPH) eine Zusammenarbeit zur klinischen Entwicklung des Wirkstoffs Emodepsid zur Behandlung von Menschen bekannt, die mit durch den Boden übertragenen Helminthen infiziert sind. Diese Zusammenarbeit folgt auf die vielversprechenden Ergebnisse einer Phase-II-Studie, die vom Swiss TPH und seinen Partnern in Tansania durchgeführt wurde. Die am 18. Mai 2023 im New England Journal of Medicine veröffentlichte Studie zeigte die Wirksamkeit von Emodepsid bei Patienten mit Infektionen mit Peitschenwürmern (Trichuris trichiura) und Hakenwürmern (Ancylostoma duodenale und Necator americanus)
Marktumfang für Brausetabletten
Der Markt ist segmentiert nach Produkten, Methoden, Typ, Indikation, Anwendung, Bevölkerungstyp, Endnutzer und Vertriebskanal. Das Wachstum dieser Segmente hilft Ihnen bei der Analyse schwacher Wachstumssegmente in den Branchen und bietet den Benutzern einen wertvollen Marktüberblick und Markteinblicke, die ihnen bei der strategischen Entscheidungsfindung zur Identifizierung der wichtigsten Marktanwendungen helfen.
Produkte
- Medikamente
- Ergänzungen
Methoden
- Trockene Methoden
- Nassgranulierung
Typ
- Rezept
- Über den Ladentisch
Anzeige
- Diuretika
- Schmerztherapie
- Magenbeschwerden
- Atemwegserkrankungen
- Sonstiges
Bevölkerungstyp
- Kinder
- Erwachsene
Anwendung
- Dentalprodukte
- Nahrungsergänzungsmittel
- Pharmazeutische
- Sonstiges
Endbenutzer
- Krankenhäuser
- Heimpflege
- Spezialkliniken
- Sonstiges
Vertriebskanal
- Krankenhausapotheke
- Online-Apotheke
- Einzelhandelsapotheke
Brausetabletten Markt – Regionale Analyse/Einblicke
Der Markt wird analysiert und es werden Einblicke in die Marktgröße und Trends nach Land, Produkten, Methoden, Typ, Indikation, Anwendung, Bevölkerungstyp, Endbenutzer und Vertriebskanal wie oben angegeben bereitgestellt.
Die vom Markt abgedeckten Länder sind die USA, Kanada, Mexiko, Deutschland, Frankreich, Großbritannien, Niederlande, Schweiz, Belgien, Russland, Italien, Spanien, Türkei, übriges Europa, China, Japan, Indien, Südkorea, Singapur, Malaysia, Australien, Thailand, Indonesien, Philippinen, übriger asiatisch-pazifischer Raum, Saudi-Arabien, Vereinigte Arabische Emirate, Südafrika, Ägypten, Israel, übriger Naher Osten und Afrika, Brasilien, Argentinien und übriges Südamerika.
Europa wird den Markt voraussichtlich aufgrund steigender verfügbarer Einkommen dominieren. Darüber hinaus wird erwartet, dass der Ausbau der Gesundheitsinfrastruktur in der Region und verstärkte staatliche Initiativen das Marktwachstum weiter beschleunigen werden.
In Nordamerika wird im Prognosezeitraum aufgrund verstärkter Forschungs- und Entwicklungsaktivitäten und steigender Gesundheitsausgaben ein deutliches Wachstum erwartet, was zum Wachstum des Marktes beitragen wird. Darüber hinaus werden wichtige Marktteilnehmer in der Region die Marktexpansion weiter vorantreiben.
Der Länderabschnitt des Berichts enthält auch Angaben zu einzelnen marktbeeinflussenden Faktoren und Änderungen der Regulierung auf dem Inlandsmarkt, die sich auf die aktuellen und zukünftigen Trends des Marktes auswirken. Datenpunkte wie Downstream- und Upstream-Wertschöpfungskettenanalysen, technische Trends und Porters Fünf-Kräfte-Analyse sowie Fallstudien sind einige der Anhaltspunkte, die zur Prognose des Marktszenarios für einzelne Länder verwendet werden. Bei der Bereitstellung von Prognoseanalysen der Länderdaten werden auch die Präsenz und Verfügbarkeit globaler Marken und ihre Herausforderungen aufgrund großer oder geringer Konkurrenz durch lokale und inländische Marken sowie die Auswirkungen inländischer Zölle und Handelsrouten berücksichtigt.
Wachstum der installierten Basis der Gesundheitsinfrastruktur und Durchdringung mit neuen Technologien
Der Markt für Brausetabletten bietet Ihnen außerdem eine detaillierte Marktanalyse für jedes Land, das Wachstum der Gesundheitsausgaben für Investitionsgüter, die installierte Basis verschiedener Arten von Produkten für den Markt für Brausetabletten, die Auswirkungen der Technologie anhand von Lebenslinienkurven und Änderungen der regulatorischen Szenarien im Gesundheitswesen und deren Auswirkungen auf den Markt für Brausetabletten. Die Daten sind für den historischen Zeitraum 2011–2021 verfügbar.
Wettbewerbsumfeld und Brausetabletten Marktanteilsanalyse
The market competitive landscape provides details by competitor. Details included are company overview, company financials, revenue generated, market potential, investment in research and development, new market initiatives, global presence, production sites and facilities, production capacities, company strengths and weaknesses, product launch, product width and breadth, application dominance. The above data points provided are only related to the companies' focus related to the market.
Some of the major players operating in the market are:
- Pfizer Inc. (U.S.)
- GSK plc (U.K.)
- Novartis AG (Switzerland)
- Bayer AG (Germany)
- Perrigo Company plc (Ireland)
- Reckitt Benckiser Group PLC (U.K.)
- Bristol-Myers Squibb Company (U.S.)
- CHIESI SAS (France)
- Hermes Pharma (Austria)
- S. G. Biopharm Pvt. Ltd (India)
- Bliss GVS Pharma Limited (India)
- Scitech (India)
- Alpex Solar (Switzerland)
- Vovantis Laboratories (India)
- Herbalife International of America, Inc. (U.S.)
- Swisse Wellness PTY LTD (Australia)
- Nuun (U.S.
- Natur Produkt Zdrovit Sp Z O O (Poland)
- Vitabiotics Ltd (U.K.)
- Amerilab Technologies Inc. (U.S.)
- HERMES ARZNEIMITTEL (Germany)
SKU-
Erhalten Sie Online-Zugriff auf den Bericht zur weltweit ersten Market Intelligence Cloud

- Interaktives Datenanalyse-Dashboard
- Unternehmensanalyse-Dashboard für Chancen mit hohem Wachstumspotenzial
- Zugriff für Research-Analysten für Anpassungen und Abfragen
- Konkurrenzanalyse mit interaktivem Dashboard
- Aktuelle Nachrichten, Updates und Trendanalyse
- Nutzen Sie die Leistungsfähigkeit der Benchmark-Analyse für eine umfassende Konkurrenzverfolgung
Inhaltsverzeichnis
- Einführung
- ZIELE DER STUDIE
- MARKTDEFINITION
- Überblick über den globalen Markt für Brausetabletten
- EINSCHRÄNKUNGEN
- ABGEDECKTE MÄRKTE
- Marktsegmentierung
- ABGEDECKTE MÄRKTE
- Geographischer Geltungsbereich
- Jahre, die für die Studie berücksichtigt wurden
- Währung und Preisgestaltung
- DBMR-Dreibeindatenvalidierungsmodell
- MULTIVARIATE MODELLIERUNG
- Produkte LIFELINE CURVE
- Primärinterviews mit wichtigen Meinungsführern
- DBMR-Marktpositionsraster
- Marktanwendungs-Abdeckungsraster
- Lieferantenanteilsanalyse
- Sekundärquellen
- Annahmen
- ZUSAMMENFASSUNG
- Premium-Einblicke
- Globaler Markt für Brausetabletten: Vorschriften
- VORSCHRIFTEN IN DEN USA:
- VORSCHRIFTEN IN EUROPA
- VORSCHRIFTEN IN AUSTRALIEN
- VORSCHRIFTEN IN JAPAN
- VORSCHRIFTEN IN CHINA
- ANALYSE DES VERBRAUCHERVERHALTENS – GLOBALE BRAUSENTABLETTEN
- Verbraucherpräferenz gegenüber einer anderen Form von Medikamenten
- GRÜNDE, WARUM SICH VERBRAUCHER FÜR BRAUSETABLETTEN ENTSCHEIDEN
- Marktübersicht
- Treiber
- Anstieg chronischer Erkrankungen
- Wachstum von F&E in der Gesundheitsbranche
- Vorteile von Brauseprodukten
- Zunahme der geriatrischen Bevölkerung mit chronischen Krankheiten
- Steigende Nachfrage nach einem gesünderen Lebensstil
- Einschränkungen
- Nachteile von Brausetabletten
- Zunahme der Produktrückrufe für Brausetabletten
- komplexer Produktionsprozess
- Teures Produkt im Vergleich zu herkömmlichen Tabletten
- GELEGENHEITEN
- Anstieg der verfügbaren Einkommen
- Strategische Initiative wichtiger Marktteilnehmer
- Steigende Nachfrage nach Brausetabletten
- HERAUSFORDERUNGEN
- Mangelnde Verfügbarkeit der Brauseprodukte in abgelegenen und unterentwickelten Regionen
- Einschränkung im Zusammenhang mit dem Vorhandensein eines hohen Natriumgehalts
- Auswirkungen von COVID-19 auf den globalen Markt für Brausetabletten
- AUSWIRKUNGEN AUF DEN PREIS
- AUSWIRKUNGEN AUF DIE NACHFRAGE
- AUSWIRKUNGEN AUF DIE LIEFERKETTE
- STRATEGISCHE ENTSCHEIDUNGEN DER HERSTELLER
- ABSCHLUSS
- GLOBALER MARKT FÜR BRAUSENTABLETTEN, NACH PRODUKTEN
- ÜBERBLICK
- Ergänzungen
- Vitamine
- Mineralien
- Medikamente
- Analgetika
- Antazida
- GLOBALER MARKT FÜR BRAUSETABLETTEN, NACH METHODE
- ÜBERBLICK
- Nassgranulation
- Wirbelschicht-Sprühgranulation
- organische Lösungsmittel
- Wasser
- Trockenmethode
- GLOBALER MARKT FÜR BRAUSETABLETTEN, NACH TYP
- ÜBERBLICK
- über den Ladentisch
- Rezept
- GLOBALER MARKT FÜR BRAUSETABLETTEN, NACH INDIKATION
- ÜBERBLICK
- Schmerzbehandlung
- Magenbeschwerden
- Atemwegserkrankungen
- Diuretika
- andere
- GLOBALER MARKT FÜR BRAUSETABLETTEN, NACH BEVÖLKERUNGSTYP
- ÜBERBLICK
- Erwachsene
- Kinder
- GLOBALER MARKT FÜR BRAUSETABLETTEN, NACH ANWENDUNG
- ÜBERBLICK
- Pharmazeutika
- Nahrungsergänzungsmittel
- Dentalprodukte
- andere
- GLOBALER MARKT FÜR BRAUSETABLETTEN, NACH ENDVERBRAUCHER
- ÜBERBLICK
- KRANKENHÄUSER
- Fachkliniken
- häusliche Gesundheitspflege
- andere
- GLOBALER MARKT FÜR BRAUSETABLETTEN, NACH VERTRIEBSKANAL
- ÜBERBLICK
- Einzelhandelsapotheken
- Drogerien
- E-Commerce
- Hypermärkte und Supermärkte
- andere
- GLOBALER Markt für Brausetabletten, nach REGION
- Überblick
- Nordamerika
- UNS
- Kanada
- MEXIKO
- Südamerika
- Brasilien
- Argentinien
- PERU
- Restliches Südamerika
- Naher Osten und Afrika
- Südafrika
- Saudi-Arabien
- Vereinigte Arabische Emirate
- Ägypten
- Kuwait
- Israel
- Rest des Nahen Ostens und Afrikas
- ASIEN-PAZIFIK
- JAPAN
- CHINA
- INDIEN
- Südkorea
- AUSTRALIEN
- Singapur
- Thailand
- Malaysia
- Indonesien
- Philippinen
- Vietnam
- Restlicher Asien-Pazifik-Raum
- Europa
- Deutschland
- Italien
- Frankreich
- Vereinigtes Königreich
- Spanien
- Niederlande
- Russland
- Schweiz
- Truthahn
- Österreich
- Norwegen
- UNGARN
- LITAUEN
- IRLAND
- POLEN
- Restliches Europa
- Globaler Markt für Brausetabletten: UNTERNEHMENSLANDSCHAFT
- Unternehmensaktienanalyse: Global
- Unternehmensaktienanalyse: Nordamerika
- Unternehmensaktienanalyse: Europa
- Unternehmensaktienanalyse: Asien-Pazifik
- Streber
- Unternehmensprofil
- GLAXOSMITHKLINE PLC
- UNTERNEHMENSÜBERSICHT
- Umsatzanalyse
- PRODUKTPORTFOLIO
- JÜNGSTE ENTWICKLUNGEN
- BAYER AG
- UNTERNEHMENSÜBERSICHT
- Umsatzanalyse
- PRODUKTPORTFOLIO
- JÜNGSTE ENTWICKLUNGEN
- RECKITT BENCKISER GROUP PLC
- UNTERNEHMENSÜBERSICHT
- Umsatzanalyse
- PRODUKTPORTFOLIO
- JÜNGSTE ENTWICKLUNGEN
- PERRIGO COMPANY PLC
- UNTERNEHMENSÜBERSICHT
- Umsatzanalyse
- PRODUKTPORTFOLIO
- JÜNGSTE ENTWICKLUNGEN
- HERBALIFE INTERNATIONAL OF AMERICA INC
- UNTERNEHMENSÜBERSICHT
- Umsatzanalyse
- PRODUKTPORTFOLIO
- JÜNGSTE ENTWICKLUNGEN
- SWISSE WELLNESS PTY LTD
- UNTERNEHMENSÜBERSICHT
- PRODUKTPORTFOLIO
- JÜNGSTE ENTWICKLUNGEN
- ALPEX
- UNTERNEHMENSÜBERSICHT
- PRODUKTPORTFOLIO
- JÜNGSTE ENTWICKLUNG
- BLISS GVS PHARMA LIMITED
- UNTERNEHMENSÜBERSICHT
- Umsatzanalyse
- PRODUKTPORTFOLIO
- JÜNGSTE ENTWICKLUNGEN
- CHIESI SAS
- UNTERNEHMENSÜBERSICHT
- PRODUKTPORTFOLIO
- JÜNGSTE ENTWICKLUNGEN
- DIETFARM
- UNTERNEHMENSÜBERSICHT
- PRODUKTPORTFOLIO
- JÜNGSTE ENTWICKLUNGEN
- HERMES ARZNEIMITTEL
- UNTERNEHMENSÜBERSICHT
- PRODUKTPORTFOLIO
- JÜNGSTE ENTWICKLUNGEN
- NUUN
- UNTERNEHMENSÜBERSICHT
- PRODUKTPORTFOLIO
- JÜNGSTE ENTWICKLUNGEN
- NATUR PRODUKT ZDROVIT SP. Z OO
- UNTERNEHMENSÜBERSICHT
- PRODUKTPORTFOLIO
- JÜNGSTE ENTWICKLUNG
- SCITECH
- UNTERNEHMENSÜBERSICHT
- PRODUKTPORTFOLIO
- JÜNGSTE ENTWICKLUNGEN
- SG BIOPHARMA PVT LTD.
- UNTERNEHMENSÜBERSICHT
- PRODUKTPORTFOLIO
- JÜNGSTE ENTWICKLUNG
- VITABIOTICS LTD.
- UNTERNEHMENSÜBERSICHT
- PRODUKTPORTFOLIO
- JÜNGSTE ENTWICKLUNG
- Vovantis Laboratories
- UNTERNEHMENSÜBERSICHT
- PRODUKTPORTFOLIO
- JÜNGSTE ENTWICKLUNG
- Fragebogen
- zugehörige Berichte
Tabellenverzeichnis
TABELLE 1: Globaler Markt für Brausetabletten, nach PRODUKTEN, 2019–2028 (in Millionen USD)
TABELLE 2: Globaler Markt für Nahrungsergänzungsmittel in Brausetabletten, nach Regionen, 2019–2028 (in Millionen USD)
TABELLE 3: Globaler Markt für Nahrungsergänzungsmittel in Brausetabletten, nach PRODUKTEN, 2019–2028 (in Millionen USD)
TABELLE 4: Globaler Markt für Medikamente in Brausetabletten, nach Regionen, 2019–2028 (in Millionen USD)
TABELLE 5: Globaler Markt für Medikamente in Brausetabletten, nach PRODUKTEN, 2019–2028 (in Millionen USD)
TABELLE 6: Globaler Markt für Brausetabletten, nach METHODE, 2019–2028 (in Millionen USD)
TABELLE 7: Globaler Markt für Nassgranulation in Brausetabletten, nach Regionen, 2019–2028 (in Mio. USD)
TABELLE 8: Globaler Markt für Nassgranulation in Brausetabletten, nach Methode, 2019–2028 (in Mio. USD)
TABELLE 9 – Globaler Markt für Trockenverfahren in Brausetabletten, nach Regionen, 2019–2028 (in Mio. USD)
TABELLE 10: Globaler Markt für Brausetabletten, nach Typ, 2019–2028 (in Millionen USD)
TABELLE 11 – Globaler Markt für rezeptfreie Brausetabletten, nach Regionen, 2019–2028 (in Mio. USD)
TABELLE 12: Globaler Markt für verschreibungspflichtige Brausetabletten, nach Regionen, 2019–2028 (in Mio. USD)
TABELLE 13: Globaler Markt für Brausetabletten, nach INDIKATION, 2019–2028 (in Mio. USD)
TABELLE 14 – Globaler Markt für Schmerzmittel mit Brausetabletten, nach Regionen, 2019–2028 (in Mio. USD)
TABELLE 15 – Globaler Markt für Brausetabletten gegen Magenbeschwerden, nach Regionen, 2019–2028 (in Mio. USD)
TABELLE 16 – Globaler Markt für Brausetabletten zu Atemwegserkrankungen, nach Regionen, 2019–2028 (in Mio. USD)
TABELLE 17 – Globaler Markt für Diuretika in Brausetabletten, nach Regionen, 2019–2028 (in Mio. USD)
TABELLE 18 – Sonstige globale Anbieter von Brausetabletten, nach Regionen, 2019–2028 (in Mio. USD)
TABELLE 19: Globaler Markt für Brausetabletten, nach BEVÖLKERUNGSTYP, 2019–2028 (in Millionen USD)
TABELLE 20 – Globaler Markt für Brausetabletten für Erwachsene, nach Regionen, 2019–2028 (in Millionen USD)
TABELLE 21 – Globaler Markt für Brausetabletten für Kinder, nach Regionen, 2019–2028 (in Millionen USD)
TABELLE 22: Globaler Markt für Brausetabletten, nach ANWENDUNG, 2019–2028 (in Millionen USD)
TABELLE 23 – Globaler Markt für Arzneimittel in Brausetabletten, nach Regionen, 2019–2028 (in Mio. USD)
TABELLE 24: Globaler Markt für Nahrungsergänzungsmittel in Brausetabletten, nach Regionen, 2019–2028 (in Millionen USD)
TABELLE 25 – Globaler Markt für Dentalprodukte in Brausetabletten, nach Regionen, 2019–2028 (in Mio. USD)
TABELLE 26 – Sonstige globale Anbieter von Brausetabletten, nach Regionen, 2019–2028 (in Mio. USD)
TABELLE 27: Globaler Markt für Brausetabletten, nach Endverbraucher, 2019–2028 (in Millionen USD)
TABELLE 28 – Globaler Markt für KRANKENHÄUSER mit Brausetabletten, nach Regionen, 2019–2028 (in Mio. USD)
TABELLE 29 – Globale Spezialkliniken im Markt für Brausetabletten, nach Regionen, 2019–2028 (in Mio. USD)
TABELLE 30: Globaler Markt für häusliche Gesundheitspflege in Form von Brausetabletten, nach Regionen, 2019–2028 (in Mio. USD)
TABELLE 31 – Sonstige globale Anbieter von Brausetabletten, nach Regionen, 2019–2028 (in Mio. USD)
TABELLE 32: Globaler Markt für Brausetabletten, nach Vertriebskanal, 2019–2028 (in Millionen USD)
TABELLE 33: Globaler Markt für Brausetabletten in Apotheken, nach Regionen, 2019–2028 (in Millionen USD)
TABELLE 34 – Globaler Markt für Brausetabletten in Drogerien, nach Regionen, 2019–2028 (in Mio. USD)
TABELLE 35: Globaler E-Commerce-Markt für Brausetabletten, nach Regionen, 2019–2028 (in Millionen USD)
TABELLE 36: Globale Hypermärkte und Supermärkte im Markt für Brausetabletten, nach Regionen, 2019–2028 (in Millionen USD)
TABELLE 37 – Sonstige globale Anbieter von Brausetabletten, nach Regionen, 2019–2028 (in Mio. USD)
TABELLE 38 GLOBALER Markt für Brausetabletten, NACH REGION, 2019–2028 (MILLIONEN USD)
TABELLE 39: Brausetablettenmarkt in Nordamerika, nach Ländern, 2019–2028 (in Mio. USD)
TABELLE 40: Nordamerikanischer Markt für Brausetabletten, nach Produkten, 2019–2028 (in Mio. USD)
TABELLE 41 Nordamerikanischer Markt für Nahrungsergänzungsmittel in Brausetabletten, nach Produkten, 2019–2028 (in Mio. USD)
TABELLE 42 Nordamerikanischer Markt für Medikamente in Brausetabletten, nach Produkten, 2019–2028 (in Mio. USD)
TABELLE 43 Nordamerikanischer Markt für Brausetabletten, nach Methode, 2019–2028 (in Mio. USD)
TABELLE 44: Nordamerikanischer Markt für Nassgranulation in Brausetabletten, nach Methode, 2019–2028 (in Mio. USD)
TABELLE 45: Brausetablettenmarkt in Nordamerika, nach Typ, 2019–2028 (in Mio. USD)
TABELLE 46: Nordamerikanischer Markt für Brausetabletten, nach Indikation, 2019–2028 (in Mio. USD)
TABELLE 47: Brausetablettenmarkt in Nordamerika, nach Bevölkerungstyp, 2019–2028 (in Mio. USD)
TABELLE 48: Brausetablettenmarkt in Nordamerika, nach Anwendung, 2019–2028 (in Mio. USD)
TABELLE 49: Brausetablettenmarkt in Nordamerika, nach Endverbraucher, 2019–2028 (in Mio. USD)
TABELLE 50: Brausetablettenmarkt in Nordamerika, nach Vertriebskanal, 2019–2028 (in Mio. USD)
TABELLE 51 US-Markt für Brausetabletten, nach Produkten, 2019–2028 (in Mio. USD)
TABELLE 52 – US-Markt für Nahrungsergänzungsmittel in Brausetabletten, nach Produkten, 2019–2028 (in Millionen USD)
TABELLE 53 US-Markt für Medikamente in Brausetabletten, nach Produkten, 2019–2028 (in Millionen USD)
TABELLE 54 US-Markt für Brausetabletten, nach Methode, 2019–2028 (in Millionen USD)
TABELLE 55 – US-Markt für Nassgranulation in Brausetabletten, nach Methode, 2019–2028 (in Mio. USD)
TABELLE 56 US-Markt für Brausetabletten, nach Typ, 2019–2028 (in Mio. USD)
TABELLE 57 US-Markt für Brausetabletten, nach Indikation, 2019–2028 (in Millionen USD)
TABELLE 58 US-Markt für Brausetabletten, nach Bevölkerungstyp, 2019–2028 (in Millionen USD)
TABELLE 59 US-Markt für Brausetabletten, nach Anwendung, 2019–2028 (in Mio. USD)
TABELLE 60 US-Markt für Brausetabletten, nach Endverbraucher, 2019–2028 (in Millionen USD)
TABELLE 61 US-Markt für Brausetabletten, nach Vertriebskanal, 2019–2028 (in Mio. USD)
TABELLE 62 Kanadischer Markt für Brausetabletten, nach Produkten, 2019–2028 (in Mio. USD)
TABELLE 63 – Kanadischer Markt für Nahrungsergänzungsmittel in Brausetabletten, nach Produkten, 2019–2028 (in Mio. USD)
TABELLE 64 – Kanadischer Markt für Medikamente in Brausetabletten, nach Produkten, 2019–2028 (in Mio. USD)
TABELLE 65 Kanadischer Markt für Brausetabletten, nach Methode, 2019–2028 (in Mio. USD)
TABELLE 66 – Kanadischer Markt für Nassgranulation im Brausetablettenbereich, nach Methode, 2019–2028 (in Mio. USD)
TABELLE 67 Brausetablettenmarkt in Kanada, nach Typ, 2019–2028 (in Mio. USD)
TABELLE 68 Kanadischer Markt für Brausetabletten, nach Indikation, 2019–2028 (in Mio. USD)
TABELLE 69 Kanadischer Markt für Brausetabletten, nach Bevölkerungstyp, 2019–2028 (in Mio. USD)
TABELLE 70 Brausetablettenmarkt in Kanada, nach Anwendung, 2019–2028 (in Mio. USD)
TABELLE 71: Kanadischer Markt für Brausetabletten, nach Endverbraucher, 2019–2028 (in Mio. USD)
TABELLE 72 Brausetablettenmarkt in Kanada, nach Vertriebskanal, 2019–2028 (in Mio. USD)
TABELLE 73 Mexikanischer Markt für Brausetabletten, nach Produkten, 2019–2028 (in Mio. USD)
TABELLE 74 – Mexikanischer Markt für Nahrungsergänzungsmittel in Brausetabletten, nach Produkten, 2019–2028 (in Millionen USD)
TABELLE 75 – Mexikanischer Markt für Medikamente in Brausetabletten, nach Produkten, 2019–2028 (in Millionen USD)
TABELLE 76 Mexikanischer Markt für Brausetabletten, nach Methode, 2019–2028 (in Mio. USD)
TABELLE 77 – Mexikanischer Markt für Nassgranulation im Brausetablettenmarkt, nach Methode, 2019–2028 (in Mio. USD)
TABELLE 78 Mexikanischer Markt für Brausetabletten, nach Typ, 2019–2028 (in Mio. USD)
TABELLE 79 Mexikanischer Markt für Brausetabletten, nach Indikation, 2019–2028 (in Mio. USD)
TABELLE 80 Mexikanischer Markt für Brausetabletten, nach Bevölkerungstyp, 2019–2028 (in Mio. USD)
TABELLE 81 Mexikanischer Markt für Brausetabletten, nach Anwendung, 2019–2028 (in Mio. USD)
TABELLE 82. Mexikanischer Markt für Brausetabletten, nach Endverbraucher, 2019–2028 (in Mio. USD)
TABELLE 83 Mexikanischer Markt für Brausetabletten, nach Vertriebskanal, 2019–2028 (in Mio. USD)
TABELLE 84 Südamerikanischer Markt für Brausetabletten, nach Ländern, 2019–2028 (in Mio. USD)
TABELLE 85 Südamerikanischer Markt für Brausetabletten, nach Produkten, 2019–2028 (in Mio. USD)
TABELLE 86 Südamerikanischer Markt für Nahrungsergänzungsmittel in Brausetabletten, nach Produkten, 2019–2028 (in Mio. USD)
TABELLE 87 Südamerikanischer Markt für Medikamente in Brausetabletten, nach Produkten, 2019–2028 (in Mio. USD)
TABELLE 88 Südamerikanischer Markt für Brausetabletten, nach Methode, 2019–2028 (in Mio. USD)
TABELLE 89 Südamerikanischer Markt für Nassgranulation in Brausetabletten, nach Methode, 2019–2028 (in Mio. USD)
TABELLE 90 Südamerikanischer Markt für Brausetabletten, nach Typ, 2019–2028 (in Mio. USD)
TABELLE 91 Südamerikanischer Markt für Brausetabletten, nach Indikation, 2019–2028 (in Mio. USD)
TABELLE 92 Südamerikanischer Markt für Brausetabletten, nach Bevölkerungstyp, 2019–2028 (in Mio. USD)
TABELLE 93 Südamerikanischer Markt für Brausetabletten, nach Anwendung, 2019–2028 (in Mio. USD)
TABELLE 94 Südamerikanischer Markt für Brausetabletten, nach Endverbraucher, 2019–2028 (in Mio. USD)
TABELLE 95: Südamerikanischer Markt für Brausetabletten, nach Vertriebskanal, 2019–2028 (in Mio. USD)
TABELLE 96 Brausetablettenmarkt in Brasilien, nach Produkten, 2019–2028 (in Mio. USD)
TABELLE 97 Brasilianischer Markt für Nahrungsergänzungsmittel in Brausetabletten, nach Produkten, 2019–2028 (in Mio. USD)
TABELLE 98 Brasilianischer Markt für Medikamente in Brausetabletten, nach Produkten, 2019–2028 (in Mio. USD)
TABELLE 99 Brausetablettenmarkt in Brasilien, nach Methode, 2019–2028 (in Mio. USD)
TABELLE 100 Brasilianischer Markt für Nassgranulation in Brausetabletten, nach Methode, 2019–2028 (in Mio. USD)
TABELLE 101 Brausetablettenmarkt in Brasilien, nach Typ, 2019–2028 (in Mio. USD)
TABELLE 102 Brausetablettenmarkt in Brasilien, nach Indikation, 2019–2028 (in Mio. USD)
TABELLE 103 Brausetablettenmarkt in Brasilien, nach Bevölkerungstyp, 2019–2028 (in Mio. USD)
TABELLE 104 Brausetablettenmarkt in Brasilien, nach Anwendung, 2019–2028 (in Mio. USD)
TABELLE 105 Brausetablettenmarkt in Brasilien, nach Endverbraucher, 2019–2028 (in Mio. USD)
TABELLE 106 Brausetablettenmarkt in Brasilien, nach Vertriebskanal, 2019–2028 (in Mio. USD)
TABELLE 107 Brausetablettenmarkt in Argentinien, nach Produkten, 2019–2028 (in Mio. USD)
TABELLE 108 – Argentinischer Markt für Nahrungsergänzungsmittel in Brausetabletten, nach Produkten, 2019–2028 (in Millionen USD)
TABELLE 109 – Markt für Medikamente in Brausetabletten in Argentinien, nach Produkten, 2019–2028 (in Mio. USD)
TABELLE 110 Brausetablettenmarkt in Argentinien, nach Methode, 2019–2028 (in Mio. USD)
TABELLE 111 – Argentinischer Markt für Nassgranulation im Brausetablettenbereich, nach Methode, 2019–2028 (in Mio. USD)
TABELLE 112 – Argentinischer Markt für Brausetabletten, nach Typ, 2019–2028 (in Mio. USD)
TABELLE 113 – Argentinischer Markt für Brausetabletten, nach Indikation, 2019–2028 (in Millionen USD)
TABELLE 114 – Argentinischer Markt für Brausetabletten, nach Bevölkerungstyp, 2019–2028 (in Millionen USD)
TABELLE 115 – Brausetablettenmarkt in Argentinien, nach Anwendung, 2019–2028 (in Mio. USD)
TABELLE 116 – Brausetablettenmarkt in Argentinien, nach Endverbraucher, 2019–2028 (in Mio. USD)
TABELLE 117 Brausetablettenmarkt in Argentinien, nach Vertriebskanal, 2019–2028 (in Mio. USD)
TABELLE 118 Peruanischer Markt für Brausetabletten, nach Produkten, 2019–2028 (in Mio. USD)
TABELLE 119 Peruanischer Markt für Nahrungsergänzungsmittel in Brausetabletten, nach Produkten, 2019–2028 (in Mio. USD)
TABELLE 120 Peruanischer Markt für Medikamente in Brausetabletten, nach Produkten, 2019–2028 (in Millionen USD)
TABELLE 121 Peruanischer Markt für Brausetabletten, nach Methode, 2019–2028 (in Mio. USD)
TABELLE 122 – Peruanischer Markt für Nassgranulation im Brausetablettenmarkt, nach Methode, 2019–2028 (in Mio. USD)
TABELLE 123 Peruanischer Markt für Brausetabletten, nach Typ, 2019–2028 (in Mio. USD)
TABELLE 124 – Peruanischer Markt für Brausetabletten, nach Indikation, 2019–2028 (in Mio. USD)
TABELLE 125 – Peruanischer Markt für Brausetabletten, nach Bevölkerungstyp, 2019–2028 (in Mio. USD)
TABELLE 126 Peruanischer Markt für Brausetabletten, nach Anwendung, 2019–2028 (in Mio. USD)
TABELLE 127 Brausetablettenmarkt in Peru, nach Endverbraucher, 2019–2028 (in Mio. USD)
TABELLE 128 Peruanischer Markt für Brausetabletten, nach Vertriebskanal, 2019–2028 (in Mio. USD)
TABELLE 129 Restlicher südamerikanischer Markt für Brausetabletten, nach Produkten, 2019–2028 (in Mio. USD)
TABELLE 130 Markt für Brausetabletten im Nahen Osten und Afrika, nach Ländern, 2019–2028 (in Mio. USD)
TABELLE 131 Markt für Brausetabletten im Nahen Osten und Afrika, nach Produkten, 2019–2028 (in Mio. USD)
TABELLE 132 Markt für Nahrungsergänzungsmittel in Brausetabletten im Nahen Osten und Afrika, nach Produkten, 2019–2028 (in Mio. USD)
TABLE 133 Middle East & Africa Medication in Effervescent tablet market, By Products, 2019-2028 (USD Million)
TABLE 134 Middle East & Africa Effervescent tablet market, By Method, 2019-2028 (USD Million)
TABLE 135 Middle East & Africa Wet Granulation in Effervescent tablet market, By Method, 2019-2028 (USD Million)
TABLE 136 Middle East & Africa Effervescent tablet market, By Type, 2019-2028 (USD Million)
TABLE 137 Middle East & Africa Effervescent tablet market, By Indication, 2019-2028 (USD Million)
TABLE 138 Middle East & Africa Effervescent tablet market, By Population Type, 2019-2028 (USD Million)
TABLE 139 Middle East & Africa Effervescent tablet market, By Application, 2019-2028 (USD Million)
TABLE 140 Middle East & Africa Effervescent tablet market, By End User, 2019-2028 (USD Million)
TABLE 141 Middle East & Africa Effervescent tablet market, By Distribution Channel, 2019-2028 (USD Million)
TABLE 142 South Africa Effervescent tablet market, By Products, 2019-2028 (USD Million)
TABLE 143 South Africa Supplements in Effervescent tablet market, By Products, 2019-2028 (USD Million)
TABLE 144 South Africa Medication in Effervescent tablet market, By Products, 2019-2028 (USD Million)
TABLE 145 South Africa Effervescent tablet market, By Method, 2019-2028 (USD Million)
TABLE 146 South Africa Wet Granulation in Effervescent tablet market, By Method, 2019-2028 (USD Million)
TABLE 147 South Africa Effervescent tablet market, By Type, 2019-2028 (USD Million)
TABLE 148 South Africa Effervescent tablet market, By Indication, 2019-2028 (USD Million)
TABLE 149 South Africa Effervescent tablet market, By Population Type, 2019-2028 (USD Million)
TABLE 150 South Africa Effervescent tablet market, By Application, 2019-2028 (USD Million)
TABLE 151 South Africa Effervescent tablet market, By End User, 2019-2028 (USD Million)
TABLE 152 South Africa Effervescent tablet market, By Distribution Channel, 2019-2028 (USD Million)
TABLE 153 Saudi Arabia Effervescent tablet market, By Products, 2019-2028 (USD Million)
TABLE 154 Saudi Arabia Supplements in Effervescent tablet market, By Products, 2019-2028 (USD Million)
TABLE 155 Saudi Arabia Medication in Effervescent tablet market, By Products, 2019-2028 (USD Million)
TABLE 156 Saudi Arabia Effervescent tablet market, By Method, 2019-2028 (USD Million)
TABLE 157 Saudi Arabia Wet Granulation in Effervescent tablet market, By Method, 2019-2028 (USD Million)
TABLE 158 Saudi Arabia Effervescent tablet market, By Type, 2019-2028 (USD Million)
TABLE 159 Saudi Arabia Effervescent tablet market, By Indication, 2019-2028 (USD Million)
TABLE 160 Saudi Arabia Effervescent tablet market, By Population Type, 2019-2028 (USD Million)
TABLE 161 Saudi Arabia Effervescent tablet market, By Application, 2019-2028 (USD Million)
TABLE 162 Saudi Arabia Effervescent tablet market, By End User, 2019-2028 (USD Million)
TABLE 163 Saudi Arabia Effervescent tablet market, By Distribution Channel, 2019-2028 (USD Million)
TABLE 164 U.A.E. Effervescent tablet market, By Products, 2019-2028 (USD Million)
TABLE 165 U.A.E. Supplements in Effervescent tablet market, By Products, 2019-2028 (USD Million)
TABLE 166 U.A.E. Medication in Effervescent tablet market, By Products, 2019-2028 (USD Million)
TABLE 167 U.A.E. Effervescent tablet market, By Method, 2019-2028 (USD Million)
TABLE 168 U.A.E. Wet Granulation in Effervescent tablet market, By Method, 2019-2028 (USD Million)
TABLE 169 U.A.E. Effervescent tablet market, By Type, 2019-2028 (USD Million)
TABLE 170 U.A.E. Effervescent tablet market, By Indication, 2019-2028 (USD Million)
TABLE 171 U.A.E. Effervescent tablet market, By Population Type, 2019-2028 (USD Million)
TABLE 172 U.A.E. Effervescent tablet market, By Application, 2019-2028 (USD Million)
TABLE 173 U.A.E. Effervescent tablet market, By End User, 2019-2028 (USD Million)
TABLE 174 U.A.E. Effervescent tablet market, By Distribution Channel, 2019-2028 (USD Million)
TABLE 175 EGYPT Effervescent tablet market, By Products, 2019-2028 (USD Million)
TABLE 176 EGYPT Supplements in Effervescent tablet market, By Products, 2019-2028 (USD Million)
TABLE 177 EGYPT Medication in Effervescent tablet market, By Products, 2019-2028 (USD Million)
TABLE 178 EGYPT Effervescent tablet market, By Method, 2019-2028 (USD Million)
TABLE 179 EGYPT Wet Granulation in Effervescent tablet market, By Method, 2019-2028 (USD Million)
TABLE 180 EGYPT Effervescent tablet market, By Type, 2019-2028 (USD Million)
TABLE 181 EGYPT Effervescent tablet market, By Indication, 2019-2028 (USD Million)
TABLE 182 EGYPT Effervescent tablet market, By Population Type, 2019-2028 (USD Million)
TABLE 183 EGYPT Effervescent tablet market, By Application, 2019-2028 (USD Million)
TABLE 184 EGYPT Effervescent tablet market, By End User, 2019-2028 (USD Million)
TABLE 185 EGYPT Effervescent tablet market, By Distribution Channel, 2019-2028 (USD Million)
TABLE 186 Kuwait Effervescent tablet market, By Products, 2019-2028 (USD Million)
TABLE 187 Kuwait Supplements in Effervescent tablet market, By Products, 2019-2028 (USD Million)
TABLE 188 Kuwait Medication in Effervescent tablet market, By Products, 2019-2028 (USD Million)
TABLE 189 Kuwait Effervescent tablet market, By Method, 2019-2028 (USD Million)
TABLE 190 Kuwait Wet Granulation in Effervescent tablet market, By Method, 2019-2028 (USD Million)
TABLE 191 Kuwait Effervescent tablet market, By Type, 2019-2028 (USD Million)
TABLE 192 Kuwait Effervescent tablet market, By Indication, 2019-2028 (USD Million)
TABLE 193 Kuwait Effervescent tablet market, By Population Type, 2019-2028 (USD Million)
TABLE 194 Kuwait Effervescent tablet market, By Application, 2019-2028 (USD Million)
TABLE 195 Kuwait Effervescent tablet market, By End User, 2019-2028 (USD Million)
TABLE 196 Kuwait Effervescent tablet market, By Distribution Channel, 2019-2028 (USD Million)
TABLE 197 Israel Effervescent tablet market, By Products, 2019-2028 (USD Million)
TABLE 198 Israel Supplements in Effervescent tablet market, By Products, 2019-2028 (USD Million)
TABLE 199 Israel Medication in Effervescent tablet market, By Products, 2019-2028 (USD Million)
TABLE 200 Israel Effervescent tablet market, By Method, 2019-2028 (USD Million)
TABLE 201 Israel Wet Granulation in Effervescent tablet market, By Method, 2019-2028 (USD Million)
TABLE 202 Israel Effervescent tablet market, By Type, 2019-2028 (USD Million)
TABLE 203 Israel Effervescent tablet market, By Indication, 2019-2028 (USD Million)
TABLE 204 Israel Effervescent tablet market, By Population Type, 2019-2028 (USD Million)
TABLE 205 Israel Effervescent tablet market, By Application, 2019-2028 (USD Million)
TABLE 206 Israel Effervescent tablet market, By End User, 2019-2028 (USD Million)
TABLE 207 Israel Effervescent tablet market, By Distribution Channel, 2019-2028 (USD Million)
TABLE 208 Rest of Middle East & Africa Effervescent tablet market, By Products, 2019-2028 (USD Million)
TABLE 209 Asia-Pacific Effervescent tablet market, By country, 2019-2028 (USD Million)
TABLE 210 Asia-Pacific Effervescent tablet market, By Products, 2019-2028 (USD Million)
TABLE 211 Asia-Pacific Supplements in Effervescent tablet market, By Products, 2019-2028 (USD Million)
TABLE 212 Asia-Pacific Medication in Effervescent tablet market, By Products, 2019-2028 (USD Million)
TABLE 213 Asia-Pacific Effervescent tablet market, By Method, 2019-2028 (USD Million)
TABLE 214 Asia-Pacific Wet Granulation in Effervescent tablet market, By Method, 2019-2028 (USD Million)
TABLE 215 Asia-Pacific Effervescent tablet market, By Type, 2019-2028 (USD Million)
TABLE 216 Asia-Pacific Effervescent tablet market, By Indication, 2019-2028 (USD Million)
TABLE 217 Asia-Pacific Effervescent tablet market, By Population Type, 2019-2028 (USD Million)
TABLE 218 Asia-Pacific Effervescent tablet market, By Application, 2019-2028 (USD Million)
TABLE 219 Asia-Pacific Effervescent tablet market, By End User, 2019-2028 (USD Million)
TABLE 220 Asia-Pacific Effervescent tablet market, By Distribution Channel, 2019-2028 (USD Million)
TABLE 221 Japan Effervescent tablet market, By Products, 2019-2028 (USD Million)
TABLE 222 Japan Supplements in Effervescent tablet market, By Products, 2019-2028 (USD Million)
TABLE 223 Japan Medication in Effervescent tablet market, By Products, 2019-2028 (USD Million)
TABLE 224 Japan Effervescent tablet market, By Method, 2019-2028 (USD Million)
TABLE 225 Japan Wet Granulation in Effervescent tablet market, By Method, 2019-2028 (USD Million)
TABLE 226 Japan Effervescent tablet market, By Type, 2019-2028 (USD Million)
TABLE 227 Japan Effervescent tablet market, By Indication, 2019-2028 (USD Million)
TABLE 228 Japan Effervescent tablet market, By Population Type, 2019-2028 (USD Million)
TABLE 229 Japan Effervescent tablet market, By Application, 2019-2028 (USD Million)
TABLE 230 Japan Effervescent tablet market, By End User, 2019-2028 (USD Million)
TABELLE 231 Japanischer Markt für Brausetabletten, nach Vertriebskanal, 2019–2028 (in Mio. USD)
TABELLE 232 Chinesischer Markt für Brausetabletten, nach Produkten, 2019–2028 (in Mio. USD)
TABELLE 233 Chinesischer Markt für Nahrungsergänzungsmittel in Brausetabletten, nach Produkten, 2019–2028 (in Millionen USD)
TABELLE 234 Chinesischer Markt für Medikamente in Brausetabletten, nach Produkten, 2019–2028 (in Millionen USD)
TABELLE 235 Chinesischer Markt für Brausetabletten, nach Methode, 2019–2028 (in Mio. USD)
TABELLE 236 – Chinesischer Markt für Nassgranulation in Brausetabletten, nach Methode, 2019–2028 (in Mio. USD)
TABELLE 237 Chinesischer Markt für Brausetabletten, nach Typ, 2019–2028 (in Mio. USD)
TABELLE 238 Chinesischer Markt für Brausetabletten, nach Indikation, 2019–2028 (in Mio. USD)
TABELLE 239 Chinesischer Markt für Brausetabletten, nach Bevölkerungstyp, 2019–2028 (in Mio. USD)
TABELLE 240 Chinesischer Markt für Brausetabletten, nach Anwendung, 2019–2028 (in Mio. USD)
TABELLE 241 Chinesischer Markt für Brausetabletten, nach Endverbraucher, 2019–2028 (in Mio. USD)
TABELLE 242 Chinesischer Markt für Brausetabletten, nach Vertriebskanal, 2019–2028 (in Mio. USD)
TABELLE 243 Indischer Markt für Brausetabletten, nach Produkten, 2019–2028 (in Mio. USD)
TABELLE 244 Indischer Markt für Nahrungsergänzungsmittel in Brausetabletten, nach Produkten, 2019–2028 (in Mio. USD)
TABELLE 245 – Indischer Markt für Medikamente in Brausetabletten, nach Produkten, 2019–2028 (in Millionen USD)
TABELLE 246 Indischer Markt für Brausetabletten, nach Methode, 2019–2028 (in Mio. USD)
TABELLE 247 Indischer Markt für Nassgranulation in Brausetabletten, nach Methode, 2019–2028 (in Mio. USD)
TABELLE 248 Indischer Markt für Brausetabletten, nach Typ, 2019–2028 (in Mio. USD)
TABELLE 249 Indischer Markt für Brausetabletten, nach Indikation, 2019–2028 (in Mio. USD)
TABELLE 250 Brausetablettenmarkt in Indien, nach Bevölkerungstyp, 2019–2028 (in Mio. USD)
TABELLE 251 Indischer Markt für Brausetabletten, nach Anwendung, 2019–2028 (in Mio. USD)
TABELLE 252 Brausetablettenmarkt in Indien, nach Endverbraucher, 2019–2028 (in Mio. USD)
TABELLE 253 Indischer Markt für Brausetabletten, nach Vertriebskanal, 2019–2028 (in Mio. USD)
TABELLE 254 SÜDKOREA – Markt für Brausetabletten, nach Produkten, 2019–2028 (in Mio. USD)
TABELLE 255 SÜDKOREA – Markt für Nahrungsergänzungsmittel in Brausetabletten, nach Produkten, 2019–2028 (in Millionen USD)
TABELLE 256 SÜDKOREA – Markt für Medikamente in Brausetabletten, nach Produkten, 2019–2028 (in Millionen USD)
TABELLE 257 SÜDKOREA – Markt für Brausetabletten, nach Methode, 2019–2028 (in Millionen USD)
TABELLE 258 SÜDKOREA – Markt für Nassgranulation im Brausetablettenmarkt, nach Methode, 2019–2028 (in Mio. USD)
TABELLE 259 SÜDKOREA – Markt für Brausetabletten, nach Typ, 2019–2028 (in Mio. USD)
TABELLE 260 SÜDKOREA – Markt für Brausetabletten, nach Indikation, 2019–2028 (in Millionen USD)
TABELLE 261 SÜDKOREA – Markt für Brausetabletten, nach Bevölkerungstyp, 2019–2028 (in Millionen USD)
TABELLE 262 SÜDKOREA – Markt für Brausetabletten, nach Anwendung, 2019–2028 (in Mio. USD)
TABELLE 263 SÜDKOREA – Markt für Brausetabletten, nach Endverbraucher, 2019–2028 (in Millionen USD)
TABELLE 264 SÜDKOREA – Markt für Brausetabletten, nach Vertriebskanal, 2019–2028 (in Mio. USD)
TABELLE 265 Australischer Markt für Brausetabletten, nach Produkten, 2019–2028 (in Mio. USD)
TABELLE 266 Australischer Markt für Nahrungsergänzungsmittel in Brausetabletten, nach Produkten, 2019–2028 (in Mio. USD)
TABELLE 267 Australischer Markt für Medikamente in Brausetabletten, nach Produkten, 2019–2028 (in Mio. USD)
TABELLE 268 Australischer Markt für Brausetabletten, nach Methode, 2019–2028 (in Mio. USD)
TABELLE 269 – Australischer Markt für Nassgranulation in Brausetabletten, nach Methode, 2019–2028 (in Mio. USD)
TABELLE 270 Australischer Markt für Brausetabletten, nach Typ, 2019–2028 (in Mio. USD)
TABELLE 271 – Australischer Markt für Brausetabletten, nach Indikation, 2019–2028 (in Mio. USD)
TABELLE 272 Australischer Markt für Brausetabletten, nach Bevölkerungstyp, 2019–2028 (in Mio. USD)
TABELLE 273 Australischer Markt für Brausetabletten, nach Anwendung, 2019–2028 (in Mio. USD)
TABELLE 274 Australischer Markt für Brausetabletten, nach Endverbraucher, 2019–2028 (in Mio. USD)
TABELLE 275: Australischer Markt für Brausetabletten, nach Vertriebskanal, 2019–2028 (in Mio. USD)
TABELLE 276 Singapurischer Markt für Brausetabletten, nach Produkten, 2019–2028 (in Mio. USD)
TABELLE 277 Singapurischer Markt für Nahrungsergänzungsmittel in Brausetabletten, nach Produkten, 2019–2028 (in Mio. USD)
TABELLE 278 Singapurischer Markt für Medikamente in Brausetabletten, nach Produkten, 2019–2028 (in Mio. USD)
TABELLE 279 Brausetablettenmarkt in Singapur, nach Methode, 2019–2028 (in Mio. USD)
TABELLE 280 Singapurischer Markt für Nassgranulation in Brausetabletten, nach Methode, 2019–2028 (in Mio. USD)
TABELLE 281 Markt für Brausetabletten in Singapur, nach Typ, 2019–2028 (in Mio. USD)
TABELLE 282 Markt für Brausetabletten in Singapur, nach Indikation, 2019–2028 (in Mio. USD)
TABELLE 283 Markt für Brausetabletten in Singapur, nach Bevölkerungstyp, 2019–2028 (in Mio. USD)
TABELLE 284 Markt für Brausetabletten in Singapur, nach Anwendung, 2019–2028 (in Mio. USD)
TABELLE 285 Markt für Brausetabletten in Singapur, nach Endverbraucher, 2019–2028 (in Mio. USD)
TABELLE 286 Brausetablettenmarkt in Singapur, nach Vertriebskanal, 2019–2028 (in Mio. USD)
TABELLE 287 Markt für Brausetabletten in Thailand, nach Produkten, 2019–2028 (in Mio. USD)
TABELLE 288 Thailand: Markt für Nahrungsergänzungsmittel in Brausetabletten, nach Produkten, 2019–2028 (in Mio. USD)
TABELLE 289 Markt für Brausetabletten in Thailand, nach Produkten, 2019–2028 (in Mio. USD)
TABELLE 290 Markt für Brausetabletten in Thailand, nach Methode, 2019–2028 (in Millionen USD)
TABELLE 291 Thailand: Markt für Nassgranulation in Brausetabletten, nach Methode, 2019–2028 (in Mio. USD)
TABELLE 292 Markt für Brausetabletten in Thailand, nach Typ, 2019–2028 (in Mio. USD)
TABELLE 293 Brausetablettenmarkt in Thailand, nach Indikation, 2019–2028 (in Mio. USD)
TABELLE 294 Markt für Brausetabletten in Thailand, nach Bevölkerungstyp, 2019–2028 (in Mio. USD)
TABELLE 295 Markt für Brausetabletten in Thailand, nach Anwendung, 2019–2028 (in Mio. USD)
TABELLE 296 Markt für Brausetabletten in Thailand, nach Endverbraucher, 2019–2028 (in Mio. USD)
TABELLE 297 Markt für Brausetabletten in Thailand, nach Vertriebskanal, 2019–2028 (in Mio. USD)
TABLE 298 Malaysia Effervescent tablet market, By Products, 2019-2028 (USD Million)
TABLE 299 Malaysia Supplements in Effervescent tablet market, By Products, 2019-2028 (USD Million)
TABLE 300 Malaysia Medication in Effervescent tablet market, By Products, 2019-2028 (USD Million)
TABLE 301 Malaysia Effervescent tablet market, By Method, 2019-2028 (USD Million)
TABLE 302 Malaysia Wet Granulation in Effervescent tablet market, By Method, 2019-2028 (USD Million)
TABLE 303 Malaysia Effervescent tablet market, By Type, 2019-2028 (USD Million)
TABLE 304 Malaysia Effervescent tablet market, By Indication, 2019-2028 (USD Million)
TABLE 305 Malaysia Effervescent tablet market, By Population Type, 2019-2028 (USD Million)
TABLE 306 Malaysia Effervescent tablet market, By Application, 2019-2028 (USD Million)
TABLE 307 Malaysia Effervescent tablet market, By End User, 2019-2028 (USD Million)
TABLE 308 Malaysia Effervescent tablet market, By Distribution Channel, 2019-2028 (USD Million)
TABLE 309 Indonesia Effervescent tablet market, By Products, 2019-2028 (USD Million)
TABLE 310 Indonesia Supplements in Effervescent tablet market, By Products, 2019-2028 (USD Million)
TABLE 311 Indonesia Medication in Effervescent tablet market, By Products, 2019-2028 (USD Million)
TABLE 312 Indonesia Effervescent tablet market, By Method, 2019-2028 (USD Million)
TABLE 313 Indonesia Wet Granulation in Effervescent tablet market, By Method, 2019-2028 (USD Million)
TABLE 314 Indonesia Effervescent tablet market, By Type, 2019-2028 (USD Million)
TABLE 315 Indonesia Effervescent tablet market, By Indication, 2019-2028 (USD Million)
TABLE 316 Indonesia Effervescent tablet market, By Population Type, 2019-2028 (USD Million)
TABLE 317 Indonesia Effervescent tablet market, By Application, 2019-2028 (USD Million)
TABLE 318 Indonesia Effervescent tablet market, By End User, 2019-2028 (USD Million)
TABLE 319 Indonesia Effervescent tablet market, By Distribution Channel, 2019-2028 (USD Million)
TABLE 320 Philippines Effervescent tablet market, By Products, 2019-2028 (USD Million)
TABLE 321 Philippines Supplements in Effervescent tablet market, By Products, 2019-2028 (USD Million)
TABLE 322 Philippines Medication in Effervescent tablet market, By Products, 2019-2028 (USD Million)
TABLE 323 Philippines Effervescent tablet market, By Method, 2019-2028 (USD Million)
TABLE 324 Philippines Wet Granulation in Effervescent tablet market, By Method, 2019-2028 (USD Million)
TABLE 325 Philippines Effervescent tablet market, By Type, 2019-2028 (USD Million)
TABLE 326 Philippines Effervescent tablet market, By Indication, 2019-2028 (USD Million)
TABLE 327 Philippines Effervescent tablet market, By Population Type, 2019-2028 (USD Million)
TABLE 328 Philippines Effervescent tablet market, By Application, 2019-2028 (USD Million)
TABLE 329 Philippines Effervescent tablet market, By End User, 2019-2028 (USD Million)
TABLE 330 Philippines Effervescent tablet market, By Distribution Channel, 2019-2028 (USD Million)
TABLE 331 Vietnam Effervescent tablet market, By Products, 2019-2028 (USD Million)
TABLE 332 Vietnam Supplements in Effervescent tablet market, By Products, 2019-2028 (USD Million)
TABLE 333 Vietnam Medication in Effervescent tablet market, By Products, 2019-2028 (USD Million)
TABLE 334 Vietnam Effervescent tablet market, By Method, 2019-2028 (USD Million)
TABLE 335 Vietnam Wet Granulation in Effervescent tablet market, By Method, 2019-2028 (USD Million)
TABLE 336 Vietnam Effervescent tablet market, By Type, 2019-2028 (USD Million)
TABLE 337 Vietnam Effervescent tablet market, By Indication, 2019-2028 (USD Million)
TABLE 338 Vietnam Effervescent tablet market, By Population Type, 2019-2028 (USD Million)
TABLE 339 Vietnam Effervescent tablet market, By Application, 2019-2028 (USD Million)
TABLE 340 Vietnam Effervescent tablet market, By End User, 2019-2028 (USD Million)
TABLE 341 Vietnam Effervescent tablet market, By Distribution Channel, 2019-2028 (USD Million)
TABLE 342 Rest of Asia-Pacific Effervescent tablet market, By Products, 2019-2028 (USD Million)
TABLE 343 Europe effervescent tablet market, By country, 2019-2028 (USD Million)
TABLE 344 Europe effervescent tablet market, By Products, 2019-2028 (USD Million)
TABLE 345 Europe Supplements in effervescent tablet market, By Products, 2019-2028 (USD Million)
TABLE 346 Europe Medication in effervescent tablet market, By Products, 2019-2028 (USD Million)
TABLE 347 Europe effervescent tablet market, By Methods, 2019-2028 (USD Million)
TABLE 348 Europe Wet Granulation in effervescent tablet market, By Methods, 2019-2028 (USD Million)
TABLE 349 Europe effervescent tablet market, By Type, 2019-2028 (USD Million)
TABLE 350 Europe effervescent tablet market, By Indication, 2019-2028 (USD Million)
TABLE 351 Europe effervescent tablet market, By Population Type, 2019-2028 (USD Million)
TABLE 352 Europe effervescent tablet market, By Application, 2019-2028 (USD Million)
TABLE 353 Europe effervescent tablet market, By End User, 2019-2028 (USD Million)
TABLE 354 Europe effervescent tablet market, By Distribution Channel, 2019-2028 (USD Million)
TABLE 355 Germany effervescent tablet market, By Products, 2019-2028 (USD Million)
TABLE 356 Germany Supplements in effervescent tablet market, By Products, 2019-2028 (USD Million)
TABLE 357 Germany Medication in effervescent tablet market, By Products, 2019-2028 (USD Million)
TABLE 358 Germany effervescent tablet market, By Methods, 2019-2028 (USD Million)
TABLE 359 Germany Wet Granulation in effervescent tablet market, By Methods, 2019-2028 (USD Million)
TABLE 360 Germany effervescent tablet market, By Type, 2019-2028 (USD Million)
TABLE 361 Germany effervescent tablet market, By Indication, 2019-2028 (USD Million)
TABLE 362 Germany effervescent tablet market, By Population Type, 2019-2028 (USD Million)
TABLE 363 Germany effervescent tablet market, By Application, 2019-2028 (USD Million)
TABLE 364 Germany effervescent tablet market, By End User, 2019-2028 (USD Million)
TABLE 365 Germany effervescent tablet market, By Distribution Channel, 2019-2028 (USD Million)
TABLE 366 Italy effervescent tablet market, By Products, 2019-2028 (USD Million)
TABLE 367 Italy Supplements in effervescent tablet market, By Products, 2019-2028 (USD Million)
TABLE 368 Italy Medication in effervescent tablet market, By Products, 2019-2028 (USD Million)
TABLE 369 Italy effervescent tablet market, By Methods, 2019-2028 (USD Million)
TABLE 370 Italy Wet Granulation in effervescent tablet market, By Methods, 2019-2028 (USD Million)
TABLE 371 Italy effervescent tablet market, By Type, 2019-2028 (USD Million)
TABLE 372 Italy effervescent tablet market, By Indication, 2019-2028 (USD Million)
TABLE 373 Italy effervescent tablet market, By Population Type, 2019-2028 (USD Million)
TABLE 374 Italy effervescent tablet market, By Application, 2019-2028 (USD Million)
TABLE 375 Italy effervescent tablet market, By End User, 2019-2028 (USD Million)
TABLE 376 Italy effervescent tablet market, By Distribution Channel, 2019-2028 (USD Million)
TABLE 377 France effervescent tablet market, By Products, 2019-2028 (USD Million)
TABLE 378 France Supplements in effervescent tablet market, By Products, 2019-2028 (USD Million)
TABLE 379 France Medication in effervescent tablet market, By Products, 2019-2028 (USD Million)
TABLE 380 France effervescent tablet market, By Methods, 2019-2028 (USD Million)
TABLE 381 France Wet Granulation in effervescent tablet market, By Methods, 2019-2028 (USD Million)
TABLE 382 France effervescent tablet market, By Type, 2019-2028 (USD Million)
TABLE 383 France effervescent tablet market, By Indication, 2019-2028 (USD Million)
TABLE 384 France effervescent tablet market, By Population Type, 2019-2028 (USD Million)
TABLE 385 France effervescent tablet market, By Application, 2019-2028 (USD Million)
TABLE 386 France effervescent tablet market, By End User, 2019-2028 (USD Million)
TABLE 387 France effervescent tablet market, By Distribution Channel, 2019-2028 (USD Million)
TABLE 388 U.K. effervescent tablet market, By Products, 2019-2028 (USD Million)
TABLE 389 U.K. Supplements in effervescent tablet market, By Products, 2019-2028 (USD Million)
TABLE 390 U.K. Medication in effervescent tablet market, By Products, 2019-2028 (USD Million)
TABLE 391 U.K. effervescent tablet market, By Methods, 2019-2028 (USD Million)
TABLE 392 U.K. Wet Granulation in effervescent tablet market, By Methods, 2019-2028 (USD Million)
TABLE 393 U.K. effervescent tablet market, By Type, 2019-2028 (USD Million)
TABLE 394 U.K. effervescent tablet market, By Indication, 2019-2028 (USD Million)
TABLE 395 U.K. effervescent tablet market, By Population Type, 2019-2028 (USD Million)
TABLE 396 U.K. effervescent tablet market, By Application, 2019-2028 (USD Million)
TABLE 397 U.K. effervescent tablet market, By End User, 2019-2028 (USD Million)
TABLE 398 U.K. effervescent tablet market, By Distribution Channel, 2019-2028 (USD Million)
TABLE 399 Spain effervescent tablet market, By Products, 2019-2028 (USD Million)
TABLE 400 Spain Supplements in effervescent tablet market, By Products, 2019-2028 (USD Million)
TABLE 401 Spain Medication in effervescent tablet market, By Products, 2019-2028 (USD Million)
TABLE 402 Spain effervescent tablet market, By Methods, 2019-2028 (USD Million)
TABLE 403 Spain Wet Granulation in effervescent tablet market, By Methods, 2019-2028 (USD Million)
TABLE 404 Spain effervescent tablet market, By Type, 2019-2028 (USD Million)
TABLE 405 Spain effervescent tablet market, By Indication, 2019-2028 (USD Million)
TABLE 406 Spain effervescent tablet market, By Population Type, 2019-2028 (USD Million)
TABLE 407 Spain effervescent tablet market, By Application, 2019-2028 (USD Million)
TABLE 408 Spain effervescent tablet market, By End User, 2019-2028 (USD Million)
TABLE 409 Spain effervescent tablet market, By Distribution Channel, 2019-2028 (USD Million)
TABLE 410 Netherlands effervescent tablet market, By Products, 2019-2028 (USD Million)
TABLE 411 Netherlands Supplements in effervescent tablet market, By Products, 2019-2028 (USD Million)
TABLE 412 Netherlands Medication in effervescent tablet market, By Products, 2019-2028 (USD Million)
TABLE 413 Netherlands effervescent tablet market, By Methods, 2019-2028 (USD Million)
TABLE 414 Netherlands Wet Granulation in effervescent tablet market, By Methods, 2019-2028 (USD Million)
TABLE 415 Netherlands effervescent tablet market, By Type, 2019-2028 (USD Million)
TABLE 416 Netherlands effervescent tablet market, By Indication, 2019-2028 (USD Million)
TABLE 417 Netherlands effervescent tablet market, By Population Type, 2019-2028 (USD Million)
TABLE 418 Netherlands effervescent tablet market, By Application, 2019-2028 (USD Million)
TABLE 419 Netherlands effervescent tablet market, By End User, 2019-2028 (USD Million)
TABLE 420 Netherlands effervescent tablet market, By Distribution Channel, 2019-2028 (USD Million)
TABLE 421 Russia effervescent tablet market, By Products, 2019-2028 (USD Million)
TABLE 422 Russia Supplements in effervescent tablet market, By Products, 2019-2028 (USD Million)
TABLE 423 Russia Medication in effervescent tablet market, By Products, 2019-2028 (USD Million)
TABLE 424 Russia effervescent tablet market, By Methods, 2019-2028 (USD Million)
TABLE 425 Russia Wet Granulation in effervescent tablet market, By Methods, 2019-2028 (USD Million)
TABLE 426 Russia effervescent tablet market, By Type, 2019-2028 (USD Million)
TABLE 427 Russia effervescent tablet market, By Indication, 2019-2028 (USD Million)
TABLE 428 Russia effervescent tablet market, By Population Type, 2019-2028 (USD Million)
TABLE 429 Russia effervescent tablet market, By Application, 2019-2028 (USD Million)
TABLE 430 Russia effervescent tablet market, By End User, 2019-2028 (USD Million)
TABLE 431 Russia effervescent tablet market, By Distribution Channel, 2019-2028 (USD Million)
TABLE 432 Switzerland effervescent tablet market, By Products, 2019-2028 (USD Million)
TABLE 433 Switzerland Supplements in effervescent tablet market, By Products, 2019-2028 (USD Million)
TABLE 434 Switzerland Medication in effervescent tablet market, By Products, 2019-2028 (USD Million)
TABLE 435 Switzerland effervescent tablet market, By Methods, 2019-2028 (USD Million)
TABLE 436 Switzerland Wet Granulation in effervescent tablet market, By Methods, 2019-2028 (USD Million)
TABLE 437 Switzerland effervescent tablet market, By Type, 2019-2028 (USD Million)
TABLE 438 Switzerland effervescent tablet market, By Indication, 2019-2028 (USD Million)
TABLE 439 Switzerland effervescent tablet market, By Population Type, 2019-2028 (USD Million)
TABLE 440 Switzerland effervescent tablet market, By Application, 2019-2028 (USD Million)
TABLE 441 Switzerland effervescent tablet market, By End User, 2019-2028 (USD Million)
TABLE 442 Switzerland effervescent tablet market, By Distribution Channel, 2019-2028 (USD Million)
TABLE 443 Turkey effervescent tablet market, By Products, 2019-2028 (USD Million)
TABLE 444 Turkey Supplements in effervescent tablet market, By Products, 2019-2028 (USD Million)
TABLE 445 Turkey Medication in effervescent tablet market, By Products, 2019-2028 (USD Million)
TABLE 446 Turkey effervescent tablet market, By Methods, 2019-2028 (USD Million)
TABLE 447 Turkey Wet Granulation in effervescent tablet market, By Methods, 2019-2028 (USD Million)
TABLE 448 Turkey effervescent tablet market, By Type, 2019-2028 (USD Million)
TABLE 449 Turkey effervescent tablet market, By Indication, 2019-2028 (USD Million)
TABLE 450 Turkey effervescent tablet market, By Population Type, 2019-2028 (USD Million)
TABLE 451 Turkey effervescent tablet market, By Application, 2019-2028 (USD Million)
TABLE 452 Turkey effervescent tablet market, By End User, 2019-2028 (USD Million)
TABLE 453 Turkey effervescent tablet market, By Distribution Channel, 2019-2028 (USD Million)
TABLE 454 Austria effervescent tablet market, By Products, 2019-2028 (USD Million)
TABLE 455 Austria Supplements in effervescent tablet market, By Products, 2019-2028 (USD Million)
TABLE 456 Austria Medication in effervescent tablet market, By Products, 2019-2028 (USD Million)
TABLE 457 Austria effervescent tablet market, By Methods, 2019-2028 (USD Million)
TABLE 458 Austria Wet Granulation in effervescent tablet market, By Methods, 2019-2028 (USD Million)
TABLE 459 Austria effervescent tablet market, By Type, 2019-2028 (USD Million)
TABLE 460 Austria effervescent tablet market, By Indication, 2019-2028 (USD Million)
TABLE 461 Austria effervescent tablet market, By Population Type, 2019-2028 (USD Million)
TABLE 462 Austria effervescent tablet market, By Application, 2019-2028 (USD Million)
TABLE 463 Austria effervescent tablet market, By End User, 2019-2028 (USD Million)
TABLE 464 Austria effervescent tablet market, By Distribution Channel, 2019-2028 (USD Million)
TABLE 465 Norway effervescent tablet market, By Products, 2019-2028 (USD Million)
TABLE 466 Norway Supplements in effervescent tablet market, By Products, 2019-2028 (USD Million)
TABLE 467 Norway Medication in effervescent tablet market, By Products, 2019-2028 (USD Million)
TABLE 468 Norway effervescent tablet market, By Methods, 2019-2028 (USD Million)
TABLE 469 Norway Wet Granulation in effervescent tablet market, By Methods, 2019-2028 (USD Million)
TABLE 470 Norway effervescent tablet market, By Type, 2019-2028 (USD Million)
TABLE 471 Norway effervescent tablet market, By Indication, 2019-2028 (USD Million)
TABLE 472 Norway effervescent tablet market, By Population Type, 2019-2028 (USD Million)
TABLE 473 Norway effervescent tablet market, By Application, 2019-2028 (USD Million)
TABLE 474 Norway effervescent tablet market, By End User, 2019-2028 (USD Million)
TABLE 475 Norway effervescent tablet market, By Distribution Channel, 2019-2028 (USD Million)
TABLE 476 Hungary effervescent tablet market, By Products, 2019-2028 (USD Million)
TABLE 477 Hungary Supplements in effervescent tablet market, By Products, 2019-2028 (USD Million)
TABLE 478 Hungary Medication in effervescent tablet market, By Products, 2019-2028 (USD Million)
TABLE 479 Hungary effervescent tablet market, By Methods, 2019-2028 (USD Million)
TABLE 480 Hungary Wet Granulation in effervescent tablet market, By Methods, 2019-2028 (USD Million)
TABLE 481 Hungary effervescent tablet market, By Type, 2019-2028 (USD Million)
TABLE 482 Hungary effervescent tablet market, By Indication, 2019-2028 (USD Million)
TABLE 483 Hungary effervescent tablet market, By Population Type, 2019-2028 (USD Million)
TABLE 484 Hungary effervescent tablet market, By Application, 2019-2028 (USD Million)
TABLE 485 Hungary effervescent tablet market, By End User, 2019-2028 (USD Million)
TABLE 486 Hungary effervescent tablet market, By Distribution Channel, 2019-2028 (USD Million)
TABLE 487 Lithuania effervescent tablet market, By Products, 2019-2028 (USD Million)
TABLE 488 Lithuania Supplements in effervescent tablet market, By Products, 2019-2028 (USD Million)
TABLE 489 Lithuania Medication in effervescent tablet market, By Products, 2019-2028 (USD Million)
TABLE 490 Lithuania effervescent tablet market, By Methods, 2019-2028 (USD Million)
TABLE 491 Lithuania Wet Granulation in effervescent tablet market, By Methods, 2019-2028 (USD Million)
TABLE 492 Lithuania effervescent tablet market, By Type, 2019-2028 (USD Million)
TABLE 493 Lithuania effervescent tablet market, By Indication, 2019-2028 (USD Million)
TABLE 494 Lithuania effervescent tablet market, By Population Type, 2019-2028 (USD Million)
TABLE 495 Lithuania effervescent tablet market, By Application, 2019-2028 (USD Million)
TABLE 496 Lithuania effervescent tablet market, By End User, 2019-2028 (USD Million)
TABLE 497 Lithuania effervescent tablet market, By Distribution Channel, 2019-2028 (USD Million)
TABLE 498 Ireland effervescent tablet market, By Products, 2019-2028 (USD Million)
TABLE 499 Ireland Supplements in effervescent tablet market, By Products, 2019-2028 (USD Million)
TABLE 500 Ireland Medication in effervescent tablet market, By Products, 2019-2028 (USD Million)
TABLE 501 Ireland effervescent tablet market, By Methods, 2019-2028 (USD Million)
TABLE 502 Ireland Wet Granulation in effervescent tablet market, By Methods, 2019-2028 (USD Million)
TABLE 503 Ireland effervescent tablet market, By Type, 2019-2028 (USD Million)
TABLE 504 Ireland effervescent tablet market, By Indication, 2019-2028 (USD Million)
TABLE 505 Ireland effervescent tablet market, By Population Type, 2019-2028 (USD Million)
TABLE 506 Ireland effervescent tablet market, By Application, 2019-2028 (USD Million)
TABLE 507 Ireland effervescent tablet market, By End User, 2019-2028 (USD Million)
TABLE 508 Ireland effervescent tablet market, By Distribution Channel, 2019-2028 (USD Million)
TABLE 509 Poland effervescent tablet market, By Products, 2019-2028 (USD Million)
TABLE 510 Poland Supplements in effervescent tablet market, By Products, 2019-2028 (USD Million)
TABLE 511 Poland Medication in effervescent tablet market, By Products, 2019-2028 (USD Million)
TABLE 512 Poland effervescent tablet market, By Methods, 2019-2028 (USD Million)
TABLE 513 Poland Wet Granulation in effervescent tablet market, By Methods, 2019-2028 (USD Million)
TABLE 514 Poland effervescent tablet market, By Type, 2019-2028 (USD Million)
TABLE 515 Poland effervescent tablet market, By Indication, 2019-2028 (USD Million)
TABLE 516 Poland effervescent tablet market, By Population Type, 2019-2028 (USD Million)
TABLE 517 Poland effervescent tablet market, By Application, 2019-2028 (USD Million)
TABLE 518 Poland effervescent tablet market, By End User, 2019-2028 (USD Million)
TABLE 519 Poland effervescent tablet market, By Distribution Channel, 2019-2028 (USD Million)
TABLE 520 REST OF Europe effervescent tablet market, By Products, 2019-2028 (USD Million)
Abbildungsverzeichnis
FIGURE 1 Global Effervescent tablet market: segmentation
FIGURE 2 Global Effervescent tablet market: data triangulation
FIGURE 3 Global Effervescent tablet market: DROC ANALYSIS
FIGURE 4 Global Effervescent tablet market: global vs REGIONAL MARKET ANALYSIS
FIGURE 5 Global Effervescent tablet market : COMPANY RESEARCH ANALYSIS
FIGURE 6 Global Effervescent tablet market: INTERVIEW DEMOGRAPHICS
FIGURE 7 Global Effervescent tablet market: DBMR MARKET POSITION GRID
FIGURE 8 GLOBAL Effervescent tablet MARKET: MARKET APPLICATION COVERAGE GRID
FIGURE 9 Global Effervescent tablet market: vendor share analysis
FIGURE 10 Global Effervescent tablet market: SEGMENTATION
FIGURE 11 Increase in chronic diseases and R&D activities are expected to drive THE Global Effervescent tablet market IN THE FORECAST PERIOD of 2021 to 2028
FIGURE 12 DIAGNOSIS segment is expected to account for the largest share of the Global Effervescent tablet market in 2021 & 2028
FIGURE 13 NORTH AMERICA is expected to DOMINATE the gLOBAL Effervescent tablet market and ASIA-PACIFIC IS EXPECTED TO GROW WITH THE HIGHEST CAGR IN THE FORECAST PERIOD OF 2021 TO 2028
FIGURE 14 asia-pacific is the fastest growing market for Effervescent tablet manufacturers in the forecast period of 2021 to 2028
FIGURE 15 DRIVERS, RESTRAINTS, OPPORTUNITIES AND CHALLENGEs OF Global EFFERVESCENT TABLET MARKET
FIGURE 16 global effervescent tablet market: BY PRODUCTS, 2020
FIGURE 17 global effervescent tablet market: BY PRODUCTS, 2020-2028 (USD Million)
FIGURE 18 global effervescent tablet market: BY PRODUCTS, CAGR (2021-2028)
FIGURE 19 global effervescent tablet market: BY PRODUCTS, LIFELINE CURVE
FIGURE 20 global effervescent tablet market: BY METHOD, 2020
FIGURE 21 global effervescent tablet market: BY METHOD, 2020-2028 (USD Million)
FIGURE 22 global effervescent tablet market: BY METHOD, CAGR (2021-2028)
FIGURE 23 global effervescent tablet market: BY METHOD, LIFELINE CURVE
FIGURE 24 global effervescent tablet market: BY TYPE, 2020
FIGURE 25 global effervescent tablet market: BY TYPE, 2020-2028 (USD Million)
FIGURE 26 global effervescent tablet market: BY TYPE, CAGR (2021-2028)
FIGURE 27 global effervescent tablet market: BY TYPE, LIFELINE CURVE
FIGURE 28 global effervescent tablet market: BY INDICATION, 2020
FIGURE 29 global effervescent tablet market: BY INDICATION, 2020-2028 (USD Million)
FIGURE 30 global effervescent tablet market: BY INDICATION, CAGR (2021-2028)
FIGURE 31 global effervescent tablet market: BY INDICATION, LIFELINE CURVE
FIGURE 32 global effervescent tablet market: BY POPULATION TYPE, 2020
FIGURE 33 global effervescent tablet market: BY POPULATION TYPE, 2020-2028 (USD Million)
FIGURE 34 global effervescent tablet market: BY POPULATION TYPE, CAGR (2021-2028)
FIGURE 35 global effervescent tablet market: BY POPULATION TYPE, LIFELINE CURVE
FIGURE 36 global effervescent tablet market: BY APPLICATION, 2020
FIGURE 37 global effervescent tablet market: BY APPLICATION, 2020-2028 (USD Million)
FIGURE 38 global effervescent tablet market: BY APPLICATION, CAGR (2021-2028)
FIGURE 39 global effervescent tablet market: BY APPLICATION, LIFELINE CURVE
FIGURE 40 global effervescent tablet market: BY END USER, 2020
FIGURE 41 global effervescent tablet market: BY END USER, 2020-2028 (USD Million)
FIGURE 42 global effervescent tablet market: BY END USER, CAGR (2021-2028)
FIGURE 43 global effervescent tablet market: BY END USER, LIFELINE CURVE
FIGURE 44 global effervescent tablet market: BY DISTRIBUTION CHANNEL, 2020
FIGURE 45 global effervescent tablet market: BY DISTRIBUTION CHANNEL, 2020-2028 (USD Million)
FIGURE 46 global effervescent tablet market: BY DISTRIBUTION CHANNEL, CAGR (2021-2028)
FIGURE 47 global effervescent tablet market: BY DISTRIBUTION CHANNEL, LIFELINE CURVE
FIGURE 48 GLOBAL Effervescent tablet market: SNAPSHOT (2020)
FIGURE 49 GLOBAL Effervescent tablet market: BY REGION (2020)
FIGURE 50 GLOBAL Effervescent tablet market: BY REGION (2021 & 2028)
ABBILDUNG 51 GLOBALER Markt für Brausetabletten: NACH REGION (2020 und 2028)
ABBILDUNG 52 GLOBALER Markt für Brausetabletten: NACH Produkten (2021–2028)
ABBILDUNG 53 Brausetablettenmarkt in Nordamerika: ÜBERSICHT (2020)
ABBILDUNG 54: Brausetablettenmarkt in Nordamerika: Nach Ländern (2020)
ABBILDUNG 55: Brausetablettenmarkt in Nordamerika: Nach Ländern (2021 und 2028)
ABBILDUNG 56: Brausetablettenmarkt in Nordamerika: Nach Ländern (2020 und 2028)
ABBILDUNG 57 Brausetablettenmarkt in Nordamerika: Nach Produkten (2021–2028)
ABBILDUNG 58 SÜDAMERIKANISCHER Markt für Brausetabletten: ÜBERSICHT (2020)
ABBILDUNG 59 SÜDAMERIKANISCHER Markt für Brausetabletten: NACH LÄNDERN (2020)
ABBILDUNG 60 SÜDAMERIKANISCHER Markt für Brausetabletten: NACH LÄNDERN (2021 UND 2028)
ABBILDUNG 61 SÜDAMERIKANISCHER Markt für Brausetabletten: NACH LÄNDERN (2020 UND 2028)
ABBILDUNG 62 SÜDAMERIKANISCHER BRAUSETABLETTEN-Markt: NACH Produkten (2021–2028)
ABBILDUNG 63 NAHER OSTEN UND AFRIKA Markt für Brausetabletten: ÜBERBLICK (2020)
ABBILDUNG 64 NAHER OSTEN UND AFRIKA Markt für Brausetabletten: NACH LÄNDERN (2020)
ABBILDUNG 65 NAHER OSTEN UND AFRIKA – Markt für Brausetabletten: NACH LÄNDERN (2021 und 2028)
ABBILDUNG 66 NAHER OSTEN UND AFRIKA Markt für Brausetabletten: NACH LÄNDERN (2020 und 2028)
ABBILDUNG 67 NAHER OSTEN UND AFRIKA – Markt für Brausetabletten: NACH Produkten (2021–2028)
ABBILDUNG 68 Markt für Brausetabletten im asiatisch-pazifischen Raum: ÜBERSICHT (2020)
ABBILDUNG 69 Markt für Brausetabletten im asiatisch-pazifischen Raum: NACH LÄNDERN (2020)
ABBILDUNG 70 Markt für Brausetabletten im asiatisch-pazifischen Raum: NACH LÄNDERN (2021 und 2028)
ABBILDUNG 71 Markt für Brausetabletten im asiatisch-pazifischen Raum: NACH LÄNDERN (2020 und 2028)
ABBILDUNG 72 Markt für Brausetabletten im asiatisch-pazifischen Raum: NACH Produkten (2021–2028)
ABBILDUNG 73 EUROPÄISCHER Markt für Brausetabletten: ÜBERSICHT (2020)
ABBILDUNG 74 EUROPÄISCHER BRAUSETABLETTEN-MARKT: NACH LÄNDERN (2020)
ABBILDUNG 75 EUROPÄISCHER BRAUSETABLETTEN-MARKT: NACH LÄNDERN (2021 UND 2028)
ABBILDUNG 76 EUROPÄISCHER Markt für Brausetabletten: NACH LÄNDERN (2020 UND 2028)
ABBILDUNG 77 EUROPÄISCHER BRAUSETABLETTEN-MARKT: NACH PRODUKTEN (2021–2028)
ABBILDUNG 78 Weltweiter Markt für Brausetabletten: Unternehmensanteil 2020 (%)
ABBILDUNG 79 Brausetablettenmarkt in Nordamerika: Unternehmensanteil 2020 (%)
ABBILDUNG 80 Europäischer Markt für Brausetabletten: Unternehmensanteil 2020 (%)
ABBILDUNG 81 Markt für Brausetabletten im asiatisch-pazifischen Raum: Unternehmensanteil 2020 (%)
Forschungsmethodik
Die Datenerfassung und Basisjahresanalyse werden mithilfe von Datenerfassungsmodulen mit großen Stichprobengrößen durchgeführt. Die Phase umfasst das Erhalten von Marktinformationen oder verwandten Daten aus verschiedenen Quellen und Strategien. Sie umfasst die Prüfung und Planung aller aus der Vergangenheit im Voraus erfassten Daten. Sie umfasst auch die Prüfung von Informationsinkonsistenzen, die in verschiedenen Informationsquellen auftreten. Die Marktdaten werden mithilfe von marktstatistischen und kohärenten Modellen analysiert und geschätzt. Darüber hinaus sind Marktanteilsanalyse und Schlüsseltrendanalyse die wichtigsten Erfolgsfaktoren im Marktbericht. Um mehr zu erfahren, fordern Sie bitte einen Analystenanruf an oder geben Sie Ihre Anfrage ein.
Die wichtigste Forschungsmethodik, die vom DBMR-Forschungsteam verwendet wird, ist die Datentriangulation, die Data Mining, die Analyse der Auswirkungen von Datenvariablen auf den Markt und die primäre (Branchenexperten-)Validierung umfasst. Zu den Datenmodellen gehören ein Lieferantenpositionierungsraster, eine Marktzeitlinienanalyse, ein Marktüberblick und -leitfaden, ein Firmenpositionierungsraster, eine Patentanalyse, eine Preisanalyse, eine Firmenmarktanteilsanalyse, Messstandards, eine globale versus eine regionale und Lieferantenanteilsanalyse. Um mehr über die Forschungsmethodik zu erfahren, senden Sie eine Anfrage an unsere Branchenexperten.
Anpassung möglich
Data Bridge Market Research ist ein führendes Unternehmen in der fortgeschrittenen formativen Forschung. Wir sind stolz darauf, unseren bestehenden und neuen Kunden Daten und Analysen zu bieten, die zu ihren Zielen passen. Der Bericht kann angepasst werden, um Preistrendanalysen von Zielmarken, Marktverständnis für zusätzliche Länder (fordern Sie die Länderliste an), Daten zu klinischen Studienergebnissen, Literaturübersicht, Analysen des Marktes für aufgearbeitete Produkte und Produktbasis einzuschließen. Marktanalysen von Zielkonkurrenten können von technologiebasierten Analysen bis hin zu Marktportfoliostrategien analysiert werden. Wir können so viele Wettbewerber hinzufügen, wie Sie Daten in dem von Ihnen gewünschten Format und Datenstil benötigen. Unser Analystenteam kann Ihnen auch Daten in groben Excel-Rohdateien und Pivot-Tabellen (Fact Book) bereitstellen oder Sie bei der Erstellung von Präsentationen aus den im Bericht verfügbaren Datensätzen unterstützen.

