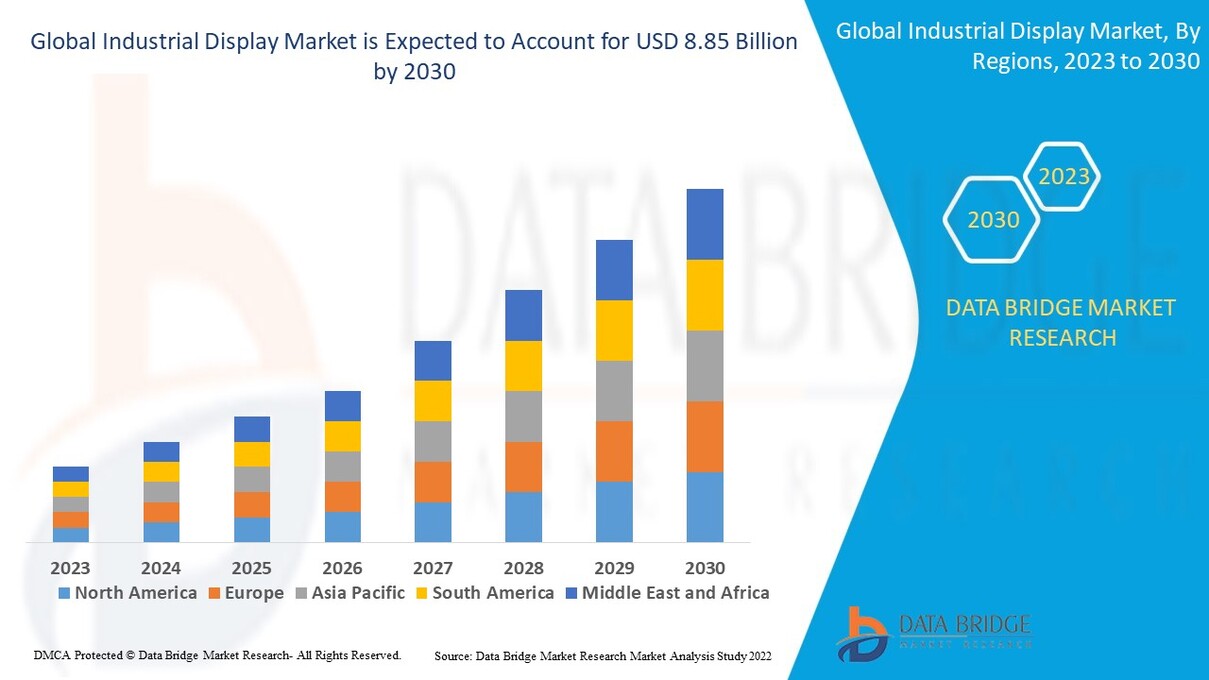
Global Industrial Display Market
Marktgröße in Milliarden USD
CAGR :
% 
 USD
5.30 Billion
USD
8.85 Billion
2022
2030
USD
5.30 Billion
USD
8.85 Billion
2022
2030
| 2023 –2030 | |
| USD 5.30 Billion | |
| USD 8.85 Billion | |
| % | |
Globaler Markt für Industriedisplays nach Typ (robuste Displays, Open-Frame-Monitore, Multi-Touch-Display (P-Cap), Frontdisplay, USB Type-C-Display, SDI-Display, Display zur Rückmontage, Monitore zur Panelmontage, Marine-Displays, Videowände, sonstige), Panelgröße (bis zu 14 Zoll, 14 bis 21 Zoll, 21 bis 40 Zoll, 40 Zoll und mehr), Technologie (LCD, LED, OLED, E-Paper-Display), Kommunikationstyp (Seriell, Ethernet, Mobilfunknetz, Industrielle Kommunikation, RF/Zigbee/IR, Jason/MQTT, sonstige), Anwendung (HMI, Remote-Anwendung, Interaktives Display, Digital Signage, Bildgebung), Vertikal (Fertigung, Energie und Strom, Militär und Avionik, Öl und Gas, Metalle und Bergbau, Transport, sonstige) – Branchentrends und Prognose bis 2030.
Marktanalyse und Größe für Industriedisplays
Industrielle Displaytechnologien haben in den letzten Jahren bemerkenswerte Veränderungen und ein beachtliches Wachstum erfahren. Zum Wachstum beigetragen haben fortschrittliche und zukunftsweisende Funktionen wie große mm-Pixelabstände, sensible Touch-Funktionen und unbegrenzte Skalierbarkeitslösungen. „OLED“ wird im Prognosezeitraum voraussichtlich das am schnellsten wachsende Technologiesegment sein, aufgrund seiner einzigartigen Eigenschaften wie hoher Helligkeit, geringem Stromverbrauch und einem höheren Kontrastverhältnis von OLED-Displays. Im Zeitalter der Digitaltechnologie werden diese Displays im Prognosezeitraum weltweit in der Werbung weit verbreitet sein.
Data Bridge Market Research analysiert, dass der Markt für Industriedisplays im Jahr 2022 einen Wert von 5,30 Milliarden USD hatte und bis 2030 voraussichtlich 8,85 Milliarden USD erreichen wird, was einer durchschnittlichen jährlichen Wachstumsrate von 6,60 % während des Prognosezeitraums von 2023 bis 2030 entspricht. Neben Einblicken in Marktszenarien wie Marktwert, Wachstumsrate, Segmentierung, geografische Abdeckung und wichtige Akteure enthalten die von Data Bridge Market Research zusammengestellten Marktberichte auch eingehende Expertenanalysen, geografisch dargestellte Produktion und Kapazität nach Unternehmen, Netzwerklayouts von Distributoren und Partnern, detaillierte und aktualisierte Preistrendanalysen und Defizitanalysen von Lieferkette und Nachfrage.
Umfang und Segmentierung des Marktes für Industriedisplays
|
Berichtsmetrik |
Details |
|
Prognosezeitraum |
2023 bis 2030 |
|
Basisjahr |
2022 |
|
Historische Jahre |
2021 (anpassbar auf 2015–2020) |
|
Quantitative Einheiten |
Umsatz in Mrd. USD, Volumen in Einheiten, Preise in USD |
|
Abgedeckte Segmente |
Typ (Robuste Displays, Open-Frame-Monitore, Multi-Touch-Display (P-Cap), Frontdisplay, USB Type-C-Display, SDI-Display, Display zur Rückmontage, Monitore zur Panelmontage, Marine-Displays, Videowände, Sonstiges), Panelgröße (Bis zu 14 Zoll, 14 bis 21 Zoll, 21 bis 40 Zoll, 40 Zoll und mehr), Technologie (LCD, LED, OLED, E-Paper-Display), Kommunikationstyp (Seriell, Ethernet, Mobilfunknetz, Industrielle Kommunikation, RF/Zigbee/IR, Jason/MQTT, Sonstiges), Anwendung (HMI, Remote-Anwendung, Interaktives Display, Digital Signage, Bildgebung), Vertikal (Fertigung, Energie und Strom, Militär und Avionik, Öl und Gas, Metalle und Bergbau, Transport, Sonstiges) |
|
Abgedeckte Länder |
USA, Kanada und Mexiko in Nordamerika, Deutschland, Frankreich, Großbritannien, Niederlande, Schweiz, Belgien, Russland, Italien, Spanien, Türkei, Restliches Europa in Europa, China, Japan, Indien, Südkorea, Singapur, Malaysia, Australien, Thailand, Indonesien, Philippinen, Restlicher Asien-Pazifik-Raum (APAC) in Asien-Pazifik (APAC), Saudi-Arabien, Vereinigte Arabische Emirate, Südafrika, Ägypten, Israel, Restlicher Naher Osten und Afrika (MEA) als Teil von Naher Osten und Afrika (MEA), Brasilien, Argentinien und Restliches Südamerika als Teil von Südamerika |
|
Abgedeckte Marktteilnehmer |
Samsung (Südkorea), LG Display (Südkorea), Panasonic Corporation Co., Ltd (Japan), Japan Display Inc (Japan), AUO Corporation (Taiwan), BOE Technology Group Co., Ltd (China), Corning Incorporated (USA), DuPont (USA), FlexEnable Limited (Großbritannien), Kateeva (USA), SONY INDIA (Indien), Pioneer Corporation (Japan), WiseChip Semiconductor Inc. (Taiwan), WINSTAR Display Co., Ltd. (China), Visionox Company (China), SHARP CORPORATION (Japan), Innolux Corporation (Taiwan), RAYSTAR OPTRONICS, INC, (Taiwan), RITEK CORPORATION (Taiwan), OSRAM GmbH (Deutschland), Plessey (Großbritannien) |
|
Marktchancen |
|
Marktdefinition
Ein Industriedisplay ist eine Sammlung von Maschinen, die hauptsächlich zur Anzeige digitaler Ausgaben verwendet werden. Diese Maschinen umfassen verschiedene Arten von TFT-Bildschirmen, Digital Signage, Monitoren und ähnlichen Geräten. Industriedisplays sind auf erhöhte Haltbarkeit ausgelegt und halten rauen Umgebungsbedingungen wie Feuchtigkeit, Staub, Schmutz, extremen Temperaturen und anderen in industriellen Anwendungen stand.
Marktdynamik für Industriedisplays
Treiber
- Zunehmender Fokus auf Wachstum und Expansion
Die wichtigsten Marktteilnehmer konzentrieren sich hauptsächlich auf innovative und neue Industriedisplayprodukte auf dem Markt und entwickeln ihre Produktionskapazitäten und Funktionen wie verbessertes Kontrastverhältnis, hohe Auflösung, Lesbarkeit, breiter Temperaturbereich, Robustheit, Haltbarkeit, höhere Displayhelligkeit, Umweltstabilität und geringer Stromverbrauch. Diese Industriedisplayprodukte werden so hergestellt, dass sie die Einhaltung strenger Richtlinien unterstützen.
- Steigende Verbreitung des Internets der Dinge
Die zunehmende Verbreitung der Internetverbindung bei Verbrauchern und die wachsende Nachfrage nach Informationen für unterwegs beeinflussen das Marktwachstum weltweit weiter. Die technologische Revolution wird voraussichtlich die Reichweite des Internets und die Möglichkeit umfassen, Fabrikinfrastruktur, -abläufe und -maschinen weltweit direkt zu steuern. Der Bedarf an HMI-Geräten ist aufgrund des rasanten Wachstums von IoT-Anwendungen gestiegen, was voraussichtlich das Wachstum des Marktes für Industriedisplays ankurbeln wird.
Gelegenheiten
- Zunehmende Regulierungen bei der Herstellung und dem Verkauf von Industriedisplays
Die Vorschriften für die Herstellung und den Vertrieb von Industriedisplays sind je nach Land oder Region unterschiedlich. So schränkt beispielsweise das Gesetz der Europäischen Union zur Beschränkung der Verwendung gefährlicher Stoffe (RoHS) bei der Herstellung von Industriedisplays die Verwendung von Blei, Quecksilber, Cadmium und sechswertigem Chrom sowie Flammschutzmitteln wie polybromierten Biphenylen (PBB) oder polybromierten Diphenylethern (PBDE) in elektronischen Geräten ein.
- Steigende Anzahl neuer Produkteinführungen
Die steigende Zahl an Produkteinführungen durch große Marktteilnehmer bietet dem Markt zusätzlich lukrative Wachstumschancen. So wurden beispielsweise am Orlando International Airport 700 Videowanddisplays installiert, die aktuelle Fluginformationen liefern. Diese Videodisplays haben auch in der Grand Hall des automatisierten People Mover (APM) kinoreife Videoinhalte bereitgestellt. Dies hat dazu beigetragen, den Passagieren relevante visuelle Inhalte zu liefern.
Einschränkungen/Herausforderungen
- Hohe Kosten im Zusammenhang mit Industrie-Displays
Der hohe Preis der Rohstoffe, die hauptsächlich für die Produktion industrieller Displays verwendet werden, wird voraussichtlich die Nachfrage nach diesen Displays begrenzen und das Marktwachstum behindern. Darüber hinaus sind hohe Investitionen erforderlich, um Industriedisplays zu installieren, die das Marktwachstum im Prognosezeitraum 2023–2030 behindern könnten.
Dieser Marktbericht für Industriedisplays enthält Einzelheiten zu neuen Entwicklungen, Handelsvorschriften, Import-Export-Analysen, Produktionsanalysen, Optimierung der Wertschöpfungskette, Marktanteilen, Auswirkungen inländischer und lokaler Marktteilnehmer, analysiert Chancen in Bezug auf neue Einnahmequellen, Änderungen der Marktvorschriften, strategische Marktwachstumsanalysen, Marktgröße, Kategoriemarktwachstum, Anwendungsnischen und -dominanz, Produktzulassungen, Produkteinführungen, geografische Expansionen und technologische Innovationen auf dem Markt. Um weitere Informationen zum Markt für Industriedisplays zu erhalten, wenden Sie sich an Data Bridge Market Research, um ein Analyst Briefing zu erhalten. Unser Team hilft Ihnen dabei, eine fundierte Marktentscheidung zu treffen, um Marktwachstum zu erzielen.
Auswirkungen von Rohstoffknappheit und Lieferverzögerungen und aktuelles Marktszenario
Data Bridge Market Research bietet eine umfassende Marktanalyse und liefert Informationen, indem es die Auswirkungen und das aktuelle Marktumfeld von Rohstoffknappheit und Lieferverzögerungen berücksichtigt. Dies bedeutet, dass strategische Möglichkeiten bewertet, wirksame Aktionspläne erstellt und Unternehmen bei wichtigen Entscheidungen unterstützt werden.
Neben dem Standardbericht bieten wir auch detaillierte Analysen des Beschaffungsniveaus anhand prognostizierter Lieferverzögerungen, Händlerzuordnung nach Regionen, Warenanalysen, Produktionsanalysen, Preiszuordnungstrends, Beschaffung, Kategorieleistungsanalysen, Lösungen zum Lieferkettenrisikomanagement, erweitertes Benchmarking und andere Dienste für Beschaffung und strategische Unterstützung.
Auswirkungen von COVID-19 auf den Markt für Industriedisplays
Der Ausbruch von Covid-19 hat das Wachstum des Marktes für Industriedisplays erheblich gebremst. Neue Projekte sind weltweit ins Stocken geraten, was die Nachfrage nach Industriedisplays stark beeinträchtigt hat. Fabriken hatten während dieser Pandemie weltweit Schwierigkeiten, neue Geräte zusammenzubauen und herzustellen. Darüber hinaus können mehrere Lager aufgrund strenger Vorschriften keine Industriedisplays transportieren, was die Produktions- und Liefereinheiten während der Pandemie gestört hat. Die Auswirkungen von COVID-19 auf diesen Markt sind vorübergehend, da nur die Lieferkette und die Produktion ins Stocken geraten sind. Sobald sich die Situation normalisiert, werden die Nachfrage, die Produktion und die Lieferketten für diese Produkte allmählich zunehmen.
Erwartete Auswirkungen der Konjunkturabschwächung auf die Preisgestaltung und Verfügbarkeit von Produkten
Wenn die Wirtschaftstätigkeit nachlässt, leiden auch die Branchen darunter. Die prognostizierten Auswirkungen des Konjunkturabschwungs auf die Preisgestaltung und Verfügbarkeit der Produkte werden in den von DBMR bereitgestellten Markteinblickberichten und Informationsdiensten berücksichtigt. Damit sind unsere Kunden ihren Konkurrenten in der Regel immer einen Schritt voraus, können ihre Umsätze und Erträge prognostizieren und ihre Gewinn- und Verlustaufwendungen abschätzen.
Jüngste Entwicklung
- Im Jahr 2022 stellte Winmate das 14-Zoll-Tablet M140TG vor, ein sehr robustes Tablet, das entwickelt wurde, um Kunden im Außendienst Mobilität und Konnektivität zu bieten. Dieses neue Rugged Extreme-Tablet bietet fortschrittliche Prozessoren und zahlreiche Konnektivitätsoptionen in kompakten Geräten. Darüber hinaus ist das M140TG so konzipiert, dass es Funktionalität, Robustheit, mobile Arbeitskräfte und Mobilität vereint und so ein zuverlässiges und dennoch anpassungsfähiges Tablet bildet, das verschiedenen Situationen und Bedrohungen gerecht wird.
- Im Jahr 2022: Samsung hat den Smart Monitor M8 vorgestellt, ein 32-Zoll-Display. Dieser neue Monitor M8 bietet ein Display, das zum Designvorliebe und reifen Lebensstil der Generation Z passt, da diese normalerweise nach einer Komplettlösung zum Arbeiten, Lernen und Spielen sucht. Darüber hinaus wird der Smart Monitor in den Farben Frühlingsgrün und Sonnenuntergangsrosa erhältlich sein.
Globaler Marktumfang für Industriedisplays
Der Markt für Industriedisplays ist nach Typ, Panelgröße, Technologie, Kommunikationstyp, Anwendung und Branche segmentiert. Das Wachstum dieser Segmente hilft Ihnen bei der Analyse schwacher Wachstumssegmente in den Branchen und bietet den Benutzern einen wertvollen Marktüberblick und Markteinblicke, die ihnen bei der strategischen Entscheidungsfindung zur Identifizierung der wichtigsten Marktanwendungen helfen.
Typ
- Robuste Displays
- Open-Frame-Monitore
- Multi-Touch-Anzeige (P-Cap)
- Front-Display
- USB-Typ-C-Anzeige
- SDI-Anzeige
- Rückseitig montiertes Display
- Monitore zur Schalttafelmontage
- Marine-Displays
- Videowände
- Sonstiges
Panelgröße
- Bis zu 14 Zoll
- 14 Zoll bis 21 Zoll
- 21 bis 40 Zoll
- 40 Zoll
- Über
Technologie
- LCD
- LED
- OLED
- E-Paper Anzeige
Kommunikationstyp
- Seriell
- Ethernet
- Mobilfunknetz
- Industrielle Kommunikation
- HF/Zigbee/IR
- Jason/MQTT
- Sonstiges
- Anwendung
- Bediengerät
- Remote-Anwendung
- Interaktive Anzeige
- Digitale Beschilderung
- Bildgebung
Vertikal
- Herstellung
- Energie & Strom
- Militär & Avionik
- Öl und Gas
- Metalle und Bergbau
- Transport
- Sonstiges
Regionale Analyse/Einblicke zum Markt für Industriedisplays
Der Markt für Industriedisplays wird analysiert und es werden Einblicke in die Marktgröße und Trends nach Land, Typ, Panelgröße, Technologie, Kommunikationstyp, Anwendung und Branche wie oben angegeben bereitgestellt.
Die im Marktbericht für Industriedisplays abgedeckten Länder sind: USA, Kanada und Mexiko in Nordamerika, Deutschland, Frankreich, Großbritannien, Niederlande, Schweiz, Belgien, Russland, Italien, Spanien, Türkei, Restliches Europa in Europa, China, Japan, Indien, Südkorea, Singapur, Malaysia, Australien, Thailand, Indonesien, Philippinen, Restlicher Asien-Pazifik-Raum (APAC) in Asien-Pazifik (APAC), Saudi-Arabien, Vereinigte Arabische Emirate, Südafrika, Ägypten, Israel, Restlicher Naher Osten und Afrika (MEA) als Teil von Naher Osten und Afrika (MEA), Brasilien, Argentinien und Restliches Südamerika als Teil von Südamerika.
Nordamerika dominiert den Markt für Marine-Industriedisplays in Bezug auf Umsatz und Marktanteil. Dies ist hauptsächlich auf die zunehmende Verbreitung von Digital Signage und HMIs sowie auf wachsende Investitionen in Internet of Things-Technologie und Multifunktions-HMI-Geräte in dieser Region zurückzuführen.
Aufgrund des wachsenden Stromerzeugungssektors und der Entwicklung des verarbeitenden Gewerbes wird erwartet, dass der asiatisch-pazifische Raum im Prognosezeitraum von 2023 bis 2030 die sich am schnellsten entwickelnde Region sein wird.
Der Länderabschnitt des Berichts enthält auch individuelle marktbeeinflussende Faktoren und Änderungen der Marktregulierung, die die aktuellen und zukünftigen Trends des Marktes beeinflussen. Datenpunkte wie Downstream- und Upstream-Wertschöpfungskettenanalysen, technische Trends und Porters Fünf-Kräfte-Analyse sowie Fallstudien sind einige der Anhaltspunkte, die zur Prognose des Marktszenarios für einzelne Länder verwendet werden. Bei der Bereitstellung von Prognoseanalysen der Länderdaten werden auch die Präsenz und Verfügbarkeit globaler Marken und ihre Herausforderungen aufgrund großer oder geringer Konkurrenz durch lokale und inländische Marken sowie die Auswirkungen inländischer Zölle und Handelsrouten berücksichtigt.
Wettbewerbsumfeld und Industriedisplays Marktanteilsanalyse
Die Wettbewerbslandschaft des Marktes für Industriedisplays liefert Details nach Wettbewerbern. Die enthaltenen Details sind Unternehmensübersicht, Unternehmensfinanzen, erzielter Umsatz, Marktpotenzial, Investitionen in Forschung und Entwicklung, neue Marktinitiativen, globale Präsenz, Produktionsstandorte und -anlagen, Produktionskapazitäten, Stärken und Schwächen des Unternehmens, Produkteinführung, Produktbreite und -umfang, Anwendungsdominanz. Die oben angegebenen Datenpunkte beziehen sich nur auf den Fokus der Unternehmen in Bezug auf den Markt für Industriedisplays.
Zu den wichtigsten Akteuren auf dem Markt für Industriedisplays zählen:
- Samsung (Südkorea)
- LG Display (Südkorea)
- Panasonic Corporation Co, Ltd (Japan)
- Japan Display Inc (Japan)
- AUO Corporation (Taiwan)
- BOE Technology Group Co., Ltd (China)
- Corning Incorporated (USA)
- DuPont (USA)
- FlexEnable Limited (Großbritannien)
- Kateeva (USA)
- SONY INDIA (Indien)
- Pioneer Corporation (Japan)
- WiseChip Semiconductor Inc. (Taiwan)
- WINSTAR Display Co., Ltd. (China)
- Visionox Company (China)
- SHARP CORPORATION (Japan)
- Innolux Corporation (Taiwan)
- RAYSTAR OPTRONICS, INC, (Taiwan)
- RITEK CORPORATION (Taiwan)
- OSRAM GmbH (Deutschland)
- Plessey (Großbritannien)
SKU-
Erhalten Sie Online-Zugriff auf den Bericht zur weltweit ersten Market Intelligence Cloud

- Interaktives Datenanalyse-Dashboard
- Unternehmensanalyse-Dashboard für Chancen mit hohem Wachstumspotenzial
- Zugriff für Research-Analysten für Anpassungen und Abfragen
- Konkurrenzanalyse mit interaktivem Dashboard
- Aktuelle Nachrichten, Updates und Trendanalyse
- Nutzen Sie die Leistungsfähigkeit der Benchmark-Analyse für eine umfassende Konkurrenzverfolgung
Inhaltsverzeichnis
- INTRODUCTION
- OBJECTIVES OF THE STUDY
- MARKET DEFINITION
- OVERVIEW OF GLOBAL INDUSTRIAL DISPLAY MARKET
- LIMITATIONS
- MARKETS COVERED
- MARKET SEGMENTATION
- MARKETS COVERED
- GEOGRAPHICAL SCOPE
- YEARS CONSIDERED FOR THE STUDY
- CURRENCY AND PRICING
- DBMR TRIPOD DATA VALIDATION MODEL
- MULTIVARIATE MODELLING
- TYPE LIFELINE CURVE
- PRIMARY INTERVIEWS WITH KEY OPINION LEADERS
- DBMR MARKET POSITION GRID
- VENDOR SHARE ANALYSIS
- MARKET APPLICATION COVERAGE GRID
- SECONDARY SOURCES
- ASSUMPTIONS
- EXECUTIVE SUMMARY
- PREMIUM INSIGHTS
- OVERVIEW OF VALUE CHAIN ANALYSIS OF INDUSTRIAL DISPLAY MARKET
- STANDARD RATINGS FOR INDUSTRIAL DISPLAY MARKET
- INGRESS PROTECTION (IP) RATING:
- NATIONAL ELECTRICAL MANUFACTURERS ASSOCIATION (NEMA) RATINGS:
- MARKET OVERVIEW
- DRIVERS
- EMERGENCE OF VARIOUS TECHNOLOGICAL DEVELOPMENTS AND AUTOMATED PROCESSES IN INDUSTRIES
- LED AND LCD BASED DISPLAY PRODUCTS REDUCES THE RISK OF EYE DAMAGE
- RISING DEMAND FOR HUMAN MACHINE INTERFACE (HMI) APPLICATION IN MANUFACTURING AND PROCESS INDUSTRIES
- INCREASING MANUFACTURING FACILITIES WORLDWIDE IS LEADING THE ADOPTION OF INDUSTRIAL DISPLAYS
- AVAILABILITY OF ROBUST DISPLAY SCREEN AND WIRELESS CONNECTION
- RESTRAINT
- HIGH INVESTMENTS REQUIRED FOR INSTALLING OF INDUSTRIAL DISPLAYS / PANELS
- OPPORTUNITIES
- GROWING DEMAND FOR DIGITAL SIGNAGE APPLICATIONS IN INDUSTRIES FOR DISPLAYING NECESSARY INFORMATION
- INCREASING DIGITALIZATION OF FACILITIES WITH INDUSTRY 4.0
- RISING ADOPTION OF OLED DISPLAYS IN VARIOUS APPLICATIONS
- COMPANIES ARE TRANSFORMING THEIR PROCESS FROM MANUAL TO DIGITAL
- VARIOUS PARTNERSHIPS AND ACQUISITION IS LEADING FOR NEW PRODUCT DEVELOPMENTS AND BUSINESS EXPANSION
- CHALLENGES
- SUITABILITY OF INDUSTRIAL DISPLAY FOR ALL WEATHER CONDITIONS
- DEPENDENCE OF MANUFACTURERS ON VARIOUS SUPPLIERS TO PROVIDE EQUIPMENT AND COMPONENTS
- ECONOMIC CRISIS OCCURRED DUE TO VARIOUS FACTORS
- IMPACT OF COVID-19 ON THE GLOBAL INDUSTRIAL DISPLAY MARKET
- AFTERMATH OF COVID-19 AND GOVERNMENT ROLE
- STRATEGIC DECISIONS FOR MARKET PLAYERS AFTER COVID-19 TO GAIN COMPETITIVE MARKET SHARE
- IMPACT ON DEMAND
- IMPACT ON SUPPLY CHAIN
- CONCLUSION
- GLOBAL INDUSTRIAL DISPLAY MARKET, BY TYPE
- OVERVIEW
- RUGGED DISPLAY
- TYPE
- SMARTPHONE & HANDHELD COMPUTER
- TABLET
- LAPTOP
- MISSION CRITICAL DISPLAY
- AVIONIC DISPLAY
- VEHICLE-MOUNTED DISPLAY
- LEVEL OF RUGEDNESS
- ULTRA-RUGGED
- VOLLKOMMEN ROBUST
- HALBROBUST
- MONITOR ZUR EINBAUPLATTE
- VIDEOWÄNDE
- OPEN-FRAME-MONITOR
- FRONTDISPLAY
- RÜCKMONTIERTES DISPLAY
- MARINEAUSSTELLUNG
- ANWENDUNG
- Bediengerät
- DIGITALE BESCHILDERUNG
- INTERAKTIVE ANZEIGE
- FERNÜBERWACHUNG
- BILDGEBUNG
- SDI-Anzeige
- Multi-Touch-Display (P-Cap)
- USB-Typ-C-Anzeige
- andere
- Globaler Markt für Industriedisplays nach Panelgröße
- Überblick
- Bis zu 14 Zoll
- 14 Zoll bis 21 Zoll
- 21 bis 40 Zoll
- 40 Zoll und mehr
- Globaler Markt für Industriedisplays, nach Technologie
- Überblick
- LCD
- geführt
- vollständiges Array
- Randbeleuchtung
- direkt beleuchtet
- OLED
- amoled
- pmoled
- E-Paper-Anzeige
- Globaler Markt für Industriedisplays, nach Kommunikationstyp
- Überblick
- seriell
- Ethernet
- Mobilfunknetz
- Industrielle Kommunikation
- HF/Zigbee/IR
- Jason/mqtt
- andere
- Globaler Markt für Industriedisplays, nach Anwendung
- Überblick
- HMI
- digitale Beschilderung
- interaktive Anzeige
- Fernüberwachung
- Bildgebung
- Globaler Markt für Industriedisplays, nach Branchen
- Überblick
- Herstellung
- LCD
- geführt
- VOLLSTÄNDIGES ARRAY
- RANDBELEUCHTUNG
- DIREKT BELEUCHTET
- OLED
- AMOLED
- PMOLED
- E-Paper-Anzeige
- Energie & Leistung
- LCD
- geführt
- VOLLSTÄNDIGES ARRAY
- RANDBELEUCHTUNG
- DIREKT BELEUCHTET
- OLED
- AMOLED
- PMOLED
- E-Paper-Anzeige
- Militär und Avionik
- LCD
- geführt
- VOLLSTÄNDIGES ARRAY
- RANDBELEUCHTUNG
- DIREKT BELEUCHTET
- OLED
- AMOLED
- PMOLED
- E-Paper-Anzeige
- Öl und Gas
- LCD
- geführt
- VOLLSTÄNDIGES ARRAY
- RANDBELEUCHTUNG
- DIREKT BELEUCHTET
- OLED
- AMOLED
- PMOLED
- E-Paper-Anzeige
- Transport
- LCD
- geführt
- VOLLSTÄNDIGES ARRAY
- RANDBELEUCHTUNG
- DIREKT BELEUCHTET
- OLED
- AMOLED
- PMOLED
- E-Paper-Anzeige
- METALL & BERGBAU
- LCD
- geführt
- VOLLSTÄNDIGES ARRAY
- RANDBELEUCHTUNG
- DIREKT BELEUCHTET
- OLED
- AMOLED
- PMOLED
- E-Paper-Anzeige
- ANDERE
- LCD
- geführt
- VOLLSTÄNDIGES ARRAY
- RANDBELEUCHTUNG
- DIREKT BELEUCHTET
- OLED
- AMOLED
- PMOLED
- E-Paper-Anzeige
- Globaler Markt für Industriedisplays nach Regionen
- Überblick
- Nordamerika
- UNS
- Kanada
- Mexiko
- Europa
- Vereinigtes Königreich
- Deutschland
- Frankreich
- Italien
- Spanien
- Niederlande
- Schweiz
- Russland
- Truthahn
- Belgien
- Restliches Europa
- Asien-Pazifik
- CHINA
- Japan
- Südkorea
- Singapur
- Indien
- Malaysia
- Thailand
- Indonesien
- Australien
- Philippinen
- Restlicher Asien-Pazifik-Raum
- Naher Osten und Afrika
- Vereinigte Arabische Emirate
- Saudi-Arabien
- Südafrika
- Ägypten
- Israel
- Rest des Nahen Ostens und Afrikas
- Südamerika
- BRASILIEN
- Argentinien
- Venezuela
- Chile
- Kolumbien
- Ecuador
- Restliches Südamerika
- Unternehmenslandschaft
- Unternehmensaktienanalyse: Global
- Unternehmensaktienanalyse: Nordamerika
- Unternehmensaktienanalyse: Europa
- Unternehmensaktienanalyse: Asien-Pazifik
- SWOT-Analyse
- Unternehmensprofil
- Au Optronics Corp.
- Unternehmens-Schnappschuss
- Umsatzanalyse
- UNTERNEHMENSAKTIENANALYSE
- Produktportfolio
- Jüngste Entwicklung
- boe technology uk limited
- Unternehmens-Schnappschuss
- UNTERNEHMENSAKTIENANALYSE
- Produktportfolio
- Jüngste Entwicklung
- Innolux Corporation
- Unternehmens-Schnappschuss
- Umsatzanalyse
- UNTERNEHMENSAKTIENANALYSE
- Produktportfolio
- Jüngste Entwicklungen
- Samsung Electronics Co., Ltd.
- Unternehmens-Schnappschuss
- Umsatzanalyse
- UNTERNEHMENSAKTIENANALYSE
- Produktportfolio
- Jüngste Entwicklungen
- LG Display Co., Ltd.
- Unternehmens-Schnappschuss
- Umsatzanalyse
- UNTERNEHMENSAKTIENANALYSE
- Produktportfolio
- Jüngste Entwicklungen
- Tianma Mikroelektronik Co., Ltd.
- Unternehmens-Schnappschuss
- Produktportfolio
- Jüngste Entwicklungen
- Advantech Co., Ltd.
- Unternehmens-Schnappschuss
- Umsatzanalyse
- Produktportfolio
- Jüngste Entwicklungen
- Panasonic Corporation
- Unternehmens-Schnappschuss
- Umsatzanalyse
- PRODUKTPORTFOLIO
- Jüngste Entwicklungen
- Emerson Electric Co.
- Unternehmens-Schnappschuss
- Umsatzanalyse
- Produktportfolio
- Jüngste Entwicklung
- Allgemeine digitale Gesellschaft
- Unternehmens-Schnappschuss
- Produktportfolio
- Jüngste Entwicklungen
- General Electric
- Unternehmens-Schnappschuss
- Umsatzanalyse
- PRODUKTPORTFOLIO
- Jüngste Entwicklungen
- Japan Display Inc.
- Unternehmens-Schnappschuss
- Umsatzanalyse
- Produktportfolio
- Jüngste Entwicklungen
- pepperl+fuchs SE
- Unternehmens-Schnappschuss
- Produktportfolio
- Jüngste Entwicklung
- planar
- Unternehmens-Schnappschuss
- Produktportfolio
- Jüngste Entwicklungen
- Rockwell Automation, Inc.
- Unternehmens-Schnappschuss
- Umsatzanalyse
- Produktportfolio
- Jüngste Entwicklungen
- Schneider Electric
- Unternehmens-Schnappschuss
- Umsatzanalyse
- PRODUKTPORTFOLIO
- Jüngste Entwicklung
- Sharp NEC Display Solutions, Ltd. (eine Tochtergesellschaft der NEC Corporation)
- Unternehmens-Schnappschuss
- Umsatzanalyse
- Produktportfolio
- Jüngste Entwicklungen
- Shenzhen Topway Technology Co., Ltd.
- Unternehmens-Schnappschuss
- Produktportfolio
- Jüngste Entwicklungen
- Siemens
- Unternehmens-Schnappschuss
- Umsatzanalyse
- Produktportfolio
- Jüngste Entwicklungen
- Tricomtek Co., Ltd.
- Unternehmens-Schnappschuss
- Produktportfolio
- Jüngste Entwicklung
- Fragebogen
- zugehörige Berichte
Tabellenverzeichnis
TABELLE 1: Globaler Markt für Industriedisplays, nach Typ, 2019–2028 (in Mio. USD)
TABELLE 2: Weltweiter Markt für robuste Displays im Industriebereich, NACH REGION, 2019–2028 (MILLIONEN USD)
TABELLE 3: Globaler Markt für robuste Displays im Industriedisplaybereich, nach Typ, 2019–2028 (MILLIONEN USD)
TABELLE 4: Weltweiter Markt für robuste Displays im Industriedisplaybereich, nach Robustheitsgrad, 2019–2028 (MILLIONEN USD)
TABELLE 5: Globaler Markt für Panel-Mount-Monitore in industriellen Displays, NACH REGION, 2019–2028 (MILLIONEN USD)
TABELLE 6: Globaler Markt für Videowände im industriellen Displaybereich, NACH REGION, 2019–2028 (MILLIONEN USD)
TABELLE 7: Globaler Markt für Open-Frame-Monitore im industriellen Displaybereich, NACH REGION, 2019–2028 (MILLIONEN USD)
TABELLE 8 – Globaler Markt für Frontdisplays im Industriedisplaybereich, NACH REGION, 2019–2028 (MILLIONEN USD)
TABELLE 9: Globaler Markt für rückseitig montierte Monitore in industriellen Displays, NACH REGION, 2019–2028 (MILLIONEN USD)
TABELLE 10 Globaler Markt für Marinedisplays im industriellen Displaybereich, NACH REGION, 2019–2028 (MILLIONEN USD)
TABELLE 11 Globaler Markt für Marinedisplays im industriellen Displaybereich, nach Anwendung, 2019–2028 (in Mio. USD)
TABELLE 12 Globaler Markt für SDI-Displays im Industriedisplaybereich, NACH REGION, 2019–2028 (MILLIONEN USD)
TABELLE 13 Globaler Markt für Multi-Touch-Displays (P-Cap) in der Industrieanzeige, NACH REGION, 2019–2028 (MILLIONEN USD)
TABELLE 14 Globaler Markt für USB-Typ-C-Displays in Industriedisplays, NACH REGION, 2019–2028 (MILLIONEN USD)
TABELLE 15: Globaler Markt für sonstige Industriedisplays, NACH REGION, 2019–2028 (MILLIONEN USD)
TABELLE 16: Globaler Markt für Industriedisplays, nach Panelgröße, 2019–2028 (in Mio. USD)
TABELLE 17 – Globaler Markt für Industriedisplays mit bis zu 14 Zoll, NACH REGION, 2019–2028 (MILLIONEN USD)
TABELLE 18 – Globaler Markt für Industriedisplays im Format 14 bis 21 Zoll, NACH REGION, 2019–2028 (MILLIONEN USD)
TABELLE 19: Globaler Markt für Industriedisplays im Format 21 bis 40 Zoll, NACH REGION, 2019–2028 (MILLIONEN USD)
TABELLE 20 Weltweiter Markt für Industriedisplays mit 40 Zoll und mehr, NACH REGION, 2019–2028 (MILLIONEN USD)
TABELLE 21: Globaler Markt für Industriedisplays, nach Technologie, 2019–2028 (in Mio. USD)
TABELLE 22. Globaler Markt für LCDs in Industriedisplays, NACH REGION, 2019–2028 (MILLIONEN USD)
TABELLE 23 Weltweit führend im Markt für Industriedisplays, NACH REGION, 2019–2028 (MILLIONEN USD)
TABELLE 24 Weltweit führend im Markt für Industriedisplays, nach Typ, 2019–2028 (Mio. USD)
TABELLE 25 Globaler OLED-Markt in Industriedisplays, NACH REGION, 2019–2028 (MILLIONEN USD)
TABELLE 26: Globaler OLED-Markt in Industriedisplays, nach Typ, 2019–2028 (MILLIONEN USD)
TABELLE 27 Globaler Markt für E-Paper-Displays in der Industrieanzeige, NACH REGION, 2019–2028 (MILLIONEN USD)
TABELLE 28 Globaler Markt für Industriedisplays, nach Kommunikationstyp, 2019–2028 (in Mio. USD)
TABELLE 29 Weltweiter Markt für serielle Industriedisplays, NACH REGION, 2019–2028 (MILLIONEN USD)
TABELLE 30 Globaler Markt für Ethernet in Industriedisplays, NACH REGION, 2019–2028 (MILLIONEN USD)
TABELLE 31 Globaler Markt für Mobilfunknetze im Industriedisplaybereich, NACH REGION, 2019–2028 (MILLIONEN USD)
TABELLE 32 Globaler Markt für industrielle Kommunikation im Bereich industrieller Displays, NACH REGION, 2019–2028 (MILLIONEN USD)
TABELLE 33 Globaler Markt für RF/Zigbee/IR in Industriedisplays, NACH REGION, 2019–2028 (MILLIONEN USD)
TABELLE 34: Globaler Jason/MQTT-Markt im Industriedisplay, NACH REGION, 2019–2028 (MILLIONEN USD)
TABELLE 35 Globaler Markt für ANDERE Industriedisplays, NACH REGION, 2019–2028 (MILLIONEN USD)
TABELLE 36: Globaler Markt für Industriedisplays, nach Anwendung, 2019–2028 (MILLIONEN USD)
TABELLE 37 Globaler Markt für HMIs in Industriedisplays, NACH REGION, 2019–2028 (MILLIONEN USD)
TABELLE 38 Globaler Markt für Digital Signage in industriellen Displays, NACH REGION, 2019–2028 (MILLIONEN USD)
TABELLE 39 Globaler Markt für interaktive Displays im Industriebereich, NACH REGION, 2019–2028 (MILLIONEN USD)
TABELLE 40 Globaler Markt für Fernüberwachung in Industriedisplays, NACH REGION, 2019–2028 (MILLIONEN USD)
TABELLE 41 Globaler Markt für Bildgebung in industriellen Displays, NACH REGION, 2019–2028 (MILLIONEN USD)
TABELLE 42: Globaler Markt für Industriedisplays, nach Branchen, 2019–2028 (MILLIONEN USD)
TABELLE 43 Globaler Markt für die Herstellung von Industriedisplays, NACH REGION, 2019–2028 (MILLIONEN USD)
TABELLE 44 Globale Fertigung im Markt für Industriedisplays, nach Technologie, 2019–2028 (MILLIONEN USD)
TABELLE 45: Globale LED-Produktion für den Markt für Industriedisplays, nach Typ, 2019–2028 (MILLIONEN USD)
TABELLE 46: Globale OLED-Produktion für den Markt für Industriedisplays, nach Typ, 2019–2028 (MILLIONEN USD)
TABELLE 47 Globaler Markt für Energie und Leistung im Bereich Industriedisplays, NACH REGION, 2019–2028 (MILLIONEN USD)
TABELLE 48 Globaler Markt für Energie und Leistung im Bereich Industriedisplays, nach Technologie, 2019–2028 (MILLIONEN USD)
TABELLE 49 Globale Energie und Leistung von LEDs für den Markt für Industriedisplays, nach Typ, 2019–2028 (MILLIONEN USD)
TABELLE 50 Globaler Energie- und Leistungsverbrauch im OLED-Markt für Industriedisplays, nach Typ, 2019–2028 (MILLIONEN USD)
TABELLE 51 Weltweiter Markt für Militär- und Avionik-Industriedisplays, NACH REGION, 2019–2028 (MILLIONEN USD)
TABELLE 52 Globaler Markt für Militär- und Avionik-Industriedisplays, nach Technologie, 2019–2028 (MILLIONEN USD)
TABELLE 53 Globaler Markt für Militär- und Avionik-LEDs für Industriedisplays, nach Typ, 2019–2028 (MILLIONEN USD)
TABELLE 54 – Globaler Markt für Militär- und Avionik-OLEDs für Industriedisplays, nach Typ, 2019–2028 (MILLIONEN USD)
TABELLE 55: Globaler Markt für Öl und Gas in industriellen Displays, NACH REGION, 2019–2028 (MILLIONEN USD)
TABELLE 56: Globaler Markt für Öl und Gas in industriellen Displays, nach Technologie, 2019–2028 (MILLIONEN USD)
TABELLE 57: Globaler Öl- und Gasmarkt für LEDs im Bereich Industriedisplays, nach Typ, 2019–2028 (MILLIONEN USD)
TABELLE 58 – Globaler Markt für OLED-Displays für Öl und Gas für industrielle Anwendungen, nach Typ, 2019–2028 (MILLIONEN USD)
TABELLE 59 Weltweiter Markt für Transportlösungen im Bereich Industriedisplays, NACH REGION, 2019–2028 (MILLIONEN USD)
TABELLE 60: Globaler Markt für Transportlösungen im industriellen Displaybereich, nach Technologie, 2019–2028 (MILLIONEN USD)
TABELLE 61 Globaler Transportmarkt für Industriedisplays, nach Typ, 2019–2028 (MILLIONEN USD)
TABELLE 62 – Globaler OLED-Transportmarkt für Industriedisplays, nach Typ, 2019–2028 (MILLIONEN USD)
TABELLE 63 Globaler Markt für Metall- und Bergbau-Industriedisplays, NACH REGION, 2019–2028 (MILLIONEN USD)
TABELLE 64 Globaler Markt für Metall und Bergbau im Bereich Industriedisplays, nach Technologie, 2019–2028 (MILLIONEN USD)
TABELLE 65 Globaler Markt für Metall- und Bergbau-LEDs für Industriedisplays, nach Typ, 2019–2028 (MILLIONEN USD)
TABELLE 66 – Globaler Markt für Metalle und Bergbau in OLEDs für Industriedisplays, nach Typ, 2019–2028 (MILLIONEN USD)
TABELLE 67 Globaler Markt für sonstige Anbieter von Industriedisplays, NACH REGION, 2019–2028 (MILLIONEN USD)
TABELLE 68 – Globaler Markt für andere Industriedisplays, nach Technologie, 2019–2028 (MILLIONEN USD)
TABELLE 69 Globale andere LEDs für den Markt für Industriedisplays, nach Typ, 2019–2028 (MILLIONEN USD)
TABELLE 70 – Globale andere OLED-Marktteilnehmer für Industriedisplays, nach Typ, 2019–2028 (MILLIONEN USD)
TABELLE 71 GLOBALER MARKT für Industriedisplays, nach Regionen, 2019–2028 (Mio. USD)
TABELLE 72 Nordamerikanischer Markt für Industriedisplays, nach Ländern, 2019–2028 (Mio. USD)
TABELLE 73 Nordamerikanischer Markt für Industriedisplays, nach Typ, 2019–2028 (Mio. USD)
TABELLE 74: Nordamerikanischer Markt für robuste Displays im Industriedisplaybereich, nach Typ, 2019–2028 (Mio. USD)
TABELLE 75: Nordamerikanischer Markt für robuste Displays im Industriedisplaybereich, nach Robustheitsgrad, 2019–2028 (Mio. USD)
TABELLE 76 Nordamerikanischer Markt für Marinedisplays im industriellen Displaybereich, nach Anwendung, 2019–2028 (Mio. USD)
TABELLE 77: Nordamerikanischer Markt für Industriedisplays, nach Technologie, 2019–2028 (Mio. USD)
TABELLE 78 Nordamerika führt den Markt für Industriedisplays an, nach Typ, 2019–2028 (Mio. USD)
TABELLE 79 Nordamerikanischer OLED-Markt in Industriedisplays, nach Typ, 2019–2028 (Mio. USD)
TABELLE 80 Nordamerikanischer Markt für Industriedisplays, nach Kommunikationstyp, 2019–2028 (Mio. USD)
TABELLE 81: Nordamerikanischer Markt für Industriedisplays, nach Panelgröße, 2019–2028 (Mio. USD)
TABELLE 82 Nordamerikanischer Markt für Industriedisplays, nach Anwendung, 2019–2028 (Mio. USD)
TABELLE 83 Nordamerikanischer Markt für Industriedisplays, nach Branchen, 2019–2028 (in Mio. USD)
TABELLE 84: Nordamerikanischer Markt für die Herstellung von Industriedisplays, nach Technologie, 2019–2028 (Mio. USD)
TABELLE 85: Nordamerikanischer Markt für die Herstellung von LEDs für Industriedisplays, nach Typ, 2019–2028 (Mio. USD)
TABELLE 86 Nordamerikanischer Markt für OLED-Produktion für Industriedisplays, nach Typ, 2019–2028 (Mio. USD)
TABELLE 87: Nordamerikanischer Markt für Energie und Leistung im industriellen Displaybereich, nach Technologie, 2019–2028 (Mio. USD)
TABELLE 88: Energie und Leistung im nordamerikanischen LED-Markt für Industriedisplays, nach Typ, 2019–2028 (in Mio. USD)
TABELLE 89: Energie und Leistung im nordamerikanischen OLED-Markt für Industriedisplays, nach Typ, 2019–2028 (Mio. USD)
TABELLE 90: Nordamerikanisches Marktsegment für Militär- und Avionik-Industriedisplays, nach Technologie, 2019–2028 (in Mio. USD)
TABELLE 91 Nordamerikanischer Markt für Militär- und Avionik-LEDs für Industriedisplays, nach Typ, 2019–2028 (Mio. USD)
TABELLE 92: Nordamerikanischer Markt für Militär- und Avionik-OLED für Industriedisplays, nach Typ, 2019–2028 (Mio. USD)
TABELLE 93 Nordamerikanischer Markt für Öl und Gas in der industriellen Anzeige, nach Technologie, 2019–2028 (Mio. USD)
TABELLE 94: Nordamerikanischer Markt für Öl und Gas in LED-Technik für Industriedisplays, nach Typ, 2019–2028 (Mio. USD)
TABELLE 95: Nordamerikanischer Markt für Öl und Gas in OLED für Industriedisplays, nach Typ, 2019–2028 (in Mio. USD)
TABELLE 96 Nordamerikanischer Markt für Transportlösungen im industriellen Displaybereich, nach Technologie, 2019–2028 (in Mio. USD)
TABELLE 97 Nordamerikanischer Markt für Transport-LEDs für Industriedisplays, nach Typ, 2019–2028 (Mio. USD)
TABELLE 98 Nordamerikanischer Markt für OLED-Transporte für Industriedisplays, nach Typ, 2019–2028 (Mio. USD)
TABELLE 99: Nordamerikanischer Markt für Metall und Bergbau in der Industrieanzeige, nach Technologie, 2019–2028 (Mio. USD)
TABELLE 100 Nordamerika: Metak & Mining im LED-Markt für Industriedisplays, nach Typ, 2019–2028 (Mio. USD)
TABELLE 101 Nordamerika: Metall und Bergbau im OLED-Markt für Industriedisplays, nach Typ, 2019–2028 (Mio. USD)
TABELLE 102 Sonstige Anbieter im nordamerikanischen Markt für Industriedisplays, nach Technologie, 2019–2028 (Mio. USD)
TABELLE 103 Sonstige LEDs für Industriedisplays in Nordamerika, nach Typ, 2019–2028 (Mio. USD)
TABELLE 104 Sonstige Anbieter im nordamerikanischen OLED-Markt für Industriedisplays, nach Typ, 2019–2028 (Mio. USD)
TABELLE 105 US-Markt für Industriedisplays, nach Typ, 2019–2028 (Mio. USD)
TABELLE 106 – US-Markt für robuste Displays im Industriebereich, nach Typ, 2019–2028 (Mio. USD)
TABELLE 107 – US-Markt für robuste Displays im Industriedisplaybereich, nach Robustheitsgrad, 2019–2028 (Mio. USD)
TABELLE 108 US-Markt für Marinedisplays im industriellen Displaybereich, nach Anwendung, 2019–2028 (Mio. USD)
TABELLE 109 US-Markt für Industriedisplays, nach Technologie, 2019–2028 (Mio. USD)
TABELLE 110: Führende US-Unternehmen im Markt für Industriedisplays, nach Typ, 2019–2028 (Mio. USD)
TABELLE 111 – US-Markt für OLED-Industriedisplays, nach Typ, 2019–2028 (Mio. USD)
TABELLE 112 US-Markt für Industriedisplays, nach Kommunikationstyp, 2019–2028 (Mio. USD)
TABELLE 113 US-Markt für Industriedisplays, nach Panelgröße, 2019–2028 (Mio. USD)
TABELLE 114 US-Markt für Industriedisplays, nach Anwendung, 2019–2028 (Mio. USD)
TABELLE 115 – US-Markt für Industriedisplays, nach Branchen, 2019–2028 (in Mio. USD)
TABELLE 116 US-amerikanischer Markt für die Herstellung von Industriedisplays, nach Technologie, 2019–2028 (Mio. USD)
TABELLE 117 US-amerikanische Produktion im LED-Markt für Industriedisplays, nach Typ, 2019–2028 (Mio. USD)
TABELLE 118 US-amerikanische OLED-Produktion auf dem Markt für Industriedisplays, nach Typ, 2019–2028 (in Mio. USD)
TABELLE 119 US-Markt für Energie und Leistung im Bereich industrieller Displays, nach Technologie, 2019–2028 (Mio. USD)
TABELLE 120: Energie und Leistung im US-Markt für LEDs für Industriedisplays, nach Typ, 2019–2028 (Mio. USD)
TABELLE 121: Energie und Leistung im US-Markt für OLEDs für Industriedisplays, nach Typ, 2019–2028 (Mio. USD)
TABELLE 122 – US-Markt für Militär- und Avionik-Industriedisplays, nach Technologie, 2019–2028 (Mio. USD)
TABELLE 123 – US-Militär und Avionik im LED-Markt für Industriedisplays, nach Typ, 2019–2028 (Mio. USD)
TABELLE 124 – US-Markt für Militär und Avionik in OLED für Industriedisplays, nach Typ, 2019–2028 (Mio. USD)
TABELLE 125 – US-Markt für Öl und Gas in der Industrieanzeige, nach Technologie, 2019–2028 (Mio. USD)
TABELLE 126 US-Markt für Öl und Gas im LED-Bereich für Industriedisplays, nach Typ, 2019–2028 (Mio. USD)
TABELLE 127 – US-Markt für Öl und Gas im OLED-Bereich für Industriedisplays, nach Typ, 2019–2028 (Mio. USD)
TABELLE 128 US-Markt für Transportlösungen im Bereich industrielle Displays, nach Technologie, 2019–2028 (Mio. USD)
TABELLE 129 US-Transportmarkt für LEDs für Industriedisplays, nach Typ, 2019–2028 (Mio. USD)
TABELLE 130 US-Transportmarkt für OLEDs für Industriedisplays, nach Typ, 2019–2028 (Mio. USD)
TABELLE 131 – US-Markt für Metall und Bergbau in der Industrieanzeige, nach Technologie, 2019–2028 (Mio. USD)
TABELLE 132 US-Markt für Metall und Bergbau im Bereich LED für Industriedisplays, nach Typ, 2019–2028 (Mio. USD)
TABELLE 133 – Metall- und Bergbaumarkt in den USA im OLED-Markt für Industriedisplays, nach Typ, 2019–2028 (in Mio. USD)
TABELLE 134 Sonstige Anbieter im US-Markt für Industriedisplays, nach Technologie, 2019–2028 (Mio. USD)
TABELLE 135 Sonstige Anbieter im US-Markt für LEDs für Industriedisplays, nach Typ, 2019–2028 (Mio. USD)
TABELLE 136 Sonstige Anbieter im US-Markt für OLED-Industriedisplays, nach Typ, 2019–2028 (Mio. USD)
TABELLE 137 Kanadischer Markt für Industriedisplays, nach Typ, 2019–2028 (Mio. USD)
TABELLE 138 – Kanadischer Markt für robuste Displays im Industriedisplaybereich, nach Typ, 2019–2028 (Mio. USD)
TABELLE 139 – Kanadischer Markt für robuste Displays im Industriedisplaybereich, nach Robustheitsgrad, 2019–2028 (Mio. USD)
TABELLE 140 Kanadischer Markt für Marinedisplays im industriellen Displaybereich, nach Anwendung, 2019–2028 (Mio. USD)
TABELLE 141 Kanadischer Markt für Industriedisplays, nach Technologie, 2019–2028 (Mio. USD)
TABELLE 142: Kanada ist Marktführer im Bereich Industriedisplays, nach Typ, 2019–2028 (Mio. USD)
TABELLE 143 – OLED-Markt in Industriedisplays in Kanada, nach Typ, 2019–2028 (Mio. USD)
TABELLE 144 Kanadischer Markt für Industriedisplays, nach Kommunikationstyp, 2019–2028 (Mio. USD)
TABELLE 145: Kanadischer Markt für Industriedisplays, nach Panelgröße, 2019–2028 (Mio. USD)
TABELLE 146 Kanadischer Markt für Industriedisplays, nach Anwendung, 2019–2028 (Mio. USD)
TABELLE 147 Kanadischer Markt für Industriedisplays, nach Branchen, 2019–2028 (Mio. USD)
TABELLE 148 Kanadischer Markt für die Herstellung von Industriedisplays, nach Technologie, 2019–2028 (Mio. USD)
TABELLE 149: Kanadische LED-Produktion für den Markt für Industriedisplays, nach Typ, 2019–2028 (Mio. USD)
TABELLE 150: Kanadischer OLED-Markt für Industriedisplays, nach Typ, 2019–2028 (Mio. USD)
TABELLE 151 – Kanadischer Markt für Energie und Leistung im Bereich industrieller Displays, nach Technologie, 2019–2028 (Mio. USD)
TABELLE 152: Energie und Leistung im kanadischen Markt für LEDs für Industriedisplays, nach Typ, 2019–2028 (Mio. USD)
TABELLE 153: Energie und Leistung im kanadischen OLED-Markt für Industriedisplays, nach Typ, 2019–2028 (Mio. USD)
TABELLE 154 – Kanadischer Markt für Militär- und Avionik-Industriedisplays, nach Technologie, 2019–2028 (Mio. USD)
TABELLE 155 – Kanadischer Markt für Militär- und Avionik-LEDs für Industriedisplays, nach Typ, 2019–2028 (Mio. USD)
TABELLE 156 – Kanadischer Markt für Militär und Avionik in OLED für Industriedisplays, nach Typ, 2019–2028 (Mio. USD)
TABELLE 157: Kanadischer Markt für Öl und Gas in der industriellen Anzeige, nach Technologie, 2019–2028 (Mio. USD)
TABELLE 158: Kanadischer Markt für Öl und Gas im LED-Bereich für Industriedisplays, nach Typ, 2019–2028 (Mio. USD)
TABELLE 159 – Kanadischer Markt für Öl und Gas im OLED-Bereich für Industriedisplays, nach Typ, 2019–2028 (Mio. USD)
TABELLE 160 – Kanadischer Markt für Transportmittel in der Industrieanzeige, nach Technologie, 2019–2028 (Mio. USD)
TABELLE 161 – Kanadischer Markt für Transport-LEDs für Industriedisplays, nach Typ, 2019–2028 (Mio. USD)
TABELLE 162 – Transportmarkt für OLEDs für Industriedisplays in Kanada, nach Typ, 2019–2028 (in Mio. USD)
TABELLE 163 – Kanadischer Markt für Metall und Bergbau in der Industrieanzeige, nach Technologie, 2019–2028 (Mio. USD)
TABELLE 164: Kanadischer Markt für Metalle und Bergbau im Bereich LED für Industriedisplays, nach Typ, 2019–2028 (Mio. USD)
TABELLE 165 – Metall und Bergbau in Kanada im OLED-Markt für Industriedisplays, nach Typ, 2019–2028 (Mio. USD)
TABELLE 166 Sonstige Anbieter im kanadischen Markt für Industriedisplays, nach Technologie, 2019–2028 (Mio. USD)
TABELLE 167 Sonstiges in Kanada im LED-Markt für Industriedisplays, nach Typ, 2019–2028 (Mio. USD)
TABELLE 168 Sonstiges in Kanada im OLED-Markt für Industriedisplays, nach Typ, 2019–2028 (Mio. USD)
TABELLE 169 Mexikanischer Markt für Industriedisplays, nach Typ, 2019–2028 (Mio. USD)
TABELLE 170: Mexikanischer Markt für robuste Displays im Industriedisplaybereich, nach Typ, 2019–2028 (Mio. USD)
TABELLE 171: Robuste Displays im mexikanischen Markt für Industriedisplays, nach Robustheitsgrad, 2019–2028 (Mio. USD)
TABELLE 172. Mexikanischer Markt für Marinedisplays im industriellen Displaybereich, nach Anwendung, 2019–2028 (in Mio. USD)
TABELLE 173 Mexikanischer Markt für Industriedisplays, nach Technologie, 2019–2028 (Mio. USD)
TABELLE 174: Mexiko ist Marktführer im Bereich Industriedisplays, nach Typ, 2019–2028 (Mio. USD)
TABELLE 175 – Mexiko: OLED-Markt in Industriedisplays, nach Typ, 2019–2028 (Mio. USD)
TABELLE 176 Mexikanischer Markt für Industriedisplays, nach Kommunikationstyp, 2019–2028 (Mio. USD)
TABELLE 177 Mexikanischer Markt für Industriedisplays, nach Panelgröße, 2019–2028 (Mio. USD)
TABELLE 178 Mexikanischer Markt für Industriedisplays, nach Anwendung, 2019–2028 (Mio. USD)
TABELLE 179 Mexikanischer Markt für Industriedisplays, nach Branchen, 2019–2028 (Mio. USD)
TABELLE 180. Mexikanischer Markt für die Herstellung von Industriedisplays, nach Technologie, 2019–2028 (Mio. USD)
TABELLE 181. Mexiko: Produktion im LED-Markt für Industriedisplays, nach Typ, 2019–2028 (in Mio. USD)
TABELLE 182. Mexiko: OLED-Produktion für den industriellen Displaymarkt, nach Typ, 2019–2028 (in Mio. USD)
TABELLE 183 – Energie und Leistung im mexikanischen Markt für Industriedisplays, nach Technologie, 2019–2028 (Mio. USD)
TABELLE 184 Energie und Leistung im mexikanischen Markt für LEDs für Industriedisplays, nach Typ, 2019–2028 (Mio. USD)
TABELLE 185: Energie und Leistung im mexikanischen OLED-Markt für Industriedisplays, nach Typ, 2019–2028 (Mio. USD)
TABELLE 186 – Mexikanischer Markt für Militär- und Avionik-Industriedisplays, nach Technologie, 2019–2028 (Mio. USD)
TABELLE 187 – Mexikanischer Markt für Militär- und Avionik-LEDs für Industriedisplays, nach Typ, 2019–2028 (Mio. USD)
TABELLE 188 – Mexikanischer Markt für Militär und Avionik in OLED für Industriedisplays, nach Typ, 2019–2028 (Mio. USD)
TABELLE 189: Mexikanischer Markt für Öl und Gas in der industriellen Anzeige, nach Technologie, 2019–2028 (Mio. USD)
TABELLE 190 Mexiko: Öl und Gas im LED-Markt für Industriedisplays, nach Typ, 2019–2028 (Mio. USD)
TABELLE 191 – Mexiko: Markt für Öl und Gas im OLED-Bereich für Industriedisplays, nach Typ, 2019–2028 (in Mio. USD)
TABELLE 192 – Mexikanischer Markt für Transportlösungen im industriellen Displaybereich, nach Technologie, 2019–2028 (Mio. USD)
TABELLE 193. Mexiko: Transportmarkt für LEDs für Industriedisplays, nach Typ, 2019–2028 (Mio. USD)
TABELLE 194 – Mexiko – Transportmarkt für OLEDs für Industriedisplays, nach Typ, 2019–2028 (Mio. USD)
TABELLE 195 – Mexikanischer Markt für Metall und Bergbau in der Industrieanzeige, nach Technologie, 2019–2028 (Mio. USD)
TABELLE 196 Mexikanischer Markt für Metalle und Bergbau in LED für Industriedisplays, nach Typ, 2019–2028 (Mio. USD)
TABELLE 197 – Metall und Bergbau in Mexiko im OLED-Markt für Industriedisplays, nach Typ, 2019–2028 (Mio. USD)
TABELLE 198 Sonstige Anbieter im mexikanischen Markt für Industriedisplays, nach Technologie, 2019–2028 (Mio. USD)
TABELLE 199 Sonstige Akteure im mexikanischen Markt für LEDs für Industriedisplays, nach Typ, 2019–2028 (Mio. USD)
TABELLE 200 Sonstige Akteure im mexikanischen OLED-Markt für Industriedisplays, nach Typ, 2019–2028 (in Mio. USD)
TABELLE 201 Europäischer Markt für Industriedisplays, nach Ländern, 2019–2028 (in Mio. USD)
TABELLE 202 Europäischer Markt für Industriedisplays, nach Typ, 2019–2028 (in Mio. USD)
TABELLE 203 – Europäischer Markt für robuste Displays im Industriedisplaybereich, nach Typ, 2019–2028 (Mio. USD)
TABELLE 204 – Europäischer Markt für robuste Displays im Industriedisplaybereich, nach Robustheitsgrad, 2019–2028 (Mio. USD)
TABELLE 205 – Europäischer Markt für Marinedisplays im industriellen Displaybereich, nach Anwendung, 2019–2028 (in Mio. USD)
TABELLE 206 Europäischer Markt für Industriedisplays, nach Technologie, 2019–2028 (in Mio. USD)
TABELLE 207: Europa ist führend im Markt für Industriedisplays, nach Typ, 2019–2028 (Mio. USD)
TABELLE 208 Europäischer OLED-Markt in Industriedisplays, nach Typ, 2019–2028 (Mio. USD)
TABELLE 209 Europäischer Markt für Industriedisplays, nach Kommunikationstyp, 2019–2028 (Mio. USD)
TABELLE 210 Europäischer Markt für Industriedisplays, nach Panelgröße, 2019–2028 (in Mio. USD)
TABELLE 211 Europäischer Markt für Industriedisplays, nach Anwendung, 2019–2028 (in Mio. USD)
TABELLE 212: Europäischer Markt für Industriedisplays, nach Branchen, 2019–2028 (in Mio. USD)
TABELLE 213 Europäischer Markt für die Herstellung von Industriedisplays, nach Technologie, 2019–2028 (Mio. USD)
TABELLE 214 Europäischer Markt für die Herstellung von LEDs für Industriedisplays, nach Typ, 2019–2028 (in Mio. USD)
TABELLE 215 Europäischer Markt für OLED-Produktion für Industriedisplays, nach Typ, 2019–2028 (Mio. USD)
TABELLE 216 – Europäischer Markt für Energie und Leistung im industriellen Displaybereich, nach Technologie, 2019–2028 (Mio. USD)
TABELLE 217: Energie und Leistung im europäischen Markt für LEDs für Industriedisplays, nach Typ, 2019–2028 (in Mio. USD)
TABELLE 218 – Europäischer Markt für Energie und Leistung im OLED-Bereich für Industriedisplays, nach Typ, 2019–2028 (Mio. USD)
TABELLE 219 – Europäischer Markt für Militär- und Avionik-Industriedisplays, nach Technologie, 2019–2028 (Mio. USD)
TABELLE 220 – Europäischer Markt für Militär- und Avionik-LEDs für Industriedisplays, nach Typ, 2019–2028 (in Mio. USD)
TABELLE 221 – Europäischer Markt für Militär- und Avionik-OLED für Industriedisplays, nach Typ, 2019–2028 (in Mio. USD)
TABELLE 222 – Europäischer Markt für Öl und Gas in der industriellen Anzeige, nach Technologie, 2019–2028 (Mio. USD)
TABELLE 223 Europäischer Markt für Öl und Gas in LED für Industriedisplays, nach Typ, 2019–2028 (Mio. USD)
TABELLE 224 – Europäischer Markt für Öl und Gas in OLED für Industriedisplays, nach Typ, 2019–2028 (in Mio. USD)
TABELLE 225 – Europäischer Markt für Transportlösungen im industriellen Displaybereich, nach Technologie, 2019–2028 (in Mio. USD)
TABELLE 226 Europäischer Markt für Transport-LEDs für Industriedisplays, nach Typ, 2019–2028 (in Mio. USD)
TABELLE 227 Europäischer Markt für OLED-Transporte für Industriedisplays, nach Typ, 2019–2028 (in Mio. USD)
TABELLE 228 – Europäischer Markt für Metall und Bergbau in der Industrieanzeige, nach Technologie, 2019–2028 (Mio. USD)
TABELLE 229 – Europa – Metall und Bergbau im LED-Markt für Industriedisplays, nach Typ, 2019–2028 (Mio. USD)
TABELLE 230 – Europäischer Markt für Metall und Bergbau im OLED-Bereich für Industriedisplays, nach Typ, 2019–2028 (in Mio. USD)
TABELLE 231 Sonstige Anbieter im europäischen Markt für Industriedisplays, nach Technologie, 2019–2028 (in Mio. USD)
TABELLE 232 Sonstige LEDs für Industriedisplays in Europa, nach Typ, 2019–2028 (in Mio. USD)
TABELLE 233 Sonstige europäische OLED-Marktteilnehmer für Industriedisplays, nach Typ, 2019–2028 (in Mio. USD)
TABELLE 234 Britischer Markt für Industriedisplays, nach Typ, 2019–2028 (Mio. USD)
TABELLE 235: Britischer Markt für robuste Displays im Industriebereich, nach Typ, 2019–2028 (Mio. USD)
TABELLE 236: Britischer Markt für robuste Displays im Industriebereich, nach Robustheitsgrad, 2019–2028 (Mio. USD)
TABELLE 237 Britischer Markt für Marinedisplays im industriellen Displaybereich, nach Anwendung, 2019–2028 (Mio. USD)
TABELLE 238 Britischer Markt für Industriedisplays, nach Technologie, 2019–2028 (in Mio. USD)
TABELLE 239 Großbritannien führt den Markt für Industriedisplays an, nach Typ, 2019–2028 (Mio. USD)
TABELLE 240 – Britischer OLED-Markt in Industriedisplays, nach Typ, 2019–2028 (in Mio. USD)
TABELLE 241 Britischer Markt für Industriedisplays, nach Kommunikationstyp, 2019–2028 (Mio. USD)
TABELLE 242 Britischer Markt für Industriedisplays, nach Panelgröße, 2019–2028 (in Mio. USD)
TABELLE 243 Britischer Markt für Industriedisplays, nach Anwendung, 2019–2028 (in Mio. USD)
TABELLE 244 Britischer Markt für Industriedisplays, nach Branchen, 2019–2028 (in Mio. USD)
TABELLE 245 Britischer Markt für die Herstellung von Industriedisplays, nach Technologie, 2019–2028 (Mio. USD)
TABELLE 246 Britischer Markt für die Herstellung von LEDs für Industriedisplays, nach Typ, 2019–2028 (Mio. USD)
TABELLE 247 Britische OLED-Produktion auf dem Markt für Industriedisplays, nach Typ, 2019–2028 (in Mio. USD)
TABELLE 248 Britischer Markt für Energie und Leistung im industriellen Displaybereich, nach Technologie, 2019–2028 (Mio. USD)
TABELLE 249 Energie und Leistung im britischen Markt für LEDs für Industriedisplays, nach Typ, 2019–2028 (Mio. USD)
TABELLE 250: Energie und Leistung im britischen OLED-Markt für Industriedisplays, nach Typ, 2019–2028 (in Mio. USD)
TABELLE 251 Britischer Markt für Militär- und Avionik-Industriedisplays, nach Technologie, 2019–2028 (Mio. USD)
TABELLE 252 Britischer Markt für Militär- und Avionik-LEDs für Industriedisplays, nach Typ, 2019–2028 (Mio. USD)
TABELLE 253 Britischer Markt für Militär- und Avionik-OLED für Industriedisplays, nach Typ, 2019–2028 (Mio. USD)
TABELLE 254 Britischer Markt für Öl und Gas in der Industrieanzeige, nach Technologie, 2019–2028 (Mio. USD)
TABELLE 255 Britischer Öl- und Gasmarkt im Bereich LED für Industriedisplays, nach Typ, 2019–2028 (Mio. USD)
TABELLE 256 Britischer Markt für Öl und Gas in OLED für Industriedisplays, nach Typ, 2019–2028 (Mio. USD)
TABELLE 257 Britischer Markt für Transportlösungen im industriellen Displaybereich, nach Technologie, 2019–2028 (in Mio. USD)
TABELLE 258 Britischer Markt für Transport-LEDs für Industriedisplays, nach Typ, 2019–2028 (Mio. USD)
TABELLE 259 Britischer Markt für OLED-Transporte für Industriedisplays, nach Typ, 2019–2028 (Mio. USD)
TABELLE 260 Britischer Markt für Metall und Bergbau in der Industrieanzeige, nach Technologie, 2019–2028 (Mio. USD)
TABELLE 261. Britischer Markt für Metall und Bergbau im Bereich LED für Industriedisplays, nach Typ, 2019–2028 (Mio. USD)
TABELLE 262. Britischer Markt für Metall und Bergbau im OLED-Bereich für Industriedisplays, nach Typ, 2019–2028 (in Mio. USD)
TABELLE 263 Sonstige Akteure im britischen Markt für Industriedisplays, nach Technologie, 2019–2028 (in Mio. USD)
TABELLE 264 Sonstige Anbieter im britischen Markt für LEDs für Industriedisplays, nach Typ, 2019–2028 (Mio. USD)
TABELLE 265 Sonstige Anbieter im britischen OLED-Markt für Industriedisplays, nach Typ, 2019–2028 (in Mio. USD)
TABELLE 266 Deutscher Markt für Industriedisplays, nach Typ, 2019–2028 (Mio. USD)
TABELLE 267 Deutscher Markt für robuste Displays im Industriedisplaybereich, nach Typ, 2019–2028 (Mio. USD)
TABELLE 268 Deutscher Markt für robuste Displays im Industriedisplaybereich, nach Robustheitsgrad, 2019–2028 (Mio. USD)
TABELLE 269 Deutscher Markt für Marinedisplays im industriellen Displaybereich, nach Anwendung, 2019–2028 (in Mio. USD)
TABELLE 270 Deutscher Markt für Industriedisplays, nach Technologie, 2019–2028 (in Mio. USD)
TABELLE 271: Deutschland ist Marktführer im Bereich Industriedisplays, nach Typ, 2019–2028 (Mio. USD)
TABELLE 272 Deutscher OLED-Markt in Industriedisplays, nach Typ, 2019–2028 (in Mio. USD)
TABELLE 273 Deutscher Markt für Industriedisplays, nach Kommunikationstyp, 2019–2028 (Mio. USD)
TABELLE 274 Deutscher Markt für Industriedisplays, nach Panelgröße, 2019–2028 (Mio. USD)
TABELLE 275 Deutscher Markt für Industriedisplays, nach Anwendung, 2019–2028 (Mio. USD)
TABELLE 276 Deutscher Markt für Industriedisplays, nach Branchen, 2019–2028 (in Mio. USD)
TABELLE 277 Deutscher Markt für die Herstellung von Industriedisplays, nach Technologie, 2019–2028 (Mio. USD)
TABELLE 278 Deutsche Produktion im Markt für LEDs für Industriedisplays, nach Typ, 2019–2028 (Mio. USD)
TABELLE 279 Deutscher OLED-Markt für Industriedisplays, nach Typ, 2019–2028 (in Mio. USD)
TABELLE 280 Deutscher Markt für Energie und Leistung im Bereich industrieller Displays, nach Technologie, 2019–2028 (in Mio. USD)
TABELLE 281 Energie und Leistung im deutschen Markt für LEDs für Industriedisplays, nach Typ, 2019–2028 (Mio. USD)
TABELLE 282: Energie und Leistung im deutschen OLED-Markt für Industriedisplays, nach Typ, 2019–2028 (in Mio. USD)
TABELLE 283 Deutscher Markt für Militär- und Avionik-Industriedisplays, nach Technologie, 2019–2028 (Mio. USD)
TABELLE 284 Deutscher Markt für Militär- und Avionik-LEDs für Industriedisplays, nach Typ, 2019–2028 (Mio. USD)
TABELLE 285 Deutscher Markt für Militär- und Avionik-OLED für Industriedisplays, nach Typ, 2019–2028 (in Mio. USD)
TABELLE 286 Deutscher Markt für Öl und Gas in der industriellen Anzeige, nach Technologie, 2019–2028 (Mio. USD)
TABELLE 287 Deutscher Öl- und Gasmarkt im Bereich LED für Industriedisplays, nach Typ, 2019–2028 (in Mio. USD)
TABELLE 288 Deutscher Markt für Öl und Gas in OLED für Industriedisplays, nach Typ, 2019–2028 (Mio. USD)
TABELLE 289 Deutscher Markt für Transportlösungen im industriellen Displaybereich, nach Technologie, 2019–2028 (in Mio. USD)
TABELLE 290 Deutscher Markt für Transport-LEDs für Industriedisplays, nach Typ, 2019–2028 (in Mio. USD)
TABELLE 291 Deutscher Markt für OLED-Transporte für Industriedisplays, nach Typ, 2019–2028 (in Mio. USD)
TABELLE 292 Deutscher Markt für Metall und Bergbau in der Industrieanzeige, nach Technologie, 2019–2028 (Mio. USD)
TABELLE 293 Deutscher Markt für Metall und Bergbau im Bereich LED für Industriedisplays, nach Typ, 2019–2028 (Mio. USD)
TABELLE 294 Deutscher Markt für Metall und Bergbau im OLED-Bereich für Industriedisplays, nach Typ, 2019–2028 (in Mio. USD)
TABELLE 295 Sonstige Anbieter im deutschen Markt für Industriedisplays, nach Technologie, 2019–2028 (Mio. USD)
TABELLE 296 Sonstige deutsche Anbieter im LED-Markt für Industriedisplays, nach Typ, 2019–2028 (in Mio. USD)
TABELLE 297 Sonstige deutsche OLED-Marktteilnehmer für Industriedisplays, nach Typ, 2019–2028 (in Mio. USD)
TABELLE 298 Französischer Markt für Industriedisplays, nach Typ, 2019–2028 (Mio. USD)
TABELLE 299: Frankreich – Markt für robuste Displays im Industriebereich, nach Typ, 2019–2028 (Mio. USD)
TABELLE 300: Frankreich – Markt für robuste Displays im Industriebereich, nach Robustheitsgrad, 2019–2028 (Mio. USD)
TABELLE 301 Markt für Marinedisplays in Frankreich im Bereich Industriedisplays, nach Anwendung, 2019–2028 (in Mio. USD)
TABELLE 302 Französischer Markt für Industriedisplays, nach Technologie, 2019–2028 (Mio. USD)
TABELLE 303 Frankreich ist führend im Markt für Industriedisplays, nach Typ, 2019–2028 (Mio. USD)
TABELLE 304 Französischer OLED-Markt in Industriedisplays, nach Typ, 2019–2028 (Mio. USD)
TABELLE 305 Französischer Markt für Industriedisplays, nach Kommunikationstyp, 2019–2028 (Mio. USD)
TABELLE 306 Französischer Markt für Industriedisplays, nach Panelgröße, 2019–2028 (Mio. USD)
TABELLE 307 Französischer Markt für Industriedisplays, nach Anwendung, 2019–2028 (Mio. USD)
TABELLE 308 Französischer Markt für Industriedisplays, nach Branchen, 2019–2028 (in Mio. USD)
TABELLE 309 Französischer Markt für die Herstellung von Industriedisplays, nach Technologie, 2019–2028 (Mio. USD)
TABELLE 310 Französische LED-Produktion im Markt für Industriedisplays, nach Typ, 2019–2028 (Mio. USD)
TABELLE 311 Französischer Markt für OLED-Produktion für Industriedisplays, nach Typ, 2019–2028 (Mio. USD)
TABELLE 312: Energie und Leistung im französischen Markt für Industriedisplays, nach Technologie, 2019–2028 (Mio. USD)
TABELLE 313: Energie und Leistung im französischen Markt für LEDs für Industriedisplays, nach Typ, 2019–2028 (Mio. USD)
TABELLE 314: Energie und Leistung im französischen OLED-Markt für Industriedisplays, nach Typ, 2019–2028 (Mio. USD)
TABELLE 315 – Französischer Markt für Militär- und Avionik-Industriedisplays, nach Technologie, 2019–2028 (Mio. USD)
TABELLE 316 Französischer Markt für Militär- und Avionik-LEDs für Industriedisplays, nach Typ, 2019–2028 (Mio. USD)
TABELLE 317 Französischer Markt für Militär- und Avionik-OLED für Industriedisplays, nach Typ, 2019–2028 (Mio. USD)
TABELLE 318 Französischer Markt für Öl und Gas in der industriellen Anzeige, nach Technologie, 2019–2028 (Mio. USD)
TABELLE 319 Französischer Öl- und Gasmarkt im Bereich LED für Industriedisplays, nach Typ, 2019–2028 (Mio. USD)
TABELLE 320 Französischer Markt für Öl und Gas im OLED-Bereich für Industriedisplays, nach Typ, 2019–2028 (in Mio. USD)
TABELLE 321. Französischer Markt für Transportmittel im industriellen Displaybereich, nach Technologie, 2019–2028 (Mio. USD)
TABELLE 322. Französischer Markt für Transport-LEDs für Industriedisplays, nach Typ, 2019–2028 (in Mio. USD)
TABELLE 323 Französischer Markt für OLED-Transporte für Industriedisplays, nach Typ, 2019–2028 (Mio. USD)
TABELLE 324. Französischer Markt für Metall und Bergbau in der Industrieanzeige, nach Technologie, 2019–2028 (Mio. USD)
TABELLE 325 Frankreich – Metall und Bergbau im LED-Markt für Industriedisplays, nach Typ, 2019–2028 (Mio. USD)
TABELLE 326 Frankreich – Metall und Bergbau im OLED-Markt für Industriedisplays, nach Typ, 2019–2028 (Mio. USD)
TABELLE 327 Sonstige Anbieter im französischen Markt für Industriedisplays, nach Technologie, 2019–2028 (Mio. USD)
TABELLE 328 Sonstige LED-Anzeigen in Frankreich auf dem Markt für Industriedisplays, nach Typ, 2019–2028 (in Mio. USD)
TABELLE 329 Sonstige Anbieter in Frankreich im OLED-Markt für Industriedisplays, nach Typ, 2019–2028 (Mio. USD)
TABELLE 330 Italienischer Markt für Industriedisplays, nach Typ, 2019–2028 (Mio. USD)
TABELLE 331: Italienischer Markt für robuste Displays im Industriedisplaybereich, nach Typ, 2019–2028 (Mio. USD)
TABELLE 332: Robuste Displays im italienischen Markt für Industriedisplays, nach Robustheitsgrad, 2019–2028 (Mio. USD)
TABELLE 333 Italienischer Markt für Marinedisplays im industriellen Displaybereich, nach Anwendung, 2019–2028 (Mio. USD)
TABELLE 334 Italienischer Markt für Industriedisplays, nach Technologie, 2019–2028 (Mio. USD)
TABELLE 335: Italien ist Marktführer im Bereich Industriedisplays, nach Typ, 2019–2028 (Mio. USD)
TABELLE 336 Italienischer OLED-Markt für Industriedisplays, nach Typ, 2019–2028 (Mio. USD)
TABELLE 337 Italienischer Markt für Industriedisplays, nach Kommunikationstyp, 2019–2028 (Mio. USD)
TABELLE 338 Italienischer Markt für Industriedisplays, nach Panelgröße, 2019–2028 (Mio. USD)
TABELLE 339 Italienischer Markt für Industriedisplays, nach Anwendung, 2019–2028 (Mio. USD)
TABELLE 340 Italienischer Markt für Industriedisplays, nach Branchen, 2019–2028 (in Mio. USD)
TABELLE 341 Italienischer Markt für die Herstellung von Industriedisplays, nach Technologie, 2019–2028 (Mio. USD)
TABELLE 342 Italienische Produktion im Markt für LEDs für Industriedisplays, nach Typ, 2019–2028 (Mio. USD)
TABELLE 343 Italienischer Markt für OLED-Produktion für Industriedisplays, nach Typ, 2019–2028 (Mio. USD)
TABELLE 344 Italienischer Markt für Energie und Leistung im Bereich industrieller Displays, nach Technologie, 2019–2028 (Mio. USD)
TABELLE 345: Energie und Leistung im italienischen Markt für LEDs für Industriedisplays, nach Typ, 2019–2028 (Mio. USD)
TABELLE 346: Energie und Leistung im italienischen OLED-Markt für Industriedisplays, nach Typ, 2019–2028 (in Mio. USD)
TABELLE 347 – Italienischer Markt für Militär- und Avionik-Industriedisplays, nach Technologie, 2019–2028 (Mio. USD)
TABELLE 348 Italienischer Markt für Militär- und Avionik-LEDs für Industriedisplays, nach Typ, 2019–2028 (Mio. USD)
TABELLE 349 – Italienischer Markt für Militär- und Avionik-OLED für Industriedisplays, nach Typ, 2019–2028 (Mio. USD)
TABELLE 350 Italienischer Markt für Öl und Gas in der Industrieanzeige, nach Technologie, 2019–2028 (Mio. USD)
TABELLE 351 Italienischer Markt für Öl und Gas im LED-Bereich für Industriedisplays, nach Typ, 2019–2028 (Mio. USD)
TABELLE 352 Italienischer Markt für Öl und Gas im OLED-Bereich für Industriedisplays, nach Typ, 2019–2028 (in Mio. USD)
TABELLE 353 Italienischer Markt für Transportmittel im industriellen Displaybereich, nach Technologie, 2019–2028 (Mio. USD)
TABELLE 354 Italienischer Markt für Transport-LEDs für Industriedisplays, nach Typ, 2019–2028 (Mio. USD)
TABELLE 355 – Italienischer Markt für OLED-Transporte für Industriedisplays, nach Typ, 2019–2028 (Mio. USD)
TABELLE 356: Italienischer Markt für Metall und Bergbau im Bereich industrielle Displays, nach Technologie, 2019–2028 (Mio. USD)
TABELLE 357 Italien: Metall- und Bergbau-LED-Markt für Industriedisplays, nach Typ, 2019–2028 (Mio. USD)
TABELLE 358: Italien – Metall und Bergbau im OLED-Markt für Industriedisplays, nach Typ, 2019–2028 (Mio. USD)
TABELLE 359 Italien, sonstige Anbieter im Markt für Industriedisplays, nach Technologie, 2019–2028 (Mio. USD)
TABELLE 360 Italien, sonstige Anbieter im LED-Markt für Industriedisplays, nach Typ, 2019–2028 (Mio. USD)
TABELLE 361 Italien, Sonstige im OLED-Markt für Industriedisplays, nach Typ, 2019–2028 (Mio. USD)
TABELLE 362 Spanischer Markt für Industriedisplays, nach Typ, 2019–2028 (Mio. USD)
TABELLE 363: Spanien – Markt für robuste Displays im Industriebereich, nach Typ, 2019–2028 (Mio. USD)
TABELLE 364: Spanien – Markt für robuste Displays im Industriebereich, nach Robustheitsgrad, 2019–2028 (Mio. USD)
TABELLE 365 Spanischer Markt für Marinedisplays im industriellen Displaybereich, nach Anwendung, 2019–2028 (in Mio. USD)
TABELLE 366 Spanischer Markt für Industriedisplays, nach Technologie, 2019–2028 (Mio. USD)
TABLE 367 Spain led in industrial display Market, By type, 2019-2028 (USD million)
TABLE 368 Spain oled in industrial display Market, By type, 2019-2028 (USD million)
TABLE 369 Spain industrial display Market, By communication type, 2019-2028 (USD million)
TABLE 370 Spain industrial display Market, By panel size, 2019-2028 (USD million)
TABLE 371 Spain industrial display Market, By application, 2019-2028 (USD million)
TABLE 372 Spain industrial display Market, By Vertical, 2019-2028 (USD million)
TABLE 373 Spain manufacturing in industrial display Market, By technology, 2019-2028 (USD million)
TABLE 374 Spain manufacturing in led for industrial display Market, By type, 2019-2028 (USD million)
TABLE 375 Spain manufacturing in oled for industrial display Market, By type, 2019-2028 (USD million)
TABLE 376 Spain energy & power in industrial display Market, By technology, 2019-2028 (USD million)
TABLE 377 Spain energy & power in led for industrial display Market, By type, 2019-2028 (USD million)
TABLE 378 Spain energy & power in oled for industrial display Market, By type, 2019-2028 (USD million)
TABLE 379 Spain military & avionics in industrial display Market, By technology, 2019-2028 (USD million)
TABLE 380 Spain military & avionics in led for industrial display Market, By type, 2019-2028 (USD million)
TABLE 381 Spain military & avionics in oled for industrial display Market, By type, 2019-2028 (USD million)
TABLE 382 Spain oil & gas in industrial display Market, By technology, 2019-2028 (USD million)
TABLE 383 Spain oil & gas in led for industrial display Market, By type, 2019-2028 (USD million)
TABLE 384 Spain oil & gas in oled for industrial display Market, By type, 2019-2028 (USD million)
TABLE 385 Spain transportation in industrial display Market, By technology, 2019-2028 (USD million)
TABLE 386 Spain transportation in led for industrial display Market, By type, 2019-2028 (USD million)
TABLE 387 Spain transportation in oled for industrial display Market, By type, 2019-2028 (USD million)
TABLE 388 Spain metal & mining in industrial display Market, By technology, 2019-2028 (USD million)
TABLE 389 Spain metal & mining in led for industrial display Market, By type, 2019-2028 (USD million)
TABLE 390 Spain metal & mining in oled for industrial display Market, By type, 2019-2028 (USD million)
TABLE 391 Spain others in industrial display Market, By technology, 2019-2028 (USD million)
TABLE 392 Spain others in led for industrial display Market, By type, 2019-2028 (USD million)
TABLE 393 Spain others in oled for industrial display Market, By type, 2019-2028 (USD million)
TABLE 394 Netherlands industrial display Market, By type, 2019-2028 (USD million)
TABLE 395 Netherlands rugged display in industrial display Market, By type, 2019-2028 (USD million)
TABLE 396 Netherlands rugged display in industrial display Market, By level of ruggedness, 2019-2028 (USD million)
TABELLE 397 Niederländischer Markt für Marinedisplays im industriellen Displaybereich, nach Anwendung, 2019–2028 (Mio. USD)
TABELLE 398 Niederländischer Markt für Industriedisplays, nach Technologie, 2019–2028 (Mio. USD)
TABELLE 399: Niederlande führend im Markt für Industriedisplays, nach Typ, 2019–2028 (Mio. USD)
TABELLE 400: Niederländischer OLED-Markt für Industriedisplays, nach Typ, 2019–2028 (in Mio. USD)
TABELLE 401 Niederländischer Markt für Industriedisplays, nach Kommunikationstyp, 2019–2028 (Mio. USD)
TABELLE 402 Niederländischer Markt für Industriedisplays, nach Panelgröße, 2019–2028 (Mio. USD)
TABELLE 403 Niederländischer Markt für Industriedisplays, nach Anwendung, 2019–2028 (Mio. USD)
TABELLE 404 Niederländischer Markt für Industriedisplays, nach Branchen, 2019–2028 (in Mio. USD)
TABELLE 405 Niederländischer Markt für die Herstellung von Industriedisplays, nach Technologie, 2019–2028 (Mio. USD)
TABELLE 406 Niederländische Produktion im Markt für LEDs für Industriedisplays, nach Typ, 2019–2028 (Mio. USD)
TABELLE 407 Niederländische OLED-Produktion für den Markt für Industriedisplays, nach Typ, 2019–2028 (Mio. USD)
TABELLE 408 Niederländischer Markt für Energie und Leistung im Bereich Industriedisplays, nach Technologie, 2019–2028 (Mio. USD)
TABELLE 409 Energie und Leistung im niederländischen Markt für LEDs für Industriedisplays, nach Typ, 2019–2028 (Mio. USD)
TABELLE 410: Energie und Leistung im niederländischen OLED-Markt für Industriedisplays, nach Typ, 2019–2028 (Mio. USD)
TABELLE 411 Niederländischer Markt für Militär- und Avionik-Industriedisplays, nach Technologie, 2019–2028 (Mio. USD)
TABELLE 412 Niederländischer Markt für Militär- und Avionik-LEDs für Industriedisplays, nach Typ, 2019–2028 (Mio. USD)
TABELLE 413 Niederländischer Markt für Militär- und Avionik-OLED für Industriedisplays, nach Typ, 2019–2028 (Mio. USD)
TABELLE 414 Niederländischer Markt für Öl und Gas in der Industrieanzeige, nach Technologie, 2019–2028 (Mio. USD)
TABELLE 415 Niederländischer Öl- und Gasmarkt im LED-Bereich für Industriedisplays, nach Typ, 2019–2028 (Mio. USD)
TABELLE 416 Niederländischer Markt für Öl und Gas in OLED für Industriedisplays, nach Typ, 2019–2028 (Mio. USD)
TABELLE 417 Niederländischer Markt für Transportlösungen im Bereich Industriedisplays, nach Technologie, 2019–2028 (Mio. USD)
TABELLE 418 Niederländischer Markt für Transport-LEDs für Industriedisplays, nach Typ, 2019–2028 (Mio. USD)
TABELLE 419 Niederländischer Markt für OLED-Transporte für Industriedisplays, nach Typ, 2019–2028 (Mio. USD)
TABELLE 420 Niederländischer Markt für Metall und Bergbau in der Industrieanzeige, nach Technologie, 2019–2028 (Mio. USD)
TABELLE 421 Niederlande – Metall und Bergbau im LED-Markt für Industriedisplays, nach Typ, 2019–2028 (Mio. USD)
TABELLE 422: Niederlande – Metall und Bergbau im OLED-Markt für Industriedisplays, nach Typ, 2019–2028 (Mio. USD)
TABELLE 423 Sonstige niederländische Anbieter im Markt für Industriedisplays, nach Technologie, 2019–2028 (Mio. USD)
TABELLE 424 Sonstige niederländische Anbieter im LED-Markt für Industriedisplays, nach Typ, 2019–2028 (Mio. USD)
TABELLE 425 Sonstige niederländische Anbieter im OLED-Markt für Industriedisplays, nach Typ, 2019–2028 (Mio. USD)
TABELLE 426 Schweizer Markt für Industriedisplays, nach Typ, 2019–2028 (in Mio. USD)
TABELLE 427 – Schweizer Markt für robuste Displays im Industriedisplaybereich, nach Typ, 2019–2028 (in Mio. USD)
TABELLE 428 – Schweizer Markt für robuste Displays im Industriedisplaybereich, nach Robustheitsgrad, 2019–2028 (in Mio. USD)
TABELLE 429 Schweizer Markt für Marinedisplays im industriellen Displaybereich, nach Anwendung, 2019–2028 (in Mio. USD)
TABELLE 430 Schweizer Markt für Industriedisplays, nach Technologie, 2019–2028 (in Mio. USD)
TABELLE 431: Die Schweiz ist führend im Markt für Industriedisplays, nach Typ, 2019–2028 (in Millionen USD)
TABELLE 432 – OLED-Markt in der Schweiz für Industriedisplays, nach Typ, 2019–2028 (in Mio. USD)
TABELLE 433 Schweizer Markt für Industriedisplays, nach Kommunikationstyp, 2019–2028 (in Mio. USD)
TABELLE 434 Schweizer Markt für Industriedisplays, nach Panelgröße, 2019–2028 (in Mio. USD)
TABELLE 435 Schweizer Markt für Industriedisplays, nach Anwendung, 2019–2028 (in Mio. USD)
TABELLE 436 Schweizer Markt für Industriedisplays, nach Branchen, 2019–2028 (in Mio. USD)
TABELLE 437 Schweizer Markt für die Herstellung von Industriedisplays, nach Technologie, 2019–2028 (in Mio. USD)
TABELLE 438 Schweizer Markt für LED-Produktion für Industriedisplays, nach Typ, 2019–2028 (in Mio. USD)
TABELLE 439 Schweizer OLED-Produktionsmarkt für Industriedisplays, nach Typ, 2019–2028 (in Mio. USD)
TABELLE 440 Schweizer Markt für Energie und Leistung im Bereich industrieller Displays, nach Technologie, 2019–2028 (in Mio. USD)
TABELLE 441 Energie und Leistung im Schweizer Markt für LEDs für Industriedisplays, nach Typ, 2019–2028 (in Mio. USD)
TABELLE 442 Energie und Leistung im Schweizer OLED-Markt für Industriedisplays, nach Typ, 2019–2028 (in Mio. USD)
TABELLE 443 Schweizer Markt für Militär- und Avionik-Industriedisplays, nach Technologie, 2019–2028 (in Mio. USD)
TABELLE 444 Schweizer Markt für Militär- und Avionik-LEDs für Industriedisplays, nach Typ, 2019–2028 (in Mio. USD)
TABELLE 445 Schweizer Markt für Militär- und Avionik-OLED für Industriedisplays, nach Typ, 2019–2028 (in Mio. USD)
TABELLE 446 Schweizer Markt für Öl und Gas in der Industrieanzeige, nach Technologie, 2019–2028 (in Mio. USD)
TABELLE 447 Schweizer Öl- und Gasmarkt im LED-Bereich für Industriedisplays, nach Typ, 2019–2028 (in Mio. USD)
TABELLE 448 Schweizer Markt für Öl und Gas in OLED für Industriedisplays, nach Typ, 2019–2028 (in Mio. USD)
TABELLE 449 Schweizer Markt für Transportlösungen im Bereich Industriedisplays, nach Technologie, 2019–2028 (in Mio. USD)
TABELLE 450 Schweizer Transportmarkt für LEDs für Industriedisplays, nach Typ, 2019–2028 (in Mio. USD)
TABELLE 451 Schweizer Markt für OLED-Transporte für Industriedisplays, nach Typ, 2019–2028 (in Mio. USD)
TABELLE 452 Schweizer Markt für Metall und Bergbau im industriellen Displaybereich, nach Technologie, 2019–2028 (in Mio. USD)
TABELLE 453 Schweizer Markt für Metall und Bergbau im LED-Bereich für Industriedisplays, nach Typ, 2019–2028 (in Mio. USD)
TABELLE 454 Schweizer Markt für Metall und Bergbau im OLED-Markt für Industriedisplays, nach Typ, 2019–2028 (in Mio. USD)
TABELLE 455 Sonstige Anbieter im Schweizer Markt für Industriedisplays, nach Technologie, 2019–2028 (in Millionen USD)
TABELLE 456 Sonstige Anbieter im Schweizer Markt für LEDs für Industriedisplays, nach Typ, 2019–2028 (in Mio. USD)
TABELLE 457 Sonstige Anbieter im OLED-Markt für Industriedisplays in der Schweiz, nach Typ, 2019–2028 (in Mio. USD)
TABELLE 458 Russischer Markt für Industriedisplays, nach Typ, 2019–2028 (in Mio. USD)
TABELLE 459: Russlands Markt für robuste Displays im Industriedisplaybereich, nach Typ, 2019–2028 (in Mio. USD)
TABELLE 460: Russlands Markt für robuste Displays im Industriedisplaybereich, nach Robustheitsgrad, 2019–2028 (in Mio. USD)
TABELLE 461 Russischer Markt für Marinedisplays im industriellen Displaybereich, nach Anwendung, 2019–2028 (in Mio. USD)
TABELLE 462 Russischer Markt für Industriedisplays, nach Technologie, 2019–2028 (in Mio. USD)
TABELLE 463 Russland ist führend im Markt für Industriedisplays, nach Typ, 2019–2028 (in Millionen USD)
TABELLE 464 – Russischer OLED-Markt für Industriedisplays, nach Typ, 2019–2028 (in Mio. USD)
TABELLE 465 Russischer Markt für Industriedisplays, nach Kommunikationstyp, 2019–2028 (in Mio. USD)
TABELLE 466 Russischer Markt für Industriedisplays, nach Panelgröße, 2019–2028 (in Mio. USD)
TABELLE 467 Russischer Markt für Industriedisplays, nach Anwendung, 2019–2028 (in Mio. USD)
TABELLE 468 Russischer Markt für Industriedisplays, nach Branchen, 2019–2028 (in Mio. USD)
TABELLE 469 Russischer Markt für die Herstellung von Industriedisplays, nach Technologie, 2019–2028 (in Mio. USD)
TABELLE 470 Russischer Markt für die Herstellung von LEDs für Industriedisplays, nach Typ, 2019–2028 (in Mio. USD)
TABELLE 471 Russischer Markt für OLED-Produktion für Industriedisplays, nach Typ, 2019–2028 (in Mio. USD)
TABELLE 472: Russischer Markt für Energie und Leistung im Bereich industrieller Displays, nach Technologie, 2019–2028 (in Millionen USD)
TABELLE 473 Energie und Leistung im russischen LED-Markt für Industriedisplays, nach Typ, 2019–2028 (in Mio. USD)
TABELLE 474: Energie und Leistung im russischen OLED-Markt für Industriedisplays, nach Typ, 2019–2028 (in Mio. USD)
TABELLE 475 – Russischer Markt für Militär- und Avionik-Industriedisplays, nach Technologie, 2019–2028 (in Millionen USD)
TABELLE 476 – Russischer Markt für Militär- und Avionik-LEDs für Industriedisplays, nach Typ, 2019–2028 (in Mio. USD)
TABELLE 477 – Russischer Markt für Militär- und Avionik-OLED für Industriedisplays, nach Typ, 2019–2028 (in Mio. USD)
TABELLE 478 Russischer Markt für Öl und Gas in der Industrieanzeige, nach Technologie, 2019–2028 (in Mio. USD)
TABELLE 479 Russischer Öl- und Gasmarkt im LED-Bereich für Industriedisplays, nach Typ, 2019–2028 (in Mio. USD)
TABELLE 480 Russischer Markt für Öl und Gas in OLED für Industriedisplays, nach Typ, 2019–2028 (in Mio. USD)
TABELLE 481 Russischer Markt für Transportlösungen im Bereich Industriedisplays, nach Technologie, 2019–2028 (in Mio. USD)
TABELLE 482 Russischer Markt für Transport-LEDs für Industriedisplays, nach Typ, 2019–2028 (in Mio. USD)
TABELLE 483 – Russischer Markt für OLED-Transporte für Industriedisplays, nach Typ, 2019–2028 (in Mio. USD)
TABELLE 484 Russlands Markt für Metall und Bergbau in der Industrieanzeige, nach Technologie, 2019–2028 (in Mio. USD)
TABELLE 485 Russland: Metall und Bergbau im LED-Markt für Industriedisplays, nach Typ, 2019–2028 (in Mio. USD)
TABELLE 486 Russland: Metall und Bergbau im OLED-Markt für Industriedisplays, nach Typ, 2019–2028 (in Mio. USD)
TABELLE 487 Russland, Sonstige im Markt für Industriedisplays, nach Technologie, 2019–2028 (in Millionen USD)
TABELLE 488 Russland, andere Anbieter im LED-Markt für Industriedisplays, nach Typ, 2019–2028 (in Mio. USD)
TABELLE 489 Russland, Sonstige im OLED-Markt für Industriedisplays, nach Typ, 2019–2028 (in Mio. USD)
TABELLE 490 Türkischer Markt für Industriedisplays, nach Typ, 2019–2028 (in Mio. USD)
TABELLE 491: Robuste Displays im türkischen Markt für Industriedisplays, nach Typ, 2019–2028 (in Mio. USD)
TABELLE 492 Robuste Displays im türkischen Markt für Industriedisplays, nach Robustheitsgrad, 2019–2028 (in Mio. USD)
TABELLE 493 Türkischer Markt für Marinedisplays im industriellen Displaybereich, nach Anwendung, 2019–2028 (in Mio. USD)
TABELLE 494 Türkischer Markt für Industriedisplays, nach Technologie, 2019–2028 (in Mio. USD)
TABELLE 495: Türkei führt den Markt für Industriedisplays an, nach Typ, 2019–2028 (in Mio. USD)
TABELLE 496 Türkischer OLED-Markt in Industriedisplays, nach Typ, 2019–2028 (in Mio. USD)
TABELLE 497 Türkischer Markt für Industriedisplays, nach Kommunikationstyp, 2019–2028 (in Mio. USD)
TABELLE 498 Türkischer Markt für Industriedisplays, nach Panelgröße, 2019–2028 (in Mio. USD)
TABELLE 499 Türkischer Markt für Industriedisplays, nach Anwendung, 2019–2028 (in Mio. USD)
TABELLE 500: Türkischer Markt für Industriedisplays, nach Branchen, 2019–2028 (in Millionen USD)
TABELLE 501 Türkischer Markt für die Herstellung von Industriedisplays, nach Technologie, 2019–2028 (in Mio. USD)
TABELLE 502 Türkische Produktion im LED-Markt für Industriedisplays, nach Typ, 2019–2028 (in Mio. USD)
TABELLE 503 Türkische OLED-Produktion für den Markt für Industriedisplays, nach Typ, 2019–2028 (in Mio. USD)
TABELLE 504 Energie- und Leistungsmarkt für Industriedisplays in der Türkei, nach Technologie, 2019–2028 (in Mio. USD)
TABELLE 505 Energie und Leistung im türkischen Markt für LEDs für Industriedisplays, nach Typ, 2019–2028 (in Mio. USD)
TABELLE 506 Energie und Leistung im türkischen OLED-Markt für Industriedisplays, nach Typ, 2019–2028 (in Mio. USD)
TABELLE 507 Türkischer Markt für Militär- und Avionik-Industriedisplays, nach Technologie, 2019–2028 (in Mio. USD)
TABELLE 508 Türkischer Markt für Militär- und Avionik-LEDs für Industriedisplays, nach Typ, 2019–2028 (in Mio. USD)
TABELLE 509 Türkischer Markt für Militär- und Avionik-OLED für Industriedisplays, nach Typ, 2019–2028 (in Mio. USD)
TABELLE 510 Türkischer Markt für Öl und Gas in der Industrieanzeige, nach Technologie, 2019–2028 (in Mio. USD)
TABELLE 511 Türkischer Öl- und Gasmarkt im LED-Bereich für Industriedisplays, nach Typ, 2019–2028 (in Mio. USD)
TABELLE 512 Türkischer Markt für Öl und Gas in OLED für Industriedisplays, nach Typ, 2019–2028 (in Mio. USD)
TABELLE 513 Transportmarkt für Industriedisplays in der Türkei, nach Technologie, 2019–2028 (in Mio. USD)
TABELLE 514 Transportmarkt für LEDs für Industriedisplays in der Türkei, nach Typ, 2019–2028 (in Mio. USD)
TABELLE 515 – Transportmarkt für OLEDs für Industriedisplays in der Türkei, nach Typ, 2019–2028 (in Mio. USD)
TABELLE 516 Türkischer Markt für Metall und Bergbau in der Industrieanzeige, nach Technologie, 2019–2028 (in Mio. USD)
TABELLE 517 Metall- und Bergbau-LED-Markt in der Türkei für Industriedisplays, nach Typ, 2019–2028 (in Mio. USD)
TABELLE 518 Türkischer Markt für Metall und Bergbau im OLED-Bereich für Industriedisplays, nach Typ, 2019–2028 (in Mio. USD)
TABELLE 519 Sonstige Anbieter im türkischen Markt für Industriedisplays, nach Technologie, 2019–2028 (in Mio. USD)
TABELLE 520 Sonstige LED-Anzeigen in der Türkei auf dem Markt für Industriedisplays, nach Typ, 2019–2028 (in Mio. USD)
TABELLE 521 Sonstige Akteure der Türkei im OLED-Markt für Industriedisplays, nach Typ, 2019–2028 (in Mio. USD)
TABELLE 522 Belgischer Markt für Industriedisplays, nach Typ, 2019–2028 (in Mio. USD)
TABELLE 523 Belgischer Markt für robuste Displays im Industriedisplaybereich, nach Typ, 2019–2028 (in Mio. USD)
TABELLE 524: Belgien: Robuste Displays im Markt für Industriedisplays, nach Robustheitsgrad, 2019–2028 (in Mio. USD)
TABELLE 525 Belgischer Markt für Marinedisplays im industriellen Displaybereich, nach Anwendung, 2019–2028 (in Mio. USD)
TABELLE 526 Belgischer Markt für Industriedisplays, nach Technologie, 2019–2028 (in Mio. USD)
TABELLE 527 Belgien ist führend im Markt für Industriedisplays, nach Typ, 2019–2028 (in Mio. USD)
TABELLE 528 Belgischer OLED-Markt für Industriedisplays, nach Typ, 2019–2028 (in Mio. USD)
TABELLE 529 Belgischer Markt für Industriedisplays, nach Kommunikationstyp, 2019–2028 (in Mio. USD)
TABELLE 530 Belgischer Markt für Industriedisplays, nach Panelgröße, 2019–2028 (in Mio. USD)
TABELLE 531 Belgischer Markt für Industriedisplays, nach Anwendung, 2019–2028 (in Mio. USD)
TABELLE 532 Belgischer Markt für Industriedisplays, nach Branchen, 2019–2028 (in Mio. USD)
TABELLE 533 Belgischer Markt für die Herstellung von Industriedisplays, nach Technologie, 2019–2028 (in Mio. USD)
TABELLE 534 Belgischer Markt für LED-Produktion für Industriedisplays, nach Typ, 2019–2028 (in Mio. USD)
TABELLE 535: Belgischer OLED-Markt für Industriedisplays, nach Typ, 2019–2028 (in Mio. USD)
TABELLE 536 Belgischer Markt für Energie und Leistung im Bereich Industriedisplays, nach Technologie, 2019–2028 (in Mio. USD)
TABELLE 537: Energie und Leistung im belgischen Markt für LEDs für Industriedisplays, nach Typ, 2019–2028 (in Mio. USD)
TABELLE 538: Belgischer Markt für Energie und Leistung im OLED-Bereich für Industriedisplays, nach Typ, 2019–2028 (in Mio. USD)
TABELLE 539 Belgischer Markt für Militär- und Avionik-Industriedisplays, nach Technologie, 2019–2028 (in Mio. USD)
TABELLE 540 Belgischer Markt für Militär- und Avionik-LEDs für Industriedisplays, nach Typ, 2019–2028 (in Mio. USD)
TABELLE 541 Belgischer Markt für Militär- und Avionik-OLED für Industriedisplays, nach Typ, 2019–2028 (in Mio. USD)
TABELLE 542 Belgischer Markt für Öl und Gas in der Industrieanzeige, nach Technologie, 2019–2028 (in Mio. USD)
TABELLE 543 Belgischer Markt für Öl und Gas im LED-Bereich für Industriedisplays, nach Typ, 2019–2028 (in Mio. USD)
TABELLE 544 Belgischer Markt für Öl und Gas in OLED für Industriedisplays, nach Typ, 2019–2028 (in Mio. USD)
TABELLE 545 Belgischer Markt für Transportmittel im industriellen Displaybereich, nach Technologie, 2019–2028 (in Mio. USD)
TABELLE 546 Belgischer Markt für Transport-LEDs für Industriedisplays, nach Typ, 2019–2028 (in Mio. USD)
TABELLE 547 Belgischer OLED-Transportmarkt für Industriedisplays, nach Typ, 2019–2028 (in Mio. USD)
TABELLE 548 Belgischer Markt für Metall und Bergbau in der Industrieanzeige, nach Technologie, 2019–2028 (in Mio. USD)
TABELLE 549 Belgischer Markt für Metall und Bergbau im LED-Bereich für Industriedisplays, nach Typ, 2019–2028 (in Mio. USD)
TABELLE 550 Belgischer Markt für Metall und Bergbau im OLED-Bereich für Industriedisplays, nach Typ, 2019–2028 (in Mio. USD)
TABELLE 551 Belgien – Sonstige Unternehmen im Markt für Industriedisplays, nach Technologie, 2019–2028 (in Mio. USD)
TABELLE 552 Belgien, Sonstige im LED-Markt für Industriedisplays, nach Typ, 2019–2028 (in Mio. USD)
TABELLE 553 Sonstige Akteure in Belgien im OLED-Markt für Industriedisplays, nach Typ, 2019–2028 (in Mio. USD)
TABELLE 554 – Markt für Industriedisplays im übrigen Europa, nach Typ, 2019–2028 (in Mio. USD)
TABELLE 555 – Markt für Industriedisplays im asiatisch-pazifischen Raum, nach Ländern, 2019–2028 (in Mio. USD)
TABELLE 556 Markt für Industriedisplays im asiatisch-pazifischen Raum, nach Typ, 2019–2028 (in Mio. USD)
TABELLE 557 Markt für robuste Displays im Industriebereich im asiatisch-pazifischen Raum, nach Typ, 2019–2028 (in Mio. USD)
TABELLE 558 Markt für robuste Displays im Industriebereich im asiatisch-pazifischen Raum, nach Robustheitsgrad, 2019–2028 (in Mio. USD)
TABELLE 559 Markt für Marinedisplays im asiatisch-pazifischen Raum im industriellen Displaybereich, nach Anwendung, 2019–2028 (in Mio. USD)
TABELLE 560 Markt für Industriedisplays im asiatisch-pazifischen Raum, nach Technologie, 2019–2028 (in Mio. USD)
TABELLE 561 Asien-Pazifik-Marktführer im Bereich Industriedisplays, nach Typ, 2019–2028 (in Mio. USD)
TABELLE 562 Markt für OLED-Industriedisplays im asiatisch-pazifischen Raum, nach Typ, 2019–2028 (in Mio. USD)
TABELLE 563 Markt für Industriedisplays im asiatisch-pazifischen Raum, nach Kommunikationstyp, 2019–2028 (in Mio. USD)
TABELLE 564 Markt für Industriedisplays im asiatisch-pazifischen Raum, nach Panelgröße, 2019–2028 (in Mio. USD)
TABELLE 565 Markt für Industriedisplays im asiatisch-pazifischen Raum, nach Anwendung, 2019–2028 (in Mio. USD)
TABELLE 566 Markt für Industriedisplays im asiatisch-pazifischen Raum, nach Branchen, 2019–2028 (in Mio. USD)
TABELLE 567 Markt für die Herstellung industrieller Displays im asiatisch-pazifischen Raum, nach Technologie, 2019–2028 (in Mio. USD)
TABELLE 568 Asiatisch-pazifischer Markt für die Herstellung von LEDs für Industriedisplays, nach Typ, 2019–2028 (in Mio. USD)
TABELLE 569 – Asiatisch-pazifischer Markt für OLED-Produktion für Industriedisplays, nach Typ, 2019–2028 (in Mio. USD)
TABELLE 570 Energie- und Leistungsmarkt für Industriedisplays im asiatisch-pazifischen Raum, nach Technologie, 2019–2028 (in Mio. USD)
TABELLE 571 Energie und Leistung im asiatisch-pazifischen Markt für LEDs für Industriedisplays, nach Typ, 2019–2028 (in Mio. USD)
TABELLE 572 Energie- und Leistungsmarkt im asiatisch-pazifischen Raum im OLED-Bereich für Industriedisplays, nach Typ, 2019–2028 (in Mio. USD)
TABELLE 573 Markt für Militär- und Avioniksysteme in der Industrieanzeige im asiatisch-pazifischen Raum, nach Technologie, 2019–2028 (in Mio. USD)
TABELLE 574 – Militär und Avionik im asiatisch-pazifischen Raum in LED-Markt für Industriedisplays, nach Typ, 2019–2028 (in Mio. USD)
TABELLE 575 – Asiatisch-pazifischer Markt für Militär und Avionik in OLED für Industriedisplays, nach Typ, 2019–2028 (in Mio. USD)
TABELLE 576 Markt für Öl und Gas im asiatisch-pazifischen Raum in der industriellen Displaybranche, nach Technologie, 2019–2028 (in Mio. USD)
TABELLE 577 Markt für Öl und Gas im asiatisch-pazifischen Raum im Bereich LED für Industriedisplays, nach Typ, 2019–2028 (in Mio. USD)
TABELLE 578 Öl- und Gasmarkt im asiatisch-pazifischen Raum in OLED für Industriedisplays, nach Typ, 2019–2028 (in Mio. USD)
TABELLE 579 Transportmarkt für Industriedisplays im asiatisch-pazifischen Raum, nach Technologie, 2019–2028 (in Mio. USD)
TABELLE 580 Transportmarkt für LEDs für Industriedisplays im asiatisch-pazifischen Raum, nach Typ, 2019–2028 (in Mio. USD)
TABELLE 581 Transportmarkt für OLEDs für Industriedisplays im asiatisch-pazifischen Raum, nach Typ, 2019–2028 (in Mio. USD)
TABELLE 582 Markt für Metalle und Bergbau im asiatisch-pazifischen Raum in der Industrieanzeige, nach Technologie, 2019–2028 (in Mio. USD)
TABELLE 583 Metall- und Bergbaumarkt im asiatisch-pazifischen Raum im Bereich LED für Industriedisplays, nach Typ, 2019–2028 (in Mio. USD)
TABELLE 584 Metall- und Bergbaumarkt im asiatisch-pazifischen Raum im OLED-Markt für Industriedisplays, nach Typ, 2019–2028 (in Mio. USD)
TABELLE 585 Sonstige Anbieter im Markt für Industriedisplays im asiatisch-pazifischen Raum, nach Technologie, 2019–2028 (in Mio. USD)
TABELLE 586 Sonstige LED-Marktteilnehmer für Industriedisplays im asiatisch-pazifischen Raum, nach Typ, 2019–2028 (in Mio. USD)
TABELLE 587 Sonstige Märkte für OLED-Displays im asiatisch-pazifischen Raum, nach Typ, 2019–2028 (in Mio. USD)
TABELLE 588 Chinesischer Markt für Industriedisplays, nach Typ, 2019–2028 (in Mio. USD)
TABELLE 589 Chinesischer Markt für robuste Displays im Industriedisplaybereich, nach Typ, 2019–2028 (in Mio. USD)
TABELLE 590 Chinesischer Markt für robuste Displays im Industriedisplaybereich, nach Robustheitsgrad, 2019–2028 (in Mio. USD)
TABELLE 591 Chinesischer Markt für Marinedisplays im industriellen Displaybereich, nach Anwendung, 2019–2028 (in Mio. USD)
TABELLE 592 Chinesischer Markt für Industriedisplays, nach Technologie, 2019–2028 (in Mio. USD)
TABELLE 593 China ist führend im Markt für Industriedisplays, nach Typ, 2019–2028 (in Millionen USD)
TABELLE 594 – Chinesischer OLED-Markt in Industriedisplays, nach Typ, 2019–2028 (in Mio. USD)
TABELLE 595 Chinesischer Markt für Industriedisplays, nach Kommunikationstyp, 2019–2028 (in Mio. USD)
TABELLE 596 Chinesischer Markt für Industriedisplays, nach Panelgröße, 2019–2028 (in Mio. USD)
TABELLE 597 Chinesischer Markt für Industriedisplays, nach Anwendung, 2019–2028 (in Mio. USD)
TABELLE 598 Chinesischer Markt für Industriedisplays, nach Branchen, 2019–2028 (in Mio. USD)
TABELLE 599 Chinesischer Markt für die Herstellung von Industriedisplays, nach Technologie, 2019–2028 (in Millionen USD)
TABELLE 600 Chinesischer Markt für die Herstellung von LEDs für Industriedisplays, nach Typ, 2019–2028 (in Mio. USD)
TABELLE 601 Chinesischer OLED-Markt für Industriedisplays, nach Typ, 2019–2028 (in Mio. USD)
TABELLE 602 Chinesischer Markt für Energie und Leistung im industriellen Displaybereich, nach Technologie, 2019–2028 (in Millionen USD)
TABELLE 603 Energie und Leistung im chinesischen Markt für LEDs für Industriedisplays, nach Typ, 2019–2028 (in Mio. USD)
TABELLE 604 Chinesischer Markt für Energie und Leistung im OLED-Bereich für Industriedisplays, nach Typ, 2019–2028 (in Mio. USD)
TABELLE 605 – Chinesischer Markt für Militär- und Avionik-Industriedisplays, nach Technologie, 2019–2028 (in Millionen USD)
TABELLE 606 Chinesischer Markt für Militär- und Avionik-LEDs für Industriedisplays, nach Typ, 2019–2028 (in Mio. USD)
TABELLE 607 Chinesischer Markt für Militär- und Avionik-OLED für Industriedisplays, nach Typ, 2019–2028 (in Mio. USD)
TABELLE 608 Chinesischer Markt für Öl und Gas in der Industrieanzeige, nach Technologie, 2019–2028 (in Mio. USD)
TABELLE 609 Chinesischer Markt für Öl und Gas in LED für Industriedisplays, nach Typ, 2019–2028 (in Mio. USD)
TABELLE 610 Chinesischer Markt für Öl und Gas in OLED für Industriedisplays, nach Typ, 2019–2028 (in Mio. USD)
TABELLE 611 Chinesischer Markt für Transportmittel im industriellen Displaybereich, nach Technologie, 2019–2028 (in Mio. USD)
TABELLE 612 Chinesischer Markt für Transport-LEDs für Industriedisplays, nach Typ, 2019–2028 (in Mio. USD)
TABELLE 613 Chinesischer Markt für OLED-Transporte für Industriedisplays, nach Typ, 2019–2028 (in Mio. USD)
TABELLE 614 Chinesischer Markt für Metall und Bergbau in der Industrieanzeige, nach Technologie, 2019–2028 (in Mio. USD)
TABELLE 615: Chinas Markt für Metall und Bergbau im LED-Bereich für Industriedisplays, nach Typ, 2019–2028 (in Mio. USD)
TABELLE 616 – Chinesischer Markt für Metall und Bergbau im OLED-Bereich für Industriedisplays, nach Typ, 2019–2028 (in Mio. USD)
TABELLE 617 Sonstige Anbieter im chinesischen Markt für Industriedisplays, nach Technologie, 2019–2028 (in Millionen USD)
TABELLE 618 Sonstige LED-Produkte für Industriedisplays in China, nach Typ, 2019–2028 (in Mio. USD)
TABELLE 619 Sonstige Anbieter im OLED-Markt für Industriedisplays in China, nach Typ, 2019–2028 (in Mio. USD)
TABELLE 620 Japanischer Markt für Industriedisplays, nach Typ, 2019–2028 (in Mio. USD)
TABELLE 621 Japanischer Markt für robuste Displays im Industriedisplaybereich, nach Typ, 2019–2028 (in Mio. USD)
TABELLE 622: Japanischer Markt für robuste Displays im Industriedisplaybereich, nach Robustheitsgrad, 2019–2028 (in Mio. USD)
TABELLE 623 Japanischer Markt für Marinedisplays im industriellen Displaybereich, nach Anwendung, 2019–2028 (in Mio. USD)
TABELLE 624 Japanischer Markt für Industriedisplays, nach Technologie, 2019–2028 (in Mio. USD)
TABELLE 625 Japan ist führend im Markt für Industriedisplays, nach Typ, 2019–2028 (in Mio. USD)
TABELLE 626 Japanischer OLED-Markt für Industriedisplays, nach Typ, 2019–2028 (in Mio. USD)
TABELLE 627 Japanischer Markt für Industriedisplays, nach Kommunikationstyp, 2019–2028 (in Mio. USD)
TABELLE 628 Japanischer Markt für Industriedisplays, nach Panelgröße, 2019–2028 (in Mio. USD)
TABELLE 629 Japanischer Markt für Industriedisplays, nach Anwendung, 2019–2028 (in Mio. USD)
TABELLE 630 Japanischer Markt für Industriedisplays, nach Branchen, 2019–2028 (in Mio. USD)
TABELLE 631 Japanischer Markt für die Herstellung von Industriedisplays, nach Technologie, 2019–2028 (in Mio. USD)
TABELLE 632 Japanische LED-Produktion für den Markt für Industriedisplays, nach Typ, 2019–2028 (in Mio. USD)
TABELLE 633 Japanischer OLED-Markt für Industriedisplays, nach Typ, 2019–2028 (in Mio. USD)
TABELLE 634 Japanischer Markt für Energie und Leistung im Bereich industrieller Displays, nach Technologie, 2019–2028 (in Mio. USD)
TABELLE 635 Energie und Leistung im japanischen LED-Markt für Industriedisplays, nach Typ, 2019–2028 (in Mio. USD)
TABELLE 636 Japanischer Markt für Energie und Leistung im OLED-Bereich für Industriedisplays, nach Typ, 2019–2028 (in Mio. USD)
TABELLE 637 Japanischer Markt für Militär- und Avionik-Industriedisplays, nach Technologie, 2019–2028 (in Mio. USD)
TABELLE 638 Japanischer Markt für Militär- und Avionik-LEDs für Industriedisplays, nach Typ, 2019–2028 (in Mio. USD)
TABELLE 639 Japanischer Markt für Militär- und Avionik-OLED für Industriedisplays, nach Typ, 2019–2028 (in Mio. USD)
TABELLE 640 Japanischer Markt für Öl und Gas in der Industrieanzeige, nach Technologie, 2019–2028 (in Mio. USD)
TABELLE 641 Japanischer Öl- und Gasmarkt im LED-Bereich für Industriedisplays, nach Typ, 2019–2028 (in Mio. USD)
TABELLE 642 Japanischer Markt für Öl und Gas in OLED für Industriedisplays, nach Typ, 2019–2028 (in Mio. USD)
TABELLE 643 Japanischer Markt für Transportmittel im industriellen Displaybereich, nach Technologie, 2019–2028 (in Mio. USD)
TABELLE 644 Japanischer Transportmarkt für LEDs für Industriedisplays, nach Typ, 2019–2028 (in Mio. USD)
TABELLE 645 Japanischer Markt für OLED-Transporte für Industriedisplays, nach Typ, 2019–2028 (in Mio. USD)
TABELLE 646 Japanischer Markt für Metall und Bergbau im Bereich industrielle Displays, nach Technologie, 2019–2028 (in Mio. USD)
TABELLE 647 Japanischer Markt für Metall und Bergbau im LED-Bereich für Industriedisplays, nach Typ, 2019–2028 (in Mio. USD)
TABELLE 648 Japanischer Markt für Metall und Bergbau im OLED-Bereich für Industriedisplays, nach Typ, 2019–2028 (in Mio. USD)
TABELLE 649 Sonstige Anbieter im japanischen Markt für Industriedisplays, nach Technologie, 2019–2028 (in Mio. USD)
TABELLE 650 Sonstige Anbieter im japanischen LED-Markt für Industriedisplays, nach Typ, 2019–2028 (in Mio. USD)
TABELLE 651 Sonstige japanische OLED-Marktteilnehmer für Industriedisplays, nach Typ, 2019–2028 (in Mio. USD)
TABELLE 652 Südkoreanischer Markt für Industriedisplays, nach Typ, 2019–2028 (in Mio. USD)
TABELLE 653 Südkoreanischer Markt für robuste Displays im Industriedisplaybereich, nach Typ, 2019–2028 (in Mio. USD)
TABELLE 654 Südkoreanischer Markt für robuste Displays im Industriedisplaybereich, nach Robustheitsgrad, 2019–2028 (in Mio. USD)
TABELLE 655 Südkoreanischer Markt für Marinedisplays im industriellen Displaybereich, nach Anwendung, 2019–2028 (in Mio. USD)
TABELLE 656 Südkoreanischer Markt für Industriedisplays, nach Technologie, 2019–2028 (in Mio. USD)
TABELLE 657 Südkorea ist führend im Markt für Industriedisplays, nach Typ, 2019–2028 (in Mio. USD)
TABELLE 658 Südkoreanischer OLED-Markt im Industriedisplay, nach Typ, 2019–2028 (in Mio. USD)
TABELLE 659 Südkoreanischer Markt für Industriedisplays, nach Kommunikationstyp, 2019–2028 (in Mio. USD)
TABELLE 660 Südkoreanischer Markt für Industriedisplays, nach Panelgröße, 2019–2028 (in Mio. USD)
TABELLE 661 Südkoreanischer Markt für Industriedisplays, nach Anwendung, 2019–2028 (in Mio. USD)
TABELLE 662 Südkoreanischer Markt für Industriedisplays, nach Branchen, 2019–2028 (in Mio. USD)
TABELLE 663 Südkoreanischer Markt für die Herstellung von Industriedisplays, nach Technologie, 2019–2028 (in Mio. USD)
TABELLE 664 Südkoreanische Produktion im Markt für LEDs für Industriedisplays, nach Typ, 2019–2028 (in Mio. USD)
TABELLE 665 Südkoreanische OLED-Produktion für den Markt für Industriedisplays, nach Typ, 2019–2028 (in Mio. USD)
TABELLE 666 Südkoreanischer Markt für Energie und Leistung im Bereich industrieller Displays, nach Technologie, 2019–2028 (in Mio. USD)
TABELLE 667 Südkoreanischer Markt für Energie und Leistung im LED-Bereich für Industriedisplays, nach Typ, 2019–2028 (in Mio. USD)
TABELLE 668 Südkoreanischer Markt für Energie und Leistung im OLED-Bereich für Industriedisplays, nach Typ, 2019–2028 (in Mio. USD)
TABELLE 669 Südkoreanischer Markt für Militär- und Avionik-Industriedisplays, nach Technologie, 2019–2028 (in Mio. USD)
TABELLE 670 Südkoreanischer Markt für Militär- und Avionik-LEDs für Industriedisplays, nach Typ, 2019–2028 (in Mio. USD)
TABELLE 671 Südkoreanischer Markt für Militär und Avionik in OLED für Industriedisplays, nach Typ, 2019–2028 (in Mio. USD)
TABELLE 672 Südkoreanischer Markt für Öl und Gas in der Industrieanzeige, nach Technologie, 2019–2028 (in Mio. USD)
TABELLE 673 Südkoreanischer Öl- und Gasmarkt im LED-Bereich für Industriedisplays, nach Typ, 2019–2028 (in Mio. USD)
TABELLE 674 Südkoreanischer Markt für Öl und Gas in OLED für Industriedisplays, nach Typ, 2019–2028 (in Mio. USD)
TABELLE 675 Südkoreanischer Markt für Transportmittel im industriellen Displaybereich, nach Technologie, 2019–2028 (in Mio. USD)
TABELLE 676 Südkoreanischer Markt für Transport-LEDs für Industriedisplays, nach Typ, 2019–2028 (in Mio. USD)
TABELLE 677 Südkoreanischer Markt für OLED-Transporte für Industriedisplays, nach Typ, 2019–2028 (in Mio. USD)
TABELLE 678 Südkoreanischer Markt für Metall und Bergbau in der Industrieanzeige, nach Technologie, 2019–2028 (in Mio. USD)
TABELLE 679 Südkoreanischer Markt für Metall und Bergbau im LED-Bereich für Industriedisplays, nach Typ, 2019–2028 (in Mio. USD)
TABELLE 680 Südkoreanischer Markt für Metall und Bergbau im OLED-Bereich für Industriedisplays, nach Typ, 2019–2028 (in Mio. USD)
TABELLE 681 Südkoreanische Anbieter im Markt für Industriedisplays, nach Technologie, 2019–2028 (in Millionen USD)
TABELLE 682 Südkoreanische Sonstige im LED-Markt für Industriedisplays, nach Typ, 2019–2028 (in Mio. USD)
TABELLE 683 Südkoreanische Sonstige im OLED-Markt für Industriedisplays, nach Typ, 2019–2028 (in Mio. USD)
TABELLE 684 Markt für Industriedisplays in Singapur, nach Typ, 2019–2028 (in Mio. USD)
TABELLE 685: Robuste Displays im Markt für Industriedisplays in Singapur, nach Typ, 2019–2028 (in Mio. USD)
TABELLE 686 Robuste Displays im Markt für Industriedisplays in Singapur, nach Robustheitsgrad, 2019–2028 (in Mio. USD)
TABELLE 687 Singapurischer Markt für Marinedisplays im industriellen Displaybereich, nach Anwendung, 2019–2028 (in Mio. USD)
TABELLE 688 Markt für Industriedisplays in Singapur, nach Technologie, 2019–2028 (in Mio. USD)
TABELLE 689 Singapur ist führend im Markt für Industriedisplays, nach Typ, 2019–2028 (in Mio. USD)
TABELLE 690 Singapur-Markt für OLED in Industriedisplays, nach Typ, 2019–2028 (in Mio. USD)
TABELLE 691 Markt für Industriedisplays in Singapur, nach Kommunikationstyp, 2019–2028 (in Mio. USD)
TABELLE 692 Markt für Industriedisplays in Singapur, nach Panelgröße, 2019–2028 (in Mio. USD)
TABELLE 693 Markt für Industriedisplays in Singapur, nach Anwendung, 2019–2028 (in Mio. USD)
TABELLE 694 Markt für Industriedisplays in Singapur, nach Branchen, 2019–2028 (in Mio. USD)
TABELLE 695 Singapurischer Markt für die Herstellung von Industriedisplays, nach Technologie, 2019–2028 (in Mio. USD)
TABELLE 696 Singapurische LED-Produktion für den Markt für Industriedisplays, nach Typ, 2019–2028 (in Mio. USD)
TABELLE 697 Singapur-Markt für OLED-Produktion für Industriedisplays, nach Typ, 2019–2028 (in Mio. USD)
TABELLE 698 Singapurischer Markt für Energie und Leistung im Bereich industrieller Displays, nach Technologie, 2019–2028 (in Mio. USD)
TABELLE 699 Energie und Leistung im singapurischen Markt für LEDs für Industriedisplays, nach Typ, 2019–2028 (in Mio. USD)
TABELLE 700 Energie und Leistung im singapurischen OLED-Markt für Industriedisplays, nach Typ, 2019–2028 (in Mio. USD)
TABELLE 701 Singapurischer Markt für Militär- und Avionik-Industriedisplays, nach Technologie, 2019–2028 (in Millionen USD)
TABELLE 702 Singapurischer Markt für Militär- und Avionik-LEDs für Industriedisplays, nach Typ, 2019–2028 (in Mio. USD)
TABELLE 703 Singapurischer Markt für Militär und Avionik in OLED für Industriedisplays, nach Typ, 2019–2028 (in Mio. USD)
TABELLE 704 Singapurischer Markt für Öl und Gas in der industriellen Anzeige, nach Technologie, 2019–2028 (in Mio. USD)
TABELLE 705 Singapurischer Markt für Öl und Gas im LED-Bereich für Industriedisplays, nach Typ, 2019–2028 (in Mio. USD)
TABELLE 706 Singapurischer Markt für Öl und Gas in OLED für Industriedisplays, nach Typ, 2019–2028 (in Mio. USD)
TABELLE 707 Singapurischer Markt für Transportlösungen im Bereich industrieller Displays, nach Technologie, 2019–2028 (in Mio. USD)
TABELLE 708 Singapurischer Markt für Transport-LEDs für Industriedisplays, nach Typ, 2019–2028 (in Mio. USD)
TABELLE 709 Singapur-Transportmarkt für OLEDs für Industriedisplays, nach Typ, 2019–2028 (in Mio. USD)
TABELLE 710 Singapurischer Markt für Metall und Bergbau in der Industrieanzeige, nach Technologie, 2019–2028 (in Mio. USD)
TABELLE 711 Singapurischer Markt für Metall und Bergbau im LED-Bereich für Industriedisplays, nach Typ, 2019–2028 (in Mio. USD)
TABELLE 712 Singapurischer Markt für Metall und Bergbau im OLED-Bereich für Industriedisplays, nach Typ, 2019–2028 (in Mio. USD)
TABELLE 713 Sonstige Anbieter im Markt für Industriedisplays in Singapur, nach Technologie, 2019–2028 (in Mio. USD)
TABELLE 714 Sonstige Anbieter in Singapur im Markt für LEDs für Industriedisplays, nach Typ, 2019–2028 (in Mio. USD)
TABELLE 715 Sonstige Akteure in Singapur im OLED-Markt für Industriedisplays, nach Typ, 2019–2028 (in Mio. USD)
TABELLE 716 Indischer Markt für Industriedisplays, nach Typ, 2019–2028 (in Mio. USD)
TABELLE 717 Robuste Displays im indischen Markt für Industriedisplays, nach Typ, 2019–2028 (in Mio. USD)
TABELLE 718 Robuste Displays im indischen Markt für Industriedisplays, nach Robustheitsgrad, 2019–2028 (in Mio. USD)
TABELLE 719 Indischer Markt für Marinedisplays im industriellen Displaybereich, nach Anwendung, 2019–2028 (in Mio. USD)
TABELLE 720 Indischer Markt für Industriedisplays, nach Technologie, 2019–2028 (in Mio. USD)
TABELLE 721 Indien ist führend im Markt für Industriedisplays, nach Typ, 2019–2028 (in Millionen USD)
TABELLE 722. Indischer OLED-Markt für Industriedisplays, nach Typ, 2019–2028 (in Mio. USD)
TABELLE 723 Indischer Markt für Industriedisplays, nach Kommunikationstyp, 2019–2028 (in Mio. USD)
TABELLE 724 Indischer Markt für Industriedisplays, nach Panelgröße, 2019–2028 (in Mio. USD)
TABELLE 725 Indischer Markt für Industriedisplays, nach Anwendung, 2019–2028 (in Mio. USD)
TABELLE 726 Indischer Markt für Industriedisplays, nach Branchen, 2019–2028 (in Mio. USD)
TABELLE 727 Indischer Markt für die Herstellung von Industriedisplays, nach Technologie, 2019–2028 (in Mio. USD)
TABELLE 728 Indischer Markt für LED-Produktion für Industriedisplays, nach Typ, 2019–2028 (in Mio. USD)
TABELLE 729 Indischer OLED-Markt für Industriedisplays, nach Typ, 2019–2028 (in Mio. USD)
TABELLE 730 Indischer Markt für Energie und Leistung im industriellen Displaybereich, nach Technologie, 2019–2028 (in Mio. USD)
TABELLE 731 Energie und Leistung im indischen Markt für LEDs für Industriedisplays, nach Typ, 2019–2028 (in Mio. USD)
TABELLE 732 Energie und Leistung im indischen OLED-Markt für Industriedisplays, nach Typ, 2019–2028 (in Mio. USD)
TABELLE 733 Indischer Markt für Militär- und Avionik-Industriedisplays, nach Technologie, 2019–2028 (in Mio. USD)
TABELLE 734 Indischer Markt für Militär- und Avionik-LEDs für Industriedisplays, nach Typ, 2019–2028 (in Mio. USD)
TABELLE 735 – Indischer Markt für Militär und Avionik in OLED für Industriedisplays, nach Typ, 2019–2028 (in Mio. USD)
TABELLE 736 Indischer Markt für Öl und Gas in der industriellen Anzeige, nach Technologie, 2019–2028 (in Mio. USD)
TABELLE 737 Indischer Markt für Öl und Gas im LED-Bereich für Industriedisplays, nach Typ, 2019–2028 (in Mio. USD)
TABELLE 738 Indischer Markt für Öl und Gas in OLED für Industriedisplays, nach Typ, 2019–2028 (in Mio. USD)
TABELLE 739 Indischer Markt für Transport im industriellen Displaybereich, nach Technologie, 2019–2028 (in Mio. USD)
TABELLE 740 Indischer Markt für Transport-LEDs für Industriedisplays, nach Typ, 2019–2028 (in Mio. USD)
TABELLE 741 – Transportmarkt für OLEDs für Industriedisplays in Indien, nach Typ, 2019–2028 (in Mio. USD)
TABELLE 742 Indischer Markt für Metall und Bergbau im Bereich industrielle Displays, nach Technologie, 2019–2028 (in Mio. USD)
TABELLE 743: Metall und Bergbau in Indien auf dem LED-Markt für Industriedisplays, nach Typ, 2019–2028 (in Mio. USD)
TABELLE 744: Metall- und Bergbaumarkt in Indien im OLED-Markt für Industriedisplays, nach Typ, 2019–2028 (in Mio. USD)
TABELLE 745 Sonstige Anbieter im indischen Markt für Industriedisplays, nach Technologie, 2019–2028 (in Millionen USD)
TABELLE 746 Sonstige LED-Anzeigen in Indien auf dem Markt für Industriedisplays, nach Typ, 2019–2028 (in Mio. USD)
TABELLE 747 Sonstige Anbieter im indischen OLED-Markt für Industriedisplays, nach Typ, 2019–2028 (in Mio. USD)
TABELLE 748 Malaysischer Markt für Industriedisplays, nach Typ, 2019–2028 (in Mio. USD)
TABELLE 749 Malaysia: Robuste Displays im Markt für Industriedisplays, nach Typ, 2019–2028 (in Mio. USD)
TABELLE 750 Robuste Displays im malaysischen Markt für Industriedisplays, nach Robustheitsgrad, 2019–2028 (in Mio. USD)
TABELLE 751 Malaysischer Markt für Marinedisplays im industriellen Displaybereich, nach Anwendung, 2019–2028 (in Mio. USD)
TABELLE 752 Malaysischer Markt für Industriedisplays, nach Technologie, 2019–2028 (in Mio. USD)
TABELLE 753 Malaysia ist führend im Markt für Industriedisplays, nach Typ, 2019–2028 (in Millionen USD)
TABELLE 754 Malaysia OLED im Industriedisplay-Markt, nach Typ, 2019–2028 (in Mio. USD)
TABELLE 755 Malaysischer Markt für Industriedisplays, nach Kommunikationstyp, 2019–2028 (in Mio. USD)
TABELLE 756 Malaysischer Markt für Industriedisplays, nach Panelgröße, 2019–2028 (in Mio. USD)
TABELLE 757 Malaysischer Markt für Industriedisplays, nach Anwendung, 2019–2028 (in Mio. USD)
TABELLE 758 Malaysischer Markt für Industriedisplays, nach Branchen, 2019–2028 (in Mio. USD)
TABELLE 759 Malaysischer Markt für die Herstellung von Industriedisplays, nach Technologie, 2019–2028 (in Mio. USD)
TABELLE 760 Malaysia: Herstellung von LEDs für Industriedisplays, nach Typ, 2019–2028 (in Mio. USD)
TABELLE 761 Malaysia: OLED-Produktion für den Markt für Industriedisplays, nach Typ, 2019–2028 (in Mio. USD)
TABELLE 762 Malaysias Markt für Energie und Leistung im Bereich industrieller Displays, nach Technologie, 2019–2028 (in Mio. USD)
TABELLE 763 Malaysia: Energie und Leistung im LED-Markt für Industriedisplays, nach Typ, 2019–2028 (in Mio. USD)
TABELLE 764: Energie und Leistung im malaysischen OLED-Markt für Industriedisplays, nach Typ, 2019–2028 (in Mio. USD)
TABELLE 765 – Malaysischer Markt für Militär- und Avionik-Industriedisplays, nach Technologie, 2019–2028 (in Mio. USD)
TABELLE 766 Malaysias Markt für Militär- und Avionik-LEDs für Industriedisplays, nach Typ, 2019–2028 (in Mio. USD)
TABELLE 767 – Malaysischer Markt für Militär und Avionik in OLED für Industriedisplays, nach Typ, 2019–2028 (in Mio. USD)
TABELLE 768 Malaysischer Markt für Öl und Gas in der Industrieanzeige, nach Technologie, 2019–2028 (in Mio. USD)
TABELLE 769 Malaysia Öl und Gas im LED-Markt für Industriedisplays, nach Typ, 2019–2028 (in Mio. USD)
TABELLE 770 Malaysischer Markt für Öl und Gas in OLED für Industriedisplays, nach Typ, 2019–2028 (in Mio. USD)
TABELLE 771 Malaysischer Markt für Transportmittel im industriellen Displaybereich, nach Technologie, 2019–2028 (in Mio. USD)
TABELLE 772 Malaysia Transport in LED für Industriedisplays, nach Typ, 2019–2028 (in Mio. USD)
TABELLE 773 Malaysia – Transportmarkt für OLEDs für Industriedisplays, nach Typ, 2019–2028 (in Mio. USD)
TABELLE 774 Malaysia: Markt für Metall und Bergbau in der Industrieanzeige, nach Technologie, 2019–2028 (in Mio. USD)
TABELLE 775 Malaysia: Metall und Bergbau im LED-Markt für Industriedisplays, nach Typ, 2019–2028 (in Mio. USD)
TABELLE 776 Malaysia – Metall und Bergbau im OLED-Markt für Industriedisplays, nach Typ, 2019–2028 (in Mio. USD)
TABELLE 777 Malaysia – Sonstige Anbieter im Markt für Industriedisplays, nach Technologie, 2019–2028 (in Mio. USD)
TABELLE 778 Malaysia, Sonstige im LED-Markt für Industriedisplays, nach Typ, 2019–2028 (in Mio. USD)
TABELLE 779 Malaysia, Sonstige im OLED-Markt für Industriedisplays, nach Typ, 2019–2028 (in Mio. USD)
TABELLE 780 Markt für Industriedisplays in Thailand, nach Typ, 2019–2028 (in Mio. USD)
TABELLE 781 Thailand: Markt für robuste Displays im Industriebereich, nach Typ, 2019–2028 (in Mio. USD)
TABELLE 782 Robuste Displays im thailändischen Markt für Industriedisplays, nach Robustheitsgrad, 2019–2028 (in Mio. USD)
TABELLE 783 Thailand: Markt für Marinedisplays im industriellen Displaybereich, nach Anwendung, 2019–2028 (in Mio. USD)
TABELLE 784 Markt für Industriedisplays in Thailand, nach Technologie, 2019–2028 (in Mio. USD)
TABELLE 785 Thailand ist führend im Markt für Industriedisplays, nach Typ, 2019–2028 (in Millionen USD)
TABELLE 786 Thailand – OLED-Markt für Industriedisplays, nach Typ, 2019–2028 (in Mio. USD)
TABELLE 787 Markt für Industriedisplays in Thailand, nach Kommunikationstyp, 2019–2028 (in Mio. USD)
TABELLE 788 Thailändischer Markt für Industriedisplays, nach Panelgröße, 2019–2028 (in Mio. USD)
TABELLE 789 Markt für Industriedisplays in Thailand, nach Anwendung, 2019–2028 (in Mio. USD)
TABELLE 790 Markt für Industriedisplays in Thailand, nach Branchen, 2019–2028 (in Mio. USD)
TABELLE 791 Thailand: Markt für die Herstellung von Industriedisplays, nach Technologie, 2019–2028 (in Mio. USD)
TABELLE 792 Thailand: Produktion im LED-Markt für Industriedisplays, nach Typ, 2019–2028 (in Mio. USD)
TABELLE 793 Thailand: OLED-Produktion für den Markt für Industriedisplays, nach Typ, 2019–2028 (in Mio. USD)
TABELLE 794 Thailands Markt für Energie und Leistung im Bereich industrieller Displays, nach Technologie, 2019–2028 (in Mio. USD)
TABELLE 795 Energie und Leistung im thailändischen LED-Markt für Industriedisplays, nach Typ, 2019–2028 (in Mio. USD)
TABELLE 796 Energie und Leistung im thailändischen OLED-Markt für Industriedisplays, nach Typ, 2019–2028 (in Mio. USD)
TABELLE 797 – Markt für Militär- und Avionik-Industriedisplays in Thailand, nach Technologie, 2019–2028 (in Mio. USD)
TABELLE 798 Thailands Markt für Militär- und Avionik-LEDs für Industriedisplays, nach Typ, 2019–2028 (in Mio. USD)
TABELLE 799 Thailands Markt für Militär- und Avionik-OLED für Industriedisplays, nach Typ, 2019–2028 (in Mio. USD)
TABELLE 800: Thailands Markt für Öl und Gas in der industriellen Anzeige, nach Technologie, 2019–2028 (in Millionen USD)
TABELLE 801 Thailands Markt für Öl und Gas im LED-Bereich für Industriedisplays, nach Typ, 2019–2028 (in Mio. USD)
TABELLE 802 Thailands Markt für Öl und Gas in OLED für Industriedisplays, nach Typ, 2019–2028 (in Mio. USD)
TABELLE 803 Thailands Markt für Transportlösungen im industriellen Displaybereich, nach Technologie, 2019–2028 (in Mio. USD)
TABELLE 804 Thailand: Transportmarkt für LEDs für Industriedisplays, nach Typ, 2019–2028 (in Mio. USD)
TABELLE 805 Thailand – Transportmarkt für OLEDs für Industriedisplays, nach Typ, 2019–2028 (in Mio. USD)
TABELLE 806 Thailand: Markt für Metall und Bergbau in der Industrieanzeige, nach Technologie, 2019–2028 (in Mio. USD)
TABELLE 807 Thailand: Metall- und Bergbaumarkt im LED-Bereich für Industriedisplays, nach Typ, 2019–2028 (in Mio. USD)
TABELLE 808 Thailand – Metall- und Bergbaumarkt im OLED-Bereich für Industriedisplays, nach Typ, 2019–2028 (in Mio. USD)
TABELLE 809 Thailand – Sonstige Anbieter im Markt für Industriedisplays, nach Technologie, 2019–2028 (in Mio. USD)
TABELLE 810 Thailand, andere Anbieter im LED-Markt für Industriedisplays, nach Typ, 2019–2028 (in Mio. USD)
TABELLE 811 Thailand, Sonstige im OLED-Markt für Industriedisplays, nach Typ, 2019–2028 (in Mio. USD)
TABELLE 812 Indonesischer Markt für Industriedisplays, nach Typ, 2019–2028 (in Mio. USD)
TABELLE 813 Indonesischer Markt für robuste Displays im Industriedisplaybereich, nach Typ, 2019–2028 (in Mio. USD)
TABELLE 814 Indonesischer Markt für robuste Displays im Industriedisplaybereich, nach Robustheitsgrad, 2019–2028 (in Mio. USD)
TABELLE 815 Indonesischer Markt für Marinedisplays im industriellen Displaybereich, nach Anwendung, 2019–2028 (in Mio. USD)
TABELLE 816 Indonesischer Markt für Industriedisplays, nach Technologie, 2019–2028 (in Mio. USD)
TABELLE 817: Indonesien ist führend im Markt für Industriedisplays, nach Typ, 2019–2028 (in Millionen USD)
TABELLE 818 Indonesischer OLED-Markt im Industriedisplay, nach Typ, 2019–2028 (in Mio. USD)
TABELLE 819 Indonesischer Markt für Industriedisplays, nach Kommunikationstyp, 2019–2028 (in Mio. USD)
TABELLE 820 Indonesischer Markt für Industriedisplays, nach Panelgröße, 2019–2028 (in Mio. USD)
TABELLE 821 Indonesischer Markt für Industriedisplays, nach Anwendung, 2019–2028 (in Mio. USD)
TABELLE 822 Indonesischer Markt für Industriedisplays, nach Branchen, 2019–2028 (in Mio. USD)
TABELLE 823 Indonesischer Markt für die Herstellung von Industriedisplays, nach Technologie, 2019–2028 (in Mio. USD)
TABELLE 824 Indonesische Produktion im LED-Markt für Industriedisplays, nach Typ, 2019–2028 (in Mio. USD)
TABELLE 825 Indonesische OLED-Produktion für den Markt für Industriedisplays, nach Typ, 2019–2028 (in Mio. USD)
TABELLE 826 Indonesischer Markt für Energie und Leistung im Bereich industrieller Displays, nach Technologie, 2019–2028 (in Mio. USD)
TABELLE 827 Indonesischer Markt für Energie und Leistung im LED-Bereich für Industriedisplays, nach Typ, 2019–2028 (in Mio. USD)
TABELLE 828 Indonesischer Markt für Energie und Leistung im OLED-Bereich für Industriedisplays, nach Typ, 2019–2028 (in Mio. USD)
TABELLE 829 Indonesischer Markt für Militär- und Avionik-Industriedisplays, nach Technologie, 2019–2028 (in Mio. USD)
TABELLE 830 Indonesischer Markt für Militär- und Avionik-LEDs für Industriedisplays, nach Typ, 2019–2028 (in Mio. USD)
TABELLE 831 Indonesischer Markt für Militär- und Avionik-OLED für Industriedisplays, nach Typ, 2019–2028 (in Mio. USD)
TABELLE 832 Indonesischer Markt für Öl und Gas in der industriellen Anzeige, nach Technologie, 2019–2028 (in Mio. USD)
TABELLE 833 Indonesischer Markt für Öl und Gas im LED-Bereich für Industriedisplays, nach Typ, 2019–2028 (in Mio. USD)
TABELLE 834 Indonesischer Markt für Öl und Gas in OLED für Industriedisplays, nach Typ, 2019–2028 (in Mio. USD)
TABELLE 835 Indonesischer Markt für Transportmittel im industriellen Displaybereich, nach Technologie, 2019–2028 (in Mio. USD)
TABELLE 836 Indonesischer Markt für Transport-LEDs für Industriedisplays, nach Typ, 2019–2028 (in Mio. USD)
TABELLE 837 Indonesischer Markt für OLED-Transporte für Industriedisplays, nach Typ, 2019–2028 (in Mio. USD)
TABELLE 838 Indonesischer Markt für Metall und Bergbau im Bereich industrielle Displays, nach Technologie, 2019–2028 (in Mio. USD)
TABELLE 839 Indonesischer Markt für Metall und Bergbau im LED-Bereich für Industriedisplays, nach Typ, 2019–2028 (in Mio. USD)
TABELLE 840 Indonesischer Markt für Metall und Bergbau im OLED-Bereich für Industriedisplays, nach Typ, 2019–2028 (in Mio. USD)
TABELLE 841 Sonstige indonesische Anbieter im Markt für Industriedisplays, nach Technologie, 2019–2028 (in Millionen USD)
TABELLE 842 Sonstige in Indonesien auf dem Markt für LEDs für Industriedisplays, nach Typ, 2019–2028 (in Millionen USD)
TABELLE 843 Sonstige in Indonesien im OLED-Markt für Industriedisplays, nach Typ, 2019–2028 (in Millionen USD)
TABELLE 844 Australischer Markt für Industriedisplays, nach Typ, 2019–2028 (in Mio. USD)
TABELLE 845 Australischer Markt für robuste Displays im Industriedisplaybereich, nach Typ, 2019–2028 (in Mio. USD)
TABELLE 846 Australischer Markt für robuste Displays im Industriedisplaybereich, nach Robustheitsgrad, 2019–2028 (in Mio. USD)
TABELLE 847 Australischer Markt für Marinedisplays im industriellen Displaybereich, nach Anwendung, 2019–2028 (in Mio. USD)
TABELLE 848 Australischer Markt für Industriedisplays, nach Technologie, 2019–2028 (in Mio. USD)
TABELLE 849 Australien ist führend im Markt für Industriedisplays, nach Typ, 2019–2028 (in Mio. USD)
TABELLE 850 – Australischer OLED-Markt für Industriedisplays, nach Typ, 2019–2028 (in Mio. USD)
TABELLE 851 Australischer Markt für Industriedisplays, nach Kommunikationstyp, 2019–2028 (in Mio. USD)
TABELLE 852 Australischer Markt für Industriedisplays, nach Panelgröße, 2019–2028 (in Mio. USD)
TABELLE 853 Australischer Markt für Industriedisplays, nach Anwendung, 2019–2028 (in Mio. USD)
TABELLE 854 Australischer Markt für Industriedisplays, nach Branchen, 2019–2028 (in Mio. USD)
TABELLE 855 Australischer Markt für die Herstellung von Industriedisplays, nach Technologie, 2019–2028 (in Mio. USD)
TABELLE 856 Australischer Markt für LED-Produktion für Industriedisplays, nach Typ, 2019–2028 (in Mio. USD)
TABELLE 857 Australischer OLED-Markt für Industriedisplays, nach Typ, 2019–2028 (in Mio. USD)
TABELLE 858 Australischer Markt für Energie und Leistung im industriellen Displaybereich, nach Technologie, 2019–2028 (in Mio. USD)
TABELLE 859 Energie und Leistung im australischen Markt für LEDs für Industriedisplays, nach Typ, 2019–2028 (in Mio. USD)
TABELLE 860: Australischer Markt für Energie und Leistung im OLED-Bereich für Industriedisplays, nach Typ, 2019–2028 (in Mio. USD)
TABELLE 861 Australischer Markt für Militär- und Avionik-Industriedisplays, nach Technologie, 2019–2028 (in Mio. USD)
TABELLE 862 Australischer Markt für Militär- und Avionik-LEDs für Industriedisplays, nach Typ, 2019–2028 (in Mio. USD)
TABELLE 863 Australischer Markt für Militär- und Avionik-OLED für Industriedisplays, nach Typ, 2019–2028 (in Mio. USD)
TABELLE 864 Australischer Markt für Öl und Gas in der Industrieanzeige, nach Technologie, 2019–2028 (in Mio. USD)
TABELLE 865 Australischer Markt für Öl und Gas im LED-Bereich für Industriedisplays, nach Typ, 2019–2028 (in Mio. USD)
TABELLE 866 Australischer Markt für Öl und Gas in OLED für Industriedisplays, nach Typ, 2019–2028 (in Mio. USD)
TABELLE 867 Australischer Markt für Transportmittel im industriellen Displaybereich, nach Technologie, 2019–2028 (in Mio. USD)
TABELLE 868 Australischer Markt für Transport-LEDs für Industriedisplays, nach Typ, 2019–2028 (in Mio. USD)
TABELLE 869 – Australischer Markt für OLED-Transporte für Industriedisplays, nach Typ, 2019–2028 (in Mio. USD)
TABELLE 870 Australischer Markt für Metall und Bergbau in der Industrieanzeige, nach Technologie, 2019–2028 (in Mio. USD)
TABELLE 871 Australischer Markt für Metall und Bergbau im LED-Bereich für Industriedisplays, nach Typ, 2019–2028 (in Mio. USD)
TABELLE 872 Australischer Markt für Metall und Bergbau im OLED-Bereich für Industriedisplays, nach Typ, 2019–2028 (in Mio. USD)
TABELLE 873 Australien – Sonstige Anbieter im Markt für Industriedisplays, nach Technologie, 2019–2028 (in Mio. USD)
TABELLE 874 Australien, Sonstige im LED-Markt für Industriedisplays, nach Typ, 2019–2028 (in Mio. USD)
TABELLE 875 Australien, Sonstige im OLED-Markt für Industriedisplays, nach Typ, 2019–2028 (in Mio. USD)
TABELLE 876 Markt für Industriedisplays auf den Philippinen, nach Typ, 2019–2028 (in Mio. USD)
TABELLE 877: Robuste Displays im philippinischen Markt für Industriedisplays, nach Typ, 2019–2028 (in Mio. USD)
TABELLE 878 Robuste Displays auf den Philippinen im Markt für Industriedisplays, nach Robustheitsgrad, 2019–2028 (in Mio. USD)
TABELLE 879 Philippinischer Markt für Marinedisplays im industriellen Displaybereich, nach Anwendung, 2019–2028 (in Mio. USD)
TABELLE 880 Markt für Industriedisplays auf den Philippinen, nach Technologie, 2019–2028 (in Mio. USD)
TABELLE 881: Die Philippinen sind führend im Markt für Industriedisplays, nach Typ, 2019–2028 (in Millionen USD)
TABELLE 882. Markt für OLED-Industriedisplays auf den Philippinen, nach Typ, 2019–2028 (in Mio. USD)
TABELLE 883 Markt für Industriedisplays auf den Philippinen, nach Kommunikationstyp, 2019–2028 (in Mio. USD)
TABELLE 884 Philippinischer Markt für Industriedisplays, nach Panelgröße, 2019–2028 (in Mio. USD)
TABELLE 885 Markt für Industriedisplays auf den Philippinen, nach Anwendung, 2019–2028 (in Mio. USD)
TABELLE 886 Markt für Industriedisplays auf den Philippinen, nach Branchen, 2019–2028 (in Mio. USD)
TABELLE 887 Philippinischer Markt für die Herstellung von Industriedisplays, nach Technologie, 2019–2028 (in Mio. USD)
TABELLE 888 Philippinische LED-Produktion für den Markt für Industriedisplays, nach Typ, 2019–2028 (in Mio. USD)
TABELLE 889 Philippinische OLED-Produktion für den Markt für Industriedisplays, nach Typ, 2019–2028 (in Mio. USD)
TABELLE 890 Energie und Leistung im philippinischen Markt für Industriedisplays, nach Technologie, 2019–2028 (in Mio. USD)
TABELLE 891 Energie und Leistung im philippinischen LED-Markt für Industriedisplays, nach Typ, 2019–2028 (in Mio. USD)
TABELLE 892 Energie und Leistung im philippinischen OLED-Markt für Industriedisplays, nach Typ, 2019–2028 (in Mio. USD)
TABELLE 893 Philippinischer Markt für Militär- und Avionik-Industriedisplays, nach Technologie, 2019–2028 (in Mio. USD)
TABELLE 894 – Markt für Militär- und Avionik-LEDs für Industriedisplays auf den Philippinen, nach Typ, 2019–2028 (in Mio. USD)
TABELLE 895 – Philippinischer Markt für Militär- und Avionik-Systeme in OLED für Industriedisplays, nach Typ, 2019–2028 (in Mio. USD)
TABELLE 896 Philippinischer Markt für Öl und Gas in der Industrieanzeige, nach Technologie, 2019–2028 (in Mio. USD)
TABELLE 897 Philippinen: Öl und Gas im LED-Markt für Industriedisplays, nach Typ, 2019–2028 (in Mio. USD)
TABELLE 898 Philippinischer Markt für Öl und Gas in OLED für Industriedisplays, nach Typ, 2019–2028 (in Mio. USD)
TABELLE 899 Philippinischer Markt für Transportmittel im industriellen Displaybereich, nach Technologie, 2019–2028 (in Mio. USD)
TABELLE 900 Philippinen: Transport in LED für Industriedisplays, Markt nach Typ, 2019–2028 (in Mio. USD)
TABELLE 901 Philippinen – Transportmarkt für OLEDs für Industriedisplays, nach Typ, 2019–2028 (in Mio. USD)
TABELLE 902 Philippinischer Markt für Metall und Bergbau im Bereich industrieller Displays, nach Technologie, 2019–2028 (in Mio. USD)
TABELLE 903 Philippinen: Metall und Bergbau im LED-Markt für Industriedisplays, nach Typ, 2019–2028 (in Mio. USD)
TABELLE 904: Philippinen – Metall und Bergbau im OLED-Markt für Industriedisplays, nach Typ, 2019–2028 (in Mio. USD)
TABELLE 905 Sonstige Anbieter auf den Philippinen im Markt für Industriedisplays, nach Technologie, 2019–2028 (in Mio. USD)
TABELLE 906 Philippinen, Sonstige im LED-Markt für Industriedisplays, nach Typ, 2019–2028 (in Mio. USD)
TABELLE 907 Sonstige Anbieter auf den Philippinen im OLED-Markt für Industriedisplays, nach Typ, 2019–2028 (in Mio. USD)
TABELLE 908 RESTLICHER ASIEN-PAZIFIK-RAUM IM Markt für Industriedisplays, nach Typ, 2019–2028 (in Mio. USD)
TABELLE 909 Markt für Industriedisplays im Nahen Osten und in Afrika, nach Ländern, 2019–2028 (in Mio. USD)
TABELLE 910 Markt für Industriedisplays im Nahen Osten und Afrika, nach Typ, 2019–2028 (in Mio. USD)
TABELLE 911 Markt für robuste Displays im Industriebereich im Nahen Osten und Afrika, nach Typ, 2019–2028 (in Mio. USD)
TABELLE 912 Robuste Displays im Markt für Industriedisplays im Nahen Osten und Afrika, nach Robustheitsgrad, 2019–2028 (in Mio. USD)
TABELLE 913 Markt für Marinedisplays im Nahen Osten und Afrika im Bereich Industriedisplays, nach Anwendung, 2019–2028 (in Mio. USD)
TABELLE 914 Markt für Industriedisplays im Nahen Osten und Afrika, nach Technologie, 2019–2028 (in Mio. USD)
TABELLE 915 Naher Osten und Afrika führend im Markt für Industriedisplays, nach Typ, 2019–2028 (in Mio. USD)
TABELLE 916 Markt für OLED-Industriedisplays im Nahen Osten und in Afrika, nach Typ, 2019–2028 (in Mio. USD)
TABELLE 917 Markt für Industriedisplays im Nahen Osten und Afrika, nach Kommunikationstyp, 2019–2028 (in Mio. USD)
TABELLE 918 Markt für Industriedisplays im Nahen Osten und Afrika, nach Panelgröße, 2019–2028 (in Mio. USD)
TABELLE 919 Markt für Industriedisplays im Nahen Osten und Afrika, nach Anwendung, 2019–2028 (in Mio. USD)
TABELLE 920 Markt für Industriedisplays im Nahen Osten und Afrika, nach Branchen, 2019–2028 (in Mio. USD)
TABELLE 921 Markt für die Herstellung von Industriedisplays im Nahen Osten und Afrika, nach Technologie, 2019–2028 (in Mio. USD)
TABELLE 922 Naher Osten und Afrika – Produktion im Markt für LEDs für Industriedisplays, nach Typ, 2019–2028 (in Mio. USD)
TABELLE 923 – Fertigung im Nahen Osten und Afrika im OLED-Markt für Industriedisplays, nach Typ, 2019–2028 (in Mio. USD)
TABELLE 924 Energie- und Leistungsmarkt im Nahen Osten und Afrika im Bereich industrieller Displays, nach Technologie, 2019–2028 (in Mio. USD)
TABELLE 925 Energie und Leistung im Nahen Osten und Afrika im LED-Markt für Industriedisplays, nach Typ, 2019–2028 (in Mio. USD)
TABELLE 926 Energie und Leistung im Nahen Osten und Afrika im OLED-Markt für Industriedisplays, nach Typ, 2019–2028 (in Mio. USD)
TABLE 927 Middle East and Africa military & avionics in industrial display Market, By technology, 2019-2028 (USD Million)
TABLE 928 Middle East and Africa military & avionics in led for industrial display Market, By type, 2019-2028 (USD Million)
TABLE 929 Middle East and Africa military & avionics in oled for industrial display Market, By type, 2019-2028 (USD Million)
TABLE 930 Middle East and Africa oil & gas in industrial display Market, By technology, 2019-2028 (USD Million)
TABLE 931 Middle East and Africa oil & gas in led for industrial display Market, By type, 2019-2028 (USD Million)
TABLE 932 Middle East and Africa oil & gas in oled for industrial display Market, By type, 2019-2028 (USD Million)
TABLE 933 Middle East and Africa transportation in industrial display Market, By technology, 2019-2028 (USD Million)
TABLE 934 Middle East and Africa transportation in led for industrial display Market, By type, 2019-2028 (USD Million)
TABLE 935 Middle East and Africa transportation in oled for industrial display Market, By type, 2019-2028 (USD Million)
TABLE 936 Middle East and Africa metal & mining in industrial display Market, By technology, 2019-2028 (USD Million)
TABLE 937 Middle East and Africa metal & mining in led for industrial display Market, By type, 2019-2028 (USD Million)
TABLE 938 Middle East and Africa metal & mining in oled for industrial display Market, By type, 2019-2028 (USD Million)
TABLE 939 Middle East and Africa others in industrial display Market, By technology, 2019-2028 (USD Million)
TABLE 940 Middle East and Africa others in led for industrial display Market, By type, 2019-2028 (USD Million)
TABLE 941 Middle East and Africa others in oled for industrial display Market, By type, 2019-2028 (USD Million)
TABLE 942 U.A.E industrial display Market, By type, 2019-2028 (USD Million)
TABLE 943 U.A.E rugged display in industrial display Market, By type, 2019-2028 (USD Million)
TABLE 944 U.A.E rugged display in industrial display Market, By level of ruggedness, 2019-2028 (USD Million)
TABLE 945 U.A.E marine display in industrial display Market, By application, 2019-2028 (USD Million)
TABLE 946 U.A.E industrial display Market, By technology, 2019-2028 (USD Million)
TABLE 947 U.A.E led in industrial display Market, By type, 2019-2028 (USD Million)
TABLE 948 U.A.E oled in industrial display Market, By type, 2019-2028 (USD Million)
TABLE 949 U.A.E industrial display Market, By communication type, 2019-2028 (USD Million)
TABLE 950 U.A.E industrial display Market, By panel size, 2019-2028 (USD Million)
TABLE 951 U.A.E industrial display Market, By application, 2019-2028 (USD Million)
TABLE 952 U.A.E industrial display Market, By Vertical, 2019-2028 (USD Million)
TABLE 953 U.A.E manufacturing in industrial display Market, By technology, 2019-2028 (USD Million)
TABLE 954 U.A.E manufacturing in led for industrial display Market, By type, 2019-2028 (USD Million)
TABLE 955 U.A.E manufacturing in oled for industrial display Market, By type, 2019-2028 (USD Million)
TABLE 956 U.A.E energy & power in industrial display Market, By technology, 2019-2028 (USD Million)
TABLE 957 U.A.E energy & power in led for industrial display Market, By type, 2019-2028 (USD Million)
TABLE 958 U.A.E energy & power in oled for industrial display Market, By type, 2019-2028 (USD Million)
TABLE 959 U.A.E military & avionics in industrial display Market, By technology, 2019-2028 (USD Million)
TABLE 960 U.A.E military & avionics in led for industrial display Market, By type, 2019-2028 (USD Million)
TABLE 961 U.A.E military & avionics in oled for industrial display Market, By type, 2019-2028 (USD Million)
TABLE 962 U.A.E oil & gas in industrial display Market, By technology, 2019-2028 (USD Million)
TABLE 963 U.A.E oil & gas in led for industrial display Market, By type, 2019-2028 (USD Million)
TABLE 964 U.A.E oil & gas in oled for industrial display Market, By type, 2019-2028 (USD Million)
TABLE 965 U.A.E transportation in industrial display Market, By technology, 2019-2028 (USD Million)
TABLE 966 U.A.E transportation in led for industrial display Market, By type, 2019-2028 (USD Million)
TABLE 967 U.A.E transportation in oled for industrial display Market, By type, 2019-2028 (USD Million)
TABLE 968 U.A.E metal & mining in industrial display Market, By technology, 2019-2028 (USD Million)
TABLE 969 U.A.E metal & mining in led for industrial display Market, By type, 2019-2028 (USD Million)
TABLE 970 U.A.E metal & mining in oled for industrial display Market, By type, 2019-2028 (USD Million)
TABLE 971 U.A.E others in industrial display Market, By technology, 2019-2028 (USD Million)
TABLE 972 U.A.E others in led for industrial display Market, By type, 2019-2028 (USD Million)
TABLE 973 U.A.E others in oled for industrial display Market, By type, 2019-2028 (USD Million)
TABLE 974 SAUDI ARABIA industrial display Market, By type, 2019-2028 (USD Million)
TABLE 975 SAUDI ARABIA rugged display in industrial display Market, By type, 2019-2028 (USD Million)
TABLE 976 SAUDI ARABIA rugged display in industrial display Market, By level of ruggedness, 2019-2028 (USD Million)
TABLE 977 SAUDI ARABIA marine display in industrial display Market, By application, 2019-2028 (USD Million)
TABLE 978 SAUDI ARABIA industrial display Market, By technology, 2019-2028 (USD Million)
TABLE 979 SAUDI ARABIA led in industrial display Market, By type, 2019-2028 (USD Million)
TABLE 980 SAUDI ARABIA oled in industrial display Market, By type, 2019-2028 (USD Million)
TABLE 981 SAUDI ARABIA industrial display Market, By communication type, 2019-2028 (USD Million)
TABLE 982 SAUDI ARABIA industrial display Market, By panel size, 2019-2028 (USD Million)
TABLE 983 SAUDI ARABIA industrial display Market, By application, 2019-2028 (USD Million)
TABLE 984 SAUDI ARABIA industrial display Market, By Vertical, 2019-2028 (USD Million)
TABLE 985 SAUDI ARABIA manufacturing in industrial display Market, By technology, 2019-2028 (USD Million)
TABLE 986 SAUDI ARABIA manufacturing in led for industrial display Market, By type, 2019-2028 (USD Million)
TABLE 987 SAUDI ARABIA manufacturing in oled for industrial display Market, By type, 2019-2028 (USD Million)
TABLE 988 SAUDI ARABIA energy & power in industrial display Market, By technology, 2019-2028 (USD Million)
TABLE 989 SAUDI ARABIA energy & power in led for industrial display Market, By type, 2019-2028 (USD Million)
TABLE 990 SAUDI ARABIA energy & power in oled for industrial display Market, By type, 2019-2028 (USD Million)
TABLE 991 SAUDI ARABIA military & avionics in industrial display Market, By technology, 2019-2028 (USD Million)
TABLE 992 SAUDI ARABIA military & avionics in led for industrial display Market, By type, 2019-2028 (USD Million)
TABLE 993 SAUDI ARABIA military & avionics in oled for industrial display Market, By type, 2019-2028 (USD Million)
TABLE 994 SAUDI ARABIA oil & gas in industrial display Market, By technology, 2019-2028 (USD Million)
TABLE 995 SAUDI ARABIA oil & gas in led for industrial display Market, By type, 2019-2028 (USD Million)
TABLE 996 SAUDI ARABIA oil & gas in oled for industrial display Market, By type, 2019-2028 (USD Million)
TABLE 997 SAUDI ARABIA transportation in industrial display Market, By technology, 2019-2028 (USD Million)
TABLE 998 SAUDI ARABIA transportation in led for industrial display Market, By type, 2019-2028 (USD Million)
TABLE 999 SAUDI ARABIA transportation in oled for industrial display Market, By type, 2019-2028 (USD Million)
TABLE 1000 SAUDI ARABIA metal & mining in industrial display Market, By technology, 2019-2028 (USD Million)
TABLE 1001 SAUDI ARABIA metal & mining in led for industrial display Market, By type, 2019-2028 (USD Million)
TABLE 1002 SAUDI ARABIA metal & mining in oled for industrial display Market, By type, 2019-2028 (USD Million)
TABLE 1003 SAUDI ARABIA others in industrial display Market, By technology, 2019-2028 (USD Million)
TABLE 1004 SAUDI ARABIA others in led for industrial display Market, By type, 2019-2028 (USD Million)
TABLE 1005 SAUDI ARABIA others in oled for industrial display Market, By type, 2019-2028 (USD Million)
TABLE 1006 SOUTH AFRICA industrial display Market, By type, 2019-2028 (USD Million)
TABLE 1007 SOUTH AFRICA rugged display in industrial display Market, By type, 2019-2028 (USD Million)
TABLE 1008 SOUTH AFRICA rugged display in industrial display Market, By level of ruggedness, 2019-2028 (USD Million)
TABLE 1009 SOUTH AFRICA marine display in industrial display Market, By application, 2019-2028 (USD Million)
TABLE 1010 SOUTH AFRICA industrial display Market, By technology, 2019-2028 (USD Million)
TABLE 1011 SOUTH AFRICA led in industrial display Market, By type, 2019-2028 (USD Million)
TABLE 1012 SOUTH AFRICA oled in industrial display Market, By type, 2019-2028 (USD Million)
TABLE 1013 SOUTH AFRICA industrial display Market, By communication type, 2019-2028 (USD Million)
TABLE 1014 SOUTH AFRICA industrial display Market, By panel size, 2019-2028 (USD Million)
TABLE 1015 SOUTH AFRICA industrial display Market, By application, 2019-2028 (USD Million)
TABLE 1016 SOUTH AFRICA industrial display Market, By Vertical, 2019-2028 (USD Million)
TABLE 1017 SOUTH AFRICA manufacturing in industrial display Market, By technology, 2019-2028 (USD Million)
TABLE 1018 SOUTH AFRICA manufacturing in led for industrial display Market, By type, 2019-2028 (USD Million)
TABLE 1019 SOUTH AFRICA manufacturing in oled for industrial display Market, By type, 2019-2028 (USD Million)
TABLE 1020 SOUTH AFRICA energy & power in industrial display Market, By technology, 2019-2028 (USD Million)
TABLE 1021 SOUTH AFRICA energy & power in led for industrial display Market, By type, 2019-2028 (USD Million)
TABLE 1022 SOUTH AFRICA energy & power in oled for industrial display Market, By type, 2019-2028 (USD Million)
TABLE 1023 SOUTH AFRICA military & avionics in industrial display Market, By technology, 2019-2028 (USD Million)
TABLE 1024 SOUTH AFRICA military & avionics in led for industrial display Market, By type, 2019-2028 (USD Million)
TABLE 1025 SOUTH AFRICA military & avionics in oled for industrial display Market, By type, 2019-2028 (USD Million)
TABLE 1026 SOUTH AFRICA oil & gas in industrial display Market, By technology, 2019-2028 (USD Million)
TABLE 1027 SOUTH AFRICA oil & gas in led for industrial display Market, By type, 2019-2028 (USD Million)
TABLE 1028 SOUTH AFRICA oil & gas in oled for industrial display Market, By type, 2019-2028 (USD Million)
TABLE 1029 SOUTH AFRICA transportation in industrial display Market, By technology, 2019-2028 (USD Million)
TABLE 1030 SOUTH AFRICA transportation in led for industrial display Market, By type, 2019-2028 (USD Million)
TABLE 1031 SOUTH AFRICA transportation in oled for industrial display Market, By type, 2019-2028 (USD Million)
TABLE 1032 SOUTH AFRICA metal & mining in industrial display Market, By technology, 2019-2028 (USD Million)
TABLE 1033 SOUTH AFRICA metal & mining in led for industrial display Market, By type, 2019-2028 (USD Million)
TABLE 1034 SOUTH AFRICA metal & mining in oled for industrial display Market, By type, 2019-2028 (USD Million)
TABLE 1035 SOUTH AFRICA others in industrial display Market, By technology, 2019-2028 (USD Million)
TABLE 1036 SOUTH AFRICA others in led for industrial display Market, By type, 2019-2028 (USD Million)
TABLE 1037 SOUTH AFRICA others in oled for industrial display Market, By type, 2019-2028 (USD Million)
TABLE 1038 EGYPT industrial display Market, By type, 2019-2028 (USD Million)
TABLE 1039 EGYPT rugged display in industrial display Market, By type, 2019-2028 (USD Million)
TABLE 1040 EGYPT rugged display in industrial display Market, By level of ruggedness, 2019-2028 (USD Million)
TABLE 1041 EGYPT marine display in industrial display Market, By application, 2019-2028 (USD Million)
TABLE 1042 EGYPT industrial display Market, By technology, 2019-2028 (USD Million)
TABLE 1043 EGYPT led in industrial display Market, By type, 2019-2028 (USD Million)
TABLE 1044 EGYPT oled in industrial display Market, By type, 2019-2028 (USD Million)
TABLE 1045 EGYPT industrial display Market, By communication type, 2019-2028 (USD Million)
TABLE 1046 EGYPT industrial display Market, By panel size, 2019-2028 (USD Million)
TABLE 1047 EGYPT industrial display Market, By application, 2019-2028 (USD Million)
TABLE 1048 EGYPT industrial display Market, By Vertical, 2019-2028 (USD Million)
TABLE 1049 EGYPT manufacturing in industrial display Market, By technology, 2019-2028 (USD Million)
TABLE 1050 EGYPT manufacturing in led for industrial display Market, By type, 2019-2028 (USD Million)
TABLE 1051 EGYPT manufacturing in oled for industrial display Market, By type, 2019-2028 (USD Million)
TABLE 1052 EGYPT energy & power in industrial display Market, By technology, 2019-2028 (USD Million)
TABLE 1053 EGYPT energy & power in led for industrial display Market, By type, 2019-2028 (USD Million)
TABLE 1054 EGYPT energy & power in oled for industrial display Market, By type, 2019-2028 (USD Million)
TABLE 1055 EGYPT military & avionics in industrial display Market, By technology, 2019-2028 (USD Million)
TABLE 1056 EGYPT military & avionics in led for industrial display Market, By type, 2019-2028 (USD Million)
TABLE 1057 EGYPT military & avionics in oled for industrial display Market, By type, 2019-2028 (USD Million)
TABLE 1058 EGYPT oil & gas in industrial display Market, By technology, 2019-2028 (USD Million)
TABLE 1059 EGYPT oil & gas in led for industrial display Market, By type, 2019-2028 (USD Million)
TABLE 1060 EGYPT oil & gas in oled for industrial display Market, By type, 2019-2028 (USD Million)
TABLE 1061 EGYPT transportation in industrial display Market, By technology, 2019-2028 (USD Million)
TABLE 1062 EGYPT transportation in led for industrial display Market, By type, 2019-2028 (USD Million)
TABLE 1063 EGYPT transportation in oled for industrial display Market, By type, 2019-2028 (USD Million)
TABLE 1064 EGYPT metal & mining in industrial display Market, By technology, 2019-2028 (USD Million)
TABLE 1065 EGYPT metal & mining in led for industrial display Market, By type, 2019-2028 (USD Million)
TABLE 1066 EGYPT metal & mining in oled for industrial display Market, By type, 2019-2028 (USD Million)
TABLE 1067 EGYPT others in industrial display Market, By technology, 2019-2028 (USD Million)
TABLE 1068 EGYPT others in led for industrial display Market, By type, 2019-2028 (USD Million)
TABLE 1069 EGYPT others in oled for industrial display Market, By type, 2019-2028 (USD Million)
TABLE 1070 ISRAEL industrial display Market, By type, 2019-2028 (USD Million)
TABELLE 1071 ISRAEL – Markt für robuste Displays im Industriebereich, nach Typ, 2019–2028 (in Mio. USD)
TABELLE 1072 ISRAEL – Robuste Displays im Markt für Industriedisplays, nach Robustheitsgrad, 2019–2028 (in Millionen USD)
TABELLE 1073 ISRAEL – Markt für Marinedisplays im industriellen Displaybereich, nach Anwendung, 2019–2028 (in Mio. USD)
TABELLE 1074 ISRAELISCHER Markt für Industriedisplays, nach Technologie, 2019–2028 (in Millionen USD)
TABELLE 1075 ISRAEL ist führend im Markt für Industriedisplays, nach Typ, 2019–2028 (in Millionen USD)
TABELLE 1076 ISRAEL OLED-Markt im Industriedisplay, nach Typ, 2019–2028 (in Mio. USD)
TABELLE 1077 ISRAELISCHER Markt für Industriedisplays, nach Kommunikationstyp, 2019–2028 (in Mio. USD)
TABELLE 1078 ISRAELISCHER Markt für Industriedisplays, nach Panelgröße, 2019–2028 (in Mio. USD)
TABELLE 1079 ISRAEL – Markt für Industriedisplays, nach Anwendung, 2019–2028 (in Mio. USD)
TABELLE 1080 ISRAELISCHER Markt für Industriedisplays, nach Branchen, 2019–2028 (in Millionen USD)
TABELLE 1081 ISRAEL – Markt für die Herstellung von Industriedisplays, nach Technologie, 2019–2028 (in Millionen USD)
TABELLE 1082 ISRAEL – Herstellung von LEDs für Industriedisplays, nach Typ, 2019–2028 (in Mio. USD)
TABELLE 1083 ISRAEL – OLED-Produktion für den Markt für Industriedisplays, nach Typ, 2019–2028 (in Mio. USD)
TABELLE 1084 ISRAEL – Energie und Leistung im Markt für Industriedisplays, nach Technologie, 2019–2028 (in Millionen USD)
TABELLE 1085 ISRAEL – Energie und Leistung im LED-Markt für Industriedisplays, nach Typ, 2019–2028 (in Mio. USD)
TABELLE 1086 – ISRAEL – Energie und Leistung im OLED-Markt für Industriedisplays, nach Typ, 2019–2028 (in Mio. USD)
TABELLE 1087 ISRAEL – Markt für Militär- und Avionikprodukte im industriellen Displaybereich, nach Technologie, 2019–2028 (in Millionen USD)
TABELLE 1088 ISRAEL – Militär und Avionik im LED-Markt für Industriedisplays, nach Typ, 2019–2028 (in Mio. USD)
TABELLE 1089 ISRAEL: Markt für Militär und Avionik in OLED für Industriedisplays, nach Typ, 2019–2028 (in Millionen USD)
TABELLE 1090 ISRAEL – Markt für Öl und Gas in der Industrieanzeige, nach Technologie, 2019–2028 (in Millionen USD)
TABELLE 1091 ISRAEL – Öl und Gas im LED-Markt für Industriedisplays, nach Typ, 2019–2028 (in Mio. USD)
TABELLE 1092 ISRAEL – Markt für Öl und Gas in OLED für Industriedisplays, nach Typ, 2019–2028 (in Mio. USD)
TABELLE 1093 ISRAEL – Transport im industriellen Displaymarkt, nach Technologie, 2019–2028 (in Mio. USD)
TABELLE 1094 ISRAEL – Transport im LED-Markt für Industriedisplays, nach Typ, 2019–2028 (in Mio. USD)
TABELLE 1095 – Israelischer Markt für OLED-Transporte für Industriedisplays, nach Typ, 2019–2028 (in Millionen USD)
TABELLE 1096 ISRAEL – Markt für Metall und Bergbau im industriellen Displaybereich, nach Technologie, 2019–2028 (in Mio. USD)
TABELLE 1097 ISRAEL – Metall und Bergbau im LED-Markt für Industriedisplays, nach Typ, 2019–2028 (in Mio. USD)
TABELLE 1098 ISRAEL – Metall und Bergbau im OLED-Markt für Industriedisplays, nach Typ, 2019–2028 (in Mio. USD)
TABELLE 1099 ISRAEL – Sonstige im Markt für Industriedisplays, nach Technologie, 2019–2028 (in Millionen USD)
TABELLE 1100 ISRAEL, Sonstiges im LED-Markt für Industriedisplays, nach Typ, 2019–2028 (in Mio. USD)
TABELLE 1101 ISRAEL – Sonstiges im OLED-Markt für Industriedisplays, nach Typ, 2019–2028 (in Millionen USD)
TABELLE 1102 – Markt für Industriedisplays im Rest des Nahen Ostens und Afrikas, nach Typ, 2019–2028 (in Mio. USD)
TABELLE 1103 Südamerikanischer Markt für Industriedisplays, nach Ländern, 2019–2028 (Mio. USD)
TABELLE 1104 Südamerikanischer Markt für Industriedisplays, nach Typ, 2019–2028 (Mio. USD)
TABELLE 1105 Südamerikanischer Markt für robuste Displays im Industriedisplaybereich, nach Typ, 2019–2028 (Mio. USD)
TABELLE 1106 Südamerikanischer Markt für robuste Displays im Industriedisplaybereich, nach Robustheitsgrad, 2019–2028 (Mio. USD)
TABELLE 1107 Südamerikanischer Markt für Marinedisplays im industriellen Displaybereich, nach Anwendung, 2019–2028 (in Mio. USD)
TABELLE 1108 Südamerikanischer Markt für Industriedisplays, nach Technologie, 2019–2028 (Mio. USD)
TABELLE 1109 Südamerika führt den Markt für Industriedisplays an, nach Typ, 2019–2028 (Mio. USD)
TABELLE 1110 Südamerikanischer OLED-Markt in Industriedisplays, nach Typ, 2019–2028 (Mio. USD)
TABELLE 1111 Südamerikanischer Markt für Industriedisplays, nach Kommunikationstyp, 2019–2028 (Mio. USD)
TABELLE 1112 Südamerikanischer Markt für Industriedisplays, nach Panelgröße, 2019–2028 (Mio. USD)
TABELLE 1113 Südamerikanischer Markt für Industriedisplays, nach Anwendung, 2019–2028 (Mio. USD)
TABELLE 1114 Südamerikanischer Markt für Industriedisplays, nach Branchen, 2019–2028 (in Mio. USD)
TABELLE 1115 Südamerikanischer Markt für die Herstellung von Industriedisplays, nach Technologie, 2019–2028 (Mio. USD)
TABELLE 1116 Südamerikanischer Markt für LED-Produktion für Industriedisplays, nach Typ, 2019–2028 (Mio. USD)
TABELLE 1117 Südamerikanischer Markt für OLED-Produktion für Industriedisplays, nach Typ, 2019–2028 (Mio. USD)
TABELLE 1118 Südamerikanischer Markt für Energie und Leistung im industriellen Displaybereich, nach Technologie, 2019–2028 (Mio. USD)
TABELLE 1119 Energie und Leistung im südamerikanischen LED-Markt für Industriedisplays, nach Typ, 2019–2028 (Mio. USD)
TABELLE 1120 Energie und Leistung im südamerikanischen OLED-Markt für Industriedisplays, nach Typ, 2019–2028 (Mio. USD)
TABELLE 1121 Südamerikanischer Markt für Militär- und Avionik in industriellen Displays, nach Technologie, 2019–2028 (Mio. USD)
TABELLE 1122 Südamerikanischer Markt für Militär- und Avionik-LEDs für Industriedisplays, nach Typ, 2019–2028 (Mio. USD)
TABELLE 1123 Südamerikanischer Markt für Militär und Avionik in OLED für Industriedisplays, nach Typ, 2019–2028 (Mio. USD)
TABELLE 1124 Südamerikanischer Markt für Öl und Gas in industriellen Displays, nach Technologie, 2019–2028 (Mio. USD)
TABELLE 1125 Südamerikanischer Öl- und Gasmarkt im LED-Bereich für Industriedisplays, nach Typ, 2019–2028 (Mio. USD)
TABELLE 1126 Südamerikanischer Markt für Öl und Gas in OLED für Industriedisplays, nach Typ, 2019–2028 (Mio. USD)
TABELLE 1127 Südamerikanischer Markt für Transportmittel in der Industrieanzeige, nach Technologie, 2019–2028 (Mio. USD)
TABELLE 1128 Südamerikanischer Markt für Transport-LEDs für Industriedisplays, nach Typ, 2019–2028 (Mio. USD)
TABLE 1129 South America transportation in oled for industrial display Market, By type, 2019-2028 (USD million)
TABLE 1130 South America metal & mining in industrial display Market, By technology, 2019-2028 (USD million)
TABLE 1131 South America metal & mining in led for industrial display Market, By type, 2019-2028 (USD million)
TABLE 1132 South America metal & mining in oled for industrial display Market, By type, 2019-2028 (USD million)
TABLE 1133 South America others in industrial display Market, By technology, 2019-2028 (USD million)
TABLE 1134 South America others in led for industrial display Market, By type, 2019-2028 (USD million)
TABLE 1135 South America others in oled for industrial display Market, By type, 2019-2028 (USD million)
TABLE 1136 Brazil industrial display Market, By type, 2019-2028 (USD million)
TABLE 1137 Brazil rugged display in industrial display Market, By type, 2019-2028 (USD million)
TABLE 1138 Brazil rugged display in industrial display Market, By level of ruggedness, 2019-2028 (USD million)
TABLE 1139 Brazil marine display in industrial display Market, By application, 2019-2028 (USD million)
TABLE 1140 Brazil industrial display Market, By technology, 2019-2028 (USD million)
TABLE 1141 Brazil led in industrial display Market, By type, 2019-2028 (USD million)
TABLE 1142 Brazil oled in industrial display Market, By type, 2019-2028 (USD million)
TABLE 1143 Brazil industrial display Market, By communication type, 2019-2028 (USD million)
TABLE 1144 Brazil industrial display Market, By panel size, 2019-2028 (USD million)
TABLE 1145 Brazil industrial display Market, By application, 2019-2028 (USD million)
TABLE 1146 Brazil industrial display Market, By Vertical, 2019-2028 (USD million)
TABLE 1147 Brazil manufacturing in industrial display Market, By technology, 2019-2028 (USD million)
TABLE 1148 Brazil manufacturing in led for industrial display Market, By type, 2019-2028 (USD million)
TABLE 1149 Brazil manufacturing in oled for industrial display Market, By type, 2019-2028 (USD million)
TABLE 1150 Brazil energy & power in industrial display Market, By technology, 2019-2028 (USD million)
TABLE 1151 Brazil energy & power in led for industrial display Market, By type, 2019-2028 (USD million)
TABLE 1152 Brazil energy & power in oled for industrial display Market, By type, 2019-2028 (USD million)
TABLE 1153 Brazil military & avionics in industrial display Market, By technology, 2019-2028 (USD million)
TABLE 1154 Brazil military & avionics in led for industrial display Market, By type, 2019-2028 (USD million)
TABLE 1155 Brazil military & avionics in oled for industrial display Market, By type, 2019-2028 (USD million)
TABLE 1156 Brazil oil & gas in industrial display Market, By technology, 2019-2028 (USD million)
TABLE 1157 Brazil oil & gas in led for industrial display Market, By type, 2019-2028 (USD million)
TABLE 1158 Brazil oil & gas in oled for industrial display Market, By type, 2019-2028 (USD million)
TABLE 1159 Brazil transportation in industrial display Market, By technology, 2019-2028 (USD million)
TABLE 1160 Brazil transportation in led for industrial display Market, By type, 2019-2028 (USD million)
TABLE 1161 Brazil transportation in oled for industrial display Market, By type, 2019-2028 (USD million)
TABLE 1162 Brazil metal & mining in industrial display Market, By technology, 2019-2028 (USD million)
TABLE 1163 Brazil metal & mining in led for industrial display Market, By type, 2019-2028 (USD million)
TABLE 1164 Brazil metal & mining in oled for industrial display Market, By type, 2019-2028 (USD million)
TABLE 1165 Brazil others in industrial display Market, By technology, 2019-2028 (USD million)
TABLE 1166 Brazil others in led for industrial display Market, By type, 2019-2028 (USD million)
TABLE 1167 Brazil others in oled for industrial display Market, By type, 2019-2028 (USD million)
TABLE 1168 Argentina industrial display Market, By type, 2019-2028 (USD million)
TABLE 1169 Argentina rugged display in industrial display Market, By type, 2019-2028 (USD million)
TABLE 1170 Argentina rugged display in industrial display Market, By level of ruggedness, 2019-2028 (USD million)
TABLE 1171 Argentina marine display in industrial display Market, By application, 2019-2028 (USD million)
TABLE 1172 Argentina industrial display Market, By technology, 2019-2028 (USD million)
TABLE 1173 Argentina led in industrial display Market, By type, 2019-2028 (USD million)
TABLE 1174 Argentina oled in industrial display Market, By type, 2019-2028 (USD million)
TABLE 1175 Argentina industrial display Market, By communication type, 2019-2028 (USD million)
TABLE 1176 Argentina industrial display Market, By panel size, 2019-2028 (USD million)
TABLE 1177 Argentina industrial display Market, By application, 2019-2028 (USD million)
TABLE 1178 Argentina industrial display Market, By Vertical, 2019-2028 (USD million)
TABLE 1179 Argentina manufacturing in industrial display Market, By technology, 2019-2028 (USD million)
TABLE 1180 Argentina manufacturing in led for industrial display Market, By type, 2019-2028 (USD million)
TABLE 1181 Argentina manufacturing in oled for industrial display Market, By type, 2019-2028 (USD million)
TABLE 1182 Argentina energy & power in industrial display Market, By technology, 2019-2028 (USD million)
TABLE 1183 Argentina energy & power in led for industrial display Market, By type, 2019-2028 (USD million)
TABLE 1184 Argentina energy & power in oled for industrial display Market, By type, 2019-2028 (USD million)
TABLE 1185 Argentina military & avionics in industrial display Market, By technology, 2019-2028 (USD million)
TABLE 1186 Argentina military & avionics in led for industrial display Market, By type, 2019-2028 (USD million)
TABLE 1187 Argentina military & avionics in oled for industrial display Market, By type, 2019-2028 (USD million)
TABLE 1188 Argentina oil & gas in industrial display Market, By technology, 2019-2028 (USD million)
TABLE 1189 Argentina oil & gas in led for industrial display Market, By type, 2019-2028 (USD million)
TABLE 1190 Argentina oil & gas in oled for industrial display Market, By type, 2019-2028 (USD million)
TABLE 1191 Argentina transportation in industrial display Market, By technology, 2019-2028 (USD million)
TABLE 1192 Argentina transportation in led for industrial display Market, By type, 2019-2028 (USD million)
TABLE 1193 Argentina transportation in oled for industrial display Market, By type, 2019-2028 (USD million)
TABLE 1194 Argentina metal & mining in industrial display Market, By technology, 2019-2028 (USD million)
TABLE 1195 Argentina metal & mining in led for industrial display Market, By type, 2019-2028 (USD million)
TABLE 1196 Argentina metal & mining in oled for industrial display Market, By type, 2019-2028 (USD million)
TABLE 1197 Argentina others in industrial display Market, By technology, 2019-2028 (USD million)
TABLE 1198 Argentina others in led for industrial display Market, By type, 2019-2028 (USD million)
TABLE 1199 Argentina others in oled for industrial display Market, By type, 2019-2028 (USD million)
TABLE 1200 Venezuela industrial display Market, By type, 2019-2028 (USD million)
TABLE 1201 Venezuela rugged display in industrial display Market, By type, 2019-2028 (USD million)
TABLE 1202 Venezuela rugged display in industrial display Market, By level of ruggedness, 2019-2028 (USD million)
TABLE 1203 Venezuela marine display in industrial display Market, By application, 2019-2028 (USD million)
TABLE 1204 Venezuela industrial display Market, By technology, 2019-2028 (USD million)
TABLE 1205 Venezuela led in industrial display Market, By type, 2019-2028 (USD million)
TABLE 1206 Venezuela oled in industrial display Market, By type, 2019-2028 (USD million)
TABLE 1207 Venezuela industrial display Market, By communication type, 2019-2028 (USD million)
TABLE 1208 Venezuela industrial display Market, By panel size, 2019-2028 (USD million)
TABLE 1209 Venezuela industrial display Market, By application, 2019-2028 (USD million)
TABLE 1210 Venezuela industrial display Market, By Vertical, 2019-2028 (USD million)
TABLE 1211 Venezuela manufacturing in industrial display Market, By technology, 2019-2028 (USD million)
TABLE 1212 Venezuela manufacturing in led for industrial display Market, By type, 2019-2028 (USD million)
TABLE 1213 Venezuela manufacturing in oled for industrial display Market, By type, 2019-2028 (USD million)
TABLE 1214 Venezuela energy & power in industrial display Market, By technology, 2019-2028 (USD million)
TABLE 1215 Venezuela energy & power in led for industrial display Market, By type, 2019-2028 (USD million)
TABLE 1216 Venezuela energy & power in oled for industrial display Market, By type, 2019-2028 (USD million)
TABLE 1217 Venezuela military & avionics in industrial display Market, By technology, 2019-2028 (USD million)
TABLE 1218 Venezuela military & avionics in led for industrial display Market, By type, 2019-2028 (USD million)
TABLE 1219 Venezuela military & avionics in oled for industrial display Market, By type, 2019-2028 (USD million)
TABLE 1220 Venezuela oil & gas in industrial display Market, By technology, 2019-2028 (USD million)
TABLE 1221 Venezuela oil & gas in led for industrial display Market, By type, 2019-2028 (USD million)
TABLE 1222 Venezuela oil & gas in oled for industrial display Market, By type, 2019-2028 (USD million)
TABLE 1223 Venezuela transportation in industrial display Market, By technology, 2019-2028 (USD million)
TABLE 1224 Venezuela transportation in led for industrial display Market, By type, 2019-2028 (USD million)
TABLE 1225 Venezuela transportation in oled for industrial display Market, By type, 2019-2028 (USD million)
TABLE 1226 Venezuela metal & mining in industrial display Market, By technology, 2019-2028 (USD million)
TABLE 1227 Venezuela metal & mining in led for industrial display Market, By type, 2019-2028 (USD million)
TABLE 1228 Venezuela metal & mining in oled for industrial display Market, By type, 2019-2028 (USD million)
TABLE 1229 Venezuela others in industrial display Market, By technology, 2019-2028 (USD million)
TABLE 1230 Venezuela others in led for industrial display Market, By type, 2019-2028 (USD million)
TABLE 1231 Venezuela others in oled for industrial display Market, By type, 2019-2028 (USD million)
TABLE 1232 Chile industrial display Market, By type, 2019-2028 (USD million)
TABLE 1233 Chile rugged display in industrial display Market, By type, 2019-2028 (USD million)
TABLE 1234 Chile rugged display in industrial display Market, By level of ruggedness, 2019-2028 (USD million)
TABLE 1235 Chile marine display in industrial display Market, By application, 2019-2028 (USD million)
TABLE 1236 Chile industrial display Market, By technology, 2019-2028 (USD million)
TABLE 1237 Chile led in industrial display Market, By type, 2019-2028 (USD million)
TABLE 1238 Chile oled in industrial display Market, By type, 2019-2028 (USD million)
TABLE 1239 Chile industrial display Market, By communication type, 2019-2028 (USD million)
TABLE 1240 Chile industrial display Market, By panel size, 2019-2028 (USD million)
TABLE 1241 Chile industrial display Market, By application, 2019-2028 (USD million)
TABLE 1242 Chile industrial display Market, By Vertical, 2019-2028 (USD million)
TABLE 1243 Chile manufacturing in industrial display Market, By technology, 2019-2028 (USD million)
TABLE 1244 Chile manufacturing in led for industrial display Market, By type, 2019-2028 (USD million)
TABLE 1245 Chile manufacturing in oled for industrial display Market, By type, 2019-2028 (USD million)
TABLE 1246 Chile energy & power in industrial display Market, By technology, 2019-2028 (USD million)
TABLE 1247 Chile energy & power in led for industrial display Market, By type, 2019-2028 (USD million)
TABLE 1248 Chile energy & power in oled for industrial display Market, By type, 2019-2028 (USD million)
TABLE 1249 Chile military & avionics in industrial display Market, By technology, 2019-2028 (USD million)
TABLE 1250 Chile military & avionics in led for industrial display Market, By type, 2019-2028 (USD million)
TABLE 1251 Chile military & avionics in oled for industrial display Market, By type, 2019-2028 (USD million)
TABLE 1252 Chile oil & gas in industrial display Market, By technology, 2019-2028 (USD million)
TABLE 1253 Chile oil & gas in led for industrial display Market, By type, 2019-2028 (USD million)
TABLE 1254 Chile oil & gas in oled for industrial display Market, By type, 2019-2028 (USD million)
TABLE 1255 Chile transportation in industrial display Market, By technology, 2019-2028 (USD million)
TABLE 1256 Chile transportation in led for industrial display Market, By type, 2019-2028 (USD million)
TABLE 1257 Chile transportation in oled for industrial display Market, By type, 2019-2028 (USD million)
TABLE 1258 Chile metal & mining in industrial display Market, By technology, 2019-2028 (USD million)
TABLE 1259 Chile metal & mining in led for industrial display Market, By type, 2019-2028 (USD million)
TABLE 1260 Chile metal & mining in oled for industrial display Market, By type, 2019-2028 (USD million)
TABLE 1261 Chile others in industrial display Market, By technology, 2019-2028 (USD million)
TABLE 1262 Chile others in led for industrial display Market, By type, 2019-2028 (USD million)
TABLE 1263 Chile others in oled for industrial display Market, By type, 2019-2028 (USD million)
TABLE 1264 Colombia industrial display Market, By type, 2019-2028 (USD million)
TABLE 1265 Colombia rugged display in industrial display Market, By type, 2019-2028 (USD million)
TABLE 1266 Colombia rugged display in industrial display Market, By level of ruggedness, 2019-2028 (USD million)
TABLE 1267 Colombia marine display in industrial display Market, By application, 2019-2028 (USD million)
TABLE 1268 Colombia industrial display Market, By technology, 2019-2028 (USD million)
TABLE 1269 Colombia led in industrial display Market, By type, 2019-2028 (USD million)
TABLE 1270 Colombia oled in industrial display Market, By type, 2019-2028 (USD million)
TABLE 1271 Colombia industrial display Market, By communication type, 2019-2028 (USD million)
TABLE 1272 Colombia industrial display Market, By panel size, 2019-2028 (USD million)
TABLE 1273 Colombia industrial display Market, By application, 2019-2028 (USD million)
TABLE 1274 Colombia industrial display Market, By Vertical, 2019-2028 (USD million)
TABLE 1275 Colombia manufacturing in industrial display Market, By technology, 2019-2028 (USD million)
TABLE 1276 Colombia manufacturing in led for industrial display Market, By type, 2019-2028 (USD million)
TABLE 1277 Colombia manufacturing in oled for industrial display Market, By type, 2019-2028 (USD million)
TABLE 1278 Colombia energy & power in industrial display Market, By technology, 2019-2028 (USD million)
TABLE 1279 Colombia energy & power in led for industrial display Market, By type, 2019-2028 (USD million)
TABLE 1280 Colombia energy & power in oled for industrial display Market, By type, 2019-2028 (USD million)
TABLE 1281 Colombia military & avionics in industrial display Market, By technology, 2019-2028 (USD million)
TABLE 1282 Colombia military & avionics in led for industrial display Market, By type, 2019-2028 (USD million)
TABLE 1283 Colombia military & avionics in oled for industrial display Market, By type, 2019-2028 (USD million)
TABLE 1284 Colombia oil & gas in industrial display Market, By technology, 2019-2028 (USD million)
TABLE 1285 Colombia oil & gas in led for industrial display Market, By type, 2019-2028 (USD million)
TABLE 1286 Colombia oil & gas in oled for industrial display Market, By type, 2019-2028 (USD million)
TABLE 1287 Colombia transportation in industrial display Market, By technology, 2019-2028 (USD million)
TABLE 1288 Colombia transportation in led for industrial display Market, By type, 2019-2028 (USD million)
TABLE 1289 Colombia transportation in oled for industrial display Market, By type, 2019-2028 (USD million)
TABLE 1290 Colombia metal & mining in industrial display Market, By technology, 2019-2028 (USD million)
TABLE 1291 Colombia metal & mining in led for industrial display Market, By type, 2019-2028 (USD million)
TABLE 1292 Colombia metal & mining in oled for industrial display Market, By type, 2019-2028 (USD million)
TABLE 1293 Colombia others in industrial display Market, By technology, 2019-2028 (USD million)
TABLE 1294 Colombia others in led for industrial display Market, By type, 2019-2028 (USD million)
TABLE 1295 Colombia others in oled for industrial display Market, By type, 2019-2028 (USD million)
TABLE 1296 Peru industrial display Market, By type, 2019-2028 (USD million)
TABLE 1297 Peru rugged display in industrial display Market, By type, 2019-2028 (USD million)
TABLE 1298 Peru rugged display in industrial display Market, By level of ruggedness, 2019-2028 (USD million)
TABLE 1299 Peru marine display in industrial display Market, By application, 2019-2028 (USD million)
TABLE 1300 Peru industrial display Market, By technology, 2019-2028 (USD million)
TABLE 1301 Peru led in industrial display Market, By type, 2019-2028 (USD million)
TABLE 1302 Peru oled in industrial display Market, By type, 2019-2028 (USD million)
TABLE 1303 Peru industrial display Market, By communication type, 2019-2028 (USD million)
TABLE 1304 Peru industrial display Market, By panel size, 2019-2028 (USD million)
TABLE 1305 Peru industrial display Market, By application, 2019-2028 (USD million)
TABLE 1306 Peru industrial display Market, By Vertical, 2019-2028 (USD million)
TABLE 1307 Peru manufacturing in industrial display Market, By technology, 2019-2028 (USD million)
TABLE 1308 Peru manufacturing in led for industrial display Market, By type, 2019-2028 (USD million)
TABLE 1309 Peru manufacturing in oled for industrial display Market, By type, 2019-2028 (USD million)
TABLE 1310 Peru energy & power in industrial display Market, By technology, 2019-2028 (USD million)
TABLE 1311 Peru energy & power in led for industrial display Market, By type, 2019-2028 (USD million)
TABLE 1312 Peru energy & power in oled for industrial display Market, By type, 2019-2028 (USD million)
TABLE 1313 Peru military & avionics in industrial display Market, By technology, 2019-2028 (USD million)
TABLE 1314 Peru military & avionics in led for industrial display Market, By type, 2019-2028 (USD million)
TABLE 1315 Peru military & avionics in oled for industrial display Market, By type, 2019-2028 (USD million)
TABLE 1316 Peru oil & gas in industrial display Market, By technology, 2019-2028 (USD million)
TABLE 1317 Peru oil & gas in led for industrial display Market, By type, 2019-2028 (USD million)
TABLE 1318 Peru oil & gas in oled for industrial display Market, By type, 2019-2028 (USD million)
TABLE 1319 Peru transportation in industrial display Market, By technology, 2019-2028 (USD million)
TABLE 1320 Peru transportation in led for industrial display Market, By type, 2019-2028 (USD million)
TABLE 1321 Peru transportation in oled for industrial display Market, By type, 2019-2028 (USD million)
TABLE 1322 Peru metal & mining in industrial display Market, By technology, 2019-2028 (USD million)
TABLE 1323 Peru metal & mining in led for industrial display Market, By type, 2019-2028 (USD million)
TABLE 1324 Peru metal & mining in oled for industrial display Market, By type, 2019-2028 (USD million)
TABLE 1325 Peru others in industrial display Market, By technology, 2019-2028 (USD million)
TABLE 1326 Peru others in led for industrial display Market, By type, 2019-2028 (USD million)
TABLE 1327 Peru others in oled for industrial display Market, By type, 2019-2028 (USD million)
TABLE 1328 Ecuador industrial display Market, By type, 2019-2028 (USD million)
TABLE 1329 Ecuador rugged display in industrial display Market, By type, 2019-2028 (USD million)
TABLE 1330 Ecuador rugged display in industrial display Market, By level of ruggedness, 2019-2028 (USD million)
TABLE 1331 Ecuador marine display in industrial display Market, By application, 2019-2028 (USD million)
TABLE 1332 Ecuador industrial display Market, By technology, 2019-2028 (USD million)
TABLE 1333 Ecuador led in industrial display Market, By type, 2019-2028 (USD million)
TABLE 1334 Ecuador oled in industrial display Market, By type, 2019-2028 (USD million)
TABLE 1335 Ecuador industrial display Market, By communication type, 2019-2028 (USD million)
TABLE 1336 Ecuador industrial display Market, By panel size, 2019-2028 (USD million)
TABLE 1337 Ecuador industrial display Market, By application, 2019-2028 (USD million)
TABLE 1338 Ecuador industrial display Market, By Vertical, 2019-2028 (USD million)
TABLE 1339 Ecuador manufacturing in industrial display Market, By technology, 2019-2028 (USD million)
TABLE 1340 Ecuador manufacturing in led for industrial display Market, By type, 2019-2028 (USD million)
TABLE 1341 Ecuador manufacturing in oled for industrial display Market, By type, 2019-2028 (USD million)
TABLE 1342 Ecuador energy & power in industrial display Market, By technology, 2019-2028 (USD million)
TABLE 1343 Ecuador energy & power in led for industrial display Market, By type, 2019-2028 (USD million)
TABLE 1344 Ecuador energy & power in oled for industrial display Market, By type, 2019-2028 (USD million)
TABLE 1345 Ecuador military & avionics in industrial display Market, By technology, 2019-2028 (USD million)
TABLE 1346 Ecuador military & avionics in led for industrial display Market, By type, 2019-2028 (USD million)
TABLE 1347 Ecuador military & avionics in oled for industrial display Market, By type, 2019-2028 (USD million)
TABLE 1348 Ecuador oil & gas in industrial display Market, By technology, 2019-2028 (USD million)
TABLE 1349 Ecuador oil & gas in led for industrial display Market, By type, 2019-2028 (USD million)
TABLE 1350 Ecuador oil & gas in oled for industrial display Market, By type, 2019-2028 (USD million)
TABLE 1351 Ecuador transportation in industrial display Market, By technology, 2019-2028 (USD million)
TABLE 1352 Ecuador transportation in led for industrial display Market, By type, 2019-2028 (USD million)
TABLE 1353 Ecuador transportation in oled for industrial display Market, By type, 2019-2028 (USD million)
TABLE 1354 Ecuador metal & mining in industrial display Market, By technology, 2019-2028 (USD million)
TABLE 1355 Ecuador metal & mining in led for industrial display Market, By type, 2019-2028 (USD million)
TABLE 1356 Ecuador metal & mining in oled for industrial display Market, By type, 2019-2028 (USD million)
TABLE 1357 Ecuador others in industrial display Market, By technology, 2019-2028 (USD million)
TABLE 1358 Ecuador others in led for industrial display Market, By type, 2019-2028 (USD million)
TABLE 1359 Ecuador others in oled for industrial display Market, By type, 2019-2028 (USD million)
TABLE 1360 rest of south america industrial display Market, By type, 2019-2028 (USD million)
Abbildungsverzeichnis
FIGURE 1 Global Industrial Display market: segmentation
FIGURE 2 GLOBAL INDUSTRIAL DISPLAY MARKET: data triangulation
FIGURE 3 Global Industrial Display market: DROC ANALYSIS
FIGURE 4 Global Industrial Display market: global VS regional MARKET ANALYSIS
FIGURE 5 GLOBAL INDUSTRIAL DISPLAY MARKET: COMPANY RESEARCH ANALYSIS
FIGURE 6 GLOBAL INDUSTRIAL DISPLAY MARKET: INTERVIEW DEMOGRAPHICS
FIGURE 8 Global Industrial Display market: vendor share analysis
FIGURE 9 GLOBAL INDUSTRIAL DISPLAY MARKET: MARKET APPLICATION COVERAGE GRID
FIGURE 10 Global Industrial Display market: SEGMENTATION
FIGURE 11 Rising demand for human machine interface (HMI) application in manufacturing and process industries is expected to DRIVe the global Industrial Display MARKET IN THE FORECAST PERIOD of 2021 to 2028
FIGURE 12 rugged displays segment is expected to account for the largest share of global Industrial Display market in 2021 & 2028
FIGURE 13 north america is expected to DOMINATE and asia-pacific is the fastest growing region in THE global Industrial Display MARKET IN the forecast period of 2021 to 2028
FIGURE 14 asia-pacific is the fastest growing market for Industrial Display manufacturers in the forecast period of 2021 to 2028
FIGURE 15 VALUE CHAIN ANALYSIS FRAMEWORK
FIGURE 16 DRIVERS, RESTRAINT, OPPORTUNITIES, AND CHALLENGES OF GLOBAL industrial display MARKET
FIGURE 17 Shipments Projection of Installation Based Digital Signage Displays
FIGURE 18 OLED Smartphone Panel Shipment
FIGURE 1 Global Industrial Display MARKET: BY type, 2020
FIGURE 2 Global Industrial Display MARKET: BY panel size, 2020
FIGURE 3 Global Industrial Display MARKET: BY technology, 2020
FIGURE 4 Global Industrial Display MARKET: BY communication type, 2020
FIGURE 5 Global Industrial Display MARKET: BY application, 2020
FIGURE 6 Global Industrial Display MARKET: BY vertical, 2020
FIGURE 7 Global industrial display MARKET: SNAPSHOT (2020)
FIGURE 8 Global industrial display MARKET: by Region (2020)
FIGURE 9 Global industrial display MARKET: by Region (2021 & 2028)
FIGURE 10 Global industrial display MARKET: by Region (2020 & 2028)
FIGURE 11 Global industrial display MARKET: by type (2021-2028)
FIGURE 12 North america industrial display MARKET: SNAPSHOT (2020)
FIGURE 13 North america industrial display MARKET: by Country (2020)
FIGURE 14 North america industrial display MARKET: by Country (2021 & 2028)
FIGURE 15 North america industrial display MARKET: by Country (2020 & 2028)
FIGURE 16 North america industrial display MARKET: by type (2021-2028)
FIGURE 17 europe industrial display MARKET: SNAPSHOT (2020)
FIGURE 18 europe industrial display MARKET: by Country (2020)
FIGURE 19 europe industrial display MARKET: by Country (2021 & 2028)
FIGURE 20 europe industrial display MARKET: by Country (2020 & 2028)
FIGURE 21 europe industrial display MARKET: by type (2021-2028)
FIGURE 22 asia-pacific industrial display MARKET: SNAPSHOT (2020)
FIGURE 23 asia-pacific industrial display MARKET: by Country (2020)
FIGURE 24 asia-pacific industrial display MARKET: by Country (2021 & 2028)
FIGURE 25 asia-pacific industrial display MARKET: by Country (2020 & 2028)
FIGURE 26 asia-pacific industrial display MARKET: by type (2021-2028)
FIGURE 27 middle east and africa industrial display MARKET: SNAPSHOT (2020)
FIGURE 28 middle east and africa industrial display MARKET: by Country (2020)
FIGURE 29 middle east and africa industrial display MARKET: by Country (2021 & 2028)
FIGURE 30 middle east and africa industrial display MARKET: by Country (2020 & 2028)
FIGURE 31 middle east and africa industrial display MARKET: by TYPE (2021-2028)
FIGURE 32 south america industrial display MARKET: SNAPSHOT (2020)
FIGURE 33 south america industrial display MARKET: by Country (2020)
FIGURE 34 south america industrial display MARKET: by Country (2021 & 2028)
FIGURE 35 south america industrial display MARKET: by Country (2020 & 2028)
FIGURE 36 south america industrial display MARKET: by type (2021-2028)
FIGURE 37 Global industrial display market: company share 2020 (%)
FIGURE 38 north America industrial display Market: company share 2020(%)
FIGURE 39 Europe industrial display Market: company share 2020 (%)
FIGURE 40 Asia-Pacific industrial display Market: company share 2020(%)
Forschungsmethodik
Die Datenerfassung und Basisjahresanalyse werden mithilfe von Datenerfassungsmodulen mit großen Stichprobengrößen durchgeführt. Die Phase umfasst das Erhalten von Marktinformationen oder verwandten Daten aus verschiedenen Quellen und Strategien. Sie umfasst die Prüfung und Planung aller aus der Vergangenheit im Voraus erfassten Daten. Sie umfasst auch die Prüfung von Informationsinkonsistenzen, die in verschiedenen Informationsquellen auftreten. Die Marktdaten werden mithilfe von marktstatistischen und kohärenten Modellen analysiert und geschätzt. Darüber hinaus sind Marktanteilsanalyse und Schlüsseltrendanalyse die wichtigsten Erfolgsfaktoren im Marktbericht. Um mehr zu erfahren, fordern Sie bitte einen Analystenanruf an oder geben Sie Ihre Anfrage ein.
Die wichtigste Forschungsmethodik, die vom DBMR-Forschungsteam verwendet wird, ist die Datentriangulation, die Data Mining, die Analyse der Auswirkungen von Datenvariablen auf den Markt und die primäre (Branchenexperten-)Validierung umfasst. Zu den Datenmodellen gehören ein Lieferantenpositionierungsraster, eine Marktzeitlinienanalyse, ein Marktüberblick und -leitfaden, ein Firmenpositionierungsraster, eine Patentanalyse, eine Preisanalyse, eine Firmenmarktanteilsanalyse, Messstandards, eine globale versus eine regionale und Lieferantenanteilsanalyse. Um mehr über die Forschungsmethodik zu erfahren, senden Sie eine Anfrage an unsere Branchenexperten.
Anpassung möglich
Data Bridge Market Research ist ein führendes Unternehmen in der fortgeschrittenen formativen Forschung. Wir sind stolz darauf, unseren bestehenden und neuen Kunden Daten und Analysen zu bieten, die zu ihren Zielen passen. Der Bericht kann angepasst werden, um Preistrendanalysen von Zielmarken, Marktverständnis für zusätzliche Länder (fordern Sie die Länderliste an), Daten zu klinischen Studienergebnissen, Literaturübersicht, Analysen des Marktes für aufgearbeitete Produkte und Produktbasis einzuschließen. Marktanalysen von Zielkonkurrenten können von technologiebasierten Analysen bis hin zu Marktportfoliostrategien analysiert werden. Wir können so viele Wettbewerber hinzufügen, wie Sie Daten in dem von Ihnen gewünschten Format und Datenstil benötigen. Unser Analystenteam kann Ihnen auch Daten in groben Excel-Rohdateien und Pivot-Tabellen (Fact Book) bereitstellen oder Sie bei der Erstellung von Präsentationen aus den im Bericht verfügbaren Datensätzen unterstützen.

