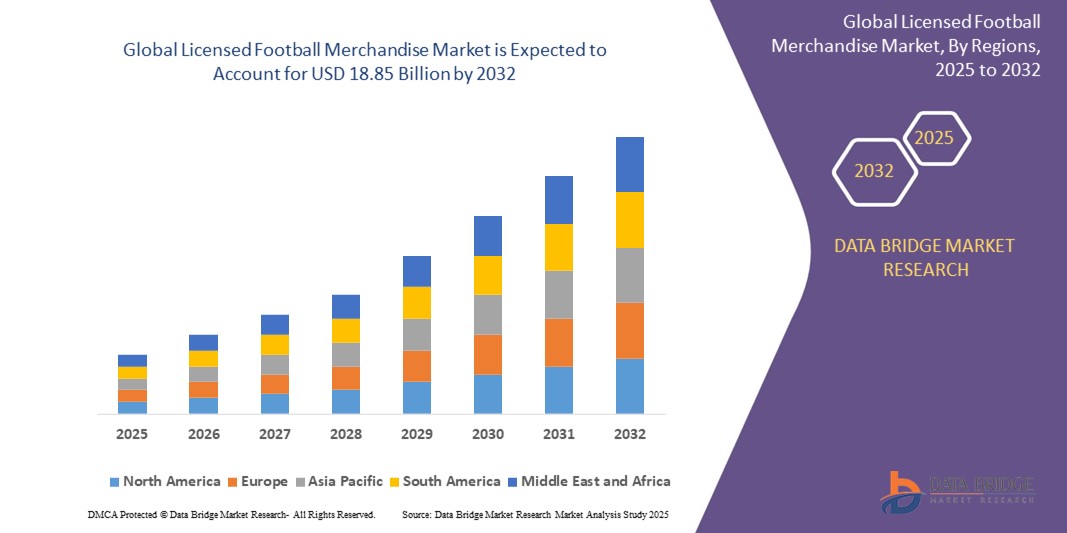
Global Licensed Football Merchandise Market
Marktgröße in Milliarden USD
CAGR :
% 
 USD
11.48 Billion
USD
18.85 Billion
2024
2032
USD
11.48 Billion
USD
18.85 Billion
2024
2032
| 2025 –2032 | |
| USD 11.48 Billion | |
| USD 18.85 Billion | |
| % | |
|
Weltweiter Markt für lizenzierte Fußballartikel nach Produkttyp (Schuhe, Bekleidung, Accessoires, Spielzeug und Spiele usw.), Preis (niedrig, mittel und hoch), Vertriebskanal (online und offline) und Endbenutzer (Kinder, Männer und Frauen) – Branchentrends und Prognose bis 2032.
Marktgröße für lizenzierte Fußballartikel
- Der globale Markt für lizenzierte Fußballartikel hatte im Jahr 2024 einen Wert von 11,48 Milliarden US-Dollar und dürfte bis 2032 einen Wert von 18,85 Milliarden US-Dollar erreichen , was einer jährlichen Wachstumsrate von 6,4 % im Prognosezeitraum entspricht.
- Das Marktwachstum wird vor allem durch die weltweit zunehmende Popularität des Fußballs vorangetrieben, die durch hochkarätige Veranstaltungen wie die FIFA-Weltmeisterschaft und die UEFA Champions League befeuert wird, die das Engagement der Fans und die Nachfrage nach lizenzierten Produkten verstärken.
- Steigende verfügbare Einkommen, eine wachsende Beteiligung am Fußball und die Expansion von E-Commerce-Plattformen, die personalisierte und innovative Produkte anbieten, tragen weiter zum robusten Wachstum der Branche bei.
Marktanalyse für lizenzierte Fußballartikel
- Lizenzierte Fußballartikel, darunter Bekleidung, Schuhe, Accessoires und Spielzeug, dienen als wichtiger Ausdruck der Fantreue und Teamzugehörigkeit, angetrieben von der globalen Anziehungskraft des Fußballs als beliebtester Sport der Welt.
- Der Markt wird durch wachsende Fangemeinden, strategische Partnerschaften zwischen Marken und Fußballvereinen und den wachsenden Einfluss sozialer Medien bei der Vermarktung von Merchandise-Artikeln vorangetrieben.
- Der asiatisch-pazifische Raum dominierte den Markt für lizenzierte Fußballartikel mit einem Anteil von 32,8 % im Jahr 2024, angetrieben durch hohe Produktion und Konsum in Ländern wie China, unterstützt durch Innovationen in der Bekleidungsherstellung
- Nordamerika ist die am schnellsten wachsende Region, angetrieben durch die steigende Popularität des Fußballs, insbesondere in den USA, angetrieben durch die Major League Soccer (MLS), Jugendfußballprogramme und die schweißabsorbierenden Eigenschaften von Fußballbekleidung.
- Das Bekleidungssegment dominierte den größten Marktumsatzanteil von 38,5 % im Jahr 2024, angetrieben durch die hohe Nachfrage nach Trikots, T-Shirts und anderen Kleidungsstücken, mit denen Fans ihre Teamtreue zeigen können.
Berichtsumfang und Marktsegmentierung für lizenzierte Fußballartikel
|
Eigenschaften |
Wichtige Markteinblicke in lizenzierte Fußballartikel |
|
Abgedeckte Segmente |
|
|
Abgedeckte Länder |
Nordamerika
Europa
Asien-Pazifik
Naher Osten und Afrika
Südamerika
|
|
Wichtige Marktteilnehmer |
|
|
Marktchancen |
|
|
Wertschöpfungsdaten-Infosets |
Zusätzlich zu den Einblicken in Marktszenarien wie Marktwert, Wachstumsrate, Segmentierung, geografische Abdeckung und wichtige Akteure enthalten die von Data Bridge Market Research kuratierten Marktberichte auch ausführliche Expertenanalysen, Preisanalysen, Markenanteilsanalysen, Verbraucherumfragen, demografische Analysen, Lieferkettenanalysen, Wertschöpfungskettenanalysen, eine Übersicht über Rohstoffe/Verbrauchsmaterialien, Kriterien für die Lieferantenauswahl, PESTLE-Analysen, Porter-Analysen und regulatorische Rahmenbedingungen. |
Markttrends für lizenzierte Fußballartikel
„Zunehmende Integration intelligenter Technologien und Personalisierung“
- Der globale Markt für lizenzierte Fußballartikel verzeichnet einen bemerkenswerten Trend zur Integration intelligenter Technologien und Personalisierung in Produkte
- Technologien wie Augmented Reality (AR) und Internet der Dinge (IoT) werden in Merchandise-Artikel wie Kleidung und Accessoires integriert und ermöglichen interaktive Fan-Erlebnisse, wie zum Beispiel AR-fähige Trikots, die beim Scannen digitale Inhalte freischalten.
- Die Personalisierung gewinnt an Bedeutung. Marken bieten personalisierte Trikots, Schuhe und Accessoires mit von Fans ausgewählten Namen, Nummern oder Designs an und steigern so die Kundenbindung.
- Beispielsweise nutzen Unternehmen wie Nike und Adidas digitale Plattformen, um Fans die Personalisierung von Fanartikeln zu ermöglichen, während intelligente Accessoires wie vernetzte Armbänder die Aktivitäten der Fans während Spielen oder Veranstaltungen verfolgen.
- Diese Innovationen steigern die Attraktivität lizenzierter Fußballartikel, insbesondere bei technisch versierten Verbrauchern und jüngeren Bevölkerungsgruppen.
- Datenanalysen werden auch eingesetzt, um Verbraucherpräferenzen zu untersuchen. So können Marken ihre Produkte und Marketingstrategien auf bestimmte Fangemeinden zuschneiden und so die Loyalität und den Umsatz steigern.
Dynamik des Marktes für lizenzierte Fußballartikel
Treiber
„Steigende Popularität des Fußballs und Fan-Engagement“
- Die weltweit wachsende Fangemeinde für Fußball, angetrieben durch große Turniere wie die FIFA-Weltmeisterschaft und die UEFA Champions League, ist ein wichtiger Treiber für den Markt für lizenzierte Fußballartikel.
- Lizenzierte Produkte wie Teamtrikots, Schuhe und Accessoires ermöglichen es den Fans, ihre Loyalität auszudrücken und sich mit ihren Lieblingsteams und -spielern zu verbinden, was die Nachfrage ankurbelt.
- Der Einfluss sozialer Medien und die Unterstützung durch bekannte Spieler wie Lionel Messi und Cristiano Ronaldo steigern die Attraktivität lizenzierter Produkte erheblich.
- Der Aufstieg von E-Commerce-Plattformen hat den Zugang zu Waren erleichtert, wobei Online-Vertriebskanäle Komfort und eine breite Produktpalette bieten
- Fußballvereine und Marken arbeiten zunehmend mit Modelabels wie Adidas und H&M zusammen, um limitierte Kollektionen herauszubringen, was das Interesse der Verbraucher weiter steigert.
Einschränkung/Herausforderung
„Hohe Kosten für lizenzierte Produkte und Probleme mit Fälschungen“
- Die hohen Kosten für lizenzierte Fußballartikel, insbesondere Premiumprodukte wie authentische Trikots und hochwertige Schuhe, können preisbewusste Verbraucher abschrecken, insbesondere in Schwellenländern.
- Produktions- und Lizenzgebühren tragen zu höheren Preisen bei und machen Produkte im niedrigen und mittleren Preissegment in kostenbewussten Regionen attraktiver.
- Gefälschte Waren stellen eine große Herausforderung dar, da gefälschte Produkte die Märkte überschwemmen und den Verkauf authentischer lizenzierter Waren untergraben.
- Bei intelligenten Waren treten Datenschutzbedenken auf, da vernetzte Geräte Benutzerdaten sammeln, was Fragen hinsichtlich der Sicherheit und der Einhaltung von Vorschriften wie der DSGVO in Europa aufwirft.
- Die fragmentierte Regulierungslandschaft der einzelnen Länder hinsichtlich des geistigen Eigentums und der Lizenzierungsstandards erschwert die Marktaktivitäten globaler Marken und schränkt möglicherweise deren Expansion ein.
Umfang des Marktes für lizenzierte Fußballartikel
Der Markt ist nach Produkttyp, Preis, Vertriebskanal und Endbenutzer segmentiert.
- Nach Produkttyp
Der globale Markt für lizenzierte Fußballartikel ist nach Produkttyp in Schuhe, Bekleidung, Accessoires, Spielwaren und Sonstiges unterteilt. Das Bekleidungssegment hatte 2024 mit 38,5 % den größten Marktanteil, angetrieben von der hohen Nachfrage nach Trikots, T-Shirts und anderen Kleidungsstücken, mit denen Fans ihre Teamtreue zeigen können. Die Dominanz dieses Segments wird durch die häufige Veröffentlichung neuer Trikots, Sondereditionen und Kooperationen mit Modemarken befeuert, die bei den Verbrauchern ein Gefühl der Dringlichkeit und Begeisterung wecken.
Das Schuhsegment wird voraussichtlich von 2025 bis 2032 mit einer prognostizierten jährlichen Wachstumsrate von 7,4 % das höchste Wachstum verzeichnen. Dieses Wachstum wird durch die zunehmende Beteiligung am Fußballsport, insbesondere bei Jugendlichen, und die steigende Nachfrage nach leistungsorientierten, lizenzierten Fußballschuhen, die professionelle Ausrüstung nachahmen, vorangetrieben. Fortschritte bei Leichtbaumaterialien und Grifftechnologie fördern die Akzeptanz zusätzlich.
- Nach Preis
Der globale Markt für lizenzierte Fußballartikel ist preislich in niedrige, mittlere und hohe Preiskategorien unterteilt. Das mittlere Preissegment hatte 2024 mit 45,0 % den größten Marktanteil, was auf seine Attraktivität für eine breite Verbraucherbasis zurückzuführen ist, die hochwertige Artikel zu vernünftigen Preisen sucht. Dieses Segment vereint Erschwinglichkeit mit Authentizität und ist daher bei Fans und Gelegenheitskäufern beliebt.
Das Hochpreissegment wird voraussichtlich von 2025 bis 2032 mit einer prognostizierten jährlichen Wachstumsrate von 6,8 % die höchste Wachstumsrate aufweisen. Dieses Wachstum wird durch steigende verfügbare Einkommen, insbesondere in Nordamerika, und die zunehmende Nachfrage nach hochwertigen, limitierten Artikeln wie Sammlertrikots und signierten Erinnerungsstücken für begeisterte Fans und Sammler vorangetrieben.
- Nach Vertriebskanal
Der globale Markt für lizenzierte Fußballartikel ist nach Vertriebskanälen in Online- und Offline-Vertriebskanäle unterteilt. Das Online-Segment dominierte den Markt mit einem Umsatzanteil von 52,3 % im Jahr 2024, was auf die Benutzerfreundlichkeit von E-Commerce-Plattformen, die globale Reichweite und die Verfügbarkeit personalisierter und anpassbarer Produkte zurückzuführen ist. Plattformen wie Amazon, Fanatics und vereinsspezifische Online-Shops haben den Umsatz durch nahtlose Einkaufserlebnisse und gezieltes Marketing beschleunigt.
Das Offline-Segment wird voraussichtlich zwischen 2025 und 2032 ein deutliches Wachstum mit einer prognostizierten jährlichen Wachstumsrate von 6,2 % verzeichnen. Dieses Wachstum wird durch die haptische Attraktivität von stationären Geschäften wie Supermärkten, Hypermärkten und Fachgeschäften vorangetrieben, in denen Fans während großer Turniere und in der Hochsaison Fanartikel entdecken können. In-Store-Aktionen und Partnerschaften mit großen Einzelhändlern verbessern die Verfügbarkeit.
- Nach Endbenutzer
Der globale Markt für lizenzierte Fußballartikel ist nach Endverbraucher in Kinder, Männer und Frauen unterteilt. Das Männersegment hielt 2024 mit 48,7 % den größten Marktanteil, was auf die historische Verbindung des Sports mit männlichen Fans und deren hohe Kaufkraft für Artikel wie Trikots, Schuhe und Accessoires zurückzuführen ist. Die hohe Beteiligung von Männern an fußballbezogenen Aktivitäten stärkt das Segment zusätzlich.
Das Frauensegment wird voraussichtlich von 2025 bis 2032 mit 7,1 % das höchste Wachstum verzeichnen. Die zunehmende Beteiligung von Frauen am Fußball, die zunehmende Sichtbarkeit von Frauenfußballligen und gezielte Marketingkampagnen für stylische und funktionale Produkte treiben die Nachfrage an. Marken konzentrieren sich auf frauenspezifische Designs und Kooperationen, um dieser wachsenden Zielgruppe gerecht zu werden.
Regionale Analyse des Marktes für lizenzierte Fußballartikel
- Der asiatisch-pazifische Raum dominierte den Markt für lizenzierte Fußballartikel mit einem Anteil von 32,8 % im Jahr 2024, angetrieben durch hohe Produktion und Konsum in Ländern wie China, unterstützt durch Innovationen in der Bekleidungsherstellung
- Verbraucher bevorzugen lizenzierte Fußballartikel, um ihre Teamtreue zu zeigen, das Fanerlebnis zu verbessern und Zugang zu hochwertigen, leistungsorientierten Produkten zu erhalten, insbesondere in Regionen mit starker Fußballbegeisterung.
- Das Wachstum wird durch Fortschritte im Warendesign, einschließlich feuchtigkeitsableitender Stoffe und nachhaltiger Materialien, sowie durch die zunehmende Akzeptanz sowohl in offiziellen Team-Shops als auch im Aftermarket-Einzelhandel unterstützt.
Einblicke in den Markt für lizenzierte Fußballartikel in Japan
Der japanische Markt für lizenzierte Fußballartikel wird voraussichtlich rasant wachsen. Grund dafür ist die starke Vorliebe der Verbraucher für hochwertige, authentische Produkte, die die Fanbindung stärken und die Vereinstreue stärken. Die Präsenz großer Fußballvereine und die Integration lizenzierter Produkte in die offiziellen Fanshops beschleunigen die Marktdurchdringung. Das steigende Interesse an individueller Anpassung trägt ebenfalls zum Wachstum bei.
Einblicke in den Markt für lizenzierte Fußballartikel in China
China hält den größten Anteil am Markt für lizenzierte Fußballartikel im asiatisch-pazifischen Raum. Grund hierfür sind die rasante Urbanisierung, die wachsende Fußballbegeisterung und die steigende Nachfrage nach Team-Branding-Produkten. Die wachsende Mittelschicht des Landes und der Fokus auf die Sportkultur fördern die Akzeptanz moderner Produkte. Starke inländische Produktionskapazitäten und wettbewerbsfähige Preise verbessern die Marktzugänglichkeit.
Einblicke in den US -Markt für lizenzierte Fußballartikel
Der US-Markt für lizenzierte Fußballartikel wird voraussichtlich deutlich wachsen, angetrieben durch die starke Nachfrage im Nachmarkt und das wachsende Fan-Engagement in nationalen und internationalen Fußballligen. Der Trend zu fanorientierter Individualisierung und zunehmende Vorschriften zur Gewährleistung authentischer Lizenzprodukte treiben das Marktwachstum weiter voran. Die zunehmende Einbindung von Markenartikeln in Fan-Engagement-Strategien von Fußballvereinen ergänzt den Nachmarktverkauf und schafft so ein vielfältiges Produkt-Ökosystem.
Einblicke in den europäischen Markt für lizenzierte Fußballartikel
Der europäische Markt für lizenzierte Fußballartikel wird voraussichtlich deutlich wachsen, unterstützt durch eine starke Fußballkultur und den regulatorischen Fokus auf authentische Produkte. Verbraucher suchen Produkte, die die Fan-Identität stärken und gleichzeitig Funktionalität bieten, wie beispielsweise atmungsaktive Kleidung. Das Wachstum ist sowohl bei offiziellen Vereinsartikeln als auch im Aftermarket-Bereich deutlich, wobei Länder wie Deutschland und Großbritannien aufgrund der großen Fußballligen und -turniere eine deutliche Nachfrage verzeichnen.
Einblicke in den Markt für lizenzierte Fußballartikel in Großbritannien
Der britische Markt für lizenzierte Fußballartikel wird voraussichtlich ein starkes Wachstum verzeichnen, angetrieben von der Nachfrage nach Team-Branding-Kleidung und -Accessoires in städtischen und vorstädtischen Gebieten. Das zunehmende Interesse an Fan-Ästhetik und das wachsende Bewusstsein für die Vorteile authentischer Produkte fördern die Akzeptanz. Darüber hinaus beeinflussen sich entwickelnde Vorschriften für lizenzierte Produkte die Kaufentscheidungen der Verbraucher und sorgen für ein Gleichgewicht zwischen Authentizität und Zugänglichkeit.
Markteinblick in Deutschland für lizenzierte Fußballartikel
In Deutschland wird ein starkes Wachstum bei lizenzierten Fußballartikeln erwartet. Dies ist auf das fortschrittliche Fußball-Ökosystem und den hohen Qualitäts- und Teamtreue-Faktor der Verbraucher zurückzuführen. Deutsche Verbraucher bevorzugen technologisch fortschrittliche Bekleidung, wie beispielsweise feuchtigkeitsableitende Trikots, die das Fanerlebnis verbessern und die Nachhaltigkeit fördern. Die Integration von lizenzierten Artikeln in Premium-Clubs und Aftermarket-Optionen unterstützt ein nachhaltiges Marktwachstum.
Marktanteile für lizenzierte Fußballartikel
Die Branche der lizenzierten Fußballartikel wird hauptsächlich von etablierten Unternehmen angeführt, darunter:
- givsport.sk (Italien)
- JOMA SPORT SA (Spanien)
- PUMA SE (Deutschland)
- Mitre International (Großbritannien)
- ADIDAS AG (Deutschland)
- Castore (Großbritannien)
- Erreà Sport Spa (Italien)
- New Balance (USA)
- Ergebnisauslosung (UK)
- DRH Sports (Großbritannien)
- Fanatics, Inc. (USA)
- Nike, Inc. (USA)
- MACRON SPA (Italien)
- New Era Cap (USA)
- Under Armour, Inc. (USA)
Was sind die jüngsten Entwicklungen auf dem globalen Markt für lizenzierte Fußballartikel?
- Im August 2024 gab Fanatics, ein weltweit führender Anbieter lizenzierter Sportartikel, eine strategische Partnerschaft mit Belk, einer bekannten US-Kaufhauskette, bekannt. Ziel dieser Zusammenarbeit ist die Erweiterung des Belk-Sortiments durch die Integration des umfangreichen Fanatics-Katalogs mit lizenzierter Sportbekleidung, Trikots, Kopfbedeckungen und Sammlerstücken in die digitalen Plattformen von Belk. Kunden können nun eine breite Palette an Fanartikeln – zunächst mit Fokus auf NCAA-Teams, weitere Ligen folgen – direkt auf Belk.com und in der Belk-App kaufen. Während Belk die Einkaufsoberfläche verwaltet, kümmert sich Fanatics um Auftragsabwicklung und Versand, verbessert die Produktverfügbarkeit und optimiert das Kundenerlebnis.
- Im September 2023 brachte Adidas die X Crazyfast Messi „Las Estrellas“ Schuhe auf den Markt, eine eindrucksvolle Hommage an Lionel Messis WM-Sieg 2022 mit Argentinien. Diese Signature Edition erschien kurz nach seinen „Infinito“-Schuhen und besticht durch ein von der argentinischen Flagge inspiriertes Design in Weiß, Blau und Gold sowie drei Sterne an der Ferse, die für die argentinischen WM-Titel stehen. Die Schuhe zeigen außerdem Messis Logo, seine ikonische Nummer 10 und ein GOAT-Symbol. Diese Veröffentlichung unterstreicht die nachhaltige Wirkung von Spielerwerbung und Erinnerungsartikeln auf die Fanbindung und die Produktnachfrage.
- Im August 2023 verlängerte Academy Sports + Outdoors seine Partnerschaft mit Fanatics, einem weltweit führenden Anbieter lizenzierter Sportartikel, um sein Sortiment an offiziell lizenzierten Produkten deutlich zu erweitern. Diese erweiterte Zusammenarbeit ermöglicht Academy-Kunden – sowohl im Geschäft als auch online – den Zugriff auf ein breiteres Sortiment an Fanartikeln, darunter Bekleidung, Trikots, Kopfbedeckungen und Neuheiten von Top-Marken wie Nike, adidas, Mitchell & Ness, New Era und anderen. Die Initiative unterstreicht das Engagement beider Unternehmen, die Produktvielfalt und -verfügbarkeit zu verbessern, beginnend mit NCAA-Artikeln und im Laufe der Saison auf weitere Ligen ausgeweitet.
- Im Juni 2023 präsentierte Adidas offiziell die neuen Cricket-Trikots des indischen Teams für alle drei Formate – Tests, ODIs und T20Is – und feierte damit sein Debüt als offizieller Trikotsponsor der indischen Cricket-Nationalmannschaft. Die Markteinführung fiel mit dem Finale der Test-Weltmeisterschaft zusammen, bei dem das Team die neuen Trikots erstmals präsentierte. Die Trikots wurden mit Adidas‘ charakteristischen Performance-Technologien wie AEROREADY entwickelt und bestehen zu 100 % aus recycelten Materialien. Sie spiegeln eine Mischung aus Innovation, Nachhaltigkeit und Nationalstolz wider. Diese Veröffentlichung unterstreicht zudem den wachsenden Einfluss lizenzierter Sportbekleidung auf den globalen Märkten, einschließlich Fußball und anderen Mannschaftssportarten.
- Im Mai 2023 gab PUMA eine wegweisende mehrjährige Partnerschaft mit der Formel 1 bekannt und wird offizieller Lizenzpartner und exklusiver Händler an der Rennstrecke. Diese Vereinbarung gibt PUMA das Recht, Bekleidung, Schuhe und Accessoires der F1-Marke zu produzieren und ab 2024 offizielle Fanartikel aller zehn F1-Teams an den Rennstrecken zu verkaufen. PUMA wird außerdem die Uniformen für die F1-Mitarbeiter ausstatten und Lifestyle-Kollektionen auf den Markt bringen, die Motorsportkultur mit Streetwear verbinden. Dieser Schritt spiegelt einen allgemeinen Trend großer Sportbekleidungsmarken wider, ihre Lizenzportfolios im globalen Sport, einschließlich Fußball, zu erweitern.
SKU-
Erhalten Sie Online-Zugriff auf den Bericht zur weltweit ersten Market Intelligence Cloud

- Interaktives Datenanalyse-Dashboard
- Unternehmensanalyse-Dashboard für Chancen mit hohem Wachstumspotenzial
- Zugriff für Research-Analysten für Anpassungen und Abfragen
- Konkurrenzanalyse mit interaktivem Dashboard
- Aktuelle Nachrichten, Updates und Trendanalyse
- Nutzen Sie die Leistungsfähigkeit der Benchmark-Analyse für eine umfassende Konkurrenzverfolgung
Inhaltsverzeichnis
- Einführung
- ZIELE DER STUDIE
- MARKTDEFINITION
- Überblick über den globalen Markt für lizenzierte Fußballartikel
- EINSCHRÄNKUNG
- ABGEDECKTE MÄRKTE
- Marktsegmentierung
- ABGEDECKTE MÄRKTE
- Geographischer Geltungsbereich
- Jahre, die für die Studie berücksichtigt wurden
- Währung und Preisgestaltung
- DBMR-Dreibeindatenvalidierungsmodell
- PRODUKTTYP LEBENSLINIENKURVE
- MULTIVARIATE MODELLIERUNG
- Primärinterviews mit wichtigen Meinungsführern
- DBMR-Marktpositionsraster
- Markt-Endbenutzer-Abdeckungsraster
- DBMR-MARKT-HERAUSFORDERUNGSMATRIX
- Lieferantenanteilsanalyse
- IMPORT-EXPORT-DATEN
- Sekundärquellen
- Annahmen
- ZUSAMMENFASSUNG
- Premium-Einblicke
- Marktübersicht
- Treiber
- Wachsendes Interesse von Teenagern an Outdoor-Sportarten
- Steigerung des Sportsponsorings
- Steigendes Bewusstsein für Fitness und einen gesunden Lebensstil
- Technologische Fortschritte bei Sportartikeln
- Zunehmende Produktion attraktiverer und modischerer Sportbekleidung und Accessoires
- Einschränkungen
- Hohe Kosten für die Ausrüstung
- Probleme kleiner Unternehmen beim Aufbau eines stabilen Kundenstamms
- Gelegenheiten
- Zunehmende Aktivitäten von Sportligen weltweit
- Steigende Nachfrage nach Leichtbaumaterialien und fortschrittlichen Technologien
- Herausforderungen
- Erlaubnispflicht für den Verkauf lizenzierter Fußballartikel
- Schwierigkeiten bei der Herstellung einzigartiger Produkte
- Auswirkungen von COVID 19 auf den globalen Markt für lizenzierte Fußballartikel
- ANALYSE der Auswirkungen von COVID-19 auf den globalen Markt für lizenzierte Fußballartikel
- NACHWIRKUNGEN VON COVID-19 UND REGIERUNGSINITIATIVE ZUR ANSPRUCHUNG DES WELTWEITEN MARKTES FÜR LIZENZIERTE FUSSBALLARTIKEL
- STRATERGISCHE ENTSCHEIDUNGEN FÜR HERSTELLER NACH COVID-19, UM WETTBEWERBSFÄHIGE MARKTANTEILE ZU GEWINNEN
- AUSWIRKUNGEN auf den Preis
- AUSWIRKUNGEN AUF DIE NACHFRAGE
- AUSWIRKUNGEN AUF DIE LIEFERKETTE
- ABSCHLUSS
- Globaler Markt für lizenzierte Fußballartikel, NACH Produkttyp
- Überblick
- Fußbekleidung
- Bekleidung
- T-Shirts
- Trikots
- Kapuzenpullover
- Hose
- andere
- Zubehör
- Handgelenk- und Stirnbänder
- Handschuhe
- Kappen
- Helme
- andere
- Sonstiges
- Globaler Markt für lizenzierte Fußballartikel, nach Vertriebskanal
- Überblick
- E-Commerce
- Kaufhäuser
- Fachgeschäfte
- SUPERMARKT & HYPERMARKT
- andere
- Globaler Markt für lizenzierte Fußballartikel, nach Endverbraucher
- Überblick
- Männer
- Frauen
- Kinder
- GLOBALER MARKT FÜR LIZENZIERTE FUSSBALL-MERCHANDISE, NACH GEOGRAFIE
- Überblick
- Nordamerika
- UNS
- KANADA
- MEXIKO
- Europa
- Deutschland
- Vereinigtes Königreich
- Frankreich
- Italien
- Spanien
- Niederlande
- Belgien
- Russland
- Truthahn
- Schweiz
- Restliches Europa
- Asien-Pazifik
- CHINA
- INDIEN
- JAPAN
- SÜDKOREA
- AUSTRALIEN & NEUSEELAND
- Indonesien
- Hongkong
- Singapur
- Malaysia
- Thailand
- Philippinen
- Taiwan
- Restlicher Asien-Pazifik-Raum
- Naher Osten und Afrika
- Vereinigte Arabische Emirate
- Ägypten
- Israel
- Südafrika
- Saudi-Arabien
- Rest des Nahen Ostens und Afrikas
- Südamerika
- Brasilien
- Argentinien
- Rest von Südamerika
- GLOBALER MARKT FÜR LIZENZIERTE FUSSBALL-MERCHANDISE: UNTERNEHMENSLANDSCHAFT
- Unternehmensaktienanalyse: GLOBAL
- Unternehmensaktienanalyse: Nordamerika
- Unternehmensaktienanalyse: EUROPA
- Unternehmensaktienanalyse: Asien-Pazifik
- Fusionen und Übernahmen
- ERWEITERUNGEN
- SWOT-Analyse
- Firmenprofile
- Under Armour, Inc.
- FIRMEN-SNAPSHOTsHot
- Umsatzanalyse
- Unternehmensaktienanalyse
- Produktportfolio
- JÜNGSTES UPDATE
- Joma
- FIRMEN-SNAPSHOTsHot
- Unternehmensaktienanalyse
- Produktportfolio
- JÜNGSTES UPDATE
- Mitre International
- FIRMEN-SNAPSHOTsHot
- Unternehmensaktienanalyse
- Produktportfolio
- JÜNGSTES UPDATE
- PUMA SE
- FIRMEN-SNAPSHOTsHot
- Umsatzanalyse
- Unternehmensaktienanalyse
- Produktportfolio
- LETZTE UPDATES
- DRH Sports
- FIRMEN-SNAPSHOTsHot
- Unternehmensaktienanalyse
- Produktportfolio
- JÜNGSTES UPDATE
- Fanatics (International) Ltd
- FIRMEN-SNAPSHOTsHot
- Produktportfolio
- JÜNGSTES UPDATE
- Erreà Sport Spa
- FIRMEN-SNAPSHOTsHot
- Produktportfolio
- JÜNGSTES UPDATE
- New Era Cap
- FIRMEN-SNAPSHOTsHot
- Produktportfolio
- JÜNGSTES UPDATE
- adidas AG
- FIRMEN-SNAPSHOTsHot
- Umsatzanalyse
- Produktportfolio
- JÜNGSTES UPDATE
- Castore
- FIRMEN-SNAPSHOTsHot
- Produktportfolio
- JÜNGSTES UPDATE
- Givova Sport
- FIRMEN-SNAPSHOTsHot
- Produktportfolio
- JÜNGSTES UPDATE
- MACRON SPA
- FIRMEN-SNAPSHOTsHot
- Produktportfolio
- LETZTE UPDATES
- Neues Gleichgewicht
- FIRMEN-SNAPSHOTsHot
- Produktportfolio
- LETZTE UPDATES
- Nike, Inc.
- FIRMEN-SNAPSHOTsHot
- Umsatzanalyse
- Produktportfolio
- JÜNGSTES UPDATE
- Ergebnis Unentschieden
- FIRMEN-SNAPSHOTsHot
- Produktportfolio
- JÜNGSTES UPDATE
- Fragebogen
- VERWANDTE BERICHTE
Tabellenverzeichnis
TABELLE 1 IMPORTDATEN FÜR Produkt: 610520 Hemden aus Chemiefasern, für Männer oder Knaben, gewirkt oder gehäkelt (ausgenommen Nachthemden, T-Shirts, ...HS-CODE: 6015 (TAUSEND USD)
TABELLE 2 Exportdaten des Produkts: 610520 Hemden aus Chemiefasern, für Männer oder Knaben, gestrickt oder gehäkelt (ausgenommen Nachthemden, T-Shirts, ...HS-CODE: 6015 (TAUSEND USD)
TABELLE 3 Adipositasrate nach Ländern (2021)
TABELLE 4 Weltweiter Markt für lizenzierte Fußballartikel, NACH Produkttyp, 2019–2028 (in Mio. USD)
TABELLE 5 Weltweiter Markt für lizenzierte Fußballartikel, NACH Produkttyp, 2019–2028 (Millionen Einheiten)
TABELLE 6 Weltweiter Markt für lizenzierte Fußballartikel, Schuhe NACH Region, 2019–2028 (Mio. USD)
TABELLE 7 Weltweiter Markt für lizenzierte Fußballartikel, Schuhe NACH Regionen, 2019–2028 (Millionen Einheiten)
TABELLE 8 Weltweiter Markt für lizenzierte Fußballartikel, Bekleidung NACH Regionen, 2019–2028 (Mio. USD)
TABELLE 9 Weltweiter Markt für lizenzierte Fußballartikel, Bekleidung NACH Regionen, 2019–2028 (Millionen Einheiten)
TABELLE 10 Weltweiter Markt für lizenzierte Fußballartikel, Bekleidung NACH Produkttyp, 2019–2028 (Mio. USD)
TABELLE 11 Weltweiter Markt für lizenzierte Fußballartikel, Zubehör NACH Regionen, 2019–2028 (Mio. USD)
TABELLE 12 Weltweiter Markt für lizenzierte Fußballartikel, Zubehör NACH Regionen, 2019–2028 (Millionen Einheiten)
TABELLE 13 Weltweiter Markt für lizenzierte Fußballartikel, Zubehör NACH Produkttyp, 2019–2028 (Mio. USD)
TABELLE 14 Weltweiter Markt für lizenzierte Fußballartikel, sonstige NACH Regionen, 2019–2028 (Mio. USD)
TABELLE 15 Weltweiter Markt für lizenzierte Fußballartikel, sonstige NACH Regionen, 2019–2028 (Millionen Einheiten)
TABELLE 16 Weltweiter Markt für lizenzierte Fußballartikel, NACH Vertriebskanal, 2019–2028 (in Mio. USD)
TABELLE 17 Weltweiter Markt für lizenzierte Fußballartikel, E-Commerce NACH Regionen, 2019–2028 (Mio. USD)
TABELLE 18 Weltweiter Markt für lizenzierte Fußballartikel, Kaufhäuser NACH Region, 2019–2028 (Mio. USD)
TABELLE 19 Weltweiter Markt für lizenzierte Fußballartikel, Fachgeschäfte NACH Region, 2019–2028 (Mio. USD)
TABELLE 20 Weltweiter Markt für lizenzierte Fußballartikel, SUPERMARKT & HYPERMARKT NACH Region, 2019–2028 (Mio. USD)
TABELLE 21 Weltweiter Markt für lizenzierte Fußballartikel, sonstige NACH Regionen, 2019–2028 (Mio. USD)
TABELLE 22 Weltweiter Markt für lizenzierte Fußballartikel, NACH Endverbraucher, 2019–2028 (in Mio. USD)
TABELLE 23 Weltweiter Markt für lizenzierte Fußballartikel, Männer, NACH Region, 2019–2028 (Mio. USD)
TABELLE 24 Weltweiter Markt für lizenzierte Fußballartikel, Frauen NACH Regionen, 2019–2028 (Mio. USD)
TABELLE 25 Weltweiter Markt für lizenzierte Fußballartikel, Kinder, NACH Regionen, 2019–2028 (Mio. USD)
TABELLE 26 GLOBALER Markt für lizenzierte Fußballartikel, nach Regionen, 2018–2027 (MILLIONEN USD)
TABELLE 27 GLOBALER Markt für lizenzierte Fußballartikel, nach Regionen, 2018–2027 (MILLIONEN EINHEITEN)
TABELLE 28 Nordamerikanischer Markt für lizenzierte Fußballartikel, NACH LAND, 2019–2028 (in Mio. USD)
TABELLE 29 Nordamerikanischer Markt für lizenzierte Fußballartikel, NACH LAND, 2019–2028 (MILLIONEN EINHEITEN)
TABELLE 30: Nordamerikanischer Markt für lizenzierte Fußballartikel, nach Produkttyp, 2019–2028 (in Mio. USD)
TABELLE 31 Nordamerikanischer Markt für lizenzierte Fußballartikel, nach Produkttyp, 2019–2028 (Millionen Einheiten)
TABELLE 32 Nordamerikanischer Markt für lizenzierte Fußballartikel, Bekleidung NACH Produkttyp, 2019–2028 (in Mio. USD)
TABELLE 33 Nordamerikanischer Markt für lizenzierte Fußballartikel, Zubehör NACH Produkttyp, 2019–2028 (in Mio. USD)
TABELLE 34 Nordamerikanischer Markt für lizenzierte Fußballartikel, NACH Vertriebskanal, 2019–2028 (in Mio. USD)
TABELLE 35: Nordamerikanischer Markt für lizenzierte Fußballartikel, NACH Endverbraucher, 2019–2028 (in Mio. USD)
TABELLE 36 US-Markt für lizenzierte Fußballartikel, nach Produkttyp, 2019–2028 (in Millionen USD)
TABELLE 37 US-Markt für lizenzierte Fußballartikel, nach Produkttyp, 2019–2028 (Millionen Einheiten)
TABELLE 38 US-Markt für lizenzierte Fußballartikel, Bekleidung NACH Produkttyp, 2019–2028 (in Millionen USD)
TABELLE 39 US-Markt für lizenzierte Fußballartikel, Zubehör NACH Produkttyp, 2019–2028 (in Millionen USD)
TABELLE 40 US-Markt für lizenzierte Fußballartikel, NACH Vertriebskanal, 2019–2028 (in Mio. USD)
TABELLE 41 US-Markt für lizenzierte Fußballartikel, NACH Endverbraucher, 2019–2028 (in Millionen USD)
TABELLE 42 KANADA – Markt für lizenzierte Fußballartikel, nach Produkttyp, 2019–2028 (in Millionen USD)
TABELLE 43 KANADA – Markt für lizenzierte Fußballartikel, nach Produkttyp, 2019–2028 (Millionen Einheiten)
TABELLE 44 KANADA – Markt für lizenzierte Fußballartikel, Bekleidung NACH Produkttyp, 2019–2028 (in Millionen USD)
TABELLE 45 KANADA – Markt für lizenzierte Fußballartikel, Zubehör NACH Produkttyp, 2019–2028 (in Millionen USD)
TABELLE 46 KANADA – Markt für lizenzierte Fußballartikel, NACH Vertriebskanal, 2019–2028 (in Millionen USD)
TABELLE 47 KANADA – Markt für lizenzierte Fußballartikel, NACH Endverbraucher, 2019–2028 (in Millionen USD)
TABELLE 48 MEXIKO – Markt für lizenzierte Fußballartikel, nach Produkttyp, 2019–2028 (in Millionen USD)
TABELLE 49 MEXIKO – Markt für lizenzierte Fußballartikel, nach Produkttyp, 2019–2028 (Millionen Einheiten)
TABELLE 50 MEXIKO – Markt für lizenzierte Fußballartikel, Bekleidung NACH Produkttyp, 2019–2028 (in Millionen USD)
TABELLE 51 MEXIKO – Markt für lizenzierte Fußballartikel, Zubehör NACH Produkttyp, 2019–2028 (in Millionen USD)
TABELLE 52 MEXIKO – Markt für lizenzierte Fußballartikel, NACH Vertriebskanal, 2019–2028 (in Millionen USD)
TABELLE 53 MEXIKO – Markt für lizenzierte Fußballartikel, NACH Endverbraucher, 2019–2028 (in Millionen USD)
TABELLE 54: Europäischer Markt für lizenzierte Fußballartikel, NACH LÄNDERN, 2019–2028
TABELLE 55 – Europäischer Markt für lizenzierte Fußballartikel, NACH LÄNDERN, 2019–2028 (Millionen Einheiten)
TABELLE 56 – Europäischer Markt für lizenzierte Fußballartikel, nach Produkttyp, 2019–2028 (in Mio. USD)
TABELLE 57 – Europäischer Markt für lizenzierte Fußballartikel, nach Produkttyp, 2019–2028 (Millionen Einheiten)
TABELLE 58 Europäischer Markt für lizenzierte Fußballartikel, Bekleidung NACH Produkttyp, 2019–2028 (in Millionen USD)
TABELLE 59 Europäischer Markt für lizenzierte Fußballartikel, Zubehör NACH Produkttyp, 2019–2028 (in Mio. USD)
TABELLE 60: Europäischer Markt für lizenzierte Fußballartikel, NACH Vertriebskanal, 2019–2028 (in Millionen USD)
TABELLE 61 – Europäischer Markt für lizenzierte Fußballartikel, NACH Endverbraucher, 2019–2028 (in Millionen USD)
TABELLE 62 Deutscher Markt für lizenzierte Fußballartikel, nach Produkttyp, 2019–2028 (in Mio. USD)
TABELLE 63 Deutscher Markt für lizenzierte Fußballartikel, nach Produkttyp, 2019–2028 (Millionen Einheiten)
TABELLE 64 Deutscher Markt für lizenzierte Fußballartikel, Bekleidung NACH Produkttyp, 2019–2028 (in Millionen USD)
TABELLE 65 Deutscher Markt für lizenzierte Fußballartikel, Zubehör NACH Produkttyp, 2019–2028 (in Millionen USD)
TABELLE 66 Deutscher Markt für lizenzierte Fußballartikel, NACH Vertriebskanal, 2019–2028 (in Mio. USD)
TABELLE 67 Deutscher Markt für lizenzierte Fußballartikel, NACH Endverbraucher, 2019–2028 (in Millionen USD)
TABELLE 68. Britischer Markt für lizenzierte Fußballartikel, nach Produkttyp, 2019–2028 (in Millionen USD)
TABELLE 69. Britischer Markt für lizenzierte Fußballartikel, nach Produkttyp, 2019–2028 (Millionen Einheiten)
TABELLE 70. Britischer Markt für lizenzierte Fußballartikel, Bekleidung NACH Produkttyp, 2019–2028 (in Millionen USD)
TABELLE 71. Britischer Markt für lizenzierte Fußballartikel, Zubehör NACH Produkttyp, 2019–2028 (in Millionen USD)
TABELLE 72. Britischer Markt für lizenzierte Fußballartikel, NACH Vertriebskanal, 2019–2028 (in Millionen USD)
TABELLE 73. Britischer Markt für lizenzierte Fußballartikel, NACH Endverbraucher, 2019–2028 (in Millionen USD)
TABELLE 74: Französischer Markt für lizenzierte Fußballartikel, nach Produkttyp, 2019–2028 (in Millionen USD)
TABELLE 75: Französischer Markt für lizenzierte Fußballartikel, nach Produkttyp, 2019–2028 (Millionen Einheiten)
TABELLE 76: Französischer Markt für lizenzierte Fußballartikel, Bekleidung NACH Produkttyp, 2019–2028 (in Millionen USD)
TABELLE 77: Französischer Markt für lizenzierte Fußballartikel, Zubehör NACH Produkttyp, 2019–2028 (in Millionen USD)
TABELLE 78: Französischer Markt für lizenzierte Fußballartikel, NACH Vertriebskanal, 2019–2028 (in Millionen USD)
TABELLE 79: Französischer Markt für lizenzierte Fußballartikel, NACH Endverbraucher, 2019–2028 (in Millionen USD)
TABELLE 80 Italienischer Markt für lizenzierte Fußballartikel, nach Produkttyp, 2019–2028 (in Millionen USD)
TABELLE 81 Italienischer Markt für lizenzierte Fußballartikel, nach Produkttyp, 2019–2028 (Millionen Einheiten)
TABELLE 82 Italienischer Markt für lizenzierte Fußballartikel, Bekleidung NACH Produkttyp, 2019–2028 (in Millionen USD)
TABELLE 83 Italienischer Markt für lizenzierte Fußballartikel, Zubehör NACH Produkttyp, 2019–2028 (in Millionen USD)
TABELLE 84 Italienischer Markt für lizenzierte Fußballartikel, NACH Vertriebskanal, 2019–2028 (in Millionen USD)
TABELLE 85: Italienischer Markt für lizenzierte Fußballartikel, NACH Endverbraucher, 2019–2028 (in Millionen USD)
TABELLE 86 Spanischer Markt für lizenzierte Fußballartikel, nach Produkttyp, 2019–2028 (in Millionen USD)
TABELLE 87 Spanischer Markt für lizenzierte Fußballartikel, nach Produkttyp, 2019–2028 (Millionen Einheiten)
TABELLE 88 Spanischer Markt für lizenzierte Fußballartikel, Bekleidung NACH Produkttyp, 2019–2028 (in Millionen USD)
TABELLE 89 Spanischer Markt für lizenzierte Fußballartikel, Zubehör NACH Produkttyp, 2019–2028 (in Millionen USD)
TABELLE 90 Spanischer Markt für lizenzierte Fußballartikel, NACH Vertriebskanal, 2019–2028 (in Millionen USD)
TABELLE 91 Spanischer Markt für lizenzierte Fußballartikel, NACH Endverbraucher, 2019–2028 (in Millionen USD)
TABELLE 92 Niederländischer Markt für lizenzierte Fußballartikel, nach Produkttyp, 2019–2028 (in Mio. USD)
TABELLE 93 Niederländischer Markt für lizenzierte Fußballartikel, nach Produkttyp, 2019–2028 (Millionen Einheiten)
TABELLE 94 Niederländischer Markt für lizenzierte Fußballartikel, Bekleidung NACH Produkttyp, 2019–2028 (in Millionen USD)
TABELLE 95 Niederländischer Markt für lizenzierte Fußballartikel, Zubehör NACH Produkttyp, 2019–2028 (in Millionen USD)
TABELLE 96 Niederländischer Markt für lizenzierte Fußballartikel, NACH Vertriebskanal, 2019–2028 (in Mio. USD)
TABELLE 97 Niederländischer Markt für lizenzierte Fußballartikel, NACH Endverbraucher, 2019–2028 (in Millionen USD)
TABELLE 98 Belgischer Markt für lizenzierte Fußballartikel, nach Produkttyp, 2019–2028 (in Mio. USD)
TABELLE 99 Belgischer Markt für lizenzierte Fußballartikel, nach Produkttyp, 2019–2028 (Millionen Einheiten)
TABELLE 100 Belgischer Markt für lizenzierte Fußballartikel, Bekleidung NACH Produkttyp, 2019–2028 (in Millionen USD)
TABELLE 101 Belgischer Markt für lizenzierte Fußballartikel, Zubehör NACH Produkttyp, 2019–2028 (in Millionen USD)
TABELLE 102 Belgischer Markt für lizenzierte Fußballartikel, NACH Vertriebskanal, 2019–2028 (in Millionen USD)
TABELLE 103 Belgischer Markt für lizenzierte Fußballartikel, NACH Endverbraucher, 2019–2028 (in Millionen USD)
TABELLE 104 Russischer Markt für lizenzierte Fußballartikel, nach Produkttyp, 2019–2028 (in Millionen USD)
TABELLE 105 – Russischer Markt für lizenzierte Fußballartikel, nach Produkttyp, 2019–2028 (Millionen Einheiten)
TABELLE 106 Russischer Markt für lizenzierte Fußballartikel, Bekleidung NACH Produkttyp, 2019–2028 (in Millionen USD)
TABELLE 107 Russischer Markt für lizenzierte Fußballartikel, Zubehör NACH Produkttyp, 2019–2028 (in Millionen USD)
TABELLE 108 Russischer Markt für lizenzierte Fußballartikel, NACH Vertriebskanal, 2019–2028 (in Millionen USD)
TABELLE 109 Russischer Markt für lizenzierte Fußballartikel, NACH Endverbraucher, 2019–2028 (in Millionen USD)
TABELLE 110 Türkischer Markt für lizenzierte Fußballartikel, nach Produkttyp, 2019–2028 (in Mio. USD)
TABELLE 111 Türkischer Markt für lizenzierte Fußballartikel, nach Produkttyp, 2019–2028 (Millionen Einheiten)
TABELLE 112 Türkischer Markt für lizenzierte Fußballartikel, Bekleidung NACH Produkttyp, 2019–2028 (in Mio. USD)
TABELLE 113 Türkischer Markt für lizenzierte Fußballartikel, Zubehör NACH Produkttyp, 2019–2028 (in Mio. USD)
TABELLE 114 Türkischer Markt für lizenzierte Fußballartikel, NACH Vertriebskanal, 2019–2028 (in Mio. USD)
TABELLE 115: Türkischer Markt für lizenzierte Fußballartikel, NACH Endverbraucher, 2019–2028 (in Mio. USD)
TABELLE 116 Schweizer Markt für lizenzierte Fußballartikel, nach Produkttyp, 2019–2028 (in Millionen USD)
TABELLE 117 Schweizer Markt für lizenzierte Fußballartikel, nach Produkttyp, 2019–2028 (Millionen Einheiten)
TABELLE 118 Schweizer Markt für lizenzierte Fußballartikel, Bekleidung NACH Produkttyp, 2019–2028 (in Millionen USD)
TABELLE 119 Schweizer Markt für lizenzierte Fußballartikel, Zubehör NACH Produkttyp, 2019–2028 (in Millionen USD)
TABELLE 120 Schweizer Markt für lizenzierte Fußballartikel, NACH Vertriebskanal, 2019–2028 (in Millionen USD)
TABELLE 121 Schweizer Markt für lizenzierte Fußballartikel, NACH Endverbraucher, 2019–2028 (in Millionen USD)
TABELLE 122 Markt für lizenzierte Fußballartikel im übrigen Europa, nach Produkttyp, 2019–2028 (in Mio. USD)
TABELLE 123 – Markt für lizenzierte Fußballartikel im übrigen Europa, nach Produkttyp, 2019–2028 (Millionen Einheiten)
TABELLE 124 Markt für lizenzierte Fußballartikel im asiatisch-pazifischen Raum, NACH LAND, 2019–2028 (in Millionen USD)
TABELLE 125 Markt für lizenzierte Fußballartikel im asiatisch-pazifischen Raum, NACH LAND, 2019–2028 (MILLIONEN EINHEITEN)
TABELLE 126 Markt für lizenzierte Fußballartikel im asiatisch-pazifischen Raum, nach Produkttyp, 2019–2028 (in Mio. USD)
TABELLE 127 Markt für lizenzierte Fußballartikel im asiatisch-pazifischen Raum, nach Produkttyp, 2019–2028 (Millionen Einheiten)
TABELLE 128 Markt für lizenzierte Fußballartikel im asiatisch-pazifischen Raum, Bekleidung NACH Produkttyp, 2019–2028 (in Mio. USD)
TABELLE 129 Markt für lizenzierte Fußballartikel im asiatisch-pazifischen Raum, Zubehör NACH Produkttyp, 2019–2028 (in Mio. USD)
TABELLE 130 Markt für lizenzierte Fußballartikel im asiatisch-pazifischen Raum, NACH Vertriebskanal, 2019–2028 (in Mio. USD)
TABELLE 131 Markt für lizenzierte Fußballartikel im asiatisch-pazifischen Raum, NACH Endverbraucher, 2019–2028 (in Mio. USD)
TABELLE 132 CHINA – Markt für lizenzierte Fußballartikel, nach Produkttyp, 2019–2028 (in Millionen USD)
TABELLE 133 CHINA – Markt für lizenzierte Fußballartikel, nach Produkttyp, 2019–2028 (Millionen Einheiten)
TABELLE 134 CHINA – Markt für lizenzierte Fußballartikel, Bekleidung NACH Produkttyp, 2019–2028 (in Millionen USD)
TABELLE 135 CHINA – Markt für lizenzierte Fußballartikel, Zubehör NACH Produkttyp, 2019–2028 (in Millionen USD)
TABELLE 136 CHINA – Markt für lizenzierte Fußballartikel, NACH Vertriebskanal, 2019–2028 (in Millionen USD)
TABELLE 137 CHINA – Markt für lizenzierte Fußballartikel, NACH Endverbraucher, 2019–2028 (in Millionen USD)
TABELLE 138 INDIEN – Markt für lizenzierte Fußballartikel, nach Produkttyp, 2019–2028 (in Millionen USD)
TABELLE 139 INDIEN – Markt für lizenzierte Fußballartikel, nach Produkttyp, 2019–2028 (Millionen Einheiten)
TABELLE 140 INDIEN – Markt für lizenzierte Fußballartikel, Bekleidung NACH Produkttyp, 2019–2028 (in Millionen USD)
TABELLE 141 INDIEN – Markt für lizenzierte Fußballartikel, Zubehör NACH Produkttyp, 2019–2028 (in Millionen USD)
TABELLE 142 INDIEN – Markt für lizenzierte Fußballartikel, NACH Vertriebskanal, 2019–2028 (in Millionen USD)
TABELLE 143 INDIEN – Markt für lizenzierte Fußballartikel, NACH Endverbraucher, 2019–2028 (in Millionen USD)
TABELLE 144 JAPANISCHER Markt für lizenzierte Fußballartikel, nach Produkttyp, 2019–2028 (in Millionen USD)
TABELLE 145 JAPANISCHER Markt für lizenzierte Fußballartikel, nach Produkttyp, 2019–2028 (Millionen Einheiten)
TABELLE 146 JAPANISCHER Markt für lizenzierte Fußballartikel, Bekleidung NACH Produkttyp, 2019–2028 (in Millionen USD)
TABELLE 147 JAPAN – Markt für lizenzierte Fußballartikel, Zubehör NACH Produkttyp, 2019–2028 (in Millionen USD)
TABELLE 148 JAPANISCHER Markt für lizenzierte Fußballartikel, NACH Vertriebskanal, 2019–2028 (in Millionen USD)
TABELLE 149 JAPAN – Markt für lizenzierte Fußballartikel, NACH Endverbraucher, 2019–2028 (in Millionen USD)
TABELLE 150 SÜDKOREA – Markt für lizenzierte Fußballartikel, nach Produkttyp, 2019–2028 (in Millionen USD)
TABELLE 151 SÜDKOREA – Markt für lizenzierte Fußballartikel, nach Produkttyp, 2019–2028 (Millionen Einheiten)
TABELLE 152 SÜDKOREA – Markt für lizenzierte Fußballartikel, Bekleidung NACH Produkttyp, 2019–2028 (in Millionen USD)
TABELLE 153 SÜDKOREA – Markt für lizenzierte Fußballartikel, Zubehör NACH Produkttyp, 2019–2028 (in Millionen USD)
TABELLE 154 SÜDKOREA – Markt für lizenzierte Fußballartikel, NACH Vertriebskanal, 2019–2028 (in Millionen USD)
TABELLE 155 SÜDKOREA – Markt für lizenzierte Fußballartikel, NACH Endverbraucher, 2019–2028 (in Millionen USD)
TABELLE 156 AUSTRALIEN UND NEUSEELAND – Markt für lizenzierte Fußballartikel, nach Produkttyp, 2019–2028 (in Millionen USD)
TABELLE 157 AUSTRALIEN UND NEUSEELAND – Markt für lizenzierte Fußballartikel, nach Produkttyp, 2019–2028 (Millionen Einheiten)
TABELLE 158 AUSTRALIEN UND NEUSEELAND – Markt für lizenzierte Fußballartikel, Bekleidung NACH Produkttyp, 2019–2028 (in Millionen USD)
TABELLE 159 AUSTRALIEN UND NEUSEELAND – Markt für lizenzierte Fußballartikel, Zubehör NACH Produkttyp, 2019–2028 (in Millionen USD)
TABELLE 160 AUSTRALIEN UND NEUSEELAND – Markt für lizenzierte Fußballartikel, NACH Vertriebskanal, 2019–2028 (in Millionen USD)
TABELLE 161 AUSTRALIEN UND NEUSEELAND – Markt für lizenzierte Fußballartikel, NACH Endverbraucher, 2019–2028 (in Millionen USD)
TABELLE 162 Indonesischer Markt für lizenzierte Fußballartikel, nach Produkttyp, 2019–2028 (in Millionen USD)
TABELLE 163 Indonesischer Markt für lizenzierte Fußballartikel, nach Produkttyp, 2019–2028 (Millionen Einheiten)
TABELLE 164 Indonesischer Markt für lizenzierte Fußballartikel, Bekleidung NACH Produkttyp, 2019–2028 (in Millionen USD)
TABELLE 165 Indonesischer Markt für lizenzierte Fußballartikel, Zubehör NACH Produkttyp, 2019–2028 (in Millionen USD)
TABELLE 166 Indonesischer Markt für lizenzierte Fußballartikel, NACH Vertriebskanal, 2019–2028 (in Millionen USD)
TABELLE 167 Indonesischer Markt für lizenzierte Fußballartikel, NACH Endverbraucher, 2019–2028 (in Millionen USD)
TABELLE 168 Hongkonger Markt für lizenzierte Fußballartikel, nach Produkttyp, 2019–2028 (in Millionen USD)
TABELLE 169 Hongkonger Markt für lizenzierte Fußballartikel, nach Produkttyp, 2019–2028 (Millionen Einheiten)
TABELLE 170 Hongkonger Markt für lizenzierte Fußballartikel, Bekleidung NACH Produkttyp, 2019–2028 (in Millionen USD)
TABELLE 171 Hongkonger Markt für lizenzierte Fußballartikel, Zubehör NACH Produkttyp, 2019–2028 (in Millionen USD)
TABELLE 172 Hongkonger Markt für lizenzierte Fußballartikel, NACH Vertriebskanal, 2019–2028 (in Millionen USD)
TABELLE 173 Hongkonger Markt für lizenzierte Fußballartikel, NACH Endverbraucher, 2019–2028 (in Millionen USD)
TABELLE 174 Singapurischer Markt für lizenzierte Fußballartikel, nach Produkttyp, 2019–2028 (in Mio. USD)
TABELLE 175 – Singapurischer Markt für lizenzierte Fußballartikel, nach Produkttyp, 2019–2028 (Millionen Einheiten)
TABELLE 176 Singapurischer Markt für lizenzierte Fußballartikel, Bekleidung NACH Produkttyp, 2019–2028 (in Millionen USD)
TABELLE 177 Singapurischer Markt für lizenzierte Fußballartikel, Zubehör NACH Produkttyp, 2019–2028 (in Millionen USD)
TABELLE 178 Singapurischer Markt für lizenzierte Fußballartikel, NACH Vertriebskanal, 2019–2028 (in Mio. USD)
TABELLE 179 Singapurischer Markt für lizenzierte Fußballartikel, NACH Endverbraucher, 2019–2028 (in Mio. USD)
TABELLE 180 Malaysias Markt für lizenzierte Fußballartikel, nach Produkttyp, 2019–2028 (in Millionen USD)
TABELLE 181 – Malaysischer Markt für lizenzierte Fußballartikel, nach Produkttyp, 2019–2028 (Millionen Einheiten)
TABELLE 182 Malaysias Markt für lizenzierte Fußballartikel, Bekleidung NACH Produkttyp, 2019–2028 (in Millionen USD)
TABELLE 183 Malaysia – Markt für lizenzierte Fußballartikel, Zubehör NACH Produkttyp, 2019–2028 (in Millionen USD)
TABELLE 184 Malaysischer Markt für lizenzierte Fußballartikel, NACH Vertriebskanal, 2019–2028 (in Millionen USD)
TABELLE 185 Malaysias Markt für lizenzierte Fußballartikel, NACH Endverbraucher, 2019–2028 (in Millionen USD)
TABELLE 186 Thailands Markt für lizenzierte Fußballartikel, nach Produkttyp, 2019–2028 (in Mio. USD)
TABELLE 187 Thailand – Markt für lizenzierte Fußballartikel, nach Produkttyp, 2019–2028 (Millionen Einheiten)
TABELLE 188 Thailand – Markt für lizenzierte Fußballartikel, Bekleidung NACH Produkttyp, 2019–2028 (in Millionen USD)
TABELLE 189 Thailand – Markt für lizenzierte Fußballartikel, Zubehör NACH Produkttyp, 2019–2028 (in Millionen USD)
TABELLE 190 Thailand – Markt für lizenzierte Fußballartikel, NACH Vertriebskanal, 2019–2028 (in Millionen USD)
TABELLE 191 Thailand – Markt für lizenzierte Fußballartikel, NACH Endverbraucher, 2019–2028 (in Millionen USD)
TABELLE 192: Philippinischer Markt für lizenzierte Fußballartikel, nach Produkttyp, 2019–2028 (in Mio. USD)
TABELLE 193 – Markt für lizenzierte Fußballartikel auf den Philippinen, nach Produkttyp, 2019–2028 (Millionen Einheiten)
TABELLE 194 Philippinischer Markt für lizenzierte Fußballartikel, Bekleidung NACH Produkttyp, 2019–2028 (in Mio. USD)
TABELLE 195 Philippinischer Markt für lizenzierte Fußballartikel, Zubehör NACH Produkttyp, 2019–2028 (in Mio. USD)
TABELLE 196 Philippinischer Markt für lizenzierte Fußballartikel, NACH Vertriebskanal, 2019–2028 (in Mio. USD)
TABELLE 197: Philippinischer Markt für lizenzierte Fußballartikel, NACH Endverbraucher, 2019–2028 (in Mio. USD)
TABELLE 198 Taiwans Markt für lizenzierte Fußballartikel, nach Produkttyp, 2019–2028 (in Millionen USD)
TABELLE 199 Taiwans Markt für lizenzierte Fußballartikel, nach Produkttyp, 2019–2028 (Millionen Einheiten)
TABELLE 200 Taiwans Markt für lizenzierte Fußballartikel, Bekleidung NACH Produkttyp, 2019–2028 (in Millionen USD)
TABELLE 201 Taiwans Markt für lizenzierte Fußballartikel, Zubehör NACH Produkttyp, 2019–2028 (in Millionen USD)
TABELLE 202 Taiwans Markt für lizenzierte Fußballartikel, NACH Vertriebskanal, 2019–2028 (in Millionen USD)
TABELLE 203 Taiwans Markt für lizenzierte Fußballartikel, NACH Endverbraucher, 2019–2028 (in Millionen USD)
TABELLE 204 Restlicher Markt für lizenzierte Fußballartikel im asiatisch-pazifischen Raum, nach Produkttyp, 2019–2028 (in Mio. USD)
TABELLE 205 Restlicher Markt für lizenzierte Fußballartikel im asiatisch-pazifischen Raum, nach Produkttyp, 2019–2028 (Millionen Einheiten)
TABELLE 206 Markt für lizenzierte Fußballartikel im Nahen Osten und in Afrika, NACH LÄNDERN, 2019–2028 (in Millionen USD)
TABELLE 207 Markt für lizenzierte Fußballartikel im Nahen Osten und in Afrika, NACH LÄNDERN, 2019–2028 (MILLIONEN EINHEITEN)
TABELLE 208 Markt für lizenzierte Fußballartikel im Nahen Osten und in Afrika, nach Produkttyp, 2019–2028 (in Mio. USD)
TABELLE 209 Markt für lizenzierte Fußballartikel im Nahen Osten und in Afrika, NACH Produkttyp, 2019–2028 (Millionen Einheiten)
TABELLE 210 Markt für lizenzierte Fußballartikel im Nahen Osten und in Afrika, Bekleidung nach Produkttyp, 2019–2028 (in Mio. USD)
TABELLE 211 Markt für lizenzierte Fußballartikel im Nahen Osten und Afrika, Zubehör nach Produkttyp, 2019–2028 (in Mio. USD)
TABELLE 212 Markt für lizenzierte Fußballartikel im Nahen Osten und in Afrika, nach Vertriebskanal, 2019–2028 ((Mio. USD)
TABELLE 213 Markt für lizenzierte Fußballartikel im Nahen Osten und in Afrika, nach Endverbraucher, 2019–2028 ((Mio. USD)
TABELLE 214 Markt für lizenzierte Fußballartikel in den Vereinigten Arabischen Emiraten, nach Produkttyp, 2019–2028 (in Mio. USD)
TABELLE 215 Markt für lizenzierte Fußballartikel in den Vereinigten Arabischen Emiraten, NACH Produkttyp, 2019–2028 (Millionen Einheiten)
TABELLE 216 Markt für lizenzierte Fußballartikel in den Vereinigten Arabischen Emiraten, Bekleidung nach Produkttyp, 2019–2028 (in Mio. USD)
TABELLE 217 Markt für lizenzierte Fußballartikel in den Vereinigten Arabischen Emiraten, Zubehör nach Produkttyp, 2019–2028 (in Mio. USD)
TABELLE 218 Markt für lizenzierte Fußballartikel in den Vereinigten Arabischen Emiraten, nach Vertriebskanal, 2019–2028 ((Mio. USD)
TABELLE 219 Markt für lizenzierte Fußballartikel in den Vereinigten Arabischen Emiraten, nach Endverbraucher, 2019–2028 ((Mio. USD)
TABELLE 220. Ägyptischer Markt für lizenzierte Fußballartikel, nach Produkttyp, 2019–2028 (in Mio. USD)
TABELLE 221. Ägyptischer Markt für lizenzierte Fußballartikel, NACH Produkttyp, 2019–2028 (Millionen Einheiten)
TABELLE 222. Ägyptischer Markt für lizenzierte Fußballartikel, Bekleidung nach Produkttyp, 2019–2028 (in Mio. USD)
TABELLE 223. Ägyptischer Markt für lizenzierte Fußballartikel, Zubehör nach Produkttyp, 2019–2028 (in Mio. USD)
TABELLE 224. Ägyptischer Markt für lizenzierte Fußballartikel, nach Vertriebskanal, 2019–2028 ((Mio. USD)
TABELLE 225. Markt für lizenzierte Fußballartikel in Ägypten, nach Endverbraucher, 2019–2028 ((Mio. USD)
TABELLE 226 Israelischer Markt für lizenzierte Fußballartikel, nach Produkttyp, 2019–2028 (in Mio. USD)
TABELLE 227 Israelischer Markt für lizenzierte Fußballartikel, NACH Produkttyp, 2019–2028 (Millionen Einheiten)
TABELLE 228 Israelischer Markt für lizenzierte Fußballartikel, Bekleidung nach Produkttyp, 2019–2028 (in Mio. USD)
TABELLE 229 Israelischer Markt für lizenzierte Fußballartikel, Zubehör nach Produkttyp, 2019–2028 (in Mio. USD)
TABELLE 230 Israelischer Markt für lizenzierte Fußballartikel, nach Vertriebskanal, 2019–2028 ((Mio. USD)
TABELLE 231 Israelischer Markt für lizenzierte Fußballartikel, nach Endverbraucher, 2019–2028 ((Mio. USD)
TABELLE 232 Südafrikanischer Markt für lizenzierte Fußballartikel, nach Produkttyp, 2019–2028 (in Mio. USD)
TABELLE 233 Südafrikanischer Markt für lizenzierte Fußballartikel, NACH Produkttyp, 2019–2028 (Millionen Einheiten)
TABELLE 234 Südafrikanischer Markt für lizenzierte Fußballartikel, Bekleidung nach Produkttyp, 2019–2028 (in Mio. USD)
TABELLE 235 Südafrikanischer Markt für lizenzierte Fußballartikel, Zubehör nach Produkttyp, 2019–2028 (in Mio. USD)
TABELLE 236 Südafrikanischer Markt für lizenzierte Fußballartikel, nach Vertriebskanal, 2019–2028 ((Mio. USD)
TABELLE 237 Südafrikanischer Markt für lizenzierte Fußballartikel, nach Endverbraucher, 2019–2028 ((Mio. USD)
TABELLE 238 Markt für lizenzierte Fußballartikel in Saudi-Arabien, nach Produkttyp, 2019–2028 (in Mio. USD)
TABELLE 239 Saudi-Arabien: Markt für lizenzierte Fußballartikel, NACH Produkttyp, 2019–2028 (Millionen Einheiten)
TABELLE 240 Saudi-Arabien – Markt für lizenzierte Fußballartikel, Bekleidung nach Produkttyp, 2019–2028 (in Mio. USD)
TABELLE 241 Saudi-Arabien: Markt für lizenzierte Fußballartikel, Zubehör nach Produkttyp, 2019–2028 (in Mio. USD)
TABELLE 242 Markt für lizenzierte Fußballartikel in Saudi-Arabien, nach Vertriebskanal, 2019–2028 ((Mio. USD)
TABELLE 243 Markt für lizenzierte Fußballartikel in Saudi-Arabien, nach Endverbraucher, 2019–2028 ((Mio. USD)
TABELLE 244 Restlicher Markt für lizenzierte Fußballartikel im Nahen Osten und in Afrika, nach Produkttyp, 2019–2028 (in Mio. USD)
TABELLE 245 Restlicher Markt für lizenzierte Fußballartikel im Nahen Osten und Afrika, NACH Produkttyp, 2019–2028 (Millionen Einheiten)
TABELLE 246 Südamerikanischer Markt für lizenzierte Fußballartikel, NACH LAND, 2019–2028 (in Mio. USD)
TABELLE 247 Südamerikanischer Markt für lizenzierte Fußballartikel, NACH LAND, 2019–2028 (MILLIONEN EINHEITEN)
TABELLE 248 Südamerikanischer Markt für lizenzierte Fußballartikel, nach Produkttyp, 2019–2028 (in Mio. USD)
TABELLE 249 Südamerikanischer Markt für lizenzierte Fußballartikel, NACH Produkttyp, 2019–2028 (Millionen Einheiten)
TABELLE 250 Südamerikanischer Markt für lizenzierte Fußballartikel, Bekleidung nach Produkttyp, 2019–2028 (in Mio. USD)
TABELLE 251 Südamerikanischer Markt für lizenzierte Fußballartikel, Zubehör nach Produkttyp, 2019–2028 (in Mio. USD)
TABELLE 252 Südamerikanischer Markt für lizenzierte Fußballartikel, nach Vertriebskanal, 2019–2028 ((Mio. USD)
TABELLE 253 Südamerikanischer Markt für lizenzierte Fußballartikel, nach Endverbraucher, 2019–2028 ((Mio. USD)
TABELLE 254 Brasilianischer Markt für lizenzierte Fußballartikel, nach Produkttyp, 2019–2028 (in Mio. USD)
TABELLE 255 Brasilianischer Markt für lizenzierte Fußballartikel, NACH Produkttyp, 2019–2028 (Millionen Einheiten)
TABELLE 256 Brasilianischer Markt für lizenzierte Fußballartikel, Bekleidung nach Produkttyp, 2019–2028 (in Mio. USD)
TABELLE 257 Brasilianischer Markt für lizenzierte Fußballartikel, Zubehör nach Produkttyp, 2019–2028 (in Mio. USD)
TABELLE 258 Brasilianischer Markt für lizenzierte Fußballartikel, nach Vertriebskanal, 2019–2028 ((Mio. USD)
TABELLE 259 Brasilianischer Markt für lizenzierte Fußballartikel, nach Endverbraucher, 2019–2028 ((Mio. USD)
TABELLE 260 – Argentinischer Markt für lizenzierte Fußballartikel, nach Produkttyp, 2019–2028 (in Mio. USD)
TABELLE 261. Argentinischer Markt für lizenzierte Fußballartikel, NACH Produkttyp, 2019–2028 (Millionen Einheiten)
TABELLE 262 – Argentinischer Markt für lizenzierte Fußballartikel, Bekleidung nach Produkttyp, 2019–2028 (in Mio. USD)
TABELLE 263. Argentinischer Markt für lizenzierte Fußballartikel, Zubehör nach Produkttyp, 2019–2028 (in Mio. USD)
TABELLE 264 – Argentinischer Markt für lizenzierte Fußballartikel, nach Vertriebskanal, 2019–2028 ((Mio. USD)
TABELLE 265 – Argentinischer Markt für lizenzierte Fußballartikel, nach Endverbraucher, 2019–2028 ((Mio. USD)
TABELLE 266 Restlicher südamerikanischer Markt für lizenzierte Fußballartikel, nach Produkttyp, 2019–2028 (in Mio. USD)
TABELLE 267 Restlicher südamerikanischer Markt für lizenzierte Fußballartikel, NACH Produkttyp, 2019–2028 (Millionen Einheiten)
Abbildungsverzeichnis
ABBILDUNG 1 GLOBALER Markt für lizenzierte Fußballartikel: Segmentierung
ABBILDUNG 2 GLOBALER MARKT FÜR LIZENZIERTE FUSSBALL-MERCHANDISE: Datentriangulation
ABBILDUNG 3 GLOBALER MARKT FÜR LIZENZIERTE FUSSBALL-MERCHANDISE: DROC-ANALYSE
ABBILDUNG 4 GLOBALER MARKT FÜR LIZENZIERTE FUSSBALL-MERCHANDISE: GLOBALE VS. REGIONALE MARKTANALYSE
ABBILDUNG 5 GLOBALER MARKT FÜR LIZENZIERTE FUSSBALL-MERCHANDISE: UNTERNEHMENSANALYSE
ABBILDUNG 6 GLOBALER MARKT FÜR LIZENZIERTE FUSSBALL-MERCHANDISE: DIE PRODUKTTYP-LEBENSLINIENKURVE
ABBILDUNG 7 GLOBALER MARKT FÜR LIZENZIERTE FUSSBALL-MERCHANDISE: DEMOGRAFISCHE INTERVIEWS
ABBILDUNG 8 GLOBALER LIZENZIERTER FUSSBALL-MERCHANDISE-MARKT: DBMR-MARKTPOSITIONSRASTER
ABBILDUNG 9 GLOBALER LIZENZIERTER FUSSBALL-MERCHANDISE-Markt: MARKT-ENDBENUTZER-ABDECKUNGSRASTER
ABBILDUNG 10 GLOBALER MARKT FÜR LIZENZIERTE FUSSBALL-MERCHANDISE: DIE MARKT-HERAUSFORDERUNGSMATRIX
ABBILDUNG 11 GLOBALER MARKT FÜR LIZENZIERTE FUSSBALL-MERCHANDISE: Analyse der Anbieteranteile
ABBILDUNG 12 Weltweiter Markt für lizenzierte Fußballartikel: SEGMENTIERUNG
ABBILDUNG 13: Nordamerika wird voraussichtlich den globalen Markt für lizenzierte Fußballartikel dominieren und im Prognosezeitraum von 2021 bis 2028 mit der höchsten jährlichen Wachstumsrate wachsen.
ABBILDUNG 14 Technologische Fortschritte bei Sportartikeln treiben den globalen Markt für lizenzierte Fußballartikel im Prognosezeitraum von 2021 bis 2028 an
ABBILDUNG 15 Es wird erwartet, dass Bekleidung in den Jahren 2021 und 2028 den größten Anteil am globalen Markt für lizenzierte Fußballartikel ausmacht
ABBILDUNG 16 Nordamerika ist der am schnellsten wachsende Markt für Hersteller von lizenziertem Fußballartikel im Prognosezeitraum von 2021 bis 2028
ABBILDUNG 17 TREIBER, EINSCHRÄNKUNGEN, CHANCEN UND HERAUSFORDERUNGEN DES GLOBALEN MÄRKTES FÜR LIZENZIERTE FUSSBALL-MERKMALE
ABBILDUNG 18 Globales Sportsponsoring und -investitionen (2015–2019)
ABBILDUNG 19 Weltweiter Markt für lizenzierte Fußballartikel: NACH Produkttyp, 2020
ABBILDUNG 20 Weltweiter Markt für lizenzierte Fußballartikel: NACH Vertriebskanal, 2020
ABBILDUNG 21 Weltweiter Markt für lizenzierte Fußballartikel: NACH Endverbraucher, 2020
ABBILDUNG 22 GLOBALER Markt für lizenzierte Fußballartikel: SNAPSHOT (2020)
ABBILDUNG 23 GLOBALER Markt für lizenzierte Fußballartikel: nach Geografie (2020)
ABBILDUNG 24 GLOBALER Markt für lizenzierte Fußballartikel: nach Geografie (2021 und 2028)
ABBILDUNG 25 GLOBALER Markt für lizenzierte Fußballartikel: nach Geografie (2020 und 2028)
ABBILDUNG 26 GLOBALER Markt für lizenzierte Fußballartikel: nach Produkttyp (2021–2028)
ABBILDUNG 27 NORDAMERIKANISCHER Markt für lizenzierte Fußballartikel: SNAPSHOT (2020)
ABBILDUNG 28 Markt für lizenzierte Fußballartikel in Nordamerika: nach LAND (2020)
ABBILDUNG 29 Markt für lizenzierte Fußballartikel in Nordamerika: nach LAND (2021 und 2028)
ABBILDUNG 30 Markt für lizenzierte Fußballartikel in Nordamerika: nach LAND (2020 und 2028)
ABBILDUNG 31 Markt für lizenzierte Fußballartikel in Nordamerika: nach QUELLE (2021–2028)
ABBILDUNG 32 EUROPA: Markt für lizenzierte Fußballartikel: SNAPSHOT (2020)
ABBILDUNG 33 EUROPA – Markt für lizenzierte Fußballartikel: nach LAND (2020)
ABBILDUNG 34 EUROPA – Markt für lizenzierte Fußballartikel: nach LAND (2021 und 2028)
ABBILDUNG 35 EUROPA – Markt für lizenzierte Fußballartikel: nach LAND (2020 und 2028)
ABBILDUNG 36 EUROPA – Markt für lizenzierte Fußballartikel: nach TYP (2021–2028)
ABBILDUNG 37 Markt für lizenzierte Fußballartikel im asiatisch-pazifischen Raum: ÜBERBLICK (2020)
ABBILDUNG 38 Markt für lizenzierte Fußballartikel im asiatisch-pazifischen Raum: nach LAND (2020)
ABBILDUNG 39 Markt für lizenzierte Fußballartikel im asiatisch-pazifischen Raum: nach LAND (2021 und 2028)
ABBILDUNG 40 Markt für lizenzierte Fußballartikel im asiatisch-pazifischen Raum: nach LAND (2020 und 2028)
ABBILDUNG 41 Markt für lizenzierte Fußballartikel im asiatisch-pazifischen Raum: nach QUELLE (2021–2028)
ABBILDUNG 42 Markt für lizenzierte Fußballartikel im Nahen Osten und Afrika: ÜBERBLICK (2020)
ABBILDUNG 43 Markt für lizenzierte Fußballartikel im Nahen Osten und Afrika: nach Ländern (2020)
ABBILDUNG 44 Markt für lizenzierte Fußballartikel im Nahen Osten und Afrika: nach Ländern (2021 und 2028)
ABBILDUNG 45 Markt für lizenzierte Fußballartikel im Nahen Osten und Afrika: nach Ländern (2020 und 2028)
ABBILDUNG 46 Markt für lizenzierte Fußballartikel im Nahen Osten und Afrika: nach QUELLE (2021–2028)
ABBILDUNG 47 SÜDAMERIKANISCHER Markt für lizenzierte Fußballartikel: SNAPSHOT (2020)
ABBILDUNG 48 SÜDAMERIKANISCHER Markt für lizenzierte Fußballartikel: nach LAND (2020)
ABBILDUNG 49 SÜDAMERIKANISCHER Markt für lizenzierte Fußballartikel: nach LAND (2021 und 2028)
ABBILDUNG 50 SÜDAMERIKANISCHER Markt für lizenzierte Fußballartikel: nach LAND (2020 und 2028)
ABBILDUNG 51 SÜDAMERIKANISCHER Markt für lizenzierte Fußballartikel: nach QUELLE (2021–2028)
ABBILDUNG 52 GLOBALER MARKT FÜR LIZENZIERTE FUSSBALL-MERCHANDISE: Unternehmensanteil 2020 (%)
ABBILDUNG 53 NORD-AMERIKANISCHER MARKT FÜR LIZENZIERTE FUSSBALL-MERCHANDISE: UNTERNEHMENSANTEIL 2020 (%)
ABBILDUNG 54 EUROPÄISCHER MARKT FÜR LIZENZIERTE FUSSBALL-MERCHANDISE: Unternehmensanteil 2020 (%)
ABBILDUNG 55 MARKT FÜR LIZENZIERTE FUSSBALLARTIKEL IM ASIATISCH-PAZIFISCHEN RAUM: UNTERNEHMENSANTEIL 2020 (%)
Forschungsmethodik
Die Datenerfassung und Basisjahresanalyse werden mithilfe von Datenerfassungsmodulen mit großen Stichprobengrößen durchgeführt. Die Phase umfasst das Erhalten von Marktinformationen oder verwandten Daten aus verschiedenen Quellen und Strategien. Sie umfasst die Prüfung und Planung aller aus der Vergangenheit im Voraus erfassten Daten. Sie umfasst auch die Prüfung von Informationsinkonsistenzen, die in verschiedenen Informationsquellen auftreten. Die Marktdaten werden mithilfe von marktstatistischen und kohärenten Modellen analysiert und geschätzt. Darüber hinaus sind Marktanteilsanalyse und Schlüsseltrendanalyse die wichtigsten Erfolgsfaktoren im Marktbericht. Um mehr zu erfahren, fordern Sie bitte einen Analystenanruf an oder geben Sie Ihre Anfrage ein.
Die wichtigste Forschungsmethodik, die vom DBMR-Forschungsteam verwendet wird, ist die Datentriangulation, die Data Mining, die Analyse der Auswirkungen von Datenvariablen auf den Markt und die primäre (Branchenexperten-)Validierung umfasst. Zu den Datenmodellen gehören ein Lieferantenpositionierungsraster, eine Marktzeitlinienanalyse, ein Marktüberblick und -leitfaden, ein Firmenpositionierungsraster, eine Patentanalyse, eine Preisanalyse, eine Firmenmarktanteilsanalyse, Messstandards, eine globale versus eine regionale und Lieferantenanteilsanalyse. Um mehr über die Forschungsmethodik zu erfahren, senden Sie eine Anfrage an unsere Branchenexperten.
Anpassung möglich
Data Bridge Market Research ist ein führendes Unternehmen in der fortgeschrittenen formativen Forschung. Wir sind stolz darauf, unseren bestehenden und neuen Kunden Daten und Analysen zu bieten, die zu ihren Zielen passen. Der Bericht kann angepasst werden, um Preistrendanalysen von Zielmarken, Marktverständnis für zusätzliche Länder (fordern Sie die Länderliste an), Daten zu klinischen Studienergebnissen, Literaturübersicht, Analysen des Marktes für aufgearbeitete Produkte und Produktbasis einzuschließen. Marktanalysen von Zielkonkurrenten können von technologiebasierten Analysen bis hin zu Marktportfoliostrategien analysiert werden. Wir können so viele Wettbewerber hinzufügen, wie Sie Daten in dem von Ihnen gewünschten Format und Datenstil benötigen. Unser Analystenteam kann Ihnen auch Daten in groben Excel-Rohdateien und Pivot-Tabellen (Fact Book) bereitstellen oder Sie bei der Erstellung von Präsentationen aus den im Bericht verfügbaren Datensätzen unterstützen.

