Asia Pacific Business Process Outsourcing Market
Tamaño del mercado en miles de millones de dólares
Tasa de crecimiento anual compuesta (CAGR) :
% 
 USD
63.76 Billion
USD
128.53 Billion
2024
2032
USD
63.76 Billion
USD
128.53 Billion
2024
2032
| 2025 –2032 | |
| USD 63.76 Billion | |
| USD 128.53 Billion | |
| % | |
|
Segmentación del mercado de externalización de procesos empresariales (BPO) en Asia-Pacífico por tipo de externalización (offshore, nearshore, onshore), servicio (procesamiento de voz, telemarketing, visualización 3D, edición de imágenes, dotación de personal virtual), aplicación (recursos humanos, ventas y marketing, finanzas y contabilidad, compras y cadena de suministro, instalaciones y administración, atención al cliente, formación, ingeniería de productos), modelo de implementación (nube, local), tamaño de la organización (grandes empresas, pymes), propiedad (cautiva, de terceros), enfoque de externalización (best shore, servicios agrupados, contrato, pago por servicio), usuario final (TI, telecomunicaciones, fabricación, BFSI, gobierno y defensa, transporte y logística, comercio minorista y comercio electrónico, viajes y hostelería, sanidad, energía y servicios públicos, educación, otros): tendencias del sector y previsiones hasta 2032.
Tamaño del mercado de subcontratación de procesos empresariales (BPO) en Asia-Pacífico
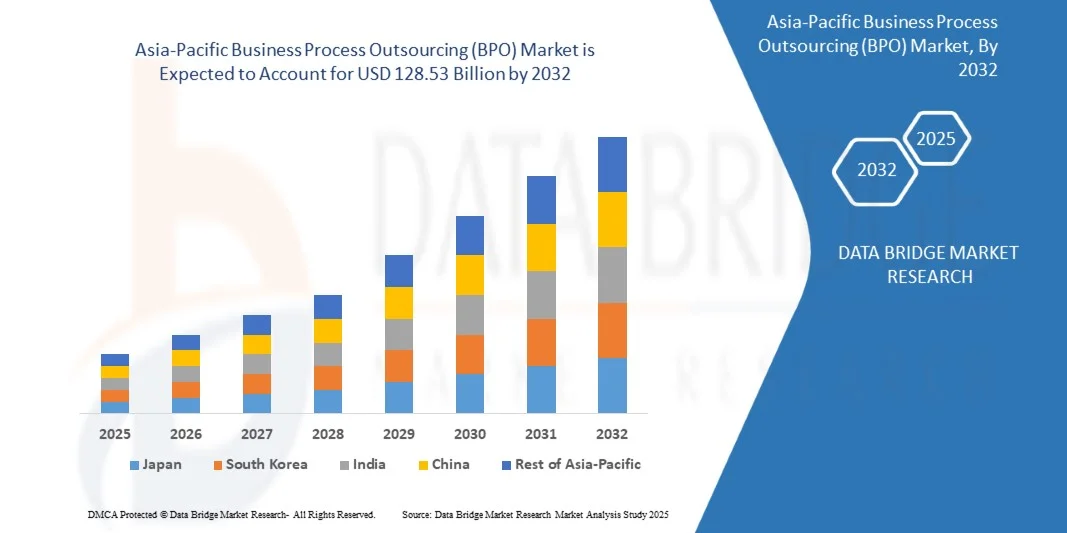
- Se espera que el mercado de subcontratación de procesos comerciales (BPO) de Asia-Pacífico alcance los USD 128,53 mil millones para 2032 desde los USD 63,76 mil millones en 2024, creciendo con una CAGR saludable del 9,3% en el período de pronóstico de 2025 a 2032.
- La expansión del mercado BPO de Asia-Pacífico está impulsada por la creciente demanda de optimización de costos, eficiencia operativa y acceso a conocimientos especializados, impulsada por empresas que navegan en paisajes competitivos y se centran en sus competencias centrales.
- Este crecimiento se ve impulsado aún más por la integración de tecnologías innovadoras como la Automatización Robótica de Procesos (RPA) para automatizar tareas rutinarias, la Inteligencia Artificial (IA) para mejorar el análisis y la atención al cliente, y las soluciones en la nube para operaciones escalables y flexibles. Estos avances, junto con la creciente necesidad de seguridad de datos y cumplimiento normativo, están expandiendo especialmente los segmentos de la automatización inteligente, la gestión de la experiencia del cliente y la externalización de procesos de conocimiento.
Análisis del mercado de subcontratación de procesos empresariales (BPO) en Asia-Pacífico
- La externalización de procesos de negocio (BPO) en Asia-Pacífico es una solución de servicios disponible comercialmente, diseñada para gestionar y optimizar funciones empresariales no esenciales, desde atención al cliente y recursos humanos hasta finanzas y contabilidad. Estos servicios ofrecen una reducción de costes esencial, mayor eficiencia y acceso a conocimientos especializados, y son fundamentales en diversos sectores como finanzas, salud, comercio minorista y tecnología, satisfaciendo la demanda empresarial de agilidad, escalabilidad y enfoque estratégico en el competitivo panorama de Asia-Pacífico.
- La creciente demanda de BPO en Asia-Pacífico se debe al ritmo acelerado de la transformación digital, la creciente complejidad de las operaciones comerciales y las presiones competitivas en la región, lo que proporciona una columna vertebral operativa crucial para las empresas modernas. Esta demanda se ve respaldada además por innovaciones integradas en los servicios de BPO, como la Automatización Robótica de Procesos (RPA) para la automatización de tareas rutinarias, la Inteligencia Artificial (IA) para el análisis avanzado y la gestión de la experiencia del cliente, y las plataformas en la nube para una prestación de servicios flexible, que mejoran la eficiencia, la toma de decisiones y la calidad del servicio. El impulso en Asia-Pacífico hacia la resiliencia empresarial y la agilidad operativa, impulsado por la creciente volatilidad económica y la necesidad de soluciones escalables, junto con el aumento de las inversiones en iniciativas de transformación digital en las economías emergentes, está impulsando significativamente la adopción de servicios avanzados de BPO en todo el mundo.
- Japón dominó el mercado de BPO en Asia-Pacífico con una destacada cuota de ingresos del 19,93 % en 2024, gracias a su temprana adopción de servicios empresariales avanzados, la alta concentración de sectores clave para el usuario final y las importantes inversiones en transformación digital y experiencia del cliente. Japón, en particular, se ha consolidado como líder gracias a su sólida infraestructura tecnológica, la presencia de importantes proveedores de BPO y la apremiante necesidad de las empresas de gestionar operaciones complejas y distribuidas globalmente y mejorar la eficiencia.
- Se espera que la región de Japón sea la de más rápido crecimiento en el mercado de BPO de Asia-Pacífico, con una CAGR proyectada de 10,4% entre 2025 y 2032, impulsada por su condición de centro de talento y servicios de Asia-Pacífico, la rápida adopción digital y el aumento de las inversiones gubernamentales en iniciativas de ciudades inteligentes y economía digital. La adopción generalizada de soluciones de subcontratación por parte de una gran cantidad de pequeñas y medianas empresas (PYME) está impulsando aún más la demanda de una gama diversa de servicios de BPO escalables y ágiles.
- El segmento Offshore dominó el mercado de subcontratación de procesos comerciales (BPO) de Asia-Pacífico con una participación de mercado del 60,38 % en 2024, debido a la creciente demanda de transformación digital, herramientas de automatización mejoradas y capacidades de integración en diversas plataformas empresariales.
Alcance del informe y segmentación del mercado de subcontratación de procesos de negocio (BPO) en Asia-Pacífico
|
Atributos |
Perspectivas clave del mercado de la subcontratación de procesos empresariales (BPO) |
|
Segmentos cubiertos |
Por tipo de subcontratación : Offshore, Nearshore, Onshore |
|
Países cubiertos |
Asia-Pacífico
|
|
Actores clave del mercado |
|
|
Oportunidades de mercado |
|
|
Conjuntos de información de datos de valor añadido |
Además de los conocimientos sobre escenarios de mercado como valor de mercado, tasa de crecimiento, segmentación, cobertura geográfica y actores principales, los informes de mercado seleccionados por Data Bridge Market Research también incluyen análisis de expertos en profundidad, análisis de precios, análisis de participación de marca, encuesta de consumidores, análisis demográfico, análisis de la cadena de suministro, análisis de la cadena de valor, descripción general de materias primas/consumibles, criterios de selección de proveedores, análisis PESTLE, análisis de Porter y marco regulatorio. |
Tendencias del mercado de subcontratación de procesos empresariales (BPO) en Asia-Pacífico
“Aumento del establecimiento de centros de servicios y del gasto en el sector TI”.
La industria de TI ha crecido exponencialmente, experimentando una rápida evolución en el desarrollo de software, la gestión, las consultorías, los servicios en línea y la externalización de procesos de negocio (BPO). Gracias a las ventajas de coste que ofrece la externalización, países como China, India y Malasia se han posicionado para captar una mayor cuota de mercado de BPO. La externalización de TI se ha adoptado como un método eficaz para ofrecer procesos de negocio, soluciones de infraestructura y servicios de aplicaciones basados en TI.
Por el contrario, se han utilizado modelos de externalización que incluyen SaaS, servicios públicos y soluciones basadas en la nube para mejorar las estrategias de abastecimiento, optimizar los contratos y construir relaciones sostenibles con los proveedores.
Se han integrado avances tecnológicos como la computación en la nube, la IoT, la cadena de bloques y el aprendizaje automático para mejorar la eficiencia y ahorrar tiempo de los empleados, y los principales proveedores de TI están implementando activamente estas tecnologías para respaldar las operaciones de BPO.
Por ejemplo,
- Como informó Reuters en septiembre de 2024, se proyecta que el mercado de los Centros de Capacidad de Asia y el Pacífico (CCG) de la India crecerá de USD 64.600 millones en el año fiscal 2024 a USD 99-105.000 millones para 2030, con empresas como Chevron y Sanofi invirtiendo alrededor de USD 1.400 millones, creando entre 2,5 y 2,8 millones de puestos de trabajo.
- Según informó The Times of India en agosto de 2024, India se está consolidando como un centro en Asia-Pacífico para los países del CCG, atrayendo inversiones gracias a su talento cualificado y su madurez operativa. Se prevé que el sector supere los 100 000 millones de dólares y genere más de 2,5 millones de empleos para 2030.
- Como informó el Financial Times en agosto de 2024, empresas multinacionales como McDonald's, Bupa y Tesco están aprovechando los CCG de la India para operaciones de IA, análisis y automatización, lo que marca un cambio del apoyo centrado en los costos a roles de innovación de alto valor.
En conclusión, todos estos datos indican que todos los sectores se han visto atraídos por los servicios de externalización de procesos de negocio (BPO) y los utilizan para cualquiera de sus funciones empresariales. Las grandes, pequeñas y medianas empresas han incrementado sus presupuestos para la externalización de servicios de TI, lo que genera oportunidades para el mercado de externalización de procesos de negocio (BPO) de Asia-Pacífico.
Dinámica del mercado de subcontratación de procesos empresariales (BPO) en Asia-Pacífico
Conductor
“Creciente necesidad de agilidad empresarial”
A medida que los mercados se vuelven más dinámicos y competitivos, las organizaciones se ven presionadas a adaptarse rápidamente, innovar y mejorar la eficiencia operativa. La BPO permite a las empresas alcanzar estos objetivos al proporcionar soluciones flexibles y escalables que reducen los riesgos y los costos, a la vez que mejoran la capacidad de respuesta al cambio.
Al mismo tiempo, la transformación cultural y las estrategias centradas en el cliente, a menudo lideradas por la alta dirección, están reforzando la transición hacia la externalización como medio para impulsar la colaboración y la innovación. Este creciente enfoque en la agilidad posiciona al BPO como una herramienta estratégica para las empresas que buscan mantenerse competitivas en el disruptivo entorno de Asia-Pacífico.
Por ejemplo,
- En junio de 2020, hubo un aumento en el número de empresas que emplean marketing digital en Japón, ya que una de esas empresas, Dai Nippon Printing Co., Ltd. (DNP), anunció el establecimiento de dos nuevos centros de subcontratación de procesos comerciales (BPO) en Tokio y Fukuoka, en el sur de Japón, para brindar una amplia gama de servicios de BPO a los clientes, incluidas las operaciones de marketing digital.
- En 2020, según el informe Outsource Asia, China registró contratos de externalización por valor de 223.700 millones de dólares con 600 proveedores de servicios de externalización para clientes extranjeros. Además, el gobierno chino ha flexibilizado las restricciones de acceso para extranjeros para impulsar el crecimiento económico del país y el mercado de BPO.
- En septiembre de 2022, un artículo revisado por pares titulado "Business Process Outsourcing (BPO): Current and Future Trends", publicado en International Research in Economics and Finance, destacó un aumento en la adopción de BPO en Australia y el Sudeste Asiático. El estudio destacó cómo las empresas externalizaban cada vez más las funciones de RR. HH., finanzas y atención al cliente para acceder a nuevos mercados y mejorar la eficiencia operativa.
- En julio de 2023, The Economic Times destacó cómo las empresas indias de BPO estaban adoptando cada vez más plataformas en la nube y automatización basada en IA para optimizar la prestación de servicios. El artículo señaló un aumento en la demanda de atención al cliente inteligente y operaciones financieras, especialmente por parte de clientes en Asia-Pacífico y Europa.
La creciente dependencia de las metodologías ágiles para la externalización de procesos de negocio ha acompañado la creciente tendencia hacia ellas. A medida que las empresas de BPO siguen liderando la adopción de prácticas innovadoras, su papel en la facilitación de la agilidad organizacional se ha visto reforzado. Esta evolución en la estrategia operativa se ha reconocido como un factor clave para el crecimiento sostenido del mercado de BPO en Asia-Pacífico.
Restricción/Desafío
Creciente preocupación por la seguridad y la privacidad de los datos
En el panorama digital actual, se ha prestado mayor atención a la seguridad de los datos, especialmente a medida que la externalización de procesos de negocio (BPO) sigue ganando terreno. Las organizaciones han expresado su preocupación por los riesgos de confiar información confidencial a proveedores externos.
Aunque se implementan rutinariamente medidas de protección como el cifrado, los controles de acceso y el enmascaramiento de datos, estas no siempre han sido suficientes para prevenir las infracciones.
Durante la última década, los ciberataques y las fallas internas han comprometido cada vez más los datos empresariales, con riesgos que abarcan desde la manipulación y el robo hasta la manipulación de identidad. Si bien las soluciones BPaaS basadas en tecnologías en la nube han ofrecido ventajas operativas, su mayor superficie de amenaza también ha expuesto a las empresas a vulnerabilidades. En algunos casos, se han producido pérdidas financieras significativas debido tanto a intrusiones externas como a errores internos, ya sean intencionales o accidentales.
Como resultado, las crecientes preocupaciones en torno a la protección de datos han seguido frenando la trayectoria de crecimiento del mercado de BPO de Asia y el Pacífico, lo que subraya la necesidad de contar con marcos de seguridad más resilientes y transparentes.
Por ejemplo,
- En junio de 2020, Cyware Social informó que BlueKai de Oracle expuso datos confidenciales en línea por valor de miles de millones debido a una falla de seguridad. El incidente afectó a una base de datos no segura que contenía información personal como nombres, direcciones de correo electrónico, domicilios particulares y actividad de navegación web. Esta exposición puso de relieve la importancia crucial de proteger los datos confidenciales, planteó inquietudes sobre la transparencia en el manejo de datos y enfatizó la necesidad de contar con medidas sólidas de protección de datos en la externalización y las operaciones digitales.
- En junio de 2020, Oodaloop informó que el gigante informático Cognizant fue víctima de un ataque de ransomware Maze, en el que se accedió y robó datos no cifrados. Este incidente puso de manifiesto las vulnerabilidades en los marcos de ciberseguridad corporativos y subrayó la importancia de implementar medidas sólidas de protección de datos y respuesta ante incidentes.
- En junio de 2025, según el Times of India, dos empleados de la empresa estadounidense de subcontratación de procesos de negocio (BPO) TaskUs, con sede en India, accedieron ilegalmente a datos confidenciales de clientes de Coinbase. La filtración, revelada en un informe presentado ante la SEC en mayo de 2025, afectó a nombres, datos de contacto, números de seguro social parcialmente enmascarados, imágenes de identificación e historial de transacciones. Coinbase estimó los costes de la remediación entre 180 y 400 millones de dólares, mientras que TaskUs despidió a los empleados y suspendió las operaciones de Coinbase en Indore.
- En septiembre de 2020, WIRED UK informó que la empresa de externalización londinense Virtual Mail Room sufrió una grave vulneración de la privacidad, que expuso más de 50.000 cartas confidenciales —incluidas comunicaciones sensibles de bancos, ayuntamientos y organismos gubernamentales— en línea debido a la falta de medidas de seguridad. El incidente planteó serias preocupaciones sobre el cumplimiento del RGPD y puso de relieve los riesgos asociados a una protección de datos inadecuada en las operaciones de externalización.
La creciente preocupación por la seguridad de los datos, impulsada tanto por ciberamenazas externas como por vulnerabilidades internas, ha aumentado la presión sobre los proveedores de BPO para que implementen medidas de seguridad robustas. Si bien los avances tecnológicos han permitido soluciones de externalización más ágiles y escalables, también han ampliado el panorama de riesgos. A medida que las empresas siguen dependiendo de plataformas en la nube y proveedores de servicios externos, la necesidad de prácticas de gestión de datos resilientes, transparentes y seguras sigue siendo crucial para mantener la confianza y apoyar el crecimiento del mercado de BPO en Asia-Pacífico.
Alcance del mercado de subcontratación de procesos empresariales (BPO) en Asia-Pacífico
El mercado de subcontratación de procesos comerciales (BPO) de Asia Pacífico APAC está segmentado en cinco segmentos notables que se basan en el tipo de subcontratación, la aplicación, el tamaño de la organización, el enfoque de subcontratación y el uso final.
• Por tipo de subcontratación
Según el tipo de externalización, el mercado global se segmenta en Offshore, Nearshore y Onshore. En 2025, se prevé que el segmento Offshore domine el mercado gracias a sus importantes ventajas en costes y al acceso a una amplia cartera de talento global, lo que lo convierte en una opción predilecta para las empresas que buscan reducir gastos operativos.
Sin embargo, se proyecta que el segmento Offshore sea el de más rápido crecimiento debido a sus beneficios de proximidad geográfica, alineación cultural y zonas horarias más cercanas, que facilitan una mejor comunicación y colaboración para las empresas que buscan un equilibrio entre ahorro de costos y fluidez operativa.
• Por aplicación
Según la aplicación, el mercado global se segmenta en Recursos Humanos, Ventas y Marketing, Servicios de TI, Finanzas y Contabilidad, Compras y Cadena de Suministro, Instalaciones y Administración, Atención al Cliente, Capacitación e Ingeniería de Producto. En 2025, se prevé que el segmento de Atención al Cliente domine el mercado, principalmente debido a la importancia crucial de la satisfacción del cliente y al alto volumen de interacciones gestionadas por centros de llamadas y servicios de soporte externalizados.
Se espera que el segmento de Recursos Humanos experimente el mayor crecimiento, impulsado por la creciente complejidad de las regulaciones globales de RR.HH., la demanda de adquisición de talento especializado y la necesidad de una administración eficiente de la nómina y los beneficios.
• Por tamaño de la organización
Según el tamaño de la organización, el mercado global se segmenta en grandes empresas y pymes. En 2025, se prevé que el segmento de grandes empresas domine el mercado, impulsado por sus amplias necesidades operativas, sus importantes presupuestos para externalización y su compleja presencia global que requiere soluciones integrales de servicios.
Se espera que el segmento de grandes empresas sea testigo de la CAGR más rápida entre 2025 y 2032, impulsada por la creciente disponibilidad de soluciones BPO rentables y escalables que permiten a las empresas más pequeñas acceder a conocimientos especializados y lograr eficiencias operativas que antes eran exclusivas de las corporaciones más grandes.
• Mediante un enfoque de subcontratación
Basándose en el enfoque de externalización, el mercado global se segmenta en Best Shore, Servicios Combinados, Contratos y Pago por Servicio. En 2025, se prevé que el segmento Contrato domine el mercado, ya que ofrece condiciones claras, alcance definido y costos predecibles, características preferidas por las empresas para alianzas estratégicas a largo plazo.
Se proyecta que el segmento de servicios agrupados será el de más rápido crecimiento, impulsado por la creciente demanda de soluciones integradas que ofrecen múltiples servicios bajo un solo proveedor, simplificando la gestión y a menudo generando mayor eficiencia en los costos y sinergia operativa.
• Por el usuario final
Según el usuario final, el mercado global se segmenta en TI, telecomunicaciones, manufactura, BFSI, gobierno, defensa, transporte, logística, comercio minorista, salud, comercio electrónico, viajes, hotelería, energía, educación, servicios públicos y otros. Se prevé que el sector BFSI (banca, servicios financieros y seguros) domine el mercado en 2025 debido a sus estrictos requisitos regulatorios, el alto volumen de transacciones y la necesidad crítica de operaciones administrativas seguras y eficientes.
Se proyecta que en 2025 el segmento de TI y telecomunicaciones será el de mayor crecimiento. Esto se debe a los rápidos avances tecnológicos, la creciente necesidad de soporte técnico especializado y la demanda de soluciones escalables para gestionar infraestructuras digitales complejas y las cambiantes expectativas de los clientes.
Análisis regional del mercado de subcontratación de procesos empresariales (BPO) en Asia-Pacífico
- Se proyecta que Asia-Pacífico será la región de más rápido crecimiento, impulsada por su posición como centro de externalización en Asia-Pacífico, la rápida digitalización en todos los sectores y la proliferación de pequeñas y medianas empresas (PYME) que buscan soluciones operativas rentables. La creciente necesidad de una mejor experiencia del cliente, operaciones administrativas eficientes y acceso a una amplia red de talento cualificado está acelerando la adopción de servicios de BPO escalables. Países como India, Filipinas y China están a la vanguardia de esta expansión.
- Se espera que Asia-Pacífico y Asia-Pacífico tengan la mayor participación de mercado, sostenida por la alta concentración de industrias clave de usuarios finales, como BFSI, TI y telecomunicaciones, y atención médica.
- El mercado en estas regiones se caracteriza por un fuerte enfoque en la transformación digital, la integración de tecnologías avanzadas como IA y RPA en los servicios de BPO y la necesidad de gestionar operaciones complejas y distribuidas globalmente manteniendo una alta calidad del servicio.
Perspectiva del mercado de BPO en Asia-Pacífico
Se prevé que el mercado de externalización de procesos de negocio (BPO) en Asia-Pacífico alcance los 128.530 millones de dólares en 2032, frente a los 63.760 millones de dólares de 2024, con una sólida tasa de crecimiento anual compuesta (TCAC) del 9,3 % entre 2025 y 2032. El crecimiento de la región se ve impulsado por su posición como centro mundial de externalización, su rápida industrialización y la enorme inversión gubernamental en tecnología e iniciativas de ciudades inteligentes. La creciente complejidad de las operaciones de comercio electrónico, telecomunicaciones y servicios financieros en países como China, Japón e India está impulsando la demanda de plataformas BPO colaborativas basadas en la nube. Muchas empresas de la región están aprovechando la BPO para obtener una ventaja competitiva al acceder a una fuerza laboral cualificada y lograr eficiencias operativas.
- Perspectiva del mercado de BPO en Japón
El mercado japonés de BPO está cobrando un impulso significativo, impulsado por el fuerte enfoque del país en la prestación de servicios de alta calidad, la automatización y la eficiencia de los procesos. Si bien tradicionalmente se centraban en las operaciones internas, las empresas japonesas de los sectores manufacturero y financiero están acelerando su transición hacia el BPO para mejorar la competitividad en Asia-Pacífico y responder con mayor rapidez a los cambios del mercado. Esta demanda se ve impulsada por la necesidad de integrar el BPO con tecnologías avanzadas como la RPA y la IA. Una tendencia clave es la adopción de servicios de BPO para gestionar toda la experiencia del cliente, desde el contacto inicial hasta el soporte posterior al servicio, en línea con los objetivos de excelencia en el servicio.
- Perspectivas del mercado de BPO en China
El mercado chino de BPO posee la mayor participación en Asia-Pacífico, impulsado por su enorme escala de fabricación, su rápido crecimiento económico y las iniciativas gubernamentales como "Hecho en China 2025". Este mercado se ve impulsado por la urgente necesidad de las empresas nacionales de innovar, mejorar la calidad del servicio y gestionar eficientemente los complejos procesos de producción e interacción con el cliente. El auge de las industrias del comercio electrónico y la tecnología ha generado una demanda masiva de soluciones de BPO. La integración de la IA, el análisis de big data y la computación en la nube en los servicios de BPO es una tendencia importante, y tanto proveedores nacionales como internacionales invierten considerablemente para captar este mercado en expansión.
Cuota de mercado de subcontratación de procesos empresariales (BPO) en Asia-Pacífico
La industria de subcontratación de procesos empresariales (BPO) está liderada principalmente por empresas bien establecidas, entre las que se incluyen:
- Accenture (EE. UU.)
- Infosys Limited (India)
- IBM Corporation (EE. UU.)
- Capgemini (Francia)
- Servicios de consultoría Tata Limited (India)
- Cognizant (EE. UU.)
- NTT DATA Corporation (EE. UU.)
- Corporación Concentrix (EE. UU.)
- Wipro Limited (India)
- ADP, Inc. (EE. UU.)
- Genpact (EE. UU.)
- HCL Technologies Limited (India)
- Robert Half Inc. (Estados Unidos)
- Sodexo (Francia)
- Corporación NCR Voyix (EE. UU.)
- Amdocs (EE. UU.)
- TTEC (EE. UU.)
- Intetics Inc. (EE. UU.)
- Tecnologías Plaxonic (India)
- IBT (EAU)
- ALTECiSyS (EE. UU.)
Últimos avances en el mercado de subcontratación de procesos empresariales (BPO) en Asia-Pacífico
- En 2025, la consultoría financiera ayudará a las organizaciones a construir un futuro financiero resiliente en medio de las disrupciones del mercado y la volatilidad empresarial. Apoya a los directores financieros y de ingresos en la gestión de transformaciones complejas, manteniendo al mismo tiempo el rendimiento, la rentabilidad y la estabilidad a largo plazo. Al integrar la IA generativa, permite una toma de decisiones más inteligente y rápida, así como una gestión avanzada de riesgos. Este servicio proporciona estrategias personalizadas para mejorar la resiliencia financiera, optimizar la asignación de capital y garantizar un crecimiento sostenible en un entorno de Asia-Pacífico cada vez más incierto y competitivo.
- En julio de 2025, Infosys Foundation lanzó el Programa Infosys Springboard Livelihood con la aspiración de crear medio millón de empleos en India para 2030. El programa se centra en la creación de empleo para jóvenes de pregrado y posgrado en industrias STEM y no STEM, proporcionando planes de estudio relevantes para la industria en tecnologías de vanguardia como inteligencia artificial y aprendizaje automático.
- En junio de 2023, IBM anunció la adquisición de Apptio, empresa de software, por 4.600 millones de dólares. Esta operación fortalece la posición de IBM en la nube híbrida y la transformación digital impulsada por IA al integrar las soluciones de gestión de TI financiera y operativa de Apptio con su portafolio actual. La adquisición mejora la capacidad de IBM para ofrecer a las empresas una mayor optimización de costos, visibilidad del gasto en TI y una mejor toma de decisiones empresariales en sus inversiones en la nube y tecnología.
- En agosto de 2025, Capgemini firmó un acuerdo para adquirir Cloud4C, especialista en servicios gestionados basados en la automatización para entornos de nube híbrida y soberana. Fundada en 2014, Cloud4C cuenta con una plantilla de aproximadamente 1600 empleados y ofrece una plataforma low-code, preparada para IA y con marcos de trabajo específicos para cada sector. La adquisición reforzará el liderazgo de Capgemini en servicios gestionados en la nube, habilitará marcos de trabajo empaquetados específicos para cada sector y generará oportunidades de venta cruzada. Se espera que la transacción se cierre en los próximos meses, sujeta a las aprobaciones regulatorias.
SKU-
Obtenga acceso en línea al informe sobre la primera nube de inteligencia de mercado del mundo

- Panel de análisis de datos interactivo
- Panel de análisis de empresas para oportunidades con alto potencial de crecimiento
- Acceso de analista de investigación para personalización y consultas
- Análisis de la competencia con panel interactivo
- Últimas noticias, actualizaciones y análisis de tendencias
- Aproveche el poder del análisis de referencia para un seguimiento integral de la competencia
Tabla de contenido
1 INTRODUCCIÓN
1.1 OBJETIVOS DEL ESTUDIO
1.2 DEFINICIÓN DE MERCADO
1.3 DESCRIPCIÓN GENERAL DEL MERCADO DE SUBCONTRATACIÓN DE PROCESOS EMPRESARIALES (BPO) EN ASIA-PACÍFICO
1.4 LIMITACIONES
1.5 MERCADOS CUBIERTOS
2 SEGMENTACIÓN DEL MERCADO
2.1 MERCADOS CUBIERTOS
2.2 ÁMBITO GEOGRÁFICO
2,3 AÑOS CONSIDERADOS PARA EL ESTUDIO
2.4 MONEDA Y PRECIOS
2.5 MODELO DE VALIDACIÓN DE DATOS TRÍPODE DBMR
2.6 MODELADO MULTIVARIADO
2.7 ENTREVISTAS PRINCIPALES CON LÍDERES DE OPINIÓN CLAVE
2.8 CUADRÍCULA DE POSICIÓN DE MERCADO DBMR
2.9 CUADRÍCULA DE APLICACIONES DE ASIA-PACÍFICO
2.1 ANÁLISIS DE PARTICIPACIÓN DE PROVEEDORES DE DBMR
2.11 FUENTES SECUNDARIAS
2.12 SUPUESTOS
3 RESUMEN EJECUTIVO
4 INFORMACIÓN PREMIUM
4.1 EVOLUCIÓN DE LA SUBCONTRATACIÓN DE PROCESOS EMPRESARIALES
4.2 LAS CINCO FUERZAS DE PORTER
4.3 ANÁLISIS PESTEL
4.4 DATOS CONTRACTUALES O ACUERDOS DE BPO POR PARTE DEL GOBIERNO DE LOS EAU Y LOS PARTICIPANTES DEL MERCADO
4.5 NÚMERO DE AGENTES DE CENTROS DE CONTACTO/ETC EN LOS EAU
4.6 DATOS DE TRANSACCIÓN/VOLUMEN DE LLAMADAS ENTRANTES Y SALIENTES EN LOS EAU
4.7 LISTA DE EMPRESAS DE LOS EMIRATOS ÁRABES UNIDOS CON OPERACIONES DE CENTROS DE CONTACTO CAUTIVOS EN LOS EMIRATOS ÁRABES UNIDOS
4.8 PANORAMA EMPRESARIAL EN LOS EMIRATOS ÁRABES UNIDOS SEGÚN LA SOLICITUD
4.8.1 ANÁLISIS DE ACCIONES DE LA EMPRESA: TALENTO Y SERVICIOS DE RRHH
4.8.2 ANÁLISIS DE ACCIONES DE LA EMPRESA: VENTAS Y MARKETING
4.8.3 ANÁLISIS DE ACCIONES DE LA EMPRESA: FINANZAS Y CONTABILIDAD
4.8.4 ANÁLISIS DE LA PARTICIPACIÓN DE LA EMPRESA: ABASTECIMIENTO, ADQUISICIÓN Y CADENA DE SUMINISTRO
4.8.5 ANÁLISIS DE ACCIONES DE LA EMPRESA: CAPACITACIÓN
4.8.6 ANÁLISIS DE ACCIONES DE LA EMPRESA: INSTALACIONES Y ADMINISTRACIÓN
4.8.7 ANÁLISIS DE ACCIONES DE LA EMPRESA: ATENCIÓN AL CLIENTE
4.8.8 ANÁLISIS DE ACCIONES DE LA EMPRESA: INGENIERÍA DE PRODUCTOS
4.9 HOJA DE RUTA TECNOLÓGICA
4.9.1 DESCRIPCIÓN GENERAL
4.9.2 CAMBIO DE RPA A AUTOMATIZACIÓN INTELIGENTE DE PROCESOS (IPA)
4.9.3 IA GENERATIVA Y AUTOMATIZACIÓN CONVERSACIONAL
4.9.4 ANÁLISIS PREDICTIVO Y PRESCRIPTIVO
4.9.5 INFRAESTRUCTURA NATIVA DE LA NUBE Y ENTREGA OMNICANAL
4.9.6 CIBERSEGURIDAD Y CUMPLIMIENTO DESDE EL DISEÑO
4.9.7 RECOMENDACIONES ESTRATÉGICAS PARA CLIENTES E INVERSORES
4.9.8 PERSPECTIVAS FUTURAS
4.1 RESEÑA DEL MERCADO DE SUBCONTRATACIÓN DE PROCESOS EMPRESARIALES (BPO) DEL LADO DEL CLIENTE
4.10.1 PERSPECTIVAS DEL MERCADO Y TRAYECTORIA DE CRECIMIENTO
4.10.2 FACTORES CLAVE DE LA DEMANDA DESDE LA PERSPECTIVA DEL CLIENTE
4.10.3 ASPECTOS DESTACADOS DE LA DEMANDA REGIONAL
4.10.4 INICIATIVAS ESTRATÉGICAS DE LOS PRINCIPALES PROVEEDORES DE BPO
4.10.5 DESAFÍOS QUE IMPACTAN LAS DECISIONES DEL LADO DEL CLIENTE
4.10.6 PERSPECTIVA ESTRATÉGICA PARA LAS EMPRESAS
4.11 FLUJOS DE SUBCONTRATACIÓN DE PAÍS A PAÍS
4.11.1 DESCRIPCIÓN GENERAL
4.11.2 MODELOS DE ENTREGA Y ESTRUCTURA REGIONAL
4.11.3 FACTORES CLAVE QUE INFLUYEN EN EL FLUJO DE SUBCONTRATACIÓN
4.11.4 CONCLUSIÓN
4.12 ANÁLISIS COMPARATIVO DE EMPRESAS
4.12.1 TELEPERFORMANCE
4.12.2 CONCENTRACIÓN
4.12.3 ACCENTURE (DIVISIÓN BPO)
4.12.4 GENPACT
4.12.5 TTEC
4.12.6 PERSPECTIVAS COMPARATIVAS
4.12.7 CONCLUSIÓN
4.13 ESTRUCTURA DE SUBCONTRATACIÓN Y ENTREGA DE ASIA-PACÍFICO
4.14 FLUJO DE SUBCONTRATACIÓN: IMPULSORES Y FACTORES RESTRICTIVOS
4.14.1 DESCRIPCIÓN GENERAL
4.14.2 OPTIMIZACIÓN DE COSTOS Y DISPONIBILIDAD DE TALENTO
4.14.3 AVANCES TECNOLÓGICOS Y CUMPLIMIENTO NORMATIVO
4.14.4 ESTABILIDAD GEOPOLÍTICA Y FACILITACIÓN DEL TRABAJO REMOTO
4.14.5 INFLACIÓN SALARIAL Y POLÍTICAS GUBERNAMENTALES
4.14.6 CONCLUSIÓN
5 COBERTURA REGULATORIA
6 PANORAMA GENERAL DEL MERCADO
6.1 CONDUCTORES
6.1.1 CRECIENTE NECESIDAD DE AGILIDAD EMPRESARIAL
6.1.2 CRECIENTE ENFOQUE EN EL CLIENTE HACIA UNA MAYOR EFICIENCIA, RENTABILIDAD Y EFICIENCIA DE COSTOS
6.1.3 CRECIENTE PREFERENCIA DE LA TECNOLOGÍA EN LA NUBE Y SU IMPORTANCIA EN LA AUTOMATIZACIÓN DE PROCESOS
6.1.4 AVANCES TECNOLÓGICOS (IA, RPA, ANÁLISIS)
6.2 RESTRICCIONES
6.2.1 CRECIENTE PREOCUPACIÓN CON RESPECTO A LA SEGURIDAD DE LOS DATOS Y LA PRIVACIDAD
6.2.2 REGULACIONES GUBERNAMENTALES ESTRICTAS
6.3 OPORTUNIDADES
6.3.1 ENFOQUE EN LA PROGRAMACIÓN DE FLUJOS DE TRABAJO MÚLTIPLES DE NEGOCIOS
6.3.2 APARICIÓN DE TECNOLOGÍAS DIGITALES, A SABER, IA, IOT Y COMPUTACIÓN EN LA NUBE
6.3.3 AUMENTO DEL ESTABLECIMIENTO DE CENTROS DE SERVICIOS Y DEL GASTO DEL SECTOR TI
6.4 DESAFÍOS
6.4.1 FALTA DE MANO DE OBRA CALIFICADA Y ALTA TASA DE DESERCIÓN
6.4.2 LAS INTERRUPCIONES FRECUENTES AFECTAN LA EFICIENCIA OPERATIVA DE LA SUBCONTRATACIÓN DE PROCESOS EMPRESARIALES (BPO)
7 MERCADO DE SUBCONTRATACIÓN DE PROCESOS EMPRESARIALES (BPO) DE ASIA-PACÍFICO, POR TIPO DE SUBCONTRATACIÓN
7.1 DESCRIPCIÓN GENERAL
7.2 COSTA AFUERA
7.3 EN TIERRA
7.4 CERCA DE LA COSTA
8 MERCADO DE SUBCONTRATACIÓN DE PROCESOS EMPRESARIALES (BPO) DE ASIA-PACÍFICO, POR APLICACIÓN
8.1 DESCRIPCIÓN GENERAL
8.2 ATENCIÓN AL CLIENTE
8.3 FINANZAS Y CONTABILIDAD
8.3.1 FINANZAS Y CONTABILIDAD, POR APLICACIÓN
8.3.2 ORDEN DE COBRO
8.3.3 PROCURE TO PAY
8.3.4 REGISTRO PARA INFORMAR
8.3.5 PLANIFICACIÓN Y ANÁLISIS FINANCIERO
8.4 SERVICIOS DE TI
8.5 TALENTO Y SERVICIOS DE RRHH
8.5.1 TALENTO Y SERVICIOS DE RRHH, POR TIPO
8.5.2 OPERACIONES DE EMPLEADOS Y RRHH
8.5.2.1 Operaciones de empleados y RR.HH., por aplicación
8.5.3 NÓMINA Y PENSIONES
8.5.4 SERVICIOS A LOS EMPLEADOS
8.5.5 SERVICIOS DE RELACIONES GUBERNAMENTALES
8.5.6 ADMINISTRACIÓN DE DATOS DE LA FUERZA LABORAL
8.5.7 GESTIÓN DE DATOS MAESTROS
8.5.8 ADQUISICIÓN Y DESARROLLO DE TALENTO
8.5.8.1 Adquisición y desarrollo de talentos, por aplicación
8.5.9 DESARROLLO DEL TALENTO
8.5.9.1 Desarrollo del talento, por aplicación
8.5.10 ORGANIZACIÓN Y GESTIÓN DEL CAMBIO
8.5.11 GESTIÓN DE COMPETENCIAS Y DESARROLLO
8.5.12 DESARROLLO DE CONTENIDO DE APRENDIZAJE E IMPARTICIÓN DE APRENDIZAJE
8.5.13 DISEÑO DE CURRÍCULOS Y CAMPAÑAS
8.5.14 COLABORACIÓN Y GESTIÓN DEL CONOCIMIENTO
8.5.15 PLANIFICACIÓN DE COMPENSACIÓN
8.5.16 OTROS
8.5.17 ADQUISICIÓN DE TALENTO
8.5.17.1 Adquisición de talento, por aplicación
8.5.18 PLANIFICACIÓN DE LA FUERZA LABORAL
8.5.19 SELECCIÓN Y EVALUACIÓN DE CANDIDATOS
8.5.20 OFERTA PARA NUEVOS EMPLEADOS E INCORPORACIÓN
8.5.21 AUTORIZACIONES DE CONTRATACIÓN
8.5.22 ASISTENCIA PARA LA REUBICACIÓN, MOVILIDAD ENTRE EMPRESAS Y EN ASIA-PACÍFICO
8.5.23 OTROS
8.6 VENTAS Y MARKETING
8.7 ABASTECIMIENTO, ADQUISICIÓN Y CADENA DE SUMINISTRO
8.7.1 ABASTECIMIENTO, ADQUISICIÓN Y CADENA DE SUMINISTRO, POR APLICACIÓN
8.7.2 SOPORTE ADMINISTRATIVO DE ADQUISICIONES
8.7.3 FUENTE PARA CONTRATAR
8.7.4 CONSULTORÍA DE ADQUISICIONES
8.8 INGENIERÍA DE PRODUCTO
8.9 INSTALACIONES Y ADMINISTRACIÓN
8.1 ENTRENAMIENTO
9 MERCADO DE SUBCONTRATACIÓN DE PROCESOS EMPRESARIALES (BPO) DE ASIA-PACÍFICO, POR TAMAÑO DE LA ORGANIZACIÓN
9.1 DESCRIPCIÓN GENERAL
9.2 GRANDES EMPRESAS
9.3 PYMES
10 MERCADO DE SUBCONTRATACIÓN DE PROCESOS EMPRESARIALES (BPO) DE ASIA-PACÍFICO, MEDIANTE UN ENFOQUE DE SUBCONTRATACIÓN
10.1 DESCRIPCIÓN GENERAL
10.2 CONTRATO BASADO
10.3 SERVICIOS PAQUETES
10.4 MEJOR COSTA
10.5 TARIFA POR SERVICIO
11 MERCADO DE SUBCONTRATACIÓN DE PROCESOS EMPRESARIALES (BPO) DE ASIA-PACÍFICO, POR USUARIO FINAL
11.1 DESCRIPCIÓN GENERAL
11.2 TI
11.2.1 TI, POR APLICACIÓN
11.2.1.1 SERVICIOS DE TI
11.2.1.2 ATENCIÓN AL CLIENTE
11.2.1.3 INGENIERÍA DE PRODUCTO
11.2.1.4 VENTAS Y MARKETING
11.2.1.5 FINANZAS Y CONTABILIDAD
11.2.1.6 TALENTO Y SERVICIOS DE RRHH
11.2.1.7 FORMACIÓN
11.2.1.8 ADQUISICIONES Y CADENA DE SUMINISTRO
11.2.1.9 INSTALACIONES Y ADMINISTRACIÓN
11.3 TELECOMUNICACIONES
11.3.1 TELECOMUNICACIONES, POR APLICACIÓN
11.3.1.1 ATENCIÓN AL CLIENTE
11.3.1.2 SERVICIOS DE TI
11.3.1.3 FINANZAS Y CONTABILIDAD
11.3.1.4 VENTAS Y MARKETING
11.3.1.5 TALENTO Y RRHH
11.3.1.6 FORMACIÓN
11.3.1.7 INSTALACIONES Y ADMINISTRACIÓN
11.3.1.8 ABASTECIMIENTO, ADQUISICIÓN Y CADENA DE SUMINISTRO
11.3.1.9 INGENIERÍA DE PRODUCTO
11.4 FABRICACIÓN
11.4.1 FABRICACIÓN, POR TIPO
11.4.1.1 AUTOMOTRIZ
11.4.1.1.1 AUTOMOTRIZ, POR APLICACIÓN
11.4.1.1.1.1 ABASTECIMIENTO, ADQUISICIÓN Y CADENA DE SUMINISTRO
11.4.1.1.1.2 INGENIERÍA DE PRODUCTO
11.4.1.1.1.3 SERVICIOS DE TI
11.4.1.1.1.4 FINANZAS Y CONTABILIDAD
11.4.1.1.1.5 ATENCIÓN AL CLIENTE
11.4.1.1.1.6 TALENTO Y RRHH
11.4.1.1.1.7 FORMACIÓN
11.4.1.1.1.8 VENTAS Y MARKETING
11.4.1.1.1.9 INSTALACIONES Y ADMINISTRACIÓN
11.4.1.2 MAQUINARIAS ELECTRÓNICAS
11.4.1.2.1 MAQUINARIAS ELECTRÓNICAS, POR APLICACIÓN
11.4.1.2.1.1 INGENIERÍA DE PRODUCTO
11.4.1.2.1.2 SERVICIOS DE TI
11.4.1.2.1.3 ABASTECIMIENTO, ADQUISICIÓN Y CADENA DE SUMINISTRO
11.4.1.2.1.4 FINANZAS Y CONTABILIDAD
11.4.1.2.1.5 ATENCIÓN AL CLIENTE
11.4.1.2.1.6 TALENTO Y RRHH
11.4.1.2.1.7 FORMACIÓN
11.4.1.2.1.8 INSTALACIONES Y ADMINISTRACIÓN
11.4.1.2.1.9 VENTAS Y MARKETING
11.4.1.3 PRODUCTOS QUÍMICOS Y MATERIALES
11.4.1.3.1 PRODUCTOS QUÍMICOS Y MATERIALES, POR APLICACIÓN
11.4.1.3.1.1 ABASTECIMIENTO, ADQUISICIÓN Y CADENA DE SUMINISTRO
11.4.1.3.1.2 FINANZAS Y CONTABILIDAD
11.4.1.3.1.3 ATENCIÓN AL CLIENTE
11.4.1.3.1.4 SERVICIOS DE TALENTO Y RRHH
11.4.1.3.1.5 INGENIERÍA DE PRODUCTO
11.4.1.3.1.6 VENTAS Y MARKETING
11.4.1.3.1.7 FORMACIÓN
11.4.1.3.1.8 INSTALACIONES Y ADMINISTRACIÓN
11.4.1.3.1.9 SERVICIOS DE TI
11.4.1.4 EQUIPOS TIC
11.4.1.4.1 EQUIPOS TIC, POR APLICACIÓN
11.4.1.4.1.1 INGENIERÍA DE PRODUCTO
11.4.1.4.1.2 SERVICIOS DE TI
11.4.1.4.1.3 ABASTECIMIENTO, ADQUISICIÓN Y CADENA DE SUMINISTRO
11.4.1.4.1.4 ATENCIÓN AL CLIENTE
11.4.1.4.1.5 FINANZAS Y CONTABILIDAD
11.4.1.4.1.6 SERVICIOS DE TALENTO Y RRHH
11.4.1.4.1.7 FORMACIÓN
11.4.1.4.1.8 SOPORTE DE VENTAS Y MARKETING
11.4.1.4.1.9 INSTALACIONES Y ADMINISTRACIÓN
11.4.1.5 ALIMENTOS Y BEBIDAS
11.4.1.5.1 ALIMENTOS Y BEBIDAS, SEGÚN APLICACIÓN
11.4.1.5.1.1 ATENCIÓN AL CLIENTE
11.4.1.5.1.2 ABASTECIMIENTO, ADQUISICIÓN Y CADENA DE SUMINISTRO
11.4.1.5.1.3 FINANZAS Y CONTABILIDAD
11.4.1.5.1.4 SOPORTE DE VENTAS Y MARKETING
11.4.1.5.1.5 SERVICIOS DE TALENTO Y RRHH
11.4.1.5.1.6 SERVICIOS DE TI
11.4.1.5.1.7 INSTALACIONES Y ADMINISTRACIÓN
11.4.1.5.1.8 FORMACIÓN
11.4.1.5.1.9 INGENIERÍA DE PRODUCTO
11.4.1.6 ARQUITECTURA Y VIVIENDA
11.4.1.6.1 ARQUITECTURA Y VIVIENDA, POR APLICACIÓN
11.4.1.6.1.1 FINANZAS Y CONTABILIDAD
11.4.1.6.1.2 INGENIERÍA DE PRODUCTO
11.4.1.6.1.3 SERVICIOS DE TI
11.4.1.6.1.4 ABASTECIMIENTO, ADQUISICIÓN Y CADENA DE SUMINISTRO
11.4.1.6.1.5 SERVICIOS DE TALENTO Y RRHH
11.4.1.6.1.6 ATENCIÓN AL CLIENTE
11.4.1.6.1.7 INSTALACIONES Y ADMINISTRACIÓN
11.4.1.6.1.8 SOPORTE DE VENTAS Y MARKETING
11.4.1.6.1.9 FORMACIÓN (SEGURIDAD, CUMPLIMIENTO, DISEÑO)
11.4.1.6.1.10 OTROS
11.5 BFSI
11.5.1 BFSI, POR TIPO
11.5.1.1 BANCA
11.5.1.1.1 BANCA, POR APLICACIÓN
11.5.1.1.1.1 ATENCIÓN AL CLIENTE
11.5.1.1.1.2 FINANZAS Y CONTABILIDAD
11.5.1.1.1.3 SERVICIOS DE TALENTO Y RRHH
11.5.1.1.1.4 SERVICIOS DE TI
11.5.1.1.1.5 SOPORTE DE VENTAS Y MARKETING
11.5.1.1.1.6 ABASTECIMIENTO, ADQUISICIÓN Y CADENA DE SUMINISTRO
11.5.1.1.1.7 FORMACIÓN
11.5.1.1.1.8 INSTALACIONES Y ADMINISTRACIÓN
11.5.1.1.2 'INGENIERÍA DE PRODUCTO
11.5.1.2 SERVICIOS FINANCIEROS
11.5.1.2.1 SERVICIOS FINANCIEROS, POR APLICACIÓN
11.5.1.2.1.1 FINANZAS Y CONTABILIDAD
11.5.1.2.1.2 ATENCIÓN AL CLIENTE
11.5.1.2.1.3 SERVICIOS DE TI
11.5.1.2.1.4 SERVICIOS DE TALENTO Y RRHH
11.5.1.2.1.5 VENTAS Y MARKETING
11.5.1.2.1.6 INGENIERÍA DE PRODUCTO
11.5.1.2.1.7 ABASTECIMIENTO, ADQUISICIÓN Y CADENA DE SUMINISTRO
11.5.1.2.1.8 FORMACIÓN
11.5.1.2.1.9 INSTALACIONES Y ADMINISTRACIÓN
11.5.1.3 SEGURO
11.5.1.3.1 SEGURO, POR APLICACIÓN
11.5.1.3.1.1 ATENCIÓN AL CLIENTE
11.5.1.3.1.2 FINANZAS Y CONTABILIDAD
11.5.1.3.1.3 VENTAS Y MARKETING
11.5.1.3.1.4 SERVICIOS DE TALENTO Y RRHH
11.5.1.3.1.5 SERVICIOS DE TI
11.5.1.3.1.6 ABASTECIMIENTO, ADQUISICIÓN Y CADENA DE SUMINISTRO
11.5.1.3.1.7 FORMACIÓN
11.5.1.3.1.8 INGENIERÍA DE PRODUCTO
11.5.1.3.1.9 INSTALACIONES Y ADMINISTRACIÓN
11.6 GOBIERNO
11.6.1 GOBIERNO, POR APLICACIÓN
11.6.1.1 SERVICIOS DE TI
11.6.1.2 ATENCIÓN AL CLIENTE
11.6.1.3 FINANZAS Y CONTABILIDAD
11.6.1.4 TALENTO Y RRHH
11.6.1.5 INSTALACIONES Y ADMINISTRACIÓN
11.6.1.6 FORMACIÓN
11.6.1.7 ABASTECIMIENTO, ADQUISICIÓN Y CADENA DE SUMINISTRO
11.6.1.8 VENTAS Y MARKETING
11.6.1.9 INGENIERÍA DE PRODUCTO
11.7 DEFENSA
11.7.1 DEFENSA, POR APLICACIÓN
11.7.1.1 SERVICIOS DE TI
11.7.1.2 FORMACIÓN
11.7.1.3 ABASTECIMIENTO, ADQUISICIÓN Y CADENA DE SUMINISTRO
11.7.1.4 FINANZAS Y CONTABILIDAD
11.7.1.5 INSTALACIONES Y ADMINISTRACIÓN
11.7.1.6 TALENTO Y RRHH
11.7.1.7 ATENCIÓN AL CLIENTE
11.7.1.8 INGENIERÍA DE PRODUCTO
11.7.1.9 VENTAS Y MARKETING
11.8 TRANSPORTE
11.8.1 TRANSPORTE, POR APLICACIÓN
11.8.1.1 ATENCIÓN AL CLIENTE
11.8.1.2 SERVICIOS DE TI
11.8.1.3 FINANZAS Y CONTABILIDAD
11.8.1.4 ABASTECIMIENTO, ADQUISICIÓN Y CADENA DE SUMINISTRO
11.8.1.5 TALENTO Y RRHH
11.8.1.6 FORMACIÓN
11.8.1.7 INSTALACIONES Y ADMINISTRACIÓN
11.8.1.8 VENTAS Y MARKETING
11.8.1.9 INGENIERÍA DE PRODUCTO
11.9 LOGÍSTICA
11.9.1 LOGÍSTICA, POR APLICACIÓN
11.9.1.1 SERVICIOS DE TI
11.9.1.2 ATENCIÓN AL CLIENTE
11.9.1.3 FINANZAS Y CONTABILIDAD
11.9.1.4 ABASTECIMIENTO, ADQUISICIÓN Y CADENA DE SUMINISTRO
11.9.1.5 TALENTO Y RRHH
11.9.1.6 FORMACIÓN
11.9.1.7 INSTALACIONES Y ADMINISTRACIÓN
11.9.1.8 VENTAS Y MARKETING
11.9.1.9 INGENIERÍA DE PRODUCTO
11.1 VENTA AL POR MENOR
11.10.1 VENTA AL POR MENOR, POR APLICACIÓN
11.10.1.1 ATENCIÓN AL CLIENTE
11.10.1.2 SERVICIOS DE TI
11.10.1.3 FINANZAS Y CONTABILIDAD
11.10.1.4 VENTAS Y MARKETING
11.10.1.5 ABASTECIMIENTO, ADQUISICIÓN Y CADENA DE SUMINISTRO
11.10.1.6 TALENTO Y RRHH
11.10.1.7 INSTALACIONES Y ADMINISTRACIÓN
11.10.1.8 FORMACIÓN
11.10.1.9 INGENIERÍA DE PRODUCTO
11.11 ATENCIÓN SANITARIA
11.11.1 ATENCIÓN SANITARIA, POR APLICACIÓN
11.11.1.1 ATENCIÓN AL CLIENTE
11.11.1.2 SERVICIOS DE TI
11.11.1.3 FINANZAS Y CONTABILIDAD
11.11.1.4 FORMACIÓN
11.11.1.5 TALENTO Y RRHH
11.11.1.6 INSTALACIONES Y ADMINISTRACIÓN
11.11.1.7 VENTAS Y MARKETING
11.11.1.8 ABASTECIMIENTO, ADQUISICIÓN Y CADENA DE SUMINISTRO
11.11.1.9 INGENIERÍA DE PRODUCTO
11.12 COMERCIO ELECTRÓNICO
11.12.1 COMERCIO ELECTRÓNICO, POR APLICACIÓN
11.12.1.1 ATENCIÓN AL CLIENTE
11.12.1.2 SERVICIOS DE TI
11.12.1.3 VENTAS Y MARKETING
11.12.1.4 ABASTECIMIENTO, ADQUISICIÓN Y CADENA DE SUMINISTRO
11.12.1.5 FINANZAS Y CONTABILIDAD
11.12.1.6 TALENTO Y RRHH
11.12.1.7 INSTALACIONES Y ADMINISTRACIÓN
11.12.1.8 FORMACIÓN
11.12.1.9 INGENIERÍA DE PRODUCTO
11.13 VIAJES
11.13.1 VIAJES, POR SOLICITUD
11.13.1.1 ATENCIÓN AL CLIENTE
11.13.1.2 FINANZAS Y CONTABILIDAD
11.13.1.3 SERVICIOS DE TALENTO Y RRHH
11.13.1.4 VENTAS Y MARKETING
11.13.1.5 ABASTECIMIENTO, ADQUISICIÓN Y CADENA DE SUMINISTRO
11.13.1.6 INSTALACIONES Y ADMINISTRACIÓN
11.13.1.7 INGENIERÍA DE PRODUCTO
11.13.1.8 FORMACIÓN
11.13.1.9 SERVICIOS DE TI
11.14 HOSPITALIDAD
11.14.1 HOSPITALIDAD, POR APLICACIÓN
11.14.1.1 ATENCIÓN AL CLIENTE
11.14.1.2 VENTAS Y MARKETING
11.14.1.3 SERVICIOS DE TI
11.14.1.4 FINANZAS Y CONTABILIDAD
11.14.1.5 TALENTO Y RRHH
11.14.1.6 FORMACIÓN
11.14.1.7 INSTALACIONES Y ADMINISTRACIÓN
11.14.1.8 ABASTECIMIENTO, ADQUISICIÓN Y CADENA DE SUMINISTRO
11.14.1.9 INGENIERÍA DE PRODUCTO
11.15 ENERGÍA
11.15.1 ENERGÍA, POR APLICACIÓN
11.15.1.1 SERVICIOS DE TI
11.15.1.2 FINANZAS Y CONTABILIDAD
11.15.1.3 ABASTECIMIENTO, ADQUISICIÓN Y CADENA DE SUMINISTRO
11.15.1.4 ATENCIÓN AL CLIENTE
11.15.1.5 INSTALACIONES Y ADMINISTRACIÓN
11.15.1.6 TALENTO Y RRHH
11.15.1.7 FORMACIÓN
11.15.1.8 INGENIERÍA DE PRODUCTO
11.15.1.9 VENTAS Y MARKETING
11.16 EDUCACIÓN
11.16.1 EDUCACIÓN, POR APLICACIÓN
11.16.1.1 FORMACIÓN
11.16.1.2 SERVICIOS DE TI
11.16.1.3 ATENCIÓN AL CLIENTE
11.16.1.4 FINANZAS Y CONTABILIDAD
11.16.1.5 TALENTO Y RRHH
11.16.1.6 VENTAS Y MARKETING
11.16.1.7 INSTALACIONES Y ADMINISTRACIÓN
11.16.1.8 INGENIERÍA DE PRODUCTO
11.16.1.9 ABASTECIMIENTO, ADQUISICIÓN Y CADENA DE SUMINISTRO
11.17 UTILIDADES
11.17.1 SERVICIOS PÚBLICOS, POR APLICACIÓN
11.17.1.1 SERVICIOS DE TI
11.17.1.2 ATENCIÓN AL CLIENTE
11.17.1.3 FINANZAS Y CONTABILIDAD
11.17.1.4 ABASTECIMIENTO, ADQUISICIÓN Y CADENA DE SUMINISTRO
11.17.1.5 INSTALACIONES Y ADMINISTRACIÓN
11.17.1.6 TALENTO Y RRHH
11.17.1.7 FORMACIÓN
11.17.1.8 INGENIERÍA DE PRODUCTO
11.17.1.9 VENTAS Y MARKETING
11.18 OTROS
12 MERCADO DE SUBCONTRATACIÓN DE PROCESOS EMPRESARIALES (BPO) DE ASIA-PACÍFICO, POR REGIÓN
12.1 ASIA-PACÍFICO
12.1.1 JAPÓN
12.1.2 CHINA
12.1.3 INDIA
12.1.4 FILIPINAS
12.1.5 COREA DEL SUR
12.1.6 AUSTRALIA
12.1.7 SINGAPUR
12.1.8 TAILANDIA
12.1.9 INDONESIA
12.1.10 MALASIA
12.1.11 TAIWÁN
12.1.12 VIETNAM
12.1.13 NUEVA ZELANDA
12.1.14 RESTO DE ASIA-PACÍFICO
13 PANORAMA EMPRESARIAL DEL MERCADO DE SUBCONTRATACIÓN DE PROCESOS EMPRESARIALES (BPO) DE ASIA-PACÍFICO
13.1 ANÁLISIS DE ACCIONES DE LA EMPRESA: GLOBAL
14 ANÁLISIS FODA
15 PERFIL DE LA EMPRESA
15.1 ACCENTURE
15.1.1 INSTANTÁNEA DE LA EMPRESA
15.1.2 ANÁLISIS DE INGRESOS
15.1.3 ANÁLISIS DE LAS ACCIONES DE LA EMPRESA
15.1.4 CARTERA DE SERVICIOS
15.1.5 DESARROLLO RECIENTE
15.2 INFOSYS LIMITADA
15.2.1 INSTANTÁNEA DE LA EMPRESA
15.2.2 ANÁLISIS DE INGRESOS
15.2.3 ANÁLISIS DE LAS ACCIONES DE LA EMPRESA
15.2.4 CARTERA DE SERVICIOS
15.2.5 DESARROLLO RECIENTE
15.3 IBM CORPORATION
15.3.1 INSTANTÁNEA DE LA EMPRESA
15.3.2 ANÁLISIS DE INGRESOS
15.3.3 ANÁLISIS DE LAS ACCIONES DE LA EMPRESA
15.3.4 CARTERA DE SERVICIOS
15.3.5 DESARROLLO RECIENTE
15.4 CAPGEMINI
15.4.1 INSTANTÁNEA DE LA EMPRESA
15.4.2 ANÁLISIS DE INGRESOS
15.4.3 ANÁLISIS DE LAS ACCIONES DE LA EMPRESA
15.4.4 CARTERA DE SERVICIOS
15.4.5 DESARROLLO RECIENTE
15.5 TATA CONSULTANCY SERVICES LIMITED
15.5.1 INSTANTÁNEA DE LA EMPRESA
15.5.2 ANÁLISIS DE INGRESOS
15.5.3 ANÁLISIS DE LAS ACCIONES DE LA EMPRESA
15.5.4 CARTERA DE SERVICIOS
15.5.5 DESARROLLO RECIENTE
15.6 ADP, INC.
15.6.1 INSTANTÁNEA DE LA EMPRESA
15.6.2 ANÁLISIS DE INGRESOS
15.6.3 CARTERA DE SERVICIOS
15.6.4 DESARROLLO RECIENTE
15.7 AMDOCS
15.7.1 INSTANTÁNEA DE LA EMPRESA
15.7.2 ANÁLISIS DE INGRESOS
15.7.3 CARTERA DE SERVICIOS
15.7.4 DESARROLLO RECIENTE
15.8 ALTECISYS
15.8.1 INSTANTÁNEA DE LA EMPRESA
15.8.2 CARTERA DE SERVICIOS
15.8.3 DESARROLLO RECIENTE
15.9 CONOCEDOR
15.9.1 INSTANTÁNEA DE LA EMPRESA
15.9.2 ANÁLISIS DE INGRESOS
15.9.3 CARTERA DE SERVICIOS
15.9.4 DESARROLLO RECIENTE
15.1 CORPORACIÓN CONCENTRIX
15.10.1 INSTANTÁNEA DE LA EMPRESA
15.10.2 ANÁLISIS DE INGRESOS
15.10.3 CARTERA DE SERVICIOS
15.10.4 DESARROLLO RECIENTE
15.11 GENNPACT
15.11.1 INSTANTÁNEA DE LA EMPRESA
15.11.2 ANÁLISIS DE INGRESOS
15.11.3 CARTERA DE SERVICIOS
15.11.4 DESARROLLO RECIENTE
15.12 HCL TECHNOLOGIES LIMITADA
15.12.1 INSTANTÁNEA DE LA EMPRESA
15.12.2 ANÁLISIS DE INGRESOS
15.12.3 CARTERA DE SERVICIOS
15.12.4 DESARROLLO RECIENTE
15.13 INTETICS INC.
15.13.1 INSTANTÁNEA DE LA EMPRESA
15.13.2 CARTERA DE SERVICIOS
15.13.3 DESARROLLO RECIENTE
15.14 IBT
15.14.1 INSTANTÁNEA DE LA EMPRESA
15.14.2 CARTERA DE SERVICIOS
15.14.3 DESARROLLO RECIENTE
15.15 CORPORACIÓN NTT DATA GROUP
15.15.1 INSTANTÁNEA DE LA EMPRESA
15.15.2 ANÁLISIS DE INGRESOS
15.15.3 CARTERA DE SERVICIOS
15.15.4 DESARROLLO RECIENTE
15.16 CORPORACIÓN NCR VOYIX
15.16.1 INSTANTÁNEA DE LA EMPRESA
15.16.2 ANÁLISIS DE INGRESOS
15.16.3 CARTERA DE SERVICIOS
15.16.4 DESARROLLO RECIENTE
15.17 PLAXÓNICO.
15.17.1 INSTANTÁNEA DE LA EMPRESA
15.17.2 CARTERA DE SERVICIOS
15.17.3 DESARROLLO RECIENTE
15.18 ROBERT HALF INC (SUBSIDARIA DE PROVITI)
15.18.1 INSTANTÁNEA DE LA EMPRESA
15.18.2 ANÁLISIS DE INGRESOS
15.18.3 CARTERA DE SERVICIOS
15.18.4 DESARROLLO RECIENTE
15.19 SODEXO
15.19.1 INSTANTÁNEA DE LA EMPRESA
15.19.2 ANÁLISIS DE INGRESOS
15.19.3 CARTERA DE SERVICIOS
15.19.4 DESARROLLO RECIENTE
15.2 TTEC
15.20.1 INSTANTÁNEA DE LA EMPRESA
15.20.2 ANÁLISIS DE INGRESOS
15.20.3 CARTERA DE SERVICIOS
15.20.4 DESARROLLO RECIENTE
15.21 WIPRO
15.21.1 INSTANTÁNEA DE LA EMPRESA
15.21.2 ANÁLISIS DE INGRESOS
15.21.3 CARTERA DE SERVICIOS
15.21.4 DESARROLLO RECIENTE
16 CUESTIONARIO
17 INFORMES RELACIONADOS
Lista de Tablas
TABLA 1 AGENTES DE CENTROS DE CONTACTO EN LOS EAU
TABLA 2 LISTA DE EMPRESAS DE LOS EMIRATOS ÁRABES UNIDOS CON OPERACIONES DE CENTROS DE CONTACTO CAUTIVOS EN LOS EMIRATOS ÁRABES UNIDOS
TABLA 3 FLUJO DE SUBCONTRATACIÓN – DEL PAÍS CLIENTE AL PAÍS PROVEEDOR | SERVICIOS Y RAZONES
TABLA 4 MODELOS DE ENTREGA Y DISTRIBUCIÓN DEL PRESUPUESTO DE SUBCONTRATACIÓN POR FUNCIÓN
TABLA 5 EMPRESAS LÍDERES DE BPO EN ASIA-PACÍFICO – RESUMEN DEL AÑO FISCAL 2024
TABLA 6 CENTROS DE ENTREGA REGIONAL EN EL MERCADO DE BPO DE ASIA-PACÍFICO
CUADRO 7 MODELOS DE ENTREGA Y ESTRUCTURA REGIONAL
CUADRO 8 COBERTURA REGULATORIA
TABLA 9 MERCADO DE SUBCONTRATACIÓN DE PROCESOS EMPRESARIALES (BPO) DE ASIA-PACÍFICO, POR TIPO DE SUBCONTRATACIÓN, 2018-2032 (MILES DE USD)
TABLA 10 MERCADO DE SUBCONTRATACIÓN DE PROCESOS EMPRESARIALES (BPO) OFFSHORE EN ASIA-PACÍFICO, POR REGIÓN, 2018-2032 (MILES DE USD)
TABLA 11 MERCADO DE SUBCONTRATACIÓN DE PROCESOS EMPRESARIALES (BPO) ONSHORE EN ASIA-PACÍFICO, POR REGIÓN, 2018-2032 (MILES DE USD)
TABLA 12 MERCADO DE SUBCONTRATACIÓN DE PROCESOS EMPRESARIALES (BPO) NEARSHORE DE ASIA-PACÍFICO, POR REGIÓN, 2018-2032 (MILES DE USD)
TABLA 13 MERCADO DE SUBCONTRATACIÓN DE PROCESOS EMPRESARIALES (BPO) DE ASIA-PACÍFICO, POR APLICACIÓN, 2018-2032 (MILES DE USD)
TABLA 14 ATENCIÓN AL CLIENTE EN EL MERCADO DE SUBCONTRATACIÓN DE PROCESOS EMPRESARIALES (BPO) DE ASIA-PACÍFICO, POR REGIÓN, 2018-2032 (MILES DE USD)
TABLA 15 MERCADO DE FINANZAS Y CONTABILIDAD EN LA SUBCONTRATACIÓN DE PROCESOS EMPRESARIALES (BPO) DE ASIA-PACÍFICO, POR REGIÓN, 2018-2032 (MILES DE USD)
TABLA 16 MERCADO DE FINANZAS Y CONTABILIDAD EN LA SUBCONTRATACIÓN DE PROCESOS EMPRESARIALES (BPO) DE ASIA-PACÍFICO, POR APLICACIÓN, 2018-2032 (MILES DE USD)
TABLA 17 SERVICIOS DE TI EN EL MERCADO DE SUBCONTRATACIÓN DE PROCESOS EMPRESARIALES (BPO) DE ASIA-PACÍFICO, POR REGIÓN, 2018-2032 (MILES DE USD)
TABLA 18 TALENTO Y SERVICIOS DE RR.HH. EN EL MERCADO DE SUBCONTRATACIÓN DE PROCESOS EMPRESARIALES (BPO) DE ASIA-PACÍFICO, POR REGIÓN, 2018-2032 (MILES DE USD)
TABLA 19 TALENTO Y SERVICIOS DE RR.HH. EN EL MERCADO DE SUBCONTRATACIÓN DE PROCESOS EMPRESARIALES (BPO) DE ASIA-PACÍFICO, POR APLICACIÓN, 2018-2032 (MILES DE USD)
TABLA 20 OPERACIONES DE EMPLEADOS Y RR.HH. EN EL MERCADO DE SUBCONTRATACIÓN DE PROCESOS EMPRESARIALES (BPO) DE ASIA-PACÍFICO, POR APLICACIÓN, 2018-2032 (MILES DE USD)
TABLA 21 ADQUISICIÓN Y DESARROLLO DE TALENTO EN EL MERCADO DE SUBCONTRATACIÓN DE PROCESOS EMPRESARIALES (BPO) DE ASIA-PACÍFICO, POR APLICACIÓN, 2018-2032 (MILES DE USD)
TABLA 22 DESARROLLO DE TALENTO EN EL MERCADO DE SUBCONTRATACIÓN DE PROCESOS EMPRESARIALES (BPO) DE ASIA-PACÍFICO, POR APLICACIÓN, 2018-2032 (MILES DE USD)
TABLA 23 ADQUISICIÓN DE TALENTO EN EL MERCADO DE SUBCONTRATACIÓN DE PROCESOS EMPRESARIALES (BPO) DE ASIA-PACÍFICO, POR APLICACIÓN, 2018-2032 (MILES DE USD)
TABLA 24 VENTAS Y MARKETING EN EL MERCADO DE SUBCONTRATACIÓN DE PROCESOS EMPRESARIALES (BPO) DE ASIA-PACÍFICO, POR REGIÓN, 2018-2032 (MILES DE USD)
TABLA 25 ABASTECIMIENTO, ADQUISICIONES Y CADENA DE SUMINISTRO EN EL MERCADO DE SUBCONTRATACIÓN DE PROCESOS EMPRESARIALES (BPO) DE ASIA-PACÍFICO, POR REGIÓN, 2018-2032 (MILES DE USD)
TABLA 26 ABASTECIMIENTO, ADQUISICIONES Y CADENA DE SUMINISTRO DE ASIA-PACÍFICO EN EL MERCADO DE SUBCONTRATACIÓN DE PROCESOS EMPRESARIALES (BPO), POR APLICACIÓN, 2018-2032 (MILES DE USD)
TABLA 27 MERCADO DE INGENIERÍA DE PRODUCTOS EN LA SUBCONTRATACIÓN DE PROCESOS EMPRESARIALES (BPO) DE ASIA-PACÍFICO, POR REGIÓN, 2018-2032 (MILES DE USD)
TABLA 28 INSTALACIONES Y ADMINISTRACIÓN EN EL MERCADO DE SUBCONTRATACIÓN DE PROCESOS EMPRESARIALES (BPO) DE ASIA-PACÍFICO, POR REGIÓN, 2018-2032 (MILES DE USD)
TABLA 29 MERCADO DE CAPACITACIÓN EN SUBCONTRATACIÓN DE PROCESOS EMPRESARIALES (BPO) EN ASIA-PACÍFICO, POR REGIÓN, 2018-2032 (MILES DE USD)
TABLA 30 MERCADO DE SUBCONTRATACIÓN DE PROCESOS EMPRESARIALES (BPO) DE ASIA-PACÍFICO, POR TAMAÑO DE LA ORGANIZACIÓN, 2018-2032 (MILES DE USD)
TABLA 31 GRANDES EMPRESAS DE ASIA-PACÍFICO EN EL MERCADO DE SUBCONTRATACIÓN DE PROCESOS EMPRESARIALES (BPO), POR REGIÓN, 2018-2032 (MILES DE USD)
TABLA 32 PYMES DE ASIA-PACÍFICO EN EL MERCADO DE SUBCONTRATACIÓN DE PROCESOS EMPRESARIALES (BPO), POR REGIÓN, 2018-2032 (MILES DE USD)
TABLA 33 MERCADO DE SUBCONTRATACIÓN DE PROCESOS EMPRESARIALES (BPO) DE ASIA-PACÍFICO, POR ENFOQUE DE SUBCONTRATACIÓN, 2018-2032 (MILES DE USD)
TABLA 34 MERCADO DE SUBCONTRATACIÓN DE PROCESOS EMPRESARIALES (BPO) BASADO EN CONTRATOS DE ASIA-PACÍFICO, POR REGIÓN, 2018-2032 (MILES DE USD)
TABLA 35 SERVICIOS PAQUETEADOS EN EL MERCADO DE SUBCONTRATACIÓN DE PROCESOS EMPRESARIALES (BPO) DE ASIA-PACÍFICO, POR REGIÓN, 2018-2032 (MILES DE USD)
TABLA 36 MERCADOS DE ASIA-PACÍFICO CON MEJORES UBICACIONES EN SUBCONTRATACIÓN DE PROCESOS EMPRESARIALES (BPO), POR REGIÓN, 2018-2032 (MILES DE USD)
TABLA 37 TARIFA POR SERVICIOS EN EL MERCADO DE SUBCONTRATACIÓN DE PROCESOS EMPRESARIALES (BPO) DE ASIA-PACÍFICO, POR REGIÓN, 2018-2032 (MILES DE USD)
TABLA 38 MERCADO DE SUBCONTRATACIÓN DE PROCESOS EMPRESARIALES (BPO) DE ASIA-PACÍFICO, POR USUARIO FINAL, 2018-2032 (MILES DE USD)
TABLA 39 MERCADO DE SUBCONTRATACIÓN DE PROCESOS EMPRESARIALES (BPO) DE TI EN ASIA-PACÍFICO, POR REGIÓN, 2018-2032 (MILES DE USD)
TABLA 40 MERCADO DE SUBCONTRATACIÓN DE PROCESOS EMPRESARIALES (BPO) DE TI EN ASIA-PACÍFICO, POR APLICACIÓN, 2018-2032 (MILES DE USD)
TABLA 41 MERCADO DE SUBCONTRATACIÓN DE PROCESOS EMPRESARIALES (BPO) DE TELECOMUNICACIONES EN ASIA-PACÍFICO, POR REGIÓN, 2018-2032 (MILES DE USD)
TABLA 42 MERCADO DE SUBCONTRATACIÓN DE PROCESOS EMPRESARIALES (BPO) DE TELECOMUNICACIONES EN ASIA-PACÍFICO, POR APLICACIÓN, 2018-2032 (MILES DE USD)
TABLA 43 MERCADO DE SUBCONTRATACIÓN DE PROCESOS EMPRESARIALES (BPO) EN LA FABRICACIÓN DE ASIA-PACÍFICO, POR REGIÓN, 2018-2032 (MILES DE USD)
TABLA 44 MERCADO DE MANUFACTURA EN ASIA-PACÍFICO EN SUBCONTRATACIÓN DE PROCESOS EMPRESARIALES (BPO), POR TIPO, 2018-2032 (MILES DE USD)
TABLA 45 MERCADO DE SUBCONTRATACIÓN DE PROCESOS EMPRESARIALES (BPO) AUTOMOTRIZ DE ASIA-PACÍFICO, POR APLICACIÓN, 2018-2032 (MILES DE USD)
TABLA 46 MERCADO DE MAQUINARIA ELECTRÓNICA EN LA SUBCONTRATACIÓN DE PROCESOS EMPRESARIALES (BPO) DE ASIA-PACÍFICO, POR APLICACIÓN, 2018-2032 (MILES DE USD)
TABLA 47 MERCADO DE SUBCONTRATACIÓN DE PROCESOS EMPRESARIALES (BPO) DE PRODUCTOS QUÍMICOS Y MATERIALES DE ASIA-PACÍFICO, POR APLICACIÓN, 2018-2032 (MILES DE USD)
TABLA 48 EQUIPOS DE TIC EN EL MERCADO DE SUBCONTRATACIÓN DE PROCESOS EMPRESARIALES (BPO) DE ASIA-PACÍFICO, POR APLICACIÓN, 2018-2032 (MILES DE USD)
TABLA 49 MERCADO DE ALIMENTOS Y BEBIDAS EN LA SUBCONTRATACIÓN DE PROCESOS EMPRESARIALES (BPO) DE ASIA-PACÍFICO, POR APLICACIÓN, 2018-2032 (MILES DE USD)
TABLA 50 ARQUITECTURA Y VIVIENDA EN EL MERCADO DE SUBCONTRATACIÓN DE PROCESOS EMPRESARIALES (BPO) DE ASIA-PACÍFICO, POR APLICACIÓN, 2018-2032 (MILES DE USD)
TABLA 51 BFSI DE ASIA-PACÍFICO EN EL MERCADO DE SUBCONTRATACIÓN DE PROCESOS EMPRESARIALES (BPO), POR REGIÓN, 2018-2032 (MILES DE USD)
TABLA 52 BFSI DE ASIA-PACÍFICO EN EL MERCADO DE SUBCONTRATACIÓN DE PROCESOS EMPRESARIALES (BPO), POR TIPO, 2018-2032 (MILES DE USD)
TABLA 53 BANCA DE ASIA-PACÍFICO EN EL MERCADO DE SUBCONTRATACIÓN DE PROCESOS EMPRESARIALES (BPO), POR APLICACIÓN, 2018-2032 (MILES DE USD)
TABLA 54 SERVICIOS FINANCIEROS EN EL MERCADO DE SUBCONTRATACIÓN DE PROCESOS EMPRESARIALES (BPO) DE ASIA-PACÍFICO, POR APLICACIÓN, 2018-2032 (MILES DE USD)
TABLA 55 MERCADO DE SEGUROS EN LA SUBCONTRATACIÓN DE PROCESOS EMPRESARIALES (BPO) DE ASIA-PACÍFICO, POR APLICACIÓN, 2018-2032 (MILES DE USD)
TABLA 56 MERCADO DE SUBCONTRATACIÓN DE PROCESOS EMPRESARIALES (BPO) EN ASIA-PACÍFICO, POR REGIÓN, 2018-2032 (MILES DE USD)
TABLA 57 MERCADO DE SUBCONTRATACIÓN DE PROCESOS EMPRESARIALES (BPO) EN ASIA-PACÍFICO, POR APLICACIÓN, 2018-2032 (MILES DE USD)
TABLA 58 MERCADO DE SUBCONTRATACIÓN DE PROCESOS EMPRESARIALES (BPO) EN DEFENSA DE ASIA-PACÍFICO, POR REGIÓN, 2018-2032 (MILES DE USD)
TABLA 59 MERCADO DE SUBCONTRATACIÓN DE PROCESOS EMPRESARIALES (BPO) EN DEFENSA DE ASIA-PACÍFICO, POR APLICACIÓN, 2018-2032 (MILES DE USD)
TABLA 60 MERCADO DE SUBCONTRATACIÓN DE PROCESOS EMPRESARIALES (BPO) EN EL TRANSPORTE DE ASIA-PACÍFICO, POR REGIÓN, 2018-2032 (MILES DE USD)
TABLA 61 MERCADO DE SUBCONTRATACIÓN DE PROCESOS EMPRESARIALES (BPO) EN EL TRANSPORTE DE ASIA-PACÍFICO, POR APLICACIÓN, 2018-2032 (MILES DE USD)
TABLA 62 MERCADO DE LOGÍSTICA EN LA SUBCONTRATACIÓN DE PROCESOS EMPRESARIALES (BPO) DE ASIA-PACÍFICO, POR REGIÓN, 2018-2032 (MILES DE USD)
TABLA 63 MERCADO DE LOGÍSTICA EN LA SUBCONTRATACIÓN DE PROCESOS EMPRESARIALES (BPO) DE ASIA-PACÍFICO, POR APLICACIÓN, 2018-2032 (MILES DE USD)
TABLA 64 MERCADO DE SUBCONTRATACIÓN DE PROCESOS EMPRESARIALES (BPO) MINORISTA EN ASIA-PACÍFICO, POR REGIÓN, 2018-2032 (MILES DE USD)
TABLA 65 MERCADO DE EXTERNALIZACIÓN DE PROCESOS EMPRESARIALES (BPO) EN ASIA-PACÍFICO, POR APLICACIÓN, 2018-2032 (MILES DE USD)
TABLA 66 MERCADO DE SUBCONTRATACIÓN DE PROCESOS EMPRESARIALES (BPO) EN ASIA-PACÍFICO, POR REGIÓN, 2018-2032 (MILES DE USD)
TABLA 67 MERCADO DE SUBCONTRATACIÓN DE PROCESOS EMPRESARIALES (BPO) EN ASIA-PACÍFICO, POR APLICACIÓN, 2018-2032 (MILES DE USD)
TABLA 68 MERCADO DE COMERCIO ELECTRÓNICO EN LA SUBCONTRATACIÓN DE PROCESOS EMPRESARIALES (BPO) DE ASIA-PACÍFICO, POR REGIÓN, 2018-2032 (MILES DE USD)
TABLA 69 MERCADO DE COMERCIO ELECTRÓNICO EN LA SUBCONTRATACIÓN DE PROCESOS EMPRESARIALES (BPO) DE ASIA-PACÍFICO, POR APLICACIÓN, 2018-2032 (MILES DE USD)
TABLA 70 MERCADO DE SUBCONTRATACIÓN DE PROCESOS EMPRESARIALES (BPO) DE VIAJES EN ASIA-PACÍFICO, POR REGIÓN, 2018-2032 (MILES DE USD)
TABLA 71 MERCADO DE VIAJES EN ASIA-PACÍFICO EN SUBCONTRATACIÓN DE PROCESOS EMPRESARIALES (BPO), POR APLICACIÓN, 2018-2032 (MILES DE USD)
TABLA 72 MERCADO DE SUBCONTRATACIÓN DE PROCESOS EMPRESARIALES (BPO) EN LA HOTELERÍA DE ASIA-PACÍFICO, POR REGIÓN, 2018-2032 (MILES DE USD)
TABLA 73 MERCADO DE SUBCONTRATACIÓN DE PROCESOS EMPRESARIALES (BPO) EN LA HOTELERÍA DE ASIA-PACÍFICO, POR APLICACIÓN, 2018-2032 (MILES DE USD)
TABLA 74 MERCADO DE SUBCONTRATACIÓN DE PROCESOS EMPRESARIALES (BPO) DE ENERGÍA EN ASIA-PACÍFICO, POR REGIÓN, 2018-2032 (MILES DE USD)
TABLA 75 MERCADO DE SUBCONTRATACIÓN DE PROCESOS EMPRESARIALES (BPO) DE ENERGÍA EN ASIA-PACÍFICO, POR APLICACIÓN, 2018-2032 (MILES DE USD)
TABLA 76 MERCADO DE EDUCACIÓN EN SUBCONTRATACIÓN DE PROCESOS EMPRESARIALES (BPO) EN ASIA-PACÍFICO, POR REGIÓN, 2018-2032 (MILES DE USD)
TABLA 77 MERCADO DE EDUCACIÓN EN SUBCONTRATACIÓN DE PROCESOS EMPRESARIALES (BPO) DE ASIA-PACÍFICO, POR APLICACIÓN, 2018-2032 (MILES DE USD)
TABLA 78 SERVICIOS PÚBLICOS EN EL MERCADO DE SUBCONTRATACIÓN DE PROCESOS EMPRESARIALES (BPO) DE ASIA-PACÍFICO, POR REGIÓN, 2018-2032 (MILES DE USD)
TABLA 79 SERVICIOS PÚBLICOS DE ASIA-PACÍFICO EN EL MERCADO DE SUBCONTRATACIÓN DE PROCESOS EMPRESARIALES (BPO), POR APLICACIÓN, 2018-2032 (MILES DE USD)
TABLA 80 OTROS MERCADOS DE SUBCONTRATACIÓN DE PROCESOS EMPRESARIALES (BPO) DE ASIA-PACÍFICO, POR REGIÓN, 2018-2032 (MILES DE USD)
TABLA 81 MERCADO DE SUBCONTRATACIÓN DE PROCESOS EMPRESARIALES (BPO) DE ASIA-PACÍFICO, POR PAÍS, 2018-2032 (MILES DE USD)
TABLA 82 MERCADO DE SUBCONTRATACIÓN DE PROCESOS EMPRESARIALES (BPO) DE ASIA-PACÍFICO, POR TIPO DE SUBCONTRATACIÓN, 2018-2032 (MILES DE USD)
TABLA 83 MERCADO DE SUBCONTRATACIÓN DE PROCESOS EMPRESARIALES (BPO) DE ASIA-PACÍFICO, POR APLICACIÓN, 2018-2032 (MILES DE USD)
TABLA 84 MERCADO DE FINANZAS Y CONTABILIDAD EN LA SUBCONTRATACIÓN DE PROCESOS EMPRESARIALES (BPO) DE ASIA-PACÍFICO, POR APLICACIÓN, 2018-2032 (MILES DE USD)
TABLA 85 TALENTO Y SERVICIOS DE RR.HH. EN EL MERCADO DE SUBCONTRATACIÓN DE PROCESOS EMPRESARIALES (BPO) DE ASIA-PACÍFICO, POR APLICACIÓN, 2018-2032 (MILES DE USD)
TABLA 86 OPERACIONES DE EMPLEADOS Y RR.HH. EN EL MERCADO DE SUBCONTRATACIÓN DE PROCESOS EMPRESARIALES (BPO) DE ASIA-PACÍFICO, POR APLICACIÓN, 2018-2032 (MILES DE USD)
TABLA 87 ADQUISICIÓN Y DESARROLLO DE TALENTO EN EL MERCADO DE SUBCONTRATACIÓN DE PROCESOS EMPRESARIALES (BPO) DE ASIA-PACÍFICO, POR APLICACIÓN, 2018-2032 (MILES DE USD)
TABLA 88 DESARROLLO DE TALENTO EN EL MERCADO DE SUBCONTRATACIÓN DE PROCESOS EMPRESARIALES (BPO) DE ASIA-PACÍFICO, POR APLICACIÓN, 2018-2032 (MILES DE USD)
TABLA 89 ADQUISICIÓN DE TALENTO EN EL MERCADO DE SUBCONTRATACIÓN DE PROCESOS EMPRESARIALES (BPO) EN ASIA-PACÍFICO, POR APLICACIÓN, 2018-2032 (MILES DE USD)
TABLA 90 ABASTECIMIENTO, ADQUISICIONES Y CADENA DE SUMINISTRO DE ASIA-PACÍFICO EN EL MERCADO DE SUBCONTRATACIÓN DE PROCESOS EMPRESARIALES (BPO), POR APLICACIÓN, 2018-2032 (MILES DE USD)
TABLA 91 MERCADO DE SUBCONTRATACIÓN DE PROCESOS EMPRESARIALES (BPO) DE ASIA-PACÍFICO, POR TAMAÑO DE LA ORGANIZACIÓN, 2018-2032 (MILES DE USD)
TABLA 92 MERCADO DE SUBCONTRATACIÓN DE PROCESOS EMPRESARIALES (BPO) DE ASIA-PACÍFICO, POR ENFOQUE DE SUBCONTRATACIÓN, 2018-2032 (MILES DE USD)
TABLA 93 MERCADO DE SUBCONTRATACIÓN DE PROCESOS EMPRESARIALES (BPO) DE ASIA-PACÍFICO, POR USUARIO FINAL, 2018-2032 (MILES DE USD)
TABLA 94 MERCADO DE SUBCONTRATACIÓN DE PROCESOS EMPRESARIALES (BPO) DE TI EN ASIA-PACÍFICO, POR APLICACIÓN, 2018-2032 (MILES DE USD)
TABLA 95 MERCADO DE SUBCONTRATACIÓN DE PROCESOS EMPRESARIALES (BPO) DE TELECOMUNICACIONES DE ASIA-PACÍFICO, POR APLICACIÓN, 2018-2032 (MILES DE USD)
TABLA 96 MERCADO DE MANUFACTURA EN ASIA-PACÍFICO EN SUBCONTRATACIÓN DE PROCESOS EMPRESARIALES (BPO), POR TIPO, 2018-2032 (MILES DE USD)
TABLA 97 MERCADO DE SUBCONTRATACIÓN DE PROCESOS EMPRESARIALES (BPO) AUTOMOTRIZ DE ASIA-PACÍFICO, POR APLICACIÓN, 2018-2032 (MILES DE USD)
TABLA 98 MERCADO DE MAQUINARIA ELECTRÓNICA EN LA SUBCONTRATACIÓN DE PROCESOS EMPRESARIALES (BPO) DE ASIA-PACÍFICO, POR APLICACIÓN, 2018-2032 (MILES DE USD)
TABLA 99 MERCADO DE SUBCONTRATACIÓN DE PROCESOS EMPRESARIALES (BPO) DE PRODUCTOS QUÍMICOS Y MATERIALES DE ASIA-PACÍFICO, POR APLICACIÓN, 2018-2032 (MILES DE USD)
TABLA 100 EQUIPOS DE TIC EN EL MERCADO DE SUBCONTRATACIÓN DE PROCESOS EMPRESARIALES (BPO) DE ASIA-PACÍFICO, POR APLICACIÓN, 2018-2032 (MILES DE USD)
TABLA 101 MERCADO DE ALIMENTOS Y BEBIDAS EN LA SUBCONTRATACIÓN DE PROCESOS EMPRESARIALES (BPO) DE ASIA-PACÍFICO, POR APLICACIÓN, 2018-2032 (MILES DE USD)
TABLA 102 ARQUITECTURA Y VIVIENDA EN EL MERCADO DE SUBCONTRATACIÓN DE PROCESOS EMPRESARIALES (BPO) DE ASIA-PACÍFICO, POR APLICACIÓN, 2018-2032 (MILES DE USD)
TABLA 103 BFSI DE ASIA-PACÍFICO EN EL MERCADO DE SUBCONTRATACIÓN DE PROCESOS EMPRESARIALES (BPO), POR TIPO, 2018-2032 (MILES DE USD)
TABLA 104 BANCA DE ASIA-PACÍFICO EN EL MERCADO DE SUBCONTRATACIÓN DE PROCESOS EMPRESARIALES (BPO), POR APLICACIÓN, 2018-2032 (MILES DE USD)
TABLA 105 MERCADO DE SERVICIOS FINANCIEROS DE ASIA-PACÍFICO EN LA SUBCONTRATACIÓN DE PROCESOS EMPRESARIALES (BPO), POR APLICACIÓN, 2018-2032 (MILES DE USD)
TABLA 106 MERCADO DE SEGUROS EN LA SUBCONTRATACIÓN DE PROCESOS EMPRESARIALES (BPO) DE ASIA-PACÍFICO, POR APLICACIÓN, 2018-2032 (MILES DE USD)
TABLA 107 MERCADO DE SUBCONTRATACIÓN DE PROCESOS EMPRESARIALES (BPO) EN EL GOBIERNO DE ASIA-PACÍFICO, POR APLICACIÓN, 2018-2032 (MILES DE USD)
TABLA 108 MERCADO DE SUBCONTRATACIÓN DE PROCESOS EMPRESARIALES (BPO) EN DEFENSA DE ASIA-PACÍFICO, POR APLICACIÓN, 2018-2032 (MILES DE USD)
TABLA 109 TRANSPORTE DE ASIA-PACÍFICO EN EL MERCADO DE SUBCONTRATACIÓN DE PROCESOS EMPRESARIALES (BPO), POR APLICACIÓN, 2018-2032 (MILES DE USD)
TABLA 110 MERCADO DE LOGÍSTICA EN LA SUBCONTRATACIÓN DE PROCESOS EMPRESARIALES (BPO) DE ASIA-PACÍFICO, POR APLICACIÓN, 2018-2032 (MILES DE USD)
TABLA 111 MERCADO DE EXTERNALIZACIÓN DE PROCESOS EMPRESARIALES (BPO) EN ASIA-PACÍFICO, POR APLICACIÓN, 2018-2032 (MILES DE USD)
TABLA 112 MERCADO DE SUBCONTRATACIÓN DE PROCESOS EMPRESARIALES (BPO) EN ASIA-PACÍFICO, POR APLICACIÓN, 2018-2032 (MILES DE USD)
TABLA 113 MERCADO DE COMERCIO ELECTRÓNICO EN LA SUBCONTRATACIÓN DE PROCESOS EMPRESARIALES (BPO) DE ASIA-PACÍFICO, POR APLICACIÓN, 2018-2032 (MILES DE USD)
TABLA 114 MERCADO DE VIAJES EN ASIA-PACÍFICO EN SUBCONTRATACIÓN DE PROCESOS EMPRESARIALES (BPO), POR APLICACIÓN, 2018-2032 (MILES DE USD)
TABLA 115 MERCADO DE SUBCONTRATACIÓN DE PROCESOS EMPRESARIALES (BPO) EN LA HOTELERÍA DE ASIA-PACÍFICO, POR APLICACIÓN, 2018-2032 (MILES DE USD)
TABLA 116 MERCADO DE SUBCONTRATACIÓN DE PROCESOS EMPRESARIALES (BPO) DE ENERGÍA EN ASIA-PACÍFICO, POR APLICACIÓN, 2018-2032 (MILES DE USD)
TABLA 117 MERCADO DE EDUCACIÓN EN SUBCONTRATACIÓN DE PROCESOS EMPRESARIALES (BPO) DE ASIA-PACÍFICO, POR APLICACIÓN, 2018-2032 (MILES DE USD)
TABLA 118 SERVICIOS PÚBLICOS DE ASIA-PACÍFICO EN EL MERCADO DE SUBCONTRATACIÓN DE PROCESOS EMPRESARIALES (BPO), POR APLICACIÓN, 2018-2032 (MILES DE USD)
TABLA 119 MERCADO DE SUBCONTRATACIÓN DE PROCESOS EMPRESARIALES (BPO) EN JAPÓN, POR TIPO DE SUBCONTRATACIÓN, 2018-2032 (MILES DE USD)
TABLA 120 MERCADO DE SUBCONTRATACIÓN DE PROCESOS EMPRESARIALES (BPO) EN JAPÓN, POR APLICACIÓN, 2018-2032 (MILES DE USD)
TABLA 121 MERCADO DE FINANZAS Y CONTABILIDAD EN LA SUBCONTRATACIÓN DE PROCESOS EMPRESARIALES (BPO) DE JAPÓN, POR APLICACIÓN, 2018-2032 (MILES DE USD)
TABLA 122 TALENTO Y SERVICIOS DE RR.HH. EN EL MERCADO DE SUBCONTRATACIÓN DE PROCESOS EMPRESARIALES (BPO) DE JAPÓN, POR APLICACIÓN, 2018-2032 (MILES DE USD)
TABLA 123 EMPLEADOS Y OPERACIONES DE RR.HH. EN EL MERCADO DE SUBCONTRATACIÓN DE PROCESOS EMPRESARIALES (BPO) DE JAPÓN, POR APLICACIÓN, 2018-2032 (MILES DE USD)
TABLA 124 ADQUISICIÓN Y DESARROLLO DE TALENTO EN EL MERCADO DE SUBCONTRATACIÓN DE PROCESOS EMPRESARIALES (BPO) EN JAPÓN, POR APLICACIÓN, 2018-2032 (MILES DE USD)
TABLA 125 DESARROLLO DE TALENTO EN EL MERCADO DE SUBCONTRATACIÓN DE PROCESOS EMPRESARIALES (BPO) EN JAPÓN, POR APLICACIÓN, 2018-2032 (MILES DE USD)
TABLA 126 ADQUISICIÓN DE TALENTO EN EL MERCADO DE SUBCONTRATACIÓN DE PROCESOS EMPRESARIALES (BPO) EN JAPÓN, POR APLICACIÓN, 2018-2032 (MILES DE USD)
TABLA 127 ABASTECIMIENTO, ADQUISICIONES Y CADENA DE SUMINISTRO EN EL MERCADO DE SUBCONTRATACIÓN DE PROCESOS EMPRESARIALES (BPO) DE JAPÓN, POR APLICACIÓN, 2018-2032 (MILES DE USD)
TABLA 128 MERCADO DE SUBCONTRATACIÓN DE PROCESOS EMPRESARIALES (BPO) EN JAPÓN, POR TAMAÑO DE LA ORGANIZACIÓN, 2018-2032 (MILES DE USD)
TABLA 129 MERCADO DE SUBCONTRATACIÓN DE PROCESOS EMPRESARIALES (BPO) EN JAPÓN, POR ENFOQUE DE SUBCONTRATACIÓN, 2018-2032 (MILES DE USD)
TABLA 130 MERCADO DE SUBCONTRATACIÓN DE PROCESOS EMPRESARIALES (BPO) EN JAPÓN, POR USUARIO FINAL, 2018-2032 (MILES DE USD)
TABLA 131 MERCADO DE TI EN LA SUBCONTRATACIÓN DE PROCESOS EMPRESARIALES (BPO) DE JAPÓN, POR APLICACIÓN, 2018-2032 (MILES DE USD)
TABLA 132 MERCADO DE SUBCONTRATACIÓN DE PROCESOS EMPRESARIALES (BPO) DE TELECOMUNICACIONES EN JAPÓN, POR APLICACIÓN, 2018-2032 (MILES DE USD)
TABLA 133 MERCADO DE SUBCONTRATACIÓN DE PROCESOS EMPRESARIALES (BPO) EN LA FABRICACIÓN JAPONESA, POR TIPO, 2018-2032 (MILES DE USD)
TABLA 134 MERCADO DE SUBCONTRATACIÓN DE PROCESOS EMPRESARIALES (BPO) EN LA INDUSTRIA AUTOMOTRIZ DE JAPÓN, POR APLICACIÓN, 2018-2032 (MILES DE USD)
TABLA 135 MERCADO DE MAQUINARIA ELECTRÓNICA EN LA SUBCONTRATACIÓN DE PROCESOS EMPRESARIALES (BPO) DE JAPÓN, POR APLICACIÓN, 2018-2032 (MILES DE USD)
TABLA 136 MERCADO DE SUBCONTRATACIÓN DE PROCESOS EMPRESARIALES (BPO) DE PRODUCTOS QUÍMICOS Y MATERIALES DE JAPÓN, POR APLICACIÓN, 2018-2032 (MILES DE USD)
TABLA 137 EQUIPOS DE TIC DE JAPÓN EN EL MERCADO DE SUBCONTRATACIÓN DE PROCESOS EMPRESARIALES (BPO), POR APLICACIÓN, 2018-2032 (MILES DE USD)
TABLA 138 MERCADO DE SUBCONTRATACIÓN DE PROCESOS EMPRESARIALES (BPO) DE ALIMENTOS Y BEBIDAS EN JAPÓN, POR APLICACIÓN, 2018-2032 (MILES DE USD)
TABLA 139 ARQUITECTURA Y VIVIENDA EN EL MERCADO DE SUBCONTRATACIÓN DE PROCESOS EMPRESARIALES (BPO) DE JAPÓN, POR APLICACIÓN, 2018-2032 (MILES DE USD)
TABLA 140 BFSI DE JAPÓN EN EL MERCADO DE SUBCONTRATACIÓN DE PROCESOS EMPRESARIALES (BPO), POR TIPO, 2018-2032 (MILES DE USD)
TABLA 141 BANCA JAPONESA EN EL MERCADO DE SUBCONTRATACIÓN DE PROCESOS EMPRESARIALES (BPO), POR APLICACIÓN, 2018-2032 (MILES DE USD)
TABLA 142 MERCADO DE SERVICIOS FINANCIEROS EN LA SUBCONTRATACIÓN DE PROCESOS EMPRESARIALES (BPO) DE JAPÓN, POR APLICACIÓN, 2018-2032 (MILES DE USD)
TABLA 143 MERCADO DE SUBCONTRATACIÓN DE PROCESOS EMPRESARIALES (BPO) DE SEGUROS EN JAPÓN, POR APLICACIÓN, 2018-2032 (MILES DE USD)
TABLA 144 PARTICIPACIÓN DEL GOBIERNO DE JAPÓN EN EL MERCADO DE SUBCONTRATACIÓN DE PROCESOS EMPRESARIALES (BPO), POR APLICACIÓN, 2018-2032 (MILES DE USD)
TABLA 145 DEFENSA DE JAPÓN EN EL MERCADO DE SUBCONTRATACIÓN DE PROCESOS EMPRESARIALES (BPO), POR APLICACIÓN, 2018-2032 (MILES DE USD)
TABLA 146 PARTICIPACIÓN DEL TRANSPORTE EN EL MERCADO DE SUBCONTRATACIÓN DE PROCESOS EMPRESARIALES (BPO) EN JAPÓN, POR APLICACIÓN, 2018-2032 (MILES DE USD)
TABLA 147 MERCADO DE SUBCONTRATACIÓN DE PROCESOS EMPRESARIALES (BPO) LOGÍSTICOS EN JAPÓN, POR APLICACIÓN, 2018-2032 (MILES DE USD)
TABLA 148 MERCADO DE SUBCONTRATACIÓN DE PROCESOS EMPRESARIALES (BPO) MINORISTA EN JAPÓN, POR APLICACIÓN, 2018-2032 (MILES DE USD)
TABLA 149 MERCADO DE SUBCONTRATACIÓN DE PROCESOS EMPRESARIALES (BPO) EN EL SECTOR DE LA SALUD EN JAPÓN, POR APLICACIÓN, 2018-2032 (MILES DE USD)
TABLA 150 MERCADO DE COMERCIO ELECTRÓNICO EN LA SUBCONTRATACIÓN DE PROCESOS EMPRESARIALES (BPO) DE JAPÓN, POR APLICACIÓN, 2018-2032 (MILES DE USD)
TABLA 151 MERCADO DE SUBCONTRATACIÓN DE PROCESOS EMPRESARIALES (BPO) DE VIAJES EN JAPÓN, POR APLICACIÓN, 2018-2032 (MILES DE USD)
TABLA 152 MERCADO DE SUBCONTRATACIÓN DE PROCESOS EMPRESARIALES (BPO) EN LA HOTELERÍA JAPONESA, POR APLICACIÓN, 2018-2032 (MILES DE USD)
TABLA 153 MERCADO DE SUBCONTRATACIÓN DE PROCESOS EMPRESARIALES (BPO) DE ENERGÍA EN JAPÓN, POR APLICACIÓN, 2018-2032 (MILES DE USD)
TABLA 154 MERCADO DE EDUCACIÓN EN SUBCONTRATACIÓN DE PROCESOS EMPRESARIALES (BPO) EN JAPÓN, POR APLICACIÓN, 2018-2032 (MILES DE USD)
TABLA 155 SERVICIOS PÚBLICOS EN EL MERCADO DE SUBCONTRATACIÓN DE PROCESOS EMPRESARIALES (BPO) DE JAPÓN, POR APLICACIÓN, 2018-2032 (MILES DE USD)
TABLA 156 MERCADO DE SUBCONTRATACIÓN DE PROCESOS EMPRESARIALES (BPO) EN CHINA, POR TIPO DE SUBCONTRATACIÓN, 2018-2032 (MILES DE USD)
TABLA 157 MERCADO DE SUBCONTRATACIÓN DE PROCESOS EMPRESARIALES (BPO) EN CHINA, POR APLICACIÓN, 2018-2032 (MILES DE USD)
TABLA 158 MERCADO DE FINANZAS Y CONTABILIDAD EN LA SUBCONTRATACIÓN DE PROCESOS EMPRESARIALES (BPO) DE CHINA, POR APLICACIÓN, 2018-2032 (MILES DE USD)
TABLA 159 TALENTO Y SERVICIOS DE RR.HH. EN EL MERCADO DE SUBCONTRATACIÓN DE PROCESOS EMPRESARIALES (BPO) DE CHINA, POR APLICACIÓN, 2018-2032 (MILES DE USD)
TABLA 160 EMPLEADOS Y OPERACIONES DE RR.HH. EN EL MERCADO DE SUBCONTRATACIÓN DE PROCESOS EMPRESARIALES (BPO) DE CHINA, POR APLICACIÓN, 2018-2032 (MILES DE USD)
TABLA 161 ADQUISICIÓN Y DESARROLLO DE TALENTO EN CHINA EN EL MERCADO DE SUBCONTRATACIÓN DE PROCESOS EMPRESARIALES (BPO), POR APLICACIÓN, 2018-2032 (MILES DE USD)
TABLA 162 DESARROLLO DE TALENTO EN EL MERCADO DE SUBCONTRATACIÓN DE PROCESOS EMPRESARIALES (BPO) DE CHINA, POR APLICACIÓN, 2018-2032 (MILES DE USD)
TABLA 163 ADQUISICIÓN DE TALENTO EN CHINA EN EL MERCADO DE SUBCONTRATACIÓN DE PROCESOS EMPRESARIALES (BPO), POR APLICACIÓN, 2018-2032 (MILES DE USD)
TABLA 164 ABASTECIMIENTO, ADQUISICIÓN Y CADENA DE SUMINISTRO DE CHINA EN EL MERCADO DE SUBCONTRATACIÓN DE PROCESOS EMPRESARIALES (BPO), POR APLICACIÓN, 2018-2032 (MILES DE USD)
TABLA 165 MERCADO DE SUBCONTRATACIÓN DE PROCESOS EMPRESARIALES (BPO) EN CHINA, POR TAMAÑO DE LA ORGANIZACIÓN, 2018-2032 (MILES DE USD)
TABLA 166 MERCADO DE SUBCONTRATACIÓN DE PROCESOS EMPRESARIALES (BPO) DE CHINA, POR ENFOQUE DE SUBCONTRATACIÓN, 2018-2032 (MILES DE USD)
TABLA 167 MERCADO DE SUBCONTRATACIÓN DE PROCESOS EMPRESARIALES (BPO) EN CHINA, POR USUARIO FINAL, 2018-2032 (MILES DE USD)
TABLA 168 MERCADO DE SUBCONTRATACIÓN DE PROCESOS EMPRESARIALES (BPO) DE TI EN CHINA, POR APLICACIÓN, 2018-2032 (MILES DE USD)
TABLA 169 MERCADO DE SUBCONTRATACIÓN DE PROCESOS EMPRESARIALES (BPO) DE TELECOMUNICACIONES DE CHINA, POR APLICACIÓN, 2018-2032 (MILES DE USD)
TABLA 170 MERCADO DE SUBCONTRATACIÓN DE PROCESOS EMPRESARIALES (BPO) DE MANUFACTURA EN CHINA, POR TIPO, 2018-2032 (MILES DE USD)
TABLA 171 MERCADO DE SUBCONTRATACIÓN DE PROCESOS EMPRESARIALES (BPO) EN EL SECTOR AUTOMOTRIZ DE CHINA, POR APLICACIÓN, 2018-2032 (MILES DE USD)
TABLA 172 MERCADO DE MAQUINARIA ELECTRÓNICA EN LA SUBCONTRATACIÓN DE PROCESOS EMPRESARIALES (BPO) DE CHINA, POR APLICACIÓN, 2018-2032 (MILES DE USD)
TABLA 173 MERCADO DE SUBCONTRATACIÓN DE PROCESOS EMPRESARIALES (BPO) DE PRODUCTOS QUÍMICOS Y MATERIALES DE CHINA, POR APLICACIÓN, 2018-2032 (MILES DE USD)
TABLA 174 EQUIPOS DE TIC DE CHINA EN EL MERCADO DE SUBCONTRATACIÓN DE PROCESOS EMPRESARIALES (BPO), POR APLICACIÓN, 2018-2032 (MILES DE USD)
TABLA 175 MERCADO DE SUBCONTRATACIÓN DE PROCESOS EMPRESARIALES (BPO) DE ALIMENTOS Y BEBIDAS DE CHINA, POR APLICACIÓN, 2018-2032 (MILES DE USD)
TABLA 176 ARQUITECTURA Y VIVIENDA EN EL MERCADO DE SUBCONTRATACIÓN DE PROCESOS EMPRESARIALES (BPO) DE CHINA, POR APLICACIÓN, 2018-2032 (MILES DE USD)
TABLA 177 BFSI DE CHINA EN EL MERCADO DE SUBCONTRATACIÓN DE PROCESOS EMPRESARIALES (BPO), POR TIPO, 2018-2032 (MILES DE USD)
TABLA 178 BANCA CHINA EN EL MERCADO DE SUBCONTRATACIÓN DE PROCESOS EMPRESARIALES (BPO), POR APLICACIÓN, 2018-2032 (MILES DE USD)
TABLA 179 MERCADO DE SERVICIOS FINANCIEROS EN CHINA EN LA SUBCONTRATACIÓN DE PROCESOS EMPRESARIALES (BPO), POR APLICACIÓN, 2018-2032 (MILES DE USD)
TABLA 180 MERCADO DE SEGUROS EN CHINA EN LA SUBCONTRATACIÓN DE PROCESOS EMPRESARIALES (BPO), POR APLICACIÓN, 2018-2032 (MILES DE USD)
TABLA 181 PARTICIPACIÓN DEL GOBIERNO DE CHINA EN EL MERCADO DE SUBCONTRATACIÓN DE PROCESOS EMPRESARIALES (BPO), POR APLICACIÓN, 2018-2032 (MILES DE USD)
TABLA 182 DEFENSA DE CHINA EN EL MERCADO DE SUBCONTRATACIÓN DE PROCESOS EMPRESARIALES (BPO), POR APLICACIÓN, 2018-2032 (MILES DE USD)
TABLA 183 PARTICIPACIÓN DEL TRANSPORTE EN EL MERCADO DE SUBCONTRATACIÓN DE PROCESOS EMPRESARIALES (BPO) DE CHINA, POR APLICACIÓN, 2018-2032 (MILES DE USD)
TABLA 184 MERCADO DE LOGÍSTICA EN CHINA PARA LA SUBCONTRATACIÓN DE PROCESOS EMPRESARIALES (BPO), POR APLICACIÓN, 2018-2032 (MILES DE USD)
TABLA 185 VENTAS MINORISTAS EN EL MERCADO DE SUBCONTRATACIÓN DE PROCESOS EMPRESARIALES (BPO) EN CHINA, POR APLICACIÓN, 2018-2032 (MILES DE USD)
TABLA 186 MERCADO DE SUBCONTRATACIÓN DE PROCESOS EMPRESARIALES (BPO) EN EL SECTOR DE LA SALUD EN CHINA, POR APLICACIÓN, 2018-2032 (MILES DE USD)
TABLA 187 MERCADO DE COMERCIO ELECTRÓNICO EN CHINA EN LA SUBCONTRATACIÓN DE PROCESOS EMPRESARIALES (BPO), POR APLICACIÓN, 2018-2032 (MILES DE USD)
TABLA 188 VIAJES A CHINA EN EL MERCADO DE SUBCONTRATACIÓN DE PROCESOS EMPRESARIALES (BPO), POR APLICACIÓN, 2018-2032 (MILES DE USD)
TABLA 189 HOTELERÍA CHINA EN EL MERCADO DE SUBCONTRATACIÓN DE PROCESOS EMPRESARIALES (BPO), POR APLICACIÓN, 2018-2032 (MILES DE USD)
TABLA 190 MERCADO DE SUBCONTRATACIÓN DE PROCESOS EMPRESARIALES (BPO) DE ENERGÍA EN CHINA, POR APLICACIÓN, 2018-2032 (MILES DE USD)
TABLA 191 MERCADO DE EDUCACIÓN EN CHINA PARA LA SUBCONTRATACIÓN DE PROCESOS EMPRESARIALES (BPO), POR APLICACIÓN, 2018-2032 (MILES DE USD)
TABLA 192 SERVICIOS PÚBLICOS DE CHINA EN EL MERCADO DE SUBCONTRATACIÓN DE PROCESOS EMPRESARIALES (BPO), POR APLICACIÓN, 2018-2032 (MILES DE USD)
TABLA 193 MERCADO DE SUBCONTRATACIÓN DE PROCESOS EMPRESARIALES (BPO) EN INDIA, POR TIPO DE SUBCONTRATACIÓN, 2018-2032 (MILES DE USD)
TABLA 194 MERCADO DE SUBCONTRATACIÓN DE PROCESOS EMPRESARIALES (BPO) EN INDIA, POR APLICACIÓN, 2018-2032 (MILES DE USD)
TABLA 195 MERCADO DE FINANZAS Y CONTABILIDAD EN LA INDIA, POR APLICACIÓN, 2018-2032 (MILES DE USD)
TABLA 196 TALENTO Y SERVICIOS DE RR.HH. EN EL MERCADO DE SUBCONTRATACIÓN DE PROCESOS EMPRESARIALES (BPO) DE INDIA, POR APLICACIÓN, 2018-2032 (MILES DE USD)
TABLA 197 OPERACIONES DE EMPLEADOS Y RR.HH. EN EL MERCADO DE SUBCONTRATACIÓN DE PROCESOS EMPRESARIALES (BPO) DE INDIA, POR APLICACIÓN, 2018-2032 (MILES DE USD)
TABLA 198 ADQUISICIÓN Y DESARROLLO DE TALENTO EN EL MERCADO DE SUBCONTRATACIÓN DE PROCESOS EMPRESARIALES (BPO) DE INDIA, POR APLICACIÓN, 2018-2032 (MILES DE USD)
TABLA 199 DESARROLLO DE TALENTO EN EL MERCADO DE SUBCONTRATACIÓN DE PROCESOS EMPRESARIALES (BPO) DE INDIA, POR APLICACIÓN, 2018-2032 (MILES DE USD)
TABLA 200 ADQUISICIÓN DE TALENTO EN EL MERCADO DE SUBCONTRATACIÓN DE PROCESOS EMPRESARIALES (BPO) EN INDIA, POR APLICACIÓN, 2018-2032 (MILES DE USD)
TABLA 201 ABASTECIMIENTO, ADQUISICIONES Y CADENA DE SUMINISTRO EN EL MERCADO DE SUBCONTRATACIÓN DE PROCESOS EMPRESARIALES (BPO) DE INDIA, POR APLICACIÓN, 2018-2032 (MILES DE USD)
TABLA 202 MERCADO DE SUBCONTRATACIÓN DE PROCESOS EMPRESARIALES (BPO) EN INDIA, POR TAMAÑO DE LA ORGANIZACIÓN, 2018-2032 (MILES DE USD)
TABLA 203 MERCADO DE SUBCONTRATACIÓN DE PROCESOS EMPRESARIALES (BPO) EN INDIA, POR ENFOQUE DE SUBCONTRATACIÓN, 2018-2032 (MILES DE USD)
TABLA 204 MERCADO DE SUBCONTRATACIÓN DE PROCESOS EMPRESARIALES (BPO) EN INDIA, POR USUARIO FINAL, 2018-2032 (MILES DE USD)
TABLA 205 MERCADO DE SUBCONTRATACIÓN DE PROCESOS EMPRESARIALES (BPO) DE TI EN LA INDIA, POR APLICACIÓN, 2018-2032 (MILES DE USD)
TABLA 206 MERCADO DE SUBCONTRATACIÓN DE PROCESOS EMPRESARIALES (BPO) DE TELECOMUNICACIONES EN LA INDIA, POR APLICACIÓN, 2018-2032 (MILES DE USD)
TABLA 207 INDIA: MERCADO DE SUBCONTRATACIÓN DE PROCESOS EMPRESARIALES (BPO), POR TIPO, 2018-2032 (MILES DE USD)
TABLA 208 MERCADO DE SUBCONTRATACIÓN DE PROCESOS EMPRESARIALES (BPO) EN LA INDIA, POR APLICACIÓN, 2018-2032 (MILES DE USD)
TABLA 209 MERCADO DE MAQUINARIA ELECTRÓNICA EN LA INDIA PARA LA SUBCONTRATACIÓN DE PROCESOS EMPRESARIALES (BPO), POR APLICACIÓN, 2018-2032 (MILES DE USD)
TABLA 210 MERCADO DE SUBCONTRATACIÓN DE PROCESOS EMPRESARIALES (BPO) DE PRODUCTOS QUÍMICOS Y MATERIALES DE LA INDIA, POR APLICACIÓN, 2018-2032 (MILES DE USD)
TABLA 211 EQUIPOS DE TIC EN EL MERCADO DE SUBCONTRATACIÓN DE PROCESOS EMPRESARIALES (BPO) DE LA INDIA, POR APLICACIÓN, 2018-2032 (MILES DE USD)
TABLA 212 MERCADO DE SUBCONTRATACIÓN DE PROCESOS EMPRESARIALES (BPO) DE ALIMENTOS Y BEBIDAS EN LA INDIA, POR APLICACIÓN, 2018-2032 (MILES DE USD)
TABLA 213 ARQUITECTURA Y VIVIENDA EN EL MERCADO DE SUBCONTRATACIÓN DE PROCESOS EMPRESARIALES (BPO) DE INDIA, POR APLICACIÓN, 2018-2032 (MILES DE USD)
TABLA 214 INDIA BFSI EN EL MERCADO DE SUBCONTRATACIÓN DE PROCESOS EMPRESARIALES (BPO), POR TIPO, 2018-2032 (MILES DE USD)
TABLA 215 BANCA INDIA EN EL MERCADO DE SUBCONTRATACIÓN DE PROCESOS EMPRESARIALES (BPO), POR APLICACIÓN, 2018-2032 (MILES DE USD)
TABLA 216 SERVICIOS FINANCIEROS EN EL MERCADO DE SUBCONTRATACIÓN DE PROCESOS EMPRESARIALES (BPO) DE LA INDIA, POR APLICACIÓN, 2018-2032 (MILES DE USD)
TABLA 217 MERCADO DE SEGUROS EN LA INDIA EN LA SUBCONTRATACIÓN DE PROCESOS EMPRESARIALES (BPO), POR APLICACIÓN, 2018-2032 (MILES DE USD)
TABLA 218 PARTICIPACIÓN DEL GOBIERNO DE LA INDIA EN EL MERCADO DE SUBCONTRATACIÓN DE PROCESOS EMPRESARIALES (BPO), POR APLICACIÓN, 2018-2032 (MILES DE USD)
TABLA 219 MERCADO DE SUBCONTRATACIÓN DE PROCESOS EMPRESARIALES (BPO) EN LA INDIA, POR APLICACIÓN, 2018-2032 (MILES DE USD)
TABLA 220 INDIA TRANSPORTE S EN EL MERCADO DE SUBCONTRATACIÓN DE PROCESOS EMPRESARIALES (BPO), POR APLICACIÓN, 2018-2032 (MILES DE USD)
TABLA 221 MERCADO DE SUBCONTRATACIÓN DE PROCESOS EMPRESARIALES (BPO) LOGÍSTICOS EN INDIA, POR APLICACIÓN, 2018-2032 (MILES DE USD)
TABLA 222 VENTAS MINORISTAS EN EL MERCADO DE SUBCONTRATACIÓN DE PROCESOS EMPRESARIALES (BPO) DE INDIA, POR APLICACIÓN, 2018-2032 (MILES DE USD)
TABLA 223 MERCADO DE SUBCONTRATACIÓN DE PROCESOS EMPRESARIALES (BPO) DE ATENCIÓN MÉDICA EN LA INDIA, POR APLICACIÓN, 2018-2032 (MILES DE USD)
TABLA 224 INDIA: MERCADO DE SUBCONTRATACIÓN DE PROCESOS EMPRESARIALES (BPO), POR APLICACIÓN, 2018-2032 (MILES DE USD)
TABLA 225 MERCADO DE SUBCONTRATACIÓN DE PROCESOS EMPRESARIALES (BPO) DE VIAJES EN INDIA, POR APLICACIÓN, 2018-2032 (MILES DE USD)
TABLA 226 MERCADO DE SUBCONTRATACIÓN DE PROCESOS EMPRESARIALES (BPO) EN LA INDIA, POR APLICACIÓN, 2018-2032 (MILES DE USD)
TABLA 227 MERCADO DE SUBCONTRATACIÓN DE PROCESOS EMPRESARIALES (BPO) DE ENERGÍA EN LA INDIA, POR APLICACIÓN, 2018-2032 (MILES DE USD)
TABLA 228 MERCADO DE EDUCACIÓN EN LA INDIA PARA LA SUBCONTRATACIÓN DE PROCESOS EMPRESARIALES (BPO), POR APLICACIÓN, 2018-2032 (MILES DE USD)
TABLA 229 SERVICIOS PÚBLICOS EN EL MERCADO DE SUBCONTRATACIÓN DE PROCESOS EMPRESARIALES (BPO) DE LA INDIA, POR APLICACIÓN, 2018-2032 (MILES DE USD)
TABLA 230 MERCADO DE SUBCONTRATACIÓN DE PROCESOS EMPRESARIALES (BPO) DE FILIPINAS, POR TIPO DE SUBCONTRATACIÓN, 2018-2032 (MILES DE USD)
TABLA 231 MERCADO DE SUBCONTRATACIÓN DE PROCESOS EMPRESARIALES (BPO) DE FILIPINAS, POR APLICACIÓN, 2018-2032 (MILES DE USD)
TABLA 232 MERCADO DE FILIPINAS DE FINANZAS Y CONTABILIDAD EN LA SUBCONTRATACIÓN DE PROCESOS EMPRESARIALES (BPO), POR APLICACIÓN, 2018-2032 (MILES DE USD)
TABLA 233 TALENTO Y SERVICIOS DE RR.HH. EN EL MERCADO DE SUBCONTRATACIÓN DE PROCESOS EMPRESARIALES (BPO) DE FILIPINAS, POR APLICACIÓN, 2018-2032 (MILES DE USD)
TABLA 234 OPERACIONES DE EMPLEADOS Y RR.HH. EN EL MERCADO DE SUBCONTRATACIÓN DE PROCESOS EMPRESARIALES (BPO) DE FILIPINAS, POR APLICACIÓN, 2018-2032 (MILES DE USD)
TABLA 235 ADQUISICIÓN Y DESARROLLO DE TALENTO EN EL MERCADO DE SUBCONTRATACIÓN DE PROCESOS EMPRESARIALES (BPO) EN FILIPINAS, POR APLICACIÓN, 2018-2032 (MILES DE USD)
TABLA 236 DESARROLLO DE TALENTO EN EL MERCADO DE SUBCONTRATACIÓN DE PROCESOS EMPRESARIALES (BPO) DE FILIPINAS, POR APLICACIÓN, 2018-2032 (MILES DE USD)
TABLA 237 ADQUISICIÓN DE TALENTO EN EL MERCADO DE SUBCONTRATACIÓN DE PROCESOS EMPRESARIALES (BPO) EN FILIPINAS, POR APLICACIÓN, 2018-2032 (MILES DE USD)
TABLA 238 ABASTECIMIENTO, ADQUISICIONES Y CADENA DE SUMINISTRO EN EL MERCADO DE SUBCONTRATACIÓN DE PROCESOS EMPRESARIALES (BPO) DE FILIPINAS, POR APLICACIÓN, 2018-2032 (MILES DE USD)
TABLA 239 MERCADO DE SUBCONTRATACIÓN DE PROCESOS EMPRESARIALES (BPO) DE FILIPINAS, POR TAMAÑO DE LA ORGANIZACIÓN, 2018-2032 (MILES DE USD)
TABLA 240 MERCADO DE SUBCONTRATACIÓN DE PROCESOS EMPRESARIALES (BPO) DE FILIPINAS, POR ENFOQUE DE SUBCONTRATACIÓN, 2018-2032 (MILES DE USD)
TABLA 241 MERCADO DE SUBCONTRATACIÓN DE PROCESOS EMPRESARIALES (BPO) DE FILIPINAS, POR USUARIO FINAL, 2018-2032 (MILES DE USD)
TABLA 242 MERCADO DE TI EN FILIPINAS PARA LA SUBCONTRATACIÓN DE PROCESOS EMPRESARIALES (BPO), POR APLICACIÓN, 2018-2032 (MILES DE USD)
TABLA 243 MERCADO DE SUBCONTRATACIÓN DE PROCESOS EMPRESARIALES (BPO) DE TELECOMUNICACIONES EN FILIPINAS, POR APLICACIÓN, 2018-2032 (MILES DE USD)
TABLA 244 MERCADO DE SUBCONTRATACIÓN DE PROCESOS EMPRESARIALES (BPO) EN FILIPINAS, POR TIPO, 2018-2032 (MILES DE USD)
TABLA 245 MERCADO DE SUBCONTRATACIÓN DE PROCESOS EMPRESARIALES (BPO) AUTOMOTRIZ DE FILIPINAS, POR APLICACIÓN, 2018-2032 (MILES DE USD)
TABLA 246 MERCADO DE MAQUINARIA ELECTRÓNICA EN LA SUBCONTRATACIÓN DE PROCESOS EMPRESARIALES (BPO) DE FILIPINAS, POR APLICACIÓN, 2018-2032 (MILES DE USD)
TABLA 247 MERCADO DE SUBCONTRATACIÓN DE PROCESOS EMPRESARIALES (BPO) DE PRODUCTOS QUÍMICOS Y MATERIALES DE FILIPINAS, POR APLICACIÓN, 2018-2032 (MILES DE USD)
TABLA 248 EQUIPOS DE TIC EN EL MERCADO DE SUBCONTRATACIÓN DE PROCESOS EMPRESARIALES (BPO) DE FILIPINAS, POR APLICACIÓN, 2018-2032 (MILES DE USD)
TABLA 249 MERCADO DE SUBCONTRATACIÓN DE PROCESOS EMPRESARIALES (BPO) DE ALIMENTOS Y BEBIDAS EN FILIPINAS, POR APLICACIÓN, 2018-2032 (MILES DE USD)
TABLA 250 ARQUITECTURA Y VIVIENDA EN EL MERCADO DE SUBCONTRATACIÓN DE PROCESOS EMPRESARIALES (BPO) DE FILIPINAS, POR APLICACIÓN, 2018-2032 (MILES DE USD)
TABLA 251 BFSI DE FILIPINAS EN EL MERCADO DE SUBCONTRATACIÓN DE PROCESOS EMPRESARIALES (BPO), POR TIPO, 2018-2032 (MILES DE USD)
TABLA 252 BANCA FILIPINAS EN EL MERCADO DE SUBCONTRATACIÓN DE PROCESOS EMPRESARIALES (BPO), POR APLICACIÓN, 2018-2032 (MILES DE USD)
TABLA 253 MERCADO DE SERVICIOS FINANCIEROS EN FILIPINAS EN LA SUBCONTRATACIÓN DE PROCESOS EMPRESARIALES (BPO), POR APLICACIÓN, 2018-2032 (MILES DE USD)
TABLA 254 MERCADO DE SEGUROS EN FILIPINAS EN LA SUBCONTRATACIÓN DE PROCESOS EMPRESARIALES (BPO), POR APLICACIÓN, 2018-2032 (MILES DE USD)
TABLA 255 PARTICIPACIÓN DEL GOBIERNO DE FILIPINAS EN EL MERCADO DE SUBCONTRATACIÓN DE PROCESOS EMPRESARIALES (BPO), POR APLICACIÓN, 2018-2032 (MILES DE USD)
TABLA 256 MERCADO DE SUBCONTRATACIÓN DE PROCESOS EMPRESARIALES (BPO) DE DEFENSA EN FILIPINAS, POR APLICACIÓN, 2018-2032 (MILES DE USD)
TABLA 257 PARTICIPACIÓN DEL TRANSPORTE EN EL MERCADO DE SUBCONTRATACIÓN DE PROCESOS EMPRESARIALES (BPO) DE FILIPINAS, POR APLICACIÓN, 2018-2032 (MILES DE USD)
TABLA 258 MERCADO DE SUBCONTRATACIÓN DE PROCESOS EMPRESARIALES (BPO) LOGÍSTICOS EN FILIPINAS, POR APLICACIÓN, 2018-2032 (MILES DE USD)
TABLA 259 MERCADO DE SUBCONTRATACIÓN DE PROCESOS EMPRESARIALES (BPO) EN FILIPINAS, POR APLICACIÓN, 2018-2032 (MILES DE USD)
TABLA 260 MERCADO DE SUBCONTRATACIÓN DE PROCESOS EMPRESARIALES (BPO) DE ATENCIÓN MÉDICA EN FILIPINAS, POR APLICACIÓN, 2018-2032 (MILES DE USD)
TABLA 261 MERCADO DE COMERCIO ELECTRÓNICO EN FILIPINAS, SUBCONTRATACIÓN DE PROCESOS EMPRESARIALES (BPO), POR APLICACIÓN, 2018-2032 (MILES DE USD)
TABLA 262 MERCADO DE SUBCONTRATACIÓN DE PROCESOS EMPRESARIALES (BPO) DE VIAJES EN FILIPINAS, POR APLICACIÓN, 2018-2032 (MILES DE USD)
TABLA 263 MERCADO DE SUBCONTRATACIÓN DE PROCESOS EMPRESARIALES (BPO) EN LA HOTELERÍA DE FILIPINAS, POR APLICACIÓN, 2018-2032 (MILES DE USD)
TABLA 264 MERCADO DE SUBCONTRATACIÓN DE PROCESOS EMPRESARIALES (BPO) DE ENERGÍA EN FILIPINAS, POR APLICACIÓN, 2018-2032 (MILES DE USD)
TABLA 265 MERCADO DE EDUCACIÓN EN FILIPINAS EN SUBCONTRATACIÓN DE PROCESOS EMPRESARIALES (BPO), POR APLICACIÓN, 2018-2032 (MILES DE USD)
TABLA 266 MERCADO DE SERVICIOS PÚBLICOS DE FILIPINAS EN LA SUBCONTRATACIÓN DE PROCESOS EMPRESARIALES (BPO), POR APLICACIÓN, 2018-2032 (MILES DE USD)
TABLA 267 MERCADO DE SUBCONTRATACIÓN DE PROCESOS EMPRESARIALES (BPO) DE COREA DEL SUR, POR TIPO DE SUBCONTRATACIÓN, 2018-2032 (MILES DE USD)
TABLA 268 MERCADO DE SUBCONTRATACIÓN DE PROCESOS EMPRESARIALES (BPO) DE COREA DEL SUR, POR APLICACIÓN, 2018-2032 (MILES DE USD)
TABLA 269 MERCADO DE FINANZAS Y CONTABILIDAD EN LA SUBCONTRATACIÓN DE PROCESOS EMPRESARIALES (BPO) DE COREA DEL SUR, POR APLICACIÓN, 2018-2032 (MILES DE USD)
TABLA 270 TALENTO Y SERVICIOS DE RR.HH. EN EL MERCADO DE SUBCONTRATACIÓN DE PROCESOS EMPRESARIALES (BPO) DE COREA DEL SUR, POR APLICACIÓN, 2018-2032 (MILES DE USD)
TABLA 271 OPERACIONES DE EMPLEADOS Y RR.HH. EN EL MERCADO DE SUBCONTRATACIÓN DE PROCESOS EMPRESARIALES (BPO) DE COREA DEL SUR, POR APLICACIÓN, 2018-2032 (MILES DE USD)
TABLA 272 ADQUISICIÓN Y DESARROLLO DE TALENTO EN COREA DEL SUR EN EL MERCADO DE SUBCONTRATACIÓN DE PROCESOS EMPRESARIALES (BPO), POR APLICACIÓN, 2018-2032 (MILES DE USD)
TABLA 273 DESARROLLO DE TALENTO EN COREA DEL SUR EN EL MERCADO DE SUBCONTRATACIÓN DE PROCESOS EMPRESARIALES (BPO), POR APLICACIÓN, 2018-2032 (MILES DE USD)
TABLA 274 ADQUISICIÓN DE TALENTO EN COREA DEL SUR EN EL MERCADO DE SUBCONTRATACIÓN DE PROCESOS EMPRESARIALES (BPO), POR APLICACIÓN, 2018-2032 (MILES DE USD)
TABLA 275 ABASTECIMIENTO, ADQUISICIONES Y CADENA DE SUMINISTRO DE COREA DEL SUR EN EL MERCADO DE SUBCONTRATACIÓN DE PROCESOS EMPRESARIALES (BPO), POR APLICACIÓN, 2018-2032 (MILES DE USD)
TABLA 276 MERCADO DE SUBCONTRATACIÓN DE PROCESOS EMPRESARIALES (BPO) DE COREA DEL SUR, POR TAMAÑO DE LA ORGANIZACIÓN, 2018-2032 (MILES DE USD)
TABLA 277 MERCADO DE SUBCONTRATACIÓN DE PROCESOS EMPRESARIALES (BPO) DE COREA DEL SUR, POR ENFOQUE DE SUBCONTRATACIÓN, 2018-2032 (MILES DE USD)
TABLA 278 MERCADO DE SUBCONTRATACIÓN DE PROCESOS EMPRESARIALES (BPO) DE COREA DEL SUR, POR USUARIO FINAL, 2018-2032 (MILES DE USD)
TABLA 279 MERCADO DE SUBCONTRATACIÓN DE PROCESOS EMPRESARIALES (BPO) DE TI EN COREA DEL SUR, POR APLICACIÓN, 2018-2032 (MILES DE USD)
TABLA 280 MERCADO DE SUBCONTRATACIÓN DE PROCESOS EMPRESARIALES (BPO) DE TELECOMUNICACIONES DE COREA DEL SUR, POR APLICACIÓN, 2018-2032 (MILES DE USD)
TABLA 281 MERCADO DE SUBCONTRATACIÓN DE PROCESOS EMPRESARIALES (BPO) DE LA MANUFACTURA DE COREA DEL SUR, POR TIPO, 2018-2032 (MILES DE USD)
TABLA 282 MERCADO DE SUBCONTRATACIÓN DE PROCESOS EMPRESARIALES (BPO) AUTOMOTRIZ DE COREA DEL SUR, POR APLICACIÓN, 2018-2032 (MILES DE USD)
TABLA 283 MERCADO DE MAQUINARIA ELECTRÓNICA EN LA SUBCONTRATACIÓN DE PROCESOS EMPRESARIALES (BPO) DE COREA DEL SUR, POR APLICACIÓN, 2018-2032 (MILES DE USD)
TABLA 284 MERCADO DE SUBCONTRATACIÓN DE PROCESOS EMPRESARIALES (BPO) DE PRODUCTOS QUÍMICOS Y MATERIALES DE COREA DEL SUR, POR APLICACIÓN, 2018-2032 (MILES DE USD)
TABLA 285 EQUIPOS DE TIC DE COREA DEL SUR EN EL MERCADO DE SUBCONTRATACIÓN DE PROCESOS EMPRESARIALES (BPO), POR APLICACIÓN, 2018-2032 (MILES DE USD)
TABLA 286 MERCADO DE ALIMENTOS Y BEBIDAS EN COREA DEL SUR EN LA SUBCONTRATACIÓN DE PROCESOS EMPRESARIALES (BPO), POR APLICACIÓN, 2018-2032 (MILES DE USD)
TABLA 287 ARQUITECTURA Y VIVIENDA DE COREA DEL SUR EN EL MERCADO DE SUBCONTRATACIÓN DE PROCESOS EMPRESARIALES (BPO), POR APLICACIÓN, 2018-2032 (MILES DE USD)
TABLA 288 BFSI DE COREA DEL SUR EN EL MERCADO DE SUBCONTRATACIÓN DE PROCESOS EMPRESARIALES (BPO), POR TIPO, 2018-2032 (MILES DE USD)
TABLA 289 BANCA DE COREA DEL SUR EN EL MERCADO DE SUBCONTRATACIÓN DE PROCESOS EMPRESARIALES (BPO), POR APLICACIÓN, 2018-2032 (MILES DE USD)
TABLA 290 MERCADO DE SERVICIOS FINANCIEROS DE COREA DEL SUR EN LA SUBCONTRATACIÓN DE PROCESOS EMPRESARIALES (BPO), POR APLICACIÓN, 2018-2032 (MILES DE USD)
TABLA 291 MERCADO DE SEGUROS EN LA SUBCONTRATACIÓN DE PROCESOS EMPRESARIALES (BPO) DE COREA DEL SUR, POR APLICACIÓN, 2018-2032 (MILES DE USD)
TABLA 292 PARTICIPACIÓN DEL GOBIERNO DE COREA DEL SUR EN EL MERCADO DE SUBCONTRATACIÓN DE PROCESOS EMPRESARIALES (BPO), POR APLICACIÓN, 2018-2032 (MILES DE USD)
TABLA 293 MERCADO DE SUBCONTRATACIÓN DE PROCESOS EMPRESARIALES (BPO) EN DEFENSA DE COREA DEL SUR, POR APLICACIÓN, 2018-2032 (MILES DE USD)
TABLA 294 TRANSPORTE DE COREA DEL SUR EN EL MERCADO DE SUBCONTRATACIÓN DE PROCESOS EMPRESARIALES (BPO), POR APLICACIÓN, 2018-2032 (MILES DE USD)
TABLA 295 MERCADO DE SUBCONTRATACIÓN DE PROCESOS EMPRESARIALES (BPO) LOGÍSTICOS DE COREA DEL SUR, POR APLICACIÓN, 2018-2032 (MILES DE USD)
TABLA 296 MERCADO DE SUBCONTRATACIÓN DE PROCESOS EMPRESARIALES (BPO) MINORISTA DE COREA DEL SUR, POR APLICACIÓN, 2018-2032 (MILES DE USD)
TABLA 297 MERCADO DE SUBCONTRATACIÓN DE PROCESOS EMPRESARIALES (BPO) DE ATENCIÓN MÉDICA DE COREA DEL SUR, POR APLICACIÓN, 2018-2032 (MILES DE USD)
TABLA 298 MERCADO DE COMERCIO ELECTRÓNICO EN LA SUBCONTRATACIÓN DE PROCESOS EMPRESARIALES (BPO) DE COREA DEL SUR, POR APLICACIÓN, 2018-2032 (MILES DE USD)
TABLA 299 MERCADO DE SUBCONTRATACIÓN DE PROCESOS EMPRESARIALES (BPO) DE VIAJES EN COREA DEL SUR, POR APLICACIÓN, 2018-2032 (MILES DE USD)
TABLA 300 MERCADO DE SUBCONTRATACIÓN DE PROCESOS EMPRESARIALES (BPO) EN LA HOTELERÍA DE COREA DEL SUR, POR APLICACIÓN, 2018-2032 (MILES DE USD)
TABLA 301 MERCADO DE SUBCONTRATACIÓN DE PROCESOS EMPRESARIALES (BPO) DE ENERGÍA EN COREA DEL SUR, POR APLICACIÓN, 2018-2032 (MILES DE USD)
TABLA 302 MERCADO DE EDUCACIÓN EN COREA DEL SUR EN SUBCONTRATACIÓN DE PROCESOS EMPRESARIALES (BPO), POR APLICACIÓN, 2018-2032 (MILES DE USD)
TABLA 303 SERVICIOS PÚBLICOS DE COREA DEL SUR EN EL MERCADO DE SUBCONTRATACIÓN DE PROCESOS EMPRESARIALES (BPO), POR APLICACIÓN, 2018-2032 (MILES DE USD)
TABLA 304 MERCADO DE SUBCONTRATACIÓN DE PROCESOS EMPRESARIALES (BPO) DE AUSTRALIA, POR TIPO DE SUBCONTRATACIÓN, 2018-2032 (MILES DE USD)
TABLA 305 MERCADO DE SUBCONTRATACIÓN DE PROCESOS EMPRESARIALES (BPO) DE AUSTRALIA, POR APLICACIÓN, 2018-2032 (MILES DE USD)
TABLA 306 MERCADO DE FINANZAS Y CONTABILIDAD EN LA SUBCONTRATACIÓN DE PROCESOS EMPRESARIALES (BPO) DE AUSTRALIA, POR APLICACIÓN, 2018-2032 (MILES DE USD)
TABLA 307 TALENTO DE AUSTRALIA Y SERVICIOS DE RR.HH. EN EL MERCADO DE SUBCONTRATACIÓN DE PROCESOS EMPRESARIALES (BPO), POR APLICACIÓN, 2018-2032 (MILES DE USD)
TABLA 308 OPERACIONES DE EMPLEADOS Y RR.HH. EN EL MERCADO DE SUBCONTRATACIÓN DE PROCESOS EMPRESARIALES (BPO) DE AUSTRALIA, POR APLICACIÓN, 2018-2032 (MILES DE USD)
TABLA 309 ADQUISICIÓN Y DESARROLLO DE TALENTO EN EL MERCADO DE SUBCONTRATACIÓN DE PROCESOS EMPRESARIALES (BPO) DE AUSTRALIA, POR APLICACIÓN, 2018-2032 (MILES DE USD)
TABLA 310 DESARROLLO DE TALENTO EN EL MERCADO DE SUBCONTRATACIÓN DE PROCESOS EMPRESARIALES (BPO) DE AUSTRALIA, POR APLICACIÓN, 2018-2032 (MILES DE USD)
TABLA 311 ADQUISICIÓN DE TALENTO EN AUSTRALIA EN EL MERCADO DE SUBCONTRATACIÓN DE PROCESOS EMPRESARIALES (BPO), POR APLICACIÓN, 2018-2032 (MILES DE USD)
TABLA 312 ABASTECIMIENTO, ADQUISICIONES Y CADENA DE SUMINISTRO EN EL MERCADO DE SUBCONTRATACIÓN DE PROCESOS EMPRESARIALES (BPO) DE AUSTRALIA, POR APLICACIÓN, 2018-2032 (MILES DE USD)
TABLA 313 MERCADO DE SUBCONTRATACIÓN DE PROCESOS EMPRESARIALES (BPO) DE AUSTRALIA, POR TAMAÑO DE LA ORGANIZACIÓN, 2018-2032 (MILES DE USD)
TABLA 314 MERCADO DE SUBCONTRATACIÓN DE PROCESOS EMPRESARIALES (BPO) DE AUSTRALIA, POR ENFOQUE DE SUBCONTRATACIÓN, 2018-2032 (MILES DE USD)
TABLA 315 MERCADO DE SUBCONTRATACIÓN DE PROCESOS EMPRESARIALES (BPO) DE AUSTRALIA, POR USUARIO FINAL, 2018-2032 (MILES DE USD)
TABLA 316 MERCADO DE SUBCONTRATACIÓN DE PROCESOS EMPRESARIALES (BPO) DE TI EN AUSTRALIA, POR APLICACIÓN, 2018-2032 (MILES DE USD)
TABLA 317 MERCADO DE SUBCONTRATACIÓN DE PROCESOS EMPRESARIALES (BPO) DE TELECOMUNICACIONES DE AUSTRALIA, POR APLICACIÓN, 2018-2032 (MILES DE USD)
TABLA 318 MERCADO DE SUBCONTRATACIÓN DE PROCESOS EMPRESARIALES (BPO) DE MANUFACTURA EN AUSTRALIA, POR TIPO, 2018-2032 (MILES DE USD)
TABLA 319 MERCADO DE SUBCONTRATACIÓN DE PROCESOS EMPRESARIALES (BPO) EN EL SECTOR AUTOMOTRIZ DE AUSTRALIA, POR APLICACIÓN, 2018-2032 (MILES DE USD)
TABLA 320 MERCADO DE MAQUINARIA ELECTRÓNICA EN LA SUBCONTRATACIÓN DE PROCESOS EMPRESARIALES (BPO) DE AUSTRALIA, POR APLICACIÓN, 2018-2032 (MILES DE USD)
TABLA 321 MERCADO DE SUBCONTRATACIÓN DE PROCESOS EMPRESARIALES (BPO) DE PRODUCTOS QUÍMICOS Y MATERIALES DE AUSTRALIA, POR APLICACIÓN, 2018-2032 (MILES DE USD)
TABLA 322 EQUIPOS DE TIC EN EL MERCADO DE SUBCONTRATACIÓN DE PROCESOS EMPRESARIALES (BPO) DE AUSTRALIA, POR APLICACIÓN, 2018-2032 (MILES DE USD)
TABLA 323 MERCADO DE SUBCONTRATACIÓN DE PROCESOS EMPRESARIALES (BPO) DE ALIMENTOS Y BEBIDAS DE AUSTRALIA, POR APLICACIÓN, 2018-2032 (MILES DE USD)
TABLA 324 ARQUITECTURA Y VIVIENDA EN EL MERCADO DE SUBCONTRATACIÓN DE PROCESOS EMPRESARIALES (BPO) DE AUSTRALIA, POR APLICACIÓN, 2018-2032 (MILES DE USD)
TABLA 325 AUSTRALIA BFSI EN EL MERCADO DE SUBCONTRATACIÓN DE PROCESOS EMPRESARIALES (BPO), POR TIPO, 2018-2032 (MILES DE USD)
TABLA 326 BANCA AUSTRALIANA EN EL MERCADO DE SUBCONTRATACIÓN DE PROCESOS EMPRESARIALES (BPO), POR APLICACIÓN, 2018-2032 (MILES DE USD)
TABLA 327 MERCADO DE SERVICIOS FINANCIEROS EN LA SUBCONTRATACIÓN DE PROCESOS EMPRESARIALES (BPO) DE AUSTRALIA, POR APLICACIÓN, 2018-2032 (MILES DE USD)
TABLA 328 MERCADO DE SEGUROS EN LA SUBCONTRATACIÓN DE PROCESOS EMPRESARIALES (BPO) DE AUSTRALIA, POR APLICACIÓN, 2018-2032 (MILES DE USD)
TABLA 329 PARTICIPACIÓN DEL GOBIERNO DE AUSTRALIA EN EL MERCADO DE SUBCONTRATACIÓN DE PROCESOS EMPRESARIALES (BPO), POR APLICACIÓN, 2018-2032 (MILES DE USD)
TABLA 330 MERCADO DE SUBCONTRATACIÓN DE PROCESOS EMPRESARIALES (BPO) EN AUSTRALIA, POR APLICACIÓN, 2018-2032 (MILES DE USD)
TABLA 331 PARTICIPACIÓN DEL TRANSPORTE EN EL MERCADO DE SUBCONTRATACIÓN DE PROCESOS EMPRESARIALES (BPO) DE AUSTRALIA, POR APLICACIÓN, 2018-2032 (MILES DE USD)
TABLA 332 MERCADO DE SUBCONTRATACIÓN DE PROCESOS EMPRESARIALES (BPO) LOGÍSTICOS EN AUSTRALIA, POR APLICACIÓN, 2018-2032 (MILES DE USD)
TABLA 333 MERCADO DE SUBCONTRATACIÓN DE PROCESOS EMPRESARIALES (BPO) MINORISTA DE AUSTRALIA, POR APLICACIÓN, 2018-2032 (MILES DE USD)
TABLA 334 MERCADO DE SUBCONTRATACIÓN DE PROCESOS EMPRESARIALES (BPO) DE ATENCIÓN MÉDICA EN AUSTRALIA, POR APLICACIÓN, 2018-2032 (MILES DE USD)
TABLA 335 MERCADO DE COMERCIO ELECTRÓNICO EN LA SUBCONTRATACIÓN DE PROCESOS EMPRESARIALES (BPO) DE AUSTRALIA, POR APLICACIÓN, 2018-2032 (MILES DE USD)
TABLA 336 MERCADO DE SUBCONTRATACIÓN DE PROCESOS EMPRESARIALES (BPO) DE VIAJES EN AUSTRALIA, POR APLICACIÓN, 2018-2032 (MILES DE USD)
TABLA 337 MERCADO DE SUBCONTRATACIÓN DE PROCESOS EMPRESARIALES (BPO) EN LA HOTELERÍA DE AUSTRALIA, POR APLICACIÓN, 2018-2032 (MILES DE USD)
TABLA 338 MERCADO DE SUBCONTRATACIÓN DE PROCESOS EMPRESARIALES (BPO) DE ENERGÍA EN AUSTRALIA, POR APLICACIÓN, 2018-2032 (MILES DE USD)
TABLA 339 MERCADO DE EDUCACIÓN EN SUBCONTRATACIÓN DE PROCESOS EMPRESARIALES (BPO) DE AUSTRALIA, POR APLICACIÓN, 2018-2032 (MILES DE USD)
TABLA 340 SERVICIOS PÚBLICOS DE AUSTRALIA EN EL MERCADO DE SUBCONTRATACIÓN DE PROCESOS EMPRESARIALES (BPO), POR APLICACIÓN, 2018-2032 (MILES DE USD)
TABLA 341 MERCADO DE SUBCONTRATACIÓN DE PROCESOS EMPRESARIALES (BPO) DE SINGAPUR, POR TIPO DE SUBCONTRATACIÓN, 2018-2032 (MILES DE USD)
TABLA 342 MERCADO DE SUBCONTRATACIÓN DE PROCESOS EMPRESARIALES (BPO) DE SINGAPUR, POR APLICACIÓN, 2018-2032 (MILES DE USD)
TABLA 343 MERCADO DE FINANZAS Y CONTABILIDAD EN LA SUBCONTRATACIÓN DE PROCESOS EMPRESARIALES (BPO) DE SINGAPUR, POR APLICACIÓN, 2018-2032 (MILES DE USD)
TABLA 344 TALENTO Y SERVICIOS DE RR.HH. EN EL MERCADO DE SUBCONTRATACIÓN DE PROCESOS EMPRESARIALES (BPO) DE SINGAPUR, POR APLICACIÓN, 2018-2032 (MILES DE USD)
TABLA 345 OPERACIONES DE EMPLEADOS Y RR.HH. EN EL MERCADO DE SUBCONTRATACIÓN DE PROCESOS EMPRESARIALES (BPO) DE SINGAPUR, POR APLICACIÓN, 2018-2032 (MILES DE USD)
TABLA 346 ADQUISICIÓN Y DESARROLLO DE TALENTO EN SINGAPUR EN EL MERCADO DE SUBCONTRATACIÓN DE PROCESOS EMPRESARIALES (BPO), POR APLICACIÓN, 2018-2032 (MILES DE USD)
TABLA 347 DESARROLLO DE TALENTO EN EL MERCADO DE SUBCONTRATACIÓN DE PROCESOS EMPRESARIALES (BPO) DE SINGAPUR, POR APLICACIÓN, 2018-2032 (MILES DE USD)
TABLA 348 ADQUISICIÓN DE TALENTO EN SINGAPUR EN EL MERCADO DE SUBCONTRATACIÓN DE PROCESOS EMPRESARIALES (BPO), POR APLICACIÓN, 2018-2032 (MILES DE USD)
TABLA 349 ABASTECIMIENTO, ADQUISICIONES Y CADENA DE SUMINISTRO EN EL MERCADO DE SUBCONTRATACIÓN DE PROCESOS EMPRESARIALES (BPO) DE SINGAPUR, POR APLICACIÓN, 2018-2032 (MILES DE USD)
TABLA 350 MERCADO DE SUBCONTRATACIÓN DE PROCESOS EMPRESARIALES (BPO) DE SINGAPUR, POR TAMAÑO DE LA ORGANIZACIÓN, 2018-2032 (MILES DE USD)
TABLA 351 MERCADO DE SUBCONTRATACIÓN DE PROCESOS EMPRESARIALES (BPO) DE SINGAPUR, POR ENFOQUE DE SUBCONTRATACIÓN, 2018-2032 (MILES DE USD)
TABLA 352 MERCADO DE SUBCONTRATACIÓN DE PROCESOS EMPRESARIALES (BPO) DE SINGAPUR, POR USUARIO FINAL, 2018-2032 (MILES DE USD)
TABLA 353 MERCADO DE SUBCONTRATACIÓN DE PROCESOS EMPRESARIALES (BPO) DE TI EN SINGAPUR, POR APLICACIÓN, 2018-2032 (MILES DE USD)
TABLA 354 MERCADO DE SUBCONTRATACIÓN DE PROCESOS EMPRESARIALES (BPO) DE TELECOMUNICACIONES DE SINGAPUR, POR APLICACIÓN, 2018-2032 (MILES DE USD)
TABLA 355 MERCADO DE SUBCONTRATACIÓN DE PROCESOS EMPRESARIALES (BPO) DE MANUFACTURA EN SINGAPUR, POR TIPO, 2018-2032 (MILES DE USD)
TABLA 356 MERCADO DE SUBCONTRATACIÓN DE PROCESOS EMPRESARIALES (BPO) EN EL SECTOR AUTOMOTRIZ DE SINGAPUR, POR APLICACIÓN, 2018-2032 (MILES DE USD)
TABLA 357 MERCADO DE MAQUINARIA ELECTRÓNICA DE SINGAPUR EN LA SUBCONTRATACIÓN DE PROCESOS EMPRESARIALES (BPO), POR APLICACIÓN, 2018-2032 (MILES DE USD)
TABLA 358 MERCADO DE SUBCONTRATACIÓN DE PROCESOS EMPRESARIALES (BPO) DE PRODUCTOS QUÍMICOS Y MATERIALES DE SINGAPUR, POR APLICACIÓN, 2018-2032 (MILES DE USD)
TABLA 359 EQUIPOS DE TIC DE SINGAPUR EN EL MERCADO DE SUBCONTRATACIÓN DE PROCESOS EMPRESARIALES (BPO), POR APLICACIÓN, 2018-2032 (MILES DE USD)
TABLA 360 MERCADO DE SUBCONTRATACIÓN DE PROCESOS EMPRESARIALES (BPO) EN ALIMENTOS Y BEBIDAS DE SINGAPUR, POR APLICACIÓN, 2018-2032 (MILES DE USD)
TABLA 361 ARQUITECTURA Y VIVIENDA DE SINGAPUR EN EL MERCADO DE SUBCONTRATACIÓN DE PROCESOS EMPRESARIALES (BPO), POR APLICACIÓN, 2018-2032 (MILES DE USD)
TABLA 362 BFSI DE SINGAPUR EN EL MERCADO DE SUBCONTRATACIÓN DE PROCESOS EMPRESARIALES (BPO), POR TIPO, 2018-2032 (MILES DE USD)
TABLA 363 BANCA DE SINGAPUR EN EL MERCADO DE SUBCONTRATACIÓN DE PROCESOS EMPRESARIALES (BPO), POR APLICACIÓN, 2018-2032 (MILES DE USD)
TABLA 364 SERVICIOS FINANCIEROS EN EL MERCADO DE SUBCONTRATACIÓN DE PROCESOS EMPRESARIALES (BPO) DE SINGAPUR, POR APLICACIÓN, 2018-2032 (MILES DE USD)
TABLA 365 MERCADO DE SUBCONTRATACIÓN DE PROCESOS EMPRESARIALES (BPO) DE SEGUROS EN SINGAPUR, POR APLICACIÓN, 2018-2032 (MILES DE USD)
TABLA 366 PARTICIPACIÓN DEL GOBIERNO DE SINGAPUR EN EL MERCADO DE SUBCONTRATACIÓN DE PROCESOS EMPRESARIALES (BPO), POR APLICACIÓN, 2018-2032 (MILES DE USD)
TABLA 367 MERCADO DE SUBCONTRATACIÓN DE PROCESOS EMPRESARIALES (BPO) DE DEFENSA EN SINGAPUR, POR APLICACIÓN, 2018-2032 (MILES DE USD)
TABLA 368 TRANSPORTE DE SINGAPUR EN EL MERCADO DE SUBCONTRATACIÓN DE PROCESOS EMPRESARIALES (BPO), POR APLICACIÓN, 2018-2032 (MILES DE USD)
TABLA 369 MERCADO DE SUBCONTRATACIÓN DE PROCESOS EMPRESARIALES (BPO) LOGÍSTICOS EN SINGAPUR, POR APLICACIÓN, 2018-2032 (MILES DE USD)
TABLA 370 MERCADO DE SUBCONTRATACIÓN DE PROCESOS EMPRESARIALES (BPO) MINORISTA EN SINGAPUR, POR APLICACIÓN, 2018-2032 (MILES DE USD)
TABLA 371 MERCADO DE SUBCONTRATACIÓN DE PROCESOS EMPRESARIALES (BPO) EN EL SECTOR SANITARIO DE SINGAPUR, POR APLICACIÓN, 2018-2032 (MILES DE USD)
TABLA 372 MERCADO DE COMERCIO ELECTRÓNICO EN LA SUBCONTRATACIÓN DE PROCESOS EMPRESARIALES (BPO) DE SINGAPUR, POR APLICACIÓN, 2018-2032 (MILES DE USD)
TABLA 373 MERCADO DE SUBCONTRATACIÓN DE PROCESOS EMPRESARIALES (BPO) DE VIAJES EN SINGAPUR, POR APLICACIÓN, 2018-2032 (MILES DE USD)
TABLA 374 HOTELERÍA DE SINGAPUR EN EL MERCADO DE SUBCONTRATACIÓN DE PROCESOS EMPRESARIALES (BPO), POR APLICACIÓN, 2018-2032 (MILES DE USD)
TABLA 375 MERCADO DE SUBCONTRATACIÓN DE PROCESOS EMPRESARIALES (BPO) DE ENERGÍA EN SINGAPUR, POR APLICACIÓN, 2018-2032 (MILES DE USD)
TABLA 376 MERCADO DE EDUCACIÓN EN SUBCONTRATACIÓN DE PROCESOS EMPRESARIALES (BPO) EN SINGAPUR, POR APLICACIÓN, 2018-2032 (MILES DE USD)
TABLA 377 SERVICIOS PÚBLICOS DE SINGAPUR EN EL MERCADO DE SUBCONTRATACIÓN DE PROCESOS EMPRESARIALES (BPO), POR APLICACIÓN, 2018-2032 (MILES DE USD)
TABLA 378 MERCADO DE SUBCONTRATACIÓN DE PROCESOS EMPRESARIALES (BPO) DE TAILANDIA, POR TIPO DE SUBCONTRATACIÓN, 2018-2032 (MILES DE USD)
TABLA 379 MERCADO DE SUBCONTRATACIÓN DE PROCESOS EMPRESARIALES (BPO) DE TAILANDIA, POR APLICACIÓN, 2018-2032 (MILES DE USD)
TABLA 380 MERCADO DE FINANZAS Y CONTABILIDAD EN LA SUBCONTRATACIÓN DE PROCESOS EMPRESARIALES (BPO) DE TAILANDIA, POR APLICACIÓN, 2018-2032 (MILES DE USD)
TABLA 381 TALENTO Y SERVICIOS DE RR.HH. EN EL MERCADO DE SUBCONTRATACIÓN DE PROCESOS EMPRESARIALES (BPO) DE TAILANDIA, POR APLICACIÓN, 2018-2032 (MILES DE USD)
TABLA 382 OPERACIONES DE EMPLEADOS Y RR.HH. EN EL MERCADO DE SUBCONTRATACIÓN DE PROCESOS EMPRESARIALES (BPO) DE TAILANDIA, POR APLICACIÓN, 2018-2032 (MILES DE USD)
TABLA 383 ADQUISICIÓN Y DESARROLLO DE TALENTO EN EL MERCADO DE SUBCONTRATACIÓN DE PROCESOS EMPRESARIALES (BPO) DE TAILANDIA, POR APLICACIÓN, 2018-2032 (MILES DE USD)
TABLA 384 DESARROLLO DE TALENTO EN EL MERCADO DE SUBCONTRATACIÓN DE PROCESOS EMPRESARIALES (BPO) DE TAILANDIA, POR APLICACIÓN, 2018-2032 (MILES DE USD)
TABLA 385 ADQUISICIÓN DE TALENTO EN TAILANDIA EN EL MERCADO DE SUBCONTRATACIÓN DE PROCESOS EMPRESARIALES (BPO), POR APLICACIÓN, 2018-2032 (MILES DE USD)
TABLA 386 ABASTECIMIENTO, ADQUISICIONES Y CADENA DE SUMINISTRO DE TAILANDIA EN EL MERCADO DE SUBCONTRATACIÓN DE PROCESOS EMPRESARIALES (BPO), POR APLICACIÓN, 2018-2032 (MILES DE USD)
TABLA 387 MERCADO DE SUBCONTRATACIÓN DE PROCESOS EMPRESARIALES (BPO) DE TAILANDIA, POR TAMAÑO DE LA ORGANIZACIÓN, 2018-2032 (MILES DE USD)
TABLA 388 MERCADO DE SUBCONTRATACIÓN DE PROCESOS EMPRESARIALES (BPO) DE TAILANDIA, POR ENFOQUE DE SUBCONTRATACIÓN, 2018-2032 (MILES DE USD)
TABLA 389 MERCADO DE SUBCONTRATACIÓN DE PROCESOS EMPRESARIALES (BPO) DE TAILANDIA, POR USUARIO FINAL, 2018-2032 (MILES DE USD)
TABLA 390 MERCADO DE SUBCONTRATACIÓN DE PROCESOS EMPRESARIALES (BPO) DE TI EN TAILANDIA, POR APLICACIÓN, 2018-2032 (MILES DE USD)
TABLA 391 MERCADO DE SUBCONTRATACIÓN DE PROCESOS EMPRESARIALES (BPO) DE TELECOMUNICACIONES DE TAILANDIA, POR APLICACIÓN, 2018-2032 (MILES DE USD)
TABLA 392 MERCADO DE SUBCONTRATACIÓN DE PROCESOS EMPRESARIALES (BPO) DE MANUFACTURA EN TAILANDIA, POR TIPO, 2018-2032 (MILES DE USD)
TABLA 393 MERCADO DE SUBCONTRATACIÓN DE PROCESOS EMPRESARIALES (BPO) AUTOMOTRIZ DE TAILANDIA, POR APLICACIÓN, 2018-2032 (MILES DE USD)
TABLA 394 MERCADO DE MAQUINARIA ELECTRÓNICA EN LA SUBCONTRATACIÓN DE PROCESOS EMPRESARIALES (BPO) DE TAILANDIA, POR APLICACIÓN, 2018-2032 (MILES DE USD)
TABLA 395 MERCADO DE SUBCONTRATACIÓN DE PROCESOS EMPRESARIALES (BPO) DE PRODUCTOS QUÍMICOS Y MATERIALES DE TAILANDIA, POR APLICACIÓN, 2018-2032 (MILES DE USD)
TABLA 396 EQUIPOS DE TIC DE TAILANDIA EN EL MERCADO DE SUBCONTRATACIÓN DE PROCESOS EMPRESARIALES (BPO), POR APLICACIÓN, 2018-2032 (MILES DE USD)
TABLA 397 MERCADO DE SUBCONTRATACIÓN DE PROCESOS EMPRESARIALES (BPO) DE ALIMENTOS Y BEBIDAS DE TAILANDIA, POR APLICACIÓN, 2018-2032 (MILES DE USD)
TABLA 398 ARQUITECTURA Y VIVIENDA DE TAILANDIA EN EL MERCADO DE SUBCONTRATACIÓN DE PROCESOS EMPRESARIALES (BPO), POR APLICACIÓN, 2018-2032 (MILES DE USD)
TABLA 399 BFSI DE TAILANDIA EN EL MERCADO DE SUBCONTRATACIÓN DE PROCESOS EMPRESARIALES (BPO), POR TIPO, 2018-2032 (MILES DE USD)
TABLA 400 BANCA DE TAILANDIA EN EL MERCADO DE SUBCONTRATACIÓN DE PROCESOS EMPRESARIALES (BPO), POR APLICACIÓN, 2018-2032 (MILES DE USD)
TABLA 401 SERVICIOS FINANCIEROS EN EL MERCADO DE SUBCONTRATACIÓN DE PROCESOS EMPRESARIALES (BPO) DE TAILANDIA, POR APLICACIÓN, 2018-2032 (MILES DE USD)
TABLA 402 MERCADO DE SEGUROS EN TAILANDIA EN LA SUBCONTRATACIÓN DE PROCESOS EMPRESARIALES (BPO), POR APLICACIÓN, 2018-2032 (MILES DE USD)
TABLA 403 PARTICIPACIÓN DEL GOBIERNO DE TAILANDIA EN EL MERCADO DE SUBCONTRATACIÓN DE PROCESOS EMPRESARIALES (BPO), POR APLICACIÓN, 2018-2032 (MILES DE USD)
TABLA 404 MERCADO DE SUBCONTRATACIÓN DE PROCESOS EMPRESARIALES (BPO) DE DEFENSA DE TAILANDIA, POR APLICACIÓN, 2018-2032 (MILES DE USD)
TABLA 405 PARTICIPACIÓN DEL TRANSPORTE EN EL MERCADO DE SUBCONTRATACIÓN DE PROCESOS EMPRESARIALES (BPO) DE TAILANDIA, POR APLICACIÓN, 2018-2032 (MILES DE USD)
TABLA 406 MERCADO DE SUBCONTRATACIÓN DE PROCESOS EMPRESARIALES (BPO) LOGÍSTICOS DE TAILANDIA, POR APLICACIÓN, 2018-2032 (MILES DE USD)
TABLA 407 MERCADO DE SUBCONTRATACIÓN DE PROCESOS EMPRESARIALES (BPO) EN TAILANDIA, POR APLICACIÓN, 2018-2032 (MILES DE USD)
TABLA 408 MERCADO DE SUBCONTRATACIÓN DE PROCESOS EMPRESARIALES (BPO) DE ATENCIÓN MÉDICA EN TAILANDIA, POR APLICACIÓN, 2018-2032 (MILES DE USD)
TABLA 409 MERCADO DE COMERCIO ELECTRÓNICO EN TAILANDIA EN LA SUBCONTRATACIÓN DE PROCESOS EMPRESARIALES (BPO), POR APLICACIÓN, 2018-2032 (MILES DE USD)
TABLA 410 MERCADO DE SUBCONTRATACIÓN DE PROCESOS EMPRESARIALES (BPO) DE VIAJES EN TAILANDIA, POR APLICACIÓN, 2018-2032 (MILES DE USD)
TABLA 411 MERCADO DE SUBCONTRATACIÓN DE PROCESOS EMPRESARIALES (BPO) EN HOTELERÍA DE TAILANDIA, POR APLICACIÓN, 2018-2032 (MILES DE USD)
TABLA 412 MERCADO DE SUBCONTRATACIÓN DE PROCESOS EMPRESARIALES (BPO) DE ENERGÍA EN TAILANDIA, POR APLICACIÓN, 2018-2032 (MILES DE USD)
TABLA 413 MERCADO DE EDUCACIÓN EN TAILANDIA EN SUBCONTRATACIÓN DE PROCESOS EMPRESARIALES (BPO), POR APLICACIÓN, 2018-2032 (MILES DE USD)
TABLA 414 SERVICIOS PÚBLICOS DE TAILANDIA EN EL MERCADO DE SUBCONTRATACIÓN DE PROCESOS EMPRESARIALES (BPO), POR APLICACIÓN, 2018-2032 (MILES DE USD)
TABLA 415 MERCADO DE SUBCONTRATACIÓN DE PROCESOS EMPRESARIALES (BPO) DE INDONESIA, POR TIPO DE SUBCONTRATACIÓN, 2018-2032 (MILES DE USD)
TABLA 416 MERCADO DE SUBCONTRATACIÓN DE PROCESOS EMPRESARIALES (BPO) DE INDONESIA, POR APLICACIÓN, 2018-2032 (MILES DE USD)
TABLA 417 MERCADO DE FINANZAS Y CONTABILIDAD EN LA SUBCONTRATACIÓN DE PROCESOS EMPRESARIALES (BPO) DE INDONESIA, POR APLICACIÓN, 2018-2032 (MILES DE USD)
TABLA 418 TALENTO Y SERVICIOS DE RR.HH. EN EL MERCADO DE SUBCONTRATACIÓN DE PROCESOS EMPRESARIALES (BPO) DE INDONESIA, POR APLICACIÓN, 2018-2032 (MILES DE USD)
TABLA 419 OPERACIONES DE EMPLEADOS Y RR.HH. EN EL MERCADO DE SUBCONTRATACIÓN DE PROCESOS EMPRESARIALES (BPO) DE INDONESIA, POR APLICACIÓN, 2018-2032 (MILES DE USD)
TABLA 420 ADQUISICIÓN Y DESARROLLO DE TALENTO EN EL MERCADO DE SUBCONTRATACIÓN DE PROCESOS EMPRESARIALES (BPO) DE INDONESIA, POR APLICACIÓN, 2018-2032 (MILES DE USD)
TABLA 421 DESARROLLO DE TALENTO EN EL MERCADO DE SUBCONTRATACIÓN DE PROCESOS EMPRESARIALES (BPO) DE INDONESIA, POR APLICACIÓN, 2018-2032 (MILES DE USD)
TABLA 422 ADQUISICIÓN DE TALENTO EN EL MERCADO DE SUBCONTRATACIÓN DE PROCESOS EMPRESARIALES (BPO) DE INDONESIA, POR APLICACIÓN, 2018-2032 (MILES DE USD)
TABLA 423 ABASTECIMIENTO, ADQUISICIONES Y CADENA DE SUMINISTRO EN EL MERCADO DE SUBCONTRATACIÓN DE PROCESOS EMPRESARIALES (BPO) DE INDONESIA, POR APLICACIÓN, 2018-2032 (MILES DE USD)
TABLA 424 MERCADO DE SUBCONTRATACIÓN DE PROCESOS EMPRESARIALES (BPO) DE INDONESIA, POR TAMAÑO DE LA ORGANIZACIÓN, 2018-2032 (MILES DE USD)
TABLA 425 MERCADO DE SUBCONTRATACIÓN DE PROCESOS EMPRESARIALES (BPO) DE INDONESIA, POR ENFOQUE DE SUBCONTRATACIÓN, 2018-2032 (MILES DE USD)
TABLA 426 MERCADO DE SUBCONTRATACIÓN DE PROCESOS EMPRESARIALES (BPO) DE INDONESIA, POR USUARIO FINAL, 2018-2032 (MILES DE USD)
TABLA 427 MERCADO DE SUBCONTRATACIÓN DE PROCESOS EMPRESARIALES (BPO) DE TI EN INDONESIA, POR APLICACIÓN, 2018-2032 (MILES DE USD)
TABLA 428 MERCADO DE SUBCONTRATACIÓN DE PROCESOS EMPRESARIALES (BPO) DE TELECOMUNICACIONES DE INDONESIA, POR APLICACIÓN, 2018-2032 (MILES DE USD)
TABLA 429 MERCADO DE SUBCONTRATACIÓN DE PROCESOS EMPRESARIALES (BPO) EN INDONESIA, POR TIPO, 2018-2032 (MILES DE USD)
TABLA 430 MERCADO DE SUBCONTRATACIÓN DE PROCESOS EMPRESARIALES (BPO) AUTOMOTRIZ DE INDONESIA, POR APLICACIÓN, 2018-2032 (MILES DE USD)
TABLA 431 MERCADO DE MAQUINARIA ELECTRÓNICA EN LA SUBCONTRATACIÓN DE PROCESOS EMPRESARIALES (BPO) DE INDONESIA, POR APLICACIÓN, 2018-2032 (MILES DE USD)
TABLA 432 MERCADO DE SUBCONTRATACIÓN DE PROCESOS EMPRESARIALES (BPO) DE PRODUCTOS QUÍMICOS Y MATERIALES DE INDONESIA, POR APLICACIÓN, 2018-2032 (MILES DE USD)
TABLA 433 EQUIPOS DE TIC EN EL MERCADO DE SUBCONTRATACIÓN DE PROCESOS EMPRESARIALES (BPO) DE INDONESIA, POR APLICACIÓN, 2018-2032 (MILES DE USD)
TABLA 434 MERCADO DE SUBCONTRATACIÓN DE PROCESOS EMPRESARIALES (BPO) DE ALIMENTOS Y BEBIDAS EN INDONESIA, POR APLICACIÓN, 2018-2032 (MILES DE USD)
TABLA 435 ARQUITECTURA Y VIVIENDA EN EL MERCADO DE SUBCONTRATACIÓN DE PROCESOS EMPRESARIALES (BPO) DE INDONESIA, POR APLICACIÓN, 2018-2032 (MILES DE USD)
TABLA 436 INDONESIA BFSI EN EL MERCADO DE SUBCONTRATACIÓN DE PROCESOS EMPRESARIALES (BPO), POR TIPO, 2018-2032 (MILES DE USD)
TABLA 437 BANCA DE INDONESIA EN EL MERCADO DE SUBCONTRATACIÓN DE PROCESOS EMPRESARIALES (BPO), POR APLICACIÓN, 2018-2032 (MILES DE USD)
TABLA 438 SERVICIOS FINANCIEROS EN EL MERCADO DE SUBCONTRATACIÓN DE PROCESOS EMPRESARIALES (BPO) DE INDONESIA, POR APLICACIÓN, 2018-2032 (MILES DE USD)
TABLA 439 SEGUROS EN EL MERCADO DE SUBCONTRATACIÓN DE PROCESOS EMPRESARIALES (BPO) DE INDONESIA, POR APLICACIÓN, 2018-2032 (MILES DE USD)
TABLA 440 PARTICIPACIÓN DEL GOBIERNO DE INDONESIA EN EL MERCADO DE SUBCONTRATACIÓN DE PROCESOS EMPRESARIALES (BPO), POR APLICACIÓN, 2018-2032 (MILES DE USD)
TABLA 441 DEFENSA EN EL MERCADO DE SUBCONTRATACIÓN DE PROCESOS EMPRESARIALES (BPO) DE INDONESIA, POR APLICACIÓN, 2018-2032 (MILES DE USD)
TABLA 442 INDONESIA TRANSPORTE S EN EL MERCADO DE SUBCONTRATACIÓN DE PROCESOS EMPRESARIALES (BPO), POR APLICACIÓN, 2018-2032 (MILES DE USD)
TABLA 443 MERCADO DE SUBCONTRATACIÓN DE PROCESOS EMPRESARIALES (BPO) LOGÍSTICOS EN INDONESIA, POR APLICACIÓN, 2018-2032 (MILES DE USD)
TABLA 444 MERCADO DE SUBCONTRATACIÓN DE PROCESOS EMPRESARIALES (BPO) MINORISTA EN INDONESIA, POR APLICACIÓN, 2018-2032 (MILES DE USD)
TABLA 445 MERCADO DE SUBCONTRATACIÓN DE PROCESOS EMPRESARIALES (BPO) EN EL SECTOR DE LA SALUD DE INDONESIA, POR APLICACIÓN, 2018-2032 (MILES DE USD)
TABLA 446 MERCADO DE COMERCIO ELECTRÓNICO EN LA SUBCONTRATACIÓN DE PROCESOS EMPRESARIALES (BPO) DE INDONESIA, POR APLICACIÓN, 2018-2032 (MILES DE USD)
TABLA 447 MERCADO DE SUBCONTRATACIÓN DE PROCESOS EMPRESARIALES (BPO) DE VIAJES EN INDONESIA, POR APLICACIÓN, 2018-2032 (MILES DE USD)
TABLA 448 MERCADO DE SUBCONTRATACIÓN DE PROCESOS EMPRESARIALES (BPO) EN LA HOTELERÍA DE INDONESIA, POR APLICACIÓN, 2018-2032 (MILES DE USD)
TABLA 449 MERCADO DE SUBCONTRATACIÓN DE PROCESOS EMPRESARIALES (BPO) DE ENERGÍA EN INDONESIA, POR APLICACIÓN, 2018-2032 (MILES DE USD)
TABLA 450 MERCADO DE EDUCACIÓN EN SUBCONTRATACIÓN DE PROCESOS EMPRESARIALES (BPO) EN INDONESIA, POR APLICACIÓN, 2018-2032 (MILES DE USD)
TABLA 451 SERVICIOS PÚBLICOS EN EL MERCADO DE SUBCONTRATACIÓN DE PROCESOS EMPRESARIALES (BPO) DE INDONESIA, POR APLICACIÓN, 2018-2032 (MILES DE USD)
TABLA 452 MERCADO DE SUBCONTRATACIÓN DE PROCESOS EMPRESARIALES (BPO) DE MALASIA, POR TIPO DE SUBCONTRATACIÓN, 2018-2032 (MILES DE USD)
TABLA 453 MERCADO DE SUBCONTRATACIÓN DE PROCESOS EMPRESARIALES (BPO) DE MALASIA, POR APLICACIÓN, 2018-2032 (MILES DE USD)
TABLA 454 MERCADO DE FINANZAS Y CONTABILIDAD EN LA SUBCONTRATACIÓN DE PROCESOS EMPRESARIALES (BPO) DE MALASIA, POR APLICACIÓN, 2018-2032 (MILES DE USD)
TABLA 455 TALENTO Y SERVICIOS DE RR.HH. EN EL MERCADO DE SUBCONTRATACIÓN DE PROCESOS EMPRESARIALES (BPO) DE MALASIA, POR APLICACIÓN, 2018-2032 (MILES DE USD)
TABLA 456 EMPLEADOS Y OPERACIONES DE RR.HH. EN EL MERCADO DE SUBCONTRATACIÓN DE PROCESOS EMPRESARIALES (BPO) DE MALASIA, POR APLICACIÓN, 2018-2032 (MILES DE USD)
TABLA 457 ADQUISICIÓN Y DESARROLLO DE TALENTO EN EL MERCADO DE SUBCONTRATACIÓN DE PROCESOS EMPRESARIALES (BPO) DE MALASIA, POR APLICACIÓN, 2018-2032 (MILES DE USD)
TABLA 458 DESARROLLO DE TALENTO EN EL MERCADO DE SUBCONTRATACIÓN DE PROCESOS EMPRESARIALES (BPO) DE MALASIA, POR APLICACIÓN, 2018-2032 (MILES DE USD)
TABLA 459 ADQUISICIÓN DE TALENTO EN MALASIA EN EL MERCADO DE SUBCONTRATACIÓN DE PROCESOS EMPRESARIALES (BPO), POR APLICACIÓN, 2018-2032 (MILES DE USD)
TABLA 460 ABASTECIMIENTO, ADQUISICIONES Y CADENA DE SUMINISTRO EN EL MERCADO DE SUBCONTRATACIÓN DE PROCESOS EMPRESARIALES (BPO) DE MALASIA, POR APLICACIÓN, 2018-2032 (MILES DE USD)
TABLA 461 MERCADO DE SUBCONTRATACIÓN DE PROCESOS EMPRESARIALES (BPO) DE MALASIA, POR TAMAÑO DE LA ORGANIZACIÓN, 2018-2032 (MILES DE USD)
TABLA 462 MERCADO DE SUBCONTRATACIÓN DE PROCESOS EMPRESARIALES (BPO) DE MALASIA, POR ENFOQUE DE SUBCONTRATACIÓN, 2018-2032 (MILES DE USD)
TABLA 463 MERCADO DE SUBCONTRATACIÓN DE PROCESOS EMPRESARIALES (BPO) DE MALASIA, POR USUARIO FINAL, 2018-2032 (MILES DE USD)
TABLA 464 MERCADO DE SUBCONTRATACIÓN DE PROCESOS EMPRESARIALES (BPO) DE TI EN MALASIA, POR APLICACIÓN, 2018-2032 (MILES DE USD)
TABLA 465 MERCADO DE SUBCONTRATACIÓN DE PROCESOS EMPRESARIALES (BPO) DE TELECOMUNICACIONES DE MALASIA, POR APLICACIÓN, 2018-2032 (MILES DE USD)
TABLA 466 MERCADO DE SUBCONTRATACIÓN DE PROCESOS EMPRESARIALES (BPO) EN MALASIA, POR TIPO, 2018-2032 (MILES DE USD)
TABLA 467 MERCADO DE SUBCONTRATACIÓN DE PROCESOS EMPRESARIALES (BPO) EN EL SECTOR AUTOMOTRIZ DE MALASIA, POR APLICACIÓN, 2018-2032 (MILES DE USD)
TABLA 468 MERCADO DE MALASIA DE MAQUINARIA ELECTRÓNICA EN LA SUBCONTRATACIÓN DE PROCESOS EMPRESARIALES (BPO), POR APLICACIÓN, 2018-2032 (MILES DE USD)
TABLA 469 MERCADO DE SUBCONTRATACIÓN DE PROCESOS EMPRESARIALES (BPO) DE PRODUCTOS QUÍMICOS Y MATERIALES DE MALASIA, POR APLICACIÓN, 2018-2032 (MILES DE USD)
TABLA 470 EQUIPOS DE TIC DE MALASIA EN EL MERCADO DE SUBCONTRATACIÓN DE PROCESOS EMPRESARIALES (BPO), POR APLICACIÓN, 2018-2032 (MILES DE USD)
TABLA 471 MERCADO DE ALIMENTOS Y BEBIDAS EN LA SUBCONTRATACIÓN DE PROCESOS EMPRESARIALES (BPO) DE MALASIA, POR APLICACIÓN, 2018-2032 (MILES DE USD)
TABLA 472 ARQUITECTURA Y VIVIENDA EN MALASIA EN EL MERCADO DE SUBCONTRATACIÓN DE PROCESOS EMPRESARIALES (BPO), POR APLICACIÓN, 2018-2032 (MILES DE USD)
TABLA 473 BFSI DE MALASIA EN EL MERCADO DE SUBCONTRATACIÓN DE PROCESOS EMPRESARIALES (BPO), POR TIPO, 2018-2032 (MILES DE USD)
TABLA 474 BANCA DE MALASIA EN EL MERCADO DE SUBCONTRATACIÓN DE PROCESOS EMPRESARIALES (BPO), POR APLICACIÓN, 2018-2032 (MILES DE USD)
TABLA 475 MERCADO DE SERVICIOS FINANCIEROS DE SUBCONTRATACIÓN DE PROCESOS EMPRESARIALES (BPO) DE MALASIA, POR APLICACIÓN, 2018-2032 (MILES DE USD)
TABLA 476 MERCADO DE SEGUROS EN LA SUBCONTRATACIÓN DE PROCESOS EMPRESARIALES (BPO) DE MALASIA, POR APLICACIÓN, 2018-2032 (MILES DE USD)
TABLA 477 PARTICIPACIÓN DEL GOBIERNO DE MALASIA EN EL MERCADO DE SUBCONTRATACIÓN DE PROCESOS EMPRESARIALES (BPO), POR APLICACIÓN, 2018-2032 (MILES DE USD)
TABLA 478 DEFENSA DE MALASIA EN EL MERCADO DE SUBCONTRATACIÓN DE PROCESOS EMPRESARIALES (BPO), POR APLICACIÓN, 2018-2032 (MILES DE USD)
TABLA 479 PARTICIPACIÓN DEL TRANSPORTE EN EL MERCADO DE SUBCONTRATACIÓN DE PROCESOS EMPRESARIALES (BPO) EN MALASIA, POR APLICACIÓN, 2018-2032 (MILES DE USD)
TABLA 480 MERCADO DE SUBCONTRATACIÓN DE PROCESOS EMPRESARIALES (BPO) LOGÍSTICOS DE MALASIA, POR APLICACIÓN, 2018-2032 (MILES DE USD)
TABLA 481 MERCADO DE SUBCONTRATACIÓN DE PROCESOS EMPRESARIALES (BPO) MINORISTA EN MALASIA, POR APLICACIÓN, 2018-2032 (MILES DE USD)
TABLA 482 MERCADO DE SUBCONTRATACIÓN DE PROCESOS EMPRESARIALES (BPO) DE ATENCIÓN MÉDICA EN MALASIA, POR APLICACIÓN, 2018-2032 (MILES DE USD)
TABLA 483 MERCADO DE COMERCIO ELECTRÓNICO EN LA SUBCONTRATACIÓN DE PROCESOS EMPRESARIALES (BPO) DE MALASIA, POR APLICACIÓN, 2018-2032 (MILES DE USD)
TABLA 484 VIAJES EN EL MERCADO DE SUBCONTRATACIÓN DE PROCESOS EMPRESARIALES (BPO) EN MALASIA, POR APLICACIÓN, 2018-2032 (MILES DE USD)
TABLA 485 MERCADO DE SUBCONTRATACIÓN DE PROCESOS EMPRESARIALES (BPO) EN HOTELERÍA DE MALASIA, POR APLICACIÓN, 2018-2032 (MILES DE USD)
TABLA 486 MERCADO DE SUBCONTRATACIÓN DE PROCESOS EMPRESARIALES (BPO) DE ENERGÍA EN MALASIA, POR APLICACIÓN, 2018-2032 (MILES DE USD)
TABLA 487 MERCADO DE EDUCACIÓN EN SUBCONTRATACIÓN DE PROCESOS EMPRESARIALES (BPO) DE MALASIA, POR APLICACIÓN, 2018-2032 (MILES DE USD)
TABLA 488 SERVICIOS PÚBLICOS DE MALASIA EN EL MERCADO DE SUBCONTRATACIÓN DE PROCESOS EMPRESARIALES (BPO), POR APLICACIÓN, 2018-2032 (MILES DE USD)
TABLA 489 MERCADO DE SUBCONTRATACIÓN DE PROCESOS EMPRESARIALES (BPO) DE TAIWÁN, POR TIPO DE SUBCONTRATACIÓN, 2018-2032 (MILES DE USD)
TABLA 490 MERCADO DE SUBCONTRATACIÓN DE PROCESOS EMPRESARIALES (BPO) DE TAIWÁN, POR APLICACIÓN, 2018-2032 (MILES DE USD)
TABLA 491 MERCADO DE FINANZAS Y CONTABILIDAD EN TAIWÁN PARA LA SUBCONTRATACIÓN DE PROCESOS EMPRESARIALES (BPO), POR APLICACIÓN, 2018-2032 (MILES DE USD)
TABLA 492 TALENTO Y SERVICIOS DE RR.HH. DE TAIWÁN EN EL MERCADO DE SUBCONTRATACIÓN DE PROCESOS EMPRESARIALES (BPO), POR APLICACIÓN, 2018-2032 (MILES DE USD)
TABLA 493 OPERACIONES DE EMPLEADOS Y RR.HH. EN EL MERCADO DE SUBCONTRATACIÓN DE PROCESOS EMPRESARIALES (BPO) DE TAIWÁN, POR APLICACIÓN, 2018-2032 (MILES DE USD)
TABLA 494 ADQUISICIÓN Y DESARROLLO DE TALENTO EN TAIWÁN EN EL MERCADO DE SUBCONTRATACIÓN DE PROCESOS EMPRESARIALES (BPO), POR APLICACIÓN, 2018-2032 (MILES DE USD)
TABLA 495 DESARROLLO DE TALENTO EN EL MERCADO DE SUBCONTRATACIÓN DE PROCESOS EMPRESARIALES (BPO) DE TAIWÁN, POR APLICACIÓN, 2018-2032 (MILES DE USD)
TABLA 496 ADQUISICIÓN DE TALENTO EN TAIWÁN EN EL MERCADO DE SUBCONTRATACIÓN DE PROCESOS EMPRESARIALES (BPO), POR APLICACIÓN, 2018-2032 (MILES DE USD)
TABLA 497 ABASTECIMIENTO, ADQUISICIONES Y CADENA DE SUMINISTRO EN EL MERCADO DE SUBCONTRATACIÓN DE PROCESOS EMPRESARIALES (BPO) DE TAIWÁN, POR APLICACIÓN, 2018-2032 (MILES DE USD)
TABLA 498 MERCADO DE SUBCONTRATACIÓN DE PROCESOS EMPRESARIALES (BPO) DE TAIWÁN, POR TAMAÑO DE LA ORGANIZACIÓN, 2018-2032 (MILES DE USD)
TABLA 499 MERCADO DE SUBCONTRATACIÓN DE PROCESOS EMPRESARIALES (BPO) DE TAIWÁN, POR ENFOQUE DE SUBCONTRATACIÓN, 2018-2032 (MILES DE USD)
TABLA 500 MERCADO DE SUBCONTRATACIÓN DE PROCESOS EMPRESARIALES (BPO) DE TAIWÁN, POR USUARIO FINAL, 2018-2032 (MILES DE USD)
TABLA 501 MERCADO DE SUBCONTRATACIÓN DE PROCESOS EMPRESARIALES (BPO) DE TI EN TAIWÁN, POR APLICACIÓN, 2018-2032 (MILES DE USD)
TABLA 502 MERCADO DE SUBCONTRATACIÓN DE PROCESOS EMPRESARIALES (BPO) DE TELECOMUNICACIONES DE TAIWÁN, POR APLICACIÓN, 2018-2032 (MILES DE USD)
TABLA 503 MERCADO DE SUBCONTRATACIÓN DE PROCESOS EMPRESARIALES (BPO) DE MANUFACTURA EN TAIWÁN, POR TIPO, 2018-2032 (MILES DE USD)
TABLA 504 MERCADO DE SUBCONTRATACIÓN DE PROCESOS EMPRESARIALES (BPO) EN LA INDUSTRIA AUTOMOTRIZ DE TAIWÁN, POR APLICACIÓN, 2018-2032 (MILES DE USD)
TABLA 505 MERCADO DE MAQUINARIA ELECTRÓNICA DE TAIWÁN EN LA SUBCONTRATACIÓN DE PROCESOS EMPRESARIALES (BPO), POR APLICACIÓN, 2018-2032 (MILES DE USD)
TABLA 506 MERCADO DE SUBCONTRATACIÓN DE PROCESOS EMPRESARIALES (BPO) DE PRODUCTOS QUÍMICOS Y MATERIALES DE TAIWÁN, POR APLICACIÓN, 2018-2032 (MILES DE USD)
TABLA 507 EQUIPOS DE TIC DE TAIWÁN EN EL MERCADO DE SUBCONTRATACIÓN DE PROCESOS EMPRESARIALES (BPO), POR APLICACIÓN, 2018-2032 (MILES DE USD)
TABLA 508 MERCADO DE SUBCONTRATACIÓN DE PROCESOS EMPRESARIALES (BPO) DE ALIMENTOS Y BEBIDAS DE TAIWÁN, POR APLICACIÓN, 2018-2032 (MILES DE USD)
TABLA 509 ARQUITECTURA Y VIVIENDA DE TAIWÁN EN EL MERCADO DE SUBCONTRATACIÓN DE PROCESOS EMPRESARIALES (BPO), POR APLICACIÓN, 2018-2032 (MILES DE USD)
TABLA 510 BFSI DE TAIWÁN EN EL MERCADO DE SUBCONTRATACIÓN DE PROCESOS EMPRESARIALES (BPO), POR TIPO, 2018-2032 (MILES DE USD)
TABLA 511 BANCA DE TAIWÁN EN EL MERCADO DE SUBCONTRATACIÓN DE PROCESOS EMPRESARIALES (BPO), POR APLICACIÓN, 2018-2032 (MILES DE USD)
TABLA 512 SERVICIOS FINANCIEROS EN EL MERCADO DE SUBCONTRATACIÓN DE PROCESOS EMPRESARIALES (BPO) DE TAIWÁN, POR APLICACIÓN, 2018-2032 (MILES DE USD)
TABLA 513 MERCADO DE SEGUROS EN TAIWÁN PARA LA SUBCONTRATACIÓN DE PROCESOS EMPRESARIALES (BPO), POR APLICACIÓN, 2018-2032 (MILES DE USD)
TABLA 514 PARTICIPACIÓN DEL GOBIERNO DE TAIWÁN EN EL MERCADO DE SUBCONTRATACIÓN DE PROCESOS EMPRESARIALES (BPO), POR APLICACIÓN, 2018-2032 (MILES DE USD)
TABLA 515 DEFENSA DE TAIWÁN EN EL MERCADO DE SUBCONTRATACIÓN DE PROCESOS EMPRESARIALES (BPO), POR APLICACIÓN, 2018-2032 (MILES DE USD)
TABLA 516 PARTICIPACIÓN DEL TRANSPORTE EN EL MERCADO DE SUBCONTRATACIÓN DE PROCESOS EMPRESARIALES (BPO) DE TAIWÁN, POR APLICACIÓN, 2018-2032 (MILES DE USD)
TABLA 517 MERCADO DE SUBCONTRATACIÓN DE PROCESOS EMPRESARIALES (BPO) LOGÍSTICOS EN TAIWÁN, POR APLICACIÓN, 2018-2032 (MILES DE USD)
TABLA 518 VENTAS MINORISTAS EN EL MERCADO DE SUBCONTRATACIÓN DE PROCESOS EMPRESARIALES (BPO) DE TAIWÁN, POR APLICACIÓN, 2018-2032 (MILES DE USD)
TABLA 519 MERCADO DE SUBCONTRATACIÓN DE PROCESOS EMPRESARIALES (BPO) EN EL SECTOR DE LA SALUD DE TAIWÁN, POR APLICACIÓN, 2018-2032 (MILES DE USD)
TABLA 520 COMERCIO ELECTRÓNICO EN EL MERCADO DE SUBCONTRATACIÓN DE PROCESOS EMPRESARIALES (BPO) DE TAIWÁN, POR APLICACIÓN, 2018-2032 (MILES DE USD)
TABLA 521 MERCADO DE SUBCONTRATACIÓN DE PROCESOS EMPRESARIALES (BPO) DE VIAJES EN TAIWÁN, POR APLICACIÓN, 2018-2032 (MILES DE USD)
TABLA 522 MERCADO DE SUBCONTRATACIÓN DE PROCESOS EMPRESARIALES (BPO) EN LA HOTELERÍA DE TAIWÁN, POR APLICACIÓN, 2018-2032 (MILES DE USD)
TABLA 523 MERCADO DE SUBCONTRATACIÓN DE PROCESOS EMPRESARIALES (BPO) DE ENERGÍA DE TAIWÁN, POR APLICACIÓN, 2018-2032 (MILES DE USD)
TABLA 524 MERCADO DE EDUCACIÓN EN TAIWÁN PARA LA SUBCONTRATACIÓN DE PROCESOS EMPRESARIALES (BPO), POR APLICACIÓN, 2018-2032 (MILES DE USD)
TABLA 525 SERVICIOS PÚBLICOS DE TAIWÁN EN EL MERCADO DE SUBCONTRATACIÓN DE PROCESOS EMPRESARIALES (BPO), POR APLICACIÓN, 2018-2032 (MILES DE USD)
TABLA 526 MERCADO DE SUBCONTRATACIÓN DE PROCESOS EMPRESARIALES (BPO) DE VIETNAM, POR TIPO DE SUBCONTRATACIÓN, 2018-2032 (MILES DE USD)
TABLA 527 MERCADO DE SUBCONTRATACIÓN DE PROCESOS EMPRESARIALES (BPO) DE VIETNAM, POR APLICACIÓN, 2018-2032 (MILES DE USD)
TABLA 528 MERCADO DE FINANZAS Y CONTABILIDAD EN VIETNAM, SUBCONTRATACIÓN DE PROCESOS EMPRESARIALES (BPO), POR APLICACIÓN, 2018-2032 (MILES DE USD)
TABLA 529 TALENTO Y SERVICIOS DE RR.HH. EN VIETNAM EN EL MERCADO DE SUBCONTRATACIÓN DE PROCESOS EMPRESARIALES (BPO), POR APLICACIÓN, 2018-2032 (MILES DE USD)
TABLA 530 EMPLEADOS DE VIETNAM Y OPERACIONES DE RR.HH. EN EL MERCADO DE SUBCONTRATACIÓN DE PROCESOS EMPRESARIALES (BPO), POR APLICACIÓN, 2018-2032 (MILES DE USD)
TABLA 531 ADQUISICIÓN Y DESARROLLO DE TALENTO EN VIETNAM EN EL MERCADO DE SUBCONTRATACIÓN DE PROCESOS EMPRESARIALES (BPO), POR APLICACIÓN, 2018-2032 (MILES DE USD)
TABLA 532 DESARROLLO DE TALENTO EN VIETNAM EN EL MERCADO DE SUBCONTRATACIÓN DE PROCESOS EMPRESARIALES (BPO), POR APLICACIÓN, 2018-2032 (MILES DE USD)
TABLA 533 ADQUISICIÓN DE TALENTO EN VIETNAM EN EL MERCADO DE SUBCONTRATACIÓN DE PROCESOS EMPRESARIALES (BPO), POR APLICACIÓN, 2018-2032 (MILES DE USD)
TABLA 534 ABASTECIMIENTO, ADQUISICIONES Y CADENA DE SUMINISTRO EN VIETNAM EN EL MERCADO DE SUBCONTRATACIÓN DE PROCESOS EMPRESARIALES (BPO), POR APLICACIÓN, 2018-2032 (MILES DE USD)
TABLA 535 MERCADO DE SUBCONTRATACIÓN DE PROCESOS EMPRESARIALES (BPO) DE VIETNAM, POR TAMAÑO DE LA ORGANIZACIÓN, 2018-2032 (MILES DE USD)
TABLA 536 MERCADO DE SUBCONTRATACIÓN DE PROCESOS EMPRESARIALES (BPO) DE VIETNAM, POR ENFOQUE DE SUBCONTRATACIÓN, 2018-2032 (MILES DE USD)
TABLA 537 MERCADO DE SUBCONTRATACIÓN DE PROCESOS EMPRESARIALES (BPO) DE VIETNAM, POR USUARIO FINAL, 2018-2032 (MILES DE USD)
TABLA 538 VIETNAM TI EN EL MERCADO DE SUBCONTRATACIÓN DE PROCESOS EMPRESARIALES (BPO), POR APLICACIÓN, 2018-2032 (MILES DE USD)
TABLA 539 MERCADO DE SUBCONTRATACIÓN DE PROCESOS EMPRESARIALES (BPO) DE TELECOMUNICACIONES DE VIETNAM, POR APLICACIÓN, 2018-2032 (MILES DE USD)
TABLA 540 MERCADO DE SUBCONTRATACIÓN DE PROCESOS EMPRESARIALES (BPO) DE MANUFACTURA EN VIETNAM, POR TIPO, 2018-2032 (MILES DE USD)
TABLA 541 MERCADO DE SUBCONTRATACIÓN DE PROCESOS EMPRESARIALES (BPO) EN LA INDUSTRIA AUTOMOTRIZ DE VIETNAM, POR APLICACIÓN, 2018-2032 (MILES DE USD)
TABLA 542 MERCADO DE MAQUINARIA ELECTRÓNICA EN LA SUBCONTRATACIÓN DE PROCESOS EMPRESARIALES (BPO) DE VIETNAM, POR APLICACIÓN, 2018-2032 (MILES DE USD)
TABLA 543 MERCADO DE SUBCONTRATACIÓN DE PROCESOS EMPRESARIALES (BPO) DE PRODUCTOS QUÍMICOS Y MATERIALES DE VIETNAM, POR APLICACIÓN, 2018-2032 (MILES DE USD)
TABLA 544 EQUIPOS DE TIC DE VIETNAM EN EL MERCADO DE SUBCONTRATACIÓN DE PROCESOS EMPRESARIALES (BPO), POR APLICACIÓN, 2018-2032 (MILES DE USD)
TABLA 545 VIETNAM MERCADO DE SUBCONTRATACIÓN DE PROCESOS EMPRESARIALES (BPO) DE ALIMENTOS Y BEBIDAS, POR APLICACIÓN, 2018-2032 (MILES DE USD)
TABLA 546 ARQUITECTURA Y VIVIENDA EN EL MERCADO DE SUBCONTRATACIÓN DE PROCESOS EMPRESARIALES (BPO) DE VIETNAM, POR APLICACIÓN, 2018-2032 (MILES DE USD)
TABLA 547 VIETNAM BFSI EN EL MERCADO DE SUBCONTRATACIÓN DE PROCESOS EMPRESARIALES (BPO), POR TIPO, 2018-2032 (MILES DE USD)
TABLA 548 BANCA DE VIETNAM EN EL MERCADO DE SUBCONTRATACIÓN DE PROCESOS EMPRESARIALES (BPO), POR APLICACIÓN, 2018-2032 (MILES DE USD)
TABLA 549 SERVICIOS FINANCIEROS EN EL MERCADO DE SUBCONTRATACIÓN DE PROCESOS EMPRESARIALES (BPO) DE VIETNAM, POR APLICACIÓN, 2018-2032 (MILES DE USD)
TABLA 550 MERCADO DE SEGUROS EN VIETNAM EN LA SUBCONTRATACIÓN DE PROCESOS EMPRESARIALES (BPO), POR APLICACIÓN, 2018-2032 (MILES DE USD)
TABLA 551 PARTICIPACIÓN DEL GOBIERNO DE VIETNAM EN EL MERCADO DE SUBCONTRATACIÓN DE PROCESOS EMPRESARIALES (BPO), POR APLICACIÓN, 2018-2032 (MILES DE USD)
TABLA 552 DEFENSA DE VIETNAM EN EL MERCADO DE SUBCONTRATACIÓN DE PROCESOS EMPRESARIALES (BPO), POR APLICACIÓN, 2018-2032 (MILES DE USD)
TABLA 553 VIETNAM TRANSPORTE S EN EL MERCADO DE SUBCONTRATACIÓN DE PROCESOS EMPRESARIALES (BPO), POR APLICACIÓN, 2018-2032 (MILES DE USD)
TABLA 554 MERCADO DE LOGÍSTICA EN VIETNAM PARA LA SUBCONTRATACIÓN DE PROCESOS EMPRESARIALES (BPO), POR APLICACIÓN, 2018-2032 (MILES DE USD)
TABLA 555 VIETNAM: MERCADO DE SUBCONTRATACIÓN DE PROCESOS EMPRESARIALES (BPO), POR APLICACIÓN, 2018-2032 (MILES DE USD)
TABLA 556 MERCADO DE SUBCONTRATACIÓN DE PROCESOS EMPRESARIALES (BPO) EN SERVICIOS DE SALUD DE VIETNAM, POR APLICACIÓN, 2018-2032 (MILES DE USD)
TABLA 557 MERCADO DE COMERCIO ELECTRÓNICO EN VIETNAM, SUBCONTRATACIÓN DE PROCESOS EMPRESARIALES (BPO), POR APLICACIÓN, 2018-2032 (MILES DE USD)
TABLA 558 VIAJES A VIETNAM EN EL MERCADO DE SUBCONTRATACIÓN DE PROCESOS EMPRESARIALES (BPO), POR APLICACIÓN, 2018-2032 (MILES DE USD)
TABLA 559 MERCADO DE SUBCONTRATACIÓN DE PROCESOS EMPRESARIALES (BPO) EN LA HOTELERÍA DE VIETNAM, POR APLICACIÓN, 2018-2032 (MILES DE USD)
TABLA 560 MERCADO DE SUBCONTRATACIÓN DE PROCESOS EMPRESARIALES (BPO) DE ENERGÍA EN VIETNAM, POR APLICACIÓN, 2018-2032 (MILES DE USD)
TABLA 561 MERCADO DE EDUCACIÓN EN VIETNAM PARA LA SUBCONTRATACIÓN DE PROCESOS EMPRESARIALES (BPO), POR APLICACIÓN, 2018-2032 (MILES DE USD)
TABLA 562 SERVICIOS PÚBLICOS DE VIETNAM EN EL MERCADO DE SUBCONTRATACIÓN DE PROCESOS EMPRESARIALES (BPO), POR APLICACIÓN, 2018-2032 (MILES DE USD)
TABLA 563 MERCADO DE SUBCONTRATACIÓN DE PROCESOS EMPRESARIALES (BPO) DE NUEVA ZELANDA, POR TIPO DE SUBCONTRATACIÓN, 2018-2032 (MILES DE USD)
TABLA 564 MERCADO DE SUBCONTRATACIÓN DE PROCESOS EMPRESARIALES (BPO) DE NUEVA ZELANDA, POR APLICACIÓN, 2018-2032 (MILES DE USD)
TABLA 565 MERCADO DE FINANZAS Y CONTABILIDAD EN LA SUBCONTRATACIÓN DE PROCESOS EMPRESARIALES (BPO) DE NUEVA ZELANDA, POR APLICACIÓN, 2018-2032 (MILES DE USD)
TABLA 566 TALENTO DE NUEVA ZELANDA Y SERVICIOS DE RR.HH. EN EL MERCADO DE SUBCONTRATACIÓN DE PROCESOS EMPRESARIALES (BPO), POR APLICACIÓN, 2018-2032 (MILES DE USD)
TABLA 567 OPERACIONES DE EMPLEADOS Y RR.HH. EN EL MERCADO DE SUBCONTRATACIÓN DE PROCESOS EMPRESARIALES (BPO) DE NUEVA ZELANDA, POR APLICACIÓN, 2018-2032 (MILES DE USD)
TABLA 568 ADQUISICIÓN Y DESARROLLO DE TALENTO EN EL MERCADO DE SUBCONTRATACIÓN DE PROCESOS EMPRESARIALES (BPO) DE NUEVA ZELANDA, POR APLICACIÓN, 2018-2032 (MILES DE USD)
TABLA 569 DESARROLLO DE TALENTO EN EL MERCADO DE SUBCONTRATACIÓN DE PROCESOS EMPRESARIALES (BPO) DE NUEVA ZELANDA, POR APLICACIÓN, 2018-2032 (MILES DE USD)
TABLA 570 ADQUISICIÓN DE TALENTO EN NUEVA ZELANDA EN EL MERCADO DE SUBCONTRATACIÓN DE PROCESOS EMPRESARIALES (BPO), POR APLICACIÓN, 2018-2032 (MILES DE USD)
TABLA 571 ABASTECIMIENTO, ADQUISICIONES Y CADENA DE SUMINISTRO EN EL MERCADO DE SUBCONTRATACIÓN DE PROCESOS EMPRESARIALES (BPO) DE NUEVA ZELANDA, POR APLICACIÓN, 2018-2032 (MILES DE USD)
TABLA 572 MERCADO DE SUBCONTRATACIÓN DE PROCESOS EMPRESARIALES (BPO) DE NUEVA ZELANDA, POR TAMAÑO DE LA ORGANIZACIÓN, 2018-2032 (MILES DE USD)
TABLA 573 MERCADO DE SUBCONTRATACIÓN DE PROCESOS EMPRESARIALES (BPO) DE NUEVA ZELANDA, POR ENFOQUE DE SUBCONTRATACIÓN, 2018-2032 (MILES DE USD)
TABLA 574 MERCADO DE SUBCONTRATACIÓN DE PROCESOS EMPRESARIALES (BPO) DE NUEVA ZELANDA, POR USUARIO FINAL, 2018-2032 (MILES DE USD)
TABLA 575 MERCADO DE SUBCONTRATACIÓN DE PROCESOS EMPRESARIALES (BPO) DE TI DE NUEVA ZELANDA, POR APLICACIÓN, 2018-2032 (MILES DE USD)
TABLA 576 MERCADO DE SUBCONTRATACIÓN DE PROCESOS EMPRESARIALES (BPO) DE TELECOMUNICACIONES DE NUEVA ZELANDA, POR APLICACIÓN, 2018-2032 (MILES DE USD)
TABLA 577 MERCADO DE SUBCONTRATACIÓN DE PROCESOS EMPRESARIALES (BPO) DE MANUFACTURA DE NUEVA ZELANDA, POR TIPO, 2018-2032 (MILES DE USD)
TABLA 578 MERCADO DE SUBCONTRATACIÓN DE PROCESOS EMPRESARIALES (BPO) EN LA INDUSTRIA AUTOMOTRIZ DE NUEVA ZELANDA, POR APLICACIÓN, 2018-2032 (MILES DE USD)
TABLA 579 MERCADO DE MAQUINARIA ELECTRÓNICA EN LA SUBCONTRATACIÓN DE PROCESOS EMPRESARIALES (BPO) DE NUEVA ZELANDA, POR APLICACIÓN, 2018-2032 (MILES DE USD)
TABLA 580 MERCADO DE SUBCONTRATACIÓN DE PROCESOS EMPRESARIALES (BPO) DE PRODUCTOS QUÍMICOS Y MATERIALES DE NUEVA ZELANDA, POR APLICACIÓN, 2018-2032 (MILES DE USD)
TABLA 581 EQUIPOS DE TIC DE NUEVA ZELANDA EN EL MERCADO DE SUBCONTRATACIÓN DE PROCESOS EMPRESARIALES (BPO), POR APLICACIÓN, 2018-2032 (MILES DE USD)
TABLA 582 MERCADO DE SUBCONTRATACIÓN DE PROCESOS EMPRESARIALES (BPO) DE ALIMENTOS Y BEBIDAS DE NUEVA ZELANDA, POR APLICACIÓN, 2018-2032 (MILES DE USD)
TABLA 583 ARQUITECTURA Y VIVIENDA DE NUEVA ZELANDA EN EL MERCADO DE SUBCONTRATACIÓN DE PROCESOS EMPRESARIALES (BPO), POR APLICACIÓN, 2018-2032 (MILES DE USD)
TABLA 584 NUEVA ZELANDA BFSI EN EL MERCADO DE SUBCONTRATACIÓN DE PROCESOS EMPRESARIALES (BPO), POR TIPO, 2018-2032 (MILES DE USD)
TABLA 585 BANCA DE NUEVA ZELANDA EN EL MERCADO DE SUBCONTRATACIÓN DE PROCESOS EMPRESARIALES (BPO), POR APLICACIÓN, 2018-2032 (MILES DE USD)
TABLA 586 MERCADO DE SERVICIOS FINANCIEROS DE SUBCONTRATACIÓN DE PROCESOS EMPRESARIALES (BPO) DE NUEVA ZELANDA, POR APLICACIÓN, 2018-2032 (MILES DE USD)
TABLA 587 MERCADO DE SUBCONTRATACIÓN DE PROCESOS EMPRESARIALES (BPO) DE SEGUROS DE NUEVA ZELANDA, POR APLICACIÓN, 2018-2032 (MILES DE USD)
TABLA 588 PARTICIPACIÓN DEL GOBIERNO DE NUEVA ZELANDA EN EL MERCADO DE SUBCONTRATACIÓN DE PROCESOS EMPRESARIALES (BPO), POR APLICACIÓN, 2018-2032 (MILES DE USD)
TABLA 589 MERCADO DE SUBCONTRATACIÓN DE PROCESOS EMPRESARIALES (BPO) DE DEFENSA DE NUEVA ZELANDA, POR APLICACIÓN, 2018-2032 (MILES DE USD)
TABLA 590 TRANSPORTE DE NUEVA ZELANDA EN EL MERCADO DE SUBCONTRATACIÓN DE PROCESOS EMPRESARIALES (BPO), POR APLICACIÓN, 2018-2032 (MILES DE USD)
TABLA 591 MERCADO DE SUBCONTRATACIÓN DE PROCESOS EMPRESARIALES (BPO) LOGÍSTICOS DE NUEVA ZELANDA, POR APLICACIÓN, 2018-2032 (MILES DE USD)
TABLA 592 MERCADO DE SUBCONTRATACIÓN DE PROCESOS EMPRESARIALES (BPO) MINORISTA DE NUEVA ZELANDA, POR APLICACIÓN, 2018-2032 (MILES DE USD)
TABLA 593 MERCADO DE SUBCONTRATACIÓN DE PROCESOS EMPRESARIALES (BPO) EN EL SECTOR SANITARIO DE NUEVA ZELANDA, POR APLICACIÓN, 2018-2032 (MILES DE USD)
TABLA 594 MERCADO DE COMERCIO ELECTRÓNICO EN LA SUBCONTRATACIÓN DE PROCESOS EMPRESARIALES (BPO) DE NUEVA ZELANDA, POR APLICACIÓN, 2018-2032 (MILES DE USD)
TABLA 595 MERCADO DE SUBCONTRATACIÓN DE PROCESOS EMPRESARIALES (BPO) DE VIAJES EN NUEVA ZELANDA, POR APLICACIÓN, 2018-2032 (MILES DE USD)
TABLA 596 MERCADO DE SUBCONTRATACIÓN DE PROCESOS EMPRESARIALES (BPO) EN HOTELERÍA DE NUEVA ZELANDA, POR APLICACIÓN, 2018-2032 (MILES DE USD)
TABLA 597 MERCADO DE SUBCONTRATACIÓN DE PROCESOS EMPRESARIALES (BPO) DE ENERGÍA DE NUEVA ZELANDA, POR APLICACIÓN, 2018-2032 (MILES DE USD)
TABLA 598 MERCADO DE EDUCACIÓN EN SUBCONTRATACIÓN DE PROCESOS EMPRESARIALES (BPO) DE NUEVA ZELANDA, POR APLICACIÓN, 2018-2032 (MILES DE USD)
TABLA 599 MERCADO DE SUBCONTRATACIÓN DE PROCESOS EMPRESARIALES (BPO) DE SERVICIOS PÚBLICOS DE NUEVA ZELANDA, POR APLICACIÓN, 2018-2032 (MILES DE USD)
TABLA 600 RESTO DEL MERCADO DE SUBCONTRATACIÓN DE PROCESOS EMPRESARIALES (BPO) DE ASIA-PACÍFICO, POR TIPO DE SUBCONTRATACIÓN, 2018-2032 (MILES DE USD)
Lista de figuras
FIGURA 1 MERCADO DE SUBCONTRATACIÓN DE PROCESOS EMPRESARIALES (BPO) DE ASIA-PACÍFICO: SEGMENTACIÓN
FIGURA 2 MERCADO DE SUBCONTRATACIÓN DE PROCESOS EMPRESARIALES (BPO) DE ASIA-PACÍFICO: TRIANGULACIÓN DE DATOS
FIGURA 3 MERCADO DE SUBCONTRATACIÓN DE PROCESOS EMPRESARIALES (BPO) DE ASIA-PACÍFICO: ANÁLISIS DROC
FIGURA 4 MERCADO DE SUBCONTRATACIÓN DE PROCESOS EMPRESARIALES (BPO) DE ASIA-PACÍFICO: ANÁLISIS DEL MERCADO DE ASIA-PACÍFICO VS. REGIONAL
FIGURA 5 MERCADO DE SUBCONTRATACIÓN DE PROCESOS EMPRESARIALES (BPO) DE ASIA-PACÍFICO: ANÁLISIS DE INVESTIGACIÓN DE EMPRESAS
FIGURA 6 CURVA DE LÍNEA DE TIEMPO DEL MERCADO DE SUBCONTRATACIÓN DE PROCESOS EMPRESARIALES (BPO) DE ASIA-PACÍFICO
FIGURA 7 MERCADO DE SUBCONTRATACIÓN DE PROCESOS EMPRESARIALES (BPO) DE ASIA-PACÍFICO: DATOS DEMOGRÁFICOS DE LAS ENTREVISTAS
FIGURA 9 MERCADO DE SUBCONTRATACIÓN DE PROCESOS EMPRESARIALES (BPO) DE ASIA-PACÍFICO: ANÁLISIS DE LA PARTICIPACIÓN DE PROVEEDORES
FIGURA 10 MERCADO DE SUBCONTRATACIÓN DE PROCESOS EMPRESARIALES (BPO) DE ASIA-PACÍFICO: SEGMENTACIÓN
FIGURA 11 RESUMEN EJECUTIVO
FIGURA 12 TRES SEGMENTOS COMPONEN EL MERCADO DE SUBCONTRATACIÓN DE PROCESOS EMPRESARIALES (BPO) DE ASIA-PACÍFICO, POR TIPO DE SUBCONTRATACIÓN (2024)
FIGURA 13 DESARROLLO ESTRATÉGICO DEL MERCADO DE SUBCONTRATACIÓN DE PROCESOS EMPRESARIALES (BPO) DE ASIA-PACÍFICO
FIGURA 14 SE ESPERA QUE LA CRECIENTE NECESIDAD DE AGILIDAD EMPRESARIAL IMPULSE EL MERCADO DE SUBCONTRATACIÓN DE PROCESOS EMPRESARIALES (BPO) DE ASIA-PACÍFICO EN EL PERÍODO PRONOSTICADO DE 2025 A 2032
FIGURA 15 SE ESPERA QUE EL SEGMENTO OFFSHORE REPRESENTE LA MAYOR PARTICIPACIÓN DEL MERCADO DE SUBCONTRATACIÓN DE PROCESOS EMPRESARIALES (BPO) DE ASIA-PACÍFICO EN 2025 Y 2032
FIGURA 16 MERCADO DE SUBCONTRATACIÓN DE PROCESOS EMPRESARIALES (BPO) DE LOS EAU: PARTICIPACIÓN DE LA EMPRESA 2023 (%)
FIGURA 17 MERCADO DE SUBCONTRATACIÓN DE PROCESOS EMPRESARIALES (BPO) DE LOS EAU: PARTICIPACIÓN DE LA EMPRESA 2023 (%)
FIGURA 18 MERCADO DE SUBCONTRATACIÓN DE PROCESOS EMPRESARIALES (BPO) DE LOS EAU: PARTICIPACIÓN DE LA EMPRESA 2023 (%)
FIGURA 19 MERCADO DE SUBCONTRATACIÓN DE PROCESOS EMPRESARIALES (BPO) DE LOS EAU: PARTICIPACIÓN DE LA EMPRESA 2023 (%)
FIGURA 20 MERCADO DE SUBCONTRATACIÓN DE PROCESOS EMPRESARIALES (BPO) DE LOS EAU: PARTICIPACIÓN DE LA EMPRESA 2023 (%)
FIGURA 21 MERCADO DE SUBCONTRATACIÓN DE PROCESOS EMPRESARIALES (BPO) DE LOS EAU: PARTICIPACIÓN DE LA EMPRESA 2023 (%)
FIGURA 22 MERCADO DE SUBCONTRATACIÓN DE PROCESOS EMPRESARIALES (BPO) DE LOS EAU: PARTICIPACIÓN DE LA EMPRESA 2023 (%)
FIGURA 23 MERCADO DE SUBCONTRATACIÓN DE PROCESOS EMPRESARIALES (BPO) DE LOS EAU: PARTICIPACIÓN DE LA EMPRESA 2023 (%)
FIGURA 24 IMPULSORES, RESTRICCIONES, OPORTUNIDADES Y DESAFÍOS DEL MERCADO DE SUBCONTRATACIÓN DE PROCESOS EMPRESARIALES (BPO) DE ASIA-PACÍFICO
FIGURA 25 MERCADO DE SUBCONTRATACIÓN DE PROCESOS EMPRESARIALES (BPO) DE ASIA-PACÍFICO: POR TIPO DE SUBCONTRATACIÓN, 2024
FIGURA 26 MERCADO DE SUBCONTRATACIÓN DE PROCESOS EMPRESARIALES (BPO) DE ASIA-PACÍFICO: POR APLICACIÓN, 2024
FIGURA 27 MERCADO DE SUBCONTRATACIÓN DE PROCESOS EMPRESARIALES (BPO) DE ASIA-PACÍFICO: POR TAMAÑO DE LA ORGANIZACIÓN, 2024
FIGURA 28 MERCADO DE SUBCONTRATACIÓN DE PROCESOS EMPRESARIALES (BPO) DE ASIA-PACÍFICO: POR ENFOQUE DE SUBCONTRATACIÓN, 2024
FIGURA 29 MERCADO DE SUBCONTRATACIÓN DE PROCESOS EMPRESARIALES (BPO) DE ASIA-PACÍFICO: POR USUARIO FINAL, 2024
FIGURA 30 MERCADO DE SUBCONTRATACIÓN DE PROCESOS EMPRESARIALES (BPO) EN ASIA-PACÍFICO: INSTANTÁNEA (2024)
FIGURA 31 MERCADO DE SUBCONTRATACIÓN DE PROCESOS EMPRESARIALES (BPO) DE ASIA-PACÍFICO: PARTICIPACIÓN DE LA EMPRESA 2024 (%)
Metodología de investigación
La recopilación de datos y el análisis del año base se realizan utilizando módulos de recopilación de datos con muestras de gran tamaño. La etapa incluye la obtención de información de mercado o datos relacionados a través de varias fuentes y estrategias. Incluye el examen y la planificación de todos los datos adquiridos del pasado con antelación. Asimismo, abarca el examen de las inconsistencias de información observadas en diferentes fuentes de información. Los datos de mercado se analizan y estiman utilizando modelos estadísticos y coherentes de mercado. Además, el análisis de la participación de mercado y el análisis de tendencias clave son los principales factores de éxito en el informe de mercado. Para obtener más información, solicite una llamada de un analista o envíe su consulta.
La metodología de investigación clave utilizada por el equipo de investigación de DBMR es la triangulación de datos, que implica la extracción de datos, el análisis del impacto de las variables de datos en el mercado y la validación primaria (experto en la industria). Los modelos de datos incluyen cuadrícula de posicionamiento de proveedores, análisis de línea de tiempo de mercado, descripción general y guía del mercado, cuadrícula de posicionamiento de la empresa, análisis de patentes, análisis de precios, análisis de participación de mercado de la empresa, estándares de medición, análisis global versus regional y de participación de proveedores. Para obtener más información sobre la metodología de investigación, envíe una consulta para hablar con nuestros expertos de la industria.
Personalización disponible
Data Bridge Market Research es líder en investigación formativa avanzada. Nos enorgullecemos de brindar servicios a nuestros clientes existentes y nuevos con datos y análisis que coinciden y se adaptan a sus objetivos. El informe se puede personalizar para incluir análisis de tendencias de precios de marcas objetivo, comprensión del mercado de países adicionales (solicite la lista de países), datos de resultados de ensayos clínicos, revisión de literatura, análisis de mercado renovado y base de productos. El análisis de mercado de competidores objetivo se puede analizar desde análisis basados en tecnología hasta estrategias de cartera de mercado. Podemos agregar tantos competidores sobre los que necesite datos en el formato y estilo de datos que esté buscando. Nuestro equipo de analistas también puede proporcionarle datos en archivos de Excel sin procesar, tablas dinámicas (libro de datos) o puede ayudarlo a crear presentaciones a partir de los conjuntos de datos disponibles en el informe.

