Asia Pacific Erp Market
Tamaño del mercado en miles de millones de dólares
Tasa de crecimiento anual compuesta (CAGR) :
% 
 USD
18.81 Billion
USD
47.76 Billion
2024
2032
USD
18.81 Billion
USD
47.76 Billion
2024
2032
| 2025 –2032 | |
| USD 18.81 Billion | |
| USD 47.76 Billion | |
| % | |
|
Mercado de ERP de Asia-Pacífico, por oferta (soluciones y servicios), modo de implementación (nube/multinube, local, híbrido y de dos niveles), tamaño de la empresa (grandes y medianas empresas), precio (suscripción, licencia única, freemium y otros), usuario final (fabricación, comercio minorista, BFSI, salud, TI y telecomunicaciones, gobierno, energía y servicios públicos, logística, educación, aeroespacial y defensa, otros): tendencias y pronóstico del sector hasta 2032.
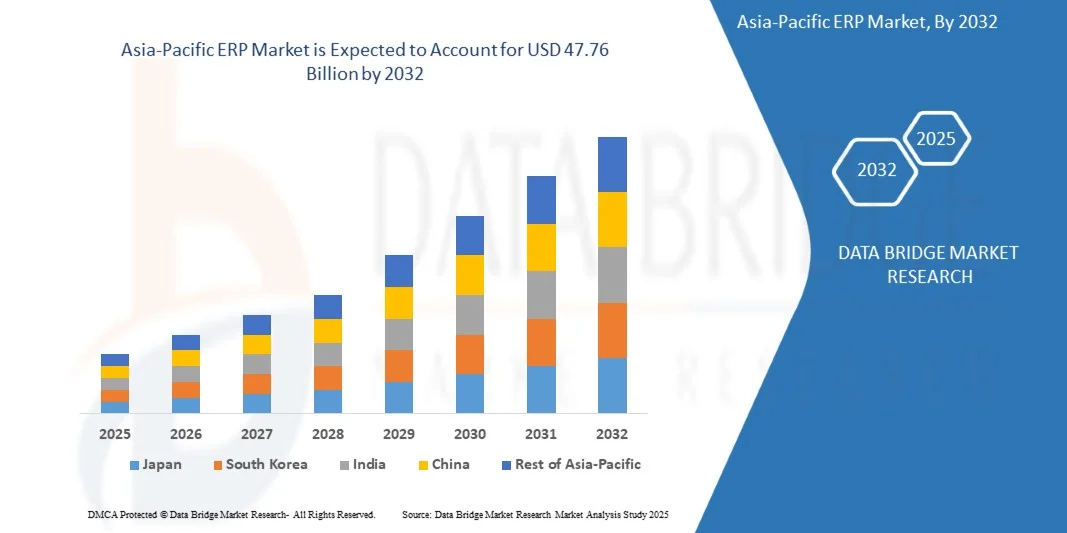
Tamaño del mercado de ERP de Asia-Pacífico
- El mercado ERP de Asia-Pacífico se valoró en USD 18.810 millones en 2024 y se espera que alcance los USD 47.760 millones en 2032.
- Durante el período de pronóstico de 2025 a 2032, es probable que el mercado crezca a una CAGR del 12,4 %, impulsado por la creciente adopción de soluciones basadas en la nube, iniciativas de transformación digital en todas las industrias y la creciente necesidad de análisis de datos en tiempo real para mejorar la eficiencia empresarial y la toma de decisiones.
- Este crecimiento se ve impulsado aún más por la integración de tecnologías avanzadas como la inteligencia artificial (IA), el aprendizaje automático (ML) y la Internet de las cosas (IoT) en los sistemas ERP, que mejoran la automatización, el análisis predictivo y la eficiencia operativa en varios sectores verticales de la industria.

Análisis del mercado de ERP en Asia-Pacífico
- El mercado de ERP de Asia-Pacífico está experimentando una rápida expansión debido a la aceleración de la transformación digital, el fuerte crecimiento económico y la creciente adopción empresarial de sistemas ERP basados en la nube para mejorar la agilidad empresarial y la eficiencia operativa en tiempo real.
- Las iniciativas gubernamentales que promueven la digitalización, las crecientes inversiones de las PYME en soluciones ERP asequibles y la creciente demanda de herramientas integradas de inteligencia empresarial son factores importantes que impulsan el crecimiento del mercado en los sectores manufacturero, minorista y de servicios.
- China, India y Japón lideran el mercado ERP de Asia-Pacífico, respaldados por la automatización industrial a gran escala, la expansión de la infraestructura de TI y la creciente adopción de soluciones ERP impulsadas por IA que optimizan la cadena de suministro, las finanzas y la gestión del capital humano.
- Se espera que China sea el país dominante y de más rápido crecimiento con una participación de mercado del 36,29% debido al fuerte apoyo gubernamental, la rápida expansión industrial y las crecientes inversiones en infraestructura digital y tecnológica.
- Se espera que el segmento de soluciones domine el mercado con una participación de mercado del 64,66% debido a la creciente demanda de plataformas integradas que mejoren la eficiencia operativa y agilicen los procesos comerciales.
Alcance del informe y segmentación del mercado ERP de Asia-Pacífico
|
Atributos |
Perspectivas clave del mercado de ERP |
|
Segmentos cubiertos |
|
|
Países cubiertos |
Asia-Pacífico
|
|
Actores clave del mercado |
|
|
Oportunidades de mercado |
|
|
Conjuntos de información de datos de valor añadido |
Además de los conocimientos del mercado, como el valor de mercado, la tasa de crecimiento, los segmentos del mercado, la cobertura geográfica, los actores del mercado y el escenario del mercado, el informe de mercado elaborado por el equipo de investigación de mercado de Data Bridge incluye un análisis experto en profundidad, análisis de importación/exportación, análisis de precios, análisis de consumo de producción y análisis PESTLE. |
Tendencias del mercado ERP en Asia-Pacífico
“Aumento de la adopción de ERP basado en la nube”
- La creciente adopción de sistemas ERP en la nube en la región APAC está impulsando significativamente el crecimiento del mercado. La creciente demanda de soluciones de gestión empresarial escalables, rentables y accesibles está impulsando a las organizaciones de los sectores manufacturero, minorista y de servicios a migrar de sus sistemas locales tradicionales a plataformas en la nube.
- En la región APAC, el acceso a datos en tiempo real, la automatización de procesos y una mejor colaboración entre equipos distribuidos son cada vez más esenciales para la eficiencia operativa. Además, el creciente número de iniciativas de transformación digital, la necesidad de una toma de decisiones ágil y la expansión de las pymes están acelerando la adopción de soluciones ERP en la nube para garantizar la flexibilidad, la productividad y la continuidad del negocio.
- El continuo crecimiento de las iniciativas de transformación digital está impulsando una fuerte adopción de soluciones ERP en la nube. Las organizaciones aprovechan cada vez más las plataformas ERP en la nube para mejorar la eficiencia operativa, optimizar los flujos de trabajo y facilitar la toma de decisiones basada en datos.
- Los sistemas ERP automatizados, escalables y flexibles se están volviendo esenciales para que las empresas optimicen el uso de recursos, garanticen el cumplimiento normativo y respalden su expansión regional. Como resultado, el ERP en la nube se reconoce cada vez más como un facilitador estratégico de operaciones empresariales rentables, integradas y preparadas para el futuro en los mercados de Asia-Pacífico.
Dinámica del mercado ERP de Asia-Pacífico
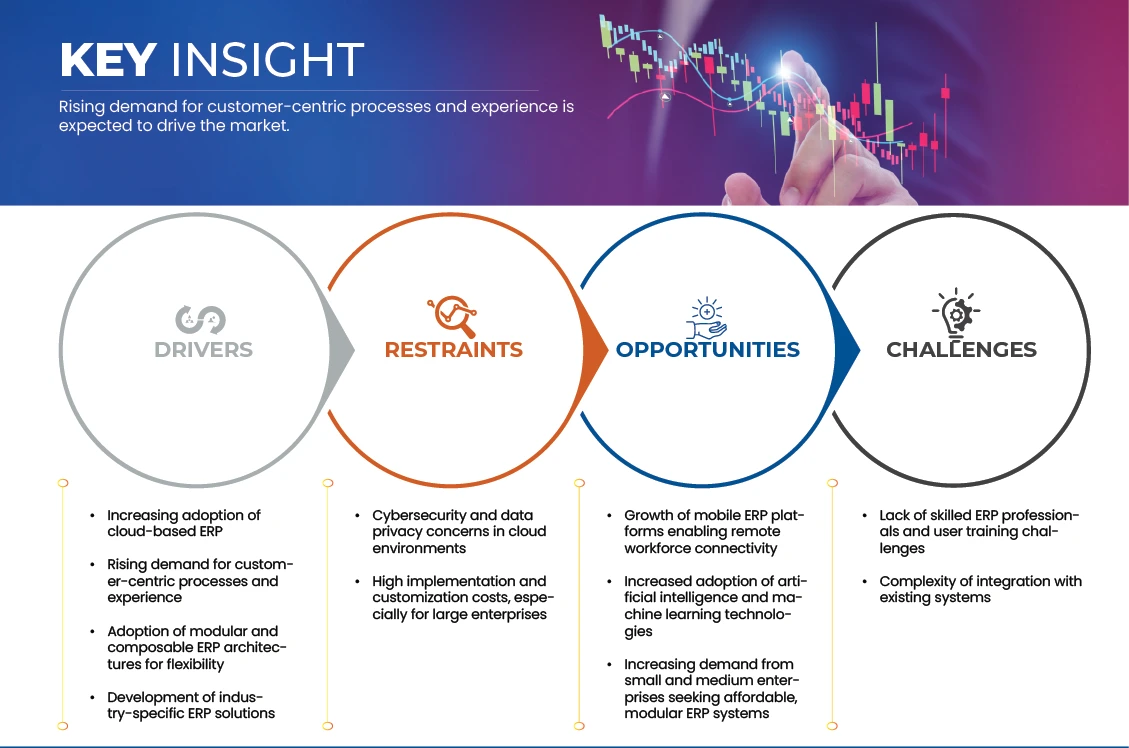
Conductor
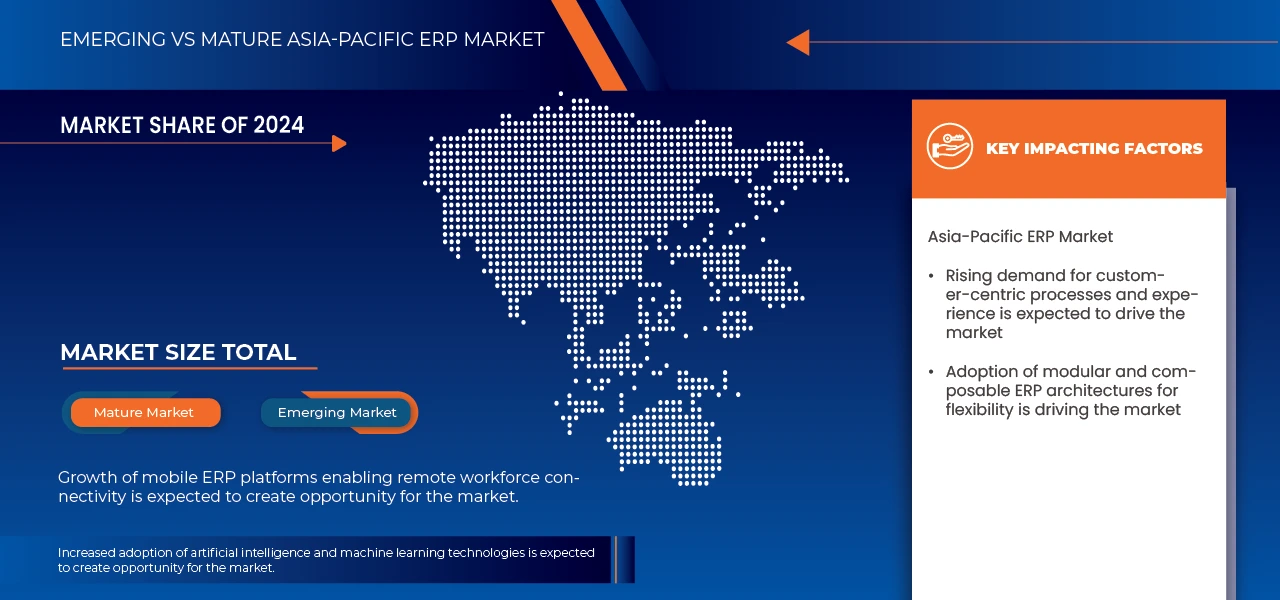
“Aumento de la demanda de procesos y experiencias centrados en el cliente”
- La creciente demanda de procesos y experiencias centrados en el cliente está impulsando a las organizaciones de la región APAC a adoptar soluciones ERP avanzadas que agilizan las operaciones y mejoran la toma de decisiones.
- Las empresas de los sectores manufacturero, minorista, farmacéutico y de bienes de consumo invierten cada vez más en sistemas ERP para mejorar la eficiencia operativa, garantizar la precisión de los datos y facilitar la monitorización de procesos en tiempo real. Las plataformas ERP integradas permiten a las empresas gestionar flujos de trabajo complejos, optimizar la asignación de recursos y mantener el cumplimiento normativo, algo crucial en sectores altamente regulados.
- Las soluciones ERP que pueden respaldar múltiples departamentos, diversos procesos comerciales y proporcionar análisis en tiempo real permiten a las organizaciones reducir errores, minimizar los costos operativos y brindar productos y servicios consistentes y de alta calidad, fortaleciendo en última instancia la satisfacción general del cliente.
- El rápido crecimiento de los sectores manufactureros y orientados a la producción en la región APAC, incluidos alimentos, bebidas y cosméticos, está impulsando a las empresas a adoptar sistemas ERP que mejoran la eficiencia operativa, el control de calidad y la flexibilidad de los procesos.
- Las organizaciones buscan cada vez más soluciones integradas que agilicen los flujos de trabajo, proporcionen visibilidad en tiempo real y respalden la toma de decisiones basada en datos, lo que les permite responder rápidamente a las necesidades de los clientes. Así como las máquinas automáticas de llenado de líquidos optimizan el rendimiento y garantizan una calidad constante del producto,
- Las plataformas ERP actúan como la columna vertebral de las operaciones modernas y centradas en el cliente, ayudando a las empresas a escalar eficientemente y a mantener altos estándares. Esta creciente demanda de automatización de procesos, precisión y transparencia operativa subraya la importancia estratégica de la adopción de ERP en la región APAC como herramienta para ofrecer mejores productos, servicios más rápidos y experiencias de cliente superiores.
Oportunidad
Crecimiento de las plataformas ERP móviles que facilitan la conectividad de la fuerza laboral remota
- El crecimiento de las plataformas ERP móviles está transformando el mercado de ERP de Asia-Pacífico (APAC) al permitir una conectividad fluida para el personal remoto y distribuido. Con la rápida adopción de tecnologías móviles y basadas en la nube en la región Asia-Pacífico, las empresas aprovechan cada vez más las aplicaciones ERP móviles para proporcionar a los empleados acceso en tiempo real a datos empresariales críticos, flujos de trabajo y análisis desde teléfonos inteligentes y tabletas.
- Esta capacidad permite al personal de campo, a los equipos de ventas y al personal operativo tomar decisiones más rápidas, actualizar registros sobre la marcha y mantener la colaboración en múltiples ubicaciones, mejorando así la productividad general. Para la región APAC, donde las empresas suelen operar en zonas geográficamente dispersas, las plataformas ERP móviles reducen la dependencia de oficinas centralizadas, reducen los retrasos en las comunicaciones y optimizan las operaciones en sectores como la manufactura, la logística, el comercio minorista y los servicios.
- Además, estas plataformas admiten la integración con dispositivos IoT, servicios en la nube y otros sistemas empresariales, lo que proporciona flexibilidad, escalabilidad y una mayor continuidad del negocio, lo que impulsa una mayor adopción entre las pymes y las grandes empresas.
- La creciente adopción de tecnologías automatizadas y asépticas en los mercados emergentes refleja una tendencia más amplia hacia la eficiencia operativa y el control de procesos en tiempo real, que es directamente paralela al crecimiento de las plataformas ERP móviles que permiten la conectividad de la fuerza laboral remota en APAC.
- Al igual que los fabricantes invierten en sistemas de llenado avanzados para optimizar la producción y garantizar el cumplimiento normativo, las empresas aprovechan cada vez más las soluciones ERP móviles para brindar a sus empleados remotos acceso en tiempo real a flujos de trabajo, datos y aprobaciones. Esta conectividad mejora la productividad, facilita las operaciones distribuidas y facilita la toma de decisiones ágil en empresas con múltiples sedes, lo que convierte al ERP móvil en una oportunidad estratégica de crecimiento en la región.
Restricción/Desafío
Falta de profesionales cualificados en ERP y dificultades para la formación de los usuarios
- El mercado de ERP de Asia-Pacífico (APAC) se enfrenta a importantes desafíos debido a la escasez de profesionales cualificados en ERP y a la complejidad de la formación de los usuarios. La implementación de sistemas ERP en grandes empresas suele implicar múltiples módulos, integraciones y personalizaciones, lo que requiere conocimientos técnicos especializados para su configuración, implementación y mantenimiento. Muchas organizaciones de la región tienen dificultades para encontrar personal cualificado que pueda gestionar estas tareas eficazmente, lo que se traduce en plazos de implementación más largos, mayores costes y un rendimiento deficiente del sistema.
- Además, la capacitación del usuario final sigue siendo un obstáculo crítico, ya que los empleados deben adaptarse a nuevos flujos de trabajo, interfaces y procesos automatizados. Una capacitación insuficiente puede resultar en bajas tasas de adopción, errores operativos y un menor retorno de la inversión (ROI), lo que complica aún más las iniciativas de ERP. En la región APAC, este problema se ve agravado por la diversidad de idiomas, las diferencias culturales y los distintos niveles de alfabetización digital entre países, lo que dificulta la implementación de programas de capacitación estandarizados. Abordar estas carencias de habilidades es crucial para garantizar una implementación exitosa del ERP y maximizar el valor del negocio.
- La rápida evolución de las tecnologías ERP en la región APAC, incluyendo módulos basados en IA, soluciones en la nube y plataformas modulares, está creando un doble desafío: oportunidades y obsolescencia de habilidades. Las organizaciones enfrentan una creciente necesidad de personal capacitado.
- Los profesionales de ERP deben implementar, gestionar y optimizar eficazmente estos sistemas avanzados. Sin la capacitación y la actualización adecuadas, los empleados pueden infrautilizar las funcionalidades del ERP, lo que genera ineficiencias, retrasos en la implementación y una reducción del retorno de la inversión (ROI). Por lo tanto, abordar la falta de habilidades y proporcionar capacitación continua a los usuarios es esencial para la adopción exitosa del ERP y la competitividad operativa.
Alcance del mercado de ERP de Asia-Pacífico
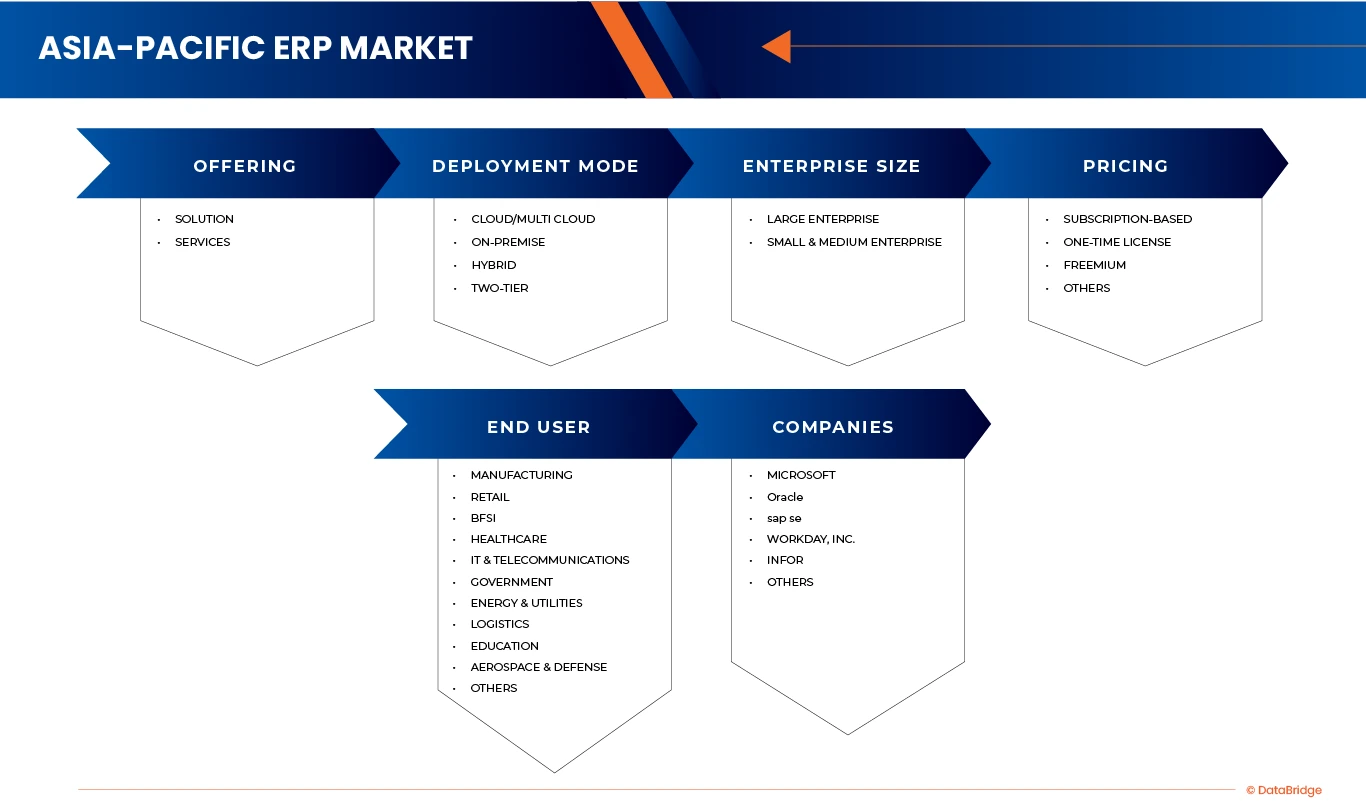
El mercado de ERP de Asia-Pacífico está segmentado en cinco segmentos según la oferta, el modo de desarrollo, el tamaño de la empresa, el precio y el usuario final.
• Ofreciendo
En función de la oferta, el mercado ERP de Asia-Pacífico se segmenta en soluciones y servicios. En 2025, se prevé que el segmento de soluciones domine el mercado con una cuota del 64,66 %, impulsado por la creciente adopción de plataformas integradas de gestión empresarial en los sectores manufacturero, minorista, BFSI, sanitario y gubernamental. La creciente demanda de visibilidad de datos en tiempo real, automatización de flujos de trabajo complejos e integración fluida entre departamentos sigue posicionando a las soluciones ERP como la opción preferida por las empresas.
Se prevé que el segmento de soluciones se expanda de forma sostenida con una tasa de crecimiento anual compuesta (TCAC) del 12,6 % durante el período de pronóstico de 2025 a 2032, registrando la TCAC más alta, impulsada por la aceleración de las iniciativas de transformación digital en las economías emergentes de Asia-Pacífico. Factores como la rápida migración a la nube, la creciente adopción por parte de las pymes, los programas de infraestructura digital impulsados por los gobiernos y la creciente integración de tecnologías avanzadas, como la analítica basada en IA, la inteligencia operativa basada en IoT y los módulos ERP que priorizan la automatización, impulsarán un sólido crecimiento de la demanda.
• Por modo de desarrollo
Según el modo de implementación, el mercado de ERP de Asia-Pacífico se segmenta en local, nube/multinube, doble capa e híbrido. En 2025, se prevé que el segmento nube/multinube domine el mercado con una cuota de mercado del 42,12 %, impulsado por la rápida transición hacia implementaciones de ERP flexibles, escalables y rentables en empresas de todos los tamaños. La creciente preferencia por los modelos basados en suscripción, la reducción de los costes de infraestructura de TI y la mayor accesibilidad entre las plantillas distribuidas han acelerado la adopción de soluciones ERP orientadas a la nube en los sectores de la fabricación, el comercio minorista, la industria BFSI, la sanidad y las TI y las telecomunicaciones.
Se prevé que el segmento de nube/multinube registre la mayor tasa de crecimiento anual compuesta (TCAC) del 12,7 % durante el período de pronóstico de 2025 a 2032, impulsada por el creciente énfasis en la transformación digital, la creciente adopción por parte de las pymes y la expansión de centros de datos a gran escala en Asia-Pacífico. La demanda de plataformas ERP ágiles que permitan análisis en tiempo real, colaboración operativa transfronteriza y una rápida escalabilidad está impulsando a las empresas a migrar de sistemas locales heredados a arquitecturas nativas de la nube.
• Por tamaño de empresa
Según el tamaño de las empresas, el mercado de ERP de Asia-Pacífico se segmenta en grandes empresas y pequeñas y medianas empresas (PYME). En 2025, se prevé que el segmento de grandes empresas domine el mercado con una cuota de mercado del 57,86 %, impulsado por la amplia adopción de plataformas ERP avanzadas para optimizar operaciones complejas, mejorar la coordinación entre países y respaldar iniciativas de transformación digital a gran escala. Las grandes empresas siguen invirtiendo fuertemente en suites ERP integradas para unificar las funciones de finanzas, cadena de suministro, RR. HH., fabricación y gestión de clientes, garantizando así la visibilidad de los datos en tiempo real y una mayor eficiencia operativa.
También se prevé que el segmento de grandes empresas experimente la tasa de crecimiento anual compuesta (TCAC) más rápida, del 12,9 %, durante el período de pronóstico de 2025 a 2032, impulsada por la creciente demanda de soluciones ERP basadas en la nube, análisis basados en IA y módulos ERP específicos para cada sector, diseñados para manufactura, BFSI, salud, gobierno y telecomunicaciones. A medida que las grandes organizaciones aceleran su transición de sistemas heredados a arquitecturas ERP escalables en la nube e híbridas, la necesidad de plataformas seguras, unificadas y de alto rendimiento continúa creciendo.
• Por precio
En cuanto a precios, el mercado de ERP de Asia-Pacífico se segmenta en suscripción, licencia única, freemium y otros. En 2025, se prevé que el segmento de suscripción domine el mercado con una cuota de mercado del 66,74 %, impulsado por la creciente preferencia por modelos de implementación de ERP rentables, escalables y flexibles en organizaciones de todos los tamaños. La transición hacia un gasto en TI basado en OPEX, la reducción de los requisitos de inversión inicial y la creciente disponibilidad de plataformas ERP nativas de la nube han acelerado significativamente la adopción de precios de suscripción.
También se proyecta que el segmento de suscripción registre la mayor tasa de crecimiento anual compuesta (TCAC) del 12,6 % durante el período de pronóstico de 2025 a 2032, impulsado por la rápida tendencia de migración a la nube, la creciente adopción por parte de las pymes y la creciente demanda de suites ERP modulares y personalizables. A medida que las empresas de Asia-Pacífico priorizan la agilidad, la accesibilidad remota y el análisis de datos en tiempo real, las ofertas de ERP basadas en suscripción están cobrando un fuerte impulso.
• Por el usuario final
En función del usuario final, el mercado ERP de Asia-Pacífico se segmenta en manufactura, comercio minorista, BFSI, salud, TI y telecomunicaciones, gobierno, energía y servicios públicos, logística, educación, aeroespacial y defensa, entre otros. En 2025, se espera que el segmento de manufactura domine el mercado con una participación del 25,11 %, impulsado por la rápida adopción de plataformas ERP para optimizar la planificación de la producción, las operaciones de la cadena de suministro y la gestión integral del uso de recursos. El auge de las iniciativas de fábricas inteligentes, la integración de la Industria 4.0 y la creciente demanda de visibilidad en tiempo real del inventario, las compras y el rendimiento de la planta de producción siguen posicionando al sector de manufactura como el principal adoptante de ERP en la región.
También se proyecta que el segmento manufacturero registre la mayor tasa de crecimiento anual compuesta (TCAC) del 13,5 % durante el período de pronóstico de 2025 a 2032, impulsada por la implementación acelerada de sistemas ERP en la nube, el aumento de las inversiones en transformación digital tanto en grandes empresas como en pymes, y un enfoque cada vez mayor en ecosistemas de fabricación conectados. A medida que los fabricantes adoptan la robótica, la maquinaria con IoT, los sistemas de mantenimiento predictivo y la previsión de la demanda basada en IA, la demanda de plataformas ERP unificadas e inteligentes se intensifica rápidamente.
Análisis regional del mercado ERP de Asia-Pacífico
- La región de Asia y el Pacífico está atravesando una de las olas de transformación digital más rápidas del mundo, impulsada por iniciativas gubernamentales a gran escala, crecientes inversiones en infraestructura inteligente y la creciente adopción de tecnologías de la Industria 4.0.
- Las empresas de manufactura, BFSI, atención médica, comercio minorista, logística y organizaciones del sector público están realizando una transición activa desde sistemas heredados fragmentados a plataformas ERP unificadas para lograr visibilidad operativa, automatización del flujo de trabajo e integración entre departamentos.
- Países como China, Japón, Corea del Sur e India están a la vanguardia debido a sus sólidos ecosistemas industriales, importantes inversiones en tecnologías de automatización y creciente demanda de sistemas de caja de cambios compactos, eficientes y duraderos.
- La rápida expansión de los centros de datos en la nube por parte de importantes hiperescaladores, como AWS, Google Cloud, Azure, Alibaba Cloud y Oracle Cloud, ha simplificado aún más la implementación de sistemas ERP, reducido la inversión inicial y mejorado la escalabilidad. A medida que las organizaciones migran a entornos híbridos y multicloud para respaldar la distribución del personal y el acceso a datos en tiempo real, las plataformas ERP con arquitecturas nativas de la nube, habilitadas para IA y modulares se vuelven esenciales, acelerando significativamente el crecimiento del mercado en toda la región.
Perspectiva del mercado de ERP en Asia-Pacífico
Asia-Pacífico es el centro global de la manufactura, representando industrias como la electrónica, automotriz, aeroespacial, maquinaria industrial, textiles y semiconductores. La rápida industrialización en China, India, Indonesia, Vietnam, Tailandia y Malasia está impulsando la demanda de sistemas ERP avanzados capaces de gestionar flujos de trabajo complejos de producción, compras, inventario y logística de múltiples unidades. El impulso agresivo de la región hacia fábricas inteligentes, integración robótica, gemelos digitales, líneas de producción habilitadas para IoT y mantenimiento predictivo está creando una fuerte demanda de plataformas ERP que admitan la monitorización en tiempo real, la integración de MES y la automatización impulsada por IA. Las interrupciones en la cadena de suministro causadas por cambios geopolíticos, la volatilidad de los precios de la energía y las fluctuaciones de la demanda global también han incrementado la necesidad de sistemas ERP inteligentes que mejoren la resiliencia de la cadena de suministro, mejoren la precisión de las previsiones y optimicen la asignación de recursos. Este cambio estructural hacia ecosistemas de manufactura conectados digitalmente es uno de los principales impulsores del mercado ERP de Asia-Pacífico.
Perspectiva del mercado ERP de China y Asia-Pacífico
El mercado chino de ERP en Asia-Pacífico está fuertemente impulsado por los programas gubernamentales de transformación digital, incluyendo las iniciativas "China Digital", "Hecho en China 2025" y el "XIV Plan Quinquenal", que enfatizan la fabricación inteligente, la estandarización de datos y la modernización digital empresarial. Estas estrategias nacionales promueven la adopción de plataformas en la nube, automatización industrial y sistemas integrados de gestión empresarial en empresas estatales (EPE), clústeres manufactureros e industrias emergentes impulsadas por la tecnología. El fuerte enfoque gubernamental en la infraestructura digital, como las redes 5G, las plataformas de internet industrial y los centros de computación en la nube, ha incrementado significativamente la necesidad de sistemas ERP robustos capaces de soportar el procesamiento de grandes volúmenes de datos, el análisis en tiempo real y la automatización integral.
Perspectiva del mercado ERP de Asia-Pacífico en Japón
El mercado japonés de ERP en Asia-Pacífico se ve fuertemente impulsado por la urgente necesidad de reemplazar los sistemas heredados, obsoletos y fragmentados que han respaldado durante mucho tiempo las operaciones de manufactura, automoción, electrónica, salud y sector público. Muchas empresas japonesas aún dependen de infraestructuras ERP locales altamente personalizadas, construidas hace décadas, cuyo mantenimiento se ha vuelto difícil debido al aumento de los costos de TI y la disminución de la disponibilidad de personal cualificado. Al mismo tiempo, la grave escasez de mano de obra en Japón, impulsada por el envejecimiento de la población y la disminución de la fuerza laboral, ha acelerado la adopción de la automatización, los flujos de trabajo digitales y la gestión operativa asistida por IA. A medida que las empresas buscan mejorar la productividad, automatizar las tareas administrativas manuales y consolidar los datos en plataformas unificadas, los sistemas ERP modernos basados en la nube se vuelven esenciales. Las iniciativas gubernamentales bajo la "Agencia Digital", el impulso a la DX (Transformación Digital) a nivel nacional y los incentivos para la modernización de TI amplifican aún más la demanda de plataformas ERP de última generación en todos los sectores en Japón.
Los principales líderes del mercado que operan en el mercado son:
- Microsoft (EE. UU.)
- Oracle (EE. UU.)
- SAP SE (Alemania)
- Workday, Inc. (EE. UU.)
- Infor (EE. UU.)
- Odoo (Bélgica)
- Focus Softnet Pvt Ltd (India)
- HashMicro (Singapur)
- Sage Group plc (Reino Unido)
- Epicor Software Corporation (EE. UU.)
- Exacto (Países Bajos)
- QAD Inc. (EE. UU.)
- Tally Solutions Private Limited (India)
- Deltek, Inc. (EE. UU.)
- Sistemas Ramco (India)
- Zoho Corporation Pvt. Ltd. (India)
- Acumatica, Inc. (EE. UU.)
- Software BatchMaster (EE. UU.)
- Deskera (Singapur)
- SYSPRO (Sudáfrica)
Últimos avances en el mercado ERP de Asia-Pacífico
- En junio de 2025, QAD organizó un evento global, QAD Redzone's Champions of Manufacturing, que reunió a líderes del sector para presentar las últimas innovaciones impulsadas por IA y las soluciones de nube adaptativas para la fabricación. El evento destacó cómo la inteligencia artificial y las tecnologías avanzadas están transformando el ERP en un sistema proactivo que impulsa una toma de decisiones más rápida y la excelencia operativa. Los asistentes participaron en demostraciones de productos en vivo, laboratorios interactivos y casos prácticos reales centrados en el ERP, la cadena de suministro y el empoderamiento de la fuerza laboral.
- En julio de 2025, Exact anunció la expansión de su equipo directivo y el lanzamiento de ediciones Premium de Exact Online, que ofrecen mayor flexibilidad y funcionalidad mejorada para los usuarios de ERP. La compañía también destacó su enfoque en la innovación, la automatización y las colaboraciones como factores clave para el crecimiento en el mercado de ERP de Asia-Pacífico.
- En enero de 2025, se implementó BatchMaster ERP para mejorar la eficiencia de la producción y optimizar las operaciones en el sector farmacéutico. La implementación sustituyó los sistemas heredados por una solución ERP moderna que prioriza la automatización, la trazabilidad, el cumplimiento normativo y una mejor programación de la producción para impulsar una fabricación más inteligente y el cumplimiento normativo.
- En septiembre de 2025, Acumatica presentó una interfaz de usuario rediseñada, herramientas de IA integradas y mejoras específicas para cada sector. Entre sus características principales se incluyen el reconocimiento de facturas basado en IA, la compatibilidad con EIN multiempresa y una funcionalidad mejorada del portal del cliente.
- En marzo de 2025, Acumatica lanzó su última actualización, que incluye usabilidad mejorada, automatización basada en IA e innovaciones específicas para cada sector. La versión 2025 R1 introdujo flujos de trabajo optimizados y mejoras significativas en los módulos de fabricación, distribución, comercio minorista y construcción, además de nuevas capacidades basadas en IA para la detección de anomalías y el reconocimiento de documentos.
SKU-
Obtenga acceso en línea al informe sobre la primera nube de inteligencia de mercado del mundo

- Panel de análisis de datos interactivo
- Panel de análisis de empresas para oportunidades con alto potencial de crecimiento
- Acceso de analista de investigación para personalización y consultas
- Análisis de la competencia con panel interactivo
- Últimas noticias, actualizaciones y análisis de tendencias
- Aproveche el poder del análisis de referencia para un seguimiento integral de la competencia
Tabla de contenido
1 INTRODUCCIÓN
1.1 OBJETIVOS DEL ESTUDIO
1.2 DEFINICIÓN DE MERCADO
1.3 DESCRIPCIÓN GENERAL DEL MERCADO DE ERP DE ASIA-PACÍFICO
1.4 LIMITACIONES
1.5 MERCADOS CUBIERTOS
2 SEGMENTACIÓN DEL MERCADO
2.1 MERCADOS CUBIERTOS
2.2 ÁMBITO GEOGRÁFICO
2,3 AÑOS CONSIDERADOS PARA EL ESTUDIO
2.4 MONEDA Y PRECIOS
2.5 MODELO DE VALIDACIÓN DE DATOS TRÍPODE DBMR
2.6 MODELADO MULTIVARIADO
2.7 ENTREVISTAS PRINCIPALES CON LÍDERES DE OPINIÓN CLAVE
2.8 CUADRÍCULA DE POSICIÓN DE MERCADO DBMR
2.9 ANÁLISIS DE PARTICIPACIÓN DE PROVEEDORES DE DBMR
2.1 CUADRÍCULA DE COBERTURA DE USUARIOS FINALES DEL MERCADO
2.11 FUENTES SECUNDARIAS
2.12 SUPUESTOS
3 RESUMEN EJECUTIVO
4 INFORMACIÓN PREMIUM
4.1 ANÁLISIS DE LAS CINCO FUERZAS DE PORTER
4.1.1 AMENAZA DE NUEVOS ENTRANTES
4.1.2 PODER DE NEGOCIACIÓN DE LOS PROVEEDORES
4.1.3 PODER DE NEGOCIACIÓN DE LOS COMPRADORES
4.1.4 AMENAZA DE PRODUCTOS SUSTITUTOS
4.1.5 RIVALIDAD EN LA INDUSTRIA
4.2 ANÁLISIS COMPARATIVO DE EMPRESAS
4.3 MATRIZ DE LA PLATAFORMA DE SERVICIOS DE LA EMPRESA: ANÁLISIS
4.4 COMPORTAMIENTO DEL CONSUMIDOR
4.4.1 PATRÓN DE COMPRA
4.4.2 ANÁLISIS DE USOS
4.5 OPORTUNIDADES DE INGRESOS PARA NUEVAS EMPRESAS Y EMPRESAS EMERGENTES EN EL MERCADO DE ERP DE APAC
4.5.1 ERP EN LA NUBE HABILITADO POR IA ESPECÍFICO PARA VERTICALES
4.5.2 ERP MÓVIL PRIMERO PARA PYMES Y MICROEMPRESAS
4.5.3 MONETIZACIÓN DE ERP IMPULSADAS POR EL CUMPLIMIENTO
4.5.4 ECOSISTEMAS ERP COMPONIBLES Y PLATAFORMAS DE MERCADO
4.5.5 ERP INTEGRADO CON IOT, GEMELO DIGITAL Y ACTIVOS
4.5.6 INTEGRACIÓN DE FINANZAS INTEGRADAS Y PAGOS EN TIEMPO REAL
4.6 ANÁLISIS DE LA INDUSTRIA Y ESCENARIO FUTURISTA: MERCADO DE ERP DE ASIA-PACÍFICO
4.6.1 INTRODUCCIÓN:
4.6.1.1 INICIATIVAS NACIONALES Y GUBERNAMENTALES
4.6.1.2 IMPACTO Y TRANSFORMACIÓN ESPECÍFICOS DEL SECTOR
4.6.1.3 ATENCIÓN SANITARIA
4.6.1.4 ADOPCIÓN Y PERSONALIZACIÓN DE TECNOLOGÍA
4.6.1.5 ESTUDIOS DE CASOS
4.6.1.6 BARRERAS PARA UN USO MÁS AMPLIO
4.6.1.7 TRAYECTORIA FUTURA Y OPORTUNIDADES
4.7 MAPEO DE PERSPECTIVAS DE PENETRACIÓN Y CRECIMIENTO: MERCADO ERP DE ASIA-PACÍFICO
4.7.1 PANORAMA ACTUAL DE PENETRACIÓN
4.7.2 DETERMINANTES QUE INFLUYEN EN LA PENETRACIÓN
4.7.3 MAPEO DE PERSPECTIVAS DE CRECIMIENTO
4.7.4 PERSPECTIVAS FUTURAS
4.7.5 CONCLUSIÓN
4.8 RESPUESTAS ESTRATÉGICAS Y PERSPECTIVAS DE LA INDUSTRIA
4.9 DIVERSIFICACIÓN DE LAS CADENAS DE SUMINISTRO
4.1 APROVECHAMIENTO DE LA LOGÍSTICA AVANZADA
4.11 DEFENSA DE AJUSTES DE POLÍTICAS
4.12 ANÁLISIS COMPARATIVO DE MARCAS: MERCADO ERP DE ASIA-PACÍFICO
4.12.1 DEFENSA DE AJUSTES DE POLÍTICAS
4.12.2 RESIDENCIA DE DATOS E INTEROPERABILIDAD EN LA NUBE
4.12.3 INCENTIVOS Y APOYO A LA ADOPCIÓN DE LAS PYMES
4.12.4 PROGRAMAS DE CAPACITACIÓN Y CERTIFICACIÓN
4.12.5 ESTANDARIZACIÓN E INTEROPERABILIDAD
4.13 ANÁLISIS DE TECNOLOGÍA
4.13.1 TECNOLOGÍAS CLAVE
4.13.2 INNOVACIONES AVANZADAS
4.13.3 TECNOLOGÍAS COMPLEMENTARIAS
4.13.4 PILA DE HABILITACIÓN DIGITAL
4.13.5 TECNOLOGÍAS ADYACENTES
4.13.6 ECOSISTEMA DE EXPANSIÓN PARA ERP APAC
4.14 EVALUACIÓN INTEGRAL DE CASOS DE USO DE ERP EN TODOS LOS FACTORES DE IMPLEMENTACIÓN, INTEGRACIÓN, CONFIABILIDAD Y RENDIMIENTO
5 ARANCELES E IMPACTO EN EL MERCADO DE ERP DE ASIA-PACÍFICO
5.1 DESCRIPCIÓN GENERAL
5.2 ESTRUCTURAS TARIFARIAS
5.3 ESTRUCTURAS ARANCELARIAS GLOBALES VS. REGIONALES
5.4 ESTADOS UNIDOS: POLÍTICAS ARANCELARIAS DE LAS TIC
5.5 UNIÓN EUROPEA: REGLAMENTOS ARANCELARIOS TRANSFRONTERIZOS Y POLÍTICAS DE REEMBOLSO
5.6 ASIA-PACÍFICO: ARANCELES IMPUESTOS POR EL GOBIERNO A LOS SERVICIOS PRESTADOS
5.7 MERCADOS EMERGENTES: DESAFÍOS EN LA IMPLEMENTACIÓN ARANCELARIA
5.8 AUMENTO DE COSTOS
5.9 INTERRUPCIONES DE LA CADENA DE SUMINISTRO
5.1 INCERTIDUMBRE E INVERSIÓN
5.11 IMPACTO EN LA INNOVACIÓN
5.12 COMPETENCIA Y DINÁMICA DEL MERCADO
5.13 EFECTO EN LAS PEQUEÑAS Y MEDIANAS EMPRESAS (PYMES)
5.14 DESPLIEGUE DE INFRAESTRUCTURA DE TELECOMUNICACIONES
6 ESTÁNDARES REGULADORES EN EL MERCADO ERP DE ASIA-PACÍFICO
6.1 NORMAS DE GESTIÓN DE CALIDAD Y CERTIFICACIÓN
6.2 REQUISITOS DE FABRICACIÓN Y PRUEBAS
6.3 NORMATIVA AMBIENTAL Y DE EFICIENCIA ENERGÉTICA
6.4 NORMAS DE SEGURIDAD Y OPERACIONALES
6.5 CONSIDERACIONES DE CUMPLIMIENTO REGIONAL
6.6 CONCLUSIÓN
7 DESCRIPCIÓN GENERAL DEL MERCADO
7.1 CONTROLADORES
7.1.1 AUMENTO DE LA ADOPCIÓN DE ERP BASADO EN LA NUBE
7.1.2 CRECIENTE DEMANDA DE PROCESOS Y EXPERIENCIAS CENTRADOS EN EL CLIENTE
7.1.3 ADOPCIÓN DE ARQUITECTURAS ERP MODULARES Y COMPONIBLES PARA MAYOR FLEXIBILIDAD
7.1.4 DESARROLLO DE SOLUCIONES ERP ESPECÍFICAS PARA LA INDUSTRIA
7.2 RESTRICCIONES
7.2.1 PREOCUPACIONES DE CIBERSEGURIDAD Y PRIVACIDAD DE DATOS EN ENTORNOS DE NUBE
7.2.2 ALTOS COSTOS DE IMPLEMENTACIÓN Y PERSONALIZACIÓN, ESPECIALMENTE PARA GRANDES EMPRESAS
7.3 OPORTUNIDADES
7.3.1 CRECIMIENTO DE LAS PLATAFORMAS ERP MÓVILES QUE PERMITEN LA CONECTIVIDAD DE LA FUERZA DE TRABAJO REMOTA
7.3.2 MAYOR ADOPCIÓN DE TECNOLOGÍAS DE INTELIGENCIA ARTIFICIAL Y APRENDIZAJE AUTOMÁTICO
7.3.3 AUMENTO DE LA DEMANDA DE LAS PEQUEÑAS Y MEDIANAS EMPRESAS QUE BUSCAN SISTEMAS ERP MODULARES Y ASEQUIBLES
7.4 DESAFÍOS
7.4.1 FALTA DE PROFESIONALES DE ERP CALIFICADOS Y DESAFÍOS EN LA FORMACIÓN DE USUARIOS
7.4.2 COMPLEJIDAD DE LA INTEGRACIÓN CON LOS SISTEMAS EXISTENTES
8 MERCADO DE ERP DE ASIA-PACÍFICO, AL OFRECER
8.1 DESCRIPCIÓN GENERAL
8.2 SOLUCIÓN
8.3 SERVICIOS
9 MERCADO DE ERP DE ASIA-PACÍFICO, POR MODO DE IMPLEMENTACIÓN
9.1 DESCRIPCIÓN GENERAL
9.2 NUBE/MULTINUBE
9.3 EN LAS INSTALACIONES
9.4 HÍBRIDO
9.5 DOS NIVELES
10 MERCADO DE ERP DE ASIA-PACÍFICO, POR TAMAÑO DE EMPRESA
10.1 DESCRIPCIÓN GENERAL
10.2 GRAN EMPRESA
10.3 PEQUEÑA Y MEDIANA EMPRESA
11 MERCADO DE ERP DE ASIA-PACÍFICO, POR PRECIOS
11.1 DESCRIPCIÓN GENERAL
11.2 BASADO EN SUSCRIPCIÓN
11.3 LICENCIA ÚNICA
11.4 FREEMIUM
11.5 OTROS
12 MERCADO DE ERP DE ASIA-PACÍFICO, POR USUARIO FINAL
12.1 DESCRIPCIÓN GENERAL
12.2 FABRICACIÓN
12.3 VENTA AL POR MENOR
12.4 BFSI
12.5 ATENCIÓN SANITARIA
12.6 TI Y TELECOMUNICACIONES
12.7 GOBIERNO
12.8 ENERGÍA Y SERVICIOS PÚBLICOS
12.9 LOGÍSTICA
12.1 EDUCACIÓN
12.11 AEROESPACIAL Y DEFENSA
12.12 OTROS
13 MERCADO DE ERP DE ASIA-PACÍFICO, POR PAÍS
13.1 ASIA PACÍFICO
13.1.1 CHINA
13.1.2 JAPÓN
13.1.3 INDIA
13.1.4 COREA DEL SUR
13.1.5 AUSTRALIA
13.1.6 INDONESIA
13.1.7 SINGAPUR
13.1.8 TAILANDIA
13.1.9 MALASIA
13.1.10 VIETNAM
13.1.11 TAIWÁN
13.1.12 HONG KONG
13.1.13 FILIPINAS
13.1.14 NUEVA ZELANDA
13.1.15 RESTO DE ASIA-PACÍFICO
14 PANORAMA EMPRESARIAL DEL MERCADO ERP DE ASIA-PACÍFICO
14.1 ANÁLISIS DE ACCIONES DE LA EMPRESA: ASIA-PACÍFICO
15 ANÁLISIS FODA
16 PERFIL DE LA EMPRESA
16.1 MICROSOFT
16.1.1 INSTANTÁNEA DE LA EMPRESA
16.1.2 ANÁLISIS DE INGRESOS
16.1.3 PORTAFOLIO DE PRODUCTOS
16.1.4 DESARROLLO RECIENTE
16.2 ORÁCULO
16.2.1 INSTANTÁNEA DE LA EMPRESA
16.2.2 ANÁLISIS DE INGRESOS
16.2.3 PORTAFOLIO DE PRODUCTOS
16.2.4 DESARROLLO RECIENTE
16.3 SAP SE
16.3.1 INSTANTÁNEA DE LA EMPRESA
16.3.2 ANÁLISIS DE INGRESOS
16.3.3 PORTAFOLIO DE PRODUCTOS
16.3.4 DESARROLLO RECIENTE
16.4 DÍA LABORAL, INC.
16.4.1 INSTANTÁNEA DE LA EMPRESA
16.4.2 ANÁLISIS DE INGRESOS
16.4.3 PORTAFOLIO DE PRODUCTOS
16.4.4 DESARROLLO RECIENTE
16.5 INFORMACIÓN
16.5.1 INSTANTÁNEA DE LA EMPRESA
16.5.2 PORTAFOLIO DE PRODUCTOS
16.5.3 DESARROLLO RECIENTE
16.6 ACUMATICA, INC.
16.6.1 INSTANTÁNEA DE LA EMPRESA
16.6.2 PORTAFOLIO DE PRODUCTOS
16.6.3 DESARROLLO RECIENTE
16.7 SOFTWARE BATCHMASTER
16.7.1 INSTANTÁNEA DE LA EMPRESA
16.7.2 PORTAFOLIO DE PRODUCTOS
16.7.3 DESARROLLO RECIENTE
16.8 DELTEK, INC.
16.8.1 INSTANTÁNEA DE LA EMPRESA
16.8.2 PORTAFOLIO DE PRODUCTOS
16.8.3 DESARROLLO RECIENTE
16.9 ESCRITORIO
16.9.1 INSTANTÁNEA DE LA EMPRESA
16.9.2 PORTAFOLIO DE PRODUCTOS
16.9.3 DESARROLLO RECIENTE
16.1 CORPORACIÓN DE SOFTWARE EPICOR
16.10.1 INSTANTÁNEA DE LA EMPRESA
16.10.2 PORTAFOLIO DE PRODUCTOS
16.10.3 DESARROLLO RECIENTE
16.11 EXACTO
16.11.1 INSTANTÁNEA DE LA EMPRESA
16.11.2 PORTAFOLIO DE PRODUCTOS
16.11.3 DESARROLLO RECIENTE
16.12 FOCUS SOFTNET PVT LTD
16.12.1 INSTANTÁNEA DE LA EMPRESA
16.12.2 PORTAFOLIO DE PRODUCTOS
16.12.3 DESARROLLO RECIENTE
16.13 HASHMICRO
16.13.1 INSTANTÁNEA DE LA EMPRESA
16.13.2 PORTAFOLIO DE PRODUCTOS
16.13.3 DESARROLLO RECIENTE
16.14 ODOO
16.14.1 INSTANTÁNEA DE LA EMPRESA
16.14.2 PORTAFOLIO DE PRODUCTOS
16.14.3 DESARROLLO RECIENTE
16.15 QAD INC.
16.15.1 INSTANTÁNEA DE LA EMPRESA
16.15.2 PORTAFOLIO DE PRODUCTOS
16.15.3 DESARROLLO RECIENTE
16.16 SISTEMAS RAMCO
16.16.1 INSTANTÁNEA DE LA EMPRESA
16.16.2 ANÁLISIS DE INGRESOS
16.16.3 PORTAFOLIO DE PRODUCTOS
16.16.4 DESARROLLO RECIENTE
16.17 SAGE GROUP PLC
16.17.1 INSTANTÁNEA DE LA EMPRESA
16.17.2 ANÁLISIS DE INGRESOS
16.17.3 PORTAFOLIO DE PRODUCTOS
16.17.4 DESARROLLO RECIENTE
16.18 SYSPRO
16.18.1 INSTANTÁNEA DE LA EMPRESA
16.18.2 PORTAFOLIO DE PRODUCTOS
16.18.3 DESARROLLO RECIENTE
16.19 TALLY SOLUTIONS PRIVATE LIMITED
16.19.1 INSTANTÁNEA DE LA EMPRESA
16.19.2 PORTAFOLIO DE PRODUCTOS
16.19.3 DESARROLLO RECIENTE
16.2 ZOHO CORPORATION PVT. LTD.
16.20.1 INSTANTÁNEA DE LA EMPRESA
16.20.2 PORTAFOLIO DE PRODUCTOS
16.20.3 DESARROLLO RECIENTE
17 CUESTIONARIO
18 INFORMES RELACIONADOS
Lista de Tablas
TABLA 1 ANÁLISIS COMPARATIVO DE EMPRESAS
TABLA 2 MATRIZ DE PLATAFORMA DE SERVICIOS DE LA EMPRESA
TABLA 3 ANÁLISIS COMPARATIVO DE LAS PRINCIPALES MARCAS DE ERP EN EL MERCADO DE ASIA-PACÍFICO
TABLA 4 MATRIZ TECNOLÓGICA DEL MERCADO DE ERP DE APAC
TABLA 5 ANÁLISIS DE CASOS USADOS
TABLA 6 MERCADO DE ERP DE ASIA-PACÍFICO, POR OFERTA, 2018-2032 (MILES DE USD)
TABLA 7 SOLUCIONES DE ASIA-PACÍFICO EN EL MERCADO ERP, POR TIPO, 2018-2032 (MILES DE USD)
TABLA 8 SERVICIOS DE ASIA-PACÍFICO EN EL MERCADO ERP, POR TIPO, 2018-2032 (MILES DE USD)
TABLA 9 SERVICIOS PROFESIONALES EN EL MERCADO DE ERP DE ASIA-PACÍFICO, POR TIPO, 2018-2032 (MILES DE USD)
TABLA 10 MERCADO DE ERP DE ASIA-PACÍFICO, POR MODO DE IMPLEMENTACIÓN, 2018-2032 (MILES DE USD)
TABLA 11 NUBE/MULTINUBE EN EL MERCADO DE ERP DE ASIA-PACÍFICO, POR TIPO, 2018-2032 (MILES DE USD)
TABLA 12 MERCADO DE ERP DE ASIA-PACÍFICO, POR TAMAÑO DE EMPRESA, 2018-2032 (MILES DE USD)
TABLA 13 MERCADO DE ERP PARA GRANDES EMPRESAS DE ASIA-PACÍFICO, POR MODO DE IMPLEMENTACIÓN, 2018-2032 (MILES DE USD)
TABLA 14 NUBE/MULTINUBE EN EL MERCADO DE ERP DE ASIA-PACÍFICO, POR TIPO, 2018-2032 (MILES DE USD)
TABLA 15 MERCADO DE ERP DE ASIA-PACÍFICO, POR PRECIOS, 2018-2032 (MILES DE USD)
TABLA 16 MERCADO DE ERP BASADO EN SUSCRIPCIÓN DE ASIA-PACÍFICO, POR TIPO, 2018-2032 (MILES DE USD)
TABLA 17 MERCADO DE ERP DE ASIA-PACÍFICO, POR USUARIO FINAL, 2018-2032 (MILES DE USD)
TABLA 18 MERCADO DE MANUFACTURA EN ERP DE ASIA-PACÍFICO, POR APLICACIÓN, 2018-2032 (MILES DE USD)
TABLA 19 FABRICACIÓN DE ASIA-PACÍFICO EN EL MERCADO DE ERP, POR MODO DE IMPLEMENTACIÓN, 2018-2032 (MILES DE USD)
TABLA 20 NUBE/MULTINUBE EN EL MERCADO DE ERP DE ASIA-PACÍFICO, POR TIPO, 2018-2032 (MILES DE USD)
TABLA 21 VENTAS MINORISTAS EN EL MERCADO ERP DE ASIA-PACÍFICO, POR APLICACIÓN, 2018-2032 (MILES DE USD)
TABLA 22 VENTAS MINORISTAS EN EL MERCADO ERP DE ASIA-PACÍFICO, POR MODO DE IMPLEMENTACIÓN, 2018-2032 (MILES DE USD)
TABLA 23 NUBE/MULTINUBE EN EL MERCADO DE ERP DE ASIA-PACÍFICO, POR TIPO, 2018-2032 (MILES DE USD)
TABLA 24 BFSI DE ASIA-PACÍFICO EN EL MERCADO ERP, POR APLICACIÓN, 2018-2032 (MILES DE USD)
TABLA 25 BFSI DE ASIA-PACÍFICO EN EL MERCADO DE ERP, POR MODO DE IMPLEMENTACIÓN, 2018-2032 (MILES DE USD)
TABLA 26 NUBE/MULTINUBE EN EL MERCADO DE ERP DE ASIA-PACÍFICO, POR TIPO, 2018-2032 (MILES DE USD)
TABLA 27 MERCADO DE ATENCIÓN MÉDICA EN ERP DE ASIA-PACÍFICO, POR APLICACIÓN, 2018-2032 (MILES DE USD)
TABLA 28 ASIA-PACÍFICO ATENCIÓN MÉDICA EN EL MERCADO ERP, POR MODO DE IMPLEMENTACIÓN, 2018-2032 (MILES DE USD)
TABLA 29 NUBE/MULTINUBE EN EL MERCADO DE ERP DE ASIA-PACÍFICO, POR TIPO, 2018-2032 (MILES DE USD)
TABLA 30 MERCADO DE TI Y TELECOMUNICACIONES EN ERP DE ASIA-PACÍFICO, POR APLICACIÓN, 2018-2032 (MILES DE USD)
TABLA 31 MERCADO DE TI Y TELECOMUNICACIONES EN ERP DE ASIA-PACÍFICO, POR MODO DE IMPLEMENTACIÓN, 2018-2032 (MILES DE USD)
TABLA 32 NUBE/MULTINUBE EN EL MERCADO DE ERP DE ASIA-PACÍFICO, POR TIPO, 2018-2032 (MILES DE USD)
TABLA 33 GOBIERNO DE ASIA-PACÍFICO EN EL MERCADO DE ERP, POR APLICACIÓN, 2018-2032 (MILES DE USD)
TABLA 34 GOBIERNO DE ASIA-PACÍFICO EN EL MERCADO DE ERP, POR MODO DE IMPLEMENTACIÓN, 2018-2032 (MILES DE USD)
TABLA 35 NUBE/MULTINUBE EN EL MERCADO DE ERP DE ASIA-PACÍFICO, POR TIPO, 2018-2032 (MILES DE USD)
TABLA 36 ENERGÍA Y SERVICIOS PÚBLICOS DE ASIA-PACÍFICO EN EL MERCADO DE ERP, POR APLICACIÓN, 2018-2032 (MILES DE USD)
TABLA 37 VENTAS MINORISTAS EN EL MERCADO ERP DE ASIA-PACÍFICO, POR MODO DE IMPLEMENTACIÓN, 2018-2032 (MILES DE USD)
TABLA 38 NUBE/MULTINUBE EN EL MERCADO DE ERP DE ASIA-PACÍFICO, POR TIPO, 2018-2032 (MILES DE USD)
TABLA 39 LOGÍSTICA DE ASIA-PACÍFICO EN EL MERCADO ERP, POR APLICACIÓN, 2018-2032 (MILES DE USD)
TABLA 40 LOGÍSTICA DE ASIA-PACÍFICO EN EL MERCADO ERP, POR MODO DE IMPLEMENTACIÓN, 2018-2032 (MILES DE USD)
TABLA 41 NUBE/MULTINUBE EN EL MERCADO DE ERP DE ASIA-PACÍFICO, POR TIPO, 2018-2032 (MILES DE USD)
TABLA 42 MERCADO DE EDUCACIÓN EN ERP DE ASIA-PACÍFICO, POR APLICACIÓN, 2018-2032 (MILES DE USD)
TABLA 43 MERCADO DE EDUCACIÓN EN ERP DE ASIA-PACÍFICO, POR MODO DE IMPLEMENTACIÓN, 2018-2032 (MILES DE USD)
TABLA 44 NUBE/MULTINUBE EN EL MERCADO DE ERP DE ASIA-PACÍFICO, POR TIPO, 2018-2032 (MILES DE USD)
TABLA 45 MERCADO DE LA INDUSTRIA AEROESPACIAL Y DE DEFENSA DE ASIA-PACÍFICO EN ERP, POR APLICACIÓN, 2018-2032 (MILES DE USD)
TABLA 46 ASIA-PACÍFICO AEROESPACIAL Y DEFENSA EN EL MERCADO ERP, POR MODO DE IMPLEMENTACIÓN, 2018-2032 (MILES DE USD)
TABLA 47 NUBE/MULTINUBE EN EL MERCADO DE ERP DE ASIA-PACÍFICO, POR TIPO, 2018-2032 (MILES DE USD)
TABLA 48 OTROS PAÍSES DE ASIA-PACÍFICO EN EL MERCADO DE ERP, POR MODO DE IMPLEMENTACIÓN, 2018-2032 (MILES DE USD)
TABLA 49 NUBE/MULTINUBE EN EL MERCADO DE ERP DE ASIA-PACÍFICO, POR TIPO, 2018-2032 (MILES DE USD)
TABLA 50 MERCADO DE ERP DE ASIA-PACÍFICO, POR PAÍS, 2018-2032 (MILES DE USD)
TABLA 51 MERCADO DE ERP DE CHINA, POR OFERTA, 2018-2032 (MILES DE USD)
TABLA 52 SOLUCIÓN DE CHINA EN EL MERCADO DE ERP, POR TIPO, 2018-2032 (MILES DE USD)
TABLA 53 SERVICIOS DE CHINA EN EL MERCADO ERP, POR TIPO, 2018-2032 (MILES DE USD)
TABLA 54 SERVICIOS PROFESIONALES DE CHINA EN EL MERCADO ERP, POR TIPO, 2018-2032 (MILES DE USD)
TABLA 55 MERCADO DE ERP DE CHINA, POR MODO DE IMPLEMENTACIÓN, 2018-2032 (MILES DE USD)
TABLA 56 NUBE/MULTINUBE DE CHINA EN EL MERCADO ERP, POR TIPO, 2018-2032 (MILES DE USD)
TABLA 57 MERCADO DE ERP DE CHINA, POR TAMAÑO DE EMPRESA, 2018-2032 (MILES DE USD)
TABLA 58 MERCADO DE ERP PARA GRANDES EMPRESAS DE CHINA, POR MODO DE IMPLEMENTACIÓN, 2018-2032 (MILES DE USD)
TABLA 59 NUBE/MULTINUBE DE CHINA EN EL MERCADO ERP, POR TIPO, 2018-2032 (MILES DE USD)
TABLA 60 MERCADO DE ERP EN CHINA, POR PRECIOS, 2018-2032 (MILES DE USD)
TABLA 61 MERCADO DE ERP BASADO EN SUSCRIPCIÓN DE CHINA, POR TIPO, 2018-2032 (MILES DE USD)
TABLA 62 MERCADO DE ERP DE CHINA, POR USUARIO FINAL, 2018-2032 (MILES DE USD)
TABLA 63 MERCADO DE ERP DE FABRICACIÓN EN CHINA, POR APLICACIÓN, 2018-2032 (MILES DE USD)
TABLA 64 FABRICACIÓN DE CHINA EN EL MERCADO DE ERP, POR MODO DE IMPLEMENTACIÓN, 2018-2032 (MILES DE USD)
TABLA 65 NUBE/MULTINUBE DE CHINA EN EL MERCADO ERP, POR TIPO, 2018-2032 (MILES DE USD)
TABLA 66 MERCADO DE ERP MINORISTA EN CHINA, POR APLICACIÓN, 2018-2032 (MILES DE USD)
TABLA 67 VENTAS MINORISTAS EN EL MERCADO ERP DE CHINA, POR MODO DE IMPLEMENTACIÓN, 2018-2032 (MILES DE USD)
TABLA 68 NUBE/MULTINUBE DE CHINA EN EL MERCADO ERP, POR TIPO, 2018-2032 (MILES DE USD)
TABLA 69 MERCADO DE ERP BFSI DE CHINA, POR APLICACIÓN, 2018-2032 (MILES DE USD)
TABLA 70 BFSI DE CHINA EN EL MERCADO DE ERP, POR MODO DE IMPLEMENTACIÓN, 2018-2032 (MILES DE USD)
TABLA 71 NUBE/MULTINUBE DE CHINA EN EL MERCADO ERP, POR TIPO, 2018-2032 (MILES DE USD)
TABLA 72 MERCADO DE ERP DE ATENCIÓN MÉDICA EN CHINA, POR APLICACIÓN, 2018-2032 (MILES DE USD)
TABLA 73 ATENCIÓN MÉDICA EN CHINA EN EL MERCADO ERP, POR MODO DE IMPLEMENTACIÓN, 2018-2032 (MILES DE USD)
TABLA 74 NUBE/MULTINUBE DE CHINA EN EL MERCADO ERP, POR TIPO, 2018-2032 (MILES DE USD)
TABLA 75 MERCADO DE ERP DE TI Y TELECOMUNICACIONES DE CHINA, POR APLICACIÓN, 2018-2032 (MILES DE USD)
TABLA 76 TI Y TELECOMUNICACIONES EN EL MERCADO ERP DE CHINA, POR MODO DE IMPLEMENTACIÓN, 2018-2032 (MILES DE USD)
TABLA 77 NUBE/MULTINUBE DE CHINA EN EL MERCADO ERP, POR TIPO, 2018-2032 (MILES DE USD)
TABLA 78 MERCADO DE ERP DEL GOBIERNO DE CHINA, POR APLICACIÓN, 2018-2032 (MILES DE USD)
TABLA 79 PARTICIPACIÓN DEL GOBIERNO DE CHINA EN EL MERCADO DE ERP, POR MODO DE IMPLEMENTACIÓN, 2018-2032 (MILES DE USD)
TABLA 80 NUBE/MULTINUBE DE CHINA EN EL MERCADO ERP, POR TIPO, 2018-2032 (MILES DE USD)
TABLA 81 MERCADO DE ERP DE ENERGÍA Y SERVICIOS PÚBLICOS DE CHINA, POR APLICACIÓN, 2018-2032 (MILES DE USD)
TABLA 82 ENERGÍA Y SERVICIOS PÚBLICOS DE CHINA EN EL MERCADO DE ERP, POR MODO DE IMPLEMENTACIÓN, 2018-2032 (MILES DE USD)
TABLA 83 NUBE/MULTINUBE DE CHINA EN EL MERCADO ERP, POR TIPO, 2018-2032 (MILES DE USD)
TABLA 84 MERCADO DE ERP LOGÍSTICO DE CHINA, POR APLICACIÓN, 2018-2032 (MILES DE USD)
TABLA 85 LOGÍSTICA DE CHINA EN EL MERCADO ERP, POR MODO DE IMPLEMENTACIÓN, 2018-2032 (MILES DE USD)
TABLA 86 NUBE/MULTINUBE DE CHINA EN EL MERCADO ERP, POR TIPO, 2018-2032 (MILES DE USD)
TABLA 87 MERCADO DE ERP EDUCATIVO DE CHINA, POR APLICACIÓN, 2018-2032 (MILES DE USD)
TABLA 88 EDUCACIÓN EN EL MERCADO ERP DE CHINA, POR MODO DE IMPLEMENTACIÓN, 2018-2032 (MILES DE USD)
TABLA 89 NUBE/MULTINUBE DE CHINA EN EL MERCADO ERP, POR TIPO, 2018-2032 (MILES DE USD)
TABLA 90 MERCADO DE ERP DE LA AEROESPACIAL Y DEFENSA DE CHINA, POR APLICACIÓN, 2018-2032 (MILES DE USD)
TABLA 91 INDUSTRIA AEROESPACIAL Y DEFENSIVA DE CHINA EN EL MERCADO ERP, POR MODO DE IMPLEMENTACIÓN, 2018-2032 (MILES DE USD)
TABLA 92 NUBE/MULTINUBE DE CHINA EN EL MERCADO ERP, POR TIPO, 2018-2032 (MILES DE USD)
TABLA 93 OTROS DE CHINA EN EL MERCADO DE ERP, POR MODO DE IMPLEMENTACIÓN, 2018-2032 (MILES DE USD)
TABLA 94 NUBE/MULTINUBE DE CHINA EN EL MERCADO ERP, POR TIPO, 2018-2032 (MILES DE USD)
TABLA 95 MERCADO DE ERP DE JAPÓN, POR OFERTA, 2018-2032 (MILES DE USD)
TABLA 96 SOLUCIÓN DE JAPÓN EN EL MERCADO DE ERP, POR TIPO, 2018-2032 (MILES DE USD)
TABLA 97 SERVICIOS DE JAPÓN EN EL MERCADO ERP, POR TIPO, 2018-2032 (MILES DE USD)
TABLA 98 SERVICIOS PROFESIONALES EN EL MERCADO ERP DE JAPÓN, POR TIPO, 2018-2032 (MILES DE USD)
TABLA 99 MERCADO DE ERP DE JAPÓN, POR MODO DE IMPLEMENTACIÓN, 2018-2032 (MILES DE USD)
TABLA 100 NUBE/MULTINUBE EN EL MERCADO ERP DE JAPÓN, POR TIPO, 2018-2032 (MILES DE USD)
TABLA 101 MERCADO DE ERP EN JAPÓN, POR TAMAÑO DE EMPRESA, 2018-2032 (MILES DE USD)
TABLA 102 MERCADO DE ERP PARA GRANDES EMPRESAS DE JAPÓN, POR MODO DE IMPLEMENTACIÓN, 2018-2032 (MILES DE USD)
TABLA 103 NUBE/MULTINUBE EN EL MERCADO ERP DE JAPÓN, POR TIPO, 2018-2032 (MILES DE USD)
TABLA 104 MERCADO DE ERP EN JAPÓN, POR PRECIOS, 2018-2032 (MILES DE USD)
TABLA 105 MERCADO DE ERP BASADO EN SUSCRIPCIÓN EN JAPÓN, POR TIPO, 2018-2032 (MILES DE USD)
TABLA 106 MERCADO DE ERP DE JAPÓN, POR USUARIO FINAL, 2018-2032 (MILES DE USD)
TABLA 107 MERCADO DE ERP DE MANUFACTURA EN JAPÓN, POR APLICACIÓN, 2018-2032 (MILES DE USD)
TABLA 108 FABRICACIÓN JAPONESA EN EL MERCADO DE ERP, POR MODO DE IMPLEMENTACIÓN, 2018-2032 (MILES DE USD)
TABLA 109 NUBE/MULTINUBE EN EL MERCADO ERP DE JAPÓN, POR TIPO, 2018-2032 (MILES DE USD)
TABLA 110 MERCADO DE ERP MINORISTA EN JAPÓN, POR APLICACIÓN, 2018-2032 (MILES DE USD)
TABLA 111 VENTAS MINORISTAS EN EL MERCADO ERP DE JAPÓN, POR MODO DE IMPLEMENTACIÓN, 2018-2032 (MILES DE USD)
TABLA 112 NUBE/MULTINUBE EN EL MERCADO ERP DE JAPÓN, POR TIPO, 2018-2032 (MILES DE USD)
TABLA 113 MERCADO DE ERP BFSI DE JAPÓN, POR APLICACIÓN, 2018-2032 (MILES DE USD)
TABLA 114 BFSI DE JAPÓN EN EL MERCADO DE ERP, POR MODO DE IMPLEMENTACIÓN, 2018-2032 (MILES DE USD)
TABLA 115 NUBE/MULTINUBE EN EL MERCADO ERP DE JAPÓN, POR TIPO, 2018-2032 (MILES DE USD)
TABLA 116 MERCADO DE ERP DE ATENCIÓN MÉDICA EN JAPÓN, POR APLICACIÓN, 2018-2032 (MILES DE USD)
TABLA 117 MERCADO DE ATENCIÓN MÉDICA EN ERP DE JAPÓN, POR MODO DE IMPLEMENTACIÓN, 2018-2032 (MILES DE USD)
TABLA 118 NUBE/MULTINUBE EN EL MERCADO ERP DE JAPÓN, POR TIPO, 2018-2032 (MILES DE USD)
TABLA 119 MERCADO DE ERP DE TI Y TELECOMUNICACIONES DE JAPÓN, POR APLICACIÓN, 2018-2032 (MILES DE USD)
TABLA 120 TI Y TELECOMUNICACIONES EN EL MERCADO ERP DE JAPÓN, POR MODO DE IMPLEMENTACIÓN, 2018-2032 (MILES DE USD)
TABLA 121 NUBE/MULTINUBE EN EL MERCADO ERP DE JAPÓN, POR TIPO, 2018-2032 (MILES DE USD)
TABLA 122 MERCADO DE ERP DEL GOBIERNO DE JAPÓN, POR APLICACIÓN, 2018-2032 (MILES DE USD)
TABLA 123 GOBIERNO DE JAPÓN EN EL MERCADO DE ERP, POR MODO DE IMPLEMENTACIÓN, 2018-2032 (MILES DE USD)
TABLA 124 NUBE/MULTINUBE EN EL MERCADO ERP DE JAPÓN, POR TIPO, 2018-2032 (MILES DE USD)
TABLA 125 MERCADO DE ERP DE ENERGÍA Y SERVICIOS PÚBLICOS DE JAPÓN, POR APLICACIÓN, 2018-2032 (MILES DE USD)
TABLA 126 ENERGÍA Y SERVICIOS PÚBLICOS DE JAPÓN EN EL MERCADO DE ERP, POR MODO DE IMPLEMENTACIÓN, 2018-2032 (MILES DE USD)
TABLA 127 NUBE/MULTINUBE EN EL MERCADO ERP DE JAPÓN, POR TIPO, 2018-2032 (MILES DE USD)
TABLA 128 MERCADO DE ERP LOGÍSTICO DE JAPÓN, POR APLICACIÓN, 2018-2032 (MILES DE USD)
TABLA 129 LOGÍSTICA EN EL MERCADO ERP DE JAPÓN, POR MODO DE IMPLEMENTACIÓN, 2018-2032 (MILES DE USD)
TABLA 130 NUBE/MULTINUBE EN EL MERCADO ERP DE JAPÓN, POR TIPO, 2018-2032 (MILES DE USD)
TABLA 131 MERCADO DE ERP EDUCATIVO DE JAPÓN, POR APLICACIÓN, 2018-2032 (MILES DE USD)
TABLA 132 EDUCACIÓN EN EL MERCADO DE ERP EN JAPÓN, POR MODO DE IMPLEMENTACIÓN, 2018-2032 (MILES DE USD)
TABLA 133 NUBE/MULTINUBE EN EL MERCADO ERP DE JAPÓN, POR TIPO, 2018-2032 (MILES DE USD)
TABLA 134 MERCADO DE ERP DE LA INDUSTRIA AEROESPACIAL Y DE DEFENSA DE JAPÓN, POR APLICACIÓN, 2018-2032 (MILES DE USD)
TABLA 135 JAPÓN AEROESPACIAL Y DEFENSA EN EL MERCADO ERP, POR MODO DE IMPLEMENTACIÓN, 2018-2032 (MILES DE USD)
TABLA 136 NUBE/MULTINUBE EN EL MERCADO ERP DE JAPÓN, POR TIPO, 2018-2032 (MILES DE USD)
TABLA 137 JAPÓN OTROS EN EL MERCADO DE ERP, POR MODO DE IMPLEMENTACIÓN, 2018-2032 (MILES DE USD)
TABLA 138 NUBE/MULTINUBE EN EL MERCADO ERP DE JAPÓN, POR TIPO, 2018-2032 (MILES DE USD)
TABLA 139 MERCADO DE ERP DE INDIA, POR OFERTA, 2018-2032 (MILES DE USD)
TABLA 140 SOLUCIONES EN EL MERCADO DE ERP DE INDIA, POR TIPO, 2018-2032 (MILES DE USD)
TABLA 141 SERVICIOS EN EL MERCADO ERP DE INDIA, POR TIPO, 2018-2032 (MILES DE USD)
TABLA 142 SERVICIOS PROFESIONALES EN EL MERCADO DE ERP DE LA INDIA, POR TIPO, 2018-2032 (MILES DE USD)
TABLA 143 MERCADO DE ERP EN INDIA, POR MODO DE IMPLEMENTACIÓN, 2018-2032 (MILES DE USD)
TABLA 144 NUBE/MULTINUBE EN EL MERCADO ERP DE INDIA, POR TIPO, 2018-2032 (MILES DE USD)
TABLA 145 MERCADO DE ERP EN INDIA, POR TAMAÑO DE EMPRESA, 2018-2032 (MILES DE USD)
TABLA 146 MERCADO DE ERP PARA GRANDES EMPRESAS DE LA INDIA, POR MODO DE IMPLEMENTACIÓN, 2018-2032 (MILES DE USD)
TABLA 147 NUBE/MULTINUBE EN EL MERCADO ERP DE INDIA, POR TIPO, 2018-2032 (MILES DE USD)
TABLA 148 MERCADO DE ERP EN INDIA, POR PRECIOS, 2018-2032 (MILES DE USD)
TABLA 149 MERCADO DE ERP BASADO EN SUSCRIPCIÓN DE INDIA, POR TIPO, 2018-2032 (MILES DE USD)
TABLA 150 MERCADO DE ERP EN INDIA, POR USUARIO FINAL, 2018-2032 (MILES DE USD)
TABLA 151 MERCADO DE ERP DE FABRICACIÓN EN INDIA, POR APLICACIÓN, 2018-2032 (MILES DE USD)
TABLA 152 INDIA FABRICACIÓN EN EL MERCADO DE ERP, POR MODO DE IMPLEMENTACIÓN, 2018-2032 (MILES DE USD)
TABLA 153 NUBE/MULTINUBE EN EL MERCADO ERP DE INDIA, POR TIPO, 2018-2032 (MILES DE USD)
TABLA 154 MERCADO DE ERP MINORISTA EN INDIA, POR APLICACIÓN, 2018-2032 (MILES DE USD)
TABLA 155 VENTAS MINORISTAS EN EL MERCADO ERP DE INDIA, POR MODO DE IMPLEMENTACIÓN, 2018-2032 (MILES DE USD)
TABLA 156 NUBE/MULTINUBE EN EL MERCADO ERP DE INDIA, POR TIPO, 2018-2032 (MILES DE USD)
TABLA 157 MERCADO DE ERP BFSI DE INDIA, POR APLICACIÓN, 2018-2032 (MILES DE USD)
TABLA 158 INDIA BFSI EN EL MERCADO ERP, POR MODO DE IMPLEMENTACIÓN, 2018-2032 (MILES DE USD)
TABLA 159 NUBE/MULTINUBE EN EL MERCADO ERP DE INDIA, POR TIPO, 2018-2032 (MILES DE USD)
TABLA 160 MERCADO DE ERP DE ATENCIÓN MÉDICA EN INDIA, POR APLICACIÓN, 2018-2032 (MILES DE USD)
TABLA 161 INDIA: MERCADO DE ATENCIÓN MÉDICA EN ERP, POR MODO DE IMPLEMENTACIÓN, 2018-2032 (MILES DE USD)
TABLA 162 NUBE/MULTINUBE EN EL MERCADO ERP DE INDIA, POR TIPO, 2018-2032 (MILES DE USD)
TABLA 163 MERCADO DE ERP DE TI Y TELECOMUNICACIONES DE LA INDIA, POR APLICACIÓN, 2018-2032 (MILES DE USD)
TABLA 164 TI Y TELECOMUNICACIONES EN EL MERCADO ERP DE INDIA, POR MODO DE IMPLEMENTACIÓN, 2018-2032 (MILES DE USD)
TABLA 165 NUBE/MULTINUBE EN EL MERCADO ERP DE INDIA, POR TIPO, 2018-2032 (MILES DE USD)
TABLA 166 MERCADO DE ERP DEL GOBIERNO DE LA INDIA, POR APLICACIÓN, 2018-2032 (MILES DE USD)
TABLA 167 GOBIERNO DE LA INDIA EN EL MERCADO DE ERP, POR MODO DE IMPLEMENTACIÓN, 2018-2032 (MILES DE USD)
TABLA 168 NUBE/MULTINUBE EN EL MERCADO ERP DE INDIA, POR TIPO, 2018-2032 (MILES DE USD)
TABLA 169 MERCADO DE ERP DE ENERGÍA Y SERVICIOS PÚBLICOS DE LA INDIA, POR APLICACIÓN, 2018-2032 (MILES DE USD)
TABLA 170 ENERGÍA Y SERVICIOS PÚBLICOS DE LA INDIA EN EL MERCADO DE ERP, POR MODO DE IMPLEMENTACIÓN, 2018-2032 (MILES DE USD)
TABLA 171 NUBE/MULTINUBE EN EL MERCADO ERP DE INDIA, POR TIPO, 2018-2032 (MILES DE USD)
TABLA 172 MERCADO DE ERP LOGÍSTICO DE INDIA, POR APLICACIÓN, 2018-2032 (MILES DE USD)
TABLA 173 LOGÍSTICA EN EL MERCADO DE ERP DE INDIA, POR MODO DE IMPLEMENTACIÓN, 2018-2032 (MILES DE USD)
TABLA 174 NUBE/MULTINUBE EN EL MERCADO ERP DE INDIA, POR TIPO, 2018-2032 (MILES DE USD)
TABLA 175 MERCADO DE ERP EDUCATIVO DE LA INDIA, POR APLICACIÓN, 2018-2032 (MILES DE USD)
TABLA 176 EDUCACIÓN EN EL MERCADO DE ERP EN INDIA, POR MODO DE IMPLEMENTACIÓN, 2018-2032 (MILES DE USD)
TABLA 177 NUBE/MULTINUBE EN EL MERCADO ERP DE INDIA, POR TIPO, 2018-2032 (MILES DE USD)
TABLA 178 MERCADO DE ERP AEROESPACIAL Y DE DEFENSA DE LA INDIA, POR APLICACIÓN, 2018-2032 (MILES DE USD)
TABLA 179 INDIA AEROESPACIAL Y DEFENSA EN EL MERCADO DE ERP, POR MODO DE IMPLEMENTACIÓN, 2018-2032 (MILES DE USD)
TABLA 180 NUBE/MULTINUBE EN EL MERCADO ERP DE INDIA, POR TIPO, 2018-2032 (MILES DE USD)
TABLA 181 INDIA OTROS EN EL MERCADO DE ERP, POR MODO DE IMPLEMENTACIÓN, 2018-2032 (MILES DE USD)
TABLA 182 NUBE/MULTINUBE EN EL MERCADO ERP DE INDIA, POR TIPO, 2018-2032 (MILES DE USD)
TABLA 183 MERCADO DE ERP DE COREA DEL SUR, POR OFERTA, 2018-2032 (MILES DE USD)
TABLA 184 SOLUCIÓN DE COREA DEL SUR EN EL MERCADO DE ERP, POR TIPO, 2018-2032 (MILES DE USD)
TABLA 185 SERVICIOS DE COREA DEL SUR EN EL MERCADO ERP, POR TIPO, 2018-2032 (MILES DE USD)
TABLA 186 SERVICIOS PROFESIONALES DE COREA DEL SUR EN EL MERCADO DE ERP, POR TIPO, 2018-2032 (MILES DE USD)
TABLA 187 MERCADO DE ERP DE COREA DEL SUR, POR MODO DE IMPLEMENTACIÓN, 2018-2032 (MILES DE USD)
TABLA 188 COREA DEL SUR NUBE/MULTI NUBE EN EL MERCADO ERP, POR TIPO, 2018-2032 (MILES DE USD)
TABLA 189 MERCADO DE ERP DE COREA DEL SUR, POR TAMAÑO DE EMPRESA, 2018-2032 (MILES DE USD)
TABLA 190 MERCADO DE ERP PARA GRANDES EMPRESAS DE COREA DEL SUR, POR MODO DE IMPLEMENTACIÓN, 2018-2032 (MILES DE USD)
TABLA 191 COREA DEL SUR NUBE/MULTI NUBE EN EL MERCADO ERP, POR TIPO, 2018-2032 (MILES DE USD)
TABLA 192 MERCADO DE ERP DE COREA DEL SUR, POR PRECIOS, 2018-2032 (MILES DE USD)
TABLA 193 MERCADO DE ERP BASADO EN SUSCRIPCIÓN DE COREA DEL SUR, POR TIPO, 2018-2032 (MILES DE USD)
TABLA 194 MERCADO DE ERP DE COREA DEL SUR, POR USUARIO FINAL, 2018-2032 (MILES DE USD)
TABLA 195 MERCADO DE ERP DE MANUFACTURA DE COREA DEL SUR, POR APLICACIÓN, 2018-2032 (MILES DE USD)
TABLA 196 FABRICACIÓN DE COREA DEL SUR EN EL MERCADO DE ERP, POR MODO DE IMPLEMENTACIÓN, 2018-2032 (MILES DE USD)
TABLA 197 COREA DEL SUR NUBE/MULTI NUBE EN EL MERCADO ERP, POR TIPO, 2018-2032 (MILES DE USD)
TABLA 198 MERCADO DE ERP MINORISTA DE COREA DEL SUR, POR APLICACIÓN, 2018-2032 (MILES DE USD)
TABLA 199 VENTAS MINORISTAS EN EL MERCADO ERP DE COREA DEL SUR, POR MODO DE IMPLEMENTACIÓN, 2018-2032 (MILES DE USD)
TABLA 200 COREA DEL SUR NUBE/MULTINUBE EN EL MERCADO ERP, POR TIPO, 2018-2032 (MILES DE USD)
TABLA 201 MERCADO DE ERP BFSI DE COREA DEL SUR, POR APLICACIÓN, 2018-2032 (MILES DE USD)
TABLA 202 BFSI DE COREA DEL SUR EN EL MERCADO DE ERP, POR MODO DE IMPLEMENTACIÓN, 2018-2032 (MILES DE USD)
TABLA 203 COREA DEL SUR NUBE/MULTINUBE EN EL MERCADO ERP, POR TIPO, 2018-2032 (MILES DE USD)
TABLA 204 MERCADO DE ERP DE ATENCIÓN MÉDICA DE COREA DEL SUR, POR APLICACIÓN, 2018-2032 (MILES DE USD)
TABLA 205 MERCADO DE ATENCIÓN MÉDICA EN ERP DE COREA DEL SUR, POR MODO DE IMPLEMENTACIÓN, 2018-2032 (MILES DE USD)
TABLA 206 COREA DEL SUR NUBE/MULTINUBE EN EL MERCADO ERP, POR TIPO, 2018-2032 (MILES DE USD)
TABLA 207 MERCADO DE ERP DE TI Y TELECOMUNICACIONES DE COREA DEL SUR, POR APLICACIÓN, 2018-2032 (MILES DE USD)
TABLA 208 MERCADO DE TI Y TELECOMUNICACIONES EN ERP DE COREA DEL SUR, POR MODO DE IMPLEMENTACIÓN, 2018-2032 (MILES DE USD)
TABLA 209 COREA DEL SUR NUBE/MULTI NUBE EN EL MERCADO ERP, POR TIPO, 2018-2032 (MILES DE USD)
TABLA 210 MERCADO DE ERP DEL GOBIERNO DE COREA DEL SUR, POR APLICACIÓN, 2018-2032 (MILES DE USD)
TABLA 211 GOBIERNO DE COREA DEL SUR EN EL MERCADO DE ERP, POR MODO DE IMPLEMENTACIÓN, 2018-2032 (MILES DE USD)
TABLA 212 COREA DEL SUR NUBE/MULTI NUBE EN EL MERCADO ERP, POR TIPO, 2018-2032 (MILES DE USD)
TABLA 213 MERCADO DE ERP DE ENERGÍA Y SERVICIOS PÚBLICOS DE COREA DEL SUR, POR APLICACIÓN, 2018-2032 (MILES DE USD)
TABLA 214 ENERGÍA Y SERVICIOS PÚBLICOS DE COREA DEL SUR EN EL MERCADO DE ERP, POR MODO DE IMPLEMENTACIÓN, 2018-2032 (MILES DE USD)
TABLA 215 COREA DEL SUR NUBE/MULTI NUBE EN EL MERCADO ERP, POR TIPO, 2018-2032 (MILES DE USD)
TABLA 216 MERCADO DE ERP LOGÍSTICO DE COREA DEL SUR, POR APLICACIÓN, 2018-2032 (MILES DE USD)
TABLA 217 LOGÍSTICA DE COREA DEL SUR EN EL MERCADO ERP, POR MODO DE IMPLEMENTACIÓN, 2018-2032 (MILES DE USD)
TABLA 218 COREA DEL SUR NUBE/MULTI NUBE EN EL MERCADO ERP, POR TIPO, 2018-2032 (MILES DE USD)
TABLA 219 MERCADO DE ERP EDUCATIVO DE COREA DEL SUR, POR APLICACIÓN, 2018-2032 (MILES DE USD)
TABLA 220 MERCADO DE EDUCACIÓN EN ERP DE COREA DEL SUR, POR MODO DE IMPLEMENTACIÓN, 2018-2032 (MILES DE USD)
TABLA 221 COREA DEL SUR NUBE/MULTI NUBE EN EL MERCADO ERP, POR TIPO, 2018-2032 (MILES DE USD)
TABLA 222 MERCADO DE ERP AEROESPACIAL Y DE DEFENSA DE COREA DEL SUR, POR APLICACIÓN, 2018-2032 (MILES DE USD)
TABLA 223 MERCADO DE AEROESPACIAL Y DEFENSA DE COREA DEL SUR EN ERP, POR MODO DE IMPLEMENTACIÓN, 2018-2032 (MILES DE USD)
TABLA 224 COREA DEL SUR NUBE/MULTI NUBE EN EL MERCADO ERP, POR TIPO, 2018-2032 (MILES DE USD)
TABLA 225 COREA DEL SUR OTROS EN EL MERCADO DE ERP, POR MODO DE IMPLEMENTACIÓN, 2018-2032 (MILES DE USD)
TABLA 226 COREA DEL SUR NUBE/MULTI NUBE EN EL MERCADO ERP, POR TIPO, 2018-2032 (MILES DE USD)
TABLA 227 MERCADO DE ERP DE AUSTRALIA, POR OFERTA, 2018-2032 (MILES DE USD)
TABLA 228 SOLUCIÓN DE AUSTRALIA EN EL MERCADO ERP, POR TIPO, 2018-2032 (MILES DE USD)
TABLE 229 AUSTRALIA SERVICES IN ERP MARKET, BY TYPE, 2018-2032 (USD THOUSAND)
TABLE 230 AUSTRALIA PROFESSIONAL SERVICES IN ERP MARKET, BY TYPE, 2018-2032 (USD THOUSAND)
TABLE 231 AUSTRALIA ERP MARKET, BY DEPLOYMENT MODE, 2018-2032 (USD THOUSAND)
TABLE 232 AUSTRALIA CLOUD/MULTI CLOUD IN ERP MARKET, BY TYPE, 2018-2032 (USD THOUSAND)
TABLE 233 AUSTRALIA ERP MARKET, BY ENTERPRISE SIZE, 2018-2032 (USD THOUSAND)
TABLE 234 AUSTRALIA LARGE ENTERPRISE ERP MARKET, BY DEPLOYMENT MODE, 2018-2032 (USD THOUSAND)
TABLE 235 AUSTRALIA CLOUD/MULTI CLOUD IN ERP MARKET, BY TYPE, 2018-2032 (USD THOUSAND)
TABLE 236 AUSTRALIA ERP MARKET, BY PRICING, 2018-2032 (USD THOUSAND)
TABLE 237 AUSTRALIA SUBSCRIPTION-BASED IN ERP MARKET, BY TYPE, 2018-2032 (USD THOUSAND)
TABLE 238 AUSTRALIA ERP MARKET, BY END USER, 2018-2032 (USD THOUSAND)
TABLE 239 AUSTRALIA MANUFACTURING ERP MARKET, BY APPLICATION, 2018-2032 (USD THOUSAND)
TABLE 240 AUSTRALIA MANUFACTURING IN ERP MARKET, BY DEPLOYMENT MODE, 2018-2032 (USD THOUSAND)
TABLE 241 AUSTRALIA CLOUD/MULTI CLOUD IN ERP MARKET, BY TYPE, 2018-2032 (USD THOUSAND)
TABLE 242 AUSTRALIA RETAIL ERP MARKET, BY APPLICATION, 2018-2032 (USD THOUSAND)
TABLE 243 AUSTRALIA RETAIL IN ERP MARKET, BY DEPLOYMENT MODE, 2018-2032 (USD THOUSAND)
TABLE 244 AUSTRALIA CLOUD/MULTI CLOUD IN ERP MARKET, BY TYPE, 2018-2032 (USD THOUSAND)
TABLE 245 AUSTRALIA BFSI ERP MARKET, BY APPLICATION, 2018-2032 (USD THOUSAND)
TABLE 246 AUSTRALIA BFSI IN ERP MARKET, BY DEPLOYMENT MODE, 2018-2032 (USD THOUSAND)
TABLE 247 AUSTRALIA CLOUD/MULTI CLOUD IN ERP MARKET, BY TYPE, 2018-2032 (USD THOUSAND)
TABLE 248 AUSTRALIA HEALTHCARE ERP MARKET, BY APPLICATION, 2018-2032 (USD THOUSAND)
TABLE 249 AUSTRALIA HEALTHCARE IN ERP MARKET, BY DEPLOYMENT MODE, 2018-2032 (USD THOUSAND)
TABLE 250 AUSTRALIA CLOUD/MULTI CLOUD IN ERP MARKET, BY TYPE, 2018-2032 (USD THOUSAND)
TABLE 251 AUSTRALIA IT & TELECOMMUNICATIONS ERP MARKET, BY APPLICATION, 2018-2032 (USD THOUSAND)
TABLE 252 AUSTRALIA IT & TELECOMMUNICATIONS IN ERP MARKET, BY DEPLOYMENT MODE, 2018-2032 (USD THOUSAND)
TABLE 253 AUSTRALIA CLOUD/MULTI CLOUD IN ERP MARKET, BY TYPE, 2018-2032 (USD THOUSAND)
TABLE 254 AUSTRALIA GOVERNMENT ERP MARKET, BY APPLICATION, 2018-2032 (USD THOUSAND)
TABLE 255 AUSTRALIA GOVERNMENT IN ERP MARKET, BY DEPLOYMENT MODE, 2018-2032 (USD THOUSAND)
TABLE 256 AUSTRALIA CLOUD/MULTI CLOUD IN ERP MARKET, BY TYPE, 2018-2032 (USD THOUSAND)
TABLE 257 AUSTRALIA ENERGY & UTILITIES ERP MARKET, BY APPLICATION, 2018-2032 (USD THOUSAND)
TABLE 258 AUSTRALIA ENERGY & UTILITIES IN ERP MARKET, BY DEPLOYMENT MODE, 2018-2032 (USD THOUSAND)
TABLE 259 AUSTRALIA CLOUD/MULTI CLOUD IN ERP MARKET, BY TYPE, 2018-2032 (USD THOUSAND)
TABLE 260 AUSTRALIA LOGISTICS ERP MARKET, BY APPLICATION, 2018-2032 (USD THOUSAND)
TABLE 261 AUSTRALIA LOGISTICS IN ERP MARKET, BY DEPLOYMENT MODE, 2018-2032 (USD THOUSAND)
TABLE 262 AUSTRALIA CLOUD/MULTI CLOUD IN ERP MARKET, BY TYPE, 2018-2032 (USD THOUSAND)
TABLA 263 MERCADO DE ERP EDUCATIVO DE AUSTRALIA, POR APLICACIÓN, 2018-2032 (MILES DE USD)
TABLA 264 AUSTRALIA EDUCACIÓN EN EL MERCADO DE ERP, POR MODO DE IMPLEMENTACIÓN, 2018-2032 (MILES DE USD)
TABLA 265 AUSTRALIA NUBE/MULTI NUBE EN EL MERCADO ERP, POR TIPO, 2018-2032 (MILES DE USD)
TABLA 266 MERCADO DE ERP AEROESPACIAL Y DE DEFENSA DE AUSTRALIA, POR APLICACIÓN, 2018-2032 (MILES DE USD)
TABLA 267 AUSTRALIA AEROESPACIAL Y DEFENSA EN EL MERCADO DE ERP, POR MODO DE IMPLEMENTACIÓN, 2018-2032 (MILES DE USD)
TABLA 268 AUSTRALIA NUBE/MULTI NUBE EN EL MERCADO ERP, POR TIPO, 2018-2032 (MILES DE USD)
TABLA 269 AUSTRALIA OTROS EN EL MERCADO DE ERP, POR MODO DE IMPLEMENTACIÓN, 2018-2032 (MILES DE USD)
TABLA 270 AUSTRALIA NUBE/MULTI NUBE EN EL MERCADO ERP, POR TIPO, 2018-2032 (MILES DE USD)
TABLA 271 MERCADO DE ERP DE INDONESIA, POR OFERTA, 2018-2032 (MILES DE USD)
TABLA 272 SOLUCIÓN DE INDONESIA EN EL MERCADO DE ERP, POR TIPO, 2018-2032 (MILES DE USD)
TABLA 273 SERVICIOS DE INDONESIA EN EL MERCADO ERP, POR TIPO, 2018-2032 (MILES DE USD)
TABLA 274 SERVICIOS PROFESIONALES EN EL MERCADO ERP DE INDONESIA, POR TIPO, 2018-2032 (MILES DE USD)
TABLA 275 MERCADO DE ERP DE INDONESIA, POR MODO DE IMPLEMENTACIÓN, 2018-2032 (MILES DE USD)
TABLA 276 NUBE/MULTINUBE EN EL MERCADO ERP DE INDONESIA, POR TIPO, 2018-2032 (MILES DE USD)
TABLA 277 MERCADO DE ERP DE INDONESIA, POR TAMAÑO DE EMPRESA, 2018-2032 (MILES DE USD)
TABLA 278 MERCADO DE ERP PARA GRANDES EMPRESAS DE INDONESIA, POR MODO DE IMPLEMENTACIÓN, 2018-2032 (MILES DE USD)
TABLA 279 NUBE/MULTINUBE EN EL MERCADO ERP DE INDONESIA, POR TIPO, 2018-2032 (MILES DE USD)
TABLA 280 MERCADO DE ERP DE INDONESIA, POR PRECIOS, 2018-2032 (MILES DE USD)
TABLA 281 MERCADO DE ERP BASADO EN SUSCRIPCIÓN DE INDONESIA, POR TIPO, 2018-2032 (MILES DE USD)
TABLA 282 MERCADO DE ERP DE INDONESIA, POR USUARIO FINAL, 2018-2032 (MILES DE USD)
TABLA 283 MERCADO DE ERP DE MANUFACTURA DE INDONESIA, POR APLICACIÓN, 2018-2032 (MILES DE USD)
TABLA 284 INDONESIA: FABRICACIÓN EN EL MERCADO DE ERP, POR MODO DE IMPLEMENTACIÓN, 2018-2032 (MILES DE USD)
TABLA 285 NUBE/MULTINUBE EN EL MERCADO ERP DE INDONESIA, POR TIPO, 2018-2032 (MILES DE USD)
TABLA 286 MERCADO DE ERP MINORISTA DE INDONESIA, POR APLICACIÓN, 2018-2032 (MILES DE USD)
TABLA 287 VENTAS MINORISTAS EN EL MERCADO DE ERP DE INDONESIA, POR MODO DE IMPLEMENTACIÓN, 2018-2032 (MILES DE USD)
TABLA 288 NUBE/MULTINUBE EN EL MERCADO ERP DE INDONESIA, POR TIPO, 2018-2032 (MILES DE USD)
TABLA 289 MERCADO DE ERP BFSI DE INDONESIA, POR APLICACIÓN, 2018-2032 (MILES DE USD)
TABLA 290 INDONESIA BFSI EN EL MERCADO ERP, POR MODO DE IMPLEMENTACIÓN, 2018-2032 (MILES DE USD)
TABLA 291 NUBE/MULTINUBE EN EL MERCADO ERP DE INDONESIA, POR TIPO, 2018-2032 (MILES DE USD)
TABLA 292 MERCADO DE ERP DE ATENCIÓN MÉDICA DE INDONESIA, POR APLICACIÓN, 2018-2032 (MILES DE USD)
TABLA 293 MERCADO DE ATENCIÓN MÉDICA EN ERP DE INDONESIA, POR MODO DE IMPLEMENTACIÓN, 2018-2032 (MILES DE USD)
TABLA 294 NUBE/MULTINUBE EN EL MERCADO ERP DE INDONESIA, POR TIPO, 2018-2032 (MILES DE USD)
TABLA 295 MERCADO DE ERP DE TI Y TELECOMUNICACIONES DE INDONESIA, POR APLICACIÓN, 2018-2032 (MILES DE USD)
TABLA 296 INDONESIA TI Y TELECOMUNICACIONES EN EL MERCADO ERP, POR MODO DE IMPLEMENTACIÓN, 2018-2032 (MILES DE USD)
TABLA 297 NUBE/MULTINUBE EN EL MERCADO ERP DE INDONESIA, POR TIPO, 2018-2032 (MILES DE USD)
TABLA 298 MERCADO DE ERP DEL GOBIERNO DE INDONESIA, POR APLICACIÓN, 2018-2032 (MILES DE USD)
TABLA 299 GOBIERNO DE INDONESIA EN EL MERCADO DE ERP, POR MODO DE IMPLEMENTACIÓN, 2018-2032 (MILES DE USD)
TABLA 300 NUBE/MULTINUBE EN EL MERCADO ERP DE INDONESIA, POR TIPO, 2018-2032 (MILES DE USD)
TABLA 301 MERCADO DE ERP DE ENERGÍA Y SERVICIOS PÚBLICOS DE INDONESIA, POR APLICACIÓN, 2018-2032 (MILES DE USD)
TABLA 302 ENERGÍA Y SERVICIOS PÚBLICOS DE INDONESIA EN EL MERCADO DE ERP, POR MODO DE IMPLEMENTACIÓN, 2018-2032 (MILES DE USD)
TABLA 303 NUBE/MULTINUBE EN EL MERCADO ERP DE INDONESIA, POR TIPO, 2018-2032 (MILES DE USD)
TABLA 304 MERCADO DE ERP LOGÍSTICO DE INDONESIA, POR APLICACIÓN, 2018-2032 (MILES DE USD)
TABLA 305 LOGÍSTICA EN EL MERCADO DE ERP DE INDONESIA, POR MODO DE IMPLEMENTACIÓN, 2018-2032 (MILES DE USD)
TABLA 306 NUBE/MULTINUBE EN EL MERCADO ERP DE INDONESIA, POR TIPO, 2018-2032 (MILES DE USD)
TABLA 307 MERCADO DE ERP EDUCATIVO DE INDONESIA, POR APLICACIÓN, 2018-2032 (MILES DE USD)
TABLA 308 EDUCACIÓN EN EL MERCADO DE ERP DE INDONESIA, POR MODO DE IMPLEMENTACIÓN, 2018-2032 (MILES DE USD)
TABLA 309 NUBE/MULTINUBE EN EL MERCADO ERP DE INDONESIA, POR TIPO, 2018-2032 (MILES DE USD)
TABLA 310 MERCADO DE ERP AEROESPACIAL Y DE DEFENSA DE INDONESIA, POR APLICACIÓN, 2018-2032 (MILES DE USD)
TABLA 311 INDONESIA AEROESPACIAL Y DEFENSA EN EL MERCADO DE ERP, POR MODO DE IMPLEMENTACIÓN, 2018-2032 (MILES DE USD)
TABLA 312 NUBE/MULTINUBE EN EL MERCADO ERP DE INDONESIA, POR TIPO, 2018-2032 (MILES DE USD)
TABLA 313 INDONESIA OTROS EN EL MERCADO DE ERP, POR MODO DE IMPLEMENTACIÓN, 2018-2032 (MILES DE USD)
TABLA 314 NUBE/MULTINUBE EN EL MERCADO ERP DE INDONESIA, POR TIPO, 2018-2032 (MILES DE USD)
TABLA 315 MERCADO DE ERP DE SINGAPUR, POR OFERTA, 2018-2032 (MILES DE USD)
TABLA 316 SOLUCIÓN DE SINGAPUR EN EL MERCADO ERP, POR TIPO, 2018-2032 (MILES DE USD)
TABLA 317 SERVICIOS DE SINGAPUR EN EL MERCADO ERP, POR TIPO, 2018-2032 (MILES DE USD)
TABLA 318 SERVICIOS PROFESIONALES DE SINGAPUR EN EL MERCADO ERP, POR TIPO, 2018-2032 (MILES DE USD)
TABLA 319 MERCADO DE ERP DE SINGAPUR, POR MODO DE IMPLEMENTACIÓN, 2018-2032 (MILES DE USD)
TABLA 320 NUBE/MULTINUBE DE SINGAPUR EN EL MERCADO ERP, POR TIPO, 2018-2032 (MILES DE USD)
TABLA 321 MERCADO DE ERP DE SINGAPUR, POR TAMAÑO DE EMPRESA, 2018-2032 (MILES DE USD)
TABLA 322 MERCADO DE ERP PARA GRANDES EMPRESAS DE SINGAPUR, POR MODO DE IMPLEMENTACIÓN, 2018-2032 (MILES DE USD)
TABLA 323 NUBE/MULTINUBE DE SINGAPUR EN EL MERCADO ERP, POR TIPO, 2018-2032 (MILES DE USD)
TABLA 324 MERCADO DE ERP DE SINGAPUR, POR PRECIOS, 2018-2032 (MILES DE USD)
TABLA 325 MERCADO DE ERP BASADO EN SUSCRIPCIÓN DE SINGAPUR, POR TIPO, 2018-2032 (MILES DE USD)
TABLA 326 MERCADO DE ERP DE SINGAPUR, POR USUARIO FINAL, 2018-2032 (MILES DE USD)
TABLA 327 MERCADO DE ERP DE MANUFACTURA DE SINGAPUR, POR APLICACIÓN, 2018-2032 (MILES DE USD)
TABLA 328 FABRICACIÓN DE SINGAPUR EN EL MERCADO DE ERP, POR MODO DE IMPLEMENTACIÓN, 2018-2032 (MILES DE USD)
TABLA 329 NUBE/MULTINUBE DE SINGAPUR EN EL MERCADO ERP, POR TIPO, 2018-2032 (MILES DE USD)
TABLA 330 MERCADO DE ERP MINORISTA DE SINGAPUR, POR APLICACIÓN, 2018-2032 (MILES DE USD)
TABLA 331 VENTAS MINORISTAS EN EL MERCADO ERP DE SINGAPUR, POR MODO DE IMPLEMENTACIÓN, 2018-2032 (MILES DE USD)
TABLA 332 NUBE/MULTINUBE DE SINGAPUR EN EL MERCADO ERP, POR TIPO, 2018-2032 (MILES DE USD)
TABLA 333 MERCADO DE ERP BFSI DE SINGAPUR, POR APLICACIÓN, 2018-2032 (MILES DE USD)
TABLA 334 BFSI DE SINGAPUR EN EL MERCADO DE ERP, POR MODO DE IMPLEMENTACIÓN, 2018-2032 (MILES DE USD)
TABLA 335 NUBE/MULTINUBE DE SINGAPUR EN EL MERCADO ERP, POR TIPO, 2018-2032 (MILES DE USD)
TABLA 336 MERCADO DE ERP DE ATENCIÓN MÉDICA DE SINGAPUR, POR APLICACIÓN, 2018-2032 (MILES DE USD)
TABLA 337 MERCADO DE ATENCIÓN MÉDICA EN SINGAPUR EN ERP, POR MODO DE IMPLEMENTACIÓN, 2018-2032 (MILES DE USD)
TABLA 338 NUBE/MULTINUBE DE SINGAPUR EN EL MERCADO ERP, POR TIPO, 2018-2032 (MILES DE USD)
TABLA 339 MERCADO DE ERP DE TI Y TELECOMUNICACIONES DE SINGAPUR, POR APLICACIÓN, 2018-2032 (MILES DE USD)
TABLA 340 TI Y TELECOMUNICACIONES EN EL MERCADO ERP DE SINGAPUR, POR MODO DE IMPLEMENTACIÓN, 2018-2032 (MILES DE USD)
TABLA 341 NUBE/MULTINUBE DE SINGAPUR EN EL MERCADO ERP, POR TIPO, 2018-2032 (MILES DE USD)
TABLA 342 MERCADO DE ERP DEL GOBIERNO DE SINGAPUR, POR APLICACIÓN, 2018-2032 (MILES DE USD)
TABLA 343 GOBIERNO DE SINGAPUR EN EL MERCADO DE ERP, POR MODO DE IMPLEMENTACIÓN, 2018-2032 (MILES DE USD)
TABLA 344 NUBE/MULTINUBE DE SINGAPUR EN EL MERCADO ERP, POR TIPO, 2018-2032 (MILES DE USD)
TABLA 345 MERCADO DE ERP DE ENERGÍA Y SERVICIOS PÚBLICOS DE SINGAPUR, POR APLICACIÓN, 2018-2032 (MILES DE USD)
TABLA 346 ENERGÍA Y SERVICIOS PÚBLICOS DE SINGAPUR EN EL MERCADO DE ERP, POR MODO DE IMPLEMENTACIÓN, 2018-2032 (MILES DE USD)
TABLA 347 NUBE/MULTINUBE DE SINGAPUR EN EL MERCADO ERP, POR TIPO, 2018-2032 (MILES DE USD)
TABLA 348 MERCADO DE ERP LOGÍSTICO DE SINGAPUR, POR APLICACIÓN, 2018-2032 (MILES DE USD)
TABLA 349 LOGÍSTICA DE SINGAPUR EN EL MERCADO ERP, POR MODO DE IMPLEMENTACIÓN, 2018-2032 (MILES DE USD)
TABLA 350 NUBE/MULTINUBE DE SINGAPUR EN EL MERCADO ERP, POR TIPO, 2018-2032 (MILES DE USD)
TABLA 351 MERCADO DE ERP EDUCATIVO DE SINGAPUR, POR APLICACIÓN, 2018-2032 (MILES DE USD)
TABLA 352 EDUCACIÓN EN EL MERCADO DE ERP DE SINGAPUR, POR MODO DE IMPLEMENTACIÓN, 2018-2032 (MILES DE USD)
TABLA 353 NUBE/MULTINUBE DE SINGAPUR EN EL MERCADO ERP, POR TIPO, 2018-2032 (MILES DE USD)
TABLA 354 MERCADO DE ERP AEROESPACIAL Y DEFENSA DE SINGAPUR, POR APLICACIÓN, 2018-2032 (MILES DE USD)
TABLA 355 SINGAPUR AEROESPACIAL Y DEFENSA EN EL MERCADO ERP, POR MODO DE IMPLEMENTACIÓN, 2018-2032 (MILES DE USD)
TABLA 356 NUBE/MULTINUBE DE SINGAPUR EN EL MERCADO ERP, POR TIPO, 2018-2032 (MILES DE USD)
TABLA 357 SINGAPUR OTROS EN EL MERCADO DE ERP, POR MODO DE IMPLEMENTACIÓN, 2018-2032 (MILES DE USD)
TABLA 358 NUBE/MULTINUBE DE SINGAPUR EN EL MERCADO ERP, POR TIPO, 2018-2032 (MILES DE USD)
TABLA 359 MERCADO DE ERP DE TAILANDIA, POR OFERTA, 2018-2032 (MILES DE USD)
TABLA 360 SOLUCIONES DE TAILANDIA EN EL MERCADO DE ERP, POR TIPO, 2018-2032 (MILES DE USD)
TABLA 361 SERVICIOS DE TAILANDIA EN EL MERCADO ERP, POR TIPO, 2018-2032 (MILES DE USD)
TABLA 362 SERVICIOS PROFESIONALES DE TAILANDIA EN EL MERCADO DE ERP, POR TIPO, 2018-2032 (MILES DE USD)
TABLA 363 MERCADO DE ERP DE TAILANDIA, POR MODO DE IMPLEMENTACIÓN, 2018-2032 (MILES DE USD)
TABLA 364 NUBE/MULTINUBE DE TAILANDIA EN EL MERCADO ERP, POR TIPO, 2018-2032 (MILES DE USD)
TABLA 365 MERCADO DE ERP DE TAILANDIA, POR TAMAÑO DE EMPRESA, 2018-2032 (MILES DE USD)
TABLA 366 MERCADO DE ERP PARA GRANDES EMPRESAS DE TAILANDIA, POR MODO DE IMPLEMENTACIÓN, 2018-2032 (MILES DE USD)
TABLA 367 NUBE/MULTINUBE EN EL MERCADO ERP DE TAILANDIA, POR TIPO, 2018-2032 (MILES DE USD)
TABLA 368 MERCADO DE ERP DE TAILANDIA, POR PRECIOS, 2018-2032 (MILES DE USD)
TABLA 369 MERCADO DE ERP BASADO EN SUSCRIPCIÓN DE TAILANDIA, POR TIPO, 2018-2032 (MILES DE USD)
TABLA 370 MERCADO DE ERP DE TAILANDIA, POR USUARIO FINAL, 2018-2032 (MILES DE USD)
TABLA 371 MERCADO DE ERP DE FABRICACIÓN DE TAILANDIA, POR APLICACIÓN, 2018-2032 (MILES DE USD)
TABLA 372 FABRICACIÓN DE TAILANDIA EN EL MERCADO DE ERP, POR MODO DE IMPLEMENTACIÓN, 2018-2032 (MILES DE USD)
TABLA 373 NUBE/MULTINUBE DE TAILANDIA EN EL MERCADO ERP, POR TIPO, 2018-2032 (MILES DE USD)
TABLA 374 MERCADO DE ERP MINORISTA DE TAILANDIA, POR APLICACIÓN, 2018-2032 (MILES DE USD)
TABLA 375 VENTAS MINORISTAS EN EL MERCADO ERP DE TAILANDIA, POR MODO DE IMPLEMENTACIÓN, 2018-2032 (MILES DE USD)
TABLA 376 NUBE/MULTINUBE DE TAILANDIA EN EL MERCADO ERP, POR TIPO, 2018-2032 (MILES DE USD)
TABLA 377 MERCADO DE ERP BFSI DE TAILANDIA, POR APLICACIÓN, 2018-2032 (MILES DE USD)
TABLA 378 BFSI DE TAILANDIA EN EL MERCADO DE ERP, POR MODO DE IMPLEMENTACIÓN, 2018-2032 (MILES DE USD)
TABLA 379 NUBE/MULTINUBE DE TAILANDIA EN EL MERCADO ERP, POR TIPO, 2018-2032 (MILES DE USD)
TABLA 380 MERCADO DE ERP DE ATENCIÓN MÉDICA DE TAILANDIA, POR APLICACIÓN, 2018-2032 (MILES DE USD)
TABLA 381 MERCADO DE ATENCIÓN MÉDICA EN ERP DE TAILANDIA, POR MODO DE IMPLEMENTACIÓN, 2018-2032 (MILES DE USD)
TABLA 382 NUBE/MULTINUBE DE TAILANDIA EN EL MERCADO ERP, POR TIPO, 2018-2032 (MILES DE USD)
TABLA 383 MERCADO DE ERP DE TI Y TELECOMUNICACIONES DE TAILANDIA, POR APLICACIÓN, 2018-2032 (MILES DE USD)
TABLA 384 TI Y TELECOMUNICACIONES EN EL MERCADO ERP DE TAILANDIA, POR MODO DE IMPLEMENTACIÓN, 2018-2032 (MILES DE USD)
TABLA 385 NUBE/MULTINUBE DE TAILANDIA EN EL MERCADO ERP, POR TIPO, 2018-2032 (MILES DE USD)
TABLA 386 MERCADO DE ERP DEL GOBIERNO DE TAILANDIA, POR APLICACIÓN, 2018-2032 (MILES DE USD)
TABLA 387 GOBIERNO DE TAILANDIA EN EL MERCADO DE ERP, POR MODO DE IMPLEMENTACIÓN, 2018-2032 (MILES DE USD)
TABLA 388 NUBE/MULTINUBE DE TAILANDIA EN EL MERCADO ERP, POR TIPO, 2018-2032 (MILES DE USD)
TABLA 389 MERCADO DE ERP DE ENERGÍA Y SERVICIOS PÚBLICOS DE TAILANDIA, POR APLICACIÓN, 2018-2032 (MILES DE USD)
TABLA 390 ENERGÍA Y SERVICIOS PÚBLICOS DE TAILANDIA EN EL MERCADO DE ERP, POR MODO DE IMPLEMENTACIÓN, 2018-2032 (MILES DE USD)
TABLA 391 NUBE/MULTINUBE DE TAILANDIA EN EL MERCADO ERP, POR TIPO, 2018-2032 (MILES DE USD)
TABLA 392 MERCADO DE ERP LOGÍSTICO DE TAILANDIA, POR APLICACIÓN, 2018-2032 (MILES DE USD)
TABLA 393 LOGÍSTICA DE TAILANDIA EN EL MERCADO ERP, POR MODO DE IMPLEMENTACIÓN, 2018-2032 (MILES DE USD)
TABLA 394 NUBE/MULTINUBE DE TAILANDIA EN EL MERCADO ERP, POR TIPO, 2018-2032 (MILES DE USD)
TABLA 395 MERCADO DE ERP EDUCATIVO DE TAILANDIA, POR APLICACIÓN, 2018-2032 (MILES DE USD)
TABLA 396 EDUCACIÓN EN EL MERCADO DE ERP DE TAILANDIA, POR MODO DE IMPLEMENTACIÓN, 2018-2032 (MILES DE USD)
TABLA 397 NUBE/MULTINUBE DE TAILANDIA EN EL MERCADO ERP, POR TIPO, 2018-2032 (MILES DE USD)
TABLA 398 MERCADO DE ERP DE LA AEROESPACIAL Y DEFENSA DE TAILANDIA, POR APLICACIÓN, 2018-2032 (MILES DE USD)
TABLA 399 TAILANDIA AEROESPACIAL Y DEFENSA EN EL MERCADO ERP, POR MODO DE IMPLEMENTACIÓN, 2018-2032 (MILES DE USD)
TABLA 400 NUBE/MULTINUBE EN EL MERCADO DE ERP DE TAILANDIA, POR TIPO, 2018-2032 (MILES DE USD)
TABLA 401 OTROS EN EL MERCADO DE ERP DE TAILANDIA, POR MODO DE IMPLEMENTACIÓN, 2018-2032 (MILES DE USD)
TABLA 402 NUBE/MULTINUBE EN EL MERCADO ERP DE TAILANDIA, POR TIPO, 2018-2032 (MILES DE USD)
TABLA 403 MERCADO DE ERP DE MALASIA, POR OFERTA, 2018-2032 (MILES DE USD)
TABLA 404 SOLUCIÓN DE MALASIA EN EL MERCADO DE ERP, POR TIPO, 2018-2032 (MILES DE USD)
TABLA 405 SERVICIOS DE MALASIA EN EL MERCADO ERP, POR TIPO, 2018-2032 (MILES DE USD)
TABLA 406 SERVICIOS PROFESIONALES DE MALASIA EN EL MERCADO DE ERP, POR TIPO, 2018-2032 (MILES DE USD)
TABLA 407 MERCADO DE ERP DE MALASIA, POR MODO DE IMPLEMENTACIÓN, 2018-2032 (MILES DE USD)
TABLA 408 NUBE/MULTINUBE DE MALASIA EN EL MERCADO ERP, POR TIPO, 2018-2032 (MILES DE USD)
TABLA 409 MERCADO DE ERP DE MALASIA, POR TAMAÑO DE EMPRESA, 2018-2032 (MILES DE USD)
TABLA 410 MERCADO DE ERP PARA GRANDES EMPRESAS DE MALASIA, POR MODO DE IMPLEMENTACIÓN, 2018-2032 (MILES DE USD)
TABLA 411 NUBE/MULTINUBE DE MALASIA EN EL MERCADO ERP, POR TIPO, 2018-2032 (MILES DE USD)
TABLA 412 MERCADO DE ERP DE MALASIA, POR PRECIOS, 2018-2032 (MILES DE USD)
TABLA 413 MERCADO DE ERP BASADO EN SUSCRIPCIÓN DE MALASIA, POR TIPO, 2018-2032 (MILES DE USD)
TABLA 414 MERCADO DE ERP DE MALASIA, POR USUARIO FINAL, 2018-2032 (MILES DE USD)
TABLA 415 MERCADO DE ERP DE MANUFACTURA DE MALASIA, POR APLICACIÓN, 2018-2032 (MILES DE USD)
TABLA 416 FABRICACIÓN DE MALASIA EN EL MERCADO DE ERP, POR MODO DE IMPLEMENTACIÓN, 2018-2032 (MILES DE USD)
TABLA 417 NUBE/MULTINUBE DE MALASIA EN EL MERCADO ERP, POR TIPO, 2018-2032 (MILES DE USD)
TABLA 418 MERCADO DE ERP MINORISTA DE MALASIA, POR APLICACIÓN, 2018-2032 (MILES DE USD)
TABLA 419 VENTAS MINORISTAS EN EL MERCADO DE ERP DE MALASIA, POR MODO DE IMPLEMENTACIÓN, 2018-2032 (MILES DE USD)
TABLA 420 NUBE/MULTINUBE DE MALASIA EN EL MERCADO ERP, POR TIPO, 2018-2032 (MILES DE USD)
TABLA 421 MERCADO DE ERP BFSI DE MALASIA, POR APLICACIÓN, 2018-2032 (MILES DE USD)
TABLA 422 BFSI DE MALASIA EN EL MERCADO DE ERP, POR MODO DE IMPLEMENTACIÓN, 2018-2032 (MILES DE USD)
TABLA 423 NUBE/MULTINUBE DE MALASIA EN EL MERCADO ERP, POR TIPO, 2018-2032 (MILES DE USD)
TABLA 424 MERCADO DE ERP DE ATENCIÓN MÉDICA DE MALASIA, POR APLICACIÓN, 2018-2032 (MILES DE USD)
TABLA 425 MERCADO DE ATENCIÓN MÉDICA EN ERP DE MALASIA, POR MODO DE IMPLEMENTACIÓN, 2018-2032 (MILES DE USD)
TABLA 426 NUBE/MULTINUBE DE MALASIA EN EL MERCADO ERP, POR TIPO, 2018-2032 (MILES DE USD)
TABLA 427 MERCADO DE ERP DE TI Y TELECOMUNICACIONES DE MALASIA, POR APLICACIÓN, 2018-2032 (MILES DE USD)
TABLA 428 TI Y TELECOMUNICACIONES EN EL MERCADO ERP DE MALASIA, POR MODO DE IMPLEMENTACIÓN, 2018-2032 (MILES DE USD)
TABLA 429 NUBE/MULTINUBE DE MALASIA EN EL MERCADO ERP, POR TIPO, 2018-2032 (MILES DE USD)
TABLA 430 MERCADO DE ERP DEL GOBIERNO DE MALASIA, POR APLICACIÓN, 2018-2032 (MILES DE USD)
TABLA 431 GOBIERNO DE MALASIA EN EL MERCADO DE ERP, POR MODO DE IMPLEMENTACIÓN, 2018-2032 (MILES DE USD)
TABLA 432 NUBE/MULTINUBE DE MALASIA EN EL MERCADO ERP, POR TIPO, 2018-2032 (MILES DE USD)
TABLA 433 MERCADO DE ERP DE ENERGÍA Y SERVICIOS PÚBLICOS DE MALASIA, POR APLICACIÓN, 2018-2032 (MILES DE USD)
TABLA 434 ENERGÍA Y SERVICIOS PÚBLICOS DE MALASIA EN EL MERCADO DE ERP, POR MODO DE IMPLEMENTACIÓN, 2018-2032 (MILES DE USD)
TABLA 435 NUBE/MULTINUBE DE MALASIA EN EL MERCADO ERP, POR TIPO, 2018-2032 (MILES DE USD)
TABLA 436 MERCADO DE ERP LOGÍSTICO DE MALASIA, POR APLICACIÓN, 2018-2032 (MILES DE USD)
TABLA 437 LOGÍSTICA EN EL MERCADO ERP DE MALASIA, POR MODO DE IMPLEMENTACIÓN, 2018-2032 (MILES DE USD)
TABLA 438 NUBE/MULTINUBE DE MALASIA EN EL MERCADO ERP, POR TIPO, 2018-2032 (MILES DE USD)
TABLA 439 MERCADO DE ERP EDUCATIVO DE MALASIA, POR APLICACIÓN, 2018-2032 (MILES DE USD)
TABLA 440 EDUCACIÓN EN EL MERCADO DE ERP DE MALASIA, POR MODO DE IMPLEMENTACIÓN, 2018-2032 (MILES DE USD)
TABLA 441 NUBE/MULTINUBE DE MALASIA EN EL MERCADO ERP, POR TIPO, 2018-2032 (MILES DE USD)
TABLA 442 MERCADO DE ERP AEROESPACIAL Y DE DEFENSA DE MALASIA, POR APLICACIÓN, 2018-2032 (MILES DE USD)
TABLA 443 MALASIA AEROESPACIAL Y DEFENSA EN EL MERCADO DE ERP, POR MODO DE IMPLEMENTACIÓN, 2018-2032 (MILES DE USD)
TABLA 444 NUBE/MULTINUBE DE MALASIA EN EL MERCADO ERP, POR TIPO, 2018-2032 (MILES DE USD)
TABLA 445 MALASIA OTROS EN EL MERCADO DE ERP, POR MODO DE IMPLEMENTACIÓN, 2018-2032 (MILES DE USD)
TABLA 446 NUBE/MULTINUBE DE MALASIA EN EL MERCADO ERP, POR TIPO, 2018-2032 (MILES DE USD)
TABLA 447 MERCADO DE ERP DE VIETNAM, POR OFERTA, 2018-2032 (MILES DE USD)
TABLA 448 SOLUCIÓN DE VIETNAM EN EL MERCADO DE ERP, POR TIPO, 2018-2032 (MILES DE USD)
TABLA 449 SERVICIOS DE VIETNAM EN EL MERCADO ERP, POR TIPO, 2018-2032 (MILES DE USD)
TABLA 450 SERVICIOS PROFESIONALES DE VIETNAM EN EL MERCADO ERP, POR TIPO, 2018-2032 (MILES DE USD)
TABLA 451 MERCADO DE ERP DE VIETNAM, POR MODO DE IMPLEMENTACIÓN, 2018-2032 (MILES DE USD)
TABLA 452 VIETNAM NUBE/MULTI NUBE EN EL MERCADO ERP, POR TIPO, 2018-2032 (MILES DE USD)
TABLA 453 MERCADO DE ERP DE VIETNAM, POR TAMAÑO DE EMPRESA, 2018-2032 (MILES DE USD)
TABLA 454 MERCADO DE ERP PARA GRANDES EMPRESAS DE VIETNAM, POR MODO DE IMPLEMENTACIÓN, 2018-2032 (MILES DE USD)
TABLA 455 VIETNAM NUBE/MULTI NUBE EN EL MERCADO ERP, POR TIPO, 2018-2032 (MILES DE USD)
TABLA 456 MERCADO DE ERP DE VIETNAM, POR PRECIOS, 2018-2032 (MILES DE USD)
TABLA 457 MERCADO DE ERP BASADO EN SUSCRIPCIÓN DE VIETNAM, POR TIPO, 2018-2032 (MILES DE USD)
TABLA 458 MERCADO DE ERP DE VIETNAM, POR USUARIO FINAL, 2018-2032 (MILES DE USD)
TABLA 459 MERCADO DE ERP DE MANUFACTURA DE VIETNAM, POR APLICACIÓN, 2018-2032 (MILES DE USD)
TABLA 460 FABRICACIÓN DE VIETNAM EN EL MERCADO DE ERP, POR MODO DE IMPLEMENTACIÓN, 2018-2032 (MILES DE USD)
TABLA 461 VIETNAM NUBE/MULTI NUBE EN EL MERCADO ERP, POR TIPO, 2018-2032 (MILES DE USD)
TABLA 462 MERCADO DE ERP MINORISTA DE VIETNAM, POR APLICACIÓN, 2018-2032 (MILES DE USD)
TABLA 463 VENTAS MINORISTAS EN EL MERCADO ERP DE VIETNAM, POR MODO DE IMPLEMENTACIÓN, 2018-2032 (MILES DE USD)
TABLA 464 VIETNAM NUBE/MULTI NUBE EN EL MERCADO ERP, POR TIPO, 2018-2032 (MILES DE USD)
TABLA 465 MERCADO DE ERP BFSI DE VIETNAM, POR APLICACIÓN, 2018-2032 (MILES DE USD)
TABLA 466 VIETNAM BFSI EN EL MERCADO ERP, POR MODO DE IMPLEMENTACIÓN, 2018-2032 (MILES DE USD)
TABLA 467 VIETNAM NUBE/MULTI NUBE EN EL MERCADO ERP, POR TIPO, 2018-2032 (MILES DE USD)
TABLA 468 MERCADO DE ERP DE ATENCIÓN MÉDICA DE VIETNAM, POR APLICACIÓN, 2018-2032 (MILES DE USD)
TABLA 469 VIETNAM ATENCIÓN MÉDICA EN EL MERCADO ERP, POR MODO DE IMPLEMENTACIÓN, 2018-2032 (MILES DE USD)
TABLA 470 VIETNAM NUBE/MULTI NUBE EN EL MERCADO ERP, POR TIPO, 2018-2032 (MILES DE USD)
TABLA 471 MERCADO DE ERP DE TI Y TELECOMUNICACIONES DE VIETNAM, POR APLICACIÓN, 2018-2032 (MILES DE USD)
TABLA 472 VIETNAM TI Y TELECOMUNICACIONES EN EL MERCADO ERP, POR MODO DE IMPLEMENTACIÓN, 2018-2032 (MILES DE USD)
TABLA 473 VIETNAM NUBE/MULTI NUBE EN EL MERCADO ERP, POR TIPO, 2018-2032 (MILES DE USD)
TABLA 474 MERCADO DE ERP DEL GOBIERNO DE VIETNAM, POR APLICACIÓN, 2018-2032 (MILES DE USD)
TABLA 475 GOBIERNO DE VIETNAM EN EL MERCADO DE ERP, POR MODO DE IMPLEMENTACIÓN, 2018-2032 (MILES DE USD)
TABLA 476 VIETNAM NUBE/MULTI NUBE EN EL MERCADO ERP, POR TIPO, 2018-2032 (MILES DE USD)
TABLA 477 MERCADO DE ERP DE ENERGÍA Y SERVICIOS PÚBLICOS DE VIETNAM, POR APLICACIÓN, 2018-2032 (MILES DE USD)
TABLA 478 ENERGÍA Y SERVICIOS PÚBLICOS DE VIETNAM EN EL MERCADO DE ERP, POR MODO DE IMPLEMENTACIÓN, 2018-2032 (MILES DE USD)
TABLA 479 VIETNAM NUBE/MULTI NUBE EN EL MERCADO ERP, POR TIPO, 2018-2032 (MILES DE USD)
TABLA 480 MERCADO DE ERP LOGÍSTICO DE VIETNAM, POR APLICACIÓN, 2018-2032 (MILES DE USD)
TABLA 481 LOGÍSTICA DE VIETNAM EN EL MERCADO ERP, POR MODO DE IMPLEMENTACIÓN, 2018-2032 (MILES DE USD)
TABLA 482 VIETNAM NUBE/MULTI NUBE EN EL MERCADO ERP, POR TIPO, 2018-2032 (MILES DE USD)
TABLA 483 MERCADO DE ERP EDUCATIVO DE VIETNAM, POR APLICACIÓN, 2018-2032 (MILES DE USD)
TABLA 484 EDUCACIÓN EN VIETNAM EN EL MERCADO DE ERP, POR MODO DE IMPLEMENTACIÓN, 2018-2032 (MILES DE USD)
TABLA 485 VIETNAM NUBE/MULTI NUBE EN EL MERCADO ERP, POR TIPO, 2018-2032 (MILES DE USD)
TABLA 486 MERCADO DE ERP AEROESPACIAL Y DE DEFENSA DE VIETNAM, POR APLICACIÓN, 2018-2032 (MILES DE USD)
TABLA 487 VIETNAM AEROESPACIAL Y DEFENSA EN EL MERCADO ERP, POR MODO DE IMPLEMENTACIÓN, 2018-2032 (MILES DE USD)
TABLA 488 VIETNAM NUBE/MULTI NUBE EN EL MERCADO ERP, POR TIPO, 2018-2032 (MILES DE USD)
TABLA 489 VIETNAM OTROS EN EL MERCADO DE ERP, POR MODO DE IMPLEMENTACIÓN, 2018-2032 (MILES DE USD)
TABLA 490 VIETNAM NUBE/MULTI NUBE EN EL MERCADO ERP, POR TIPO, 2018-2032 (MILES DE USD)
TABLA 491 MERCADO DE ERP DE TAIWÁN, POR OFERTA, 2018-2032 (MILES DE USD)
TABLA 492 SOLUCIÓN DE TAIWÁN EN EL MERCADO DE ERP, POR TIPO, 2018-2032 (MILES DE USD)
TABLA 493 SERVICIOS DE TAIWÁN EN EL MERCADO ERP, POR TIPO, 2018-2032 (MILES DE USD)
TABLA 494 SERVICIOS PROFESIONALES DE TAIWÁN EN EL MERCADO ERP, POR TIPO, 2018-2032 (MILES DE USD)
TABLA 495 MERCADO DE ERP DE TAIWÁN, POR MODO DE IMPLEMENTACIÓN, 2018-2032 (MILES DE USD)
TABLA 496 NUBE/MULTINUBE DE TAIWÁN EN EL MERCADO ERP, POR TIPO, 2018-2032 (MILES DE USD)
TABLA 497 MERCADO DE ERP DE TAIWÁN, POR TAMAÑO DE EMPRESA, 2018-2032 (MILES DE USD)
TABLA 498 MERCADO DE ERP PARA GRANDES EMPRESAS DE TAIWÁN, POR MODO DE IMPLEMENTACIÓN, 2018-2032 (MILES DE USD)
TABLA 499 NUBE/MULTINUBE DE TAIWÁN EN EL MERCADO ERP, POR TIPO, 2018-2032 (MILES DE USD)
TABLA 500 MERCADO DE ERP DE TAIWÁN, POR PRECIOS, 2018-2032 (MILES DE USD)
TABLA 501 MERCADO DE ERP BASADO EN SUSCRIPCIÓN DE TAIWÁN, POR TIPO, 2018-2032 (MILES DE USD)
TABLA 502 MERCADO DE ERP DE TAIWÁN, POR USUARIO FINAL, 2018-2032 (MILES DE USD)
TABLA 503 MERCADO DE ERP DE MANUFACTURA DE TAIWÁN, POR APLICACIÓN, 2018-2032 (MILES DE USD)
TABLA 504 FABRICACIÓN DE TAIWÁN EN EL MERCADO DE ERP, POR MODO DE IMPLEMENTACIÓN, 2018-2032 (MILES DE USD)
TABLA 505 NUBE/MULTINUBE EN EL MERCADO ERP DE TAIWÁN, POR TIPO, 2018-2032 (MILES DE USD)
TABLA 506 MERCADO DE ERP MINORISTA EN TAIWÁN, POR APLICACIÓN, 2018-2032 (MILES DE USD)
TABLA 507 VENTAS MINORISTAS EN EL MERCADO ERP DE TAIWÁN, POR MODO DE IMPLEMENTACIÓN, 2018-2032 (MILES DE USD)
TABLA 508 NUBE/MULTINUBE DE TAIWÁN EN EL MERCADO ERP, POR TIPO, 2018-2032 (MILES DE USD)
TABLA 509 MERCADO DE ERP BFSI DE TAIWÁN, POR APLICACIÓN, 2018-2032 (MILES DE USD)
TABLA 510 BFSI DE TAIWÁN EN EL MERCADO DE ERP, POR MODO DE IMPLEMENTACIÓN, 2018-2032 (MILES DE USD)
TABLA 511 NUBE/MULTINUBE DE TAIWÁN EN EL MERCADO ERP, POR TIPO, 2018-2032 (MILES DE USD)
TABLA 512 MERCADO DE ERP DE ATENCIÓN MÉDICA DE TAIWÁN, POR APLICACIÓN, 2018-2032 (MILES DE USD)
TABLA 513 ATENCIÓN MÉDICA EN TAIWÁN EN EL MERCADO ERP, POR MODO DE IMPLEMENTACIÓN, 2018-2032 (MILES DE USD)
TABLA 514 NUBE/MULTINUBE DE TAIWÁN EN EL MERCADO ERP, POR TIPO, 2018-2032 (MILES DE USD)
TABLA 515 MERCADO DE ERP DE TI Y TELECOMUNICACIONES DE TAIWÁN, POR APLICACIÓN, 2018-2032 (MILES DE USD)
TABLA 516 TI Y TELECOMUNICACIONES EN EL MERCADO ERP DE TAIWÁN, POR MODO DE IMPLEMENTACIÓN, 2018-2032 (MILES DE USD)
TABLA 517 NUBE/MULTINUBE DE TAIWÁN EN EL MERCADO ERP, POR TIPO, 2018-2032 (MILES DE USD)
TABLA 518 MERCADO DE ERP DEL GOBIERNO DE TAIWÁN, POR APLICACIÓN, 2018-2032 (MILES DE USD)
TABLA 519 GOBIERNO DE TAIWÁN EN EL MERCADO DE ERP, POR MODO DE IMPLEMENTACIÓN, 2018-2032 (MILES DE USD)
TABLA 520 NUBE/MULTINUBE EN EL MERCADO ERP DE TAIWÁN, POR TIPO, 2018-2032 (MILES DE USD)
TABLA 521 MERCADO DE ERP DE ENERGÍA Y SERVICIOS PÚBLICOS DE TAIWÁN, POR APLICACIÓN, 2018-2032 (MILES DE USD)
TABLA 522 ENERGÍA Y SERVICIOS PÚBLICOS DE TAIWÁN EN EL MERCADO DE ERP, POR MODO DE IMPLEMENTACIÓN, 2018-2032 (MILES DE USD)
TABLA 523 NUBE/MULTINUBE DE TAIWÁN EN EL MERCADO ERP, POR TIPO, 2018-2032 (MILES DE USD)
TABLA 524 MERCADO DE ERP LOGÍSTICO DE TAIWÁN, POR APLICACIÓN, 2018-2032 (MILES DE USD)
TABLA 525 LOGÍSTICA DE TAIWÁN EN EL MERCADO DE ERP, POR MODO DE IMPLEMENTACIÓN, 2018-2032 (MILES DE USD)
TABLA 526 NUBE/MULTINUBE DE TAIWÁN EN EL MERCADO ERP, POR TIPO, 2018-2032 (MILES DE USD)
TABLA 527 MERCADO DE ERP EDUCATIVO DE TAIWÁN, POR APLICACIÓN, 2018-2032 (MILES DE USD)
TABLA 528 EDUCACIÓN EN EL MERCADO DE ERP DE TAIWÁN, POR MODO DE IMPLEMENTACIÓN, 2018-2032 (MILES DE USD)
TABLA 529 NUBE/MULTINUBE DE TAIWÁN EN EL MERCADO ERP, POR TIPO, 2018-2032 (MILES DE USD)
TABLA 530 MERCADO DE ERP DE LA INDUSTRIA AEROESPACIAL Y DE DEFENSA DE TAIWÁN, POR APLICACIÓN, 2018-2032 (MILES DE USD)
TABLA 531 TAIWÁN AEROESPACIAL Y DEFENSA EN EL MERCADO ERP, POR MODO DE IMPLEMENTACIÓN, 2018-2032 (MILES DE USD)
TABLA 532 NUBE/MULTINUBE DE TAIWÁN EN EL MERCADO ERP, POR TIPO, 2018-2032 (MILES DE USD)
TABLA 533 TAIWÁN OTROS EN EL MERCADO DE ERP, POR MODO DE IMPLEMENTACIÓN, 2018-2032 (MILES DE USD)
TABLA 534 NUBE/MULTINUBE DE TAIWÁN EN EL MERCADO ERP, POR TIPO, 2018-2032 (MILES DE USD)
TABLA 535 MERCADO DE ERP DE HONG KONG, POR OFERTA, 2018-2032 (MILES DE USD)
TABLA 536 SOLUCIÓN DE HONG KONG EN EL MERCADO DE ERP, POR TIPO, 2018-2032 (MILES DE USD)
TABLA 537 SERVICIOS DE HONG KONG EN EL MERCADO ERP, POR TIPO, 2018-2032 (MILES DE USD)
TABLA 538 SERVICIOS PROFESIONALES DE HONG KONG EN EL MERCADO ERP, POR TIPO, 2018-2032 (MILES DE USD)
TABLA 539 MERCADO DE ERP DE HONG KONG, POR MODO DE IMPLEMENTACIÓN, 2018-2032 (MILES DE USD)
TABLA 540 NUBE/MULTINUBE EN EL MERCADO ERP DE HONG KONG, POR TIPO, 2018-2032 (MILES DE USD)
TABLA 541 MERCADO DE ERP DE HONG KONG, POR TAMAÑO DE EMPRESA, 2018-2032 (MILES DE USD)
TABLA 542 MERCADO DE ERP PARA GRANDES EMPRESAS DE HONG KONG, POR MODO DE IMPLEMENTACIÓN, 2018-2032 (MILES DE USD)
TABLA 543 NUBE/MULTINUBE EN EL MERCADO ERP DE HONG KONG, POR TIPO, 2018-2032 (MILES DE USD)
TABLA 544 MERCADO DE ERP DE HONG KONG, POR PRECIOS, 2018-2032 (MILES DE USD)
TABLA 545 MERCADO DE ERP BASADO EN SUSCRIPCIÓN DE HONG KONG, POR TIPO, 2018-2032 (MILES DE USD)
TABLA 546 MERCADO DE ERP DE HONG KONG, POR USUARIO FINAL, 2018-2032 (MILES DE USD)
TABLA 547 MERCADO DE ERP DE MANUFACTURA DE HONG KONG, POR APLICACIÓN, 2018-2032 (MILES DE USD)
TABLA 548 FABRICACIÓN DE HONG KONG EN EL MERCADO DE ERP, POR MODO DE IMPLEMENTACIÓN, 2018-2032 (MILES DE USD)
TABLA 549 NUBE/MULTINUBE EN EL MERCADO ERP DE HONG KONG, POR TIPO, 2018-2032 (MILES DE USD)
TABLA 550 MERCADO DE ERP MINORISTA EN HONG KONG, POR APLICACIÓN, 2018-2032 (MILES DE USD)
TABLA 551 VENTAS MINORISTAS EN EL MERCADO ERP DE HONG KONG, POR MODO DE IMPLEMENTACIÓN, 2018-2032 (MILES DE USD)
TABLA 552 NUBE/MULTINUBE EN EL MERCADO ERP DE HONG KONG, POR TIPO, 2018-2032 (MILES DE USD)
TABLA 553 MERCADO DE ERP BFSI DE HONG KONG, POR APLICACIÓN, 2018-2032 (MILES DE USD)
TABLA 554 BFSI DE HONG KONG EN EL MERCADO DE ERP, POR MODO DE IMPLEMENTACIÓN, 2018-2032 (MILES DE USD)
TABLA 555 NUBE/MULTINUBE EN EL MERCADO ERP DE HONG KONG, POR TIPO, 2018-2032 (MILES DE USD)
TABLA 556 MERCADO DE ERP DE ATENCIÓN MÉDICA DE HONG KONG, POR APLICACIÓN, 2018-2032 (MILES DE USD)
TABLA 557 MERCADO DE ATENCIÓN MÉDICA EN HONG KONG EN ERP, POR MODO DE IMPLEMENTACIÓN, 2018-2032 (MILES DE USD)
TABLA 558 NUBE/MULTINUBE EN EL MERCADO ERP DE HONG KONG, POR TIPO, 2018-2032 (MILES DE USD)
TABLA 559 MERCADO DE ERP DE TI Y TELECOMUNICACIONES DE HONG KONG, POR APLICACIÓN, 2018-2032 (MILES DE USD)
TABLA 560 TI Y TELECOMUNICACIONES EN EL MERCADO ERP DE HONG KONG, POR MODO DE IMPLEMENTACIÓN, 2018-2032 (MILES DE USD)
TABLA 561 NUBE/MULTINUBE EN EL MERCADO ERP DE HONG KONG, POR TIPO, 2018-2032 (MILES DE USD)
TABLA 562 MERCADO DE ERP DEL GOBIERNO DE HONG KONG, POR APLICACIÓN, 2018-2032 (MILES DE USD)
TABLA 563 GOBIERNO DE HONG KONG EN EL MERCADO DE ERP, POR MODO DE IMPLEMENTACIÓN, 2018-2032 (MILES DE USD)
TABLA 564 NUBE/MULTINUBE EN EL MERCADO ERP DE HONG KONG, POR TIPO, 2018-2032 (MILES DE USD)
TABLA 565 MERCADO DE ERP DE ENERGÍA Y SERVICIOS PÚBLICOS DE HONG KONG, POR APLICACIÓN, 2018-2032 (MILES DE USD)
TABLA 566 ENERGÍA Y SERVICIOS PÚBLICOS DE HONG KONG EN EL MERCADO DE ERP, POR MODO DE IMPLEMENTACIÓN, 2018-2032 (MILES DE USD)
TABLA 567 NUBE/MULTINUBE EN EL MERCADO ERP DE HONG KONG, POR TIPO, 2018-2032 (MILES DE USD)
TABLA 568 MERCADO DE ERP DE LOGÍSTICA DE HONG KONG, POR APLICACIÓN, 2018-2032 (MILES DE USD)
TABLA 569 LOGÍSTICA DE HONG KONG EN EL MERCADO ERP, POR MODO DE IMPLEMENTACIÓN, 2018-2032 (MILES DE USD)
TABLA 570 NUBE/MULTINUBE EN EL MERCADO ERP DE HONG KONG, POR TIPO, 2018-2032 (MILES DE USD)
TABLA 571 MERCADO DE ERP EDUCATIVO DE HONG KONG, POR APLICACIÓN, 2018-2032 (MILES DE USD)
TABLA 572 EDUCACIÓN EN EL MERCADO ERP DE HONG KONG, POR MODO DE IMPLEMENTACIÓN, 2018-2032 (MILES DE USD)
TABLA 573 NUBE/MULTINUBE EN EL MERCADO ERP DE HONG KONG, POR TIPO, 2018-2032 (MILES DE USD)
TABLA 574 MERCADO DE ERP AEROESPACIAL Y DE DEFENSA DE HONG KONG, POR APLICACIÓN, 2018-2032 (MILES DE USD)
TABLA 575 MERCADO DE ERP DE LA INDUSTRIA AEROESPACIAL Y DEFENSIVA DE HONG KONG, POR MODO DE IMPLEMENTACIÓN, 2018-2032 (MILES DE USD)
TABLA 576 NUBE/MULTINUBE EN EL MERCADO ERP DE HONG KONG, POR TIPO, 2018-2032 (MILES DE USD)
TABLA 577 HONG KONG OTROS EN EL MERCADO DE ERP, POR MODO DE IMPLEMENTACIÓN, 2018-2032 (MILES DE USD)
TABLA 578 NUBE/MULTINUBE EN EL MERCADO ERP DE HONG KONG, POR TIPO, 2018-2032 (MILES DE USD)
TABLA 579 MERCADO DE ERP DE FILIPINAS, POR OFERTA, 2018-2032 (MILES DE USD)
TABLA 580 SOLUCIÓN EN EL MERCADO DE ERP DE FILIPINAS, POR TIPO, 2018-2032 (MILES DE USD)
TABLA 581 SERVICIOS DE FILIPINAS EN EL MERCADO ERP, POR TIPO, 2018-2032 (MILES DE USD)
TABLA 582 SERVICIOS PROFESIONALES EN EL MERCADO DE ERP DE FILIPINAS, POR TIPO, 2018-2032 (MILES DE USD)
TABLA 583 MERCADO DE ERP DE FILIPINAS, POR MODO DE IMPLEMENTACIÓN, 2018-2032 (MILES DE USD)
TABLA 584 NUBE/MULTINUBE EN EL MERCADO ERP DE FILIPINAS, POR TIPO, 2018-2032 (MILES DE USD)
TABLA 585 MERCADO DE ERP DE FILIPINAS, POR TAMAÑO DE EMPRESA, 2018-2032 (MILES DE USD)
TABLA 586 MERCADO DE ERP PARA GRANDES EMPRESAS DE FILIPINAS, POR MODO DE IMPLEMENTACIÓN, 2018-2032 (MILES DE USD)
TABLA 587 NUBE/MULTINUBE EN EL MERCADO DE ERP DE FILIPINAS, POR TIPO, 2018-2032 (MILES DE USD)
TABLA 588 MERCADO DE ERP DE FILIPINAS, POR PRECIOS, 2018-2032 (MILES DE USD)
TABLA 589 MERCADO DE ERP BASADO EN SUSCRIPCIÓN DE FILIPINAS, POR TIPO, 2018-2032 (MILES DE USD)
TABLA 590 MERCADO DE ERP DE FILIPINAS, POR USUARIO FINAL, 2018-2032 (MILES DE USD)
TABLA 591 MERCADO DE ERP DE MANUFACTURA DE FILIPINAS, POR APLICACIÓN, 2018-2032 (MILES DE USD)
TABLA 592 FABRICACIÓN DE FILIPINAS EN EL MERCADO DE ERP, POR MODO DE IMPLEMENTACIÓN, 2018-2032 (MILES DE USD)
TABLA 593 NUBE/MULTINUBE EN EL MERCADO DE ERP DE FILIPINAS, POR TIPO, 2018-2032 (MILES DE USD)
TABLA 594 MERCADO DE ERP MINORISTA DE FILIPINAS, POR APLICACIÓN, 2018-2032 (MILES DE USD)
TABLA 595 VENTAS MINORISTAS EN EL MERCADO ERP DE FILIPINAS, POR MODO DE IMPLEMENTACIÓN, 2018-2032 (MILES DE USD)
TABLA 596 NUBE/MULTINUBE EN EL MERCADO ERP DE FILIPINAS, POR TIPO, 2018-2032 (MILES DE USD)
TABLA 597 MERCADO DE ERP BFSI DE FILIPINAS, POR APLICACIÓN, 2018-2032 (MILES DE USD)
TABLA 598 BFSI DE FILIPINAS EN EL MERCADO DE ERP, POR MODO DE IMPLEMENTACIÓN, 2018-2032 (MILES DE USD)
TABLA 599 NUBE/MULTINUBE EN EL MERCADO DE ERP DE FILIPINAS, POR TIPO, 2018-2032 (MILES DE USD)
TABLA 600 MERCADO DE ERP DE ATENCIÓN MÉDICA DE FILIPINAS, POR APLICACIÓN, 2018-2032 (MILES DE USD)
TABLA 601 MERCADO DE ATENCIÓN MÉDICA EN FILIPINAS EN ERP, POR MODO DE IMPLEMENTACIÓN, 2018-2032 (MILES DE USD)
TABLA 602 NUBE/MULTINUBE EN EL MERCADO ERP DE FILIPINAS, POR TIPO, 2018-2032 (MILES DE USD)
TABLA 603 MERCADO DE ERP DE TI Y TELECOMUNICACIONES DE FILIPINAS, POR APLICACIÓN, 2018-2032 (MILES DE USD)
TABLA 604 TI Y TELECOMUNICACIONES EN EL MERCADO ERP DE FILIPINAS, POR MODO DE IMPLEMENTACIÓN, 2018-2032 (MILES DE USD)
TABLA 605 NUBE/MULTINUBE EN EL MERCADO ERP DE FILIPINAS, POR TIPO, 2018-2032 (MILES DE USD)
TABLA 606 MERCADO DE ERP DEL GOBIERNO DE FILIPINAS, POR APLICACIÓN, 2018-2032 (MILES DE USD)
TABLA 607 GOBIERNO DE FILIPINAS EN EL MERCADO DE ERP, POR MODO DE IMPLEMENTACIÓN, 2018-2032 (MILES DE USD)
TABLA 608 NUBE/MULTINUBE EN EL MERCADO ERP DE FILIPINAS, POR TIPO, 2018-2032 (MILES DE USD)
TABLA 609 MERCADO DE ERP DE ENERGÍA Y SERVICIOS PÚBLICOS DE FILIPINAS, POR APLICACIÓN, 2018-2032 (MILES DE USD)
TABLA 610 ENERGÍA Y SERVICIOS PÚBLICOS DE FILIPINAS EN EL MERCADO DE ERP, POR MODO DE IMPLEMENTACIÓN, 2018-2032 (MILES DE USD)
TABLA 611 NUBE/MULTINUBE EN EL MERCADO DE ERP DE FILIPINAS, POR TIPO, 2018-2032 (MILES DE USD)
TABLA 612 MERCADO DE ERP LOGÍSTICO DE FILIPINAS, POR APLICACIÓN, 2018-2032 (MILES DE USD)
TABLA 613 LOGÍSTICA EN EL MERCADO ERP DE FILIPINAS, POR MODO DE IMPLEMENTACIÓN, 2018-2032 (MILES DE USD)
TABLA 614 NUBE/MULTINUBE EN EL MERCADO DE ERP DE FILIPINAS, POR TIPO, 2018-2032 (MILES DE USD)
TABLA 615 MERCADO DE ERP EDUCATIVO DE FILIPINAS, POR APLICACIÓN, 2018-2032 (MILES DE USD)
TABLA 616 EDUCACIÓN EN EL MERCADO DE ERP DE FILIPINAS, POR MODO DE IMPLEMENTACIÓN, 2018-2032 (MILES DE USD)
TABLA 617 NUBE/MULTINUBE EN EL MERCADO ERP DE FILIPINAS, POR TIPO, 2018-2032 (MILES DE USD)
TABLA 618 MERCADO DE ERP DE LA AEROESPACIAL Y DEFENSA DE FILIPINAS, POR APLICACIÓN, 2018-2032 (MILES DE USD)
TABLA 619 FILIPINAS AEROESPACIAL Y DEFENSA EN EL MERCADO DE ERP, POR MODO DE IMPLEMENTACIÓN, 2018-2032 (MILES DE USD)
TABLA 620 NUBE/MULTINUBE EN EL MERCADO ERP DE FILIPINAS, POR TIPO, 2018-2032 (MILES DE USD)
TABLA 621 FILIPINAS OTROS EN EL MERCADO DE ERP, POR MODO DE IMPLEMENTACIÓN, 2018-2032 (MILES DE USD)
TABLA 622 NUBE/MULTINUBE EN EL MERCADO ERP DE FILIPINAS, POR TIPO, 2018-2032 (MILES DE USD)
TABLA 623 MERCADO DE ERP DE NUEVA ZELANDA, POR OFERTA, 2018-2032 (MILES DE USD)
TABLA 624 SOLUCIONES DE NUEVA ZELANDA EN EL MERCADO DE ERP, POR TIPO, 2018-2032 (MILES DE USD)
TABLA 625 SERVICIOS DE NUEVA ZELANDA EN EL MERCADO ERP, POR TIPO, 2018-2032 (MILES DE USD)
TABLA 626 SERVICIOS PROFESIONALES DE NUEVA ZELANDA EN EL MERCADO DE ERP, POR TIPO, 2018-2032 (MILES DE USD)
TABLA 627 MERCADO DE ERP DE NUEVA ZELANDA, POR MODO DE IMPLEMENTACIÓN, 2018-2032 (MILES DE USD)
TABLA 628 NUEVA ZELANDA NUBE/MULTI NUBE EN EL MERCADO ERP, POR TIPO, 2018-2032 (MILES DE USD)
TABLA 629 MERCADO DE ERP DE NUEVA ZELANDA, POR TAMAÑO DE EMPRESA, 2018-2032 (MILES DE USD)
TABLA 630 MERCADO DE ERP PARA GRANDES EMPRESAS DE NUEVA ZELANDA, POR MODO DE IMPLEMENTACIÓN, 2018-2032 (MILES DE USD)
TABLA 631 NUEVA ZELANDA NUBE/MULTI NUBE EN EL MERCADO ERP, POR TIPO, 2018-2032 (MILES DE USD)
TABLA 632 MERCADO DE ERP DE NUEVA ZELANDA, POR PRECIOS, 2018-2032 (MILES DE USD)
TABLA 633 MERCADO DE ERP BASADO EN SUSCRIPCIÓN DE NUEVA ZELANDA, POR TIPO, 2018-2032 (MILES DE USD)
TABLA 634 MERCADO DE ERP DE NUEVA ZELANDA, POR USUARIO FINAL, 2018-2032 (MILES DE USD)
TABLA 635 MERCADO DE ERP DE MANUFACTURA DE NUEVA ZELANDA, POR APLICACIÓN, 2018-2032 (MILES DE USD)
TABLA 636 FABRICACIÓN DE NUEVA ZELANDA EN EL MERCADO DE ERP, POR MODO DE IMPLEMENTACIÓN, 2018-2032 (MILES DE USD)
TABLA 637 NUEVA ZELANDA NUBE/MULTI NUBE EN EL MERCADO ERP, POR TIPO, 2018-2032 (MILES DE USD)
TABLA 638 MERCADO DE ERP MINORISTA DE NUEVA ZELANDA, POR APLICACIÓN, 2018-2032 (MILES DE USD)
TABLA 639 VENTAS MINORISTAS EN EL MERCADO DE ERP DE NUEVA ZELANDA, POR MODO DE IMPLEMENTACIÓN, 2018-2032 (MILES DE USD)
TABLA 640 NUEVA ZELANDA NUBE/MULTI NUBE EN EL MERCADO ERP, POR TIPO, 2018-2032 (MILES DE USD)
TABLA 641 MERCADO DE ERP BFSI DE NUEVA ZELANDA, POR APLICACIÓN, 2018-2032 (MILES DE USD)
TABLA 642 NUEVA ZELANDA BFSI EN EL MERCADO ERP, POR MODO DE IMPLEMENTACIÓN, 2018-2032 (MILES DE USD)
TABLA 643 NUEVA ZELANDA NUBE/MULTI NUBE EN EL MERCADO ERP, POR TIPO, 2018-2032 (MILES DE USD)
TABLA 644 MERCADO DE ERP DE SALUD DE NUEVA ZELANDA, POR APLICACIÓN, 2018-2032 (MILES DE USD)
TABLA 645 MERCADO DE ATENCIÓN MÉDICA EN ERP DE NUEVA ZELANDA, POR MODO DE IMPLEMENTACIÓN, 2018-2032 (MILES DE USD)
TABLA 646 NUEVA ZELANDA NUBE/MULTI NUBE EN EL MERCADO ERP, POR TIPO, 2018-2032 (MILES DE USD)
TABLA 647 MERCADO DE ERP DE TI Y TELECOMUNICACIONES DE NUEVA ZELANDA, POR APLICACIÓN, 2018-2032 (MILES DE USD)
TABLA 648 NUEVA ZELANDA TI Y TELECOMUNICACIONES EN EL MERCADO ERP, POR MODO DE IMPLEMENTACIÓN, 2018-2032 (MILES DE USD)
TABLA 649 NUEVA ZELANDA NUBE/MULTI NUBE EN EL MERCADO ERP, POR TIPO, 2018-2032 (MILES DE USD)
TABLA 650 MERCADO DE ERP DEL GOBIERNO DE NUEVA ZELANDA, POR APLICACIÓN, 2018-2032 (MILES DE USD)
TABLA 651 GOBIERNO DE NUEVA ZELANDA EN EL MERCADO DE ERP, POR MODO DE IMPLEMENTACIÓN, 2018-2032 (MILES DE USD)
TABLA 652 NUEVA ZELANDA NUBE/MULTI NUBE EN EL MERCADO ERP, POR TIPO, 2018-2032 (MILES DE USD)
TABLA 653 MERCADO DE ERP DE ENERGÍA Y SERVICIOS PÚBLICOS DE NUEVA ZELANDA, POR APLICACIÓN, 2018-2032 (MILES DE USD)
TABLA 654 ENERGÍA Y SERVICIOS PÚBLICOS DE NUEVA ZELANDA EN EL MERCADO DE ERP, POR MODO DE IMPLEMENTACIÓN, 2018-2032 (MILES DE USD)
TABLA 655 NUEVA ZELANDA NUBE/MULTI NUBE EN EL MERCADO ERP, POR TIPO, 2018-2032 (MILES DE USD)
TABLA 656 MERCADO DE ERP LOGÍSTICO DE NUEVA ZELANDA, POR APLICACIÓN, 2018-2032 (MILES DE USD)
TABLA 657 LOGÍSTICA DE NUEVA ZELANDA EN EL MERCADO DE ERP, POR MODO DE IMPLEMENTACIÓN, 2018-2032 (MILES DE USD)
TABLA 658 NUEVA ZELANDA NUBE/MULTI NUBE EN EL MERCADO ERP, POR TIPO, 2018-2032 (MILES DE USD)
TABLA 659 MERCADO DE ERP EDUCATIVO DE NUEVA ZELANDA, POR APLICACIÓN, 2018-2032 (MILES DE USD)
TABLA 660 MERCADO DE EDUCACIÓN EN ERP DE NUEVA ZELANDA, POR MODO DE IMPLEMENTACIÓN, 2018-2032 (MILES DE USD)
TABLA 661 NUEVA ZELANDA NUBE/MULTI NUBE EN EL MERCADO ERP, POR TIPO, 2018-2032 (MILES DE USD)
TABLA 662 MERCADO DE ERP AEROESPACIAL Y DE DEFENSA DE NUEVA ZELANDA, POR APLICACIÓN, 2018-2032 (MILES DE USD)
TABLA 663 NUEVA ZELANDA AEROESPACIAL Y DEFENSA EN EL MERCADO ERP, POR MODO DE IMPLEMENTACIÓN, 2018-2032 (MILES DE USD)
TABLA 664 NUEVA ZELANDA NUBE/MULTI NUBE EN EL MERCADO ERP, POR TIPO, 2018-2032 (MILES DE USD)
TABLA 665 NUEVA ZELANDA OTROS EN EL MERCADO DE ERP, POR MODO DE IMPLEMENTACIÓN, 2018-2032 (MILES DE USD)
TABLA 666 NUEVA ZELANDA NUBE/MULTI NUBE EN EL MERCADO ERP, POR TIPO, 2018-2032 (MILES DE USD)
TABLA 667 RESTO DEL MERCADO DE ERP DE ASIA-PACÍFICO, POR OFERTA, 2018-2032 (MILES DE USD)
Lista de figuras
FIGURA 1 MERCADO DE ERP DE ASIA-PACÍFICO: SEGMENTACIÓN
FIGURA 2 MERCADO DE ERP DE ASIA-PACÍFICO: TRIANGULACIÓN DE DATOS
FIGURA 3 MERCADO DE ERP DE ASIA-PACÍFICO: ANÁLISIS DROC
FIGURA 4 MERCADO DE ERP DE ASIA-PACÍFICO: ANÁLISIS GLOBAL VS. REGIONAL
FIGURA 5 MERCADO DE ERP DE ASIA-PACÍFICO: ANÁLISIS DE INVESTIGACIÓN DE EMPRESAS
FIGURA 6 MERCADO DE ERP DE ASIA-PACÍFICO: DATOS DEMOGRÁFICOS DE LAS ENTREVISTAS
FIGURA 7 MERCADO DE ERP DE ASIA-PACÍFICO: CUADRÍCULA DE POSICIÓN DE MERCADO DE DBMR
FIGURA 8 MERCADO ERP DE ASIA-PACÍFICO: ANÁLISIS DE LA PARTICIPACIÓN DE PROVEEDORES
FIGURA 9 MERCADO ERP DE ASIA-PACÍFICO: CUADRÍCULA DE COBERTURA DE USUARIOS FINALES DEL MERCADO
FIGURA 10 MERCADO DE ERP DE ASIA-PACÍFICO: SEGMENTACIÓN
FIGURA 11 RESUMEN EJECUTIVO
FIGURA 12 DOS SEGMENTOS COMPONEN EL MERCADO DE ERP DE ASIA-PACÍFICO, POR OFERTA (2024)
FIGURA 13 DECISIONES ESTRATÉGICAS
FIGURA 14 SE ESPERA QUE LA AUMENTO DE LA ADOPCIÓN DE ERP BASADO EN LA NUBE IMPULSÉ EL MERCADO DE ERP DE ASIA-PACÍFICO EN EL PERÍODO PRONOSTICADO DE 2025 A 2032
FIGURA 15 SE ESPERA QUE EL SEGMENTO DE SOLUCIONES REPRESENTE LA MAYOR PARTICIPACIÓN DEL MERCADO DE ERP DE ASIA-PACÍFICO EN 2025 Y 2032
FIGURA 16 ANÁLISIS DE LAS CINCO FUERZAS DE PORTER
FIGURA 17 IMPULSORES, RESTRICCIONES, OPORTUNIDADES Y DESAFÍOS DEL MERCADO DE ERP DE ASIA-PACÍFICO
FIGURA 18 MERCADO DE ERP DE ASIA-PACÍFICO: POR OFERTA, 2024
FIGURA 19 MERCADO DE ERP DE ASIA-PACÍFICO: POR MODO DE IMPLEMENTACIÓN, 2024
FIGURA 20 MERCADO DE ERP DE ASIA-PACÍFICO: POR TAMAÑO DE EMPRESA, 2024
FIGURA 21 MERCADO DE ERP DE ASIA-PACÍFICO: POR PRECIOS, 2024
FIGURA 22 MERCADO DE ERP DE ASIA-PACÍFICO: POR USUARIO FINAL, 2024
FIGURA 23 MERCADO DE ERP DE ASIA-PACÍFICO, INSTANTÁNEA (2024)
FIGURA 24 MERCADO DE ERP DE ASIA-PACÍFICO: PARTICIPACIÓN DE LA EMPRESA 2024 (%)
Metodología de investigación
La recopilación de datos y el análisis del año base se realizan utilizando módulos de recopilación de datos con muestras de gran tamaño. La etapa incluye la obtención de información de mercado o datos relacionados a través de varias fuentes y estrategias. Incluye el examen y la planificación de todos los datos adquiridos del pasado con antelación. Asimismo, abarca el examen de las inconsistencias de información observadas en diferentes fuentes de información. Los datos de mercado se analizan y estiman utilizando modelos estadísticos y coherentes de mercado. Además, el análisis de la participación de mercado y el análisis de tendencias clave son los principales factores de éxito en el informe de mercado. Para obtener más información, solicite una llamada de un analista o envíe su consulta.
La metodología de investigación clave utilizada por el equipo de investigación de DBMR es la triangulación de datos, que implica la extracción de datos, el análisis del impacto de las variables de datos en el mercado y la validación primaria (experto en la industria). Los modelos de datos incluyen cuadrícula de posicionamiento de proveedores, análisis de línea de tiempo de mercado, descripción general y guía del mercado, cuadrícula de posicionamiento de la empresa, análisis de patentes, análisis de precios, análisis de participación de mercado de la empresa, estándares de medición, análisis global versus regional y de participación de proveedores. Para obtener más información sobre la metodología de investigación, envíe una consulta para hablar con nuestros expertos de la industria.
Personalización disponible
Data Bridge Market Research es líder en investigación formativa avanzada. Nos enorgullecemos de brindar servicios a nuestros clientes existentes y nuevos con datos y análisis que coinciden y se adaptan a sus objetivos. El informe se puede personalizar para incluir análisis de tendencias de precios de marcas objetivo, comprensión del mercado de países adicionales (solicite la lista de países), datos de resultados de ensayos clínicos, revisión de literatura, análisis de mercado renovado y base de productos. El análisis de mercado de competidores objetivo se puede analizar desde análisis basados en tecnología hasta estrategias de cartera de mercado. Podemos agregar tantos competidores sobre los que necesite datos en el formato y estilo de datos que esté buscando. Nuestro equipo de analistas también puede proporcionarle datos en archivos de Excel sin procesar, tablas dinámicas (libro de datos) o puede ayudarlo a crear presentaciones a partir de los conjuntos de datos disponibles en el informe.

