Asia Pacific Plastic Compounding Market
Tamaño del mercado en miles de millones de dólares
Tasa de crecimiento anual compuesta (CAGR) :
% 
 USD
82.64 Billion
USD
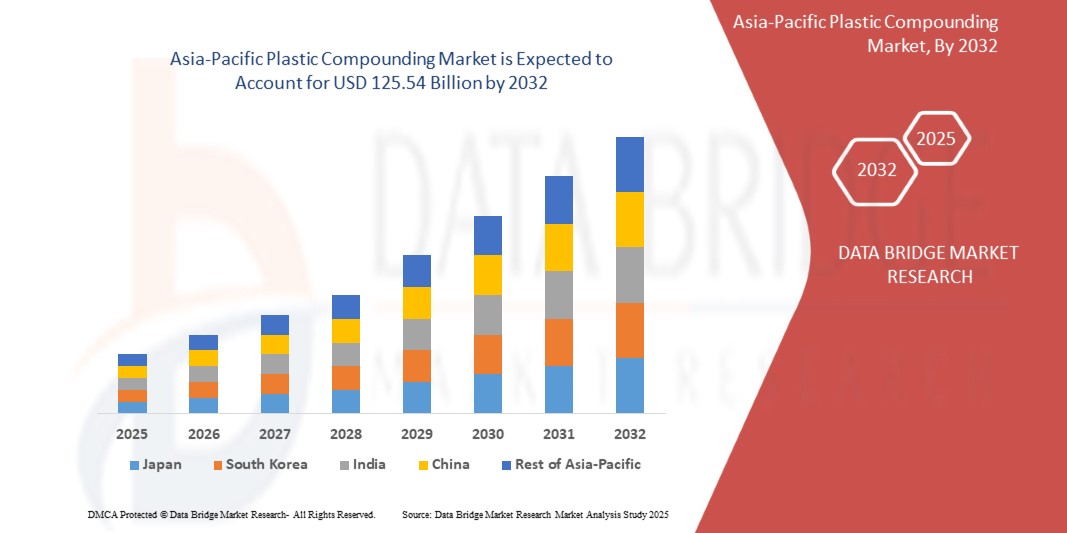
125.54 Billion
2024
2032
USD
82.64 Billion
USD
125.54 Billion
2024
2032
| 2025 –2032 | |
| USD 82.64 Billion | |
| USD 125.54 Billion | |
| % | |
|
Segmentación del mercado de compuestos plásticos en Asia-Pacífico por tipo de polímero (termoplásticos, termoestables, plásticos de ingeniería, bioplásticos, etc.), tipo de relleno (rellenos minerales, refuerzos, aditivos, etc.), proceso de fabricación (extrusión, compactación/prensado, amasadora/mezcla Banbury, compuestos por moldeo por inyección, etc.), propiedades (resistencia, durabilidad, flexibilidad, resistencia al impacto, rigidez, etc.), aplicación (aeroespacial y defensa, embalaje, electricidad y electrónica, energía, construcción, automoción, dispositivos médicos, mobiliario, etc.): tendencias y pronóstico del sector hasta 2032.
Tamaño del mercado de compuestos plásticos de Asia-Pacífico
- El tamaño del mercado de compuestos plásticos de Asia-Pacífico se valoró en USD 82,64 mil millones en 2024 y se espera que alcance los USD 125,54 mil millones para 2032 , con una CAGR de 5,41% durante el período de pronóstico mediante el cambio hacia compuestos plásticos reciclables y biodegradables debido a las regulaciones ambientales, los avances en las tecnologías de compuestos que mejoran el rendimiento y la rentabilidad de los productos y las políticas e iniciativas gubernamentales de apoyo que promueven el uso de plásticos en varias industrias.
- Además, se espera que el mercado aumente el uso de bioplásticos y alternativas de compuestos sostenibles, el aumento en la adopción de vehículos eléctricos que requieren polímeros avanzados y la creciente demanda de soluciones plásticas reciclables y circulares.
Análisis del mercado de compuestos plásticos de Asia-Pacífico
- El aumento global en el cambio hacia compuestos plásticos reciclables y biodegradables debido a las regulaciones ambientales, los avances en las tecnologías de compuestos que mejoran el rendimiento del producto y la rentabilidad.
- Los factores clave incluyen el aumento global en el cambio hacia compuestos plásticos reciclables y biodegradables debido a las regulaciones ambientales, los avances en tecnologías de compuestos que mejoran el rendimiento y la rentabilidad de los productos, la creciente demanda de los sectores de transmisión de energía y el aumento de las inversiones en la modernización de la red y la infraestructura transfronteriza.
- China domina el mercado de compuestos plásticos de Asia y el Pacífico, con la mayor participación en los ingresos del 23,14 % en 2024, atribuido a fuertes capacidades de fabricación, infraestructura avanzada de I+D y creciente adopción de plásticos de alto rendimiento en los sectores automotriz, aeroespacial y eléctrico.
- El segmento de termoplásticos domina el mercado con una participación de mercado del 65,47 % en 2024, creciendo con una CAGR del 5,12 % en el período de pronóstico de 2025 a 2032. Impulsado por la creciente demanda de propiedades de materiales mejoradas, rentabilidad y una mayor adopción en diversas aplicaciones industriales.
Alcance del informe y segmentación del mercado de compuestos plásticos en Asia-Pacífico
|
Atributos |
Perspectivas clave del mercado de compuestos plásticos en Asia-Pacífico |
|
Segmentos cubiertos |
|
|
Países cubiertos |
Asia-Pacífico
|
|
Actores clave del mercado |
|
|
Oportunidades de mercado |
|
|
Conjuntos de información de datos de valor añadido |
Además de los conocimientos sobre escenarios de mercado como valor de mercado, tasa de crecimiento, segmentación, cobertura geográfica y actores principales, los informes de mercado seleccionados por Data Bridge Market Research también incluyen análisis de importación y exportación, descripción general de la capacidad de producción, análisis del consumo de producción, análisis de tendencias de precios, escenario de cambio climático, análisis de la cadena de suministro, análisis de la cadena de valor, descripción general de materias primas/consumibles, criterios de selección de proveedores, análisis PESTLE, análisis de Porter y marco regulatorio. |
Tendencias del mercado de compuestos plásticos en Asia-Pacífico
Creciente demanda de plásticos de alto rendimiento
- La demanda de compuestos plásticos de alto rendimiento está creciendo rápidamente, impulsada por la creciente urbanización, la actividad industrial y el creciente uso de vehículos eléctricos e infraestructuras inteligentes. Los compuestos plásticos avanzados abordan estos desafíos ofreciendo mayor durabilidad, eficiencia energética y un rendimiento superior del producto.
- A medida que los países se centran en reducir las emisiones de carbono y mejorar la estabilidad de la red eléctrica, se observa una tendencia creciente hacia la modernización de la infraestructura eléctrica mediante el uso de compuestos plásticos innovadores. Esta transición es crucial para satisfacer la creciente demanda de electricidad, a la vez que se promueven sistemas de transmisión más limpios y eficientes.
- Los principales actores de la industria, como Covestro, LyondellBasell y BASF, están aumentando significativamente sus esfuerzos de I+D para desarrollar compuestos plásticos de próxima generación que sean más sostenibles, flexibles y de alto rendimiento, impulsando aún más la innovación y el crecimiento del mercado.
- Los avances en la tecnología de compuestos plásticos, caracterizados por una mejor estabilidad térmica, aislamiento eléctrico y resistencia mecánica, impulsan el crecimiento del mercado. Los principales fabricantes desarrollan activamente compuestos especializados para apoyar la integración de energías renovables a gran escala y mejorar la infraestructura energética interregional, impulsando la expansión del mercado global de compuestos plásticos en Asia-Pacífico.
Dinámica del mercado de compuestos plásticos en Asia-Pacífico
Conductor
Cambio hacia compuestos plásticos reciclables y biodegradables debido a las regulaciones ambientales
- La creciente demanda mundial de materiales sostenibles, impulsada por estrictas regulaciones ambientales, la creciente concienciación de los consumidores y los objetivos de sostenibilidad de las empresas, está ejerciendo una enorme presión sobre los métodos tradicionales de producción de plástico. Para afrontar este desafío, muchos fabricantes están acelerando las inversiones en compuestos plásticos reciclables y biodegradables para reducir el impacto ambiental y apoyar iniciativas de economía circular. Estos avances están creando soluciones de materiales más ecológicas, eficientes y preparadas para el futuro, de forma similar a cómo las tecnologías de eficiencia energética optimizan el uso de recursos.
- Por ejemplo, en 2024, varias importantes empresas químicas anunciaron proyectos a gran escala centrados en ampliar la capacidad de fabricación de compuestos de plásticos biodegradables, con el objetivo de satisfacer la creciente demanda de los sectores del embalaje, la automoción y los bienes de consumo. Estas iniciativas se centran en reducir los residuos plásticos, mejorar la reciclabilidad y cumplir con los marcos regulatorios globales, como el Plan de Acción para la Economía Circular de la UE.
- Estas inversiones no solo están transformando las formulaciones de materiales, sino que también permiten una mayor adopción de plásticos sostenibles en todas las industrias. Empresas líderes como BASF, Covestro y LyondellBasell están invirtiendo fuertemente en I+D para desarrollar compuestos plásticos de origen biológico y reciclables de nueva generación, garantizando un mejor rendimiento y cumplimiento ambiental.
- Además, el compromiso continuo de gobiernos, empresas privadas y organismos reguladores desempeña un papel fundamental en la promoción de plásticos reciclables y biodegradables como componente esencial de las iniciativas globales de sostenibilidad. Estas iniciativas están consolidando los compuestos plásticos ecológicos como un factor clave de la economía circular y un importante motor de crecimiento en el mercado global de compuestos plásticos de Asia-Pacífico.
Restricción/Desafío
Volatilidad en los precios de las materias primas, especialmente las derivadas del petróleo, como el polipropileno y el polietileno
- La volatilidad de los precios de las materias primas, en particular las derivadas del petróleo, como el polipropileno y el polietileno, sigue siendo un obstáculo importante para el mercado de compuestos plásticos de Asia-Pacífico. La fluctuación de los precios afecta los costos de producción y la rentabilidad, generando incertidumbre tanto para fabricantes como para usuarios finales.
- Además, la dependencia de los mercados de petróleo crudo expone a la industria de compuestos a tensiones geopolíticas, interrupciones en la cadena de suministro y políticas comerciales cambiantes, que pueden conducir a picos repentinos de precios o escasez.
- Por ejemplo, a principios de 2025, las fluctuaciones del precio mundial del petróleo crudo provocaron que los precios del polipropileno variaran más de un 20% en cuestión de meses, lo que afectó directamente los costos de insumos de los fabricantes de compuestos plásticos y obligó a realizar ajustes en las estrategias de precios.
- Además, las materias primas alternativas, como las materias primas de origen biológico, si bien son prometedoras, actualmente están limitadas por los mayores costos y los desafíos de escalabilidad, lo que impide mitigar por completo la volatilidad de los precios del petróleo.
- Esta inestabilidad de precios plantea desafíos para la planificación y la inversión a largo plazo en el sector de compuestos plásticos, especialmente para los pequeños fabricantes y las regiones con menor resiliencia financiera. A pesar de los esfuerzos por diversificar las fuentes de materias primas y mejorar la flexibilidad de la cadena de suministro, la volatilidad de los precios de las materias primas sigue siendo un obstáculo clave para un crecimiento estable.
Alcance del mercado de compuestos plásticos de Asia-Pacífico
El mercado está segmentado según el tipo de polímero, tipo de relleno, proceso de fabricación, propiedades y aplicación.
- Tipo de polímero
Según el tipo de polímero, el mercado se segmenta en termoplásticos, plásticos termoestables, plásticos de ingeniería, bioplásticos y otros. En 2025, se prevé que el segmento de termoplásticos domine el mercado con una cuota de mercado del 65,30 %, con una tasa de crecimiento anual compuesta (TCAC) del 5,12 % entre 2025 y 2032, impulsada por la creciente demanda de materiales ligeros y duraderos en todas las industrias y un mayor enfoque en compuestos plásticos reciclables y sostenibles.
- Tipo de relleno
Según el tipo de relleno, el mercado se segmenta en rellenos minerales, refuerzos, aditivos y otros. En 2025, se prevé que el segmento de rellenos minerales domine el mercado con una cuota de mercado del 52,95 %, con una tasa de crecimiento anual compuesta (TCAC) del 5,87 % entre 2025 y 2032, impulsada por la creciente demanda de mejores propiedades de los materiales, la rentabilidad y su creciente adopción en diversas aplicaciones industriales.
- Proceso de fabricación
Según el proceso de fabricación, el mercado se segmenta en extrusión, compactación/prensado, amasadora/mezcla Banbury, compuestos basados en moldeo por inyección, entre otros. En 2025, se prevé que el segmento de extrusión domine el mercado con una cuota de mercado del 49,59 %, con una tasa de crecimiento anual compuesta (TCAC) del 5,62 % durante el período de pronóstico de 2025 a 2032, impulsada por su adopción generalizada para un compuesto eficiente y continuo, y la creciente demanda de compuestos plásticos de alta calidad en diversas industrias.
- Propiedades
Según sus propiedades, el mercado se segmenta en resistencia, durabilidad, flexibilidad, resistencia al impacto, rigidez, entre otras. En 2025, se prevé que el segmento de resistencia domine el mercado con una cuota de mercado del 35,12 %, con una tasa de crecimiento anual compuesta (TCAC) del 5,75 % entre 2025 y 2032, impulsada por la creciente demanda de compuestos plásticos duraderos y de alto rendimiento en las industrias automotriz, de construcción y de bienes de consumo.
- Solicitud
Según su aplicación, el mercado se segmenta en aeroespacial y defensa, embalaje, electricidad y electrónica, energía y electricidad, construcción, automoción, dispositivos médicos, mobiliario, entre otros. En 2025, se prevé que el segmento automotriz domine el mercado con una cuota de mercado del 34,06 %, con una tasa de crecimiento anual compuesta (TCAC) del 4,77 % entre 2025 y 2032, impulsada por la creciente demanda de compuestos plásticos ligeros, duraderos y reciclables para mejorar la eficiencia del combustible y cumplir con las estrictas normativas ambientales.
Análisis regional del mercado de compuestos plásticos de Asia-Pacífico
- Se espera que el mercado de compuestos plásticos de Asia-Pacífico alcance los USD 125,54 mil millones para 2032, desde USD 82,64 mil millones en 2024, creciendo a una CAGR del 5,41% en el período de pronóstico de 2025 a 2032.
- Asia-Pacífico destina una parte significativa de su PIB a la manufactura y el desarrollo industrial, lo que garantiza una sólida financiación para materiales avanzados y tecnologías innovadoras de compuestos plásticos. En cambio, los mercados emergentes están incrementando sus inversiones en compuestos plásticos, impulsados por la creciente industrialización, la urbanización y la creciente demanda de materiales sostenibles y de alto rendimiento. La disponibilidad de financiación, tanto del sector público como del privado, desempeña un papel crucial en la expansión de la capacidad de producción y la adopción de compuestos plásticos avanzados a nivel mundial.
- En Asia Pacífico, las tecnologías avanzadas de compuestos plásticos se adoptan e integran ampliamente en diversas aplicaciones industriales, impulsando sectores como el automotriz, el aeroespacial y el electrónico. Por el contrario, los mercados emergentes con infraestructura de fabricación en desarrollo experimentan un rápido crecimiento de la demanda de compuestos plásticos especializados, impulsado por la expansión de las bases industriales y el aumento de las necesidades en los sectores de la salud, la automoción y el embalaje. A medida que estos sistemas sanitarios e industriales se centralizan o privatizan, a menudo se produce un aumento de la inversión en tecnologías de vanguardia para compuestos plásticos, lo que promueve el crecimiento del mercado y la accesibilidad.
Análisis del mercado de compuestos plásticos de China y Asia-Pacífico
Se espera que China registre una CAGR del 6,26 % entre 2025 y 2032 en la región Asia-Pacífico, impulsada por la creciente demanda de mejores propiedades de los materiales, mayor rentabilidad y una mayor adopción en diversas aplicaciones industriales.
Perspectiva del mercado de compuestos plásticos de la India y Asia-Pacífico
Se espera que India registre una CAGR del 5,73 % entre 2025 y 2032, impulsada por la creciente demanda de materiales livianos y duraderos en todas las industrias y un enfoque cada vez mayor en compuestos plásticos reciclables y sostenibles.
Cuota de mercado de compuestos plásticos en Asia-Pacífico
El mercado de compuestos plásticos de Asia-Pacífico está liderado principalmente por empresas bien establecidas, entre las que se incluyen:
- LyondellBasell Industries Holdings BV (EE. UU.)
- BASF (Alemania)
- LG Chem (Corea del Sur)
- Dow (EE.UU.)
- SABIC (Arabia Saudita)
- Covestro AG (Alemania)
- Teknor Apex (EE. UU.)
- LANXESS (Alemania)
- Corporación Celanese (EE. UU.)
- Borealis GmbH (Austria)
- Asahi Kasei Corp. (Japón)
- Mitsubishi Chemical Group Corporation (Japón)
- DuPont (EE. UU.)
- Corporación Avient (EE. UU.)
- CHIMEI (Taiwán)
- INEOS (Reino Unido)
- Ciencia Kingfa. Y tecnología. Co., Ltd (China)
- Washington Penn (EE. UU.)
- Compañía RTP (EE. UU.)
- Syensqo (Bélgica)
- Envalior (Alemania)
- Arkema (Francia)
- Trinseo (Estados Unidos)
- Daicel Corporation (Japón)
- KANEKA CORPORATION (Japón)
- TORAY INDUSTRIES, INC. (Japón)
- Mitsui Chemicals, Inc. (Japón)
- Ensinger (Alemania)
- SCG (Tailandia)
- CLARIANT (Suiza)
Últimos avances en el mercado de compuestos plásticos de Asia-Pacífico
- En junio de 2025, Envalior, en colaboración con SENTImotion y Frencken Group, anunció una innovación de producto que consiste en un nuevo concepto de caja de engranajes para brazos robóticos, fabricado con plástico de ingeniería Stanyl PA46. Este desarrollo permite cajas de engranajes un 50 % más ligeras y rentables que las alternativas metálicas, lo que facilita la producción a gran escala de robots ligeros y energéticamente eficientes. Esta innovación beneficia significativamente a Envalior, ya que amplía su presencia en los sectores de la robótica y la movilidad, abriendo nuevas oportunidades de crecimiento en la automatización industrial y de consumo.
- En mayo de 2024, Envalior anunció su participación en la conferencia SKZ "Plásticos en aplicaciones de ingeniería eléctrica y eléctrica", donde presentó innovaciones de producto, como compuestos sostenibles de poliamida 6 y un nuevo PBT ignífugo sin halógenos (p. ej., Pocan BFN4221Z). Este desarrollo se centra en ampliar la cartera de plásticos de ingeniería de Envalior con una mayor proporción de materias primas sostenibles, lo que permite a los clientes reducir su huella de carbono y su dependencia de insumos fósiles. Los materiales destacados ofrecen un rendimiento mecánico mejorado y una mayor resistencia al fuego, lo que posiciona a Envalior para satisfacer mejor la creciente demanda en sectores como la electromovilidad, el 5G y los sistemas autónomos, a la vez que refuerza su liderazgo en termoplásticos sostenibles.
- En julio de 2025, Arkema lanzó Zenimid, una nueva marca para su gama de poliimidas de ultraalto rendimiento, lo que marca un desarrollo estratégico de producto. Esta innovación enriquece la cartera de materiales especiales de Arkema, satisfaciendo sectores de alta demanda como el aeroespacial, la electrónica y la automoción. Con una excepcional resistencia térmica, mecánica y química, Zenimid impulsa el crecimiento de la empresa en aplicaciones avanzadas. Este lanzamiento refuerza la posición de Arkema en el mercado de polímeros de alto rendimiento.
- En junio de 2025, Trinseo presentó LIGOS A9615, un nuevo adhesivo acrílico diseñado para el segmento de etiquetas de uso general (GPL), lanzado el 9 de junio de 2025, dirigido a etiquetas de película en el mercado del sudeste asiático. Este desarrollo representa un lanzamiento estratégico que refuerza la fortaleza de Trinseo en innovación adhesiva. Entre sus principales ventajas se incluyen una excelente resistencia al envejecimiento, una removibilidad limpia con capacidad de reposicionamiento y resistencia a los plastificantes, lo que permite una adhesión fiable incluso en superficies curvas de PVC, comunes en bienes de consumo y aplicaciones de embalaje.
- En febrero de 2025, Trinseo anunció el lanzamiento del primer producto de resina de poliestireno (rPS) transparente y reciclado por disolución en Europa, específicamente aprobado para el contacto directo con alimentos y que cumple oficialmente con el Reglamento (UE) 2022/1616. Este hito regulatorio se produjo tras extensas pruebas, incluyendo una "Prueba de Desafío" realizada con el Instituto Fraunhofer para validar la eficacia de la descontaminación y el cumplimiento de la seguridad alimentaria de la resina final. Producida en las instalaciones de Trinseo en Schkopau y con aproximadamente un 30 % de contenido reciclado, la nueva resina rPS ofrece una reducción de la huella de carbono de aproximadamente el 18 % en comparación con el poliestireno virgen. Para Trinseo, este desarrollo representa un avance estratégico en sostenibilidad, que permite a la empresa satisfacer la creciente demanda de soluciones de materiales circulares y respaldar los objetivos de contenido reciclado de sus clientes.
SKU-
Obtenga acceso en línea al informe sobre la primera nube de inteligencia de mercado del mundo

- Panel de análisis de datos interactivo
- Panel de análisis de empresas para oportunidades con alto potencial de crecimiento
- Acceso de analista de investigación para personalización y consultas
- Análisis de la competencia con panel interactivo
- Últimas noticias, actualizaciones y análisis de tendencias
- Aproveche el poder del análisis de referencia para un seguimiento integral de la competencia
Tabla de contenido
1 INTRODUCCIÓN
1.1 OBJETIVOS DEL ESTUDIO
1.2 DEFINICIÓN DE MERCADO
1.3 INFORMACIÓN GENERAL
1.4 LIMITACIONES
1.5 MERCADOS CUBIERTOS
2 SEGMENTACIÓN DEL MERCADO
2.1 MERCADOS CUBIERTOS
2.2 ÁMBITO GEOGRÁFICO
2,3 AÑOS CONSIDERADOS PARA EL ESTUDIO
2.4 MONEDA Y PRECIOS
2.5 MODELO DE VALIDACIÓN DE DATOS TRÍPODE DBMR
2.6 MODELADO MULTIVARIADO
2.7 ENTREVISTAS PRINCIPALES CON LÍDERES DE OPINIÓN CLAVE
2.8 CUADRÍCULA DE POSICIÓN DE MERCADO DBMR
2.9 CUADRÍCULA DE COBERTURA DE APLICACIONES DEL MERCADO
2.1 FUENTES SECUNDARIAS
2.11 SUPUESTOS
3 RESUMEN EJECUTIVO
4 INFORMACIÓN PREMIUM
4.1 ANÁLISIS DE LAS CINCO FUERZAS DE PORTER
4.1.1 AMENAZA DE NUEVOS ENTRANTES
4.1.2 PODER DE NEGOCIACIÓN DE LOS PROVEEDORES
4.1.3 PODER DE NEGOCIACIÓN DE LOS COMPRADORES
4.1.4 AMENAZA DE SUSTITUTOS
4.1.5 COMPETENCIA INTERNA
4.2 SEGUIMIENTO DE INNOVACIÓN Y ANÁLISIS ESTRATÉGICO
4.2.1 ANÁLISIS DE GRANDES ACUERDOS Y ALIANZAS ESTRATÉGICAS
4.2.1.1 EMPRESAS CONJUNTAS
4.2.1.2 FUSIONES Y ADQUISICIONES
4.2.1.3 LICENCIAS Y ASOCIACIONES
4.2.1.4 COLABORACIONES TECNOLÓGICAS
4.2.1.5 DESINVERSIONES ESTRATÉGICAS
4.2.2 NÚMERO DE PRODUCTOS EN DESARROLLO
4.2.3 ETAPA DE DESARROLLO
4.2.4 CRONOGRAMAS E HITOS
4.2.5 ESTRATEGIAS Y METODOLOGÍAS DE INNOVACIÓN
4.2.6 EVALUACIÓN Y MITIGACIÓN DE RIESGOS
4.2.7 PERSPECTIVAS FUTURAS
4.3 ANÁLISIS DE LA CADENA DE VALOR
4.4 ESCENARIO DE IMPORTACIÓN Y EXPORTACIÓN
4.5 CAPACIDAD DE PRODUCCIÓN PARA LOS MEJORES FABRICANTES
4.6 PERSPECTIVA DE LA MARCA
4.7 COMPORTAMIENTO DE COMPRA DEL CONSUMIDOR
4.8 BASE DE DATOS DE LAS FABRICANTES DE MEZCLAS Y LOS EQUIPOS QUE UTILIZAN
4.9 ANÁLISIS DE PATENTES
4.9.1 CALIDAD Y RESISTENCIA DE LA PATENTE
4.9.2 FAMILIAS DE PATENTES
4.9.3 LICENCIAS Y COLABORACIONES
4.9.4 PANORAMA DE PATENTES DE LA REGIÓN
4.9.5 ESTRATEGIA Y GESTIÓN DE LA PROPIEDAD INTELECTUAL
4.1 COBERTURA DE MATERIA PRIMA
4.11 ANÁLISIS DE LA CADENA DE SUMINISTRO DEL MERCADO DE COMPUESTOS PLÁSTICOS DE ASIA-PACÍFICO
4.11.1 DESCRIPCIÓN GENERAL
4.11.2 ESCENARIOS DE COSTOS LOGÍSTICOS
4.11.3 IMPORTANCIA DE LOS PROVEEDORES DE SERVICIOS LOGÍSTICOS (PSL)
4.12 AVANCES TECNOLÓGICOS EN EL MERCADO DE COMPUESTOS PLÁSTICOS DE ASIA-PACÍFICO
4.12.1 IA Y OPTIMIZACIÓN DE PROCESOS DIGITALES
4.12.2 TECNOLOGÍAS AVANZADAS DE EXTRUSIÓN Y MANEJO DE MATERIALES
4.12.3 COMPUESTOS POLIMÉRICOS FUNCIONALIZADOS Y DE BASE BIOLÓGICA
4.12.4 SOLUCIONES DE COMPUESTOS INTELIGENTES Y CON EFICACIA
4.12.5 AUTOMATIZACIÓN E INDUSTRIA 4.0 EN OPERACIONES DE COMPUESTO
4.12.6 INNOVACIONES EN SOSTENIBILIDAD Y ECONOMÍA CIRCULAR
4.12.7 PLATAFORMAS DE FORMULACIÓN Y PARTICIPACIÓN DEL CLIENTE DIGITAL
4.13 CRITERIOS DE SELECCIÓN DE PROVEEDORES
4.14 CUADRANTE DE EVALUACIÓN DE LA EMPRESA
4.15 ANÁLISIS DE PRECIOS
5. EL PAPEL DE LOS ARANCELES EN EL MERCADO DE COMPUESTOS PLÁSTICOS DE ASIA-PACÍFICO
5.1 PANORAMA ARANCELARIO: ARANCELES SOBRE POLÍMEROS, ADITIVOS Y MAQUINARIA
5.2 IMPACTO DE LOS ARANCELES EN LAS ESTRUCTURAS DE COSTOS Y LA DINÁMICA DE LA CADENA DE SUMINISTRO
5.3 INFLUENCIA DE LOS ACUERDOS COMERCIALES Y LAS POLÍTICAS REGULADORAS
5.4 TENDENCIAS DEL MERCADO QUE AMPLIFICAN LOS IMPACTOS ARANCELARIOS
5.5 IMPLICACIONES COMPETITIVAS PARA LOS PARTICIPANTES DE LA INDUSTRIA
5.6 RETOS Y OPORTUNIDADES DERIVADOS DE LOS ARANCELES
5.7 EMPRESAS CLAVE Y RESUMEN DE LA ESTRATEGIA TARIFARIA
6 COBERTURA REGLAMENTARIA: MERCADO DE COMPUESTOS PLÁSTICOS DE ASIA-PACÍFICO
7 DESCRIPCIÓN GENERAL DEL MERCADO
7.1 CONTROLADORES
7.1.1 CAMBIO HACIA COMPUESTOS PLÁSTICOS RECICLABLES Y BIODEGRADABLES DEBIDO A LAS REGULACIONES AMBIENTALES
7.1.2 AVANCES EN TECNOLOGÍAS DE COMPUESTOS QUE MEJORAN EL RENDIMIENTO DEL PRODUCTO Y LA RENTABLE EFICIENCIA
7.1.3 DESARROLLO DE PLÁSTICOS NANOCOMPUESTOS QUE OFRECEN PROPIEDADES MECÁNICAS Y DE BARRERA SUPERIORES
7.1.4 AUMENTO DEL USO DE PLÁSTICOS COMPUESTOS EN DISPOSITIVOS MÉDICOS DEBIDO A LA BIOCOPATIBILIDAD Y LA COMPATIBILIDAD DE ESTERILIZACIÓN
7.2 RESTRICCIONES
7.2.1 VOLATILIDAD EN LOS PRECIOS DE LAS MATERIAS PRIMAS, ESPECIALMENTE LAS MATERIAS PRIMAS A BASE DE PETRÓLEO, COMO EL POLIPROPILENO Y EL POLIETILENO
7.2.2 PROCESOS DE RECICLAJE COMPLEJOS Y FALTA DE INFRAESTRUCTURA ADECUADA PARA LA GESTIÓN DE RESIDUOS COMPUESTOS DE PLÁSTICO
7.3 OPORTUNIDADES
7.3.1 USO CRECIENTE DE BIOPLÁSTICOS Y ALTERNATIVAS DE COMPUESTOS SOSTENIBLES
7.3.2 AUMENTO EN LA ADOPCIÓN DE VEHÍCULOS ELÉCTRICOS QUE REQUIEREN POLÍMEROS AVANZADOS
7.3.3 AUMENTO DE LA DEMANDA DE SOLUCIONES DE PLÁSTICO RECICLABLES Y CIRCULARES
7.4 DESAFÍOS
7.4.1 LIMITACIONES DE RENDIMIENTO DE LAS ALTERNATIVAS SOSTENIBLES
7.4.2 FRAGMENTACIÓN REGLAMENTARIA Y DE NORMAS ENTRE REGIONES
8 MERCADO DE COMPUESTOS PLÁSTICOS DE ASIA-PACÍFICO, POR TIPO DE POLÍMERO
8.1 DESCRIPCIÓN GENERAL
8.2 TERMOPLÁSTICOS
8.2.1 TERMOPLÁSTICOS, POR TIPO
8.2.2 POLIETILENO (PE), POR TIPO
8.3 PLÁSTICOS DE INGENIERÍA
8.3.1 PLÁSTICOS DE INGENIERÍA, POR TIPO
8.4 PLÁSTICOS TERMOESTABLECIDOS
8.4.1 PLÁSTICOS TERMOESTABLECIDOS, POR TIPO
8.5 BIOPLÁSTICOS
8.5.1 BIOPLÁSTICOS, POR TIPO
8.6 OTROS
9 MERCADO DE COMPUESTOS PLÁSTICOS DE ASIA-PACÍFICO, POR TIPO DE RELLENO
9.1 INFORMACIÓN GENERAL
9.2 RELLENOS MINERALES
9.2.1 RELLENOS MINERALES, POR TIPO
9.3 REFUERZOS
9.3.1 REFUERZOS, POR TIPO
9.4 ADITIVOS
9.4.1 ADITIVOS, POR TIPO
9.5 OTROS
10 MERCADO DE COMPUESTOS PLÁSTICOS DE ASIA-PACÍFICO, POR PROCESO DE FABRICACIÓN
10.1 INFORMACIÓN GENERAL
10.2 EXTRUSIÓN
10.2.1 EXTRUSIÓN, POR TIPO
10.2.2 EXTRUSIÓN, POR SISTEMA DE PELETIZACIÓN
10.3 COMPUESTOS BASADOS EN MOLDEO POR INYECCIÓN
10.3.1 COMPUESTO BASADO EN MOLDEO POR INYECCIÓN, MEDIANTE SISTEMA DE PELETIZACIÓN
10.4 COMPACTACIÓN/PRESIONADO
10.4.1 COMPACTACIÓN/PRESIONADO, MEDIANTE SISTEMA DE PELETIZACIÓN
10.5 AMASADORA/MEZCLA BANBURY
10.5.1 MEZCLA AMASADORA/BANBURY, MEDIANTE SISTEMA DE PELETIZACIÓN
10.6 OTROS
11 MERCADO DE COMPUESTOS PLÁSTICOS DE ASIA-PACÍFICO, POR PROPIEDADES
11.1 INFORMACIÓN GENERAL
11.2 RESISTENCIA
11.3 DURABILIDAD
11.4 FLEXIBILIDAD
11.5 RESISTENCIA AL IMPACTO
11.6 RIGIDEZ
11.7 OTROS
12 MERCADO DE COMPUESTOS PLÁSTICOS DE ASIA-PACÍFICO, POR APLICACIÓN
12.1 INFORMACIÓN GENERAL
12.2 AUTOMOTRIZ
12.2.1 AUTOMOTRIZ, POR CATEGORÍA
12.2.1.1 COMPONENTES INTERIORES, POR TIPO
12.2.1.2 PARTES EXTERIORES DE LA CARROCERÍA, POR TIPO
12.2.1.3 APLICACIONES BAJO EL CAPÓ, POR TIPO
12.3 EMBALAJE
12.3.1 EMBALAJE, POR CATEGORÍA
12.3.1.1 ENVASES DE ALIMENTOS Y BEBIDAS, POR TIPO
12.3.1.2 ENVASES INDUSTRIALES, POR TIPO
12.3.1.3 EMBALAJE DE BIENES DE CONSUMO, POR TIPO
12.4 EDIFICACIÓN Y CONSTRUCCIÓN
12.4.1 EDIFICACIÓN Y CONSTRUCCIÓN, POR CATEGORÍA
12.5 ELECTRICIDAD Y ELECTRÓNICA
12.5.1 ELECTRICIDAD Y ELECTRÓNICA, POR CATEGORÍA
12.6 DISPOSITIVOS MÉDICOS
12.6.1 DISPOSITIVOS MÉDICOS, POR CATEGORÍA
12.7 MUEBLES
12.7.1 MUEBLES, POR CATEGORÍA
12.8 ENERGÍA Y POTENCIA
12.8.1 ENERGÍA Y POTENCIA, POR CATEGORÍA
12.9 AEROESPACIAL Y DEFENSA
12.9.1 AEROESPACIAL Y DEFENSA, POR CATEGORÍA
12.1 OTROS
13 MERCADO DE COMPUESTOS PLÁSTICOS DE ASIA-PACÍFICO POR PAÍSES
13.1 ASIA-PACÍFICO
13.1.1 CHINA
13.1.2 INDIA
13.1.3 JAPÓN
13.1.4 COREA DEL SUR
13.1.5 TAILANDIA
13.1.6 SINGAPUR
13.1.7 INDONESIA
13.1.8 AUSTRALIA
13.1.9 NUEVA ZELANDA
13.1.10 FILIPINAS
13.1.11 MALASIA
13.1.12 TAIWÁN
13.1.13 HONG KONG
13.1.14 RESTO DE ASIA-PACÍFICO
14 MERCADO DE COMPUESTOS PLÁSTICOS DE ASIA-PACÍFICO: PANORAMA EMPRESARIAL
14.1 ANÁLISIS DE ACCIONES DE LA EMPRESA: ASIA-PACÍFICO
15 ANÁLISIS FODA
16 PERFILES DE EMPRESAS
16.1 SABIC
16.1.1 INSTANTÁNEA DE LA EMPRESA
16.1.2 ANÁLISIS DE INGRESOS
16.1.3 ANÁLISIS DE LAS ACCIONES DE LA EMPRESA
16.1.4 PORTAFOLIO DE PRODUCTOS
16.1.5 DESARROLLO RECIENTE
16.2 LYONDELLBASELL INDUSTRIES HOLDINGS BV
16.2.1 INSTANTÁNEA DE LA EMPRESA
16.2.2 ANÁLISIS DE INGRESOS
16.2.3 ANÁLISIS DE LAS ACCIONES DE LA EMPRESA
16.2.4 PORTAFOLIO DE PRODUCTOS
16.2.5 DESARROLLOS/NOTICIAS RECIENTES
16.3 DOW
16.3.1 INSTANTÁNEA DE LA EMPRESA
16.3.2 ANÁLISIS DE INGRESOS
16.3.3 ANÁLISIS DE LAS ACCIONES DE LA EMPRESA
16.3.4 PORTAFOLIO DE PRODUCTOS
16.3.5 DESARROLLO RECIENTE
16.4 DUPONT
16.4.1 INSTANTÁNEA DE LA EMPRESA
16.4.2 ANÁLISIS DE INGRESOS
16.4.3 ANÁLISIS DE LAS ACCIONES DE LA EMPRESA
16.4.4 PORTAFOLIO DE PRODUCTOS
16.4.5 DESARROLLO RECIENTE
16.5 ARKEMA
16.5.1 INSTANTÁNEA DE LA EMPRESA
16.5.2 ANÁLISIS DE INGRESOS
16.5.3 ANÁLISIS DE LAS ACCIONES DE LA EMPRESA
16.5.4 PORTAFOLIO DE PRODUCTOS
16.5.5 DESARROLLOS RECIENTES
16.6 ASAHI KASEI CORP.
16.6.1 INSTANTÁNEA DE LA EMPRESA
16.6.2 ANÁLISIS DE INGRESOS
16.6.3 PORTAFOLIO DE PRODUCTOS
16.6.4 DESARROLLO RECIENTE
16.7 CORPORACIÓN AVIENT
16.7.1 INSTANTÁNEA DE LA EMPRESA
16.7.2 ANÁLISIS DE INGRESOS
16.7.3 PORTAFOLIO DE PRODUCTOS
16.7.4 DESARROLLO RECIENTE
16.8 BOREALIS GMBH
16.8.1 INSTANTÁNEA DE LA EMPRESA
16.8.2 PORTAFOLIO DE PRODUCTOS
16.8.3 DESARROLLO RECIENTE
16.9 BASF
16.9.1 INSTANTÁNEA DE LA EMPRESA
16.9.2 ANÁLISIS DE INGRESOS
16.9.3 PORTAFOLIO DE PRODUCTOS
16.9.4 DESARROLLO RECIENTE
16.1 CORPORACIÓN CLEANESE
16.10.1 INSTANTÁNEA DE LA EMPRESA
16.10.2 ANÁLISIS DE INGRESOS
16.10.3 PORTAFOLIO DE PRODUCTOS
16.10.4 DESARROLLO RECIENTE
16.11 CHIMEI
16.11.1 INSTANTÁNEA DE LA EMPRESA
16.11.2 ANÁLISIS DE INGRESOS
16.11.3 PORTAFOLIO DE PRODUCTOS
16.11.4 DESARROLLO RECIENTE
16.12 CLARIANTE
16.12.1 INSTANTÁNEA DE LA EMPRESA
16.12.2 ANÁLISIS DE INGRESOS
16.12.3 PORTAFOLIO DE PRODUCTOS
16.12.4 DESARROLLO RECIENTE
16.13 COVESTRO AG
16.13.1 INSTANTÁNEA DE LA EMPRESA
16.13.2 ANÁLISIS DE INGRESOS
16.13.3 PORTAFOLIO DE PRODUCTOS
16.13.4 DESARROLLO RECIENTE
16.14 CORPORACIÓN DAICEL
16.14.1 INSTANTÁNEA DE LA EMPRESA
16.14.2 ANÁLISIS DE INGRESOS
16.14.3 PORTAFOLIO DE PRODUCTOS
16.14.4 DESARROLLOS RECIENTES
16.15 ENSINGER GMBH
16.15.1 INSTANTÁNEA DE LA EMPRESA
16.15.2 PORTAFOLIO DE PRODUCTOS
16.15.3 DESARROLLO RECIENTE
16.16 ENVALIOR
16.16.1 INSTANTÁNEA DE LA EMPRESA
16.16.2 PORTAFOLIO DE PRODUCTOS
16.16.3 DESARROLLOS RECIENTES
16.17 INEOS
16.17.1 INSTANTÁNEA DE LA EMPRESA
16.17.2 PORTAFOLIO DE PRODUCTOS
16.17.3 DESARROLLO RECIENTE
16.18 CORPORACIÓN KANEKA
16.18.1 INSTANTÁNEA DE LA EMPRESA
16.18.2 ANÁLISIS DE INGRESOS
16.18.3 PORTAFOLIO DE PRODUCTOS
16.18.4 DESARROLLO RECIENTE
16.19 KINGFA CIENCIA Y TECNOLOGÍA. CO., LTD.
16.19.1 INSTANTÁNEA DE LA EMPRESA
16.19.2 ANÁLISIS DE INGRESOS
16.19.3 PORTAFOLIO DE PRODUCTOS
16.19.4 DESARROLLO RECIENTE
16.2 LANXESS
16.20.1 INSTANTÁNEA DE LA EMPRESA
16.20.2 ANÁLISIS DE INGRESOS
16.20.3 CARTERA DE NEGOCIOS
16.20.4 DESARROLLO RECIENTE
16.21 LG QUÍMICO
16.21.1 INSTANTÁNEA DE LA EMPRESA
16.21.2 ANÁLISIS DE INGRESOS
16.21.3 PORTAFOLIO DE PRODUCTOS
16.21.4 DESARROLLO RECIENTE
16.22 CORPORACIÓN DEL GRUPO QUÍMICO MITSUBISHI.
16.22.1 INSTANTÁNEA DE LA EMPRESA
16.22.2 ANÁLISIS DE INGRESOS
16.22.3 PORTAFOLIO DE PRODUCTOS
16.22.4 DESARROLLO RECIENTE
16.23 PRODUCTOS QUÍMICOS MITSUI, INC.
16.23.1 INSTANTÁNEA DE LA EMPRESA
16.23.2 ANÁLISIS DE INGRESOS
16.23.3 PORTAFOLIO DE PRODUCTOS
16.23.4 DESARROLLO RECIENTE
16.24 RTP COMPAÑÍA
16.24.1 INSTANTÁNEA DE LA EMPRESA
16.24.2 PORTAFOLIO DE PRODUCTOS
16.24.3 DESARROLLO RECIENTE
16.25 SCG
16.25.1 INSTANTÁNEA DE LA EMPRESA
16.25.2 ANÁLISIS DE INGRESOS
16.25.3 PORTAFOLIO DE PRODUCTOS
16.25.4 DESARROLLO RECIENTE
16.26 SYENSQO
16.26.1 INSTANTÁNEA DE LA EMPRESA
16.26.2 ANÁLISIS DE INGRESOS
16.26.3 PORTAFOLIO DE PRODUCTOS
16.26.4 DESARROLLOS RECIENTES
16.27 TEKNOR APEX
16.27.1 INSTANTÁNEA DE LA EMPRESA
16.27.2 PORTAFOLIO DE PRODUCTOS
16.27.3 DESARROLLO RECIENTE
16.28 INDUSTRIAS TORAY, INC.
16.28.1 INSTANTÁNEA DE LA EMPRESA
16.28.2 ANÁLISIS DE INGRESOS
16.28.3 PORTAFOLIO DE PRODUCTOS
16.28.4 DESARROLLO RECIENTE
16.29 TRINSEO
16.29.1 INSTANTÁNEA DE LA EMPRESA
16.29.2 ANÁLISIS DE INGRESOS
16.29.3 CARTERA DE SOLUCIONES
16.29.4 DESARROLLOS RECIENTES
16.3 WASHINGTON PENN
16.30.1 INSTANTÁNEA DE LA EMPRESA
16.30.2 PORTAFOLIO DE PRODUCTOS
16.30.3 DESARROLLO RECIENTE
17 CUESTIONARIO
18 INFORMES RELACIONADOS
Lista de Tablas
TABLA 1 ETAPAS DE LA CADENA DE VALOR
TABLA 2 PERSPECTIVA DE LA MARCA: MERCADO DE COMPUESTOS PLÁSTICOS DE ASIA-PACÍFICO
TABLA 3 COMPORTAMIENTO DE COMPRA DEL CONSUMIDOR
CUADRO 4 ACTORES DE ASIA-PACÍFICO EN LA FABRICACIÓN DE COMPUESTOS DE PLÁSTICO
TABLA 5 NÚMERO DE PATENTES POR AÑO
CUADRO 6 NÚMERO DE PATENTES POR REGIÓN/PAÍS
TABLA 7 PRINCIPALES SOLICITANTES DE PATENTES
CUADRO 8 EXPOSICIÓN ARANCELARIA Y RESPUESTA ESTRATÉGICA POR TIPO DE EMPRESA
CUADRO 9 EXPOSICIÓN ARANCELARIA Y RESPUESTA ESTRATÉGICA DE LOS ACTORES CLAVE
TABLA 10 MERCADO DE COMPUESTOS PLÁSTICOS DE ASIA-PACÍFICO, POR TIPO DE POLÍMERO, 2018-2032 (MILES DE USD)
TABLA 11 MERCADO DE COMPUESTOS PLÁSTICOS DE ASIA-PACÍFICO, POR TIPO DE POLÍMERO, 2018-2032 (KILOTONELADAS)
TABLA 12 MERCADO DE TERMOPLÁSTICOS EN COMPUESTOS PLÁSTICOS DE ASIA-PACÍFICO, POR REGIÓN, 2018-2032 (MILES DE USD)
TABLA 13 MERCADO DE TERMOPLÁSTICOS EN COMPUESTOS PLÁSTICOS DE ASIA-PACÍFICO, POR REGIÓN, 2018-2032 (KILOTONELADAS)
TABLA 14 MERCADO DE TERMOPLÁSTICOS EN COMPUESTOS PLÁSTICOS DE ASIA-PACÍFICO, POR TIPO, 2018-2032 (MILES DE USD)
TABLA 15 MERCADO DE POLIETILENO (PE) EN COMPUESTOS PLÁSTICOS DE ASIA-PACÍFICO, POR TIPO, 2018-2032 (MILES DE USD)
TABLA 16 PLÁSTICOS DE INGENIERÍA DE ASIA-PACÍFICO EN EL MERCADO DE COMPUESTOS PLÁSTICOS, POR REGIÓN, 2018-2032 (MILES DE USD)
TABLA 17 PLÁSTICOS DE INGENIERÍA EN EL MERCADO DE COMPUESTOS PLÁSTICOS DE ASIA-PACÍFICO, POR REGIÓN, 2018-2032 (KILOTONELADAS)
TABLA 18 PLÁSTICOS DE INGENIERÍA EN EL MERCADO DE COMPUESTOS PLÁSTICOS DE ASIA-PACÍFICO, POR TIPO, 2018-2032 (MILES DE USD)
TABLA 19 PLÁSTICOS TERMOESTABLECIDOS DE ASIA-PACÍFICO EN EL MERCADO DE COMPUESTOS DE PLÁSTICO, POR REGIÓN, 2018-2032 (MILES DE USD)
TABLA 20 PLÁSTICOS TERMOESTABLECIDOS DE ASIA-PACÍFICO EN EL MERCADO DE COMPUESTOS DE PLÁSTICO, POR REGIÓN, 2018-2032 (KILOTONELADAS)
TABLA 21 PLÁSTICOS TERMOESTABLECIDOS DE ASIA-PACÍFICO EN EL MERCADO DE COMPUESTOS DE PLÁSTICO, POR TIPO, 2018-2032 (MILES DE USD)
TABLA 22 MERCADO DE BIOPLÁSTICOS EN COMPUESTOS PLÁSTICOS DE ASIA-PACÍFICO, POR REGIÓN, 2018-2032 (MILES DE USD)
TABLA 23 MERCADO DE BIOPLÁSTICOS EN COMPUESTOS PLÁSTICOS DE ASIA-PACÍFICO, POR REGIÓN, 2018-2032 (KILOTONELADAS)
TABLA 24 MERCADO DE BIOPLÁSTICOS EN COMPUESTOS PLÁSTICOS DE ASIA-PACÍFICO, POR TIPO, 2018-2032 (MILES DE USD)
TABLA 25 OTROS MERCADOS DE COMPUESTOS PLÁSTICOS DE ASIA-PACÍFICO, POR REGIÓN, 2018-2032 (MILES DE USD)
TABLA 26 OTROS MERCADOS DE COMPUESTOS PLÁSTICOS DE ASIA-PACÍFICO, POR REGIÓN, 2018-2032 (KILOTONELADAS)
TABLA 27 MERCADO DE COMPUESTOS PLÁSTICOS DE ASIA-PACÍFICO, POR TIPO DE FILTRO, 2018-2032 (MILES DE USD)
TABLA 28 RELLENOS MINERALES EN EL MERCADO DE COMPUESTOS PLÁSTICOS DE ASIA-PACÍFICO, POR REGIÓN, 2018-2032 (MILES DE USD)
TABLA 29 RELLENOS MINERALES EN EL MERCADO DE COMPUESTOS PLÁSTICOS DE ASIA-PACÍFICO, POR TIPO, 2018-2032 (MILES DE USD)
TABLA 30 MERCADO DE REFUERZOS DE COMPUESTOS PLÁSTICOS DE ASIA-PACÍFICO, POR REGIÓN, 2018-2032 (MILES DE USD)
TABLA 31 MERCADO DE REFUERZOS DE COMPUESTOS PLÁSTICOS DE ASIA-PACÍFICO, POR TIPO, 2018-2032 (MILES DE USD)
TABLA 32 ADITIVOS EN EL MERCADO DE COMPUESTOS PLÁSTICOS DE ASIA-PACÍFICO, POR REGIÓN, 2018-2032 (MILES DE USD)
TABLA 33 ADITIVOS EN EL MERCADO DE COMPUESTOS PLÁSTICOS DE ASIA-PACÍFICO, POR TIPO, 2018-2032 (MILES DE USD)
TABLA 34 OTROS MERCADOS DE COMPUESTOS PLÁSTICOS DE ASIA-PACÍFICO, POR REGIÓN, 2018-2032 (MILES DE USD)
TABLA 35 MERCADO DE COMPUESTOS DE PLÁSTICO DE ASIA-PACÍFICO, POR PROCESO DE FABRICACIÓN, 2018-2032 (MILES DE USD)
TABLA 36 MERCADO DE COMPUESTOS PLÁSTICOS DE ASIA-PACÍFICO, POR PROCESO DE FABRICACIÓN, 2018-2032 (KILOTONELADAS)
TABLA 37 MERCADO DE EXTRUSIÓN DE COMPUESTOS PLÁSTICOS DE ASIA-PACÍFICO, POR REGIÓN, 2018-2032 (MILES DE USD)
TABLA 38 MERCADO DE EXTRUSIÓN DE COMPUESTOS PLÁSTICOS DE ASIA-PACÍFICO, POR REGIÓN, 2018-2032 (KILOTONELADAS)
TABLA 39 MERCADO DE EXTRUSIÓN DE COMPUESTOS PLÁSTICOS DE ASIA-PACÍFICO, POR TIPO, 2018-2032 (MILES DE USD)
TABLA 40 MERCADO DE EXTRUSIÓN DE PLÁSTICOS EN ASIA-PACÍFICO, POR SISTEMA DE PELETIZACIÓN, 2018-2032 (MILES DE USD)
TABLA 41 MERCADO DE COMPUESTOS DE PLÁSTICO BASADOS EN MOLDEO POR INYECCIÓN DE ASIA-PACÍFICO, POR REGIÓN, 2018-2032 (MILES DE USD)
TABLA 42 MERCADO DE COMPUESTOS DE PLÁSTICO BASADOS EN MOLDEO POR INYECCIÓN DE ASIA-PACÍFICO, POR REGIÓN, 2018-2032 (KILOTONELADAS)
TABLA 43 MERCADO DE COMPUESTOS DE PLÁSTICO BASADOS EN MOLDEO POR INYECCIÓN DE ASIA-PACÍFICO, POR SISTEMA DE PELETIZACIÓN, 2018-2032 (MILES DE USD)
TABLA 44 MERCADO DE COMPACTACIÓN/PRESIONADO DE PLÁSTICOS EN ASIA-PACÍFICO, POR REGIÓN, 2018-2032 (MILES DE USD)
TABLA 45 MERCADO DE COMPACTACIÓN/PRESIONADO DE PLÁSTICOS EN ASIA-PACÍFICO, POR REGIÓN, 2018-2032 (KILOTONELADAS)
TABLA 46 COMPACTACIÓN/PRESIONADO EN EL MERCADO DE COMPUESTOS DE PLÁSTICO DE ASIA-PACÍFICO, POR SISTEMA DE PELETIZACIÓN, 2018-2032 (MILES DE USD)
TABLA 47 MERCADO DE AMASADORAS/MEZCLAS BANBURY DE ASIA-PACÍFICO PARA COMPUESTOS DE PLÁSTICO, POR REGIÓN, 2018-2032 (MILES DE USD)
TABLA 48 MERCADO DE AMASADORAS/MEZCLAS BANBURY DE ASIA-PACÍFICO PARA COMPUESTOS DE PLÁSTICO, POR REGIÓN, 2018-2032 (KILOTONELADAS)
TABLA 49 MERCADO DE AMASADORAS/MEZCLAS BANBURY DE ASIA-PACÍFICO EN COMPUESTOS DE PLÁSTICO, POR SISTEMA DE PELETIZACIÓN, 2018-2032 (MILES DE USD)
TABLA 50 OTROS MERCADOS DE COMPUESTOS PLÁSTICOS DE ASIA-PACÍFICO, POR REGIÓN, 2018-2032 (MILES DE USD)
TABLA 51 OTROS MERCADOS DE COMPUESTOS PLÁSTICOS DE ASIA-PACÍFICO, POR REGIÓN, 2018-2032 (KILOTONELADAS)
TABLA 52 MERCADO DE COMPUESTOS PLÁSTICOS DE ASIA-PACÍFICO, POR PROPIEDADES, 2018-2032 (MILES DE USD)
TABLA 53 RESISTENCIA EN EL MERCADO DE COMPUESTOS PLÁSTICOS DE ASIA-PACÍFICO, POR REGIÓN, 2018-2032 (MILES DE USD)
TABLA 54 DURABILIDAD EN EL MERCADO DE COMPUESTOS DE PLÁSTICO DE ASIA-PACÍFICO, POR REGIÓN, 2018-2032 (MILES DE USD)
TABLA 55 FLEXIBILIDAD EN EL MERCADO DE COMPUESTOS PLÁSTICOS DE ASIA-PACÍFICO, POR REGIÓN, 2018-2032 (MILES DE USD)
TABLA 56 RESISTENCIA AL IMPACTO EN EL MERCADO DE COMPUESTOS PLÁSTICOS DE ASIA-PACÍFICO, POR REGIÓN, 2018-2032 (MILES DE USD)
TABLA 57 RIGIDEZ EN EL MERCADO DE COMPUESTOS PLÁSTICOS DE ASIA-PACÍFICO, POR REGIÓN, 2018-2032 (MILES DE USD)
TABLA 58 OTROS MERCADOS DE COMPUESTOS PLÁSTICOS DE ASIA-PACÍFICO, POR REGIÓN, 2018-2032 (MILES DE USD)
TABLA 59 MERCADO DE COMPUESTOS PLÁSTICOS DE ASIA-PACÍFICO, POR APLICACIÓN, 2018-2032 (MILES DE USD)
TABLA 60 MERCADO DE COMPUESTOS PLÁSTICOS DE ASIA-PACÍFICO, POR APLICACIÓN, 2018-2032 (KILOTONELADAS)
TABLA 61 MERCADO DE COMPUESTOS DE PLÁSTICO EN AUTOMOCIÓN DE ASIA-PACÍFICO, POR REGIÓN, 2018-2032 (MILES DE USD)
TABLA 62 MERCADO DE COMPUESTOS DE PLÁSTICO PARA AUTOMÓVILES EN ASIA-PACÍFICO, POR REGIÓN, 2018-2032 (KILOTONELADAS)
TABLA 63 MERCADO DE COMPUESTOS DE PLÁSTICO EN AUTOMOCIÓN DE ASIA-PACÍFICO, POR CATEGORÍA, 2018-2032 (MILES DE USD)
TABLA 64 COMPONENTES INTERIORES DE ASIA-PACÍFICO EN EL MERCADO DE COMPUESTOS PLÁSTICOS, POR TIPO, 2018-2032 (MILES DE USD)
TABLA 65 PIEZAS DE CARROCERÍA EXTERIOR DE ASIA-PACÍFICO EN EL MERCADO DE COMPUESTOS DE PLÁSTICO, POR TIPO, 2018-2032 (MILES DE USD)
TABLA 66 APLICACIONES INTERNAS EN EL MERCADO DE COMPUESTOS PLÁSTICOS DE ASIA-PACÍFICO, POR TIPO, 2018-2032 (MILES DE USD)
TABLA 67 MERCADO DE ENVASES DE PLÁSTICO PARA COMPUESTOS DE ASIA-PACÍFICO, POR REGIÓN, 2018-2032 (MILES DE USD)
TABLA 68 MERCADO DE ENVASES DE PLÁSTICO PARA COMPUESTOS DE ASIA-PACÍFICO, POR REGIÓN, 2018-2032 (KILOTONELADAS)
TABLA 69 MERCADO DE ENVASES DE PLÁSTICO EN ASIA-PACÍFICO, POR CATEGORÍA, 2018-2032 (MILES DE USD)
TABLA 70 MERCADO DE ENVASES DE ALIMENTOS Y BEBIDAS EN COMPUESTOS DE PLÁSTICO DE ASIA-PACÍFICO, POR TIPO, 2018-2032 (MILES DE USD)
TABLA 71 MERCADO DE ENVASES INDUSTRIALES DE ASIA-PACÍFICO EN COMPUESTOS DE PLÁSTICO, POR TIPO, 2018-2032 (MILES DE USD)
TABLA 72 MERCADO DE ENVASES DE BIENES DE CONSUMO EN COMPUESTOS DE PLÁSTICO DE ASIA-PACÍFICO, POR TIPO, 2018-2032 (MILES DE USD)
TABLA 73 MERCADO DE CONSTRUCCIÓN Y EDIFICACIÓN DE COMPUESTOS PLÁSTICOS EN ASIA-PACÍFICO, POR REGIÓN, 2018-2032 (MILES DE USD)
TABLA 74 MERCADO DE CONSTRUCCIÓN Y EDIFICACIÓN DE COMPUESTOS PLÁSTICOS EN ASIA-PACÍFICO, POR REGIÓN, 2018-2032 (KILOTONELADAS)
TABLA 75 MERCADO DE CONSTRUCCIÓN Y EDIFICACIÓN DE COMPUESTOS PLÁSTICOS EN ASIA-PACÍFICO, POR CATEGORÍA, 2018-2032 (MILES DE USD)
TABLA 76 MERCADO DE PRODUCTOS ELÉCTRICOS Y ELECTRÓNICOS EN COMPUESTOS DE PLÁSTICO DE ASIA-PACÍFICO, POR REGIÓN, 2018-2032 (MILES DE USD)
TABLA 77 MERCADO DE PRODUCTOS ELÉCTRICOS Y ELECTRÓNICOS EN COMPUESTOS DE PLÁSTICO DE ASIA-PACÍFICO, POR REGIÓN, 2018-2032 (KILOTONELADAS)
TABLA 78 MERCADO DE PRODUCTOS ELÉCTRICOS Y ELECTRÓNICOS EN COMPUESTOS DE PLÁSTICO DE ASIA-PACÍFICO, POR CATEGORÍA, 2018-2032 (MILES DE USD)
TABLA 79 MERCADO DE DISPOSITIVOS MÉDICOS DE ASIA-PACÍFICO EN COMPUESTOS DE PLÁSTICO, POR REGIÓN, 2018-2032 (MILES DE USD)
TABLA 80 DISPOSITIVOS MÉDICOS EN EL MERCADO DE COMPUESTOS PLÁSTICOS DE ASIA-PACÍFICO, POR REGIÓN, 2018-2032 (KILOTONELADAS)
TABLA 81 DISPOSITIVOS MÉDICOS EN EL MERCADO DE COMPUESTOS PLÁSTICOS DE ASIA-PACÍFICO, POR CATEGORÍA, 2018-2032 (MILES DE USD)
TABLA 82 MERCADO DE MUEBLES DE ASIA-PACÍFICO EN COMPUESTOS DE PLÁSTICO, POR REGIÓN, 2018-2032 (MILES DE USD)
TABLA 83 MERCADO DE MUEBLES DE ASIA-PACÍFICO EN COMPUESTOS DE PLÁSTICO, POR REGIÓN, 2018-2032 (KILOTONELADAS)
TABLA 84 MERCADO DE MUEBLES DE ASIA-PACÍFICO EN COMPUESTOS DE PLÁSTICO, POR CATEGORÍA, 2018-2032 (MILES DE USD)
TABLA 85 MERCADO DE ENERGÍA Y ELECTRICIDAD EN COMPUESTOS DE PLÁSTICO EN ASIA-PACÍFICO, POR REGIÓN, 2018-2032 (MILES DE USD)
TABLA 86 MERCADO DE ENERGÍA Y ELECTRICIDAD EN COMPUESTOS DE PLÁSTICO EN ASIA-PACÍFICO, POR REGIÓN, 2018-2032 (KILOTONELADAS)
TABLA 87 MERCADO DE ENERGÍA Y ELECTRICIDAD EN COMPUESTOS DE PLÁSTICO DE ASIA-PACÍFICO, POR CATEGORÍA, 2018-2032 (MILES DE USD)
TABLA 88 MERCADO DE COMPUESTOS PLÁSTICOS DE LA INDUSTRIA AEROESPACIAL Y DE DEFENSA DE ASIA-PACÍFICO, POR REGIÓN, 2018-2032 (MILES DE USD)
TABLA 89 MERCADO DE COMPUESTOS PLÁSTICOS DE LA INDUSTRIA AEROESPACIAL Y DE DEFENSA DE ASIA-PACÍFICO, POR REGIÓN, 2018-2032 (KILOTONELADAS)
TABLA 90 MERCADO DE COMPUESTOS PLÁSTICOS DE LA INDUSTRIA AEROESPACIAL Y DE DEFENSA DE ASIA-PACÍFICO, POR CATEGORÍA, 2018-2032 (MILES DE USD)
TABLA 91 OTROS MERCADOS DE COMPUESTOS PLÁSTICOS DE ASIA-PACÍFICO, POR REGIÓN, 2018-2032 (MILES DE USD)
TABLA 92 OTROS MERCADOS DE COMPUESTOS PLÁSTICOS DE ASIA-PACÍFICO, POR REGIÓN, 2018-2032 (KILOTONELADAS)
TABLA 93 MERCADO DE COMPUESTOS PLÁSTICOS DE ASIA-PACÍFICO, POR PAÍS, 2018-2032 (MILES DE USD)
TABLA 94 MERCADO DE COMPUESTOS PLÁSTICOS DE ASIA-PACÍFICO, POR PAÍS, 2018-2032 (KILOTONELADAS)
TABLA 95 MERCADO DE COMPUESTOS PLÁSTICOS DE ASIA-PACÍFICO, POR TIPO DE POLÍMERO, 2018-2032 (MILES DE USD)
TABLA 96 MERCADO DE COMPUESTOS PLÁSTICOS DE ASIA-PACÍFICO, POR TIPO DE POLÍMERO, 2018-2032 (KILOTONELADAS)
TABLA 97 MERCADO DE TERMOPLÁSTICOS EN COMPUESTOS PLÁSTICOS DE ASIA-PACÍFICO, POR TIPO, 2018-2032 (MILES DE USD)
TABLA 98 MERCADO DE POLIETILENO (PE) EN COMPUESTOS PLÁSTICOS DE ASIA-PACÍFICO, POR TIPO, 2018-2032 (MILES DE USD)
TABLA 99 PLÁSTICOS DE INGENIERÍA EN EL MERCADO DE COMPUESTOS PLÁSTICOS DE ASIA-PACÍFICO, POR TIPO, 2018-2032 (MILES DE USD)
TABLA 100 PLÁSTICOS TERMOENDURECIBLES EN EL MERCADO DE COMPUESTOS PLÁSTICOS DE ASIA-PACÍFICO, POR TIPO, 2018-2032 (MILES DE USD)
TABLA 101 MERCADO DE BIOPLÁSTICOS EN COMPUESTOS PLÁSTICOS DE ASIA-PACÍFICO, POR TIPO, 2018-2032 (MILES DE USD)
TABLA 102 MERCADO DE COMPUESTOS PLÁSTICOS DE ASIA-PACÍFICO, POR TIPO DE RELLENO, 2018-2032 (MILES DE USD)
TABLA 103 RELLENOS MINERALES EN EL MERCADO DE COMPUESTOS PLÁSTICOS DE ASIA-PACÍFICO, POR TIPO, 2018-2032 (MILES DE USD)
TABLA 104 MERCADO DE REFUERZOS DE COMPUESTOS PLÁSTICOS DE ASIA-PACÍFICO, POR TIPO, 2018-2032 (MILES DE USD)
TABLA 105 ADITIVOS EN EL MERCADO DE COMPUESTOS PLÁSTICOS DE ASIA-PACÍFICO, POR TIPO, 2018-2032 (MILES DE USD)
TABLA 106 MERCADO DE COMPUESTOS PLÁSTICOS DE ASIA-PACÍFICO, POR PROCESO DE FABRICACIÓN, 2018-2032 (MILES DE USD)
TABLA 107 MERCADO DE COMPUESTOS PLÁSTICOS DE ASIA-PACÍFICO, POR PROCESO DE FABRICACIÓN, 2018-2032 (KILOTONELADAS)
TABLA 108 MERCADO DE EXTRUSIÓN DE COMPUESTOS PLÁSTICOS DE ASIA-PACÍFICO, POR TIPO, 2018-2032 (MILES DE USD)
TABLA 109 MERCADO DE EXTRUSIÓN DE PLÁSTICOS EN ASIA-PACÍFICO, POR SISTEMA DE PELETIZACIÓN, 2018-2032 (MILES DE USD)
TABLA 110 MERCADO DE COMPUESTOS DE PLÁSTICO BASADOS EN MOLDEO POR INYECCIÓN DE ASIA-PACÍFICO, POR SISTEMA DE PELETIZACIÓN, 2018-2032 (MILES DE USD)
TABLA 111 COMPACTACIÓN/PRESIONADO EN EL MERCADO DE COMPUESTOS DE PLÁSTICO DE ASIA-PACÍFICO, POR SISTEMA DE PELETIZACIÓN, 2018-2032 (MILES DE USD)
TABLA 112 MERCADO DE AMASADORAS/MEZCLAS BANBURY DE ASIA-PACÍFICO EN LA FABRICACIÓN DE COMPUESTOS DE PLÁSTICO, POR SISTEMA DE PELETIZACIÓN, 2018-2032 (MILES DE USD)
TABLA 113 MERCADO DE COMPUESTOS PLÁSTICOS DE ASIA-PACÍFICO, POR PROPIEDADES, 2018-2032 (MILES DE USD)
TABLA 114 MERCADO DE COMPUESTOS PLÁSTICOS DE ASIA-PACÍFICO, POR APLICACIÓN, 2018-2032 (MILES DE USD)
TABLA 115 MERCADO DE COMPUESTOS PLÁSTICOS DE ASIA-PACÍFICO, POR APLICACIÓN, 2018-2032 (KILOTONELADAS)
TABLA 116 MERCADO DE COMPUESTOS DE PLÁSTICO EN AUTOMOCIÓN DE ASIA-PACÍFICO, POR CATEGORÍA, 2018-2032 (MILES DE USD)
TABLA 117 COMPONENTES INTERIORES DE ASIA-PACÍFICO EN EL MERCADO DE COMPUESTOS PLÁSTICOS, POR TIPO, 2018-2032 (MILES DE USD)
TABLA 118 PIEZAS DE CARROCERÍA EXTERIOR DE ASIA-PACÍFICO EN EL MERCADO DE COMPUESTOS DE PLÁSTICO, POR TIPO, 2018-2032 (MILES DE USD)
TABLA 119 APLICACIONES INTERNAS EN EL MERCADO DE COMPUESTOS PLÁSTICOS DE ASIA-PACÍFICO, POR TIPO, 2018-2032 (MILES DE USD)
TABLA 120 MERCADO DE ENVASES DE PLÁSTICO EN ASIA-PACÍFICO, POR CATEGORÍA, 2018-2032 (MILES DE USD)
TABLA 121 MERCADO DE ENVASES DE ALIMENTOS Y BEBIDAS EN COMPUESTOS DE PLÁSTICO DE ASIA-PACÍFICO, POR TIPO, 2018-2032 (MILES DE USD)
TABLA 122 MERCADO DE ENVASES INDUSTRIALES DE ASIA-PACÍFICO EN COMPUESTOS DE PLÁSTICO, POR TIPO, 2018-2032 (MILES DE USD)
TABLA 123 MERCADO DE ENVASES DE BIENES DE CONSUMO EN COMPUESTOS DE PLÁSTICO DE ASIA-PACÍFICO, POR TIPO, 2018-2032 (MILES DE USD)
TABLA 124 MERCADO DE CONSTRUCCIÓN Y EDIFICACIÓN DE COMPUESTOS PLÁSTICOS EN ASIA-PACÍFICO, POR CATEGORÍA, 2018-2032 (MILES DE USD)
TABLA 125 MERCADO DE PRODUCTOS ELÉCTRICOS Y ELECTRÓNICOS EN COMPUESTOS DE PLÁSTICO DE ASIA-PACÍFICO, POR CATEGORÍA, 2018-2032 (MILES DE USD)
TABLA 126 DISPOSITIVOS MÉDICOS EN EL MERCADO DE COMPUESTOS PLÁSTICOS DE ASIA-PACÍFICO, POR CATEGORÍA, 2018-2032 (MILES DE USD)
TABLA 127 MERCADO DE MUEBLES DE ASIA-PACÍFICO EN COMPUESTOS DE PLÁSTICO, POR CATEGORÍA, 2018-2032 (MILES DE USD)
TABLA 128 MERCADO DE ENERGÍA Y ELECTRICIDAD EN COMPUESTOS DE PLÁSTICO DE ASIA-PACÍFICO, POR CATEGORÍA, 2018-2032 (MILES DE USD)
TABLA 129 MERCADO DE COMPUESTOS PLÁSTICOS DE LA INDUSTRIA AEROESPACIAL Y DE DEFENSA DE ASIA-PACÍFICO, POR CATEGORÍA, 2018-2032 (MILES DE USD)
TABLA 130 MERCADO DE COMPUESTOS PLÁSTICOS DE CHINA, POR TIPO DE POLÍMERO, 2018-2032 (MILES DE USD)
TABLA 131 MERCADO DE COMPUESTOS PLÁSTICOS DE CHINA, POR TIPO DE POLÍMERO, 2018-2032 (KILOTONELADAS)
TABLA 132 MERCADO DE TERMOPLÁSTICOS EN COMPUESTOS PLÁSTICOS DE CHINA, POR TIPO, 2018-2032 (MILES DE USD)
TABLA 133 POLIETILENO (PE) EN EL MERCADO DE COMPUESTOS PLÁSTICOS DE CHINA, POR TIPO, 2018-2032 (MILES DE USD)
TABLA 134 PLÁSTICOS DE INGENIERÍA DE CHINA EN EL MERCADO DE COMPUESTOS DE PLÁSTICO, POR TIPO, 2018-2032 (MILES DE USD)
TABLA 135 PLÁSTICOS TERMOESTABLECIDOS DE CHINA EN EL MERCADO DE COMPUESTOS DE PLÁSTICO, POR TIPO, 2018-2032 (MILES DE USD)
TABLA 136 BIOPLÁSTICOS DE CHINA EN EL MERCADO DE COMPUESTOS PLÁSTICOS, POR TIPO, 2018-2032 (MILES DE USD)
TABLA 137 MERCADO DE COMPUESTOS PLÁSTICOS DE CHINA, POR TIPO DE RELLENO, 2018-2032 (MILES DE USD)
TABLA 138 RELLENOS MINERALES DE CHINA EN EL MERCADO DE COMPUESTOS PLÁSTICOS, POR TIPO, 2018-2032 (MILES DE USD)
TABLA 139 REFUERZOS DE CHINA EN EL MERCADO DE COMPUESTOS PLÁSTICOS, POR TIPO, 2018-2032 (MILES DE USD)
TABLA 140 ADITIVOS DE CHINA EN EL MERCADO DE COMPUESTOS PLÁSTICOS, POR TIPO, 2018-2032 (MILES DE USD)
TABLA 141 MERCADO DE COMPUESTOS PLÁSTICOS DE CHINA, POR PROCESO DE FABRICACIÓN, 2018-2032 (MILES DE USD)
TABLA 142 MERCADO DE COMPUESTOS PLÁSTICOS DE CHINA, POR PROCESO DE FABRICACIÓN, 2018-2032 (KILOTONELADAS)
TABLA 143 MERCADO DE EXTRUSIÓN DE COMPUESTOS DE PLÁSTICO EN CHINA, POR TIPO, 2018-2032 (MILES DE USD)
TABLA 144 MERCADO DE EXTRUSIÓN DE PLÁSTICOS EN CHINA, POR SISTEMA DE PELETIZACIÓN, 2018-2032 (MILES DE USD)
TABLA 145 MERCADO DE COMPUESTOS DE PLÁSTICO BASADOS EN MOLDEO POR INYECCIÓN EN CHINA, POR SISTEMA DE PELETIZACIÓN, 2018-2032 (MILES DE USD)
TABLA 146 COMPACTACIÓN/PRESIONADO EN EL MERCADO DE COMPUESTOS DE PLÁSTICO EN CHINA, POR SISTEMA DE PELETIZACIÓN, 2018-2032 (MILES DE USD)
TABLA 147 MERCADO DE MEZCLA DE AMASADORAS/BANBURY DE CHINA EN LA FABRICACIÓN DE COMPUESTOS DE PLÁSTICO, POR SISTEMA DE PELETIZACIÓN, 2018-2032 (MILES DE USD)
TABLA 148 MERCADO DE COMPUESTOS PLÁSTICOS DE CHINA, POR PROPIEDADES, 2018-2032 (MILES DE USD)
TABLA 149 MERCADO DE COMPUESTOS PLÁSTICOS DE CHINA, POR APLICACIÓN, 2018-2032 (MILES DE USD)
TABLA 150 MERCADO DE COMPUESTOS PLÁSTICOS DE CHINA, POR APLICACIÓN, 2018-2032 (KILOTONELADAS)
TABLA 151 MERCADO DE COMPUESTOS DE PLÁSTICO EN LA INDUSTRIA AUTOMOTRIZ DE CHINA, POR CATEGORÍA, 2018-2032 (MILES DE USD)
TABLA 152 COMPONENTES DE CHINA INTERIOR EN EL MERCADO DE COMPUESTOS DE PLÁSTICO, POR TIPO, 2018-2032 (MILES DE USD)
TABLA 153 PIEZAS DE CARROCERÍA EXTERIOR DE CHINA EN EL MERCADO DE COMPUESTOS DE PLÁSTICO, POR TIPO, 2018-2032 (MILES DE USD)
TABLA 154 APLICACIONES INTERNAS EN CHINA EN EL MERCADO DE COMPUESTOS PLÁSTICOS, POR TIPO, 2018-2032 (MILES DE USD)
TABLA 155 MERCADO DE ENVASES DE PLÁSTICO EN CHINA, POR CATEGORÍA, 2018-2032 (MILES DE USD)
TABLA 156 ENVASES DE ALIMENTOS Y BEBIDAS EN EL MERCADO DE COMPUESTOS DE PLÁSTICO DE CHINA, POR TIPO, 2018-2032 (MILES DE USD)
TABLA 157 MERCADO DE ENVASES INDUSTRIALES DE CHINA EN COMPUESTOS DE PLÁSTICO, POR TIPO, 2018-2032 (MILES DE USD)
TABLA 158 ENVASES DE BIENES DE CONSUMO EN EL MERCADO DE COMPUESTOS PLÁSTICOS DE CHINA, POR TIPO, 2018-2032 (MILES DE USD)
TABLA 159 MERCADO DE CONSTRUCCIÓN Y EDIFICACIÓN DE COMPUESTOS DE PLÁSTICO EN CHINA, POR CATEGORÍA, 2018-2032 (MILES DE USD)
TABLA 160 MERCADO DE PRODUCTOS ELÉCTRICOS Y ELECTRÓNICOS EN COMPUESTOS DE PLÁSTICO DE CHINA, POR CATEGORÍA, 2018-2032 (MILES DE USD)
TABLA 161 DISPOSITIVOS MÉDICOS EN EL MERCADO DE COMPUESTOS PLÁSTICOS DE CHINA, POR CATEGORÍA, 2018-2032 (MILES DE USD)
TABLA 162 MUEBLES DE CHINA EN EL MERCADO DE COMPUESTOS DE PLÁSTICO, POR CATEGORÍA, 2018-2032 (MILES DE USD)
TABLA 163 ENERGÍA Y PODER EN EL MERCADO DE COMPUESTOS DE PLÁSTICO DE CHINA, POR CATEGORÍA, 2018-2032 (MILES DE USD)
TABLA 164 MERCADO DE COMPUESTOS PLÁSTICOS DE LA INDUSTRIA AEROESPACIAL Y DE DEFENSA DE CHINA, POR CATEGORÍA, 2018-2032 (MILES DE USD)
TABLA 165 MERCADO DE COMPUESTOS PLÁSTICOS DE LA INDIA, POR TIPO DE POLÍMERO, 2018-2032 (MILES DE USD)
TABLA 166 MERCADO DE COMPUESTOS PLÁSTICOS DE LA INDIA, POR TIPO DE POLÍMERO, 2018-2032 (KILOTONELADAS)
TABLA 167 MERCADO DE TERMOPLÁSTICOS EN COMPUESTOS PLÁSTICOS DE LA INDIA, POR TIPO, 2018-2032 (MILES DE USD)
TABLA 168 MERCADO DE POLIETILENO (PE) EN COMPUESTOS PLÁSTICOS DE LA INDIA, POR TIPO, 2018-2032 (MILES DE USD)
TABLA 169 PLÁSTICOS DE INGENIERÍA EN EL MERCADO DE COMPUESTOS PLÁSTICOS DE INDIA, POR TIPO, 2018-2032 (MILES DE USD)
TABLA 170 PLÁSTICOS TERMOENDURECIBLES EN EL MERCADO DE COMPUESTOS DE PLÁSTICO DE LA INDIA, POR TIPO, 2018-2032 (MILES DE USD)
TABLA 171 BIOPLÁSTICOS EN EL MERCADO DE COMPUESTOS PLÁSTICOS DE LA INDIA, POR TIPO, 2018-2032 (MILES DE USD)
TABLA 172 MERCADO DE COMPUESTOS PLÁSTICOS DE LA INDIA, POR TIPO DE RELLENO, 2018-2032 (MILES DE USD)
TABLA 173 RELLENOS MINERALES EN EL MERCADO DE COMPUESTOS PLÁSTICOS DE LA INDIA, POR TIPO, 2018-2032 (MILES DE USD)
TABLA 174 INDIA: REFUERZOS EN EL MERCADO DE COMPUESTOS PLÁSTICOS, POR TIPO, 2018-2032 (MILES DE USD)
TABLA 175 ADITIVOS EN EL MERCADO DE COMPUESTOS PLÁSTICOS DE LA INDIA, POR TIPO, 2018-2032 (MILES DE USD)
TABLA 176 MERCADO DE COMPUESTOS DE PLÁSTICO DE LA INDIA, POR PROCESO DE FABRICACIÓN, 2018-2032 (MILES DE USD)
TABLA 177 MERCADO DE COMPUESTOS DE PLÁSTICO EN LA INDIA, POR PROCESO DE FABRICACIÓN, 2018-2032 (KILOTONELADAS)
TABLA 178 MERCADO DE EXTRUSIÓN DE COMPUESTOS DE PLÁSTICO EN INDIA, POR TIPO, 2018-2032 (MILES DE USD)
TABLA 179 MERCADO DE EXTRUSIÓN DE PLÁSTICOS EN INDIA, POR SISTEMA DE PELETIZACIÓN, 2018-2032 (MILES DE USD)
TABLA 180 INDIA: MERCADO DE COMPUESTOS DE PLÁSTICO BASADOS EN MOLDEO POR INYECCIÓN, SEGÚN EL SISTEMA DE PELETIZACIÓN, 2018-2032 (MILES DE USD)
TABLA 181 COMPACTACIÓN/PRESIONADO EN EL MERCADO DE COMPUESTOS DE PLÁSTICO EN INDIA, POR SISTEMA DE PELETIZACIÓN, 2018-2032 (MILES DE USD)
TABLA 182 MERCADO DE MEZCLA DE AMASADORAS/BANBURY EN LA INDIA, POR SISTEMA DE PELETIZACIÓN, 2018-2032 (MILES DE USD)
TABLA 183 MERCADO DE COMPUESTOS PLÁSTICOS DE LA INDIA, POR PROPIEDADES, 2018-2032 (MILES DE USD)
TABLA 184 MERCADO DE COMPUESTOS PLÁSTICOS DE LA INDIA, POR APLICACIÓN, 2018-2032 (MILES DE USD)
TABLA 185 MERCADO DE COMPUESTOS PLÁSTICOS DE LA INDIA, POR APLICACIÓN, 2018-2032 (KILOTONELADAS)
TABLA 186 MERCADO DE COMPUESTOS DE PLÁSTICO EN AUTOMÓVILES DE INDIA, POR CATEGORÍA, 2018-2032 (MILES DE USD)
TABLA 187 INDIA COMPONENTES INTERIORES EN EL MERCADO DE COMPUESTOS PLÁSTICOS, POR TIPO, 2018-2032 (MILES DE USD)
TABLA 188 INDIA: PIEZAS DE CARROCERÍA EXTERIOR EN EL MERCADO DE COMPUESTOS DE PLÁSTICO, POR TIPO, 2018-2032 (MILES DE USD)
TABLA 189 APLICACIONES INTERNAS EN EL MERCADO DE COMPUESTOS PLÁSTICOS DE LA INDIA, POR TIPO, 2018-2032 (MILES DE USD)
TABLA 190 MERCADO DE ENVASES DE PLÁSTICO EN INDIA, POR CATEGORÍA, 2018-2032 (MILES DE USD)
TABLA 191 MERCADO DE ENVASES DE ALIMENTOS Y BEBIDAS EN LA INDIA, POR TIPO, 2018-2032 (MILES DE USD)
TABLA 192 MERCADO DE ENVASES INDUSTRIALES DE COMPUESTOS PLÁSTICOS DE LA INDIA, POR TIPO, 2018-2032 (MILES DE USD)
TABLA 193 ENVASES DE BIENES DE CONSUMO EN EL MERCADO DE COMPUESTOS PLÁSTICOS DE LA INDIA, POR TIPO, 2018-2032 (MILES DE USD)
TABLA 194 INDIA: MERCADO DE CONSTRUCCIÓN Y EDIFICACIÓN DE COMPUESTOS DE PLÁSTICO, POR CATEGORÍA, 2018-2032 (MILES DE USD)
TABLA 195 MERCADO DE PRODUCTOS ELÉCTRICOS Y ELECTRÓNICOS EN COMPUESTOS DE PLÁSTICO EN INDIA, POR CATEGORÍA, 2018-2032 (MILES DE USD)
TABLA 196 DISPOSITIVOS MÉDICOS EN EL MERCADO DE COMPUESTOS DE PLÁSTICO DE LA INDIA, POR CATEGORÍA, 2018-2032 (MILES DE USD)
TABLA 197 MERCADO DE MUEBLES DE INDIA EN COMPUESTOS DE PLÁSTICO, POR CATEGORÍA, 2018-2032 (MILES DE USD)
TABLA 198 ENERGÍA Y ELECTRICIDAD EN EL MERCADO DE COMPUESTOS DE PLÁSTICO EN INDIA, POR CATEGORÍA, 2018-2032 (MILES DE USD)
TABLA 199 INDIA, MERCADO DE COMPUESTOS PLÁSTICOS EN LA INDUSTRIA AEROESPACIAL Y DE DEFENSA, POR CATEGORÍA, 2018-2032 (MILES DE USD)
TABLA 200 MERCADO DE COMPUESTOS PLÁSTICOS DE JAPÓN, POR TIPO DE POLÍMERO, 2018-2032 (MILES DE USD)
TABLA 201 MERCADO DE COMPUESTOS PLÁSTICOS DE JAPÓN, POR TIPO DE POLÍMERO, 2018-2032 (KILOTONELADAS)
TABLA 202 MERCADO DE TERMOPLÁSTICOS EN COMPUESTOS PLÁSTICOS DE JAPÓN, POR TIPO, 2018-2032 (MILES DE USD)
TABLA 203 MERCADO DE POLIETILENO (PE) EN COMPUESTOS PLÁSTICOS DE JAPÓN, POR TIPO, 2018-2032 (MILES DE USD)
TABLA 204 PLÁSTICOS DE INGENIERÍA DE JAPÓN EN EL MERCADO DE COMPUESTOS DE PLÁSTICO, POR TIPO, 2018-2032 (MILES DE USD)
TABLA 205 PLÁSTICOS TERMOESTABLECIDOS DE JAPÓN EN EL MERCADO DE COMPUESTOS DE PLÁSTICO, POR TIPO, 2018-2032 (MILES DE USD)
TABLA 206 BIOPLÁSTICOS EN EL MERCADO DE COMPUESTOS PLÁSTICOS DE JAPÓN, POR TIPO, 2018-2032 (MILES DE USD)
TABLA 207 MERCADO DE COMPUESTOS PLÁSTICOS DE JAPÓN, POR TIPO DE RELLENO, 2018-2032 (MILES DE USD)
TABLA 208 RELLENOS MINERALES EN EL MERCADO DE COMPUESTOS PLÁSTICOS DE JAPÓN, POR TIPO, 2018-2032 (MILES DE USD)
TABLA 209 REFUERZOS EN EL MERCADO DE COMPUESTOS PLÁSTICOS DE JAPÓN, POR TIPO, 2018-2032 (MILES DE USD)
TABLA 210 ADITIVOS EN EL MERCADO DE COMPUESTOS PLÁSTICOS DE JAPÓN, POR TIPO, 2018-2032 (MILES DE USD)
TABLA 211 MERCADO DE COMPUESTOS DE PLÁSTICO DE JAPÓN, POR PROCESO DE FABRICACIÓN, 2018-2032 (MILES DE USD)
TABLA 212 MERCADO DE COMPUESTOS DE PLÁSTICO DE JAPÓN, POR PROCESO DE FABRICACIÓN, 2018-2032 (KILOTONELADAS)
TABLA 213 MERCADO DE EXTRUSIÓN DE COMPUESTOS DE PLÁSTICO EN JAPÓN, POR TIPO, 2018-2032 (MILES DE USD)
TABLA 214 MERCADO DE EXTRUSIÓN DE PLÁSTICOS EN JAPÓN, POR SISTEMA DE PELETIZACIÓN, 2018-2032 (MILES DE USD)
TABLA 215 MERCADO DE COMPUESTOS DE PLÁSTICO BASADOS EN MOLDEO POR INYECCIÓN EN JAPÓN, POR SISTEMA DE PELETIZACIÓN, 2018-2032 (MILES DE USD)
TABLA 216 COMPACTACIÓN/PRESIONADO EN EL MERCADO DE COMPUESTOS DE PLÁSTICO EN JAPÓN, POR SISTEMA DE PELETIZACIÓN, 2018-2032 (MILES DE USD)
TABLA 217 MERCADO DE MEZCLA DE AMASADORAS/BANBURY EN JAPÓN PARA COMPUESTOS DE PLÁSTICO, POR SISTEMA DE PELETIZACIÓN, 2018-2032 (MILES DE USD)
TABLA 218 MERCADO DE COMPUESTOS PLÁSTICOS DE JAPÓN, POR PROPIEDADES, 2018-2032 (MILES DE USD)
TABLA 219 MERCADO DE COMPUESTOS PLÁSTICOS DE JAPÓN, POR APLICACIÓN, 2018-2032 (MILES DE USD)
TABLA 220 MERCADO DE COMPUESTOS PLÁSTICOS DE JAPÓN, POR APLICACIÓN, 2018-2032 (KILOTONELADAS)
TABLA 221 MERCADO DE COMPUESTOS DE PLÁSTICO EN AUTOMÓVILES DE JAPÓN, POR CATEGORÍA, 2018-2032 (MILES DE USD)
TABLA 222 COMPONENTES INTERIORES DE JAPÓN EN EL MERCADO DE COMPUESTOS PLÁSTICOS, POR TIPO, 2018-2032 (MILES DE USD)
TABLA 223 PIEZAS DE CARROCERÍA EXTERIOR DE JAPÓN EN EL MERCADO DE COMPUESTOS DE PLÁSTICO, POR TIPO, 2018-2032 (MILES DE USD)
TABLA 224 APLICACIONES INTERNAS EN JAPÓN EN EL MERCADO DE COMPUESTOS PLÁSTICOS, POR TIPO, 2018-2032 (MILES DE USD)
TABLA 225 MERCADO DE ENVASES DE PLÁSTICO EN JAPÓN, POR CATEGORÍA, 2018-2032 (MILES DE USD)
TABLA 226 MERCADO DE ENVASES DE ALIMENTOS Y BEBIDAS EN JAPÓN, POR TIPO, 2018-2032 (MILES DE USD)
TABLA 227 MERCADO DE ENVASES INDUSTRIALES DE JAPÓN EN COMPUESTOS DE PLÁSTICO, POR TIPO, 2018-2032 (MILES DE USD)
TABLA 228 MERCADO DE ENVASES DE BIENES DE CONSUMO EN JAPÓN, POR TIPO, 2018-2032 (MILES DE USD)
TABLA 229 MERCADO DE CONSTRUCCIÓN Y EDIFICACIÓN DE PLÁSTICOS EN JAPÓN, POR CATEGORÍA, 2018-2032 (MILES DE USD)
TABLA 230 MERCADO DE PRODUCTOS ELÉCTRICOS Y ELECTRÓNICOS EN COMPUESTOS DE PLÁSTICO EN JAPÓN, POR CATEGORÍA, 2018-2032 (MILES DE USD)
TABLA 231 DISPOSITIVOS MÉDICOS EN EL MERCADO DE COMPUESTOS DE PLÁSTICO DE JAPÓN, POR CATEGORÍA, 2018-2032 (MILES DE USD)
TABLA 232 MERCADO DE MUEBLES DE JAPÓN EN COMPUESTOS DE PLÁSTICO, POR CATEGORÍA, 2018-2032 (MILES DE USD)
TABLA 233 MERCADO DE ENERGÍA Y ELECTRICIDAD EN JAPÓN, POR CATEGORÍA, 2018-2032 (MILES DE USD)
TABLA 234 MERCADO DE COMPUESTOS PLÁSTICOS DE LA INDUSTRIA AEROESPACIAL Y DE DEFENSA DE JAPÓN, POR CATEGORÍA, 2018-2032 (MILES DE USD)
TABLA 235 MERCADO DE COMPUESTOS PLÁSTICOS DE COREA DEL SUR, POR TIPO DE POLÍMERO, 2018-2032 (MILES DE USD)
TABLA 236 MERCADO DE COMPUESTOS PLÁSTICOS DE COREA DEL SUR, POR TIPO DE POLÍMERO, 2018-2032 (KILOTONELADAS)
TABLA 237 MERCADO DE TERMOPLÁSTICOS EN COMPUESTOS PLÁSTICOS DE COREA DEL SUR, POR TIPO, 2018-2032 (MILES DE USD)
TABLA 238 MERCADO DE POLIETILENO (PE) EN COMPUESTOS PLÁSTICOS DE COREA DEL SUR, POR TIPO, 2018-2032 (MILES DE USD)
TABLA 239 PLÁSTICOS DE INGENIERÍA DE COREA DEL SUR EN EL MERCADO DE COMPUESTOS PLÁSTICOS, POR TIPO, 2018-2032 (MILES DE USD)
TABLA 240 PLÁSTICOS TERMOESTABLECIDOS DE COREA DEL SUR EN EL MERCADO DE COMPUESTOS DE PLÁSTICO, POR TIPO, 2018-2032 (MILES DE USD)
TABLA 241 BIOPLÁSTICOS DE COREA DEL SUR EN EL MERCADO DE COMPUESTOS PLÁSTICOS, POR TIPO, 2018-2032 (MILES DE USD)
TABLA 242 MERCADO DE COMPUESTOS PLÁSTICOS DE COREA DEL SUR, POR TIPO DE RELLENO, 2018-2032 (MILES DE USD)
TABLA 243 RELLENOS MINERALES EN EL MERCADO DE COMPUESTOS PLÁSTICOS DE COREA DEL SUR, POR TIPO, 2018-2032 (MILES DE USD)
TABLA 244 REFUERZOS EN EL MERCADO DE COMPUESTOS PLÁSTICOS DE COREA DEL SUR, POR TIPO, 2018-2032 (MILES DE USD)
TABLA 245 ADITIVOS DE COREA DEL SUR EN EL MERCADO DE COMPUESTOS PLÁSTICOS, POR TIPO, 2018-2032 (MILES DE USD)
TABLA 246 MERCADO DE COMPUESTOS PLÁSTICOS DE COREA DEL SUR, POR PROCESO DE FABRICACIÓN, 2018-2032 (MILES DE USD)
TABLA 247 MERCADO DE COMPUESTOS PLÁSTICOS DE COREA DEL SUR, POR PROCESO DE FABRICACIÓN, 2018-2032 (KILOTONELADAS)
TABLA 248 MERCADO DE EXTRUSIÓN DE COMPUESTOS PLÁSTICOS DE COREA DEL SUR, POR TIPO, 2018-2032 (MILES DE USD)
TABLA 249 MERCADO DE EXTRUSIÓN DE PLÁSTICOS EN COREA DEL SUR, POR SISTEMA DE PELETIZACIÓN, 2018-2032 (MILES DE USD)
TABLA 250 MERCADO DE COMPUESTOS DE PLÁSTICO BASADOS EN MOLDEO POR INYECCIÓN DE COREA DEL SUR, POR SISTEMA DE PELETIZACIÓN, 2018-2032 (MILES DE USD)
TABLA 251 COMPACTACIÓN/PRESIONADO EN EL MERCADO DE COMPUESTOS DE PLÁSTICO DE COREA DEL SUR, POR SISTEMA DE PELETIZACIÓN, 2018-2032 (MILES DE USD)
TABLA 252 MERCADO DE COREA DEL SUR DE AMASADORAS/MEZCLAS BANBURY EN LA FABRICACIÓN DE COMPUESTOS DE PLÁSTICO, POR SISTEMA DE PELETIZACIÓN, 2018-2032 (MILES DE USD)
TABLA 253 MERCADO DE COMPUESTOS PLÁSTICOS DE COREA DEL SUR, POR PROPIEDADES, 2018-2032 (MILES DE USD)
TABLA 254 MERCADO DE COMPUESTOS PLÁSTICOS DE COREA DEL SUR, POR APLICACIÓN, 2018-2032 (MILES DE USD)
TABLA 255 MERCADO DE COMPUESTOS PLÁSTICOS DE COREA DEL SUR, POR APLICACIÓN, 2018-2032 (KILOTONELADAS)
TABLA 256 MERCADO DE COMPUESTOS DE PLÁSTICO PARA AUTOMÓVILES DE COREA DEL SUR, POR CATEGORÍA, 2018-2032 (MILES DE USD)
TABLA 257 COMPONENTES INTERIORES DE COREA DEL SUR EN EL MERCADO DE COMPUESTOS PLÁSTICOS, POR TIPO, 2018-2032 (MILES DE USD)
TABLA 258 PARTES DE CARROCERÍA EXTERIOR DE COREA DEL SUR EN EL MERCADO DE COMPUESTOS DE PLÁSTICO, POR TIPO, 2018-2032 (MILES DE USD)
TABLA 259 APLICACIONES INTERNAS EN COREA DEL SUR EN EL MERCADO DE COMPUESTOS PLÁSTICOS, POR TIPO, 2018-2032 (MILES DE USD)
TABLA 260 MERCADO DE ENVASES DE PLÁSTICO EN COREA DEL SUR, POR CATEGORÍA, 2018-2032 (MILES DE USD)
TABLA 261 MERCADO DE ENVASES DE ALIMENTOS Y BEBIDAS EN COMPUESTOS DE PLÁSTICO DE COREA DEL SUR, POR TIPO, 2018-2032 (MILES DE USD)
TABLA 262 MERCADO DE ENVASES INDUSTRIALES DE COREA DEL SUR EN COMPUESTOS DE PLÁSTICO, POR TIPO, 2018-2032 (MILES DE USD)
TABLA 263 MERCADO DE ENVASES DE BIENES DE CONSUMO EN COMPUESTOS DE PLÁSTICO DE COREA DEL SUR, POR TIPO, 2018-2032 (MILES DE USD)
TABLA 264 MERCADO DE CONSTRUCCIÓN Y EDIFICACIÓN DE COMPUESTOS PLÁSTICOS DE COREA DEL SUR, POR CATEGORÍA, 2018-2032 (MILES DE USD)
TABLA 265 MERCADO DE PRODUCTOS ELÉCTRICOS Y ELECTRÓNICOS EN COMPUESTOS DE PLÁSTICO DE COREA DEL SUR, POR CATEGORÍA, 2018-2032 (MILES DE USD)
TABLA 266 DISPOSITIVOS MÉDICOS DE COREA DEL SUR EN EL MERCADO DE COMPUESTOS DE PLÁSTICO, POR CATEGORÍA, 2018-2032 (MILES DE USD)
TABLA 267 MERCADO DE MUEBLES DE COREA DEL SUR EN COMPUESTOS DE PLÁSTICO, POR CATEGORÍA, 2018-2032 (MILES DE USD)
TABLA 268 MERCADO DE ENERGÍA Y ELECTRICIDAD EN COMPUESTOS DE PLÁSTICO DE COREA DEL SUR, POR CATEGORÍA, 2018-2032 (MILES DE USD)
TABLA 269 MERCADO DE COMPUESTOS PLÁSTICOS DE LA INDUSTRIA AEROESPACIAL Y DE DEFENSA DE COREA DEL SUR, POR CATEGORÍA, 2018-2032 (MILES DE USD)
TABLA 270 MERCADO DE COMPUESTOS PLÁSTICOS DE TAILANDIA, POR TIPO DE POLÍMERO, 2018-2032 (MILES DE USD)
TABLA 271 MERCADO DE COMPUESTOS PLÁSTICOS DE TAILANDIA, POR TIPO DE POLÍMERO, 2018-2032 (KILOTONELADAS)
TABLA 272 MERCADO DE TERMOPLÁSTICOS EN COMPUESTOS PLÁSTICOS DE TAILANDIA, POR TIPO, 2018-2032 (MILES DE USD)
TABLA 273 MERCADO DE POLIETILENO (PE) EN COMPUESTOS PLÁSTICOS DE TAILANDIA, POR TIPO, 2018-2032 (MILES DE USD)
TABLA 274 PLÁSTICOS DE INGENIERÍA DE TAILANDIA EN EL MERCADO DE COMPUESTOS PLÁSTICOS, POR TIPO, 2018-2032 (MILES DE USD)
TABLA 275 PLÁSTICOS TERMOENDURECIBLES DE TAILANDIA EN EL MERCADO DE COMPUESTOS DE PLÁSTICO, POR TIPO, 2018-2032 (MILES DE USD)
TABLA 276 BIOPLÁSTICOS EN EL MERCADO DE COMPUESTOS PLÁSTICOS DE TAILANDIA, POR TIPO, 2018-2032 (MILES DE USD)
TABLA 277 MERCADO DE COMPUESTOS PLÁSTICOS DE TAILANDIA, POR TIPO DE RELLENO, 2018-2032 (MILES DE USD)
TABLA 278 RELLENOS MINERALES EN EL MERCADO DE COMPUESTOS PLÁSTICOS DE TAILANDIA, POR TIPO, 2018-2032 (MILES DE USD)
TABLA 279 REFUERZOS EN EL MERCADO DE COMPUESTOS PLÁSTICOS DE TAILANDIA, POR TIPO, 2018-2032 (MILES DE USD)
TABLA 280 ADITIVOS DE TAILANDIA EN EL MERCADO DE COMPUESTOS PLÁSTICOS, POR TIPO, 2018-2032 (MILES DE USD)
TABLA 281 MERCADO DE COMPUESTOS PLÁSTICOS DE TAILANDIA, POR PROCESO DE FABRICACIÓN, 2018-2032 (MILES DE USD)
TABLA 282 MERCADO DE COMPUESTOS PLÁSTICOS DE TAILANDIA, POR PROCESO DE FABRICACIÓN, 2018-2032 (KILOTONELADAS)
TABLA 283 MERCADO DE EXTRUSIÓN DE PLÁSTICOS EN TAILANDIA, POR TIPO, 2018-2032 (MILES DE USD)
TABLA 284 MERCADO DE EXTRUSIÓN DE PLÁSTICOS EN TAILANDIA, POR SISTEMA DE PELETIZACIÓN, 2018-2032 (MILES DE USD)
TABLA 285 MERCADO DE COMPUESTOS DE PLÁSTICO BASADOS EN MOLDEO POR INYECCIÓN EN TAILANDIA, POR SISTEMA DE PELETIZACIÓN, 2018-2032 (MILES DE USD)
TABLA 286 COMPACTACIÓN/PRESIONADO EN EL MERCADO DE COMPUESTOS DE PLÁSTICO DE TAILANDIA, POR SISTEMA DE PELETIZACIÓN, 2018-2032 (MILES DE USD)
TABLA 287 MERCADO DE MEZCLA DE AMASADORAS/BANBURY EN TAILANDIA PARA COMPUESTOS DE PLÁSTICO, POR SISTEMA DE PELETIZACIÓN, 2018-2032 (MILES DE USD)
TABLA 288 MERCADO DE COMPUESTOS PLÁSTICOS DE TAILANDIA, POR PROPIEDADES, 2018-2032 (MILES DE USD)
TABLA 289 MERCADO DE COMPUESTOS PLÁSTICOS DE TAILANDIA, POR APLICACIÓN, 2018-2032 (MILES DE USD)
TABLA 290 MERCADO DE COMPUESTOS PLÁSTICOS DE TAILANDIA, POR APLICACIÓN, 2018-2032 (KILOTONELADAS)
TABLA 291 MERCADO DE COMPUESTOS DE PLÁSTICO EN AUTOMÓVILES DE TAILANDIA, POR CATEGORÍA, 2018-2032 (MILES DE USD)
TABLA 292 COMPONENTES INTERIORES DE TAILANDIA EN EL MERCADO DE COMPUESTOS PLÁSTICOS, POR TIPO, 2018-2032 (MILES DE USD)
TABLA 293 PIEZAS DE CARROCERÍA EXTERIOR EN EL MERCADO DE COMPUESTOS DE PLÁSTICO DE TAILANDIA, POR TIPO, 2018-2032 (MILES DE USD)
TABLA 294 APLICACIONES INTERNAS EN TAILANDIA EN EL MERCADO DE COMPUESTOS PLÁSTICOS, POR TIPO, 2018-2032 (MILES DE USD)
TABLA 295 MERCADO DE ENVASES DE PLÁSTICO EN TAILANDIA, POR CATEGORÍA, 2018-2032 (MILES DE USD)
TABLA 296 ENVASES DE ALIMENTOS Y BEBIDAS EN EL MERCADO DE COMPUESTOS DE PLÁSTICO DE TAILANDIA, POR TIPO, 2018-2032 (MILES DE USD)
TABLA 297 MERCADO DE ENVASES INDUSTRIALES DE TAILANDIA EN COMPUESTOS DE PLÁSTICO, POR TIPO, 2018-2032 (MILES DE USD)
TABLA 298 ENVASES DE BIENES DE CONSUMO EN EL MERCADO DE COMPUESTOS PLÁSTICOS DE TAILANDIA, POR TIPO, 2018-2032 (MILES DE USD)
TABLA 299 MERCADO DE CONSTRUCCIÓN Y EDIFICACIÓN DE PLÁSTICOS EN TAILANDIA, POR CATEGORÍA, 2018-2032 (MILES DE USD)
TABLA 300 MERCADO DE PRODUCTOS ELÉCTRICOS Y ELECTRÓNICOS EN COMPUESTOS DE PLÁSTICO DE TAILANDIA, POR CATEGORÍA, 2018-2032 (MILES DE USD)
TABLA 301 DISPOSITIVOS MÉDICOS EN EL MERCADO DE COMPUESTOS PLÁSTICOS DE TAILANDIA, POR CATEGORÍA, 2018-2032 (MILES DE USD)
TABLA 302 MERCADO DE MUEBLES DE TAILANDIA EN COMPUESTOS DE PLÁSTICO, POR CATEGORÍA, 2018-2032 (MILES DE USD)
TABLA 303 ENERGÍA Y ELECTRICIDAD EN EL MERCADO DE COMPUESTOS DE PLÁSTICO DE TAILANDIA, POR CATEGORÍA, 2018-2032 (MILES DE USD)
TABLA 304 MERCADO DE COMPUESTOS PLÁSTICOS DE LA INDUSTRIA AEROESPACIAL Y DE DEFENSA DE TAILANDIA, POR CATEGORÍA, 2018-2032 (MILES DE USD)
TABLA 305 MERCADO DE COMPUESTOS PLÁSTICOS DE SINGAPUR, POR TIPO DE POLÍMERO, 2018-2032 (MILES DE USD)
TABLA 306 MERCADO DE COMPUESTOS PLÁSTICOS DE SINGAPUR, POR TIPO DE POLÍMERO, 2018-2032 (KILOTONELADAS)
TABLA 307 MERCADO DE TERMOPLÁSTICOS EN COMPUESTOS PLÁSTICOS DE SINGAPUR, POR TIPO, 2018-2032 (MILES DE USD)
TABLA 308 MERCADO DE POLIETILENO (PE) EN COMPUESTOS PLÁSTICOS DE SINGAPUR, POR TIPO, 2018-2032 (MILES DE USD)
TABLA 309 PLÁSTICOS DE INGENIERÍA DE SINGAPUR EN EL MERCADO DE COMPUESTOS PLÁSTICOS, POR TIPO, 2018-2032 (MILES DE USD)
TABLA 310 PLÁSTICOS TERMOESTABLECIDOS DE SINGAPUR EN EL MERCADO DE COMPUESTOS PLÁSTICOS, POR TIPO, 2018-2032 (MILES DE USD)
TABLA 311 BIOPLÁSTICOS DE SINGAPUR EN EL MERCADO DE COMPUESTOS PLÁSTICOS, POR TIPO, 2018-2032 (MILES DE USD)
TABLA 312 MERCADO DE COMPUESTOS PLÁSTICOS DE SINGAPUR, POR TIPO DE RELLENO, 2018-2032 (MILES DE USD)
TABLA 313 RELLENOS MINERALES EN EL MERCADO DE COMPUESTOS PLÁSTICOS DE SINGAPUR, POR TIPO, 2018-2032 (MILES DE USD)
TABLA 314 REFUERZOS EN EL MERCADO DE COMPUESTOS PLÁSTICOS DE SINGAPUR, POR TIPO, 2018-2032 (MILES DE USD)
TABLA 315 ADITIVOS DE SINGAPUR EN EL MERCADO DE COMPUESTOS PLÁSTICOS, POR TIPO, 2018-2032 (MILES DE USD)
TABLA 316 MERCADO DE COMPUESTOS DE PLÁSTICO DE SINGAPUR, POR PROCESO DE FABRICACIÓN, 2018-2032 (MILES DE USD)
TABLA 317 MERCADO DE COMPUESTOS DE PLÁSTICO DE SINGAPUR, POR PROCESO DE FABRICACIÓN, 2018-2032 (KILOTONELADAS)
TABLA 318 MERCADO DE EXTRUSIÓN DE COMPUESTOS PLÁSTICOS DE SINGAPUR, POR TIPO, 2018-2032 (MILES DE USD)
TABLA 319 MERCADO DE EXTRUSIÓN DE PLÁSTICOS EN SINGAPUR, POR SISTEMA DE PELETIZACIÓN, 2018-2032 (MILES DE USD)
TABLA 320 MERCADO DE COMPUESTOS DE PLÁSTICO BASADOS EN MOLDEO POR INYECCIÓN EN SINGAPUR, POR SISTEMA DE PELETIZACIÓN, 2018-2032 (MILES DE USD)
TABLA 321 COMPACTACIÓN/PRESIONADO EN EL MERCADO DE COMPUESTOS DE PLÁSTICO EN SINGAPUR, POR SISTEMA DE PELETIZACIÓN, 2018-2032 (MILES DE USD)
TABLA 322 AMASADORA DE SINGAPUR/MEZCLA BANBURY EN EL MERCADO DE COMPUESTOS DE PLÁSTICO, POR SISTEMA DE PELETIZACIÓN, 2018-2032 (MILES DE USD)
TABLA 323 MERCADO DE COMPUESTOS PLÁSTICOS DE SINGAPUR, POR PROPIEDADES, 2018-2032 (MILES DE USD)
TABLA 324 MERCADO DE COMPUESTOS PLÁSTICOS DE SINGAPUR, POR APLICACIÓN, 2018-2032 (MILES DE USD)
TABLA 325 MERCADO DE COMPUESTOS PLÁSTICOS DE SINGAPUR, POR APLICACIÓN, 2018-2032 (KILOTONELADAS)
TABLA 326 MERCADO DE COMPUESTOS DE PLÁSTICO EN AUTOMÓVILES DE SINGAPUR, POR CATEGORÍA, 2018-2032 (MILES DE USD)
TABLA 327 COMPONENTES DE INTERIOR DE SINGAPUR EN EL MERCADO DE COMPUESTOS DE PLÁSTICO, POR TIPO, 2018-2032 (MILES DE USD)
TABLA 328 PIEZAS DE CARROCERÍA EXTERIOR DE SINGAPUR EN EL MERCADO DE COMPUESTOS DE PLÁSTICO, POR TIPO, 2018-2032 (MILES DE USD)
TABLA 329 APLICACIONES INTERNAS EN EL MERCADO DE COMPUESTOS PLÁSTICOS DE SINGAPUR, POR TIPO, 2018-2032 (MILES DE USD)
TABLA 330 MERCADO DE ENVASES DE PLÁSTICO EN SINGAPUR, POR CATEGORÍA, 2018-2032 (MILES DE USD)
TABLA 331 ENVASES DE ALIMENTOS Y BEBIDAS EN EL MERCADO DE COMPUESTOS DE PLÁSTICO DE SINGAPUR, POR TIPO, 2018-2032 (MILES DE USD)
TABLA 332 MERCADO DE ENVASES INDUSTRIALES DE SINGAPUR EN COMPUESTOS DE PLÁSTICO, POR TIPO, 2018-2032 (MILES DE USD)
TABLA 333 ENVASES DE BIENES DE CONSUMO EN EL MERCADO DE COMPUESTOS PLÁSTICOS DE SINGAPUR, POR TIPO, 2018-2032 (MILES DE USD)
TABLA 334 MERCADO DE CONSTRUCCIÓN Y EDIFICACIÓN DE SINGAPUR EN EL MERCADO DE COMPUESTOS DE PLÁSTICO, POR CATEGORÍA, 2018-2032 (MILES DE USD)
TABLA 335 MERCADO DE PRODUCTOS ELÉCTRICOS Y ELECTRÓNICOS EN COMPUESTOS DE PLÁSTICO DE SINGAPUR, POR CATEGORÍA, 2018-2032 (MILES DE USD)
TABLA 336 DISPOSITIVOS MÉDICOS DE SINGAPUR EN EL MERCADO DE COMPUESTOS DE PLÁSTICO, POR CATEGORÍA, 2018-2032 (MILES DE USD)
TABLA 337 MERCADO DE MUEBLES DE SINGAPUR EN COMPUESTOS DE PLÁSTICO, POR CATEGORÍA, 2018-2032 (MILES DE USD)
TABLA 338 MERCADO DE ENERGÍA Y ELECTRICIDAD EN SINGAPUR, POR CATEGORÍA, 2018-2032 (MILES DE USD)
TABLA 339 SINGAPUR, MERCADO DE COMPUESTOS PLÁSTICOS DE LA INDUSTRIA AEROESPACIAL Y DE DEFENSA, POR CATEGORÍA, 2018-2032 (MILES DE USD)
TABLA 340 MERCADO DE COMPUESTOS PLÁSTICOS DE INDONESIA, POR TIPO DE POLÍMERO, 2018-2032 (MILES DE USD)
TABLA 341 MERCADO DE COMPUESTOS PLÁSTICOS DE INDONESIA, POR TIPO DE POLÍMERO, 2018-2032 (KILOTONELADAS)
TABLA 342 MERCADO DE TERMOPLÁSTICOS EN COMPUESTOS PLÁSTICOS DE INDONESIA, POR TIPO, 2018-2032 (MILES DE USD)
TABLA 343 MERCADO DE POLIETILENO (PE) EN COMPUESTOS PLÁSTICOS DE INDONESIA, POR TIPO, 2018-2032 (MILES DE USD)
TABLA 344 PLÁSTICOS DE INGENIERÍA EN EL MERCADO DE COMPUESTOS PLÁSTICOS DE INDONESIA, POR TIPO, 2018-2032 (MILES DE USD)
TABLA 345 PLÁSTICOS TERMOENDURECIBLES DE INDONESIA EN EL MERCADO DE COMPUESTOS DE PLÁSTICO, POR TIPO, 2018-2032 (MILES DE USD)
TABLA 346 BIOPLÁSTICOS EN EL MERCADO DE COMPUESTOS PLÁSTICOS DE INDONESIA, POR TIPO, 2018-2032 (MILES DE USD)
TABLA 347 MERCADO DE COMPUESTOS PLÁSTICOS DE INDONESIA, POR TIPO DE RELLENO, 2018-2032 (MILES DE USD)
TABLA 348 RELLENOS MINERALES EN EL MERCADO DE COMPUESTOS PLÁSTICOS DE INDONESIA, POR TIPO, 2018-2032 (MILES DE USD)
TABLA 349 MERCADO DE REFUERZOS DE COMPUESTOS PLÁSTICOS DE INDONESIA, POR TIPO, 2018-2032 (MILES DE USD)
TABLA 350 ADITIVOS EN EL MERCADO DE COMPUESTOS PLÁSTICOS DE INDONESIA, POR TIPO, 2018-2032 (MILES DE USD)
TABLA 351 MERCADO DE COMPUESTOS PLÁSTICOS DE INDONESIA, POR PROCESO DE FABRICACIÓN, 2018-2032 (MILES DE USD)
TABLA 352 MERCADO DE COMPUESTOS PLÁSTICOS DE INDONESIA, POR PROCESO DE FABRICACIÓN, 2018-2032 (KILOTONELADAS)
TABLA 353 MERCADO DE EXTRUSIÓN DE COMPUESTOS PLÁSTICOS EN INDONESIA, POR TIPO, 2018-2032 (MILES DE USD)
TABLA 354 MERCADO DE EXTRUSIÓN DE PLÁSTICOS COMPUESTOS EN INDONESIA, POR SISTEMA DE PELETIZACIÓN, 2018-2032 (MILES DE USD)
TABLA 355 MERCADO DE COMPUESTOS DE PLÁSTICO BASADOS EN MOLDEO POR INYECCIÓN EN INDONESIA, POR SISTEMA DE PELETIZACIÓN, 2018-2032 (MILES DE USD)
TABLA 356 COMPACTACIÓN/PRESIONADO EN EL MERCADO DE COMPUESTOS DE PLÁSTICO DE INDONESIA, POR SISTEMA DE PELETIZACIÓN, 2018-2032 (MILES DE USD)
TABLA 357 MERCADO DE MEZCLA DE AMASADORAS/BANBURY EN LA FABRICACIÓN DE COMPUESTOS DE PLÁSTICO DE INDONESIA, POR SISTEMA DE PELETIZACIÓN, 2018-2032 (MILES DE USD)
TABLA 358 MERCADO DE COMPUESTOS PLÁSTICOS DE INDONESIA, POR PROPIEDADES, 2018-2032 (MILES DE USD)
TABLA 359 MERCADO DE COMPUESTOS PLÁSTICOS DE INDONESIA, POR APLICACIÓN, 2018-2032 (MILES DE USD)
TABLA 360 MERCADO DE COMPUESTOS PLÁSTICOS DE INDONESIA, POR APLICACIÓN, 2018-2032 (KILOTONELADAS)
TABLA 361 MERCADO DE COMPUESTOS PLÁSTICOS AUTOMOTRICES DE INDONESIA, POR CATEGORÍA, 2018-2032 (MILES DE USD)
TABLA 362 COMPONENTES INTERIORES EN EL MERCADO DE COMPUESTOS PLÁSTICOS DE INDONESIA, POR TIPO, 2018-2032 (MILES DE USD)
TABLA 363 INDONESIA: PIEZAS DE CARROCERÍA EXTERIOR EN EL MERCADO DE COMPUESTOS PLÁSTICOS, POR TIPO, 2018-2032 (MILES DE USD)
TABLA 364 APLICACIONES INTERNAS EN EL MERCADO DE COMPUESTOS PLÁSTICOS DE INDONESIA, POR TIPO, 2018-2032 (MILES DE USD)
TABLA 365 MERCADO DE ENVASES DE PLÁSTICO EN INDONESIA, POR CATEGORÍA, 2018-2032 (MILES DE USD)
TABLA 366 MERCADO DE ENVASES DE ALIMENTOS Y BEBIDAS EN COMPUESTOS DE PLÁSTICO DE INDONESIA, POR TIPO, 2018-2032 (MILES DE USD)
TABLA 367 MERCADO DE ENVASES INDUSTRIALES DE COMPUESTOS PLÁSTICOS DE INDONESIA, POR TIPO, 2018-2032 (MILES DE USD)
TABLA 368 MERCADO DE ENVASES DE BIENES DE CONSUMO EN INDONESIA, POR TIPO, 2018-2032 (MILES DE USD)
TABLA 369 MERCADO DE CONSTRUCCIÓN Y EDIFICACIÓN DE COMPUESTOS PLÁSTICOS EN INDONESIA, POR CATEGORÍA, 2018-2032 (MILES DE USD)
TABLA 370 MERCADO DE PRODUCTOS ELÉCTRICOS Y ELECTRÓNICOS EN COMPUESTOS DE PLÁSTICO DE INDONESIA, POR CATEGORÍA, 2018-2032 (MILES DE USD)
TABLA 371 MERCADO DE DISPOSITIVOS MÉDICOS DE INDONESIA EN COMPUESTOS DE PLÁSTICO, POR CATEGORÍA, 2018-2032 (MILES DE USD)
TABLA 372 MERCADO DE MUEBLES DE INDONESIA EN COMPUESTOS DE PLÁSTICO, POR CATEGORÍA, 2018-2032 (MILES DE USD)
TABLA 373 MERCADO DE ENERGÍA Y ELECTRICIDAD EN COMPUESTOS DE PLÁSTICO EN INDONESIA, POR CATEGORÍA, 2018-2032 (MILES DE USD)
TABLA 374 INDONESIA: MERCADO DE COMPUESTOS PLÁSTICOS AEROESPACIALES Y DE DEFENSA, POR CATEGORÍA, 2018-2032 (MILES DE USD)
TABLA 375 MERCADO DE COMPUESTOS PLÁSTICOS DE AUSTRALIA, POR TIPO DE POLÍMERO, 2018-2032 (MILES DE USD)
TABLA 376 MERCADO DE COMPUESTOS PLÁSTICOS DE AUSTRALIA, POR TIPO DE POLÍMERO, 2018-2032 (KILOTONELADAS)
TABLA 377 MERCADO DE TERMOPLÁSTICOS EN COMPUESTOS PLÁSTICOS DE AUSTRALIA, POR TIPO, 2018-2032 (MILES DE USD)
TABLA 378 MERCADO DE POLIETILENO (PE) EN COMPUESTOS PLÁSTICOS DE AUSTRALIA, POR TIPO, 2018-2032 (MILES DE USD)
TABLA 379 PLÁSTICOS DE INGENIERÍA DE AUSTRALIA EN EL MERCADO DE COMPUESTOS DE PLÁSTICO, POR TIPO, 2018-2032 (MILES DE USD)
TABLA 380 PLÁSTICOS TERMOENDURECIBLES DE AUSTRALIA EN EL MERCADO DE COMPUESTOS DE PLÁSTICO, POR TIPO, 2018-2032 (MILES DE USD)
TABLA 381 AUSTRALIA BIOPLÁSTICOS EN EL MERCADO DE COMPUESTOS PLÁSTICOS, POR TIPO, 2018-2032 (MILES DE USD)
TABLA 382 MERCADO DE COMPUESTOS PLÁSTICOS DE AUSTRALIA, POR TIPO DE RELLENO, 2018-2032 (MILES DE USD)
TABLA 383 AUSTRALIA: RELLENOS MINERALES EN EL MERCADO DE COMPUESTOS PLÁSTICOS, POR TIPO, 2018-2032 (MILES DE USD)
TABLA 384 REFUERZOS EN EL MERCADO DE COMPUESTOS PLÁSTICOS DE AUSTRALIA, POR TIPO, 2018-2032 (MILES DE USD)
TABLA 385 ADITIVOS DE AUSTRALIA EN EL MERCADO DE COMPUESTOS PLÁSTICOS, POR TIPO, 2018-2032 (MILES DE USD)
TABLA 386 MERCADO DE COMPUESTOS DE PLÁSTICO DE AUSTRALIA, POR PROCESO DE FABRICACIÓN, 2018-2032 (MILES DE USD)
TABLA 387 MERCADO DE COMPUESTOS DE PLÁSTICO DE AUSTRALIA, POR PROCESO DE FABRICACIÓN, 2018-2032 (KILOTONELADAS)
TABLA 388 MERCADO DE EXTRUSIÓN DE COMPUESTOS PLÁSTICOS DE AUSTRALIA, POR TIPO, 2018-2032 (MILES DE USD)
TABLA 389 MERCADO DE EXTRUSIÓN DE PLÁSTICOS EN AUSTRALIA, POR SISTEMA DE PELETIZACIÓN, 2018-2032 (MILES DE USD)
TABLA 390 MERCADO DE COMPUESTOS DE PLÁSTICO BASADOS EN MOLDEO POR INYECCIÓN DE AUSTRALIA, POR SISTEMA DE PELETIZACIÓN, 2018-2032 (MILES DE USD)
TABLA 391 COMPACTACIÓN/PRESIONADO EN EL MERCADO DE COMPUESTOS DE PLÁSTICO DE AUSTRALIA, POR SISTEMA DE PELETIZACIÓN, 2018-2032 (MILES DE USD)
TABLA 392 MERCADO DE AUSTRALIA DE MEZCLAS DE AMASADORAS/BANBURY EN LA FABRICACIÓN DE COMPUESTOS DE PLÁSTICO, POR SISTEMA DE PELETIZACIÓN, 2018-2032 (MILES DE USD)
TABLA 393 MERCADO DE COMPUESTOS PLÁSTICOS DE AUSTRALIA, POR PROPIEDADES, 2018-2032 (MILES DE USD)
TABLA 394 MERCADO DE COMPUESTOS PLÁSTICOS DE AUSTRALIA, POR APLICACIÓN, 2018-2032 (MILES DE USD)
TABLA 395 MERCADO DE COMPUESTOS PLÁSTICOS DE AUSTRALIA, POR APLICACIÓN, 2018-2032 (KILOTONELADAS)
TABLA 396 MERCADO DE COMPUESTOS DE PLÁSTICO EN AUTOMÓVILES DE AUSTRALIA, POR CATEGORÍA, 2018-2032 (MILES DE USD)
TABLA 397 COMPONENTES DE INTERIOR DE AUSTRALIA EN EL MERCADO DE COMPUESTOS DE PLÁSTICO, POR TIPO, 2018-2032 (MILES DE USD)
TABLA 398 AUSTRALIA: PIEZAS DE CARROCERÍA EXTERIOR EN EL MERCADO DE COMPUESTOS DE PLÁSTICO, POR TIPO, 2018-2032 (MILES DE USD)
TABLA 399 APLICACIONES INTERNAS EN AUSTRALIA EN EL MERCADO DE COMPUESTOS PLÁSTICOS, POR TIPO, 2018-2032 (MILES DE USD)
TABLA 400 MERCADO DE ENVASES DE PLÁSTICO EN AUSTRALIA, POR CATEGORÍA, 2018-2032 (MILES DE USD)
TABLA 401 MERCADO DE ENVASES DE ALIMENTOS Y BEBIDAS EN AUSTRALIA, POR TIPO, 2018-2032 (MILES DE USD)
TABLA 402 MERCADO DE ENVASES INDUSTRIALES DE AUSTRALIA EN COMPUESTOS DE PLÁSTICO, POR TIPO, 2018-2032 (MILES DE USD)
TABLA 403 MERCADO DE ENVASES DE BIENES DE CONSUMO EN AUSTRALIA, POR TIPO, 2018-2032 (MILES DE USD)
TABLA 404 MERCADO DE CONSTRUCCIÓN Y EDIFICACIÓN DE PLÁSTICOS EN AUSTRALIA, POR CATEGORÍA, 2018-2032 (MILES DE USD)
TABLA 405 MERCADO DE PRODUCTOS ELÉCTRICOS Y ELECTRÓNICOS EN COMPUESTOS DE PLÁSTICO DE AUSTRALIA, POR CATEGORÍA, 2018-2032 (MILES DE USD)
TABLA 406 MERCADO DE DISPOSITIVOS MÉDICOS DE AUSTRALIA EN COMPUESTOS DE PLÁSTICO, POR CATEGORÍA, 2018-2032 (MILES DE USD)
TABLA 407 MERCADO DE MUEBLES DE AUSTRALIA EN COMPUESTOS DE PLÁSTICO, POR CATEGORÍA, 2018-2032 (MILES DE USD)
TABLA 408 AUSTRALIA ENERGÍA Y ELECTRICIDAD EN EL MERCADO DE COMPUESTOS DE PLÁSTICO, POR CATEGORÍA, 2018-2032 (MILES DE USD)
TABLA 409 AUSTRALIA AEROESPACIAL Y DEFENSA EN EL MERCADO DE COMPUESTOS PLÁSTICOS, POR CATEGORÍA, 2018-2032 (MILES DE USD)
TABLA 410 MERCADO DE COMPUESTOS PLÁSTICOS DE NUEVA ZELANDA, POR TIPO DE POLÍMERO, 2018-2032 (MILES DE USD)
TABLA 411 MERCADO DE COMPUESTOS PLÁSTICOS DE NUEVA ZELANDA, POR TIPO DE POLÍMERO, 2018-2032 (KILOTONELADAS)
TABLA 412 MERCADO DE TERMOPLÁSTICOS EN COMPUESTOS PLÁSTICOS DE NUEVA ZELANDA, POR TIPO, 2018-2032 (MILES DE USD)
TABLA 413 MERCADO DE POLIETILENO (PE) EN COMPUESTOS PLÁSTICOS DE NUEVA ZELANDA, POR TIPO, 2018-2032 (MILES DE USD)
TABLA 414 PLÁSTICOS DE INGENIERÍA DE NUEVA ZELANDA EN EL MERCADO DE COMPUESTOS PLÁSTICOS, POR TIPO, 2018-2032 (MILES DE USD)
TABLA 415 PLÁSTICOS TERMOENDURECIBLES DE NUEVA ZELANDA EN EL MERCADO DE COMPUESTOS DE PLÁSTICO, POR TIPO, 2018-2032 (MILES DE USD)
TABLA 416 BIOPLÁSTICOS DE NUEVA ZELANDA EN EL MERCADO DE COMPUESTOS PLÁSTICOS, POR TIPO, 2018-2032 (MILES DE USD)
TABLA 417 MERCADO DE COMPUESTOS PLÁSTICOS DE NUEVA ZELANDA, POR TIPO DE RELLENO, 2018-2032 (MILES DE USD)
TABLA 418 RELLENOS MINERALES DE NUEVA ZELANDA EN EL MERCADO DE COMPUESTOS PLÁSTICOS, POR TIPO, 2018-2032 (MILES DE USD)
TABLA 419 REFUERZOS DE NUEVA ZELANDA EN EL MERCADO DE COMPUESTOS PLÁSTICOS, POR TIPO, 2018-2032 (MILES DE USD)
TABLA 420 ADITIVOS DE NUEVA ZELANDA EN EL MERCADO DE COMPUESTOS PLÁSTICOS, POR TIPO, 2018-2032 (MILES DE USD)
TABLA 421 MERCADO DE COMPUESTOS PLÁSTICOS DE NUEVA ZELANDA, POR PROCESO DE FABRICACIÓN, 2018-2032 (MILES DE USD)
TABLA 422 MERCADO DE COMPUESTOS PLÁSTICOS DE NUEVA ZELANDA, POR PROCESO DE FABRICACIÓN, 2018-2032 (KILOTONELADAS)
TABLA 423 MERCADO DE EXTRUSIÓN DE COMPUESTOS PLÁSTICOS DE NUEVA ZELANDA, POR TIPO, 2018-2032 (MILES DE USD)
TABLA 424 MERCADO DE EXTRUSIÓN DE PLÁSTICOS EN NUEVA ZELANDA, POR SISTEMA DE PELETIZACIÓN, 2018-2032 (MILES DE USD)
TABLA 425 MERCADO DE COMPUESTOS DE PLÁSTICO BASADOS EN MOLDEO POR INYECCIÓN DE NUEVA ZELANDA, POR SISTEMA DE PELETIZACIÓN, 2018-2032 (MILES DE USD)
TABLA 426 COMPACTACIÓN/PRESIONADO EN EL MERCADO DE COMPUESTOS DE PLÁSTICO DE NUEVA ZELANDA, POR SISTEMA DE PELETIZACIÓN, 2018-2032 (MILES DE USD)
TABLA 427 MERCADO DE AMASADORAS/MEZCLAS BANBURY DE NUEVA ZELANDA EN LA FABRICACIÓN DE COMPUESTOS DE PLÁSTICO, POR SISTEMA DE PELETIZACIÓN, 2018-2032 (MILES DE USD)
TABLA 428 MERCADO DE COMPUESTOS PLÁSTICOS DE NUEVA ZELANDA, POR PROPIEDADES, 2018-2032 (MILES DE USD)
TABLA 429 MERCADO DE COMPUESTOS PLÁSTICOS DE NUEVA ZELANDA, POR APLICACIÓN, 2018-2032 (MILES DE USD)
TABLA 430 MERCADO DE COMPUESTOS PLÁSTICOS DE NUEVA ZELANDA, POR APLICACIÓN, 2018-2032 (KILOTONELADAS)
TABLA 431 MERCADO DE COMPUESTOS PLÁSTICOS AUTOMOTRICES DE NUEVA ZELANDA, POR CATEGORÍA, 2018-2032 (MILES DE USD)
TABLA 432 COMPONENTES DE INTERIOR DE NUEVA ZELANDA EN EL MERCADO DE COMPUESTOS PLÁSTICOS, POR TIPO, 2018-2032 (MILES DE USD)
TABLA 433 PIEZAS DE CARROCERÍA EXTERIOR DE NUEVA ZELANDA EN EL MERCADO DE COMPUESTOS PLÁSTICOS, POR TIPO, 2018-2032 (MILES DE USD)
TABLA 434 APLICACIONES INTERNAS EN NUEVA ZELANDA EN EL MERCADO DE COMPUESTOS PLÁSTICOS, POR TIPO, 2018-2032 (MILES DE USD)
TABLA 435 MERCADO DE ENVASES DE PLÁSTICO EN NUEVA ZELANDA, POR CATEGORÍA, 2018-2032 (MILES DE USD)
TABLA 436 MERCADO DE ENVASES DE ALIMENTOS Y BEBIDAS EN COMPUESTOS DE PLÁSTICO DE NUEVA ZELANDA, POR TIPO, 2018-2032 (MILES DE USD)
TABLA 437 MERCADO DE ENVASES INDUSTRIALES DE NUEVA ZELANDA EN COMPUESTOS DE PLÁSTICO, POR TIPO, 2018-2032 (MILES DE USD)
TABLA 438 MERCADO DE ENVASES DE BIENES DE CONSUMO EN COMPUESTOS DE PLÁSTICO DE NUEVA ZELANDA, POR TIPO, 2018-2032 (MILES DE USD)
TABLA 439 MERCADO DE CONSTRUCCIÓN Y EDIFICACIÓN DE COMPUESTOS PLÁSTICOS DE NUEVA ZELANDA, POR CATEGORÍA, 2018-2032 (MILES DE USD)
TABLA 440 MERCADO DE PRODUCTOS ELÉCTRICOS Y ELECTRÓNICOS EN COMPUESTOS DE PLÁSTICO DE NUEVA ZELANDA, POR CATEGORÍA, 2018-2032 (MILES DE USD)
TABLA 441 MERCADO DE DISPOSITIVOS MÉDICOS DE NUEVA ZELANDA EN COMPUESTOS DE PLÁSTICO, POR CATEGORÍA, 2018-2032 (MILES DE USD)
TABLA 442 MERCADO DE MUEBLES DE NUEVA ZELANDA EN COMPUESTOS DE PLÁSTICO, POR CATEGORÍA, 2018-2032 (MILES DE USD)
TABLA 443 MERCADO DE ENERGÍA Y ELECTRICIDAD EN COMPUESTOS DE PLÁSTICO DE NUEVA ZELANDA, POR CATEGORÍA, 2018-2032 (MILES DE USD)
TABLA 444 MERCADO DE COMPUESTOS PLÁSTICOS DE LA INDUSTRIA AEROESPACIAL Y DE DEFENSA DE NUEVA ZELANDA, POR CATEGORÍA, 2018-2032 (MILES DE USD)
TABLA 445 MERCADO DE COMPUESTOS PLÁSTICOS DE FILIPINAS, POR TIPO DE POLÍMERO, 2018-2032 (MILES DE USD)
TABLA 446 MERCADO DE COMPUESTOS PLÁSTICOS DE FILIPINAS, POR TIPO DE POLÍMERO, 2018-2032 (KILOTONELADAS)
TABLA 447 MERCADO DE TERMOPLÁSTICOS EN COMPUESTOS PLÁSTICOS DE FILIPINAS, POR TIPO, 2018-2032 (MILES DE USD)
TABLA 448 MERCADO DE POLIETILENO (PE) EN COMPUESTOS PLÁSTICOS DE FILIPINAS, POR TIPO, 2018-2032 (MILES DE USD)
TABLA 449 PLÁSTICOS DE INGENIERÍA EN EL MERCADO DE COMPUESTOS PLÁSTICOS DE FILIPINAS, POR TIPO, 2018-2032 (MILES DE USD)
TABLA 450 PLÁSTICOS TERMOENDURECIBLES DE FILIPINAS EN EL MERCADO DE COMPUESTOS DE PLÁSTICO, POR TIPO, 2018-2032 (MILES DE USD)
TABLA 451 BIOPLÁSTICOS EN EL MERCADO DE COMPUESTOS PLÁSTICOS DE FILIPINAS, POR TIPO, 2018-2032 (MILES DE USD)
TABLA 452 MERCADO DE COMPUESTOS PLÁSTICOS DE FILIPINAS, POR TIPO DE RELLENO, 2018-2032 (MILES DE USD)
TABLA 453 RELLENOS MINERALES EN EL MERCADO DE COMPUESTOS PLÁSTICOS DE FILIPINAS, POR TIPO, 2018-2032 (MILES DE USD)
TABLA 454 REFUERZOS EN EL MERCADO DE COMPUESTOS PLÁSTICOS DE FILIPINAS, POR TIPO, 2018-2032 (MILES DE USD)
TABLA 455 ADITIVOS EN EL MERCADO DE COMPUESTOS PLÁSTICOS DE FILIPINAS, POR TIPO, 2018-2032 (MILES DE USD)
TABLA 456 MERCADO DE COMPUESTOS PLÁSTICOS DE FILIPINAS, POR PROCESO DE FABRICACIÓN, 2018-2032 (MILES DE USD)
TABLA 457 MERCADO DE COMPUESTOS PLÁSTICOS DE FILIPINAS, POR PROCESO DE FABRICACIÓN, 2018-2032 (KILOTONELADAS)
TABLA 458 MERCADO DE EXTRUSIÓN DE COMPUESTOS PLÁSTICOS EN FILIPINAS, POR TIPO, 2018-2032 (MILES DE USD)
TABLA 459 MERCADO DE EXTRUSIÓN DE PLÁSTICOS EN FILIPINAS, POR SISTEMA DE PELETIZACIÓN, 2018-2032 (MILES DE USD)
TABLA 460 MERCADO DE COMPUESTOS DE PLÁSTICO BASADOS EN MOLDEO POR INYECCIÓN EN FILIPINAS, POR SISTEMA DE PELETIZACIÓN, 2018-2032 (MILES DE USD)
TABLA 461 COMPACTACIÓN/PRESIONADO EN EL MERCADO DE COMPUESTOS DE PLÁSTICO EN FILIPINAS, POR SISTEMA DE PELETIZACIÓN, 2018-2032 (MILES DE USD)
TABLA 462 MERCADO DE MEZCLAS DE AMASADORAS/BANBURY EN FILIPINAS PARA COMPUESTOS DE PLÁSTICO, POR SISTEMA DE PELETIZACIÓN, 2018-2032 (MILES DE USD)
TABLA 463 MERCADO DE COMPUESTOS PLÁSTICOS DE FILIPINAS, POR PROPIEDADES, 2018-2032 (MILES DE USD)
TABLA 464 MERCADO DE COMPUESTOS PLÁSTICOS DE FILIPINAS, POR APLICACIÓN, 2018-2032 (MILES DE USD)
TABLA 465 MERCADO DE COMPUESTOS PLÁSTICOS DE FILIPINAS, POR APLICACIÓN, 2018-2032 (KILOTONELADAS)
TABLA 466 MERCADO DE COMPUESTOS DE PLÁSTICO EN AUTOMÓVILES DE FILIPINAS, POR CATEGORÍA, 2018-2032 (MILES DE USD)
TABLA 467 COMPONENTES INTERIORES EN EL MERCADO DE COMPUESTOS PLÁSTICOS DE FILIPINAS, POR TIPO, 2018-2032 (MILES DE USD)
TABLA 468 PIEZAS DE CARROCERÍA EXTERIOR EN EL MERCADO DE COMPUESTOS DE PLÁSTICO DE FILIPINAS, POR TIPO, 2018-2032 (MILES DE USD)
TABLA 469 APLICACIONES INTERNAS EN EL MERCADO DE COMPUESTOS PLÁSTICOS DE FILIPINAS, POR TIPO, 2018-2032 (MILES DE USD)
TABLA 470 MERCADO DE ENVASES DE PLÁSTICO EN FILIPINAS, POR CATEGORÍA, 2018-2032 (MILES DE USD)
TABLA 471 MERCADO DE ENVASES DE ALIMENTOS Y BEBIDAS EN FILIPINAS, POR TIPO, 2018-2032 (MILES DE USD)
TABLA 472 MERCADO DE ENVASES INDUSTRIALES DE FILIPINAS PARA COMPUESTOS DE PLÁSTICO, POR TIPO, 2018-2032 (MILES DE USD)
TABLA 473 MERCADO DE ENVASES DE BIENES DE CONSUMO EN FILIPINAS, POR TIPO, 2018-2032 (MILES DE USD)
TABLA 474 MERCADO DE CONSTRUCCIÓN Y EDIFICACIÓN DE COMPUESTOS DE PLÁSTICO EN FILIPINAS, POR CATEGORÍA, 2018-2032 (MILES DE USD)
TABLA 475 MERCADO DE PRODUCTOS ELÉCTRICOS Y ELECTRÓNICOS EN COMPUESTOS DE PLÁSTICO DE FILIPINAS, POR CATEGORÍA, 2018-2032 (MILES DE USD)
TABLA 476 MERCADO DE DISPOSITIVOS MÉDICOS DE FILIPINAS EN COMPUESTOS DE PLÁSTICO, POR CATEGORÍA, 2018-2032 (MILES DE USD)
TABLA 477 MERCADO DE MUEBLES DE FILIPINAS EN COMPUESTOS DE PLÁSTICO, POR CATEGORÍA, 2018-2032 (MILES DE USD)
TABLA 478 ENERGÍA Y ELECTRICIDAD EN EL MERCADO DE COMPUESTOS DE PLÁSTICO DE FILIPINAS, POR CATEGORÍA, 2018-2032 (MILES DE USD)
TABLA 479 MERCADO DE COMPUESTOS PLÁSTICOS DE LA INDUSTRIA AEROESPACIAL Y DE DEFENSA DE FILIPINAS, POR CATEGORÍA, 2018-2032 (MILES DE USD)
TABLA 480 MERCADO DE COMPUESTOS PLÁSTICOS DE MALASIA, POR TIPO DE POLÍMERO, 2018-2032 (MILES DE USD)
TABLA 481 MERCADO DE COMPUESTOS PLÁSTICOS DE MALASIA, POR TIPO DE POLÍMERO, 2018-2032 (KILOTONELADAS)
TABLA 482 MERCADO DE TERMOPLÁSTICOS EN COMPUESTOS PLÁSTICOS DE MALASIA, POR TIPO, 2018-2032 (MILES DE USD)
TABLA 483 MERCADO DE POLIETILENO (PE) EN COMPUESTOS PLÁSTICOS DE MALASIA, POR TIPO, 2018-2032 (MILES DE USD)
TABLA 484 PLÁSTICOS DE INGENIERÍA EN EL MERCADO DE COMPUESTOS PLÁSTICOS DE MALASIA, POR TIPO, 2018-2032 (MILES DE USD)
TABLA 485 PLÁSTICOS TERMOENDURECIBLES DE MALASIA EN EL MERCADO DE COMPUESTOS DE PLÁSTICO, POR TIPO, 2018-2032 (MILES DE USD)
TABLA 486 BIOPLÁSTICOS EN EL MERCADO DE COMPUESTOS PLÁSTICOS DE MALASIA, POR TIPO, 2018-2032 (MILES DE USD)
TABLA 487 MERCADO DE COMPUESTOS PLÁSTICOS DE MALASIA, POR TIPO DE RELLENO, 2018-2032 (MILES DE USD)
TABLA 488 RELLENOS MINERALES EN EL MERCADO DE COMPUESTOS PLÁSTICOS DE MALASIA, POR TIPO, 2018-2032 (MILES DE USD)
TABLA 489 MERCADO DE REFUERZOS DE MALASIA EN COMPUESTOS PLÁSTICOS, POR TIPO, 2018-2032 (MILES DE USD)
TABLA 490 ADITIVOS DE MALASIA EN EL MERCADO DE COMPUESTOS PLÁSTICOS, POR TIPO, 2018-2032 (MILES DE USD)
TABLA 491 MERCADO DE COMPUESTOS PLÁSTICOS DE MALASIA, POR PROCESO DE FABRICACIÓN, 2018-2032 (MILES DE USD)
TABLA 492 MERCADO DE COMPUESTOS PLÁSTICOS DE MALASIA, POR PROCESO DE FABRICACIÓN, 2018-2032 (KILOTONELADAS)
TABLA 493 MERCADO DE EXTRUSIÓN DE COMPUESTOS PLÁSTICOS DE MALASIA, POR TIPO, 2018-2032 (MILES DE USD)
TABLA 494 MERCADO DE EXTRUSIÓN DE PLÁSTICOS EN MALASIA, POR SISTEMA DE PELETIZACIÓN, 2018-2032 (MILES DE USD)
TABLA 495 MERCADO DE COMPUESTOS DE PLÁSTICO BASADOS EN MOLDEO POR INYECCIÓN EN MALASIA, POR SISTEMA DE PELETIZACIÓN, 2018-2032 (MILES DE USD)
TABLA 496 COMPACTACIÓN/PRESIONADO EN EL MERCADO DE COMPUESTOS DE PLÁSTICO EN MALASIA, POR SISTEMA DE PELETIZACIÓN, 2018-2032 (MILES DE USD)
TABLA 497 MERCADO DE MEZCLA DE AMASADORAS/BANBURY EN LA FABRICACIÓN DE COMPUESTOS DE PLÁSTICO, POR SISTEMA DE PELETIZACIÓN, 2018-2032 (MILES DE USD)
TABLA 498 MERCADO DE COMPUESTOS PLÁSTICOS DE MALASIA, POR PROPIEDADES, 2018-2032 (MILES DE USD)
TABLA 499 MERCADO DE COMPUESTOS PLÁSTICOS DE MALASIA, POR APLICACIÓN, 2018-2032 (MILES DE USD)
TABLA 500 MERCADO DE COMPUESTOS PLÁSTICOS DE MALASIA, POR APLICACIÓN, 2018-2032 (KILOTONELADAS)
TABLA 501 MERCADO DE COMPUESTOS DE PLÁSTICO EN AUTOMÓVILES DE MALASIA, POR CATEGORÍA, 2018-2032 (MILES DE USD)
TABLA 502 COMPONENTES DE INTERIOR DE MALASIA EN EL MERCADO DE COMPUESTOS PLÁSTICOS, POR TIPO, 2018-2032 (MILES DE USD)
TABLA 503 PARTES DE CARROCERÍA EXTERIOR EN EL MERCADO DE COMPUESTOS PLÁSTICOS DE MALASIA, POR TIPO, 2018-2032 (MILES DE USD)
TABLA 504 APLICACIONES INTERNAS EN MALASIA EN EL MERCADO DE COMPUESTOS PLÁSTICOS, POR TIPO, 2018-2032 (MILES DE USD)
TABLA 505 MERCADO DE ENVASES DE PLÁSTICO EN MALASIA, POR CATEGORÍA, 2018-2032 (MILES DE USD)
TABLA 506 MERCADO DE ENVASES DE ALIMENTOS Y BEBIDAS EN MALASIA, POR TIPO, 2018-2032 (MILES DE USD)
TABLA 507 MERCADO DE ENVASES INDUSTRIALES DE MALASIA EN COMPUESTOS DE PLÁSTICO, POR TIPO, 2018-2032 (MILES DE USD)
TABLA 508 MERCADO DE ENVASES DE BIENES DE CONSUMO EN MALASIA, POR TIPO, 2018-2032 (MILES DE USD)
TABLA 509 MERCADO DE CONSTRUCCIÓN Y EDIFICACIÓN DE MALASIA EN EL MERCADO DE COMPUESTOS DE PLÁSTICO, POR CATEGORÍA, 2018-2032 (MILES DE USD)
TABLA 510 MERCADO DE PRODUCTOS ELÉCTRICOS Y ELECTRÓNICOS EN COMPUESTOS DE PLÁSTICO DE MALASIA, POR CATEGORÍA, 2018-2032 (MILES DE USD)
TABLA 511 MERCADO DE DISPOSITIVOS MÉDICOS DE MALASIA EN COMPUESTOS DE PLÁSTICO, POR CATEGORÍA, 2018-2032 (MILES DE USD)
TABLA 512 MERCADO DE MUEBLES DE MALASIA EN COMPUESTOS DE PLÁSTICO, POR CATEGORÍA, 2018-2032 (MILES DE USD)
TABLA 513 MERCADO DE ENERGÍA Y ELECTRICIDAD EN COMPUESTOS DE PLÁSTICO DE MALASIA, POR CATEGORÍA, 2018-2032 (MILES DE USD)
TABLA 514 MERCADO DE COMPUESTOS PLÁSTICOS DE LA INDUSTRIA AEROESPACIAL Y DE DEFENSA DE MALASIA, POR CATEGORÍA, 2018-2032 (MILES DE USD)
TABLA 515 MERCADO DE COMPUESTOS PLÁSTICOS DE TAIWÁN, POR TIPO DE POLÍMERO, 2018-2032 (MILES DE USD)
TABLA 516 MERCADO DE COMPUESTOS PLÁSTICOS DE TAIWÁN, POR TIPO DE POLÍMERO, 2018-2032 (KILOTONELADAS)
TABLA 517 MERCADO DE TERMOPLÁSTICOS EN COMPUESTOS PLÁSTICOS DE TAIWÁN, POR TIPO, 2018-2032 (MILES DE USD)
TABLA 518 POLIETILENO (PE) EN EL MERCADO DE COMPUESTOS PLÁSTICOS DE TAIWÁN, POR TIPO, 2018-2032 (MILES DE USD)
TABLA 519 PLÁSTICOS DE INGENIERÍA DE TAIWÁN EN EL MERCADO DE COMPUESTOS PLÁSTICOS, POR TIPO, 2018-2032 (MILES DE USD)
TABLA 520 PLÁSTICOS TERMOESTABLECIDOS DE TAIWÁN EN EL MERCADO DE COMPUESTOS DE PLÁSTICO, POR TIPO, 2018-2032 (MILES DE USD)
TABLA 521 BIOPLÁSTICOS EN EL MERCADO DE COMPUESTOS PLÁSTICOS DE TAIWÁN, POR TIPO, 2018-2032 (MILES DE USD)
TABLA 522 MERCADO DE COMPUESTOS PLÁSTICOS DE TAIWÁN, POR TIPO DE RELLENO, 2018-2032 (MILES DE USD)
TABLA 523 RELLENOS MINERALES EN EL MERCADO DE COMPUESTOS PLÁSTICOS DE TAIWÁN, POR TIPO, 2018-2032 (MILES DE USD)
TABLA 524 REFUERZOS EN EL MERCADO DE COMPUESTOS PLÁSTICOS DE TAIWÁN, POR TIPO, 2018-2032 (MILES DE USD)
TABLA 525 ADITIVOS DE TAIWÁN EN EL MERCADO DE COMPUESTOS PLÁSTICOS, POR TIPO, 2018-2032 (MILES DE USD)
TABLA 526 MERCADO DE COMPUESTOS PLÁSTICOS DE TAIWÁN, POR PROCESO DE FABRICACIÓN, 2018-2032 (MILES DE USD)
TABLA 527 MERCADO DE COMPUESTOS PLÁSTICOS DE TAIWÁN, POR PROCESO DE FABRICACIÓN, 2018-2032 (KILOTONELADAS)
TABLA 528 MERCADO DE EXTRUSIÓN DE COMPUESTOS PLÁSTICOS DE TAIWÁN, POR TIPO, 2018-2032 (MILES DE USD)
TABLA 529 MERCADO DE EXTRUSIÓN DE PLÁSTICOS EN TAIWÁN, POR SISTEMA DE PELETIZACIÓN, 2018-2032 (MILES DE USD)
TABLA 530 MERCADO DE COMPUESTOS DE PLÁSTICO BASADOS EN MOLDEO POR INYECCIÓN EN TAIWÁN, SEGÚN EL SISTEMA DE PELETIZACIÓN, 2018-2032 (MILES DE USD)
TABLA 531 COMPACTACIÓN/PRESIONADO EN EL MERCADO DE COMPUESTOS DE PLÁSTICO EN TAIWÁN, POR SISTEMA DE PELETIZACIÓN, 2018-2032 (MILES DE USD)
TABLA 532 AMASADAS/MEZCLAS BANBURY EN EL MERCADO DE COMPUESTOS DE PLÁSTICO DE TAIWÁN, POR SISTEMA DE PELETIZACIÓN, 2018-2032 (MILES DE USD)
TABLA 533 MERCADO DE COMPUESTOS PLÁSTICOS DE TAIWÁN, POR PROPIEDADES, 2018-2032 (MILES DE USD)
TABLA 534 MERCADO DE COMPUESTOS PLÁSTICOS DE TAIWÁN, POR APLICACIÓN, 2018-2032 (MILES DE USD)
TABLA 535 MERCADO DE COMPUESTOS PLÁSTICOS DE TAIWÁN, POR APLICACIÓN, 2018-2032 (KILOTONELADAS)
TABLA 536 MERCADO DE COMPUESTOS DE PLÁSTICO EN LA INDUSTRIA AUTOMOTRIZ DE TAIWÁN, POR CATEGORÍA, 2018-2032 (MILES DE USD)
TABLA 537 COMPONENTES DE INTERIOR DE TAIWÁN EN EL MERCADO DE COMPUESTOS PLÁSTICOS, POR TIPO, 2018-2032 (MILES DE USD)
TABLA 538 PIEZAS DE CARROCERÍA EXTERIOR DE TAIWÁN EN EL MERCADO DE COMPUESTOS DE PLÁSTICO, POR TIPO, 2018-2032 (MILES DE USD)
TABLA 539 APLICACIONES INTERNAS EN TAIWÁN EN EL MERCADO DE COMPUESTOS PLÁSTICOS, POR TIPO, 2018-2032 (MILES DE USD)
TABLA 540 MERCADO DE ENVASES DE PLÁSTICO EN TAIWÁN, POR CATEGORÍA, 2018-2032 (MILES DE USD)
TABLA 541 ENVASES DE ALIMENTOS Y BEBIDAS EN EL MERCADO DE COMPUESTOS DE PLÁSTICO DE TAIWÁN, POR TIPO, 2018-2032 (MILES DE USD)
TABLA 542 MERCADO DE EMBALAJES INDUSTRIALES DE TAIWÁN EN COMPUESTOS DE PLÁSTICO, POR TIPO, 2018-2032 (MILES DE USD)
TABLA 543 ENVASES DE BIENES DE CONSUMO EN EL MERCADO DE COMPUESTOS PLÁSTICOS DE TAIWÁN, POR TIPO, 2018-2032 (MILES DE USD)
TABLA 544 MERCADO DE CONSTRUCCIÓN Y EDIFICACIÓN DE PLÁSTICOS EN TAIWÁN, POR CATEGORÍA, 2018-2032 (MILES DE USD)
TABLA 545 MERCADO DE PRODUCTOS ELÉCTRICOS Y ELECTRÓNICOS EN COMPUESTOS DE PLÁSTICO DE TAIWÁN, POR CATEGORÍA, 2018-2032 (MILES DE USD)
TABLA 546 DISPOSITIVOS MÉDICOS DE TAIWÁN EN EL MERCADO DE COMPUESTOS DE PLÁSTICO, POR CATEGORÍA, 2018-2032 (MILES DE USD)
TABLA 547 MERCADO DE MUEBLES DE TAIWÁN EN COMPUESTOS DE PLÁSTICO, POR CATEGORÍA, 2018-2032 (MILES DE USD)
TABLA 548 ENERGÍA Y PODER EN EL MERCADO DE COMPUESTOS DE PLÁSTICO DE TAIWÁN, POR CATEGORÍA, 2018-2032 (MILES DE USD)
TABLA 549 MERCADO DE COMPUESTOS PLÁSTICOS DE LA INDUSTRIA AEROESPACIAL Y DE DEFENSA DE TAIWÁN, POR CATEGORÍA, 2018-2032 (MILES DE USD)
TABLA 550 MERCADO DE COMPUESTOS PLÁSTICOS DE HONG KONG, POR TIPO DE POLÍMERO, 2018-2032 (MILES DE USD)
TABLA 551 MERCADO DE COMPUESTOS PLÁSTICOS DE HONG KONG, POR TIPO DE POLÍMERO, 2018-2032 (KILOTONELADAS)
TABLA 552 MERCADO DE TERMOPLÁSTICOS EN COMPUESTOS PLÁSTICOS DE HONG KONG, POR TIPO, 2018-2032 (MILES DE USD)
TABLA 553 MERCADO DE POLIETILENO (PE) EN COMPUESTOS PLÁSTICOS DE HONG KONG, POR TIPO, 2018-2032 (MILES DE USD)
TABLA 554 PLÁSTICOS DE INGENIERÍA DE HONG KONG EN EL MERCADO DE COMPUESTOS PLÁSTICOS, POR TIPO, 2018-2032 (MILES DE USD)
TABLA 555 PLÁSTICOS TERMOENDURECIBLES DE HONG KONG EN EL MERCADO DE COMPUESTOS DE PLÁSTICO, POR TIPO, 2018-2032 (MILES DE USD)
TABLA 556 BIOPLÁSTICOS EN EL MERCADO DE COMPUESTOS PLÁSTICOS DE HONG KONG, POR TIPO, 2018-2032 (MILES DE USD)
TABLA 557 MERCADO DE COMPUESTOS DE PLÁSTICO DE HONG KONG, POR TIPO DE RELLENO, 2018-2032 (MILES DE USD)
TABLA 558 RELLENOS MINERALES EN EL MERCADO DE COMPUESTOS PLÁSTICOS DE HONG KONG, POR TIPO, 2018-2032 (MILES DE USD)
TABLA 559 REFUERZOS EN EL MERCADO DE COMPUESTOS PLÁSTICOS DE HONG KONG, POR TIPO, 2018-2032 (MILES DE USD)
TABLA 560 ADITIVOS DE HONG KONG EN EL MERCADO DE COMPUESTOS PLÁSTICOS, POR TIPO, 2018-2032 (MILES DE USD)
TABLA 561 MERCADO DE COMPUESTOS DE PLÁSTICO DE HONG KONG, POR PROCESO DE FABRICACIÓN, 2018-2032 (MILES DE USD)
TABLA 562 MERCADO DE COMPUESTOS DE PLÁSTICO DE HONG KONG, POR PROCESO DE FABRICACIÓN, 2018-2032 (KILOTONELADAS)
TABLA 563 MERCADO DE EXTRUSIÓN DE COMPUESTOS PLÁSTICOS EN HONG KONG, POR TIPO, 2018-2032 (MILES DE USD)
TABLA 564 MERCADO DE EXTRUSIÓN DE PLÁSTICOS EN HONG KONG, POR SISTEMA DE PELETIZACIÓN, 2018-2032 (MILES DE USD)
TABLA 565 MERCADO DE COMPUESTOS DE PLÁSTICO BASADOS EN MOLDEO POR INYECCIÓN EN HONG KONG, SEGÚN EL SISTEMA DE PELETIZACIÓN, 2018-2032 (MILES DE USD)
TABLA 566 COMPACTACIÓN/PRESIONADO EN EL MERCADO DE COMPUESTOS DE PLÁSTICO EN HONG KONG, POR SISTEMA DE PELETIZACIÓN, 2018-2032 (MILES DE USD)
TABLA 567 AMASADORA DE HONG KONG/MEZCLA BANBURY EN EL MERCADO DE COMPUESTOS DE PLÁSTICO, POR SISTEMA DE PELETIZACIÓN, 2018-2032 (MILES DE USD)
TABLA 568 MERCADO DE COMPUESTOS PLÁSTICOS DE HONG KONG, POR PROPIEDADES, 2018-2032 (MILES DE USD)
TABLA 569 MERCADO DE COMPUESTOS PLÁSTICOS DE HONG KONG, POR APLICACIÓN, 2018-2032 (MILES DE USD)
TABLA 570 MERCADO DE COMPUESTOS PLÁSTICOS DE HONG KONG, POR APLICACIÓN, 2018-2032 (KILOTONELADAS)
TABLA 571 MERCADO DE COMPUESTOS DE PLÁSTICO EN AUTOMÓVILES DE HONG KONG, POR CATEGORÍA, 2018-2032 (MILES DE USD)
TABLA 572 COMPONENTES DE INTERIOR DE HONG KONG EN EL MERCADO DE COMPUESTOS PLÁSTICOS, POR TIPO, 2018-2032 (MILES DE USD)
TABLA 573 PIEZAS DE CARROCERÍA EXTERIOR DE HONG KONG EN EL MERCADO DE COMPUESTOS DE PLÁSTICO, POR TIPO, 2018-2032 (MILES DE USD)
TABLA 574 APLICACIONES INTERNAS EN HONG KONG EN EL MERCADO DE COMPUESTOS PLÁSTICOS, POR TIPO, 2018-2032 (MILES DE USD)
TABLA 575 MERCADO DE ENVASES DE PLÁSTICO EN HONG KONG, POR CATEGORÍA, 2018-2032 (MILES DE USD)
TABLA 576 ENVASES DE ALIMENTOS Y BEBIDAS EN EL MERCADO DE COMPUESTOS DE PLÁSTICO DE HONG KONG, POR TIPO, 2018-2032 (MILES DE USD)
TABLA 577 MERCADO DE ENVASES INDUSTRIALES DE HONG KONG EN COMPUESTOS DE PLÁSTICO, POR TIPO, 2018-2032 (MILES DE USD)
TABLA 578 ENVASES DE BIENES DE CONSUMO EN EL MERCADO DE COMPUESTOS PLÁSTICOS DE HONG KONG, POR TIPO, 2018-2032 (MILES DE USD)
TABLA 579 MERCADO DE CONSTRUCCIÓN Y EDIFICACIÓN DE COMPUESTOS PLÁSTICOS EN HONG KONG, POR CATEGORÍA, 2018-2032 (MILES DE USD)
TABLA 580 MERCADO DE PRODUCTOS ELÉCTRICOS Y ELECTRÓNICOS EN COMPUESTOS DE PLÁSTICO DE HONG KONG, POR CATEGORÍA, 2018-2032 (MILES DE USD)
TABLA 581 DISPOSITIVOS MÉDICOS EN EL MERCADO DE COMPUESTOS PLÁSTICOS DE HONG KONG, POR CATEGORÍA, 2018-2032 (MILES DE USD)
TABLA 582 MERCADO DE MUEBLES DE HONG KONG EN COMPUESTOS DE PLÁSTICO, POR CATEGORÍA, 2018-2032 (MILES DE USD)
TABLA 583 MERCADO DE ENERGÍA Y ELECTRICIDAD EN HONG KONG, POR CATEGORÍA, 2018-2032 (MILES DE USD)
TABLA 584 MERCADO DE COMPUESTOS PLÁSTICOS DE LA INDUSTRIA AEROESPACIAL Y DE DEFENSA DE HONG KONG, POR CATEGORÍA, 2018-2032 (MILES DE USD)
TABLA 585 RESTO DEL MERCADO DE COMPUESTOS PLÁSTICOS DE ASIA-PACÍFICO, POR TIPO DE POLÍMERO, 2018-2032 (MILES DE USD)
TABLA 586 RESTO DEL MERCADO DE COMPUESTOS PLÁSTICOS DE ASIA-PACÍFICO, POR TIPO DE POLÍMERO, 2018-2032 (KILOTONELADAS)
Lista de figuras
FIGURA 1 MERCADO DE COMPUESTOS PLÁSTICOS DE ASIA-PACÍFICO
FIGURA 2 MERCADO DE COMPUESTOS PLÁSTICOS DE ASIA-PACÍFICO: TRIANGULACIÓN DE DATOS
FIGURA 3 MERCADO DE COMPUESTOS PLÁSTICOS DE ASIA-PACÍFICO: ANÁLISIS DROC
FIGURA 4 MERCADO DE COMPUESTOS PLÁSTICOS DE ASIA-PACÍFICO: ANÁLISIS DEL MERCADO DE ASIA-PACÍFICO VS. REGIONAL
FIGURA 5 MERCADO DE COMPUESTOS PLÁSTICOS DE ASIA-PACÍFICO: ANÁLISIS DE INVESTIGACIÓN DE EMPRESAS
FIGURA 6 MERCADO DE COMPUESTOS PLÁSTICOS DE ASIA-PACÍFICO: MODELADO MULTIVARIADO
FIGURA 7 MERCADO DE COMPUESTOS PLÁSTICOS DE ASIA-PACÍFICO: DATOS DEMOGRÁFICOS DE LAS ENTREVISTAS
FIGURA 8 MERCADO DE COMPUESTOS PLÁSTICOS DE ASIA-PACÍFICO: CUADRÍCULA DE POSICIÓN DE MERCADO DE DBMR
FIGURA 9 MERCADO DE COMPUESTOS PLÁSTICOS DE ASIA-PACÍFICO: CUADRÍCULA DE COBERTURA DE APLICACIONES DEL MERCADO
FIGURA 10 RESUMEN EJECUTIVO
FIGURA 11 MERCADO DE COMPUESTOS PLÁSTICOS DE ASIA-PACÍFICO: SEGMENTACIÓN
FIGURA 12 CINCO SEGMENTOS COMPRENDEN EL MERCADO DE COMPUESTOS PLÁSTICOS DE ASIA-PACÍFICO, POR TIPO DE POLÍMERO
FIGURA 13 DECISIONES ESTRATÉGICAS
FIGURA 14 SE ESPERA QUE EL CAMBIO HACIA COMPUESTOS PLÁSTICOS RECICLABLES Y BIODEGRADABLES DEBIDO A LA REGULACIÓN AMBIENTAL IMPULSE EL MERCADO DE COMPUESTOS PLÁSTICOS DE ASIA-PACÍFICO DURANTE EL PERÍODO DE PRONÓSTICO DE 2025 A 2032
FIGURA 15 SE ESPERA QUE EL SEGMENTO DE TERMOPLÁSTICOS REPRESENTE LA MAYOR PARTICIPACIÓN DEL MERCADO DE COMPUESTOS DE PLÁSTICO DE ASIA-PACÍFICO EN 2025 Y 2032
FIGURA 16 ANÁLISIS DE LAS CINCO FUERZAS DE PORTER
FIGURA 17 MERCADO DE COMPUESTOS PLÁSTICOS DE ASIA-PACÍFICO: ANÁLISIS DE LA CADENA DE VALOR
FIGURA 18 ESCENARIO DE IMPORTACIÓN Y EXPORTACIÓN (MILES DE USD)
FIGURA 19 CAPACIDAD DE PRODUCCIÓN DE LOS MEJORES FABRICANTES
FIGURA 20 CÓDIGO IPC V/S NÚMERO DE PATENTES
FIGURA 21 NÚMERO DE PATENTES POR AÑO
FIGURA 22 NÚMERO DE PATENTES POR REGIÓN/PAÍS
FIGURA 23 PRINCIPALES SOLICITANTES DE PATENTES
FIGURA 24 MERCADO DE COMPUESTOS PLÁSTICOS DE ASIA-PACÍFICO, 2024-2032, PRECIO DE VENTA PROMEDIO (USD/KG)
FIGURA 25 IMPULSORES, RESTRICCIONES, OPORTUNIDADES Y DESAFÍOS DEL MERCADO DE COMPUESTOS PLÁSTICOS DE ASIA-PACÍFICO
FIGURA 26 MERCADO DE COMPUESTOS PLÁSTICOS DE ASIA-PACÍFICO: POR TIPO DE POLÍMERO, 2024
FIGURA 27 MERCADO DE COMPUESTOS PLÁSTICOS DE ASIA-PACÍFICO, POR TIPO DE FILTRO, 2024
FIGURA 28 MERCADO DE COMPUESTOS DE PLÁSTICO DE ASIA-PACÍFICO, POR PROCESO DE FABRICACIÓN, 2024
FIGURA 29 MERCADO DE COMPUESTOS PLÁSTICOS DE ASIA-PACÍFICO, POR PROPIEDADES, 2024
FIGURA 30 MERCADO DE COMPUESTOS PLÁSTICOS DE ASIA-PACÍFICO, POR APLICACIÓN, 2024
FIGURA 31 MERCADO DE COMPUESTOS PLÁSTICOS DE ASIA-PACÍFICO: INSTANTÁNEA (2024)
FIGURA 32 MERCADO DE COMPUESTOS PLÁSTICOS DE ASIA-PACÍFICO: PARTICIPACIÓN DE LA EMPRESA 2024 (%)
Metodología de investigación
La recopilación de datos y el análisis del año base se realizan utilizando módulos de recopilación de datos con muestras de gran tamaño. La etapa incluye la obtención de información de mercado o datos relacionados a través de varias fuentes y estrategias. Incluye el examen y la planificación de todos los datos adquiridos del pasado con antelación. Asimismo, abarca el examen de las inconsistencias de información observadas en diferentes fuentes de información. Los datos de mercado se analizan y estiman utilizando modelos estadísticos y coherentes de mercado. Además, el análisis de la participación de mercado y el análisis de tendencias clave son los principales factores de éxito en el informe de mercado. Para obtener más información, solicite una llamada de un analista o envíe su consulta.
La metodología de investigación clave utilizada por el equipo de investigación de DBMR es la triangulación de datos, que implica la extracción de datos, el análisis del impacto de las variables de datos en el mercado y la validación primaria (experto en la industria). Los modelos de datos incluyen cuadrícula de posicionamiento de proveedores, análisis de línea de tiempo de mercado, descripción general y guía del mercado, cuadrícula de posicionamiento de la empresa, análisis de patentes, análisis de precios, análisis de participación de mercado de la empresa, estándares de medición, análisis global versus regional y de participación de proveedores. Para obtener más información sobre la metodología de investigación, envíe una consulta para hablar con nuestros expertos de la industria.
Personalización disponible
Data Bridge Market Research es líder en investigación formativa avanzada. Nos enorgullecemos de brindar servicios a nuestros clientes existentes y nuevos con datos y análisis que coinciden y se adaptan a sus objetivos. El informe se puede personalizar para incluir análisis de tendencias de precios de marcas objetivo, comprensión del mercado de países adicionales (solicite la lista de países), datos de resultados de ensayos clínicos, revisión de literatura, análisis de mercado renovado y base de productos. El análisis de mercado de competidores objetivo se puede analizar desde análisis basados en tecnología hasta estrategias de cartera de mercado. Podemos agregar tantos competidores sobre los que necesite datos en el formato y estilo de datos que esté buscando. Nuestro equipo de analistas también puede proporcionarle datos en archivos de Excel sin procesar, tablas dinámicas (libro de datos) o puede ayudarlo a crear presentaciones a partir de los conjuntos de datos disponibles en el informe.

