Global Biostimulants Market
Tamaño del mercado en miles de millones de dólares
Tasa de crecimiento anual compuesta (CAGR) :
% 
 USD
5,781.56 Million
USD
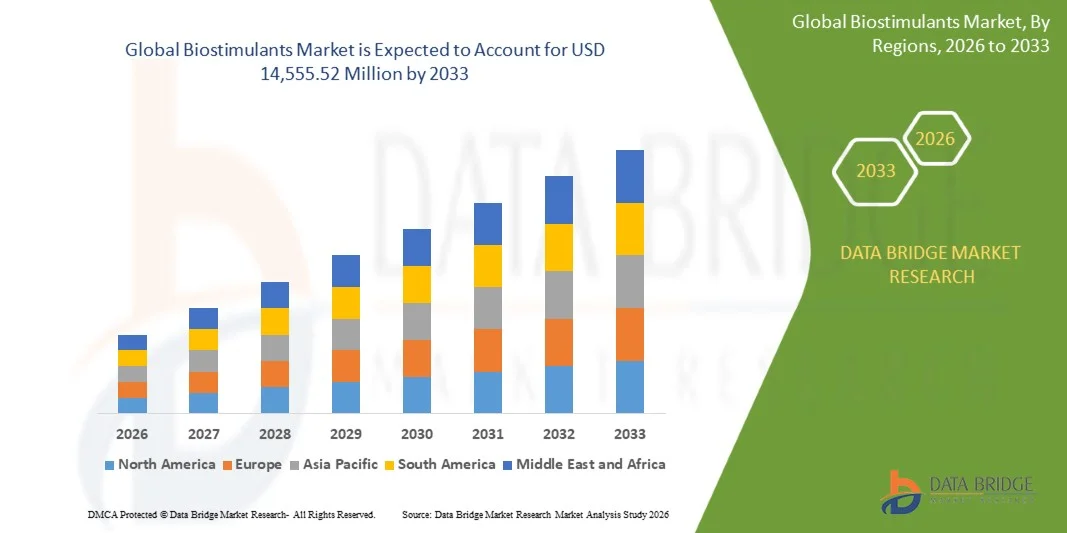
14,555.52 Million
2025
2033
USD
5,781.56 Million
USD
14,555.52 Million
2025
2033
| 2026 –2033 | |
| USD 5,781.56 Million | |
| USD 14,555.52 Million | |
| % | |
|
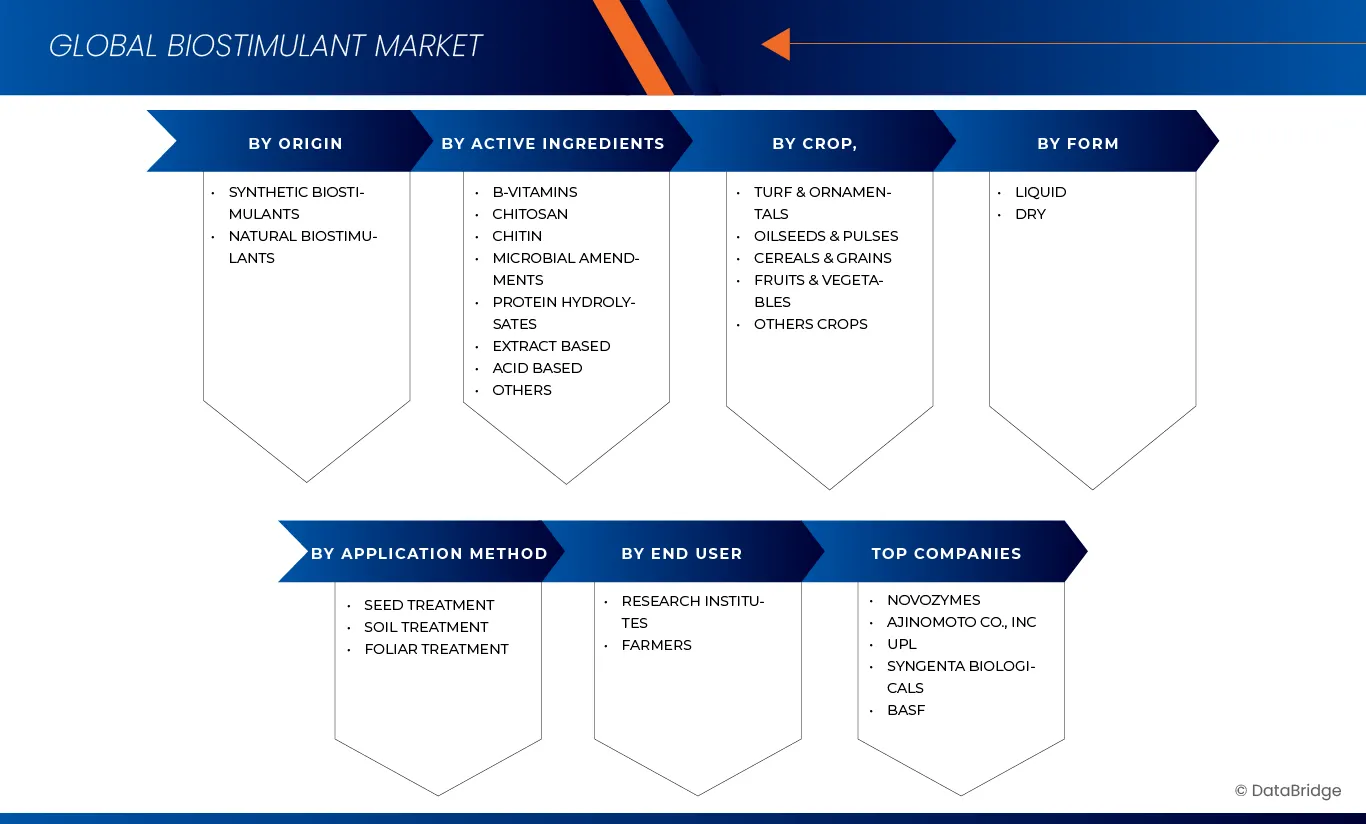
Segmentación del mercado global de bioestimulantes: por origen (bioestimulantes sintéticos, bioestimulantes naturales), presentación (líquida, seca), ingredientes activos (vitaminas B, quitosano, quitina, enmiendas microbianas, hidrolizados proteicos, extractos, ácidos, otros), método de aplicación (tratamiento de semillas, tratamiento del suelo, foliar), cultivo (ornamentales para césped, oleaginosas y legumbres, cereales, frutas y verduras, otros cultivos) y usuario final (institutos de investigación, agricultores). Tendencias y pronóstico del sector hasta 2033.
¿Cuál es la tasa de tamaño y crecimiento del mercado de bioestimulantes
- Según Data Bridge Market Research Analysis El tamaño del mercado de los bioestimulantes mundiales se valoró enUSD 5,781,56 millones en 2025y se espera que alcanceUSD 14,555,52 millones en 2033, aCAGR of 12.3%durante el período previsto
- El crecimiento del mercado está impulsado principalmente por la creciente demanda de aditivos naturales y sostenibles en industrias clave como alimentos y bebidas, cuero,farmacéuticas, ypiensoLos avances en las tecnologías de extracción y procesamiento están mejorando la eficiencia y la calidad de la producción de bioestimulantes, al tiempo que apoyan una mayor digitalización e innovación dentro de la industria.
- Aumentar la preferencia de los consumidores por productos basados en plantas y ecológicos es fortalecer la posición de los bioestimulantes como una alternativa atractiva a los productos químicos sintéticos. Juntos, estos factores están acelerando la adopción de soluciones basadas en bioestimulantes y contribuyendo sustancialmente a la expansión mundial del mercado de bioestimulantes.
Tamaño del mercado
- Valor mundial del mercado (2025):USD 5,781.56 Millones
- Valor de mercado esperado (2033):USD 14,555,52 Million
- CAGR prefabricado (2026–2033):12.3%
Global Biostimulants Market Analysis
- Los bioestimulantes, compuestos polifenolicos de origen natural que se encuentran en diversas plantas, se están volviendo cada vez más vitales en múltiples industrias, como alimentos y bebidas, procesamiento de cuero, productos farmacéuticos, alimentación animal y tratamiento de agua, debido a sus propiedades multifuncionales como la astringencia, actividad antioxidante, efectos antimicrobianos y eco-amigración.
- La creciente demanda de bioestimulantes se ve alimentada principalmente por el cambio mundial hacia los productos naturales, sostenibles y basados en la biotecnología, el aumento de la conciencia ambiental y el aumento de la presión reglamentaria para reducir el uso de aditivos y productos químicos sintéticos en bienes industriales y de consumo.
- Europa domina el mercado de bioestimulantes, con un 36,52% de los ingresos totales en 2026, impulsados por la rápida industrialización, el aumento del consumo de aditivos alimentarios naturales, la expansión de la fabricación de cuero y el aumento de la conciencia sanitaria entre los consumidores.
- Se espera que Asia-Pacífico sea la región de mayor crecimiento en el mercado de bioestimulantes durante el período previsto, con el apoyo de una fuerte demanda de los sectores del vino, el cuero y los productos farmacéuticos, las instalaciones de extracción y procesamiento bien establecidas y el aumento de la inversión en innovaciones basadas en plantas. Países como Francia, Italia y España lideran el consumo de bioestimulantes debido a sus extensas industrias de producción de vino y bronceado.
- Se proyecta que el segmento de bioestimulantes naturales dominará el mercado con una participación del 71,94% en 2026, debido a su amplia aplicabilidad en productos farmacéuticos, piensos animales y purificación de agua, junto con esfuerzos crecientes de R corpD centrados en sus propiedades medicinales, antioxidantes y funcionales.
Report Scope and Biostimulants Market Segmentation
|
Atributos |
Biostimulants Key Market Insights |
|
Segmentos cubiertos |
|
|
Países cubiertos |
América del Norte
Europa
Asia y el Pacífico
Oriente Medio y África
América del Sur
|
|
Principales jugadores del mercado |
|
|
Oportunidades de mercado |
|
|
Valor añadido Data Infosets |
Además de las ideas sobre escenarios de mercado como el valor de mercado, la tasa de crecimiento, la segmentación, la cobertura geográfica y los principales actores, los informes de mercado comisariados por el Data Bridge Market Research también incluyen análisis de exportaciones de importaciones, visión general de la capacidad de producción, análisis de consumo de producción, escenario de cambio climático, análisis de la cadena de suministro, análisis de la cadena de valor, visión general de materias primas/consumibles, criterios de selección de proveedores, análisis PESTLE Analysis, análisis, análisis de PESTLE, análisis de valores y análisis de valores. |
¿Cuál es la tendencia clave en el mercado de bioestimulantes
“Integración de los microbios y Nano-Biostimulantes para el rendimiento mejorado de los cultivos”
- Una tendencia prominente y de rápido crecimiento en el mercado mundial de bioestimulantes es la creciente integración de las tecnologías microbianas y nanobiostimulantes para aumentar la productividad de los cultivos, la eficiencia del uso de nutrientes y la resistencia al estrés abiótico. Esta tendencia está impulsada por avances rápidos en la biotecnología agrícola y un impulso global hacia soluciones agrícolas sostenibles, de alta eficiencia y bajo rendimiento.
- Empresas líderes como UPL, Valagro y Novozymes están invirtiendo fuertemente en consorcios microbianos y nanoformaciones que ofrecen beneficios específicos, como la fijación de nitrógeno mejorada, la colonización de raíces mejorada, la absorción de nutrientes más rápida y una mayor tolerancia al estrés bajo sequía, calor y salinidad. Estas innovaciones están ayudando a los agricultores a lograr mayores rendimientos al tiempo que reducen la dependencia de los fertilizantes sintéticos.
- Los bioestimulantes microbianos —particularmente la rhizobacteria de crecimiento de plantas (PGPR), hongos micorricenizales y soluciones basadas en Bacillus— están ganando tracción debido a su capacidad de fortalecer la arquitectura de raíces, mejorar la fertilidad del suelo y estimular las vías de defensa de plantas naturales. Las empresas también están desarrollando variedades de próxima generación con mayor supervivencia y compatibilidad en diversos suelos y condiciones climáticas.
- Nano-biostimulantes, incluyendo nano-silicon, nano-aminoácidos y elementos de traza nano-chelated, están surgiendo como alternativas de alta eficiencia a las formulaciones convencionales. Su estructura nanoescala mejora la penetración, la movilidad y la biodisponibilidad de nutrientes, lo que da lugar a una respuesta vegetal más rápida y a una reducción de las dosis de aplicación.
- En la agricultura de precisión, estos bioestimulantes avanzados están siendo emparejados con herramientas digitales como la cartografía de microbioma de suelo, la teleobservación y la vigilancia de cultivos impulsados por IA para permitir estrategias de aplicación adaptadas y optimizar el rendimiento a nivel de campo.
- Este cambio hacia los bioestimulantes microbianos y nanocapacitados de próxima generación está redefiniendo los estándares de la industria, transfiriendo el mercado de insumos orgánicos básicos a soluciones biológicas científicamente diseñadas y de alto rendimiento.
Biostimulants Market Dynamics
Conductor
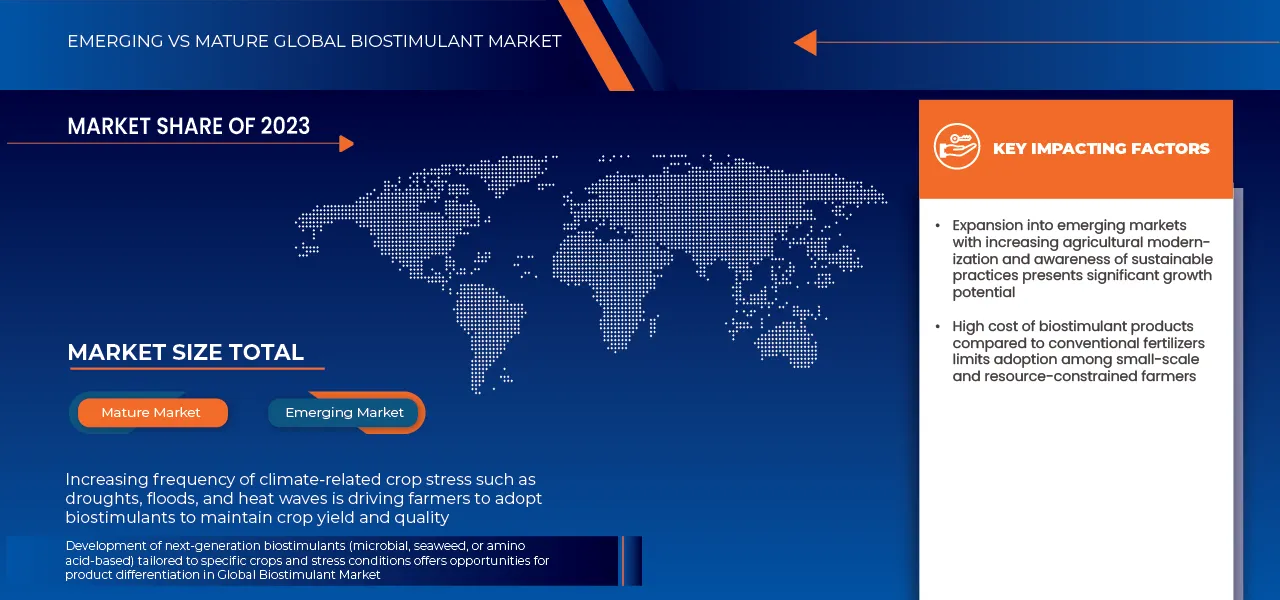
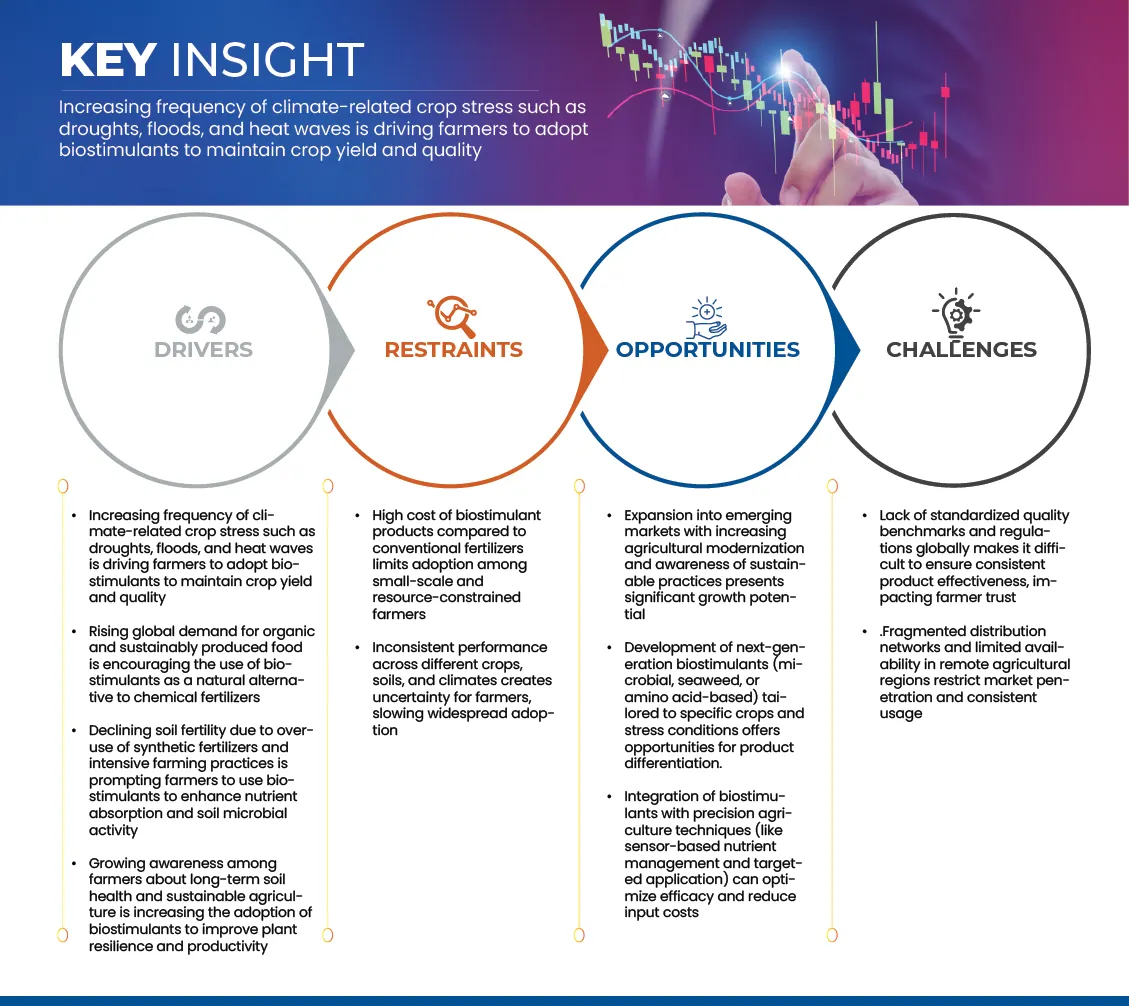
“El aumento de la frecuencia del estrés de los cultivos relacionados con el clima, como sequías, inundaciones y olas de calor, está impulsando a los agricultores a adoptar bioestimulantes para mantener el rendimiento y la calidad de los cultivos”
- La creciente frecuencia de las tensiones relacionadas con el clima, como las sequías, las inundaciones y las olas de calor, ha surgido como una preocupación fundamental para la agricultura mundial, que afecta directamente a la productividad de los cultivos y la seguridad alimentaria.
- Estas condiciones extremas perturban el metabolismo de las plantas, socavan la absorción de nutrientes y reducen el potencial de rendimiento general. Como resultado, los agricultores recurren cada vez más a bioestimulantes, sustancias naturales que mejoran los procesos fisiológicos vegetales, para fortalecer la resiliencia de los cultivos contra el estrés ambiental.
- La adopción de bioestimulantes permite a los productores mantener el rendimiento y la calidad en escenarios climáticos impredecibles, apoyando al mismo tiempo la salud de suelos y ecosistemas a largo plazo.
- Para la instalación... Como se presentó en un artículo de investigación de MDPI en julio de 2025, la aplicación de extracto de algas sobre cultivos de soja bajo condiciones de déficit de agua mejoró la eficiencia fotosintética y la acumulación de biomasa, indicando el papel de los bioestimulantes en la mejora de la resiliencia a la sequía
- Como se indicó en una versión conjunta BASF y Elicit Plant en octubre de 2024, los ensayos de campo sobre cultivos de girasol demostraron que los bioestimulantes derivados de las algas mejoraron la resistencia a la sequía y mantuvieron el rendimiento bajo condiciones limitadas al agua, reforzando la confianza en los productos biológicos de reducción del estrés
- La creciente incidencia de fenómenos climáticos extremos sigue perturbando la productividad agrícola mundial, obligando a los agricultores a buscar soluciones sostenibles que aumenten la resiliencia de los cultivos. Los bioestimulantes han surgido como un componente vital para mitigar los efectos de las sequías, las inundaciones y las ondas de calor mejorando la tolerancia al estrés de las plantas y la capacidad de recuperación.
- Se espera que su adopción se acelere más a medida que los productores prioricen la estabilidad y la calidad del rendimiento frente a la incertidumbre climática.
Oportunidad
“La expansión en mercados emergentes con una mayor modernización agrícola y conciencia de las prácticas sostenibles presenta un potencial de crecimiento significativo”
- La expansión del uso de bioestimulantes en los mercados emergentes presenta importantes oportunidades de crecimiento, impulsadas por la aceleración de la modernización agrícola y la sensibilización creciente sobre las prácticas agrícolas sostenibles. A medida que los países de Asia y el Pacífico, América Latina y África adoptan cada vez más técnicas avanzadas de gestión de cultivos para aumentar la productividad y la eficiencia de los recursos, los bioestimulantes están adquiriendo atención como solución ecológica para mejorar la salud del suelo y la resiliencia de los cultivos. Las iniciativas gubernamentales de apoyo, el aumento de la inversión en los programas de educación agrícola y de agricultores están fomentando aún más la penetración del mercado, situando las economías emergentes como centros clave de crecimiento para la industria mundial de los bioestimulantes en los próximos años.
- Por ejemplo, en agosto de 2025, un artículo de GK Today informó que el cambio de India hacia la agricultura sostenible y resistente al clima y la creciente conciencia sobre la salud de los cultivos están impulsando la absorción bioestimulante en el país.
- Por ejemplo, en julio de 2025, Agrithority publicó que en América Latina, el creciente reconocimiento de bioestimulantes y bioinputs como alternativas sostenibles en los sistemas agrícolas tropicales está acelerando la inversión y la absorción en todo Brasil, Argentina y Perú.
- Aunque el segmento Biostimulants ofrece un cambio prometedor hacia la agricultura sostenible mejorando la resiliencia de las plantas, mejorando la salud del suelo y reduciendo la dependencia de los agroquímicos convencionales, su camino hacia adelante no es sin problemas. Entre las cuestiones fundamentales cabe citar un panorama normativo que sigue evolucionando para garantizar la eficacia y la calidad de los productos, las deficiencias generalizadas en la educación de los agricultores y la seguridad sobre el terreno, y el dominio de las formulaciones no verificadas en el mercado. Hasta que estos obstáculos se aborden mediante pruebas estandarizadas, una mayor transparencia y servicios de extensión centrados en agricultores, se limitará todo el potencial de los bioestimulantes.
Restraint/Challenge
“El alto costo de los productos bioestimulantes en comparación con los fertilizantes convencionales limita la adopción entre los agricultores de pequeña escala y con recursos limitados”
- El costo relativamente alto de los productos bioestimulantes en comparación con los fertilizantes químicos convencionales constituye una limitación significativa para el crecimiento del mercado, especialmente entre los agricultores de pequeña escala y con recursos.
- Si bien los bioestimulantes ofrecen beneficios a largo plazo en términos de salud del suelo, estabilidad del rendimiento y sostenibilidad, su costo inicial y competitividad de precios limitados a menudo desalientan la adopción en regiones agrícolas sensibles a los costos. Esta disparidad de precios, junto con una menor conciencia de los rendimientos económicos a largo plazo, sigue obstaculizando el uso generalizado de los bioestimulantes en las comunidades de desarrollo y de bajos ingresos
- Para la instalación... Como informó KNN India en septiembre de 2025, el sector de fertilizantes destacó que las nuevas regulaciones que tratan a los bioestimulantes bajo el control formal de fertilizantes han aumentado los costos de cumplimiento y producción, amenazando a muchos pequeños fabricantes de PYME y aumentando indirectamente los costos de productos finales para los agricultores.
- En 2025, Khoulati et al. en “Harnessing Biostimulants for Sustainable Agriculture” señalaron que uno de los principales retos es “las limitaciones económicas” —incluido el alto costo de los productos en relación con los insumos convencionales— limitando la captación en entornos con capacitación de recursos
- El costo relativamente elevado de los productos bioestimulantes en comparación con los fertilizantes convencionales sigue siendo un obstáculo importante para su adopción generalizada, en particular entre los agricultores de pequeña escala y con recursos.
- A pesar de sus beneficios comprobados para la salud del suelo, la resiliencia de los cultivos y la sostenibilidad a largo plazo, los mayores gastos iniciales, los limitados subsidios gubernamentales y la falta de formulaciones asequibles hacen que los bioestimulantes sean menos accesibles para los productores sensibles a los precios. A menos que se aborden las barreras de costos mediante el apoyo a las políticas, la innovación tecnológica y la producción localizada, su potencial para transformar la agricultura sostenible seguirá subutilizando en muchas regiones en desarrollo.
Biostimulants Market Scope
El mercado mundial de bioestimulantes se segmenta en Seis segmentos notables basados en el Origen, Forma, Ingredientes Activos, Método de Aplicación, Cultivo, Usuario Final.
- Por Origen
Sobre la base de Origen, el mercado mundial de bioestimulantes se segmenta en bioestimulantes sintéticos, bioestimulantes naturales. Seca es sub segmento en gránulos dispersibles de agua, secos, polvo húmedo y procesamiento subcontratado se sub segmenta en concentrado de suspensión, concentrado emulsificable, concentrado líquido soluble. Los bioestimulantes naturales se suman sobre la base de la forma en el procesamiento seco y subcontratado. Seca es sub segmento en agua dispersible, gránulos secos, polvo húmedo. En 2026, se prevé que el segmento de bioestimulantes naturales dominará con la cuota de mercado del 71,94%.
También se espera que el segmento de bioestimulantes naturales registre la CAGR más alta del 12,6% debido a su creciente adopción entre los agricultores que buscan soluciones sostenibles y ecológicas para la gestión de cultivos. Bioestimulantes naturales, derivados de fuentes orgánicas como extractos de algas, hidrolizados de proteínas y microorganismos beneficiosos, potenciar el crecimiento de las plantas, la absorción de nutrientes y la tolerancia al estrés sin el impacto ambiental asociado con sustancias químicas sintéticas.
- Por formulario
Sobre la base de la Forma, el mercado mundial de bioestimulantes se segmenta en líquido, seco. Seca son sub-segmentados en gránulos dispersibles de agua, secos, polvo húmedo. El líquido se sumerge en concentrado de suspensión, concentrado emulsionable, concentrado líquido soluble. En 2026 se espera que el segmento líquido domine el mercado con 65.45% de participación.
También se espera que el segmento líquido registre la CAGR más alta del 12,5% debido a su facilidad de aplicación, rápida absorción y compatibilidad con sistemas modernos de riego y pulverización. Los bioestimulantes líquidos permiten una distribución uniforme de ingredientes activos, garantizando una absorción eficiente de nutrientes y un crecimiento mejorado de las plantas, especialmente en las operaciones agrícolas a gran escala.
- Por ingredientes activos
Sobre la base de Active Ingredients, el mercado mundial de bioestimulantes se segmenta en b-vitaminas, chitosan, chitina, microbial amendments, protein hydrolysates, extract based, acid based, others. En el extracto basado, el mercado se segmenta aún más en extracto de hongos, extracto de planta, extractos de algas. en base a ácido, el mercado se segmenta aún más a ácido húmico fulvic ácidos, aminoácidos. En 2026, se prevé que el segmento basado en ácido dominará el mercado con un 53,32% de participación.
También se espera que el segmento basado en ácido registre la CAGR más alta del 12,7% debido a la rápida adopción de aminoácidos, ácidos humicos y ácidos fulvic para mejorar la productividad de los cultivos y la tolerancia al estrés. Estos bioestimulantes basados en ácidos mejoran la absorción de nutrientes, estimulan el desarrollo de las raíces y aumentan la resiliencia de las plantas contra tensiones abióticas como sequía, salinidad y temperaturas extremas. Su eficacia en una amplia gama de cultivos, junto con el aumento de la conciencia de los agricultores sobre prácticas agrícolas sostenibles y ecológicas, impulsa su creciente popularidad.
- Por solicitud
Sobre la base del método de aplicación, el mercado mundial de bioestimulantes se segmenta en tratamiento de semillas, tratamiento del suelo, tratamiento follar. En 2026, se prevé que el segmento de tratamiento foliar dominará el mercado con un 74,39% de participación.
También se espera que el segmento de tratamiento foliar registre la CAGR más alta del 12,4% debido a su método directo y eficiente de suministrar nutrientes y compuestos activos a los cultivos. Las aplicaciones engañosas permiten una rápida absorción a través de las hojas, lo que lleva a respuestas más rápidas en el crecimiento, la tolerancia al estrés y la mejora del rendimiento en comparación con las aplicaciones del suelo. La creciente adopción de técnicas de agricultura de precisión, el aumento de los requisitos de eficiencia laboral y la versatilidad de los tratamientos follares en una amplia gama de cultivos apoyan el crecimiento del mercado
- Por cultivo
Sobre la base de Crop, el mercado mundial de bioestimulantes se segmenta en ornamentales de césped, pulsos de semillas de aceite, cereales, frutas y verduras, otros. Las semillas de aceite " pulsa el mercado se segmenta aún más en soya, girasol, rapeseed/canola, castaña (peanut), sésamo, otros. En el grano de cereales, el mercado se segmenta aún más en trigo, arroz, maíz, cebada, avena, sorgo, otros. En 2026, se prevé que el segmento de frutas y verduras dominará el mercado con 58,87% de participación.
También se espera que el segmento de frutas y verduras registre la CAGR más alta del 12,6% debido a la creciente demanda de productos de alta calidad, ricos en nutrientes y atractivos visuales. Los bioestimulantes aumentan el rendimiento de los cultivos, mejoran el tamaño de la fruta, el color, el gusto y la vida útil de los estantes, y aumentan la resistencia a tensiones abióticas como sequía, calor y salinidad, haciéndolos altamente valorados en el cultivo de frutas y verduras. La creciente preferencia de los consumidores por productos frescos y orgánicos, junto con normas más estrictas sobre fertilizantes químicos y pesticidas, está impulsando a los agricultores a adoptar bioestimulantes
- Por usuario final
Sobre la base del Usuario Final, el mercado mundial de bioestimulantes se segmenta en institutos de investigación, agricultores. En 2026, se prevé que el segmento de agricultores dominará el mercado con una cuota de mercado del 85,34%.
También se espera que el segmento de agricultores registre la CAGR más alta del 12,6% debido al creciente reconocimiento de los bioestimulantes como herramientas esenciales para la agricultura sostenible y de alto rendimiento. Los agricultores están adoptando cada vez más estos productos para mejorar el crecimiento de los cultivos, aumentar la eficiencia de los nutrientes y fortalecer la resistencia a las tensiones ambientales como la sequía, la salinidad y las temperaturas extremas. La creciente demanda de productos orgánicos y de alta calidad, junto con normas más estrictas sobre fertilizantes sintéticos e insumos químicos, alienta a los agricultores a integrar los bioestimulantes en sus prácticas de gestión de cultivos.
Biostimulants Market Regional Analysis
- Europa domina el mercado mundial de bioestimulantes, que representa el 36,52% de la cuota total en 2026, el liderazgo de la región está impulsado por estrictas regulaciones de sostenibilidad de la UE, alta adopción de prácticas agrícolas orgánicas, expansión de la innovación bioproducto, y fuertes ecosistemas de I+D en Italia, España y Francia. Los fabricantes europeos también lideran tecnologías avanzadas de extracción y formulaciones de primera calidad, posicionando a la región como el centro mundial de innovación y consumo bioestimulantes.
- Asia Pacific representa el 21,77% del mercado mundial en 2026, al más alto CAGR del 12,5% entre todas las regiones. This growth is driven by large-scale agricultural production, rising environmental awareness, and increasing adoption of bio-based products to enhance crop performance under climate stress. Países como China, la India y las economías del sudeste asiático están acelerando el uso de bioestimulantes para mejorar la salud del suelo, la resiliencia de los cultivos y la productividad, lo que hace que Asia Pacífico sea el mercado más rápido y dinámico.
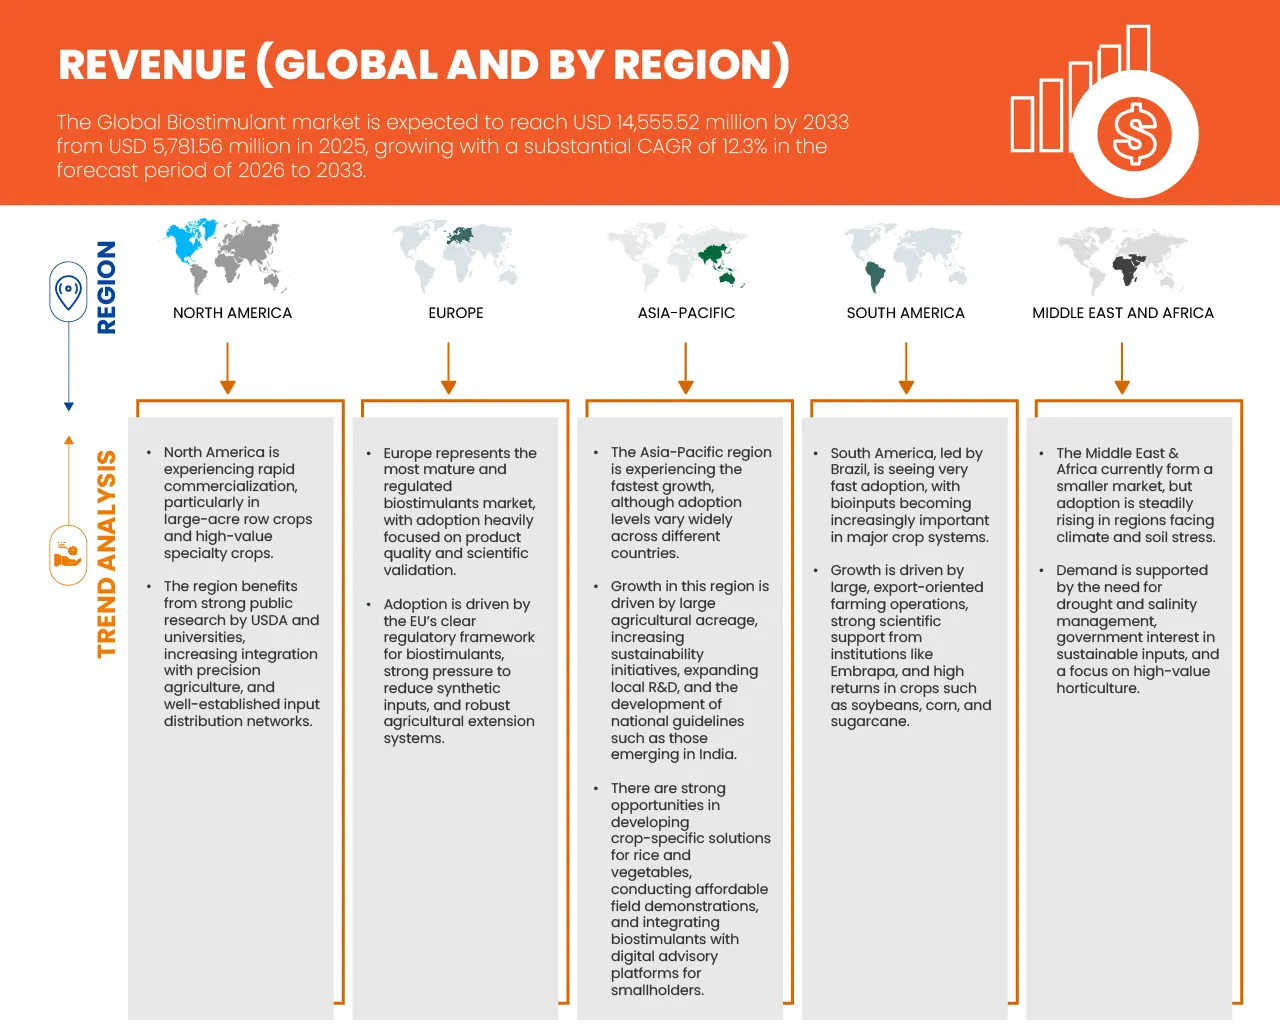
North America Biostimulants Market Insight
El mercado de bioestimulantes de América del Norte está experimentando un crecimiento constante y fuerte, impulsado por la adopción creciente de insumos agrícolas sostenibles, tecnologías agrícolas de precisión y el creciente cambio hacia la producción de alimentos orgánicos y sin residuos. La región sigue invirtiendo fuertemente en soluciones biológicas para mejorar la eficiencia de los nutrientes, la tolerancia al estrés y la productividad general de las plantas.
U.S. Biostimulants Market Insight
Estados Unidos es la fuerza dominante en el mercado de bioestimulantes norteamericanos, que representa el 77,72% de la cuota de la región en 2026, y se prevé que se expanda a una fuerte CAGR de 12,1% de 2026 a 2033. Este crecimiento se ve impulsado por altas tasas de adopción de herramientas de agricultura de precisión y agricultura digital, continua expansión de la agricultura orgánica y regenerativa, y la fuerte presencia de los principales fabricantes de bioestimulantes e instituciones de investigación. Además, el aumento de la demanda de producción de cultivos de alta calidad, especialmente en frutas, verduras, maíz, soja y cultivos especializados, sigue aumentando la absorción del mercado.
Canada Biostimulatns Market Insights
Canadá tiene 12,40% del mercado de bioestimulantes norteamericanos en 2026 y se espera que crezca en una CAGR de 11,4% de 2026 a 2033. Esta expansión se ve impulsada por el rápido crecimiento de la agricultura orgánica y de bajo consumo químico, el aumento de la demanda de consumidores de productos alimenticios limpios y bio-basados, y el firme apoyo gubernamental a las prácticas agrícolas ecológicamente racionales. La adopción de bioestimulantes está aumentando en las principales categorías de cultivos, incluidos los cereales, las semillas oleaginosas, el césped y los cultivos hortícolas, para acelerar la captación del mercado. Además, la creciente inversión de Canadá en programas de mejora de la salud del suelo está reforzando el cambio hacia soluciones de mejora de cultivos biológicos, apoyando el crecimiento sostenido del mercado a largo plazo
Europe Biostimulants Market Insight
Europa domina el mercado mundial de bioestimulantes, con un 36,52% de la cuota total en 2026, creciendo en un CAGR sólido de 12,3%. El liderazgo de la región está impulsado por estrictas regulaciones de sostenibilidad de la UE, alta adopción de prácticas agrícolas orgánicas, ampliando la innovación de bioproductos, y fuertes ecosistemas de R plagaD en Italia, España y Francia. Los fabricantes europeos también lideran tecnologías avanzadas de extracción y formulaciones de primera calidad, posicionando a la región como el centro mundial de innovación y consumo bioestimulantes.
Spain Biostimulants Market Insight
España tiene la mayor parte del mercado europeo de bioestimulantes al 20,22% en 2026 y es también el país de más rápido crecimiento de la región, con una CAGR proyectada del 14,8% de 2026 a 2033. Este fuerte rendimiento es impulsado por la extensa producción de frutas, verduras y cultivos hortícolas que dependen en gran medida de insumos agrícolas de alto valor, junto con sus sectores exportadores como cítricos, aceitunas, bayas y uvas. La rápida adopción de bioestimulantes basados en microbianos y algas, junto con un sólido apoyo gubernamental y respaldado por la UE para prácticas agrícolas sostenibles, está acelerando aún más el crecimiento del mercado. El liderazgo de España también se ve reforzado por su avanzado ecosistema agrotecnológico y su alta capacidad de respuesta a las soluciones biológicas resistentes al clima, consolidando su posición en la vanguardia de la industria europea de bioestimulantes.
U.K. Biostimulants Market Insight
El U.K. representa el 13.68% del mercado europeo de bioestimulantes en 2026 y se prevé que crecerá en una fuerte CAGR de 12,3% de 2026 a 2033. El crecimiento se ve impulsado por la creciente demanda de productos alimenticios orgánicos y sin residuos, el aumento del uso de insumos biológicos en cultivos de alto valor, como frutas, verduras y productos cultivados en invernadero, y un impulso gubernamental post-Brexit hacia la adopción de insumos ecológicos. Adicionalmente, los esfuerzos ampliados de I+D centrados en bioestimulantes microbianos y potenciadores de resistencia al estrés de las plantas están acelerando la innovación en el sector. Con el apoyo de instituciones de investigación avanzadas y la creciente inversión en startups agrobiotecnológicas, el Reino Unido está emergiendo como un mercado estratégico para las formulaciones bioestimulantes de próxima generación.
Asia-Pacific Biostimulants Market Insight
Asia Pacific representa el 21,77% del mercado mundial de bioestimulantes en 2026, al más alto CAGR del 12,5% entre todas las regiones. This growth is driven by large-scale agricultural production, rising environmental awareness, and increasing adoption of bio-based products to enhance crop performance under climate stress. Países como China, la India y las economías del sudeste asiático están acelerando el uso de bioestimulantes para mejorar la salud del suelo, la resiliencia de los cultivos y la productividad, lo que hace que Asia Pacífico sea el mercado más rápido y dinámico.
India Biostimulants Market Insight
La India representa el 21,93% del mercado de bioestimulantes de Asia y el Pacífico en 2026 y se prevé que crecerá en una fuerte CAGR del 13,4% durante el período previsto. Este crecimiento se debe al aumento de la demanda de insumos agrícolas basados en la biotecnología destinados a mejorar la salud del suelo y la productividad de los cultivos, junto con la adopción cada vez mayor de bioestimulantes microbianos, algas y aminoácidos entre los pequeños y medianos agricultores. Las iniciativas gubernamentales que apoyan la agricultura orgánica y el cultivo sin residuos están acelerando aún más la captación del mercado, mientras que la expansión de la horticultura, los pulsos, las semillas oleaginosas y el cultivo de plantaciones sigue ampliando la demanda. Con la creciente capacidad de producción y el uso generalizado en diversos segmentos de cultivos, la India está surgiendo rápidamente como productor principal y consumidor clave en el mercado regional de bioestimulantes.
China Biostimulants Market Insight
China es el mercado más grande y de mayor crecimiento en el sector de bioestimulantes Asia-Pacífico, con 27,74% de la cuota regional en 2026 y registrando la CAGR más alta proyectada del 13,9% entre 2026 y 2033. El crecimiento se ve impulsado por la rápida adopción de bioestimulantes para mejorar la resiliencia de los cultivos en medio del aumento de las tensiones climáticas, junto con iniciativas respaldadas por el Gobierno firmes que promueven prácticas agrícolas ecológicas y de bajo grado de resistencia. El uso es particularmente alto entre las frutas, las verduras, el arroz y los cultivos de efecto invernadero, apoyados por el aumento de los esfuerzos de R plagaD, los avances tecnológicos y la ampliación de la capacidad de fabricación nacional. Con su vasta base agrícola y su cambio estratégico hacia soluciones sostenibles de insumos, China se posiciona como el principal motor de la expansión del mercado regional de bioestimulantes.
¿Cuál es el Mercado de Empresas Top en Biostimulants
El mercado mundial de bioestimulantes está dirigido principalmente por empresas bien establecidas, incluyendo:
- Ajinomoto Co., Inc(Japón)
- Syngenta Biologicals (Suiza)
- Coromandel International Ltd. (India)
- BASF (Alemania)
- Bayer AG(Alemania)
- UPL (India)
- Biostadt India Limited (India)
- Novozymes (Dinamarca)
- Agricen (U.S.)
- FMC Corporation (Estados Unidos)
- T. Stanes & Company Limited (TSTANES) (India)
- REKA ( Koppert) (Países Bajos)
- Atlántica Agrícola(España)
- Haifa Negev Technologies Ltd. (Israel)
- ILSA S.p.A. (Italia)
- AG Biotech, Inc. (U.S.)
Novedades en el mercado mundial de bioestimulantes
- En 2023 de febrero, el ILSA lanzó nuevos bioestimulantes basados en fuentes vegetales renovables: aleación y algas. El producto basado en la soja contiene aminoácidos, manchas y triacontanol, mientras que el bioestimulante basado en algas se extrae utilizando métodos sostenibles y no invasivos. Ambos productos aumentan el crecimiento de las plantas, la tolerancia al estrés y la calidad de las frutas.
- En el 2025 de febrero, Horticoop invirtió en REKA Group BV, una spin-off de Koppert especializada en la mejora del suelo regenerativo. La inversión apoya la misión de REKA de desarrollar y distribuir bioestimulantes, nutrientes e inoculantes que mejoran la salud del suelo, la eficiencia nutritiva y la resiliencia vegetal. Esta asociación pretende fortalecer la agricultura sostenible y la horticultura a nivel mundial.
- En 2024 octubre, T.Stanes lanzó y promovió Fytovita, un bioestimulante basado en vitaminas, destacando su papel en la mejora del crecimiento de las plantas, la mitigación del estrés abiótico y la mejora del rendimiento y la calidad de los cultivos.
- En 2025 de marzo, Ajinomoto Co., Inc. anunció que participaría como socio en el proyecto “Recovery of Degraded Pasture Verification Study” en Brasil, bajo la Iniciativa Japón-Brasil Green Partnership Initiative, proporcionando sus productos bioestimulantes basados en aminoácidos (por ejemplo, AJIFOL® y AMINO Arginine) para su aplicación en tierras de cultivo para verificar la restauración de tierras de pasto degradadas.
- En 2025 de noviembre, BASF anunció que “continuó su compromiso con la financiación de los productores de bajo interés” para la temporada de crecimiento de 2026, ofreciendo financiación de 0% APR en compras de protección de cultivos participantes, tratamiento de semillas y marcas de semillas para apoyar a los agricultores con su inversión en agricultura sostenible.
SKU-
Obtenga acceso en línea al informe sobre la primera nube de inteligencia de mercado del mundo

- Panel de análisis de datos interactivo
- Panel de análisis de empresas para oportunidades con alto potencial de crecimiento
- Acceso de analista de investigación para personalización y consultas
- Análisis de la competencia con panel interactivo
- Últimas noticias, actualizaciones y análisis de tendencias
- Aproveche el poder del análisis de referencia para un seguimiento integral de la competencia
Tabla de contenido
1 INTRODUCCIÓN
1.1 OBJETIVOS DEL ESTUDIO
1.2 DEFINICIÓN DE MERCADO
1.3 DESCRIPCIÓN GENERAL DEL MERCADO MUNDIAL DE BIOESTIMULANTES
1.4 MONEDA Y PRECIOS
1.5 LIMITACIONES
1.6 MERCADOS CUBIERTOS
2 SEGMENTACIÓN DEL MERCADO
2.1 MERCADOS CUBIERTOS
2.2 ÁMBITO GEOGRÁFICO
2,3 AÑOS CONSIDERADOS PARA EL ESTUDIO
2.4 MODELO DE VALIDACIÓN DE DATOS TRÍPODE DBMR
2.5 ENTREVISTAS PRINCIPALES CON LÍDERES DE OPINIÓN CLAVE
2.6 CUADRÍCULA DE POSICIÓN DE MERCADO DBMR
2.7 ANÁLISIS DE LA PARTICIPACIÓN DE LOS PROVEEDORES
2.8 MODELADO MULTIVARIADO
2.9 CURVA DE LA LÍNEA DE TIEMPO DE ORIGEN
2.1 CUADRÍCULA DE COBERTURA DE USUARIOS FINALES DEL MERCADO
2.11 FUENTES SECUNDARIAS
2.12 SUPUESTOS
3 RESUMEN EJECUTIVO
4 INFORMACIÓN PREMIUM
4.1 ANÁLISIS DE LAS CINCO FUERZAS DE PORTER
4.1.1 AMENAZA DE NUEVOS ENTRANTES
4.1.2 PODER DE NEGOCIACIÓN DE LOS PROVEEDORES
4.1.3 PODER DE NEGOCIACIÓN DE LOS COMPRADORES
4.1.4 AMENAZA DE PRODUCTOS SUSTITUTOS
4.1.5 RIVALIDAD EN LA INDUSTRIA
4.2 ANÁLISIS DE PRECIOS
4.3 PERSPECTIVAS DE LA CAPACIDAD DE PRODUCCIÓN DE LA EMPRESA
4.3.1 DESCRIPCIÓN GENERAL
4.3.2 CONCLUSIÓN
4.4 ANÁLISIS DEL ECOSISTEMA INDUSTRIAL
4.4.1 DESCRIPCIÓN GENERAL
4.4.2 EMPRESAS DESTACADAS
4.4.2.1 ESCALA GLOBAL Y VENTAJAS ESTRATÉGICAS
4.4.2.2 FUNCIONES CLAVE Y ROLES DE LA CADENA DE VALOR
4.4.3 PEQUEÑAS Y MEDIANAS EMPRESAS
4.4.3.1 PYMES IMPULSADAS POR LA INNOVACIÓN
4.4.3.2 MODELOS DE NEGOCIO Y ROLES COMPETITIVOS
4.4.4 USUARIOS FINALES
4.4.4.1 SEGMENTACIÓN DE USUARIOS FINALES
4.4.4.2 IMPULSORES DE LA ADOPCIÓN, BARRERAS Y CREACIÓN DE VALOR
4.4.4.3 TABLA DE USUARIOS FINALES POR SEGMENTO DE CULTIVO
4.4.5 CONCLUSIÓN
4.5 ANÁLISIS DE PATENTES – MERCADO GLOBAL DE BIOESTIMULANTES
4.5.1 CALIDAD Y RESISTENCIA DE LA PATENTE
4.5.2 FAMILIAS DE PATENTES
4.5.3 LICENCIAS Y COLABORACIONES
4.5.4 PANORAMA DE PATENTES REGIONALES
4.5.5 ESTRATEGIA Y GESTIÓN DE LA PROPIEDAD INTELECTUAL
4.6 OBTENCIÓN DE MATERIA PRIMA
4.6.1 EXTRACTOS DE ALGAS
4.6.2 SUSTANCIAS HÚMICAS Y FÚLVICAS
4.6.3 AMINOÁCIDOS E HIDROLIZADOS DE PROTEÍNAS
4.6.4 CEPAS MICROBIANAS (BACTERIAS, HONGOS Y LEVADURAS)
4.6.5 ÁCIDOS ORGÁNICOS Y POLISACÁRIDOS
4.6.6 NUTRIENTES INORGÁNICOS Y AGENTES QUELAENTES
4.6.7 PORTADORES Y ADITIVOS DE FORMULACIÓN
4.7 FACTORES QUE AFECTAN LAS DECISIONES DE COMPRA EN EL MERCADO GLOBAL DE BIOESTIMULANTES
4.7.1 INTRODUCCIÓN:
4.7.2 EFICACIA TÉCNICA COMPROBADA Y RENDIMIENTO DEMOSTRADO
4.7.3 ADECUACIÓN A LOS CULTIVOS, EL SUELO Y EL MEDIO AMBIENTE
4.7.4 VIABILIDAD ECONÓMICA Y RETORNO DE LA INVERSIÓN (ROI)
4.7.5 CONFIANZA, TRANSPARENCIA Y REPUTACIÓN DE MARCA
4.7.6 CUMPLIMIENTO NORMATIVO Y CREDENCIALES DE SOSTENIBILIDAD
4.7.7 CONOCIMIENTO, CONCIENCIA Y PERCEPCIÓN DEL RIESGO
4.7.8 CONCLUSIÓN
4.8 ANÁLISIS DE PRODUCCIÓN Y CONSUMO
4.8.1 CONJUNTO DE DATOS DE PRODUCCIÓN
4.8.2 CONJUNTO DE DATOS DE CONSUMO
4.9 ESCENARIO DE IMPORTACIÓN Y EXPORTACIÓN
4.9.1 IMPORTAR CONJUNTO DE DATOS
4.9.2 EXPORTAR CONJUNTO DE DATOS
4.1 SEGUIMIENTO DE INNOVACIÓN Y ANÁLISIS ESTRATÉGICO
4.10.1 ANÁLISIS DE GRANDES ACUERDOS Y ALIANZAS ESTRATÉGICAS
4.10.1.1 EMPRESAS CONJUNTAS
4.10.1.2 FUSIONES Y ADQUISICIONES
4.10.1.3 ACUERDOS DE LICENCIA Y ASOCIACIÓN
4.10.1.4 COLABORACIONES TECNOLÓGICAS
4.10.1.5 DESINVERSIONES ESTRATÉGICAS / REESTRUCTURACIÓN DE CARTERA
4.10.2 NÚMERO DE PRODUCTOS EN DESARROLLO
4.10.3 ETAPA DE DESARROLLO
4.10.4 CRONOGRAMAS E HITOS
4.10.5 ESTRATEGIAS Y METODOLOGÍAS DE INNOVACIÓN
4.10.6 EVALUACIÓN Y MITIGACIÓN DE RIESGOS
4.11 ESCENARIO DE ADOPCIÓN DE PRODUCTOS EN EL MERCADO MUNDIAL DE BIOESTIMULANTES
4.11.1 INTRODUCCIÓN
4.11.2 ETAPA ACTUAL DE ADOPCIÓN
4.11.3 PATRONES DE ADOPCIÓN REGIONALES Y ESPECÍFICOS DE CULTIVOS
4.11.4 FACTORES IMPULSORES DE LA ADOPCIÓN
4.11.5 BARRERAS A LA ADOPCIÓN
4.11.6 CURVA DE ADOPCIÓN Y PERSPECTIVAS
4.11.7 PERSPECTIVA CENTRADA EN EL AGRICULTOR
4.11.8 IMPLICACIONES PARA LAS PARTES INTERESADAS
4.11.9 CONCLUSIÓN
4.12 CUADRANTE DE EVALUACIÓN DE EMPRESAS
4.13 DESGLOSE DEL ANÁLISIS DE COSTOS
4.13.1 DESCRIPCIÓN GENERAL
4.13.2 INVERSIÓN DE CAPITAL Y ESCALA DE PRODUCCIÓN
4.13.2.1 ESCALA DE PLANTA, INFRAESTRUCTURA Y AUTOMATIZACIÓN
4.13.2.2 COMPLEJIDAD DE EQUIPOS Y PROCESOS
4.13.3 COSTOS DE MATERIA PRIMA, FORMULACIÓN Y OPERACIÓN
4.13.3.1 OBTENCIÓN Y VARIABILIDAD DE LA MATERIA PRIMA
4.13.3.2 INTENSIDAD DE PROCESAMIENTO Y COMPLEJIDAD DE LA FORMULACIÓN
4.13.3.3 VARIABILIDAD Y PRIMAS DE RIESGO
4.13.4 COSTOS REGULATORIOS, DE CUMPLIMIENTO Y DE REGISTRO
4.13.4.1 PANORAMA REGULATORIO Y COSTOS ASOCIADOS
4.13.4.2 IMPLICACIONES PARA LA BASE DE COSTOS DE FABRICACIÓN
4.13.5 COSTOS DE LOGÍSTICA, DISTRIBUCIÓN Y APLICACIÓN
4.13.5.1 EMBALAJE, ALMACENAMIENTO Y TRANSPORTE
4.13.5.2 ESTRUCTURA DEL CANAL Y APLICACIÓN DEL USUARIO FINAL
4.13.6 CONSIDERACIONES DE COSTO-BENEFICIO E IMPLICACIONES DE MARGEN
4.13.6.1 RETORNO DE LA INVERSIÓN PARA LOS PRODUCTORES
4.13.6.2 MÁRGENES DE FABRICANTE Y DISTRIBUIDOR
4.13.7 OPORTUNIDADES DE REDUCCIÓN DE COSTOS Y TENDENCIAS DE LA INDUSTRIA
4.13.7.1 USO DE MATERIAS PRIMAS DE RESIDUOS AGROALIMENTARIOS Y ECONOMÍA CIRCULAR
4.13.7.2 AMPLIACIONES, EFICIENCIA DE PROCESOS Y ESTANDARIZACIÓN
4.13.7.3 ARMONIZACIÓN REGULATORIA Y ACCESO AL MERCADO GLOBAL
4.13.8 CONCLUSIÓN
4.14 ESCENARIO DE MÁRGENES DE GANANCIA
4.14.1 DESCRIPCIÓN GENERAL
4.14.2 ESTRUCTURA DEL MARGEN DE LA CADENA DE VALOR
4.14.2.1 MARGEN BRUTO DEL FABRICANTE
4.14.2.2 MARGEN DEL DISTRIBUIDOR/COMERCIANTE
4.14.2.3 CAPTURA DE VALOR DEL AGRICULTOR Y REALIZACIÓN DE MARGEN
4.14.3 IMPULSORES Y RESTRICCIONES DEL MARGEN
4.14.3.1 NUEVOS ACTIVOS Y PRECIOS PREMIUM
4.14.3.2 PRESIONES DE LA BASE DE COSTOS
4.14.3.3 ESCALA Y TASA DE ADOPCIÓN
4.14.3.4 PRESIÓN COMPETITIVA Y SUSTITUCIÓN
4.14.3.5 ROI DEL AGRICULTOR Y DISPOSICIÓN A PAGAR
4.14.4 RANGOS DE MARGEN DE GANANCIA ESTIMADOS
4.14.5 ESTRATEGIAS DE MEJORA DEL MARGEN
4.14.5.1 PRECIOS BASADOS EN EL VALOR
4.14.5.2 OPTIMIZACIÓN DE LA BASE DE COSTOS
4.14.5.3 ENFOQUE EN EL SEGMENTO PREMIUM
4.14.5.4 EXPANSIÓN DE ESCALA
4.14.5.5 PARTICIPACIÓN Y DEMOSTRACIÓN DE LOS AGRICULTORES
4.14.6 CONSIDERACIONES REGIONALES Y DE SEGMENTOS DE CULTIVO
4.14.7 CONCLUSIÓN
4.15 IMPACTO DE LA DESACELERACIÓN ECONÓMICA EN EL MERCADO
4.15.1 IMPACTO EN EL PRECIO
4.15.2 IMPACTO EN LA CADENA DE SUMINISTRO
4.15.3 IMPACTO EN EL ENVÍO
4.15.4 IMPACTO EN LAS DECISIONES ESTRATÉGICAS DE LA EMPRESA
4.15.5 IMPACTO EN LA DEMANDA
4.15.6 IMPACTO EN LAS DECISIONES ESTRATÉGICAS
4.16 ANÁLISIS DE LA CADENA DE SUMINISTRO
4.16.1 DESCRIPCIÓN GENERAL
4.16.2 ESCENARIO DE COSTOS LOGÍSTICOS
4.16.3 IMPORTANCIA DE LOS PROVEEDORES DE SERVICIOS LOGÍSTICOS
5 ARANCELES E IMPACTO EN EL MERCADO
5.1 TASA ARANCELARIA ACTUAL
5.1.1 PERSPECTIVAS: PRODUCCIÓN LOCAL VS. DEPENDENCIA DE LAS IMPORTACIONES
5.2 DINÁMICA DE LOS CRITERIOS DE SELECCIÓN DE PROVEEDORES
5.3 IMPACTO EN LA CADENA DE SUMINISTRO
5.3.1 ADQUISICIÓN DE MATERIA PRIMA
5.3.2 FABRICACIÓN Y PRODUCCIÓN
5.3.3 LOGÍSTICA Y DISTRIBUCIÓN
5.3.4 PRECIOS DE LANZAMIENTO Y POSICIÓN DEL MERCADO
5.4 PARTICIPANTES DE LA INDUSTRIA: ACCIONES PROACTIVAS
5.4.1 OPTIMIZACIÓN DE LA CADENA DE SUMINISTRO
5.4.2 ESTABLECIMIENTOS DE EMPRESAS CONJUNTAS
5.5 IMPACTO EN LOS PRECIOS
5.6 INCLINACIÓN REGULADORA
5.6.1 SITUACIÓN GEOPOLÍTICA
5.6.2 ASOCIACIONES COMERCIALES ENTRE LOS PAÍSES
5.6.2.1 TRATADOS DE LIBRE COMERCIO
5.6.2.2 ESTABLECIMIENTOS DE ALIANZAS
5.6.3 ACREDITACIÓN DE ESTATUS (INCLUIDA LA NMF)
5.6.4 CURSO DE CORRECCIÓN DOMÉSTICA
5.6.4.1 ESQUEMAS DE INCENTIVOS PARA IMPULSAR LA PRODUCCIÓN
5.6.4.2 ESTABLECIMIENTO DE ZONAS ECONÓMICAS ESPECIALES / PARQUES INDUSTRIALES
6 COBERTURA REGULADORA EN EL MERCADO MUNDIAL DE BIOESTIMULANTES
6.1 DESCRIPCIÓN GENERAL
6.2 DEFINICIONES Y CLASIFICACIÓN REGLAMENTARIAS
6.3 REQUISITOS DE CUMPLIMIENTO Y REGISTRO
6.4 ASPECTOS REGULATORIOS DESTACADOS REGIONALES
6.5 IMPLICACIONES PARA LAS PARTES INTERESADAS
6.6 DESAFÍOS EN LA COBERTURA REGULATORIA
6.7 PERSPECTIVAS
7 DESCRIPCIÓN GENERAL DEL MERCADO
7.1 CONTROLADORES
7.1.1 LA AUMENTO DE LA FRECUENCIA DEL ESTRÉS DE LOS CULTIVOS RELACIONADO CON EL CLIMA, COMO SEQUÍAS, INUNDACIONES Y OLAS DE CALOR, ESTÁ IMPULSANDO A LOS AGRICULTORES A ADOPTAR BIOESTIMULANTES PARA MANTENER EL RENDIMIENTO Y LA CALIDAD DE LOS CULTIVOS.
7.1.2 LA AUMENTANTE DEMANDA MUNDIAL DE ALIMENTOS ORGÁNICOS Y PRODUCIDOS DE FORMA SOSTENIBLE ESTÁ FOMENTANDO EL USO DE BIOESTIMULANTES COMO ALTERNATIVA NATURAL A LOS FERTILIZANTES QUÍMICOS.
7.1.3 LA DISMINUCIÓN DE LA FERTILIDAD DEL SUELO DEBIDO AL USO EXCESIVO DE FERTILIZANTES SINTÉTICOS Y A LAS PRÁCTICAS AGRÍCOLAS INTENSIVAS ESTÁ IMPULSANDO A LOS AGRICULTORES A UTILIZAR BIOESTIMULANTES PARA MEJORAR LA ABSORCIÓN DE NUTRIENTES Y LA ACTIVIDAD MICROBIANA DEL SUELO.
7.1.4 GROWING AWARENESS AMONG FARMERS ABOUT LONG-TERM SOIL HEALTH AND SUSTAINABLE AGRICULTURE IS INCREASING THE ADOPTION OF BIOSTIMULANTS TO IMPROVE PLANT RESILIENCE AND PRODUCTIVITY.
7.2 RESTRAINTS
7.2.1 HIGH COST OF BIOSTIMULANT PRODUCTS COMPARED TO CONVENTIONAL FERTILIZERS LIMITS ADOPTION AMONG SMALL-SCALE AND RESOURCE-CONSTRAINED FARMERS
7.2.2 INCONSISTENT PERFORMANCE ACROSS DIFFERENT CROPS, SOILS, AND CLIMATES CREATES UNCERTAINTY FOR FARMERS, SLOWING WIDESPREAD ADOPTION.
7.3 OPPORTUNITY
7.3.1 EXPANSION INTO EMERGING MARKETS WITH INCREASING AGRICULTURAL MODERNIZATION AND AWARENESS OF SUSTAINABLE PRACTICES PRESENTS SIGNIFICANT GROWTH POTENTIAL
7.3.2 DEVELOPMENT OF NEXT-GENERATION BIOSTIMULANTS (MICROBIAL, SEAWEED, OR AMINO ACID-BASED) TAILORED TO SPECIFIC CROPS AND STRESS CONDITIONS OFFERS OPPORTUNITIES FOR PRODUCT DIFFERENTIATION.
7.3.3 INTEGRATION OF BIOSTIMULANTS WITH PRECISION AGRICULTURE TECHNIQUES (LIKE SENSOR-BASED NUTRIENT MANAGEMENT AND TARGETED APPLICATION) CAN OPTIMIZE EFFICACY AND REDUCE INPUT COSTS
7.4 CHALLENGES
7.4.1 LACK OF STANDARDIZED QUALITY BENCHMARKS AND REGULATIONS GLOBALLY MAKES IT DIFFICULT TO ENSURE CONSISTENT PRODUCT EFFECTIVENESS, IMPACTING FARMER TRUST.
7.4.2 FRAGMENTED DISTRIBUTION NETWORKS AND LIMITED AVAILABILITY IN REMOTE AGRICULTURAL REGIONS RESTRICT MARKET PENETRATION AND CONSISTENT USAGE
8 GLOBAL BIOSTIMULANTS MARKET, BY ORIGIN
8.1 OVERVIEW
8.2 NATURAL BIOSTIMULANTS
8.2.1 LIQUID
8.2.2 DRY
8.3 SYNTHETIC BIOSTIMULANTS
8.3.1 LIQUID
8.3.2 DRY
9 GLOBAL BIOSTIMULANTS MARKET, BY FORM
9.1 OVERVIEW
9.2 LIQUID
9.3 DRY
10 GLOBAL BIOSTIMULANTS MARKET, BY ACTIVE INGREDIENTS
10.1 OVERVIEW
10.2 ACID BASED
10.3 EXTRACT BASED
10.4 PROTEIN HYDROLYSATES
10.5 MICROBIAL AMENDMENTS
10.6 CHITIN
10.7 CHITOSAN
10.8 B- VITAMINS
10.9 OTHERS
11 GLOBAL BIOSTIMULANTS MARKET, BY CROP
11.1 OVERVIEW
11.2 FRUITS & VEGETABLES
11.3 CEREALS & GRAINS
11.4 OILSEEDS & PULSES
11.5 TURF & ORNAMENTALS
11.6 OTHER CROPS
12 GLOBAL BIOSTIMULANTS MARKET, BY APPLICATION METHOD
12.1 OVERVIEW
12.2 FOLIAR TREATMENT
12.3 SOIL TREATMENT
12.4 SEED TREATMENT
13 GLOBAL BIOSTIMULANTS MARKET, BY END USER
13.1 OVERVIEW
13.2 FARMERS
13.3 RESEARCH INSTITUTES
14 GLOBAL BIOSTIMULANTS MARKET, BY REGION
14.1 OVERVIEW
14.2 EUROPE
14.2.1 SPAIN
14.2.2 ITALY
14.2.3 U.K.
14.2.4 FRANCE
14.2.5 GERMANY
14.2.6 NETHERLANDS
14.2.7 SWITZERLAND
14.2.8 RUSSIA
14.2.9 BELGIUM
14.2.10 TURKEY
14.2.11 POLAND
14.2.12 DENMARK
14.2.13 SWEDEN
14.2.14 NORWAY
14.2.15 REST OF EUROPE
14.3 NORTH AMERICA
14.3.1 U.S.
14.3.2 CANADA
14.3.3 MEXICO
14.4 ASIA PACIFIC
14.4.1 CHINA
14.4.2 INDIA
14.4.3 AUSTRALIA
14.4.4 JAPAN
14.4.5 INDONESIA
14.4.6 SOUTH KOREA
14.4.7 THAILAND
14.4.8 MALAYSIA
14.4.9 PHILIPPINES
14.4.10 SINGAPORE
14.4.11 NEW ZEALAND
14.4.12 REST OF ASIA-PACIFIC
14.5 SOUTH AMERICA
14.5.1 BRAZIL
14.5.2 ARGENTINA
14.5.3 REST OF SOUTH AMERICA
14.6 MIDDLE EAST AND AFRICA
14.6.1 SOUTH AFRICA
14.6.2 SAUDI ARABIA
14.6.3 UNITED ARAB EMIRATES (UAE)
14.6.4 EGYPT
14.6.5 ISRAEL
14.6.6 REST OF MIDDLE EAST & AFRICA
15 GLOBAL BIOSTIMULANTS MARKET: COMPANY LANDSCAPE
15.1 ANÁLISIS DE LAS ACCIONES DE LAS EMPRESAS FABRICANTES: GLOBAL
15.2 ANÁLISIS DE ACCIONES DE LA EMPRESA: ASIA-PACÍFICO
15.3 ANÁLISIS DE ACCIONES DE EMPRESAS: AMÉRICA DEL NORTE
15.4 ANÁLISIS DE ACCIONES DE EMPRESAS: EUROPA
16 ANÁLISIS FODA
17 PERFIL DE LA EMPRESA
17.1 NOVOZYMES A/S
17.1.1 INSTANTÁNEA DE LA EMPRESA
17.1.2 ANÁLISIS DE INGRESOS
17.1.3 ANÁLISIS DE LAS ACCIONES DE LA EMPRESA
17.1.4 PORTAFOLIO DE PRODUCTOS
17.1.5 DESARROLLO RECIENTE
17.2 AJINOMOTO CO., INC.
17.2.1 INSTANTÁNEA DE LA EMPRESA
17.2.2 ANÁLISIS DE INGRESOS
17.2.3 ANÁLISIS DE LAS ACCIONES DE LA EMPRESA
17.2.4 PORTAFOLIO DE PRODUCTOS
17.2.5 DESARROLLO RECIENTE
17.3 UPL
17.3.1 INSTANTÁNEA DE LA EMPRESA
17.3.2 ANÁLISIS DE INGRESOS
17.3.3 ANÁLISIS DE LAS ACCIONES DE LA EMPRESA
17.3.4 PORTAFOLIO DE PRODUCTOS
17.3.5 DESARROLLO RECIENTE
17.4 SYNGENTA
17.4.1 INSTANTÁNEA DE LA EMPRESA
17.4.2 ANÁLISIS DE LAS ACCIONES DE LA EMPRESA
17.4.3 PORTAFOLIO DE PRODUCTOS
17.4.4 DESARROLLO RECIENTE
17.5 BASF
17.5.1 INSTANTÁNEA DE LA EMPRESA
17.5.2 ANÁLISIS DE INGRESOS
17.5.3 ANÁLISIS DE LAS ACCIONES DE LA EMPRESA
17.5.4 PORTAFOLIO DE PRODUCTOS
17.5.5 DESARROLLO RECIENTE
17.6 AG BIOTECNOLOGÍA, INC.
17.6.1 INSTANTÁNEA DE LA EMPRESA
17.6.2 PORTAFOLIO DE PRODUCTOS
17.6.3 DESARROLLO RECIENTE
17.7 AGRÍCOLA
17.7.1 INSTANTÁNEA DE LA EMPRESA
17.7.2 PORTAFOLIO DE PRODUCTOS
17.7.3 DESARROLLO RECIENTE
17.8 ATLÁNTICA AGRÍCOLA
17.8.1 INSTANTÁNEA DE LA EMPRESA
17.8.2 PORTAFOLIO DE PRODUCTOS
17.8.3 DESARROLLO RECIENTE
17.9 Bayer AG
17.9.1 INSTANTÁNEA DE LA EMPRESA
17.9.2 ANÁLISIS DE INGRESOS
17.9.3 PORTAFOLIO DE PRODUCTOS
17.9.4 DESARROLLO RECIENTE
17.1 BIOSTADT.
17.10.1 INSTANTÁNEA DE LA EMPRESA
17.10.2 PORTAFOLIO DE PRODUCTOS
17.10.3 DESARROLLO RECIENTE
17.11 COROMANDEL INTERNACIONAL LTD.
17.11.1 INSTANTÁNEA DE LA EMPRESA
17.11.2 ANÁLISIS DE INGRESOS
17.11.3 PORTAFOLIO DE PRODUCTOS
17.11.4 DESARROLLO RECIENTE
17.12 CORPORACIÓN FMC
17.12.1 INSTANTÁNEA DE LA EMPRESA
17.12.2 ANÁLISIS DE INGRESOS
17.12.3 PORTAFOLIO DE PRODUCTOS
17.12.4 DESARROLLO RECIENTE
17.13 HAIFA NEGEV TECNOLOGÍAS LTD.
17.13.1 INSTANTÁNEA DE LA EMPRESA
17.13.2 PORTAFOLIO DE PRODUCTOS
17.13.3 DESARROLLO RECIENTE
17.14 ILSA SPA
17.14.1 INSTANTÁNEA DE LA EMPRESA
17.14.2 PORTAFOLIO DE PRODUCTOS
17.14.3 DESARROLLO RECIENTE
17.15 REKA
17.15.1 INSTANTÁNEA DE LA EMPRESA
17.15.2 PORTAFOLIO DE PRODUCTOS
17.15.3 DESARROLLO RECIENTE
17.16 TSTANES.
17.16.1 INSTANTÁNEA DE LA EMPRESA
17.16.2 ANÁLISIS DE INGRESOS
17.16.3 PORTAFOLIO DE PRODUCTOS
17.16.4 DESARROLLO RECIENTE
18 CUESTIONARIO
Lista de Tablas
TABLA 1 CAPACIDAD DE PRODUCCIÓN DE LA EMPRESA
TABLA 2 MERCADO MUNDIAL DE BIOESTIMULANTES, POR ORIGEN, 2018-2033 (MILES DE USD)
TABLA 3 MERCADO MUNDIAL DE BIOESTIMULANTES, POR ORIGEN, 2018-2033 (TONELADAS)
TABLA 4 MERCADO GLOBAL DE BIOESTIMULANTES NATURALES, POR REGIÓN, 2018-2033 (MILES DE USD)
TABLA 5 MERCADO GLOBAL DE BIOESTIMULANTES NATURALES, POR FORMA, 2018-2033 (MILES DE USD)
TABLA 6 MERCADO GLOBAL DE LÍQUIDOS EN BIOESTIMULANTES, POR TIPO, 2018-2033 (MILES DE USD)
TABLA 7 MERCADO MUNDIAL DE BIOESTIMULANTES SECOS, POR TIPO, 2018-2033 (MILES DE USD)
TABLA 8 BIOESTIMULANTES SINTÉTICOS GLOBALES EN EL MERCADO DE BIOESTIMULANTES, POR REGIÓN, 2018-2033 (MILES DE USD)
TABLA 9 BIOESTIMULANTES SINTÉTICOS GLOBALES EN EL MERCADO DE BIOESTIMULANTES, POR FORMA, 2018-2033 (MILES DE USD)
TABLA 10 MERCADO GLOBAL DE LÍQUIDOS EN BIOESTIMULANTES, POR TIPO, 2018-2033 (MILES DE USD)
TABLA 11 MERCADO MUNDIAL DE BIOESTIMULANTES SECOS, POR TIPO, 2018-2033 (MILES DE USD)
TABLA 12 MERCADO MUNDIAL DE BIOESTIMULANTES, POR FORMA, 2018-2033 (MILES DE USD)
TABLA 13 MERCADO GLOBAL DE BIOESTIMULANTES LÍQUIDOS, POR REGIÓN, 2018-2033 (MILES DE USD)
TABLA 14 MERCADO GLOBAL DE LÍQUIDOS EN BIOESTIMULANTES, POR TIPO, 2018-2033 (MILES DE USD)
TABLA 15 MERCADO MUNDIAL DE BIOESTIMULANTES SECOS, POR REGIÓN, 2018-2033 (MILES DE USD)
TABLA 16 MERCADO GLOBAL DE BIOESTIMULANTES SECOS, POR TIPO, 2018-2033 (MILES DE USD)
TABLA 17 MERCADO MUNDIAL DE BIOESTIMULANTES, POR ORIGEN, 2018-2033 (MILES DE USD)
TABLA 18 MERCADO GLOBAL DE BIOESTIMULANTES A BASE DE ÁCIDO, POR REGIÓN, 2018-2033 (MILES DE USD)
TABLA 19 MERCADO GLOBAL DE BIOESTIMULANTES A BASE DE ÁCIDO, POR TIPO, 2018-2033 (MILES DE USD)
TABLA 20 MERCADO MUNDIAL DE BIOESTIMULANTES BASADOS EN EXTRACTOS, POR REGIÓN, 2018-2033 (MILES DE USD)
TABLA 21 MERCADO MUNDIAL DE BIOESTIMULANTES BASADOS EN EXTRACTOS, POR TIPO, 2018-2033 (MILES DE USD)
TABLA 22 MERCADO MUNDIAL DE HIDROLIZADOS DE PROTEÍNAS EN BIOESTIMULANTES, POR REGIÓN, 2018-2033 (MILES DE USD)
TABLA 23 MERCADO MUNDIAL DE ENMIENDAS MICROBIANAS EN BIOESTIMULANTES, POR REGIÓN, 2018-2033 (MILES DE USD)
TABLA 24 MERCADO MUNDIAL DE QUITINA EN BIOESTIMULANTES, POR REGIÓN, 2018-2033 (MILES DE USD)
TABLA 25 MERCADO MUNDIAL DE QUITOSANO EN BIOESTIMULANTES, POR REGIÓN, 2018-2033 (MILES DE USD)
TABLA 26 MERCADO MUNDIAL DE VITAMINAS B EN BIOESTIMULANTES, POR REGIÓN, 2018-2033 (MILES DE USD)
TABLA 27 MERCADO MUNDIAL DE OTROS EN BIOESTIMULANTES, POR REGIÓN, 2018-2033 (MILES DE USD)
TABLA 28 MERCADO MUNDIAL DE BIOESTIMULANTES, POR CULTIVO, 2018-2033 (MILES DE USD)
TABLA 29 MERCADO MUNDIAL DE FRUTAS Y VERDURAS EN BIOESTIMULANTES, POR REGIÓN, 2018-2033 (MILES DE USD)
TABLA 30 MERCADO MUNDIAL DE FRUTAS Y VERDURAS EN BIOESTIMULANTES, POR FRUTAS, 2018-2033 (MILES DE USD)
TABLA 31 MERCADO MUNDIAL DE FRUTAS Y VERDURAS EN BIOESTIMULANTES, POR VERDURA, 2018-2033 (MILES DE USD)
CUADRO 32 MERCADO MUNDIAL DE CEREALES Y GRANOS EN BIOESTIMULANTES, POR REGIÓN, 2018-2033 (MILES DE USD)
TABLA 33 MERCADO MUNDIAL DE CEREALES Y GRANOS EN BIOESTIMULANTES, POR TIPO, 2018-2033 (MILES DE USD)
CUADRO 34 MERCADO MUNDIAL DE SEMILLAS OLEAGINOSAS Y LEGUMBRES EN BIOESTIMULANTES, POR REGIÓN, 2018-2033 (MILES DE USD)
TABLA 35 MERCADO MUNDIAL DE SEMILLAS OLEAGINOSAS Y LEGUMBRES EN BIOESTIMULANTES, POR TIPO, 2018-2033 (MILES DE USD)
TABLA 36 MERCADO MUNDIAL DE CÉSPEDES Y PLANTAS ORNAMENTALES EN BIOESTIMULANTES, POR REGIÓN, 2018-2033 (MILES DE USD)
CUADRO 37 MERCADO MUNDIAL DE OTROS CULTIVOS EN BIOESTIMULANTES, POR REGIÓN, 2018-2033 (MILES DE USD)
TABLA 38 MERCADO MUNDIAL DE BIOESTIMULANTES, POR MÉTODO DE APLICACIÓN, 2018-2033 (MILES DE USD)
CUADRO 39 MERCADO GLOBAL DE TRATAMIENTO FOLIAR EN BIOESTIMULANTES, POR REGIÓN, 2018-2033 (MILES DE USD)
CUADRO 40 MERCADO MUNDIAL DE TRATAMIENTO DE SUELOS CON BIOESTIMULANTES, POR REGIÓN, 2018-2033 (MILES DE USD)
CUADRO 41 MERCADO MUNDIAL DE TRATAMIENTO DE SEMILLAS EN BIOESTIMULANTES, POR REGIÓN, 2018-2033 (MILES DE USD)
TABLA 42 MERCADO MUNDIAL DE BIOESTIMULANTES, POR USUARIO FINAL, 2018-2033 (MILES DE USD)
TABLA 43 AGRICULTORES MUNDIALES EN EL MERCADO DE BIOESTIMULANTES, POR REGIÓN, 2018-2033 (MILES DE USD)
TABLA 44 INSTITUTOS DE INVESTIGACIÓN GLOBAL EN EL MERCADO DE BIOESTIMULANTES, POR REGIÓN, 2018-2033 (MILES DE USD)
TABLA 45 MERCADO MUNDIAL DE BIOESTIMULANTES
TABLA 46 MERCADO MUNDIAL DE BIOESTIMULANTES, POR REGIÓN, 2018-2033 (MILES DE USD)
CUADRO 47 MERCADO MUNDIAL DE BIOESTIMULANTES, POR REGIÓN, 2018-2033 (TONELADAS)
CUADRO 48 GLOBAL
TABLA 49 MERCADO MUNDIAL DE BIOESTIMULANTES, POR ORIGEN, 2018-2033 (MILES DE USD)
TABLA 50 MERCADO MUNDIAL DE BIOESTIMULANTES, POR ORIGEN, 2018-2033 (TONELADAS)
TABLA 51 MERCADO GLOBAL DE BIOESTIMULANTES NATURALES, POR FORMA, 2018-2033 (MILES DE USD)
TABLA 52 MERCADO GLOBAL DE LÍQUIDOS EN BIOESTIMULANTES, POR TIPO, 2018-2033 (MILES DE USD)
TABLA 53 MERCADO MUNDIAL DE BIOESTIMULANTES SECOS, POR TIPO, 2018-2033 (MILES DE USD)
TABLA 54 BIOESTIMULANTES SINTÉTICOS GLOBALES EN EL MERCADO DE BIOESTIMULANTES, POR FORMA, 2018-2033 (MILES DE USD)
TABLA 55 MERCADO GLOBAL DE LÍQUIDOS EN BIOESTIMULANTES, POR TIPO, 2018-2033 (MILES DE USD)
TABLA 56 MERCADO GLOBAL DE BIOESTIMULANTES SECOS, POR TIPO, 2018-2033 (MILES DE USD)
TABLA 57 MERCADO MUNDIAL DE BIOESTIMULANTES, POR FORMA, 2018-2033 (MILES DE USD)
TABLA 58 MERCADO GLOBAL DE LÍQUIDOS EN BIOESTIMULANTES, POR TIPO, 2018-2033 (MILES DE USD)
TABLA 59 MERCADO GLOBAL DE BIOESTIMULANTES SECOS, POR TIPO, 2018-2033 (MILES DE USD)
TABLA 60 MERCADO MUNDIAL DE BIOESTIMULANTES, POR INGREDIENTES ACTIVOS, 2018-2033 (MILES DE USD)
TABLA 61 MERCADO GLOBAL DE BIOESTIMULANTES A BASE DE ÁCIDO, POR TIPO, 2018-2033 (MILES DE USD)
TABLA 62 MERCADO MUNDIAL DE BIOESTIMULANTES BASADOS EN EXTRACTOS, POR TIPO, 2018-2033 (MILES DE USD)
TABLA 63 MERCADO MUNDIAL DE BIOESTIMULANTES, POR MÉTODO DE APLICACIÓN, 2018-2032 (MILES DE USD)
TABLA 64 MERCADO MUNDIAL DE BIOESTIMULANTES, POR CULTIVO, 2018-2033 (MILES DE USD)
TABLA 65 MERCADO MUNDIAL DE FRUTAS Y VERDURAS EN BIOESTIMULANTES, POR FRUTAS, 2018-2033 (MILES DE USD)
TABLA 66 MERCADO MUNDIAL DE FRUTAS Y VERDURAS EN BIOESTIMULANTES, POR VERDURA, 2018-2033 (MILES DE USD)
TABLA 67 MERCADO MUNDIAL DE CEREALES Y GRANOS EN BIOESTIMULANTES, POR TIPO, 2018-2033 (MILES DE USD)
TABLA 68 MERCADO MUNDIAL DE SEMILLAS OLEAGINOSAS Y LEGUMBRES EN BIOESTIMULANTES, POR TIPO, 2018-2033 (MILES DE USD)
TABLA 69 MERCADO MUNDIAL DE BIOESTIMULANTES, POR USUARIO FINAL, 2018-2033 (MILES DE USD)
TABLA 70 MERCADO EUROPEO DE BIOESTIMULANTES, POR PAÍS, 2018-2033 (MILES DE USD)
TABLA 71 MERCADO EUROPEO DE BIOESTIMULANTES, POR PAÍS, 2018-2033 (MILES DE USD)
TABLA 72 MERCADO EUROPEO DE BIOESTIMULANTES, POR PAÍS, 2018-2033 (TONELADAS)
CUADRO 73 EUROPA
TABLA 74 MERCADO EUROPEO DE BIOESTIMULANTES, POR ORIGEN, 2018-2033 (MILES DE USD)
TABLA 75 MERCADO EUROPEO DE BIOESTIMULANTES, POR ORIGEN, 2018-2033 (TONELADAS)
TABLA 76 BIOESTIMULANTES NATURALES EN EL MERCADO EUROPEO DE BIOESTIMULANTES, POR FORMA, 2018-2033 (MILES DE USD)
TABLA 77 MERCADO EUROPEO DE BIOESTIMULANTES LÍQUIDOS, POR TIPO, 2018-2033 (MILES DE USD)
TABLA 78 MERCADO EUROPEO DE BIOESTIMULANTES SECOS, POR TIPO, 2018-2033 (MILES DE USD)
TABLA 79 BIOESTIMULANTES SINTÉTICOS EN EL MERCADO EUROPEO DE BIOESTIMULANTES, POR FORMA, 2018-2033 (MILES DE USD)
TABLA 80 MERCADO EUROPEO DE BIOESTIMULANTES LÍQUIDOS, POR TIPO, 2018-2033 (MILES DE USD)
TABLA 81 MERCADO EUROPEO DE BIOESTIMULANTES SECOS, POR TIPO, 2018-2033 (MILES DE USD)
TABLA 82 MERCADO EUROPEO DE BIOESTIMULANTES, POR FORMA, 2018-2033 (MILES DE USD)
TABLA 83 MERCADO EUROPEO DE BIOESTIMULANTES LÍQUIDOS, POR TIPO, 2018-2033 (MILES DE USD)
TABLA 84 MERCADO EUROPEO DE BIOESTIMULANTES SECOS, POR TIPO, 2018-2033 (MILES DE USD)
TABLA 85 MERCADO EUROPEO DE BIOESTIMULANTES, POR INGREDIENTES ACTIVOS, 2018-2033 (MILES DE USD)
TABLA 86 MERCADO EUROPEO DE BIOESTIMULANTES A BASE DE ÁCIDO, POR TIPO, 2018-2033 (MILES DE USD)
TABLA 87 MERCADO EUROPEO DE BIOESTIMULANTES BASADOS EN EXTRACTOS, POR TIPO, 2018-2033 (MILES DE USD)
TABLA 88 MERCADO EUROPEO DE BIOESTIMULANTES, POR MÉTODO DE APLICACIÓN, 2018-2032 (MILES DE USD)
TABLA 89 MERCADO EUROPEO DE BIOESTIMULANTES, POR CULTIVO, 2018-2033 (MILES DE USD)
TABLA 90 MERCADO EUROPEO DE FRUTAS Y VERDURAS EN BIOESTIMULANTES, POR FRUTAS, 2018-2033 (MILES DE USD)
TABLA 91 MERCADO EUROPEO DE FRUTAS Y VERDURAS EN BIOESTIMULANTES, POR VERDURA, 2018-2033 (MILES DE USD)
TABLA 92 MERCADO EUROPEO DE CEREALES Y GRANOS EN BIOESTIMULANTES, POR TIPO, 2018-2033 (MILES DE USD)
TABLA 93 MERCADO EUROPEO DE SEMILLAS OLEAGINOSAS Y LEGUMBRES EN BIOESTIMULANTES, POR TIPO, 2018-2033 (MILES DE USD)
TABLA 94 MERCADO EUROPEO DE BIOESTIMULANTES, POR USUARIO FINAL, 2018-2033 (MILES DE USD)
TABLA 95 MERCADO ESPAÑOL DE BIOESTIMULANTES, POR ORIGEN, 2018-2033 (MILES DE USD)
TABLA 96 MERCADO ESPAÑOL DE BIOESTIMULANTES, POR ORIGEN, 2018-2033 (TONELADAS)
TABLA 97 BIOESTIMULANTES NATURALES EN EL MERCADO DE BIOESTIMULANTES DE ESPAÑA, POR FORMA, 2018-2033 (MILES DE USD)
TABLA 98 MERCADO ESPAÑOL DE LÍQUIDOS EN BIOESTIMULANTES, POR TIPO, 2018-2033 (MILES DE USD)
TABLA 99 MERCADO DE BIOESTIMULANTES SECO EN ESPAÑA, POR TIPO, 2018-2033 (MILES DE USD)
TABLA 100 BIOESTIMULANTES SINTÉTICOS EN EL MERCADO DE BIOESTIMULANTES DE ESPAÑA, POR FORMA, 2018-2033 (MILES DE USD)
TABLA 101 MERCADO ESPAÑOL DE LÍQUIDOS EN BIOESTIMULANTES, POR TIPO, 2018-2033 (MILES DE USD)
TABLA 102 MERCADO DE BIOESTIMULANTES SECO EN ESPAÑA, POR TIPO, 2018-2033 (MILES DE USD)
TABLA 103 MERCADO ESPAÑOL DE BIOESTIMULANTES, POR FORMA, 2018-2033 (MILES DE USD)
TABLA 104 MERCADO ESPAÑOL DE LÍQUIDOS EN BIOESTIMULANTES, POR TIPO, 2018-2033 (MILES DE USD)
TABLA 105 MERCADO DE BIOESTIMULANTES SECO EN ESPAÑA, POR TIPO, 2018-2033 (MILES DE USD)
TABLA 106 MERCADO ESPAÑOL DE BIOESTIMULANTES, POR INGREDIENTES ACTIVOS, 2018-2033 (MILES DE USD)
TABLA 107 MERCADO ESPAÑOL DE BIOESTIMULANTES A BASE DE ÁCIDO, POR TIPO, 2018-2033 (MILES DE USD)
TABLA 108 MERCADO ESPAÑOL DE BIOESTIMULANTES A BASE DE EXTRACTO, POR TIPO, 2018-2033 (MILES DE USD)
TABLA 109 MERCADO ESPAÑOL DE BIOESTIMULANTES, POR MÉTODO DE APLICACIÓN, 2018-2032 (MILES DE USD)
TABLA 110 MERCADO DE BIOESTIMULANTES EN ESPAÑA, POR CULTIVO, 2018-2033 (MILES DE USD)
TABLA 111 MERCADO DE FRUTAS Y VERDURAS EN ESPAÑA, POR FRUTAS, 2018-2033 (MILES DE USD)
TABLA 112 MERCADO DE FRUTAS Y VERDURAS EN ESPAÑA, POR VERDURAS, 2018-2033 (MILES DE USD)
TABLA 113 MERCADO DE CEREALES Y GRANOS EN BIOESTIMULANTES EN ESPAÑA, POR TIPO, 2018-2033 (MILES DE USD)
TABLA 114 MERCADO DE SEMILLAS OLEAGINOSAS Y LEGUMBRES EN BIOESTIMULANTES EN ESPAÑA, POR TIPO, 2018-2033 (MILES DE USD)
TABLA 115 MERCADO ESPAÑOL DE BIOESTIMULANTES, POR USUARIO FINAL, 2018-2033 (MILES DE USD)
TABLA 116 MERCADO DE BIOESTIMULANTES DE ITALIA, POR ORIGEN, 2018-2033 (MILES DE USD)
TABLA 117 MERCADO DE BIOESTIMULANTES EN ITALIA, POR ORIGEN, 2018-2033 (TONELADAS)
TABLA 118 BIOESTIMULANTES NATURALES DE ITALIA EN EL MERCADO DE BIOESTIMULANTES, POR FORMA, 2018-2033 (MILES DE USD)
TABLA 119 MERCADO DE BIOESTIMULANTES LÍQUIDOS DE ITALIA, POR TIPO, 2018-2033 (MILES DE USD)
TABLA 120 MERCADO DE BIOESTIMULANTES SECO EN ITALIA, POR TIPO, 2018-2033 (MILES DE USD)
TABLA 121 BIOESTIMULANTES SINTÉTICOS DE ITALIA EN EL MERCADO DE BIOESTIMULANTES, POR FORMA, 2018-2033 (MILES DE USD)
TABLA 122 MERCADO DE BIOESTIMULANTES LÍQUIDOS DE ITALIA, POR TIPO, 2018-2033 (MILES DE USD)
TABLA 123 MERCADO DE BIOESTIMULANTES SECO EN ITALIA, POR TIPO, 2018-2033 (MILES DE USD)
TABLA 124 MERCADO DE BIOESTIMULANTES DE ITALIA, POR FORMA, 2018-2033 (MILES DE USD)
TABLA 125 MERCADO DE BIOESTIMULANTES LÍQUIDOS DE ITALIA, POR TIPO, 2018-2033 (MILES DE USD)
TABLA 126 ITALIA SECA EN EL MERCADO DE BIOESTIMULANTES, POR TIPO, 2018-2033 (MILES DE USD)
TABLA 127 MERCADO DE BIOESTIMULANTES DE ITALIA, POR INGREDIENTES ACTIVOS, 2018-2033 (MILES DE USD)
TABLA 128 MERCADO DE BIOESTIMULANTES A BASE DE ÁCIDO DE ITALIA, POR TIPO, 2018-2033 (MILES DE USD)
TABLA 129 MERCADO DE BIOESTIMULANTES A BASE DE EXTRACTO DE ITALIA, POR TIPO, 2018-2033 (MILES DE USD)
TABLA 130 MERCADO DE BIOESTIMULANTES DE ITALIA, POR MÉTODO DE APLICACIÓN, 2018-2032 (MILES DE USD)
TABLA 131 MERCADO DE BIOESTIMULANTES DE ITALIA, POR CULTIVO, 2018-2033 (MILES DE USD)
TABLA 132 ITALIA FRUTAS Y VERDURAS EN EL MERCADO DE BIOESTIMULANTES, POR FRUTAS, 2018-2033 (MILES DE USD)
TABLA 133 ITALIA FRUTAS Y VERDURAS EN EL MERCADO DE BIOESTIMULANTES, POR VERDURA, 2018-2033 (MILES DE USD)
TABLA 134 ITALIA CEREALES Y GRANOS EN EL MERCADO DE BIOESTIMULANTES, POR TIPO, 2018-2033 (MILES DE USD)
TABLA 135 SEMILLAS OLEAGINOSAS Y LEGUMBRES EN EL MERCADO DE BIOESTIMULANTES DE ITALIA, POR TIPO, 2018-2033 (MILES DE USD)
TABLA 136 MERCADO DE BIOESTIMULANTES DE ITALIA, POR USUARIO FINAL, 2018-2033 (MILES DE USD)
TABLA 137 MERCADO DE BIOESTIMULANTES DEL REINO UNIDO, POR ORIGEN, 2018-2033 (MILES DE USD)
TABLA 138 MERCADO DE BIOESTIMULANTES DEL REINO UNIDO, POR ORIGEN, 2018-2033 (TONELADAS)
TABLA 139 BIOESTIMULANTES NATURALES EN EL MERCADO DE BIOESTIMULANTES DEL REINO UNIDO, POR FORMA, 2018-2033 (MILES DE USD)
TABLA 140 MERCADO DE BIOESTIMULANTES LÍQUIDOS DEL REINO UNIDO, POR TIPO, 2018-2033 (MILES DE USD)
TABLA 141 MERCADO DE BIOESTIMULANTES SECOS DEL REINO UNIDO, POR TIPO, 2018-2033 (MILES DE USD)
TABLA 142 BIOESTIMULANTES SINTÉTICOS EN EL MERCADO DE BIOESTIMULANTES DEL REINO UNIDO, POR FORMA, 2018-2033 (MILES DE USD)
TABLA 143 MERCADO DE BIOESTIMULANTES LÍQUIDOS DEL REINO UNIDO, POR TIPO, 2018-2033 (MILES DE USD)
TABLA 144 MERCADO DE BIOESTIMULANTES SECOS DEL REINO UNIDO, POR TIPO, 2018-2033 (MILES DE USD)
TABLA 145 MERCADO DE BIOESTIMULANTES DEL REINO UNIDO, POR FORMA, 2018-2033 (MILES DE USD)
TABLA 146 MERCADO DE BIOESTIMULANTES LÍQUIDOS DEL REINO UNIDO, POR TIPO, 2018-2033 (MILES DE USD)
TABLA 147 MERCADO DE BIOESTIMULANTES SECOS DEL REINO UNIDO, POR TIPO, 2018-2033 (MILES DE USD)
TABLA 148 MERCADO DE BIOESTIMULANTES DEL REINO UNIDO, POR INGREDIENTES ACTIVOS, 2018-2033 (MILES DE USD)
TABLA 149 MERCADO DE BIOESTIMULANTES A BASE DE ÁCIDO DEL REINO UNIDO, POR TIPO, 2018-2033 (MILES DE USD)
TABLA 150 MERCADO DE BIOESTIMULANTES BASADOS EN EXTRACTOS DEL REINO UNIDO, POR TIPO, 2018-2033 (MILES DE USD)
TABLA 151 MERCADO DE BIOESTIMULANTES DEL REINO UNIDO, POR MÉTODO DE APLICACIÓN, 2018-2032 (MILES DE USD)
TABLA 152 MERCADO DE BIOESTIMULANTES DEL REINO UNIDO, POR CULTIVO, 2018-2033 (MILES DE USD)
TABLA 153 FRUTAS Y VERDURAS EN EL MERCADO DE BIOESTIMULANTES DEL REINO UNIDO, POR FRUTAS, 2018-2033 (MILES DE USD)
TABLA 154 FRUTAS Y VERDURAS EN EL MERCADO DE BIOESTIMULANTES DEL REINO UNIDO, POR VERDURA, 2018-2033 (MILES DE USD)
TABLA 155 MERCADO DE CEREALES Y GRANOS BIOESTIMULANTES DEL REINO UNIDO, POR TIPO, 2018-2033 (MILES DE USD)
TABLA 156 MERCADO DE SEMILLAS OLEAGINOSAS Y LEGUMBRES EN BIOESTIMULANTES DEL REINO UNIDO, POR TIPO, 2018-2033 (MILES DE USD)
TABLA 157 MERCADO DE BIOESTIMULANTES DEL REINO UNIDO, POR USUARIO FINAL, 2018-2033 (MILES DE USD)
TABLA 158 MERCADO DE BIOESTIMULANTES EN FRANCIA, POR ORIGEN, 2018-2033 (MILES DE USD)
TABLA 159 MERCADO DE BIOESTIMULANTES EN FRANCIA, POR ORIGEN, 2018-2033 (TONELADAS)
TABLA 160 FRANCIA BIOESTIMULANTES NATURALES EN EL MERCADO DE BIOESTIMULANTES, POR FORMA, 2018-2033 (MILES DE USD)
TABLA 161 MERCADO DE BIOESTIMULANTES LÍQUIDOS EN FRANCIA, POR TIPO, 2018-2033 (MILES DE USD)
TABLA 162 MERCADO DE BIOESTIMULANTES SECADOS EN FRANCIA, POR TIPO, 2018-2033 (MILES DE USD)
TABLA 163 BIOESTIMULANTES SINTÉTICOS EN FRANCIA EN EL MERCADO DE BIOESTIMULANTES, POR FORMA, 2018-2033 (MILES DE USD)
TABLA 164 MERCADO DE BIOESTIMULANTES LÍQUIDOS EN FRANCIA, POR TIPO, 2018-2033 (MILES DE USD)
TABLA 165 MERCADO DE BIOESTIMULANTES SECADOS EN FRANCIA, POR TIPO, 2018-2033 (MILES DE USD)
TABLA 166 MERCADO DE BIOESTIMULANTES EN FRANCIA, POR FORMA, 2018-2033 (MILES DE USD)
TABLA 167 MERCADO DE BIOESTIMULANTES LÍQUIDOS EN FRANCIA, POR TIPO, 2018-2033 (MILES DE USD)
TABLA 168 MERCADO DE BIOESTIMULANTES SECADOS EN FRANCIA, POR TIPO, 2018-2033 (MILES DE USD)
TABLA 169 MERCADO DE BIOESTIMULANTES EN FRANCIA, POR INGREDIENTES ACTIVOS, 2018-2033 (MILES DE USD)
TABLA 170 MERCADO DE BIOESTIMULANTES A BASE DE ÁCIDO EN FRANCIA, POR TIPO, 2018-2033 (MILES DE USD)
TABLA 171 MERCADO DE BIOESTIMULANTES BASADOS EN EXTRACTO DE FRANCIA, POR TIPO, 2018-2033 (MILES DE USD)
TABLA 172 MERCADO DE BIOESTIMULANTES EN FRANCIA, POR MÉTODO DE APLICACIÓN, 2018-2032 (MILES DE USD)
CUADRO 173 MERCADO DE BIOESTIMULANTES EN FRANCIA, POR CULTIVO, 2018-2033 (MILES DE USD)
TABLA 174 FRANCIA FRUTAS Y VERDURAS EN EL MERCADO DE BIOESTIMULANTES, POR FRUTAS, 2018-2033 (MILES DE USD)
TABLA 175 FRANCIA FRUTAS Y VERDURAS EN EL MERCADO DE BIOESTIMULANTES, POR VERDURA, 2018-2033 (MILES DE USD)
TABLA 176 CEREALES Y GRANOS EN EL MERCADO DE BIOESTIMULANTES DE FRANCIA, POR TIPO, 2018-2033 (MILES DE USD)
TABLA 177 SEMILLAS OLEAGINOSAS Y LEGUMBRES EN EL MERCADO DE BIOESTIMULANTES EN FRANCIA, POR TIPO, 2018-2033 (MILES DE USD)
TABLA 178 MERCADO DE BIOESTIMULANTES EN FRANCIA, POR USUARIO FINAL, 2018-2033 (MILES DE USD)
TABLA 179 MERCADO DE BIOESTIMULANTES DE ALEMANIA, POR ORIGEN, 2018-2033 (MILES DE USD)
TABLA 180 MERCADO DE BIOESTIMULANTES DE ALEMANIA, POR ORIGEN, 2018-2033 (TONELADAS)
TABLA 181 BIOESTIMULANTES NATURALES EN EL MERCADO DE BIOESTIMULANTES DE ALEMANIA, POR FORMA, 2018-2033 (MILES DE USD)
TABLA 182 MERCADO DE BIOESTIMULANTES LÍQUIDOS DE ALEMANIA, POR TIPO, 2018-2033 (MILES DE USD)
TABLA 183 MERCADO DE BIOESTIMULANTES SECO EN ALEMANIA, POR TIPO, 2018-2033 (MILES DE USD)
TABLA 184 BIOESTIMULANTES SINTÉTICOS EN EL MERCADO DE BIOESTIMULANTES DE ALEMANIA, POR FORMA, 2018-2033 (MILES DE USD)
TABLA 185 MERCADO DE BIOESTIMULANTES LÍQUIDOS DE ALEMANIA, POR TIPO, 2018-2033 (MILES DE USD)
TABLA 186 MERCADO DE BIOESTIMULANTES SECO EN ALEMANIA, POR TIPO, 2018-2033 (MILES DE USD)
TABLA 187 MERCADO DE BIOESTIMULANTES DE ALEMANIA, POR FORMA, 2018-2033 (MILES DE USD)
TABLA 188 MERCADO DE BIOESTIMULANTES LÍQUIDOS DE ALEMANIA, POR TIPO, 2018-2033 (MILES DE USD)
TABLA 189 MERCADO DE BIOESTIMULANTES SECO EN ALEMANIA, POR TIPO, 2018-2033 (MILES DE USD)
TABLA 190 MERCADO DE BIOESTIMULANTES DE ALEMANIA, POR INGREDIENTES ACTIVOS, 2018-2033 (MILES DE USD)
TABLA 191 MERCADO DE BIOESTIMULANTES A BASE DE ÁCIDO DE ALEMANIA, POR TIPO, 2018-2033 (MILES DE USD)
TABLA 192 MERCADO DE BIOESTIMULANTES BASADOS EN EXTRACTOS DE ALEMANIA, POR TIPO, 2018-2033 (MILES DE USD)
TABLA 193 MERCADO DE BIOESTIMULANTES DE ALEMANIA, POR MÉTODO DE APLICACIÓN, 2018-2032 (MILES DE USD)
TABLA 194 MERCADO DE BIOESTIMULANTES DE ALEMANIA, POR CULTIVO, 2018-2033 (MILES DE USD)
TABLA 195 FRUTAS Y VERDURAS EN EL MERCADO DE BIOESTIMULANTES DE ALEMANIA, POR FRUTAS, 2018-2033 (MILES DE USD)
TABLA 196 FRUTAS Y VERDURAS EN EL MERCADO DE BIOESTIMULANTES DE ALEMANIA, POR VERDURA, 2018-2033 (MILES DE USD)
TABLA 197 MERCADO DE CEREALES Y GRANOS BIOESTIMULANTES DE ALEMANIA, POR TIPO, 2018-2033 (MILES DE USD)
TABLA 198 SEMILLAS OLEAGINOSAS Y LEGUMBRES EN EL MERCADO DE BIOESTIMULANTES DE ALEMANIA, POR TIPO, 2018-2033 (MILES DE USD)
TABLA 199 MERCADO DE BIOESTIMULANTES DE ALEMANIA, POR USUARIO FINAL, 2018-2033 (MILES DE USD)
TABLA 200 MERCADO DE BIOESTIMULANTES DE LOS PAÍSES BAJOS, POR ORIGEN, 2018-2033 (MILES DE USD)
TABLA 201 MERCADO DE BIOESTIMULANTES DE LOS PAÍSES BAJOS, POR ORIGEN, 2018-2033 (TONELADAS)
TABLA 202 BIOESTIMULANTES NATURALES EN EL MERCADO DE BIOESTIMULANTES DE LOS PAÍSES BAJOS, POR FORMA, 2018-2033 (MILES DE USD)
TABLA 203 MERCADO DE BIOESTIMULANTES LÍQUIDOS DE LOS PAÍSES BAJOS, POR TIPO, 2018-2033 (MILES DE USD)
TABLA 204 MERCADO DE BIOESTIMULANTES SECOS EN PAÍSES BAJOS, POR TIPO, 2018-2033 (MILES DE USD)
TABLA 205 BIOESTIMULANTES SINTÉTICOS DE LOS PAÍSES BAJOS EN EL MERCADO DE BIOESTIMULANTES, POR FORMA, 2018-2033 (MILES DE USD)
TABLA 206 MERCADO DE BIOESTIMULANTES LÍQUIDOS DE LOS PAÍSES BAJOS, POR TIPO, 2018-2033 (MILES DE USD)
TABLA 207 MERCADO DE BIOESTIMULANTES SECOS EN PAÍSES BAJOS, POR TIPO, 2018-2033 (MILES DE USD)
TABLA 208 MERCADO DE BIOESTIMULANTES DE LOS PAÍSES BAJOS, POR FORMA, 2018-2033 (MILES DE USD)
TABLA 209 MERCADO DE BIOESTIMULANTES LÍQUIDOS DE LOS PAÍSES BAJOS, POR TIPO, 2018-2033 (MILES DE USD)
TABLA 210 MERCADO DE BIOESTIMULANTES SECOS EN PAÍSES BAJOS, POR TIPO, 2018-2033 (MILES DE USD)
TABLA 211 MERCADO DE BIOESTIMULANTES DE LOS PAÍSES BAJOS, POR INGREDIENTES ACTIVOS, 2018-2033 (MILES DE USD)
TABLA 212 MERCADO DE BIOESTIMULANTES A BASE DE ÁCIDO DE LOS PAÍSES BAJOS, POR TIPO, 2018-2033 (MILES DE USD)
TABLA 213 MERCADO DE BIOESTIMULANTES BASADOS EN EXTRACTOS DE LOS PAÍSES BAJOS, POR TIPO, 2018-2033 (MILES DE USD)
TABLA 214 MERCADO DE BIOESTIMULANTES DE LOS PAÍSES BAJOS, POR MÉTODO DE APLICACIÓN, 2018-2032 (MILES DE USD)
TABLA 215 MERCADO DE BIOESTIMULANTES DE LOS PAÍSES BAJOS, POR CULTIVO, 2018-2033 (MILES DE USD)
TABLA 216 MERCADO DE FRUTAS Y VERDURAS DE LOS PAÍSES BAJOS EN BIOESTIMULANTES, POR FRUTAS, 2018-2033 (MILES DE USD)
TABLA 217 MERCADO DE FRUTAS Y VERDURAS DE LOS PAÍSES BAJOS EN BIOESTIMULANTES, POR VERDURA, 2018-2033 (MILES DE USD)
TABLA 218 MERCADO DE CEREALES Y GRANOS BIOESTIMULANTES DE LOS PAÍSES BAJOS, POR TIPO, 2018-2033 (MILES DE USD)
TABLA 219 MERCADO DE SEMILLAS OLEAGINOSAS Y LEGUMBRES EN BIOESTIMULANTES DE LOS PAÍSES BAJOS, POR TIPO, 2018-2033 (MILES DE USD)
TABLA 220 MERCADO DE BIOESTIMULANTES DE LOS PAÍSES BAJOS, POR USUARIO FINAL, 2018-2033 (MILES DE USD)
TABLA 221 MERCADO DE BIOESTIMULANTES DE SUIZA, POR ORIGEN, 2018-2033 (MILES DE USD)
TABLA 222 MERCADO DE BIOESTIMULANTES DE SUIZA, POR ORIGEN, 2018-2033 (TONELADAS)
TABLA 223 SUIZA BIOESTIMULANTES NATURALES EN EL MERCADO DE BIOESTIMULANTES, POR FORMA, 2018-2033 (MILES DE USD)
TABLA 224 MERCADO SUIZO DE LÍQUIDOS EN BIOESTIMULANTES, POR TIPO, 2018-2033 (MILES DE USD)
TABLA 225 MERCADO DE BIOESTIMULANTES SECOS EN SUIZA, POR TIPO, 2018-2033 (MILES DE USD)
TABLA 226 BIOESTIMULANTES SINTÉTICOS DE SUIZA EN EL MERCADO DE BIOESTIMULANTES, POR FORMA, 2018-2033 (MILES DE USD)
TABLA 227 MERCADO SUIZO DE LÍQUIDOS EN BIOESTIMULANTES, POR TIPO, 2018-2033 (MILES DE USD)
TABLA 228 MERCADO DE BIOESTIMULANTES SECOS EN SUIZA, POR TIPO, 2018-2033 (MILES DE USD)
TABLA 229 MERCADO DE BIOESTIMULANTES DE SUIZA, POR FORMA, 2018-2033 (MILES DE USD)
TABLA 230 MERCADO SUIZO DE BIOESTIMULANTES LÍQUIDOS, POR TIPO, 2018-2033 (MILES DE USD)
TABLA 231 MERCADO DE BIOESTIMULANTES SECOS DE SUIZA, POR TIPO, 2018-2033 (MILES DE USD)
TABLA 232 MERCADO DE BIOESTIMULANTES DE SUIZA, POR INGREDIENTES ACTIVOS, 2018-2033 (MILES DE USD)
TABLA 233 MERCADO SUIZO DE BIOESTIMULANTES A BASE DE ÁCIDO, POR TIPO, 2018-2033 (MILES DE USD)
TABLA 234 MERCADO SUIZO DE BIOESTIMULANTES A BASE DE EXTRACTO, POR TIPO, 2018-2033 (MILES DE USD)
TABLA 235 MERCADO DE BIOESTIMULANTES DE SUIZA, POR MÉTODO DE APLICACIÓN, 2018-2032 (MILES DE USD)
TABLA 236 MERCADO DE BIOESTIMULANTES DE SUIZA, POR CULTIVO, 2018-2033 (MILES DE USD)
TABLA 237 SUIZA FRUTAS Y VERDURAS EN EL MERCADO DE BIOESTIMULANTES, POR FRUTAS, 2018-2033 (MILES DE USD)
TABLA 238 SUIZA FRUTAS Y VERDURAS EN EL MERCADO DE BIOESTIMULANTES, POR VERDURA, 2018-2033 (MILES DE USD)
TABLA 239 SUIZA CEREALES Y GRANOS EN EL MERCADO DE BIOESTIMULANTES, POR TIPO, 2018-2033 (MILES DE USD)
TABLA 240 SEMILLAS OLEAGINOSAS Y LEGUMBRES EN EL MERCADO DE BIOESTIMULANTES DE SUIZA, POR TIPO, 2018-2033 (MILES DE USD)
TABLA 241 MERCADO DE BIOESTIMULANTES DE SUIZA, POR USUARIO FINAL, 2018-2033 (MILES DE USD)
TABLA 242 MERCADO DE BIOESTIMULANTES DE RUSIA, POR ORIGEN, 2018-2033 (MILES DE USD)
TABLA 243 MERCADO DE BIOESTIMULANTES DE RUSIA, POR ORIGEN, 2018-2033 (TONELADAS)
TABLA 244 BIOESTIMULANTES NATURALES DE RUSIA EN EL MERCADO DE BIOESTIMULANTES, POR FORMA, 2018-2033 (MILES DE USD)
TABLA 245 MERCADO DE BIOESTIMULANTES LÍQUIDOS EN RUSIA, POR TIPO, 2018-2033 (MILES DE USD)
TABLA 246 RUSIA SECA EN EL MERCADO DE BIOESTIMULANTES, POR TIPO, 2018-2033 (MILES DE USD)
TABLA 247 BIOESTIMULANTES SINTÉTICOS DE RUSIA EN EL MERCADO DE BIOESTIMULANTES, POR FORMA, 2018-2033 (MILES DE USD)
TABLA 248 MERCADO DE BIOESTIMULANTES LÍQUIDOS EN RUSIA, POR TIPO, 2018-2033 (MILES DE USD)
TABLA 249 RUSIA SECA EN EL MERCADO DE BIOESTIMULANTES, POR TIPO, 2018-2033 (MILES DE USD)
TABLA 250 MERCADO DE BIOESTIMULANTES DE RUSIA, POR FORMA, 2018-2033 (MILES DE USD)
TABLA 251 MERCADO DE BIOESTIMULANTES LÍQUIDOS DE RUSIA, POR TIPO, 2018-2033 (MILES DE USD)
TABLA 252 RUSIA SECA EN EL MERCADO DE BIOESTIMULANTES, POR TIPO, 2018-2033 (MILES DE USD)
TABLA 253 MERCADO DE BIOESTIMULANTES EN RUSIA, POR INGREDIENTES ACTIVOS, 2018-2033 (MILES DE USD)
TABLA 254 MERCADO RUSO DE BIOESTIMULANTES A BASE DE ÁCIDO, POR TIPO, 2018-2033 (MILES DE USD)
TABLA 255 MERCADO DE BIOESTIMULANTES BASADOS EN EXTRACTO DE RUSIA, POR TIPO, 2018-2033 (MILES DE USD)
TABLA 256 MERCADO DE BIOESTIMULANTES DE RUSIA, POR MÉTODO DE APLICACIÓN, 2018-2032 (MILES DE USD)
TABLA 257 MERCADO DE BIOESTIMULANTES DE RUSIA, POR CULTIVO, 2018-2033 (MILES DE USD)
TABLA 258 FRUTAS Y VERDURAS DE RUSIA EN EL MERCADO DE BIOESTIMULANTES, POR FRUTAS, 2018-2033 (MILES DE USD)
TABLA 259 FRUTAS Y VERDURAS DE RUSIA EN EL MERCADO DE BIOESTIMULANTES, POR VERDURA, 2018-2033 (MILES DE USD)
TABLA 260 CEREALES Y GRANOS DE RUSIA EN EL MERCADO DE BIOESTIMULANTES, POR TIPO, 2018-2033 (MILES DE USD)
TABLA 261 SEMILLAS OLEAGINOSAS Y LEGUMBRES EN EL MERCADO DE BIOESTIMULANTES DE RUSIA, POR TIPO, 2018-2033 (MILES DE USD)
TABLA 262 MERCADO DE BIOESTIMULANTES DE RUSIA, POR USUARIO FINAL, 2018-2033 (MILES DE USD)
TABLA 263 MERCADO DE BIOESTIMULANTES DE BÉLGICA, POR ORIGEN, 2018-2033 (MILES DE USD)
TABLA 264 MERCADO DE BIOESTIMULANTES DE BÉLGICA, POR ORIGEN, 2018-2033 (TONELADAS)
TABLA 265 BIOESTIMULANTES NATURALES DE BÉLGICA EN EL MERCADO DE BIOESTIMULANTES, POR FORMA, 2018-2033 (MILES DE USD)
TABLA 266 MERCADO DE BIOESTIMULANTES LÍQUIDOS DE BÉLGICA, POR TIPO, 2018-2033 (MILES DE USD)
TABLA 267 MERCADO DE BIOESTIMULANTES SECOS DE BÉLGICA, POR TIPO, 2018-2033 (MILES DE USD)
TABLA 268 BIOESTIMULANTES SINTÉTICOS DE BÉLGICA EN EL MERCADO DE BIOESTIMULANTES, POR FORMA, 2018-2033 (MILES DE USD)
TABLA 269 MERCADO DE BIOESTIMULANTES LÍQUIDOS DE BÉLGICA, POR TIPO, 2018-2033 (MILES DE USD)
TABLA 270 MERCADO DE BIOESTIMULANTES SECOS DE BÉLGICA, POR TIPO, 2018-2033 (MILES DE USD)
TABLA 271 MERCADO DE BIOESTIMULANTES DE BÉLGICA, POR FORMA, 2018-2033 (MILES DE USD)
TABLA 272 MERCADO DE BIOESTIMULANTES LÍQUIDOS DE BÉLGICA, POR TIPO, 2018-2033 (MILES DE USD)
TABLA 273 MERCADO DE BIOESTIMULANTES SECOS DE BÉLGICA, POR TIPO, 2018-2033 (MILES DE USD)
TABLA 274 MERCADO DE BIOESTIMULANTES DE BÉLGICA, POR INGREDIENTES ACTIVOS, 2018-2033 (MILES DE USD)
TABLA 275 MERCADO BÉLGICO DE BIOESTIMULANTES A BASE DE ÁCIDO, POR TIPO, 2018-2033 (MILES DE USD)
TABLA 276 MERCADO DE BIOESTIMULANTES BASADOS EN EXTRACTO DE BÉLGICA, POR TIPO, 2018-2033 (MILES DE USD)
TABLA 277 MERCADO DE BIOESTIMULANTES DE BÉLGICA, POR MÉTODO DE APLICACIÓN, 2018-2032 (MILES DE USD)
TABLA 278 MERCADO DE BIOESTIMULANTES DE BÉLGICA, POR CULTIVO, 2018-2033 (MILES DE USD)
TABLA 279 FRUTAS Y VERDURAS DE BÉLGICA EN EL MERCADO DE BIOESTIMULANTES, POR FRUTAS, 2018-2033 (MILES DE USD)
TABLA 280 FRUTAS Y VERDURAS DE BÉLGICA EN EL MERCADO DE BIOESTIMULANTES, POR VERDURA, 2018-2033 (MILES DE USD)
TABLA 281 MERCADO DE CEREALES Y GRANOS BIOESTIMULANTES DE BÉLGICA, POR TIPO, 2018-2033 (MILES DE USD)
TABLA 282 SEMILLAS OLEAGINOSAS Y LEGUMBRES EN EL MERCADO DE BIOESTIMULANTES DE BÉLGICA, POR TIPO, 2018-2033 (MILES DE USD)
TABLA 283 MERCADO DE BIOESTIMULANTES DE BÉLGICA, POR USUARIO FINAL, 2018-2033 (MILES DE USD)
TABLA 284 MERCADO DE BIOESTIMULANTES PARA PAVO, POR ORIGEN, 2018-2033 (MILES DE USD)
TABLA 285 MERCADO DE BIOESTIMULANTES PARA PAVO, POR ORIGEN, 2018-2033 (TONELADAS)
TABLA 286 BIOESTIMULANTES NATURALES DE PAVO EN EL MERCADO DE BIOESTIMULANTES, POR FORMA, 2018-2033 (MILES DE USD)
TABLA 287 MERCADO DE BIOESTIMULANTES LÍQUIDOS DE PAVO, POR TIPO, 2018-2033 (MILES DE USD)
TABLA 288 PAVO SECO EN EL MERCADO DE BIOESTIMULANTES, POR TIPO, 2018-2033 (MILES DE USD)
TABLA 289 BIOESTIMULANTES SINTÉTICOS DE PAVO EN EL MERCADO DE BIOESTIMULANTES, POR FORMA, 2018-2033 (MILES DE USD)
TABLA 290 MERCADO DE BIOESTIMULANTES LÍQUIDOS DE PAVO, POR TIPO, 2018-2033 (MILES DE USD)
TABLA 291 PAVO SECO EN EL MERCADO DE BIOESTIMULANTES, POR TIPO, 2018-2033 (MILES DE USD)
TABLA 292 MERCADO DE BIOESTIMULANTES PARA PAVOS, POR FORMA, 2018-2033 (MILES DE USD)
TABLA 293 MERCADO DE BIOESTIMULANTES LÍQUIDOS DE PAVO, POR TIPO, 2018-2033 (MILES DE USD)
TABLA 294 PAVO SECO EN EL MERCADO DE BIOESTIMULANTES, POR TIPO, 2018-2033 (MILES DE USD)
TABLA 295 MERCADO DE BIOESTIMULANTES PARA PAVOS, POR INGREDIENTES ACTIVOS, 2018-2033 (MILES DE USD)
TABLA 296 MERCADO DE BIOESTIMULANTES A BASE DE ÁCIDO DE TURQUÍA, POR TIPO, 2018-2033 (MILES DE USD)
TABLA 297 MERCADO DE BIOESTIMULANTES A BASE DE EXTRACTO DE PAVO, POR TIPO, 2018-2033 (MILES DE USD)
TABLA 298 MERCADO DE BIOESTIMULANTES PARA TURQUÍA, POR MÉTODO DE APLICACIÓN, 2018-2032 (MILES DE USD)
CUADRO 299 MERCADO DE BIOESTIMULANTES PARA PAVO, POR CULTIVO, 2018-2033 (MILES DE USD)
TABLA 300 FRUTAS Y VERDURAS DE PAVO EN EL MERCADO DE BIOESTIMULANTES, POR FRUTAS, 2018-2033 (MILES DE USD)
TABLA 301 FRUTAS Y VERDURAS DE PAVO EN EL MERCADO DE BIOESTIMULANTES, POR VERDURA, 2018-2033 (MILES DE USD)
TABLA 302 CEREALES Y GRANOS DE PAVO EN EL MERCADO DE BIOESTIMULANTES, POR TIPO, 2018-2033 (MILES DE USD)
TABLA 303 SEMILLAS OLEAGINOSAS Y LEGUMBRES DE PAVO EN EL MERCADO DE BIOESTIMULANTES, POR TIPO, 2018-2033 (MILES DE USD)
TABLA 304 MERCADO DE BIOESTIMULANTES PARA TURQUÍA, POR USUARIO FINAL, 2018-2033 (MILES DE USD)
TABLA 305 MERCADO DE BIOESTIMULANTES DE POLONIA, POR ORIGEN, 2018-2033 (MILES DE USD)
TABLA 306 MERCADO DE BIOESTIMULANTES DE POLONIA, POR ORIGEN, 2018-2033 (TONELADAS)
TABLA 307 BIOESTIMULANTES NATURALES EN EL MERCADO DE BIOESTIMULANTES DE POLONIA, POR FORMA, 2018-2033 (MILES DE USD)
TABLA 308 MERCADO DE BIOESTIMULANTES LÍQUIDOS DE POLONIA, POR TIPO, 2018-2033 (MILES DE USD)
TABLA 309 MERCADO DE BIOESTIMULANTES SECOS DE POLONIA, POR TIPO, 2018-2033 (MILES DE USD)
TABLA 310 BIOESTIMULANTES SINTÉTICOS DE POLONIA EN EL MERCADO DE BIOESTIMULANTES, POR FORMA, 2018-2033 (MILES DE USD)
TABLA 311 MERCADO DE BIOESTIMULANTES LÍQUIDOS DE POLONIA, POR TIPO, 2018-2033 (MILES DE USD)
TABLA 312 MERCADO DE BIOESTIMULANTES SECOS DE POLONIA, POR TIPO, 2018-2033 (MILES DE USD)
TABLA 313 MERCADO DE BIOESTIMULANTES DE POLONIA, POR FORMA, 2018-2033 (MILES DE USD)
TABLA 314 MERCADO DE BIOESTIMULANTES LÍQUIDOS DE POLONIA, POR TIPO, 2018-2033 (MILES DE USD)
TABLA 315 MERCADO DE BIOESTIMULANTES SECOS DE POLONIA, POR TIPO, 2018-2033 (MILES DE USD)
TABLA 316 MERCADO DE BIOESTIMULANTES DE POLONIA, POR INGREDIENTES ACTIVOS, 2018-2033 (MILES DE USD)
TABLA 317 MERCADO DE BIOESTIMULANTES A BASE DE ÁCIDO DE POLONIA, POR TIPO, 2018-2033 (MILES DE USD)
TABLA 318 MERCADO DE BIOESTIMULANTES BASADOS EN EXTRACTO DE POLONIA, POR TIPO, 2018-2033 (MILES DE USD)
TABLA 319 MERCADO DE BIOESTIMULANTES DE POLONIA, POR MÉTODO DE APLICACIÓN, 2018-2032 (MILES DE USD)
TABLA 320 MERCADO DE BIOESTIMULANTES DE POLONIA, POR CULTIVO, 2018-2033 (MILES DE USD)
TABLA 321 POLONIA FRUTAS Y VERDURAS EN EL MERCADO DE BIOESTIMULANTES, POR FRUTAS, 2018-2033 (MILES DE USD)
TABLA 322 POLONIA FRUTAS Y VERDURAS EN EL MERCADO DE BIOESTIMULANTES, POR VERDURA, 2018-2033 (MILES DE USD)
TABLA 323 MERCADO DE CEREALES Y GRANOS DE POLONIA EN BIOESTIMULANTES, POR TIPO, 2018-2033 (MILES DE USD)
TABLA 324 SEMILLAS OLEAGINOSAS Y LEGUMBRES EN EL MERCADO DE BIOESTIMULANTES DE POLONIA, POR TIPO, 2018-2033 (MILES DE USD)
TABLA 325 MERCADO DE BIOESTIMULANTES DE POLONIA, POR USUARIO FINAL, 2018-2033 (MILES DE USD)
TABLA 326 MERCADO DE BIOESTIMULANTES DE DINAMARCA, POR ORIGEN, 2018-2033 (MILES DE USD)
TABLA 327 MERCADO DE BIOESTIMULANTES DE DINAMARCA, POR ORIGEN, 2018-2033 (TONELADAS)
TABLA 328 BIOESTIMULANTES NATURALES DE DINAMARCA EN EL MERCADO DE BIOESTIMULANTES, POR FORMA, 2018-2033 (MILES DE USD)
TABLA 329 MERCADO DINAMARCA DE BIOESTIMULANTES LÍQUIDOS, POR TIPO, 2018-2033 (MILES DE USD)
TABLA 330 MERCADO DE BIOESTIMULANTES SECOS DE DINAMARCA, POR TIPO, 2018-2033 (MILES DE USD)
TABLA 331 BIOESTIMULANTES SINTÉTICOS DE DINAMARCA EN EL MERCADO DE BIOESTIMULANTES, POR FORMA, 2018-2033 (MILES DE USD)
TABLA 332 MERCADO DINAMARCA DE BIOESTIMULANTES LÍQUIDOS, POR TIPO, 2018-2033 (MILES DE USD)
TABLA 333 MERCADO DE BIOESTIMULANTES SECOS DE DINAMARCA, POR TIPO, 2018-2033 (MILES DE USD)
TABLA 334 MERCADO DE BIOESTIMULANTES DE DINAMARCA, POR FORMA, 2018-2033 (MILES DE USD)
TABLA 335 MERCADO DINAMARCA DE BIOESTIMULANTES LÍQUIDOS, POR TIPO, 2018-2033 (MILES DE USD)
TABLA 336 MERCADO DE BIOESTIMULANTES SECOS DE DINAMARCA, POR TIPO, 2018-2033 (MILES DE USD)
TABLA 337 MERCADO DE BIOESTIMULANTES DE DINAMARCA, POR INGREDIENTES ACTIVOS, 2018-2033 (MILES DE USD)
TABLA 338 MERCADO DINAMARCA DE BIOESTIMULANTES A BASE DE ÁCIDO, POR TIPO, 2018-2033 (MILES DE USD)
TABLA 339 MERCADO DE BIOESTIMULANTES BASADOS EN EXTRACTOS DE DINAMARCA, POR TIPO, 2018-2033 (MILES DE USD)
TABLA 340 MERCADO DE BIOESTIMULANTES DE DINAMARCA, POR MÉTODO DE APLICACIÓN, 2018-2032 (MILES DE USD)
TABLA 341 MERCADO DE BIOESTIMULANTES DE DINAMARCA, POR CULTIVO, 2018-2033 (MILES DE USD)
TABLA 342 DINAMARCA FRUTAS Y VERDURAS EN EL MERCADO DE BIOESTIMULANTES, POR FRUTAS, 2018-2033 (MILES DE USD)
TABLA 343 DINAMARCA FRUTAS Y VERDURAS EN EL MERCADO DE BIOESTIMULANTES, POR VERDURA, 2018-2033 (MILES DE USD)
TABLA 344 DINAMARCA CEREALES Y GRANOS EN EL MERCADO DE BIOESTIMULANTES, POR TIPO, 2018-2033 (MILES DE USD)
TABLA 345 DINAMARCA SEMILLAS OLEAGINOSAS Y LEGUMBRES EN EL MERCADO DE BIOESTIMULANTES, POR TIPO, 2018-2033 (MILES DE USD)
TABLA 346 MERCADO DE BIOESTIMULANTES DE DINAMARCA, POR USUARIO FINAL, 2018-2033 (MILES DE USD)
TABLA 347 MERCADO DE BIOESTIMULANTES DE SUECIA, POR ORIGEN, 2018-2033 (MILES DE USD)
TABLA 348 MERCADO DE BIOESTIMULANTES DE SUECIA, POR ORIGEN, 2018-2033 (TONELADAS)
TABLA 349 SUECIA BIOESTIMULANTES NATURALES EN EL MERCADO DE BIOESTIMULANTES, POR FORMA, 2018-2033 (MILES DE USD)
TABLA 350 MERCADO SUECIO DE BIOESTIMULANTES LÍQUIDOS, POR TIPO, 2018-2033 (MILES DE USD)
TABLA 351 SUECIA SECA EN EL MERCADO DE BIOESTIMULANTES, POR TIPO, 2018-2033 (MILES DE USD)
TABLA 352 SUECIA BIOESTIMULANTES SINTÉTICOS EN EL MERCADO DE BIOESTIMULANTES, POR FORMA, 2018-2033 (MILES DE USD)
TABLA 353 MERCADO SUECIO DE BIOESTIMULANTES LÍQUIDOS, POR TIPO, 2018-2033 (MILES DE USD)
TABLA 354 SUECIA MERCADO DE BIOESTIMULANTES SECOS, POR TIPO, 2018-2033 (MILES DE USD)
TABLA 355 MERCADO DE BIOESTIMULANTES DE SUECIA, POR FORMA, 2018-2033 (MILES DE USD)
TABLA 356 MERCADO SUECIO DE BIOESTIMULANTES LÍQUIDOS, POR TIPO, 2018-2033 (MILES DE USD)
TABLA 357 SUECIA MERCADO DE BIOESTIMULANTES SECOS, POR TIPO, 2018-2033 (MILES DE USD)
TABLA 358 MERCADO DE BIOESTIMULANTES DE SUECIA, POR INGREDIENTES ACTIVOS, 2018-2033 (MILES DE USD)
TABLA 359 MERCADO SUECIO DE BIOESTIMULANTES A BASE DE ÁCIDO, POR TIPO, 2018-2033 (MILES DE USD)
TABLA 360 MERCADO DE BIOESTIMULANTES BASADOS EN EXTRACTO DE SUECIA, POR TIPO, 2018-2033 (MILES DE USD)
TABLA 361 MERCADO DE BIOESTIMULANTES DE SUECIA, POR MÉTODO DE APLICACIÓN, 2018-2032 (MILES DE USD)
TABLA 362 MERCADO DE BIOESTIMULANTES DE SUECIA, POR CULTIVO, 2018-2033 (MILES DE USD)
TABLA 363 SUECIA FRUTAS Y VERDURAS EN EL MERCADO DE BIOESTIMULANTES, POR FRUTAS, 2018-2033 (MILES DE USD)
TABLA 364 SUECIA FRUTAS Y VERDURAS EN EL MERCADO DE BIOESTIMULANTES, POR VERDURA, 2018-2033 (MILES DE USD)
TABLA 365 SUECIA CEREALES Y GRANOS EN EL MERCADO DE BIOESTIMULANTES, POR TIPO, 2018-2033 (MILES DE USD)
TABLA 366 SUECIA SEMILLAS OLEAGINOSAS Y LEGUMBRES EN EL MERCADO DE BIOESTIMULANTES, POR TIPO, 2018-2033 (MILES DE USD)
TABLA 367 MERCADO DE BIOESTIMULANTES DE SUECIA, POR USUARIO FINAL, 2018-2033 (MILES DE USD)
TABLA 368 MERCADO DE BIOESTIMULANTES DE NORUEGA, POR ORIGEN, 2018-2033 (MILES DE USD)
TABLA 369 MERCADO DE BIOESTIMULANTES DE NORUEGA, POR ORIGEN, 2018-2033 (TONELADAS)
TABLA 370 BIOESTIMULANTES NATURALES DE NORUEGA EN EL MERCADO DE BIOESTIMULANTES, POR FORMA, 2018-2033 (MILES DE USD)
TABLA 371 MERCADO NORUEGO DE BIOESTIMULANTES LÍQUIDOS, POR TIPO, 2018-2033 (MILES DE USD)
TABLA 372 MERCADO DE BIOESTIMULANTES SECOS DE NORUEGA, POR TIPO, 2018-2033 (MILES DE USD)
TABLA 373 BIOESTIMULANTES SINTÉTICOS DE NORUEGA EN EL MERCADO DE BIOESTIMULANTES, POR FORMA, 2018-2033 (MILES DE USD)
TABLA 374 MERCADO NORUEGO DE BIOESTIMULANTES LÍQUIDOS, POR TIPO, 2018-2033 (MILES DE USD)
TABLA 375 MERCADO DE BIOESTIMULANTES SECOS DE NORUEGA, POR TIPO, 2018-2033 (MILES DE USD)
TABLA 376 MERCADO DE BIOESTIMULANTES DE NORUEGA, POR FORMA, 2018-2033 (MILES DE USD)
TABLA 377 MERCADO NORUEGO DE BIOESTIMULANTES LÍQUIDOS, POR TIPO, 2018-2033 (MILES DE USD)
TABLA 378 MERCADO DE BIOESTIMULANTES SECOS DE NORUEGA, POR TIPO, 2018-2033 (MILES DE USD)
TABLA 379 MERCADO DE BIOESTIMULANTES DE NORUEGA, POR INGREDIENTES ACTIVOS, 2018-2033 (MILES DE USD)
TABLA 380 MERCADO NORUEGO DE BIOESTIMULANTES A BASE DE ÁCIDO, POR TIPO, 2018-2033 (MILES DE USD)
TABLA 381 MERCADO DE BIOESTIMULANTES BASADOS EN EXTRACTO DE NORUEGA, POR TIPO, 2018-2033 (MILES DE USD)
TABLA 382 MERCADO DE BIOESTIMULANTES DE NORUEGA, POR MÉTODO DE APLICACIÓN, 2018-2032 (MILES DE USD)
TABLA 383 MERCADO DE BIOESTIMULANTES DE NORUEGA, POR CULTIVO, 2018-2033 (MILES DE USD)
TABLA 384 FRUTAS Y VERDURAS DE NORUEGA EN EL MERCADO DE BIOESTIMULANTES, POR FRUTAS, 2018-2033 (MILES DE USD)
TABLA 385 FRUTAS Y VERDURAS DE NORUEGA EN EL MERCADO DE BIOESTIMULANTES, POR VERDURA, 2018-2033 (MILES DE USD)
TABLA 386 MERCADO DE CEREALES Y GRANOS DE NORUEGA EN BIOESTIMULANTES, POR TIPO, 2018-2033 (MILES DE USD)
TABLA 387 MERCADO DE SEMILLAS OLEAGINOSAS Y LEGUMBRES EN BIOESTIMULANTES DE NORUEGA, POR TIPO, 2018-2033 (MILES DE USD)
TABLA 388 MERCADO DE BIOESTIMULANTES DE NORUEGA, POR USUARIO FINAL, 2018-2033 (MILES DE USD)
TABLA 389 RESTO DE EUROPA MERCADO DE BIOESTIMULANTES, POR ORIGEN, 2018-2033 (MILES DE USD)
TABLA 390 RESTO DE EUROPA MERCADO DE BIOESTIMULANTES, POR ORIGEN, 2018-2033 (TONELADAS)
TABLA 391 RESTO DE EUROPA BIOESTIMULANTES NATURALES EN EL MERCADO DE BIOESTIMULANTES, POR FORMA, 2018-2033 (MILES DE USD)
TABLA 392 RESTO DE EUROPA MERCADO DE LÍQUIDOS EN BIOESTIMULANTES, POR TIPO, 2018-2033 (MILES DE USD)
TABLA 393 RESTO DE EUROPA SECO EN EL MERCADO DE BIOESTIMULANTES, POR TIPO, 2018-2033 (MILES DE USD)
TABLA 394 RESTO DE EUROPA BIOESTIMULANTES SINTÉTICOS EN EL MERCADO DE BIOESTIMULANTES, POR FORMA, 2018-2033 (MILES DE USD)
TABLA 395 RESTO DE EUROPA MERCADO DE LÍQUIDOS EN BIOESTIMULANTES, POR TIPO, 2018-2033 (MILES DE USD)
TABLA 396 RESTO DE EUROPA SECO EN EL MERCADO DE BIOESTIMULANTES, POR TIPO, 2018-2033 (MILES DE USD)
TABLA 397 RESTO DE EUROPA MERCADO DE BIOESTIMULANTES, POR FORMA, 2018-2033 (MILES DE USD)
TABLA 398 RESTO DE EUROPA MERCADO DE LÍQUIDOS EN BIOESTIMULANTES, POR TIPO, 2018-2033 (MILES DE USD)
TABLA 399 RESTO DE EUROPA SECO EN EL MERCADO DE BIOESTIMULANTES, POR TIPO, 2018-2033 (MILES DE USD)
TABLA 400 RESTO DE EUROPA MERCADO DE BIOESTIMULANTES, POR INGREDIENTES ACTIVOS, 2018-2033 (MILES DE USD)
TABLA 401 RESTO DE EUROPA MERCADO DE BIOESTIMULANTES A BASE DE ÁCIDO, POR TIPO, 2018-2033 (MILES DE USD)
TABLA 402 RESTO DE EUROPA EXTRACTOS BASADOS EN BIOESTIMULANTES MERCADO, POR TIPO, 2018-2033 (MILES DE USD)
TABLA 403 RESTO DE EUROPA MERCADO DE BIOESTIMULANTES, POR MÉTODO DE APLICACIÓN, 2018-2032 (MILES DE USD)
TABLA 404 RESTO DE EUROPA MERCADO DE BIOESTIMULANTES, POR CULTIVO, 2018-2033 (MILES DE USD)
TABLA 405 RESTO DE EUROPA FRUTAS Y VERDURAS EN EL MERCADO DE BIOESTIMULANTES, POR FRUTAS, 2018-2033 (MILES DE USD)
TABLA 406 RESTO DE EUROPA FRUTAS Y VERDURAS EN EL MERCADO DE BIOESTIMULANTES, POR VERDURA, 2018-2033 (MILES DE USD)
TABLA 407 RESTO DE EUROPA CEREALES Y GRANOS EN EL MERCADO DE BIOESTIMULANTES, POR TIPO, 2018-2033 (MILES DE USD)
TABLA 408 RESTO DE EUROPA SEMILLAS OLEAGINOSAS Y LEGUMBRES EN EL MERCADO DE BIOESTIMULANTES, POR TIPO, 2018-2033 (MILES DE USD)
TABLA 409 RESTO DE EUROPA MERCADO DE BIOESTIMULANTES, POR USUARIO FINAL, 2018-2033 (MILES DE USD)
TABLA 410 MERCADO DE BIOESTIMULANTES DE AMÉRICA DEL NORTE, POR PAÍS, 2018-2033 (MILES DE USD)
TABLA 411 MERCADO DE BIOESTIMULANTES DE AMÉRICA DEL NORTE, POR PAÍS, 2018-2033 (MILES DE USD)
TABLA 412 MERCADO DE BIOESTIMULANTES DE AMÉRICA DEL NORTE, POR PAÍS, 2018-2033 (TONELADAS)
TABLA 413 AMÉRICA DEL NORTE
TABLA 414 MERCADO DE BIOESTIMULANTES DE AMÉRICA DEL NORTE, POR ORIGEN, 2018-2033 (MILES DE USD)
TABLA 415 MERCADO DE BIOESTIMULANTES DE AMÉRICA DEL NORTE, POR ORIGEN, 2018-2033 (TONELADAS)
TABLA 416 BIOESTIMULANTES NATURALES EN EL MERCADO DE BIOESTIMULANTES DE AMÉRICA DEL NORTE, POR FORMA, 2018-2033 (MILES DE USD)
TABLA 417 MERCADO DE BIOESTIMULANTES LÍQUIDOS DE AMÉRICA DEL NORTE, POR TIPO, 2018-2033 (MILES DE USD)
TABLA 418 MERCADO DE BIOESTIMULANTES SECO EN AMÉRICA DEL NORTE, POR TIPO, 2018-2033 (MILES DE USD)
TABLA 419 BIOESTIMULANTES SINTÉTICOS EN EL MERCADO DE BIOESTIMULANTES DE AMÉRICA DEL NORTE, POR FORMA, 2018-2033 (MILES DE USD)
TABLA 420 MERCADO DE BIOESTIMULANTES LÍQUIDOS DE AMÉRICA DEL NORTE, POR TIPO, 2018-2033 (MILES DE USD)
TABLA 421 MERCADO DE BIOESTIMULANTES SECO EN AMÉRICA DEL NORTE, POR TIPO, 2018-2033 (MILES DE USD)
TABLA 422 MERCADO DE BIOESTIMULANTES DE AMÉRICA DEL NORTE, POR FORMA, 2018-2033 (MILES DE USD)
TABLA 423 MERCADO DE BIOESTIMULANTES LÍQUIDOS DE AMÉRICA DEL NORTE, POR TIPO, 2018-2033 (MILES DE USD)
TABLA 424 MERCADO DE BIOESTIMULANTES SECO EN AMÉRICA DEL NORTE, POR TIPO, 2018-2033 (MILES DE USD)
TABLA 425 MERCADO DE BIOESTIMULANTES DE AMÉRICA DEL NORTE, POR INGREDIENTES ACTIVOS, 2018-2033 (MILES DE USD)
TABLA 426 MERCADO DE BIOESTIMULANTES A BASE DE ÁCIDO DE AMÉRICA DEL NORTE, POR TIPO, 2018-2033 (MILES DE USD)
TABLA 427 MERCADO DE BIOESTIMULANTES BASADOS EN EXTRACTOS DE AMÉRICA DEL NORTE, POR TIPO, 2018-2033 (MILES DE USD)
TABLA 428 MERCADO DE BIOESTIMULANTES DE AMÉRICA DEL NORTE, POR MÉTODO DE APLICACIÓN, 2018-2032 (MILES DE USD)
TABLA 429 MERCADO DE BIOESTIMULANTES DE AMÉRICA DEL NORTE, POR CULTIVO, 2018-2033 (MILES DE USD)
TABLA 430 FRUTAS Y VERDURAS EN EL MERCADO DE BIOESTIMULANTES DE AMÉRICA DEL NORTE, POR FRUTAS, 2018-2033 (MILES DE USD)
TABLA 431 FRUTAS Y VERDURAS EN EL MERCADO DE BIOESTIMULANTES DE AMÉRICA DEL NORTE, POR VERDURA, 2018-2033 (MILES DE USD)
TABLA 432 MERCADO DE CEREALES Y GRANOS BIOESTIMULANTES DE AMÉRICA DEL NORTE, POR TIPO, 2018-2033 (MILES DE USD)
TABLA 433 MERCADO DE SEMILLAS OLEAGINOSAS Y LEGUMBRES EN BIOESTIMULANTES DE AMÉRICA DEL NORTE, POR TIPO, 2018-2033 (MILES DE USD)
TABLA 434 MERCADO DE BIOESTIMULANTES DE AMÉRICA DEL NORTE, POR USUARIO FINAL, 2018-2033 (MILES DE USD)
TABLA 435 MERCADO DE BIOESTIMULANTES DE EE. UU., POR ORIGEN, 2018-2033 (MILES DE USD)
TABLA 436 MERCADO DE BIOESTIMULANTES DE EE. UU., POR ORIGEN, 2018-2033 (TONELADAS)
TABLA 437 BIOESTIMULANTES NATURALES DE EE. UU. EN EL MERCADO DE BIOESTIMULANTES, POR FORMA, 2018-2033 (MILES DE USD)
TABLA 438 MERCADO ESTADOUNIDENSE DE BIOESTIMULANTES LÍQUIDOS, POR TIPO, 2018-2033 (MILES DE USD)
TABLA 439 MERCADO DE BIOESTIMULANTES SECOS DE EE. UU., POR TIPO, 2018-2033 (MILES DE USD)
TABLA 440 BIOESTIMULANTES SINTÉTICOS DE EE. UU. EN EL MERCADO DE BIOESTIMULANTES, POR FORMA, 2018-2033 (MILES DE USD)
TABLA 441 MERCADO ESTADOUNIDENSE DE BIOESTIMULANTES LÍQUIDOS, POR TIPO, 2018-2033 (MILES DE USD)
TABLA 442 MERCADO DE BIOESTIMULANTES SECOS DE EE. UU., POR TIPO, 2018-2033 (MILES DE USD)
TABLA 443 MERCADO ESTADOUNIDENSE DE BIOESTIMULANTES, POR FORMA, 2018-2033 (MILES DE USD)
TABLA 444 MERCADO ESTADOUNIDENSE DE BIOESTIMULANTES LÍQUIDOS, POR TIPO, 2018-2033 (MILES DE USD)
TABLA 445 MERCADO DE BIOESTIMULANTES SECOS DE EE. UU., POR TIPO, 2018-2033 (MILES DE USD)
TABLA 446 MERCADO ESTADOUNIDENSE DE BIOESTIMULANTES, POR INGREDIENTES ACTIVOS, 2018-2033 (MILES DE USD)
TABLA 447 MERCADO ESTADOUNIDENSE DE BIOESTIMULANTES A BASE DE ÁCIDO, POR TIPO, 2018-2033 (MILES DE USD)
TABLA 448 MERCADO ESTADOUNIDENSE DE BIOESTIMULANTES BASADOS EN EXTRACTO, POR TIPO, 2018-2033 (MILES DE USD)
TABLA 449 MERCADO ESTADOUNIDENSE DE BIOESTIMULANTES, POR MÉTODO DE APLICACIÓN, 2018-2032 (MILES DE USD)
TABLA 450 MERCADO DE BIOESTIMULANTES DE EE. UU., POR CULTIVO, 2018-2033 (MILES DE USD)
TABLA 451 FRUTAS Y VERDURAS DE EE. UU. EN EL MERCADO DE BIOESTIMULANTES, POR FRUTAS, 2018-2033 (MILES DE USD)
TABLA 452 FRUTAS Y VERDURAS DE EE. UU. EN EL MERCADO DE BIOESTIMULANTES, POR VERDURA, 2018-2033 (MILES DE USD)
TABLA 453 MERCADO DE CEREALES Y GRANOS BIOESTIMULANTES DE EE. UU., POR TIPO, 2018-2033 (MILES DE USD)
TABLA 454 MERCADO DE SEMILLAS OLEAGINOSAS Y LEGUMBRES EN BIOESTIMULANTES DE EE. UU., POR TIPO, 2018-2033 (MILES DE USD)
TABLA 455 MERCADO DE BIOESTIMULANTES DE EE. UU., POR USUARIO FINAL, 2018-2033 (MILES DE USD)
TABLA 456 MERCADO DE BIOESTIMULANTES DE CANADÁ, POR ORIGEN, 2018-2033 (MILES DE USD)
TABLA 457 MERCADO DE BIOESTIMULANTES DE CANADÁ, POR ORIGEN, 2018-2033 (TONELADAS)
TABLA 458 BIOESTIMULANTES NATURALES EN EL MERCADO DE BIOESTIMULANTES DE CANADÁ, POR FORMA, 2018-2033 (MILES DE USD)
TABLA 459 MERCADO CANADIENSE DE BIOESTIMULANTES LÍQUIDOS, POR TIPO, 2018-2033 (MILES DE USD)
TABLA 460 MERCADO DE BIOESTIMULANTES CANADA DRY, POR TIPO, 2018-2033 (MILES DE USD)
TABLA 461 BIOESTIMULANTES SINTÉTICOS EN EL MERCADO DE BIOESTIMULANTES DE CANADÁ, POR FORMA, 2018-2033 (MILES DE USD)
TABLA 462 MERCADO CANADIENSE DE BIOESTIMULANTES LÍQUIDOS, POR TIPO, 2018-2033 (MILES DE USD)
TABLA 463 MERCADO DE BIOESTIMULANTES CANADA DRY, POR TIPO, 2018-2033 (MILES DE USD)
TABLA 464 MERCADO DE BIOESTIMULANTES DE CANADÁ, POR FORMA, 2018-2033 (MILES DE USD)
TABLA 465 MERCADO CANADIENSE DE BIOESTIMULANTES LÍQUIDOS, POR TIPO, 2018-2033 (MILES DE USD)
TABLA 466 MERCADO DE BIOESTIMULANTES CANADA DRY, POR TIPO, 2018-2033 (MILES DE USD)
TABLA 467 MERCADO DE BIOESTIMULANTES DE CANADÁ, POR INGREDIENTES ACTIVOS, 2018-2033 (MILES DE USD)
TABLA 468 MERCADO DE BIOESTIMULANTES A BASE DE ÁCIDO DE CANADÁ, POR TIPO, 2018-2033 (MILES DE USD)
TABLA 469 MERCADO DE BIOESTIMULANTES BASADOS EN EXTRACTO DE CANADÁ, POR TIPO, 2018-2033 (MILES DE USD)
TABLA 470 MERCADO DE BIOESTIMULANTES DE CANADÁ, POR MÉTODO DE APLICACIÓN, 2018-2032 (MILES DE USD)
TABLA 471 MERCADO DE BIOESTIMULANTES DE CANADÁ, POR CULTIVO, 2018-2033 (MILES DE USD)
TABLA 472 MERCADO DE FRUTAS Y VERDURAS DE CANADÁ EN BIOESTIMULANTES, POR FRUTAS, 2018-2033 (MILES DE USD)
TABLA 473 MERCADO DE FRUTAS Y VERDURAS DE CANADÁ EN BIOESTIMULANTES, POR VERDURA, 2018-2033 (MILES DE USD)
TABLA 474 MERCADO DE CEREALES Y GRANOS BIOESTIMULANTES DE CANADÁ, POR TIPO, 2018-2033 (MILES DE USD)
TABLA 475 MERCADO DE SEMILLAS OLEAGINOSAS Y LEGUMBRES EN BIOESTIMULANTES DE CANADÁ, POR TIPO, 2018-2033 (MILES DE USD)
TABLA 476 MERCADO DE BIOESTIMULANTES DE CANADÁ, POR USUARIO FINAL, 2018-2033 (MILES DE USD)
TABLA 477 MERCADO DE BIOESTIMULANTES EN MÉXICO, POR ORIGEN, 2018-2033 (MILES DE USD)
TABLA 478 MERCADO DE BIOESTIMULANTES EN MÉXICO, POR ORIGEN, 2018-2033 (TONELADAS)
TABLA 479 BIOESTIMULANTES NATURALES EN EL MERCADO DE BIOESTIMULANTES DE MÉXICO, POR FORMA, 2018-2033 (MILES DE USD)
TABLA 480 MERCADO DE BIOESTIMULANTES LÍQUIDOS EN MÉXICO, POR TIPO, 2018-2033 (MILES DE USD)
TABLA 481 MERCADO DE BIOESTIMULANTES SECO EN MÉXICO, POR TIPO, 2018-2033 (MILES DE USD)
TABLA 482 BIOESTIMULANTES SINTÉTICOS EN EL MERCADO DE BIOESTIMULANTES DE MÉXICO, POR FORMA, 2018-2033 (MILES DE USD)
TABLA 483 MERCADO DE BIOESTIMULANTES LÍQUIDOS EN MÉXICO, POR TIPO, 2018-2033 (MILES DE USD)
TABLA 484 MERCADO DE BIOESTIMULANTES SECO EN MÉXICO, POR TIPO, 2018-2033 (MILES DE USD)
TABLA 485 MERCADO DE BIOESTIMULANTES EN MÉXICO, POR FORMA, 2018-2033 (MILES DE USD)
TABLA 486 MERCADO DE BIOESTIMULANTES LÍQUIDOS EN MÉXICO, POR TIPO, 2018-2033 (MILES DE USD)
TABLA 487 MERCADO DE BIOESTIMULANTES SECO EN MÉXICO, POR TIPO, 2018-2033 (MILES DE USD)
TABLA 488 MERCADO DE BIOESTIMULANTES EN MÉXICO, POR INGREDIENTES ACTIVOS, 2018-2033 (MILES DE USD)
TABLA 489 MERCADO DE BIOESTIMULANTES A BASE DE ÁCIDO MÉXICO, POR TIPO, 2018-2033 (MILES DE USD)
TABLA 490 MERCADO DE BIOESTIMULANTES A BASE DE EXTRACTO DE MÉXICO, POR TIPO, 2018-2033 (MILES DE USD)
TABLA 491 MERCADO DE BIOESTIMULANTES EN MÉXICO, POR MÉTODO DE APLICACIÓN, 2018-2032 (MILES DE USD)
TABLA 492 MERCADO DE BIOESTIMULANTES EN MÉXICO, POR CULTIVO, 2018-2033 (MILES DE USD)
TABLA 493 FRUTAS Y VERDURAS DE MÉXICO EN EL MERCADO DE BIOESTIMULANTES, POR FRUTAS, 2018-2033 (MILES DE USD)
TABLA 494 FRUTAS Y VERDURAS DE MÉXICO EN EL MERCADO DE BIOESTIMULANTES, POR VERDURA, 2018-2033 (MILES DE USD)
TABLA 495 MERCADO DE CEREALES Y GRANOS EN BIOESTIMULANTES DE MÉXICO, POR TIPO, 2018-2033 (MILES DE USD)
TABLA 496 MERCADO DE SEMILLAS OLEAGINOSAS Y LEGUMBRES EN BIOESTIMULANTES DE MÉXICO, POR TIPO, 2018-2033 (MILES DE USD)
TABLA 497 MERCADO DE BIOESTIMULANTES EN MÉXICO, POR USUARIO FINAL, 2018-2033 (MILES DE USD)
TABLA 498 MERCADO DE BIOESTIMULANTES DE ASIA-PACÍFICO, POR PAÍS, 2018-2033 (MILES DE USD)
TABLA 499 MERCADO DE BIOESTIMULANTES DE ASIA-PACÍFICO, POR PAÍS, 2018-2033 (MILES DE USD)
CUADRO 500 MERCADO DE BIOESTIMULANTES DE ASIA-PACÍFICO, POR PAÍS, 2018-2033 (TONELADAS)
CUADRO 501 ASIA-PACÍFICO
TABLA 502 MERCADO DE BIOESTIMULANTES DE ASIA-PACÍFICO, POR ORIGEN, 2018-2033 (MILES DE USD)
TABLA 503 MERCADO DE BIOESTIMULANTES DE ASIA-PACÍFICO, POR ORIGEN, 2018-2033 (TONELADAS)
TABLA 504 BIOESTIMULANTES NATURALES EN EL MERCADO DE BIOESTIMULANTES DE ASIA-PACÍFICO, POR FORMA, 2018-2033 (MILES DE USD)
TABLA 505 MERCADO DE BIOESTIMULANTES LÍQUIDOS DE ASIA-PACÍFICO, POR TIPO, 2018-2033 (MILES DE USD)
TABLA 506 MERCADO DE BIOESTIMULANTES SECOS DE ASIA-PACÍFICO, POR TIPO, 2018-2033 (MILES DE USD)
TABLA 507 BIOESTIMULANTES SINTÉTICOS EN EL MERCADO DE BIOESTIMULANTES DE ASIA-PACÍFICO, POR FORMA, 2018-2033 (MILES DE USD)
TABLA 508 MERCADO DE BIOESTIMULANTES LÍQUIDOS DE ASIA-PACÍFICO, POR TIPO, 2018-2033 (MILES DE USD)
TABLA 509 MERCADO DE BIOESTIMULANTES SECOS DE ASIA-PACÍFICO, POR TIPO, 2018-2033 (MILES DE USD)
TABLA 510 MERCADO DE BIOESTIMULANTES DE ASIA-PACÍFICO, POR FORMA, 2018-2033 (MILES DE USD)
TABLA 511 MERCADO DE BIOESTIMULANTES LÍQUIDOS DE ASIA-PACÍFICO, POR TIPO, 2018-2033 (MILES DE USD)
TABLA 512 MERCADO DE BIOESTIMULANTES SECOS DE ASIA-PACÍFICO, POR TIPO, 2018-2033 (MILES DE USD)
TABLA 513 MERCADO DE BIOESTIMULANTES DE ASIA-PACÍFICO, POR INGREDIENTES ACTIVOS, 2018-2033 (MILES DE USD)
TABLA 514 MERCADO DE BIOESTIMULANTES BASADOS EN ÁCIDO DE ASIA-PACÍFICO, POR TIPO, 2018-2033 (MILES DE USD)
TABLA 515 MERCADO DE BIOESTIMULANTES BASADOS EN EXTRACTOS DE ASIA-PACÍFICO, POR TIPO, 2018-2033 (MILES DE USD)
TABLA 516 MERCADO DE BIOESTIMULANTES DE ASIA-PACÍFICO, POR MÉTODO DE APLICACIÓN, 2018-2032 (MILES DE USD)
CUADRO 517 MERCADO DE BIOESTIMULANTES DE ASIA-PACÍFICO, POR CULTIVO, 2018-2033 (MILES DE USD)
TABLA 518 FRUTAS Y VERDURAS DE ASIA-PACÍFICO EN EL MERCADO DE BIOESTIMULANTES, POR FRUTAS, 2018-2033 (MILES DE USD)
TABLA 519 FRUTAS Y VERDURAS EN EL MERCADO DE BIOESTIMULANTES DE ASIA-PACÍFICO, POR VERDURA, 2018-2033 (MILES DE USD)
TABLA 520 MERCADO DE CEREALES Y GRANOS DE ASIA-PACÍFICO EN BIOESTIMULANTES, POR TIPO, 2018-2033 (MILES DE USD)
TABLA 521 MERCADO DE SEMILLAS OLEAGINOSAS Y LEGUMBRES EN BIOESTIMULANTES DE ASIA-PACÍFICO, POR TIPO, 2018-2033 (MILES DE USD)
TABLA 522 MERCADO DE BIOESTIMULANTES DE ASIA-PACÍFICO, POR USUARIO FINAL, 2018-2033 (MILES DE USD)
TABLA 523 MERCADO DE BIOESTIMULANTES DE CHINA, POR ORIGEN, 2018-2033 (MILES DE USD)
TABLA 524 MERCADO DE BIOESTIMULANTES DE CHINA, POR ORIGEN, 2018-2033 (TONELADAS)
TABLA 525 BIOESTIMULANTES NATURALES DE CHINA EN EL MERCADO DE BIOESTIMULANTES, POR FORMA, 2018-2033 (MILES DE USD)
TABLA 526 MERCADO DE BIOESTIMULANTES LÍQUIDOS DE CHINA, POR TIPO, 2018-2033 (MILES DE USD)
TABLA 527 CHINA DRY EN EL MERCADO DE BIOESTIMULANTES, POR TIPO, 2018-2033 (MILES DE USD)
TABLA 528 BIOESTIMULANTES SINTÉTICOS DE CHINA EN EL MERCADO DE BIOESTIMULANTES, POR FORMA, 2018-2033 (MILES DE USD)
TABLA 529 MERCADO DE BIOESTIMULANTES LÍQUIDOS DE CHINA, POR TIPO, 2018-2033 (MILES DE USD)
TABLA 530 CHINA DRY EN EL MERCADO DE BIOESTIMULANTES, POR TIPO, 2018-2033 (MILES DE USD)
TABLA 531 MERCADO DE BIOESTIMULANTES DE CHINA, POR FORMA, 2018-2033 (MILES DE USD)
TABLA 532 MERCADO DE BIOESTIMULANTES LÍQUIDOS DE CHINA, POR TIPO, 2018-2033 (MILES DE USD)
TABLA 533 CHINA DRY EN EL MERCADO DE BIOESTIMULANTES, POR TIPO, 2018-2033 (MILES DE USD)
TABLA 534 MERCADO DE BIOESTIMULANTES EN CHINA, POR INGREDIENTES ACTIVOS, 2018-2033 (MILES DE USD)
TABLA 535 MERCADO DE BIOESTIMULANTES A BASE DE ÁCIDO DE CHINA, POR TIPO, 2018-2033 (MILES DE USD)
TABLA 536 MERCADO DE BIOESTIMULANTES A BASE DE EXTRACTO DE CHINA, POR TIPO, 2018-2033 (MILES DE USD)
TABLA 537 MERCADO DE BIOESTIMULANTES DE CHINA, POR MÉTODO DE APLICACIÓN, 2018-2032 (MILES DE USD)
TABLA 538 MERCADO DE BIOESTIMULANTES DE CHINA, POR CULTIVO, 2018-2033 (MILES DE USD)
TABLA 539 FRUTAS Y VERDURAS DE CHINA EN EL MERCADO DE BIOESTIMULANTES, POR FRUTAS, 2018-2033 (MILES DE USD)
TABLA 540 FRUTAS Y VERDURAS DE CHINA EN EL MERCADO DE BIOESTIMULANTES, POR VERDURA, 2018-2033 (MILES DE USD)
TABLA 541 CEREALES Y GRANOS DE CHINA EN EL MERCADO DE BIOESTIMULANTES, POR TIPO, 2018-2033 (MILES DE USD)
TABLA 542 SEMILLAS OLEAGINOSAS Y LEGUMBRES EN EL MERCADO DE BIOESTIMULANTES DE CHINA, POR TIPO, 2018-2033 (MILES DE USD)
TABLA 543 MERCADO DE BIOESTIMULANTES DE CHINA, POR USUARIO FINAL, 2018-2033 (MILES DE USD)
TABLA 544 MERCADO DE BIOESTIMULANTES DE LA INDIA, POR ORIGEN, 2018-2033 (MILES DE USD)
TABLA 545 MERCADO DE BIOESTIMULANTES DE LA INDIA, POR ORIGEN, 2018-2033 (TONELADAS)
TABLA 546 BIOESTIMULANTES NATURALES EN EL MERCADO DE BIOESTIMULANTES DE LA INDIA, POR FORMA, 2018-2033 (MILES DE USD)
TABLA 547 MERCADO DE BIOESTIMULANTES LÍQUIDOS EN INDIA, POR TIPO, 2018-2033 (MILES DE USD)
TABLA 548 MERCADO DE BIOESTIMULANTES SECOS EN INDIA, POR TIPO, 2018-2033 (MILES DE USD)
TABLA 549 BIOESTIMULANTES SINTÉTICOS EN EL MERCADO DE BIOESTIMULANTES DE LA INDIA, POR FORMA, 2018-2033 (MILES DE USD)
TABLA 550 MERCADO DE BIOESTIMULANTES LÍQUIDOS EN INDIA, POR TIPO, 2018-2033 (MILES DE USD)
TABLA 551 MERCADO DE BIOESTIMULANTES SECOS EN INDIA, POR TIPO, 2018-2033 (MILES DE USD)
TABLA 552 MERCADO DE BIOESTIMULANTES DE LA INDIA, POR FORMA, 2018-2033 (MILES DE USD)
TABLA 553 MERCADO DE BIOESTIMULANTES LÍQUIDOS EN INDIA, POR TIPO, 2018-2033 (MILES DE USD)
TABLA 554 MERCADO DE BIOESTIMULANTES SECOS EN INDIA, POR TIPO, 2018-2033 (MILES DE USD)
TABLA 555 MERCADO DE BIOESTIMULANTES EN INDIA, POR INGREDIENTES ACTIVOS, 2018-2033 (MILES DE USD)
TABLA 556 MERCADO DE BIOESTIMULANTES A BASE DE ÁCIDO EN INDIA, POR TIPO, 2018-2033 (MILES DE USD)
TABLA 557 MERCADO DE BIOESTIMULANTES BASADOS EN EXTRACTO DE INDIA, POR TIPO, 2018-2033 (MILES DE USD)
TABLA 558 MERCADO DE BIOESTIMULANTES DE LA INDIA, POR MÉTODO DE APLICACIÓN, 2018-2032 (MILES DE USD)
TABLA 559 MERCADO DE BIOESTIMULANTES EN LA INDIA, POR CULTIVO, 2018-2033 (MILES DE USD)
TABLA 560 INDIA FRUTAS Y VERDURAS EN EL MERCADO DE BIOESTIMULANTES, POR FRUTAS, 2018-2033 (MILES DE USD)
TABLA 561 INDIA FRUTAS Y VERDURAS EN EL MERCADO DE BIOESTIMULANTES, POR VERDURA, 2018-2033 (MILES DE USD)
TABLA 562 CEREALES Y GRANOS EN EL MERCADO DE BIOESTIMULANTES DE LA INDIA, POR TIPO, 2018-2033 (MILES DE USD)
TABLA 563 SEMILLAS OLEAGINOSAS Y LEGUMBRES EN EL MERCADO DE BIOESTIMULANTES DE LA INDIA, POR TIPO, 2018-2033 (MILES DE USD)
TABLA 564 MERCADO DE BIOESTIMULANTES EN LA INDIA, POR USUARIO FINAL, 2018-2033 (MILES DE USD)
TABLA 565 MERCADO DE BIOESTIMULANTES DE AUSTRALIA, POR ORIGEN, 2018-2033 (MILES DE USD)
TABLA 566 MERCADO DE BIOESTIMULANTES DE AUSTRALIA, POR ORIGEN, 2018-2033 (TONELADAS)
TABLA 567 BIOESTIMULANTES NATURALES DE AUSTRALIA EN EL MERCADO DE BIOESTIMULANTES, POR FORMA, 2018-2033 (MILES DE USD)
TABLA 568 MERCADO DE BIOESTIMULANTES LÍQUIDOS DE AUSTRALIA, POR TIPO, 2018-2033 (MILES DE USD)
TABLA 569 MERCADO DE BIOESTIMULANTES SECOS DE AUSTRALIA, POR TIPO, 2018-2033 (MILES DE USD)
TABLA 570 BIOESTIMULANTES SINTÉTICOS DE AUSTRALIA EN EL MERCADO DE BIOESTIMULANTES, POR FORMA, 2018-2033 (MILES DE USD)
TABLA 571 MERCADO DE BIOESTIMULANTES LÍQUIDOS DE AUSTRALIA, POR TIPO, 2018-2033 (MILES DE USD)
TABLA 572 MERCADO DE BIOESTIMULANTES SECOS DE AUSTRALIA, POR TIPO, 2018-2033 (MILES DE USD)
TABLA 573 MERCADO DE BIOESTIMULANTES DE AUSTRALIA, POR FORMA, 2018-2033 (MILES DE USD)
TABLA 574 MERCADO DE BIOESTIMULANTES LÍQUIDOS DE AUSTRALIA, POR TIPO, 2018-2033 (MILES DE USD)
TABLA 575 MERCADO DE BIOESTIMULANTES SECOS DE AUSTRALIA, POR TIPO, 2018-2033 (MILES DE USD)
TABLA 576 MERCADO DE BIOESTIMULANTES DE AUSTRALIA, POR INGREDIENTES ACTIVOS, 2018-2033 (MILES DE USD)
TABLA 577 MERCADO DE AUSTRALIA DE BIOESTIMULANTES A BASE DE ÁCIDO, POR TIPO, 2018-2033 (MILES DE USD)
TABLA 578 MERCADO DE AUSTRALIA DE BIOESTIMULANTES A BASE DE EXTRACTO, POR TIPO, 2018-2033 (MILES DE USD)
TABLA 579 MERCADO DE BIOESTIMULANTES DE AUSTRALIA, POR MÉTODO DE APLICACIÓN, 2018-2032 (MILES DE USD)
TABLA 580 MERCADO DE BIOESTIMULANTES DE AUSTRALIA, POR CULTIVO, 2018-2033 (MILES DE USD)
TABLA 581 AUSTRALIA FRUTAS Y VERDURAS EN EL MERCADO DE BIOESTIMULANTES, POR FRUTAS, 2018-2033 (MILES DE USD)
TABLA 582 AUSTRALIA FRUTAS Y VERDURAS EN EL MERCADO DE BIOESTIMULANTES, POR VERDURA, 2018-2033 (MILES DE USD)
TABLA 583 MERCADO DE CEREALES Y GRANOS BIOESTIMULANTES DE AUSTRALIA, POR TIPO, 2018-2033 (MILES DE USD)
TABLA 584 MERCADO DE SEMILLAS OLEAGINOSAS Y LEGUMBRES EN BIOESTIMULANTES DE AUSTRALIA, POR TIPO, 2018-2033 (MILES DE USD)
TABLA 585 MERCADO DE BIOESTIMULANTES DE AUSTRALIA, POR USUARIO FINAL, 2018-2033 (MILES DE USD)
TABLA 586 MERCADO DE BIOESTIMULANTES DE JAPÓN, POR ORIGEN, 2018-2033 (MILES DE USD)
TABLA 587 MERCADO DE BIOESTIMULANTES DE JAPÓN, POR ORIGEN, 2018-2033 (TONELADAS)
TABLA 588 BIOESTIMULANTES NATURALES EN EL MERCADO DE BIOESTIMULANTES DE JAPÓN, POR FORMA, 2018-2033 (MILES DE USD)
TABLA 589 MERCADO DE BIOESTIMULANTES LÍQUIDOS DE JAPÓN, POR TIPO, 2018-2033 (MILES DE USD)
TABLA 590 MERCADO DE BIOESTIMULANTES SECOS DE JAPÓN, POR TIPO, 2018-2033 (MILES DE USD)
TABLA 591 BIOESTIMULANTES SINTÉTICOS DE JAPÓN EN EL MERCADO DE BIOESTIMULANTES, POR FORMA, 2018-2033 (MILES DE USD)
TABLA 592 MERCADO DE BIOESTIMULANTES LÍQUIDOS DE JAPÓN, POR TIPO, 2018-2033 (MILES DE USD)
TABLA 593 MERCADO DE BIOESTIMULANTES SECOS DE JAPÓN, POR TIPO, 2018-2033 (MILES DE USD)
TABLA 594 MERCADO DE BIOESTIMULANTES DE JAPÓN, POR FORMA, 2018-2033 (MILES DE USD)
TABLA 595 MERCADO DE BIOESTIMULANTES LÍQUIDOS DE JAPÓN, POR TIPO, 2018-2033 (MILES DE USD)
TABLA 596 MERCADO DE BIOESTIMULANTES SECOS DE JAPÓN, POR TIPO, 2018-2033 (MILES DE USD)
TABLA 597 MERCADO DE BIOESTIMULANTES EN JAPÓN, POR INGREDIENTES ACTIVOS, 2018-2033 (MILES DE USD)
TABLA 598 MERCADO DE BIOESTIMULANTES A BASE DE ÁCIDO DE JAPÓN, POR TIPO, 2018-2033 (MILES DE USD)
TABLA 599 MERCADO DE BIOESTIMULANTES BASADOS EN EXTRACTO DE JAPÓN, POR TIPO, 2018-2033 (MILES DE USD)
TABLA 600 MERCADO DE BIOESTIMULANTES DE JAPÓN, POR MÉTODO DE APLICACIÓN, 2018-2032 (MILES DE USD)
TABLA 601 MERCADO DE BIOESTIMULANTES DE JAPÓN, POR CULTIVO, 2018-2033 (MILES DE USD)
TABLA 602 FRUTAS Y VERDURAS DE JAPÓN EN EL MERCADO DE BIOESTIMULANTES, POR FRUTAS, 2018-2033 (MILES DE USD)
TABLA 603 FRUTAS Y VERDURAS DE JAPÓN EN EL MERCADO DE BIOESTIMULANTES, POR VERDURA, 2018-2033 (MILES DE USD)
TABLA 604 MERCADO DE CEREALES Y GRANOS BIOESTIMULANTES DE JAPÓN, POR TIPO, 2018-2033 (MILES DE USD)
TABLA 605 MERCADO DE SEMILLAS OLEAGINOSAS Y LEGUMBRES EN BIOESTIMULANTES DE JAPÓN, POR TIPO, 2018-2033 (MILES DE USD)
TABLA 606 MERCADO DE BIOESTIMULANTES DE JAPÓN, POR USUARIO FINAL, 2018-2033 (MILES DE USD)
TABLA 607 MERCADO DE BIOESTIMULANTES DE INDONESIA, POR ORIGEN, 2018-2033 (MILES DE USD)
TABLA 608 MERCADO DE BIOESTIMULANTES DE INDONESIA, POR ORIGEN, 2018-2033 (TONELADAS)
TABLA 609 BIOESTIMULANTES NATURALES EN EL MERCADO DE BIOESTIMULANTES DE INDONESIA, POR FORMA, 2018-2033 (MILES DE USD)
TABLA 610 MERCADO DE BIOESTIMULANTES LÍQUIDOS DE INDONESIA, POR TIPO, 2018-2033 (MILES DE USD)
TABLA 611 MERCADO DE BIOESTIMULANTES SECOS DE INDONESIA, POR TIPO, 2018-2033 (MILES DE USD)
TABLA 612 BIOESTIMULANTES SINTÉTICOS EN EL MERCADO DE BIOESTIMULANTES DE INDONESIA, POR FORMA, 2018-2033 (MILES DE USD)
TABLA 613 MERCADO DE BIOESTIMULANTES LÍQUIDOS DE INDONESIA, POR TIPO, 2018-2033 (MILES DE USD)
TABLA 614 MERCADO DE BIOESTIMULANTES SECOS DE INDONESIA, POR TIPO, 2018-2033 (MILES DE USD)
TABLA 615 MERCADO DE BIOESTIMULANTES DE INDONESIA, POR FORMA, 2018-2033 (MILES DE USD)
TABLA 616 MERCADO DE BIOESTIMULANTES LÍQUIDOS DE INDONESIA, POR TIPO, 2018-2033 (MILES DE USD)
TABLA 617 MERCADO DE BIOESTIMULANTES SECOS DE INDONESIA, POR TIPO, 2018-2033 (MILES DE USD)
TABLA 618 MERCADO DE BIOESTIMULANTES DE INDONESIA, POR INGREDIENTES ACTIVOS, 2018-2033 (MILES DE USD)
TABLA 619 MERCADO DE BIOESTIMULANTES A BASE DE ÁCIDO DE INDONESIA, POR TIPO, 2018-2033 (MILES DE USD)
TABLA 620 MERCADO DE BIOESTIMULANTES A BASE DE EXTRACTO DE INDONESIA, POR TIPO, 2018-2033 (MILES DE USD)
TABLA 621 MERCADO DE BIOESTIMULANTES DE INDONESIA, POR MÉTODO DE APLICACIÓN, 2018-2032 (MILES DE USD)
CUADRO 622 MERCADO DE BIOESTIMULANTES DE INDONESIA, POR CULTIVO, 2018-2033 (MILES DE USD)
TABLA 623 INDONESIA FRUTAS Y VERDURAS EN EL MERCADO DE BIOESTIMULANTES, POR FRUTAS, 2018-2033 (MILES DE USD)
TABLA 624 INDONESIA FRUTAS Y VERDURAS EN EL MERCADO DE BIOESTIMULANTES, POR VERDURA, 2018-2033 (MILES DE USD)
TABLA 625 MERCADO DE CEREALES Y GRANOS BIOESTIMULANTES DE INDONESIA, POR TIPO, 2018-2033 (MILES DE USD)
TABLA 626 SEMILLAS OLEAGINOSAS Y LEGUMBRES EN EL MERCADO DE BIOESTIMULANTES DE INDONESIA, POR TIPO, 2018-2033 (MILES DE USD)
TABLA 627 MERCADO DE BIOESTIMULANTES DE INDONESIA, POR USUARIO FINAL, 2018-2033 (MILES DE USD)
TABLA 628 MERCADO DE BIOESTIMULANTES DE COREA DEL SUR, POR ORIGEN, 2018-2033 (MILES DE USD)
TABLA 629 MERCADO DE BIOESTIMULANTES DE COREA DEL SUR, POR ORIGEN, 2018-2033 (TONELADAS)
TABLA 630 BIOESTIMULANTES NATURALES DE COREA DEL SUR EN EL MERCADO DE BIOESTIMULANTES, POR FORMA, 2018-2033 (MILES DE USD)
TABLA 631 MERCADO DE BIOESTIMULANTES LÍQUIDOS DE COREA DEL SUR, POR TIPO, 2018-2033 (MILES DE USD)
TABLA 632 MERCADO DE BIOESTIMULANTES SECOS DE COREA DEL SUR, POR TIPO, 2018-2033 (MILES DE USD)
TABLA 633 BIOESTIMULANTES SINTÉTICOS DE COREA DEL SUR EN EL MERCADO DE BIOESTIMULANTES, POR FORMA, 2018-2033 (MILES DE USD)
TABLA 634 MERCADO DE BIOESTIMULANTES LÍQUIDOS DE COREA DEL SUR, POR TIPO, 2018-2033 (MILES DE USD)
TABLA 635 MERCADO DE BIOESTIMULANTES SECOS DE COREA DEL SUR, POR TIPO, 2018-2033 (MILES DE USD)
TABLA 636 MERCADO DE BIOESTIMULANTES DE COREA DEL SUR, POR FORMA, 2018-2033 (MILES DE USD)
TABLA 637 MERCADO DE BIOESTIMULANTES LÍQUIDOS DE COREA DEL SUR, POR TIPO, 2018-2033 (MILES DE USD)
TABLA 638 MERCADO DE BIOESTIMULANTES SECOS DE COREA DEL SUR, POR TIPO, 2018-2033 (MILES DE USD)
TABLA 639 MERCADO DE BIOESTIMULANTES DE COREA DEL SUR, POR INGREDIENTES ACTIVOS, 2018-2033 (MILES DE USD)
TABLA 640 MERCADO DE BIOESTIMULANTES A BASE DE ÁCIDO DE COREA DEL SUR, POR TIPO, 2018-2033 (MILES DE USD)
TABLA 641 MERCADO DE BIOESTIMULANTES A BASE DE EXTRACTO DE COREA DEL SUR, POR TIPO, 2018-2033 (MILES DE USD)
TABLA 642 MERCADO DE BIOESTIMULANTES DE COREA DEL SUR, POR MÉTODO DE APLICACIÓN, 2018-2032 (MILES DE USD)
TABLA 643 MERCADO DE BIOESTIMULANTES DE COREA DEL SUR, POR CULTIVO, 2018-2033 (MILES DE USD)
TABLA 644 FRUTAS Y VERDURAS DE COREA DEL SUR EN EL MERCADO DE BIOESTIMULANTES, POR FRUTAS, 2018-2033 (MILES DE USD)
TABLA 645 FRUTAS Y VERDURAS DE COREA DEL SUR EN EL MERCADO DE BIOESTIMULANTES, POR VERDURA, 2018-2033 (MILES DE USD)
TABLA 646 MERCADO DE CEREALES Y GRANOS DE COREA DEL SUR EN BIOESTIMULANTES, POR TIPO, 2018-2033 (MILES DE USD)
TABLA 647 MERCADO DE SEMILLAS OLEAGINOSAS Y LEGUMBRES DE COREA DEL SUR EN BIOESTIMULANTES, POR TIPO, 2018-2033 (MILES DE USD)
TABLA 648 MERCADO DE BIOESTIMULANTES DE COREA DEL SUR, POR USUARIO FINAL, 2018-2033 (MILES DE USD)
TABLA 649 MERCADO DE BIOESTIMULANTES DE TAILANDIA, POR ORIGEN, 2018-2033 (MILES DE USD)
TABLA 650 MERCADO DE BIOESTIMULANTES DE TAILANDIA, POR ORIGEN, 2018-2033 (TONELADAS)
TABLA 651 BIOESTIMULANTES NATURALES DE TAILANDIA EN EL MERCADO DE BIOESTIMULANTES, POR FORMA, 2018-2033 (MILES DE USD)
TABLA 652 MERCADO DE BIOESTIMULANTES LÍQUIDOS DE TAILANDIA, POR TIPO, 2018-2033 (MILES DE USD)
TABLA 653 MERCADO DE BIOESTIMULANTES SECOS DE TAILANDIA, POR TIPO, 2018-2033 (MILES DE USD)
TABLA 654 BIOESTIMULANTES SINTÉTICOS DE TAILANDIA EN EL MERCADO DE BIOESTIMULANTES, POR FORMA, 2018-2033 (MILES DE USD)
TABLA 655 MERCADO DE BIOESTIMULANTES LÍQUIDOS DE TAILANDIA, POR TIPO, 2018-2033 (MILES DE USD)
TABLA 656 MERCADO DE BIOESTIMULANTES SECOS DE TAILANDIA, POR TIPO, 2018-2033 (MILES DE USD)
TABLA 657 MERCADO DE BIOESTIMULANTES DE TAILANDIA, POR FORMA, 2018-2033 (MILES DE USD)
TABLA 658 MERCADO DE BIOESTIMULANTES LÍQUIDOS DE TAILANDIA, POR TIPO, 2018-2033 (MILES DE USD)
TABLA 659 MERCADO DE BIOESTIMULANTES SECOS DE TAILANDIA, POR TIPO, 2018-2033 (MILES DE USD)
TABLA 660 MERCADO DE BIOESTIMULANTES DE TAILANDIA, POR INGREDIENTES ACTIVOS, 2018-2033 (MILES DE USD)
TABLA 661 MERCADO DE BIOESTIMULANTES A BASE DE ÁCIDO DE TAILANDIA, POR TIPO, 2018-2033 (MILES DE USD)
TABLA 662 MERCADO DE BIOESTIMULANTES BASADOS EN EXTRACTO DE TAILANDIA, POR TIPO, 2018-2033 (MILES DE USD)
TABLA 663 MERCADO DE BIOESTIMULANTES DE TAILANDIA, POR MÉTODO DE APLICACIÓN, 2018-2032 (MILES DE USD)
TABLA 664 MERCADO DE BIOESTIMULANTES DE TAILANDIA, POR CULTIVO, 2018-2033 (MILES DE USD)
TABLA 665 FRUTAS Y VERDURAS DE TAILANDIA EN EL MERCADO DE BIOESTIMULANTES, POR FRUTAS, 2018-2033 (MILES DE USD)
TABLA 666 FRUTAS Y VERDURAS DE TAILANDIA EN EL MERCADO DE BIOESTIMULANTES, POR VERDURA, 2018-2033 (MILES DE USD)
TABLA 667 MERCADO DE CEREALES Y GRANOS DE TAILANDIA EN BIOESTIMULANTES, POR TIPO, 2018-2033 (MILES DE USD)
TABLA 668 SEMILLAS OLEAGINOSAS Y LEGUMBRES EN EL MERCADO DE BIOESTIMULANTES DE TAILANDIA, POR TIPO, 2018-2033 (MILES DE USD)
TABLA 669 MERCADO DE BIOESTIMULANTES DE TAILANDIA, POR USUARIO FINAL, 2018-2033 (MILES DE USD)
TABLA 670 MERCADO DE BIOESTIMULANTES DE MALASIA, POR ORIGEN, 2018-2033 (MILES DE USD)
TABLA 671 MERCADO DE BIOESTIMULANTES DE MALASIA, POR ORIGEN, 2018-2033 (TONELADAS)
TABLA 672 BIOESTIMULANTES NATURALES DE MALASIA EN EL MERCADO DE BIOESTIMULANTES, POR FORMA, 2018-2033 (MILES DE USD)
TABLA 673 MERCADO DE BIOESTIMULANTES LÍQUIDOS DE MALASIA, POR TIPO, 2018-2033 (MILES DE USD)
TABLA 674 MERCADO DE BIOESTIMULANTES SECOS DE MALASIA, POR TIPO, 2018-2033 (MILES DE USD)
TABLA 675 BIOESTIMULANTES SINTÉTICOS DE MALASIA EN EL MERCADO DE BIOESTIMULANTES, POR FORMA, 2018-2033 (MILES DE USD)
TABLA 676 MERCADO DE BIOESTIMULANTES LÍQUIDOS DE MALASIA, POR TIPO, 2018-2033 (MILES DE USD)
TABLA 677 MERCADO DE BIOESTIMULANTES SECOS DE MALASIA, POR TIPO, 2018-2033 (MILES DE USD)
TABLA 678 MERCADO DE BIOESTIMULANTES DE MALASIA, POR FORMA, 2018-2033 (MILES DE USD)
TABLA 679 MERCADO DE BIOESTIMULANTES LÍQUIDOS DE MALASIA, POR TIPO, 2018-2033 (MILES DE USD)
TABLA 680 MERCADO DE BIOESTIMULANTES SECOS DE MALASIA, POR TIPO, 2018-2033 (MILES DE USD)
TABLA 681 MERCADO DE BIOESTIMULANTES DE MALASIA, POR INGREDIENTES ACTIVOS, 2018-2033 (MILES DE USD)
TABLA 682 MERCADO DE BIOESTIMULANTES A BASE DE ÁCIDO DE MALASIA, POR TIPO, 2018-2033 (MILES DE USD)
TABLA 683 MERCADO DE BIOESTIMULANTES A BASE DE EXTRACTO DE MALASIA, POR TIPO, 2018-2033 (MILES DE USD)
TABLA 684 MERCADO DE BIOESTIMULANTES DE MALASIA, POR MÉTODO DE APLICACIÓN, 2018-2032 (MILES DE USD)
TABLA 685 MERCADO DE BIOESTIMULANTES DE MALASIA, POR CULTIVO, 2018-2033 (MILES DE USD)
TABLA 686 FRUTAS Y VERDURAS DE MALASIA EN EL MERCADO DE BIOESTIMULANTES, POR FRUTAS, 2018-2033 (MILES DE USD)
TABLA 687 MERCADO DE FRUTAS Y VERDURAS DE MALASIA EN BIOESTIMULANTES, POR VERDURA, 2018-2033 (MILES DE USD)
TABLA 688 MERCADO DE CEREALES Y GRANOS DE MALASIA EN BIOESTIMULANTES, POR TIPO, 2018-2033 (MILES DE USD)
MERCADO DE SEMILLAS OLEAGINOSAS Y LEGUMBRES EN BIOESTIMULANTES DE MALASIA, POR TIPO, 2018-2033 (MILES DE USD) 443
TABLA 689 MERCADO DE BIOESTIMULANTES DE MALASIA, POR USUARIO FINAL, 2018-2033 (MILES DE USD)
TABLA 690 MERCADO DE BIOESTIMULANTES DE FILIPINAS, POR ORIGEN, 2018-2033 (MILES DE USD)
TABLA 691 MERCADO DE BIOESTIMULANTES DE FILIPINAS, POR ORIGEN, 2018-2033 (TONELADAS)
TABLA 692 BIOESTIMULANTES NATURALES EN EL MERCADO DE BIOESTIMULANTES DE FILIPINAS, POR FORMA, 2018-2033 (MILES DE USD)
TABLA 693 MERCADO DE BIOESTIMULANTES LÍQUIDOS DE FILIPINAS, POR TIPO, 2018-2033 (MILES DE USD)
TABLA 694 MERCADO DE BIOESTIMULANTES SECOS EN FILIPINAS, POR TIPO, 2018-2033 (MILES DE USD)
TABLA 695 BIOESTIMULANTES SINTÉTICOS DE FILIPINAS EN EL MERCADO DE BIOESTIMULANTES, POR FORMA, 2018-2033 (MILES DE USD)
TABLA 696 MERCADO DE BIOESTIMULANTES LÍQUIDOS DE FILIPINAS, POR TIPO, 2018-2033 (MILES DE USD)
TABLA 697 MERCADO DE BIOESTIMULANTES SECOS EN FILIPINAS, POR TIPO, 2018-2033 (MILES DE USD)
TABLA 698 MERCADO DE BIOESTIMULANTES DE FILIPINAS, POR FORMA, 2018-2033 (MILES DE USD)
TABLA 699 MERCADO DE BIOESTIMULANTES LÍQUIDOS DE FILIPINAS, POR TIPO, 2018-2033 (MILES DE USD)
TABLA 700 MERCADO DE BIOESTIMULANTES SECOS EN FILIPINAS, POR TIPO, 2018-2033 (MILES DE USD)
TABLA 701 MERCADO DE BIOESTIMULANTES DE FILIPINAS, POR INGREDIENTES ACTIVOS, 2018-2033 (MILES DE USD)
TABLA 702 MERCADO DE BIOESTIMULANTES A BASE DE ÁCIDO DE FILIPINAS, POR TIPO, 2018-2033 (MILES DE USD)
TABLA 703 MERCADO DE BIOESTIMULANTES BASADOS EN EXTRACTO DE FILIPINAS, POR TIPO, 2018-2033 (MILES DE USD)
TABLA 704 MERCADO DE BIOESTIMULANTES DE FILIPINAS, POR MÉTODO DE APLICACIÓN, 2018-2032 (MILES DE USD)
TABLA 705 MERCADO DE BIOESTIMULANTES DE FILIPINAS, POR CULTIVO, 2018-2033 (MILES DE USD)
TABLA 706 FRUTAS Y VERDURAS DE FILIPINAS EN EL MERCADO DE BIOESTIMULANTES, POR FRUTAS, 2018-2033 (MILES DE USD)
TABLA 707 FILIPINAS FRUTAS Y VERDURAS EN EL MERCADO DE BIOESTIMULANTES, POR VERDURA, 2018-2033 (MILES DE USD)
TABLA 708 CEREALES Y GRANOS DE FILIPINAS EN EL MERCADO DE BIOESTIMULANTES, POR TIPO, 2018-2033 (MILES DE USD)
TABLA 709 SEMILLAS OLEAGINOSAS Y LEGUMBRES EN EL MERCADO DE BIOESTIMULANTES DE FILIPINAS, POR TIPO, 2018-2033 (MILES DE USD)
TABLA 710 MERCADO DE BIOESTIMULANTES DE FILIPINAS, POR USUARIO FINAL, 2018-2033 (MILES DE USD)
TABLA 711 MERCADO DE BIOESTIMULANTES DE SINGAPUR, POR ORIGEN, 2018-2033 (MILES DE USD)
TABLA 712 MERCADO DE BIOESTIMULANTES DE SINGAPUR, POR ORIGEN, 2018-2033 (TONELADAS)
TABLA 713 BIOESTIMULANTES NATURALES DE SINGAPUR EN EL MERCADO DE BIOESTIMULANTES, POR FORMA, 2018-2033 (MILES DE USD)
TABLA 714 MERCADO DE BIOESTIMULANTES LÍQUIDOS DE SINGAPUR, POR TIPO, 2018-2033 (MILES DE USD)
TABLA 715 MERCADO DE BIOESTIMULANTES SECOS DE SINGAPUR, POR TIPO, 2018-2033 (MILES DE USD)
TABLA 716 BIOESTIMULANTES SINTÉTICOS DE SINGAPUR EN EL MERCADO DE BIOESTIMULANTES, POR FORMA, 2018-2033 (MILES DE USD)
TABLA 717 MERCADO DE BIOESTIMULANTES LÍQUIDOS DE SINGAPUR, POR TIPO, 2018-2033 (MILES DE USD)
TABLA 718 MERCADO DE BIOESTIMULANTES SECOS DE SINGAPUR, POR TIPO, 2018-2033 (MILES DE USD)
TABLA 719 MERCADO DE BIOESTIMULANTES DE SINGAPUR, POR FORMA, 2018-2033 (MILES DE USD)
TABLA 720 MERCADO DE BIOESTIMULANTES LÍQUIDOS DE SINGAPUR, POR TIPO, 2018-2033 (MILES DE USD)
TABLA 721 MERCADO DE BIOESTIMULANTES SECOS DE SINGAPUR, POR TIPO, 2018-2033 (MILES DE USD)
TABLA 722 MERCADO DE BIOESTIMULANTES DE SINGAPUR, POR INGREDIENTES ACTIVOS, 2018-2033 (MILES DE USD)
TABLA 723 MERCADO DE BIOESTIMULANTES A BASE DE ÁCIDO DE SINGAPUR, POR TIPO, 2018-2033 (MILES DE USD)
TABLA 724 MERCADO DE BIOESTIMULANTES BASADOS EN EXTRACTO DE SINGAPUR, POR TIPO, 2018-2033 (MILES DE USD)
TABLA 725 MERCADO DE BIOESTIMULANTES DE SINGAPUR, POR MÉTODO DE APLICACIÓN, 2018-2032 (MILES DE USD)
TABLA 726 MERCADO DE BIOESTIMULANTES DE SINGAPUR, POR CULTIVO, 2018-2033 (MILES DE USD)
TABLA 727 FRUTAS Y VERDURAS DE SINGAPUR EN EL MERCADO DE BIOESTIMULANTES, POR FRUTAS, 2018-2033 (MILES DE USD)
TABLA 728 FRUTAS Y VERDURAS DE SINGAPUR EN EL MERCADO DE BIOESTIMULANTES, POR VERDURA, 2018-2033 (MILES DE USD)
TABLA 729 CEREALES Y GRANOS DE SINGAPUR EN EL MERCADO DE BIOESTIMULANTES, POR TIPO, 2018-2033 (MILES DE USD)
TABLA 730 SEMILLAS OLEAGINOSAS Y LEGUMBRES EN EL MERCADO DE BIOESTIMULANTES DE SINGAPUR, POR TIPO, 2018-2033 (MILES DE USD)
TABLA 731 MERCADO DE BIOESTIMULANTES DE SINGAPUR, POR USUARIO FINAL, 2018-2033 (MILES DE USD)
TABLA 732 MERCADO DE BIOESTIMULANTES DE NUEVA ZELANDA, POR ORIGEN, 2018-2033 (MILES DE USD)
TABLA 733 MERCADO DE BIOESTIMULANTES DE NUEVA ZELANDA, POR ORIGEN, 2018-2033 (TONELADAS)
TABLA 734 BIOESTIMULANTES NATURALES DE NUEVA ZELANDA EN EL MERCADO DE BIOESTIMULANTES, POR FORMA, 2018-2033 (MILES DE USD)
TABLA 735 MERCADO DE BIOESTIMULANTES LÍQUIDOS DE NUEVA ZELANDA, POR TIPO, 2018-2033 (MILES DE USD)
TABLA 736 MERCADO DE BIOESTIMULANTES SECOS DE NUEVA ZELANDA, POR TIPO, 2018-2033 (MILES DE USD)
TABLA 737 BIOESTIMULANTES SINTÉTICOS DE NUEVA ZELANDA EN EL MERCADO DE BIOESTIMULANTES, POR FORMA, 2018-2033 (MILES DE USD)
TABLA 738 MERCADO DE BIOESTIMULANTES LÍQUIDOS DE NUEVA ZELANDA, POR TIPO, 2018-2033 (MILES DE USD)
TABLA 739 MERCADO DE BIOESTIMULANTES SECOS DE NUEVA ZELANDA, POR TIPO, 2018-2033 (MILES DE USD)
TABLA 740 MERCADO DE BIOESTIMULANTES DE NUEVA ZELANDA, POR FORMA, 2018-2033 (MILES DE USD)
TABLA 741 MERCADO DE BIOESTIMULANTES LÍQUIDOS DE NUEVA ZELANDA, POR TIPO, 2018-2033 (MILES DE USD)
TABLA 742 MERCADO DE BIOESTIMULANTES SECOS DE NUEVA ZELANDA, POR TIPO, 2018-2033 (MILES DE USD)
TABLA 743 MERCADO DE BIOESTIMULANTES DE NUEVA ZELANDA, POR INGREDIENTES ACTIVOS, 2018-2033 (MILES DE USD)
TABLA 744 MERCADO DE BIOESTIMULANTES A BASE DE ÁCIDO DE NUEVA ZELANDA, POR TIPO, 2018-2033 (MILES DE USD)
TABLA 745 MERCADO DE BIOESTIMULANTES A BASE DE EXTRACTO DE NUEVA ZELANDA, POR TIPO, 2018-2033 (MILES DE USD)
TABLA 746 MERCADO DE BIOESTIMULANTES DE NUEVA ZELANDA, POR MÉTODO DE APLICACIÓN, 2018-2032 (MILES DE USD)
TABLA 747 MERCADO DE BIOESTIMULANTES DE NUEVA ZELANDA, POR CULTIVO, 2018-2033 (MILES DE USD)
TABLA 748 FRUTAS Y VERDURAS DE NUEVA ZELANDA EN EL MERCADO DE BIOESTIMULANTES, POR FRUTAS, 2018-2033 (MILES DE USD)
TABLA 749 FRUTAS Y VERDURAS DE NUEVA ZELANDA EN EL MERCADO DE BIOESTIMULANTES, POR VERDURA, 2018-2033 (MILES DE USD)
TABLA 750 MERCADO DE CEREALES Y GRANOS DE NUEVA ZELANDA EN BIOESTIMULANTES, POR TIPO, 2018-2033 (MILES DE USD)
TABLA 751 SEMILLAS OLEAGINOSAS Y LEGUMBRES EN EL MERCADO DE BIOESTIMULANTES DE NUEVA ZELANDA, POR TIPO, 2018-2033 (MILES DE USD)
TABLA 752 MERCADO DE BIOESTIMULANTES DE NUEVA ZELANDA, POR USUARIO FINAL, 2018-2033 (MILES DE USD)
TABLA 753 RESTO DEL MERCADO DE BIOESTIMULANTES DE ASIA-PACÍFICO, POR ORIGEN, 2018-2033 (MILES DE USD)
TABLA 754 RESTO DEL MERCADO DE BIOESTIMULANTES DE ASIA-PACÍFICO, POR ORIGEN, 2018-2033 (TONELADAS)
TABLA 755 RESTO DEL MERCADO DE BIOESTIMULANTES NATURALES DE ASIA-PACÍFICO, POR FORMA, 2018-2033 (MILES DE USD)
TABLA 756 RESTO DEL MERCADO DE BIOESTIMULANTES LÍQUIDOS DE ASIA-PACÍFICO, POR TIPO, 2018-2033 (MILES DE USD)
TABLA 757 RESTO DEL MERCADO DE BIOESTIMULANTES SECOS DE ASIA-PACÍFICO, POR TIPO, 2018-2033 (MILES DE USD)
TABLA 758 RESTO DEL MERCADO DE BIOESTIMULANTES SINTÉTICOS DE ASIA-PACÍFICO, POR FORMA, 2018-2033 (MILES DE USD)
TABLA 759 RESTO DEL MERCADO DE BIOESTIMULANTES LÍQUIDOS DE ASIA-PACÍFICO, POR TIPO, 2018-2033 (MILES DE USD)
TABLA 760 RESTO DEL MERCADO DE BIOESTIMULANTES SECOS DE ASIA-PACÍFICO, POR TIPO, 2018-2033 (MILES DE USD)
TABLA 761 RESTO DEL MERCADO DE BIOESTIMULANTES DE ASIA-PACÍFICO, POR FORMA, 2018-2033 (MILES DE USD)
TABLA 762 RESTO DEL MERCADO DE BIOESTIMULANTES LÍQUIDOS DE ASIA-PACÍFICO, POR TIPO, 2018-2033 (MILES DE USD)
TABLA 763 RESTO DEL MERCADO DE BIOESTIMULANTES SECOS DE ASIA-PACÍFICO, POR TIPO, 2018-2033 (MILES DE USD)
TABLA 764 RESTO DEL MERCADO DE BIOESTIMULANTES DE ASIA-PACÍFICO, POR INGREDIENTES ACTIVOS, 2018-2033 (MILES DE USD)
TABLA 765 RESTO DEL MERCADO DE BIOESTIMULANTES A BASE DE ÁCIDO DE ASIA-PACÍFICO, POR TIPO, 2018-2033 (MILES DE USD)
TABLA 766 RESTO DEL MERCADO DE BIOESTIMULANTES BASADOS EN EXTRACTOS DE ASIA-PACÍFICO, POR TIPO, 2018-2033 (MILES DE USD)
TABLA 767 RESTO DEL MERCADO DE BIOESTIMULANTES DE ASIA-PACÍFICO, POR MÉTODO DE APLICACIÓN, 2018-2032 (MILES DE USD)
TABLA 768 RESTO DEL MERCADO DE BIOESTIMULANTES DE ASIA-PACÍFICO, POR CULTIVO, 2018-2033 (MILES DE USD)
TABLA 769 RESTO DEL MERCADO DE FRUTAS Y VERDURAS DE ASIA-PACÍFICO EN BIOESTIMULANTES, POR FRUTAS, 2018-2033 (MILES DE USD)
TABLA 770 RESTO DEL MERCADO DE FRUTAS Y VERDURAS DE ASIA-PACÍFICO EN BIOESTIMULANTES, POR VERDURA, 2018-2033 (MILES DE USD)
TABLA 771 RESTO DEL MERCADO DE CEREALES Y GRANOS DE ASIA-PACÍFICO EN BIOESTIMULANTES, POR TIPO, 2018-2033 (MILES DE USD)
TABLA 772 RESTO DEL MERCADO DE SEMILLAS OLEAGINOSAS Y LEGUMBRES EN BIOESTIMULANTES DE ASIA-PACÍFICO, POR TIPO, 2018-2033 (MILES DE USD)
TABLA 773 RESTO DEL MERCADO DE BIOESTIMULANTES DE ASIA-PACÍFICO, POR USUARIO FINAL, 2018-2033 (MILES DE USD)
TABLA 774 MERCADO DE BIOESTIMULANTES EN AMÉRICA DEL SUR, POR PAÍS, 2018-2033 (MILES DE USD)
CUADRO 775 MERCADO DE BIOESTIMULANTES EN AMÉRICA DEL SUR, POR PAÍS, 2018-2033 (TONELADAS)
TABLA 776 AMÉRICA DEL SUR
TABLA 777 MERCADO DE BIOESTIMULANTES DE AMÉRICA DEL SUR, POR ORIGEN, 2018-2033 (MILES DE USD)
TABLA 778 MERCADO DE BIOESTIMULANTES DE AMÉRICA DEL SUR, POR ORIGEN, 2018-2033 (TONELADAS)
TABLA 779 BIOESTIMULANTES NATURALES EN EL MERCADO DE BIOESTIMULANTES DE AMÉRICA DEL SUR, POR FORMA, 2018-2033 (MILES DE USD)
TABLA 780 MERCADO DE BIOESTIMULANTES LÍQUIDOS DE AMÉRICA DEL SUR, POR TIPO, 2018-2033 (MILES DE USD)
TABLA 781 MERCADO DE BIOESTIMULANTES SECO EN AMÉRICA DEL SUR, POR TIPO, 2018-2033 (MILES DE USD)
TABLA 782 BIOESTIMULANTES SINTÉTICOS EN EL MERCADO DE BIOESTIMULANTES DE AMÉRICA DEL SUR, POR FORMA, 2018-2033 (MILES DE USD)
TABLA 783 MERCADO DE BIOESTIMULANTES LÍQUIDOS DE AMÉRICA DEL SUR, POR TIPO, 2018-2033 (MILES DE USD)
TABLA 784 MERCADO DE BIOESTIMULANTES SECO EN AMÉRICA DEL SUR, POR TIPO, 2018-2033 (MILES DE USD)
TABLA 785 MERCADO DE BIOESTIMULANTES DE AMÉRICA DEL SUR, POR FORMA, 2018-2033 (MILES DE USD)
TABLA 786 MERCADO DE BIOESTIMULANTES LÍQUIDOS DE AMÉRICA DEL SUR, POR TIPO, 2018-2033 (MILES DE USD)
TABLA 787 MERCADO DE BIOESTIMULANTES SECO EN AMÉRICA DEL SUR, POR TIPO, 2018-2033 (MILES DE USD)
TABLA 788 MERCADO DE BIOESTIMULANTES EN AMÉRICA DEL SUR, POR INGREDIENTES ACTIVOS, 2018-2033 (MILES DE USD)
TABLA 789 MERCADO DE BIOESTIMULANTES A BASE DE ÁCIDO DE AMÉRICA DEL SUR, POR TIPO, 2018-2033 (MILES DE USD)
TABLA 790 MERCADO DE BIOESTIMULANTES A BASE DE EXTRACTOS DE AMÉRICA DEL SUR, POR TIPO, 2018-2033 (MILES DE USD)
TABLA 791 MERCADO DE BIOESTIMULANTES DE AMÉRICA DEL SUR, POR MÉTODO DE APLICACIÓN, 2018-2032 (MILES DE USD)
CUADRO 792 MERCADO DE BIOESTIMULANTES EN AMÉRICA DEL SUR, POR CULTIVO, 2018-2033 (MILES DE USD)
TABLA 793 FRUTAS Y VERDURAS DE AMÉRICA DEL SUR EN EL MERCADO DE BIOESTIMULANTES, POR FRUTAS, 2018-2033 (MILES DE USD)
TABLA 794 FRUTAS Y VERDURAS EN EL MERCADO DE BIOESTIMULANTES DE AMÉRICA DEL SUR, POR VERDURA, 2018-2033 (MILES DE USD)
TABLA 795 MERCADO DE CEREALES Y GRANOS EN BIOESTIMULANTES DE AMÉRICA DEL SUR, POR TIPO, 2018-2033 (MILES DE USD)
TABLA 796 SEMILLAS OLEAGINOSAS Y LEGUMBRES EN EL MERCADO DE BIOESTIMULANTES DE AMÉRICA DEL SUR, POR TIPO, 2018-2033 (MILES DE USD)
TABLA 797 MERCADO DE BIOESTIMULANTES EN AMÉRICA DEL SUR, POR USUARIO FINAL, 2018-2033 (MILES DE USD)
TABLA 798 MERCADO DE BIOESTIMULANTES DE BRASIL, POR ORIGEN, 2018-2033 (MILES DE USD)
TABLA 799 MERCADO DE BIOESTIMULANTES DE BRASIL, POR ORIGEN, 2018-2033 (TONELADAS)
TABLA 800 BIOESTIMULANTES NATURALES DE BRASIL EN EL MERCADO DE BIOESTIMULANTES, POR FORMA, 2018-2033 (MILES DE USD)
TABLA 801 MERCADO DE BIOESTIMULANTES LÍQUIDOS DE BRASIL, POR TIPO, 2018-2033 (MILES DE USD)
TABLA 802 MERCADO DE BIOESTIMULANTES SECADOS EN BRASIL, POR TIPO, 2018-2033 (MILES DE USD)
TABLA 803 BIOESTIMULANTES SINTÉTICOS DE BRASIL EN EL MERCADO DE BIOESTIMULANTES, POR FORMA, 2018-2033 (MILES DE USD)
TABLA 804 MERCADO DE BIOESTIMULANTES LÍQUIDOS DE BRASIL, POR TIPO, 2018-2033 (MILES DE USD)
TABLA 805 MERCADO DE BIOESTIMULANTES SECADOS EN BRASIL, POR TIPO, 2018-2033 (MILES DE USD)
TABLA 806 MERCADO DE BIOESTIMULANTES DE BRASIL, POR FORMA, 2018-2033 (MILES DE USD)
TABLA 807 MERCADO DE BIOESTIMULANTES LÍQUIDOS DE BRASIL, POR TIPO, 2018-2033 (MILES DE USD)
TABLA 808 MERCADO DE BIOESTIMULANTES SECADOS EN BRASIL, POR TIPO, 2018-2033 (MILES DE USD)
TABLA 809 MERCADO DE BIOESTIMULANTES DE BRASIL, POR INGREDIENTES ACTIVOS, 2018-2033 (MILES DE USD)
TABLA 810 MERCADO DE BIOESTIMULANTES A BASE DE ÁCIDO BRASILERO, POR TIPO, 2018-2033 (MILES DE USD)
TABLA 811 MERCADO DE BIOESTIMULANTES A BASE DE EXTRACTO DE BRASIL, POR TIPO, 2018-2033 (MILES DE USD)
TABLA 812 MERCADO DE BIOESTIMULANTES DE BRASIL, POR MÉTODO DE APLICACIÓN, 2018-2032 (MILES DE USD)
TABLA 813 MERCADO DE BIOESTIMULANTES DE BRASIL, POR CULTIVO, 2018-2033 (MILES DE USD)
TABLA 814 FRUTAS Y VERDURAS DE BRASIL EN EL MERCADO DE BIOESTIMULANTES, POR FRUTAS, 2018-2033 (MILES DE USD)
TABLA 815 FRUTAS Y VERDURAS DE BRASIL EN EL MERCADO DE BIOESTIMULANTES, POR VERDURA, 2018-2033 (MILES DE USD)
TABLA 816 CEREALES Y GRANOS DE BRASIL EN EL MERCADO DE BIOESTIMULANTES, POR TIPO, 2018-2033 (MILES DE USD)
TABLA 817 MERCADO DE SEMILLAS OLEAGINOSAS Y LEGUMBRES EN BIOESTIMULANTES DE BRASIL, POR TIPO, 2018-2033 (MILES DE USD)
TABLA 818 MERCADO DE BIOESTIMULANTES DE BRASIL, POR USUARIO FINAL, 2018-2033 (MILES DE USD)
TABLA 819 MERCADO DE BIOESTIMULANTES EN ARGENTINA, POR ORIGEN, 2018-2033 (MILES DE USD)
TABLA 820 MERCADO DE BIOESTIMULANTES EN ARGENTINA, POR ORIGEN, 2018-2033 (TONELADAS)
TABLA 821 BIOESTIMULANTES NATURALES EN EL MERCADO DE BIOESTIMULANTES DE ARGENTINA, POR FORMA, 2018-2033 (MILES DE USD)
TABLA 822 MERCADO ARGENTINO DE BIOESTIMULANTES LÍQUIDOS, POR TIPO, 2018-2033 (MILES DE USD)
TABLA 823 MERCADO DE BIOESTIMULANTES SECO EN ARGENTINA, POR TIPO, 2018-2033 (MILES DE USD)
TABLA 824 BIOESTIMULANTES SINTÉTICOS EN EL MERCADO DE BIOESTIMULANTES DE ARGENTINA, POR FORMA, 2018-2033 (MILES DE USD)
TABLA 825 MERCADO ARGENTINO DE BIOESTIMULANTES LÍQUIDOS, POR TIPO, 2018-2033 (MILES DE USD)
TABLA 826 MERCADO DE BIOESTIMULANTES SECO EN ARGENTINA, POR TIPO, 2018-2033 (MILES DE USD)
TABLA 827 MERCADO ARGENTINO DE BIOESTIMULANTES, POR FORMA, 2018-2033 (MILES DE USD)
TABLA 828 MERCADO ARGENTINO DE BIOESTIMULANTES LÍQUIDOS, POR TIPO, 2018-2033 (MILES DE USD)
TABLA 829 MERCADO DE BIOESTIMULANTES SECO EN ARGENTINA, POR TIPO, 2018-2033 (MILES DE USD)
TABLA 830 MERCADO ARGENTINO DE BIOESTIMULANTES, POR INGREDIENTES ACTIVOS, 2018-2033 (MILES DE USD)
TABLA 831 MERCADO ARGENTINO DE BIOESTIMULANTES A BASE DE ÁCIDO, POR TIPO, 2018-2033 (MILES DE USD)
TABLA 832 MERCADO ARGENTINO DE BIOESTIMULANTES A BASE DE EXTRACTO, POR TIPO, 2018-2033 (MILES DE USD)
TABLA 833 MERCADO ARGENTINO DE BIOESTIMULANTES, POR MÉTODO DE APLICACIÓN, 2018-2032 (MILES DE USD)
TABLA 834 MERCADO DE BIOESTIMULANTES EN ARGENTINA, POR CULTIVO, 2018-2033 (MILES DE USD)
TABLA 835 FRUTAS Y HORTALIZAS DE ARGENTINA EN EL MERCADO DE BIOESTIMULANTES, POR FRUTAS, 2018-2033 (MILES DE USD)
TABLA 836 ARGENTINA FRUTAS Y VERDURAS EN EL MERCADO DE BIOESTIMULANTES, POR VERDURA, 2018-2033 (MILES DE USD)
TABLA 837 MERCADO DE CEREALES Y GRANOS BIOESTIMULANTES DE ARGENTINA, POR TIPO, 2018-2033 (MILES DE USD)
TABLA 838 MERCADO DE SEMILLAS OLEAGINOSAS Y LEGUMBRES EN BIOESTIMULANTES DE ARGENTINA, POR TIPO, 2018-2033 (MILES DE USD)
TABLA 839 MERCADO DE BIOESTIMULANTES EN ARGENTINA, POR USUARIO FINAL, 2018-2033 (MILES DE USD)
TABLA 840 RESTO DEL MERCADO DE BIOESTIMULANTES DE SUDAMÉRICA, POR ORIGEN, 2018-2033 (MILES DE USD)
TABLA 841 RESTO DEL MERCADO DE BIOESTIMULANTES DE SUDAMÉRICA, POR ORIGEN, 2018-2033 (TONELADAS)
TABLA 842 RESTO DE SUDAMÉRICA BIOESTIMULANTES NATURALES EN EL MERCADO DE BIOESTIMULANTES, POR FORMA, 2018-2033 (MILES DE USD)
TABLA 843 RESTO DE SUDAMÉRICA MERCADO DE LÍQUIDOS EN BIOESTIMULANTES, POR TIPO, 2018-2033 (MILES DE USD)
TABLA 844 RESTO DE SUDAMÉRICA SECO EN EL MERCADO DE BIOESTIMULANTES, POR TIPO, 2018-2033 (MILES DE USD)
TABLA 845 RESTO DE SUDAMÉRICA BIOESTIMULANTES SINTÉTICOS EN EL MERCADO DE BIOESTIMULANTES, POR FORMA, 2018-2033 (MILES DE USD)
TABLA 846 RESTO DE SUDAMÉRICA MERCADO DE LÍQUIDOS EN BIOESTIMULANTES, POR TIPO, 2018-2033 (MILES DE USD)
TABLA 847 RESTO DE SUDAMÉRICA SECO EN EL MERCADO DE BIOESTIMULANTES, POR TIPO, 2018-2033 (MILES DE USD)
TABLA 848 RESTO DEL MERCADO DE BIOESTIMULANTES DE SUDAMÉRICA, POR FORMA, 2018-2033 (MILES DE USD)
TABLA 849 RESTO DE SUDAMÉRICA MERCADO DE LÍQUIDOS EN BIOESTIMULANTES, POR TIPO, 2018-2033 (MILES DE USD)
TABLA 850 RESTO DE SUDAMÉRICA SECO EN EL MERCADO DE BIOESTIMULANTES, POR TIPO, 2018-2033 (MILES DE USD)
TABLA 851 RESTO DEL MERCADO DE BIOESTIMULANTES DE SUDAMÉRICA, POR INGREDIENTES ACTIVOS, 2018-2033 (MILES DE USD)
TABLA 852 RESTO DE SUDAMÉRICA MERCADO DE BIOESTIMULANTES A BASE DE ÁCIDO, POR TIPO, 2018-2033 (MILES DE USD)
TABLA 853 RESTO DE SUDAMÉRICA MERCADO DE BIOESTIMULANTES A BASE DE EXTRACTOS, POR TIPO, 2018-2033 (MILES DE USD)
TABLA 854 RESTO DEL MERCADO DE BIOESTIMULANTES DE SUDAMÉRICA, POR MÉTODO DE APLICACIÓN, 2018-2032 (MILES DE USD)
TABLA 855 RESTO DE SUDAMÉRICA MERCADO DE BIOESTIMULANTES, POR CULTIVO, 2018-2033 (MILES DE USD)
TABLA 856 RESTO DE SUDAMÉRICA FRUTAS Y VERDURAS EN EL MERCADO DE BIOESTIMULANTES, POR FRUTAS, 2018-2033 (MILES DE USD)
TABLA 857 RESTO DE SUDAMÉRICA FRUTAS Y VERDURAS EN EL MERCADO DE BIOESTIMULANTES, POR VERDURA, 2018-2033 (MILES DE USD)
TABLA 858 RESTO DE AMÉRICA DEL SUR MERCADO DE CEREALES Y GRANOS EN BIOESTIMULANTES, POR TIPO, 2018-2033 (MILES DE USD)
TABLA 859 RESTO DE SUDAMÉRICA SEMILLAS OLEAGINOSAS Y LEGUMBRES EN EL MERCADO DE BIOESTIMULANTES, POR TIPO, 2018-2033 (MILES DE USD)
TABLA 860 RESTO DEL MERCADO DE BIOESTIMULANTES DE SUDAMÉRICA, POR USUARIO FINAL, 2018-2033 (MILES DE USD)
TABLA 861 MERCADO DE BIOESTIMULANTES DE ORIENTE MEDIO Y ÁFRICA, POR PAÍS, 2018-2033 (MILES DE USD)
TABLA 862 MERCADO DE BIOESTIMULANTES DE ORIENTE MEDIO Y ÁFRICA, POR PAÍS, 2018-2033 (MILES DE USD)
CUADRO 863 MERCADO DE BIOESTIMULANTES DE ORIENTE MEDIO Y ÁFRICA, POR PAÍS, 2018-2033 (TONELADAS)
TABLA 864 ORIENTE MEDIO Y ÁFRICA
TABLA 865 MERCADO DE BIOESTIMULANTES DE ORIENTE MEDIO Y ÁFRICA, POR ORIGEN, 2018-2033 (MILES DE USD)
TABLA 866 MERCADO DE BIOESTIMULANTES DE ORIENTE MEDIO Y ÁFRICA, POR ORIGEN, 2018-2033 (TONELADAS)
TABLA 867 BIOESTIMULANTES NATURALES EN EL MERCADO DE BIOESTIMULANTES DE ORIENTE MEDIO Y ÁFRICA, POR FORMA, 2018-2033 (MILES DE USD)
TABLA 868 MERCADO DE BIOESTIMULANTES LÍQUIDOS DE ORIENTE MEDIO Y ÁFRICA, POR TIPO, 2018-2033 (MILES DE USD)
TABLA 869 MERCADO DE BIOESTIMULANTES SECOS EN ORIENTE MEDIO Y ÁFRICA, POR TIPO, 2018-2033 (MILES DE USD)
TABLA 870 BIOESTIMULANTES SINTÉTICOS EN EL MERCADO DE BIOESTIMULANTES DE ORIENTE MEDIO Y ÁFRICA, POR FORMA, 2018-2033 (MILES DE USD)
TABLA 871 MERCADO DE BIOESTIMULANTES LÍQUIDOS DE ORIENTE MEDIO Y ÁFRICA, POR TIPO, 2018-2033 (MILES DE USD)
TABLA 872 MERCADO DE BIOESTIMULANTES SECOS EN ORIENTE MEDIO Y ÁFRICA, POR TIPO, 2018-2033 (MILES DE USD)
TABLA 873 MERCADO DE BIOESTIMULANTES DE ORIENTE MEDIO Y ÁFRICA, POR FORMA, 2018-2033 (MILES DE USD)
TABLA 874 MERCADO DE BIOESTIMULANTES LÍQUIDOS DE ORIENTE MEDIO Y ÁFRICA, POR TIPO, 2018-2033 (MILES DE USD)
TABLA 875 MERCADO DE BIOESTIMULANTES SECOS EN ORIENTE MEDIO Y ÁFRICA, POR TIPO, 2018-2033 (MILES DE USD)
TABLA 876 MERCADO DE BIOESTIMULANTES DE ORIENTE MEDIO Y ÁFRICA, POR INGREDIENTES ACTIVOS, 2018-2033 (MILES DE USD)
TABLA 877 MERCADO DE BIOESTIMULANTES A BASE DE ÁCIDO DE ORIENTE MEDIO Y ÁFRICA, POR TIPO, 2018-2033 (MILES DE USD)
TABLA 878 MERCADO DE BIOESTIMULANTES A BASE DE EXTRACTO DE ORIENTE MEDIO Y ÁFRICA, POR TIPO, 2018-2033 (MILES DE USD)
TABLA 879 MERCADO DE BIOESTIMULANTES DE ORIENTE MEDIO Y ÁFRICA, POR MÉTODO DE APLICACIÓN, 2018-2032 (MILES DE USD)
CUADRO 880 MERCADO DE BIOESTIMULANTES DE ORIENTE MEDIO Y ÁFRICA, POR CULTIVO, 2018-2033 (MILES DE USD)
TABLA 881 ORIENTE MEDIO Y ÁFRICA FRUTAS Y VERDURAS EN EL MERCADO DE BIOESTIMULANTES, POR FRUTAS, 2018-2033 (MILES DE USD)
TABLA 882 ORIENTE MEDIO Y ÁFRICA FRUTAS Y VERDURAS EN EL MERCADO DE BIOESTIMULANTES, POR VERDURA, 2018-2033 (MILES DE USD)
TABLA 883 MERCADO DE CEREALES Y GRANOS EN BIOESTIMULANTES DE ORIENTE MEDIO Y ÁFRICA, POR TIPO, 2018-2033 (MILES DE USD)
TABLA 884 ORIENTE MEDIO Y ÁFRICA SEMILLAS OLEAGINOSAS Y LEGUMBRES EN EL MERCADO DE BIOESTIMULANTES, POR TIPO, 2018-2033 (MILES DE USD)
TABLA 885 MERCADO DE BIOESTIMULANTES DE ORIENTE MEDIO Y ÁFRICA, POR USUARIO FINAL, 2018-2033 (MILES DE USD)
TABLA 886 MERCADO DE BIOESTIMULANTES DE SUDÁFRICA, POR ORIGEN, 2018-2033 (MILES DE USD)
TABLA 887 MERCADO DE BIOESTIMULANTES DE SUDÁFRICA, POR ORIGEN, 2018-2033 (TONELADAS)
TABLA 888 BIOESTIMULANTES NATURALES EN EL MERCADO DE BIOESTIMULANTES DE SUDÁFRICA, POR FORMA, 2018-2033 (MILES DE USD)
TABLA 889 MERCADO DE BIOESTIMULANTES LÍQUIDOS DE SUDÁFRICA, POR TIPO, 2018-2033 (MILES DE USD)
TABLA 890 MERCADO DE BIOESTIMULANTES SECO DE SUDÁFRICA, POR TIPO, 2018-2033 (MILES DE USD)
TABLA 891 BIOESTIMULANTES SINTÉTICOS EN EL MERCADO DE BIOESTIMULANTES DE SUDÁFRICA, POR FORMA, 2018-2033 (MILES DE USD)
TABLA 892 MERCADO DE BIOESTIMULANTES LÍQUIDOS DE SUDÁFRICA, POR TIPO, 2018-2033 (MILES DE USD)
TABLA 893 MERCADO DE BIOESTIMULANTES SECO DE SUDÁFRICA, POR TIPO, 2018-2033 (MILES DE USD)
TABLA 894 MERCADO DE BIOESTIMULANTES DE SUDÁFRICA, POR FORMA, 2018-2033 (MILES DE USD)
TABLA 895 MERCADO DE BIOESTIMULANTES LÍQUIDOS DE SUDÁFRICA, POR TIPO, 2018-2033 (MILES DE USD)
TABLA 896 MERCADO DE BIOESTIMULANTES SECO DE SUDÁFRICA, POR TIPO, 2018-2033 (MILES DE USD)
TABLA 897 MERCADO DE BIOESTIMULANTES DE SUDÁFRICA, POR INGREDIENTES ACTIVOS, 2018-2033 (MILES DE USD)
TABLA 898 MERCADO DE BIOESTIMULANTES A BASE DE ÁCIDO DE SUDÁFRICA, POR TIPO, 2018-2033 (MILES DE USD)
TABLA 899 MERCADO DE BIOESTIMULANTES BASADOS EN EXTRACTO DE SUDÁFRICA, POR TIPO, 2018-2033 (MILES DE USD)
CUADRO 900 MERCADO DE BIOESTIMULANTES DE SUDÁFRICA, POR MÉTODO DE APLICACIÓN, 2018-2032 (MILES DE USD)
CUADRO 901 MERCADO DE BIOESTIMULANTES DE SUDÁFRICA, POR CULTIVO, 2018-2033 (MILES DE USD)
TABLA 902 SUDÁFRICA FRUTAS Y VERDURAS EN EL MERCADO DE BIOESTIMULANTES, POR FRUTAS, 2018-2033 (MILES DE USD)
TABLA 903 SUDÁFRICA FRUTAS Y VERDURAS EN EL MERCADO DE BIOESTIMULANTES, POR VERDURA, 2018-2033 (MILES DE USD)
TABLA 904 MERCADO DE CEREALES Y GRANOS DE SUDÁFRICA EN BIOESTIMULANTES, POR TIPO, 2018-2033 (MILES DE USD)
TABLA 905 SEMILLAS OLEAGINOSAS Y LEGUMBRES EN EL MERCADO DE BIOESTIMULANTES DE SUDÁFRICA, POR TIPO, 2018-2033 (MILES DE USD)
TABLA 906 MERCADO DE BIOESTIMULANTES DE SUDÁFRICA, POR USUARIO FINAL, 2018-2033 (MILES DE USD)
TABLA 907 MERCADO DE BIOESTIMULANTES DE ARABIA SAUDITA, POR ORIGEN, 2018-2033 (MILES DE USD)
CUADRO 908 MERCADO DE BIOESTIMULANTES DE ARABIA SAUDITA, POR ORIGEN, 2018-2033 (TONELADAS)
TABLA 909 BIOESTIMULANTES NATURALES EN EL MERCADO DE BIOESTIMULANTES DE ARABIA SAUDITA, POR FORMA, 2018-2033 (MILES DE USD)
TABLA 910 MERCADO DE BIOESTIMULANTES LÍQUIDOS DE ARABIA SAUDITA, POR TIPO, 2018-2033 (MILES DE USD)
TABLA 911 ARABIA SAUDITA MERCADO DE BIOESTIMULANTES SECOS, POR TIPO, 2018-2033 (MILES DE USD)
TABLA 912 BIOESTIMULANTES SINTÉTICOS EN EL MERCADO DE BIOESTIMULANTES DE ARABIA SAUDITA, POR FORMA, 2018-2033 (MILES DE USD)
TABLA 913 MERCADO DE BIOESTIMULANTES LÍQUIDOS DE ARABIA SAUDITA, POR TIPO, 2018-2033 (MILES DE USD)
TABLA 914 MERCADO DE BIOESTIMULANTES SECOS DE ARABIA SAUDITA, POR TIPO, 2018-2033 (MILES DE USD)
TABLA 915 MERCADO DE BIOESTIMULANTES DE ARABIA SAUDITA, POR FORMA, 2018-2033 (MILES DE USD)
TABLA 916 MERCADO DE BIOESTIMULANTES LÍQUIDOS DE ARABIA SAUDITA, POR TIPO, 2018-2033 (MILES DE USD)
TABLA 917 MERCADO DE BIOESTIMULANTES SECOS DE ARABIA SAUDITA, POR TIPO, 2018-2033 (MILES DE USD)
TABLA 918 MERCADO DE BIOESTIMULANTES DE ARABIA SAUDITA, POR INGREDIENTES ACTIVOS, 2018-2033 (MILES DE USD)
TABLA 919 MERCADO DE BIOESTIMULANTES A BASE DE ÁCIDO DE ARABIA SAUDITA, POR TIPO, 2018-2033 (MILES DE USD)
TABLA 920 MERCADO DE BIOESTIMULANTES BASADOS EN EXTRACTO DE ARABIA SAUDITA, POR TIPO, 2018-2033 (MILES DE USD)
TABLA 921 MERCADO DE BIOESTIMULANTES DE ARABIA SAUDITA, POR MÉTODO DE APLICACIÓN, 2018-2032 (MILES DE USD)
CUADRO 922 MERCADO DE BIOESTIMULANTES DE ARABIA SAUDITA, POR CULTIVO, 2018-2033 (MILES DE USD)
TABLA 923 FRUTAS Y VERDURAS DE ARABIA SAUDITA EN EL MERCADO DE BIOESTIMULANTES, POR FRUTAS, 2018-2033 (MILES DE USD)
TABLA 924 ARABIA SAUDITA: FRUTAS Y VERDURAS EN EL MERCADO DE BIOESTIMULANTES, POR VERDURA, 2018-2033 (MILES DE USD)
TABLA 925 CEREALES Y GRANOS DE ARABIA SAUDITA EN EL MERCADO DE BIOESTIMULANTES, POR TIPO, 2018-2033 (MILES DE USD)
TABLA 926 ARABIA SAUDITA: MERCADO DE SEMILLAS OLEAGINOSAS Y LEGUMBRES EN BIOESTIMULANTES, POR TIPO, 2018-2033 (MILES DE USD)
TABLA 927 MERCADO DE BIOESTIMULANTES DE ARABIA SAUDITA, POR USUARIO FINAL, 2018-2033 (MILES DE USD)
TABLA 928 MERCADO DE BIOESTIMULANTES DE LOS EMIRATOS ÁRABES UNIDOS (EAU), POR ORIGEN, 2018-2033 (MILES DE USD)
TABLA 929 MERCADO DE BIOESTIMULANTES DE LOS EMIRATOS ÁRABES UNIDOS (EAU), POR ORIGEN, 2018-2033 (TONELADAS)
TABLA 930 EMIRATOS ÁRABES UNIDOS (EAU) BIOESTIMULANTES NATURALES EN EL MERCADO DE BIOESTIMULANTES, POR FORMA, 2018-2033 (MILES DE USD)
TABLA 931 EMIRATOS ÁRABES UNIDOS (EAU) MERCADO DE BIOESTIMULANTES LÍQUIDOS, POR TIPO, 2018-2033 (MILES DE USD)
TABLA 932 EMIRATOS ÁRABES UNIDOS (EAU) MERCADO DE BIOESTIMULANTES SECOS, POR TIPO, 2018-2033 (MILES DE USD)
TABLA 933 EMIRATOS ÁRABES UNIDOS (EAU) BIOESTIMULANTES SINTÉTICOS EN EL MERCADO DE BIOESTIMULANTES, POR FORMA, 2018-2033 (MILES DE USD)
TABLA 934 EMIRATOS ÁRABES UNIDOS (EAU) MERCADO DE BIOESTIMULANTES LÍQUIDOS, POR TIPO, 2018-2033 (MILES DE USD)
TABLA 935 EMIRATOS ÁRABES UNIDOS (EAU) MERCADO DE BIOESTIMULANTES SECOS, POR TIPO, 2018-2033 (MILES DE USD)
TABLA 936 MERCADO DE BIOESTIMULANTES DE LOS EMIRATOS ÁRABES UNIDOS (EAU), POR FORMA, 2018-2033 (MILES DE USD)
TABLA 937 EMIRATOS ÁRABES UNIDOS (EAU) MERCADO DE BIOESTIMULANTES LÍQUIDOS, POR TIPO, 2018-2033 (MILES DE USD)
TABLA 938 EMIRATOS ÁRABES UNIDOS (EAU) MERCADO DE BIOESTIMULANTES SECOS, POR TIPO, 2018-2033 (MILES DE USD)
TABLA 939 MERCADO DE BIOESTIMULANTES DE LOS EMIRATOS ÁRABES UNIDOS (EAU), POR INGREDIENTES ACTIVOS, 2018-2033 (MILES DE USD)
TABLA 940 EMIRATOS ÁRABES UNIDOS (EAU) MERCADO DE BIOESTIMULANTES A BASE DE ÁCIDO, POR TIPO, 2018-2033 (MILES DE USD)
TABLA 941 EMIRATOS ÁRABES UNIDOS (EAU) MERCADO DE BIOESTIMULANTES A BASE DE EXTRACTO, POR TIPO, 2018-2033 (MILES DE USD)
TABLA 942 MERCADO DE BIOESTIMULANTES DE LOS EMIRATOS ÁRABES UNIDOS (EAU), POR MÉTODO DE APLICACIÓN, 2018-2032 (MILES DE USD)
TABLA 943 MERCADO DE BIOESTIMULANTES DE LOS EMIRATOS ÁRABES UNIDOS (EAU), POR CULTIVO, 2018-2033 (MILES DE USD)
TABLA 944 EMIRATOS ÁRABES UNIDOS (EAU) FRUTAS Y VERDURAS EN EL MERCADO DE BIOESTIMULANTES, POR FRUTAS, 2018-2033 (MILES DE USD)
TABLA 945 EMIRATOS ÁRABES UNIDOS (EAU) FRUTAS Y VERDURAS EN EL MERCADO DE BIOESTIMULANTES, POR VERDURA, 2018-2033 (MILES DE USD)
TABLA 946 EMIRATOS ÁRABES UNIDOS (EAU) MERCADO DE CEREALES Y GRANOS EN BIOESTIMULANTES, POR TIPO, 2018-2033 (MILES DE USD)
TABLA 947 EMIRATOS ÁRABES UNIDOS (EAU) SEMILLAS OLEAGINOSAS Y LEGUMBRES EN EL MERCADO DE BIOESTIMULANTES, POR TIPO, 2018-2033 (MILES DE USD)
TABLA 948 MERCADO DE BIOESTIMULANTES DE LOS EMIRATOS ÁRABES UNIDOS (EAU), POR USUARIO FINAL, 2018-2033 (MILES DE USD)
TABLA 949 MERCADO DE BIOESTIMULANTES DE EGIPTO, POR ORIGEN, 2018-2033 (MILES DE USD)
TABLA 950 MERCADO DE BIOESTIMULANTES DE EGIPTO, POR ORIGEN, 2018-2033 (TONELADAS)
TABLA 951 BIOESTIMULANTES NATURALES DE EGIPTO EN EL MERCADO DE BIOESTIMULANTES, POR FORMA, 2018-2033 (MILES DE USD)
TABLA 952 MERCADO DE BIOESTIMULANTES LÍQUIDOS EN EGIPTO, POR TIPO, 2018-2033 (MILES DE USD)
TABLA 953 MERCADO DE BIOESTIMULANTES SECO DE EGIPTO, POR TIPO, 2018-2033 (MILES DE USD)
TABLA 954 BIOESTIMULANTES SINTÉTICOS DE EGIPTO EN EL MERCADO DE BIOESTIMULANTES, POR FORMA, 2018-2033 (MILES DE USD)
TABLA 955 MERCADO DE BIOESTIMULANTES LÍQUIDOS EN EGIPTO, POR TIPO, 2018-2033 (MILES DE USD)
TABLA 956 MERCADO DE BIOESTIMULANTES SECO DE EGIPTO, POR TIPO, 2018-2033 (MILES DE USD)
TABLA 957 MERCADO DE BIOESTIMULANTES DE EGIPTO, POR FORMA, 2018-2033 (MILES DE USD)
TABLA 958 MERCADO DE BIOESTIMULANTES LÍQUIDOS EN EGIPTO, POR TIPO, 2018-2033 (MILES DE USD)
TABLA 959 EGIPTO SECO EN EL MERCADO DE BIOESTIMULANTES, POR TIPO, 2018-2033 (MILES DE USD)
TABLA 960 MERCADO DE BIOESTIMULANTES DE EGIPTO, POR INGREDIENTES ACTIVOS, 2018-2033 (MILES DE USD)
TABLA 961 MERCADO DE BIOESTIMULANTES A BASE DE ÁCIDO DE EGIPTO, POR TIPO, 2018-2033 (MILES DE USD)
TABLA 962 MERCADO DE BIOESTIMULANTES A BASE DE EXTRACTO DE EGIPTO, POR TIPO, 2018-2033 (MILES DE USD)
TABLA 963 MERCADO DE BIOESTIMULANTES DE EGIPTO, POR MÉTODO DE APLICACIÓN, 2018-2032 (MILES DE USD)
TABLA 964 MERCADO DE BIOESTIMULANTES DE EGIPTO, POR CULTIVO, 2018-2033 (MILES DE USD)
TABLA 965 EGIPTO FRUTAS Y VERDURAS EN EL MERCADO DE BIOESTIMULANTES, POR FRUTAS, 2018-2033 (MILES DE USD)
TABLA 966 EGIPTO FRUTAS Y VERDURAS EN EL MERCADO DE BIOESTIMULANTES, POR VERDURA, 2018-2033 (MILES DE USD)
TABLA 967 EGIPTO CEREALES Y GRANOS EN EL MERCADO DE BIOESTIMULANTES, POR TIPO, 2018-2033 (MILES DE USD)
TABLA 968 SEMILLAS OLEAGINOSAS Y LEGUMBRES EN EL MERCADO DE BIOESTIMULANTES DE EGIPTO, POR TIPO, 2018-2033 (MILES DE USD)
TABLA 969 MERCADO DE BIOESTIMULANTES DE EGIPTO, POR USUARIO FINAL, 2018-2033 (MILES DE USD)
TABLA 970 MERCADO DE BIOESTIMULANTES DE ISRAEL, POR ORIGEN, 2018-2033 (MILES DE USD)
TABLA 971 MERCADO DE BIOESTIMULANTES DE ISRAEL, POR ORIGEN, 2018-2033 (TONELADAS)
TABLA 972 BIOESTIMULANTES NATURALES DE ISRAEL EN EL MERCADO DE BIOESTIMULANTES, POR FORMA, 2018-2033 (MILES DE USD)
TABLA 973 MERCADO DE BIOESTIMULANTES LÍQUIDOS DE ISRAEL, POR TIPO, 2018-2033 (MILES DE USD)
TABLA 974 MERCADO DE BIOESTIMULANTES SECOS DE ISRAEL, POR TIPO, 2018-2033 (MILES DE USD)
TABLA 975 BIOESTIMULANTES SINTÉTICOS DE ISRAEL EN EL MERCADO DE BIOESTIMULANTES, POR FORMA, 2018-2033 (MILES DE USD)
TABLA 976 MERCADO DE BIOESTIMULANTES LÍQUIDOS DE ISRAEL, POR TIPO, 2018-2033 (MILES DE USD)
TABLA 977 MERCADO DE BIOESTIMULANTES SECOS DE ISRAEL, POR TIPO, 2018-2033 (MILES DE USD)
TABLA 978 MERCADO DE BIOESTIMULANTES DE ISRAEL, POR FORMA, 2018-2033 (MILES DE USD)
TABLA 979 MERCADO DE BIOESTIMULANTES LÍQUIDOS DE ISRAEL, POR TIPO, 2018-2033 (MILES DE USD)
TABLA 980 MERCADO DE BIOESTIMULANTES SECOS DE ISRAEL, POR TIPO, 2018-2033 (MILES DE USD)
TABLA 981 MERCADO DE BIOESTIMULANTES DE ISRAEL, POR INGREDIENTES ACTIVOS, 2018-2033 (MILES DE USD)
TABLA 982 MERCADO DE BIOESTIMULANTES A BASE DE ÁCIDO DE ISRAEL, POR TIPO, 2018-2033 (MILES DE USD)
TABLA 983 MERCADO DE BIOESTIMULANTES A BASE DE EXTRACTO DE ISRAEL, POR TIPO, 2018-2033 (MILES DE USD)
TABLA 984 MERCADO DE BIOESTIMULANTES DE ISRAEL, POR MÉTODO DE APLICACIÓN, 2018-2032 (MILES DE USD)
TABLA 985 MERCADO DE BIOESTIMULANTES DE ISRAEL, POR CULTIVO, 2018-2033 (MILES DE USD)
TABLA 986 FRUTAS Y VERDURAS DE ISRAEL EN EL MERCADO DE BIOESTIMULANTES, POR FRUTAS, 2018-2033 (MILES DE USD)
TABLA 987 FRUTAS Y VERDURAS DE ISRAEL EN EL MERCADO DE BIOESTIMULANTES, POR VERDURA, 2018-2033 (MILES DE USD)
TABLA 988 CEREALES Y GRANOS DE ISRAEL EN EL MERCADO DE BIOESTIMULANTES, POR TIPO, 2018-2033 (MILES DE USD)
TABLA 989 SEMILLAS OLEAGINOSAS Y LEGUMBRES EN EL MERCADO DE BIOESTIMULANTES DE ISRAEL, POR TIPO, 2018-2033 (MILES DE USD)
TABLA 990 MERCADO DE BIOESTIMULANTES DE ISRAEL, POR USUARIO FINAL, 2018-2033 (MILES DE USD)
TABLA 991 RESTO DEL MERCADO DE BIOESTIMULANTES DE ORIENTE MEDIO Y ÁFRICA, POR ORIGEN, 2018-2033 (MILES DE USD)
TABLA 992 RESTO DEL MERCADO DE BIOESTIMULANTES DE ORIENTE MEDIO Y ÁFRICA, POR ORIGEN, 2018-2033 (TONELADAS)
TABLA 993 RESTO DE ORIENTE MEDIO Y ÁFRICA BIOESTIMULANTES NATURALES EN EL MERCADO DE BIOESTIMULANTES, POR FORMA, 2018-2033 (MILES DE USD)
TABLA 994 RESTO DEL MERCADO DE BIOESTIMULANTES LÍQUIDOS DE ORIENTE MEDIO Y ÁFRICA, POR TIPO, 2018-2033 (MILES DE USD)
TABLA 995 RESTO DE ORIENTE MEDIO Y ÁFRICA MERCADO DE BIOESTIMULANTES SECOS, POR TIPO, 2018-2033 (MILES DE USD)
TABLA 996 RESTO DE ORIENTE MEDIO Y ÁFRICA BIOESTIMULANTES SINTÉTICOS EN EL MERCADO DE BIOESTIMULANTES, POR FORMA, 2018-2033 (MILES DE USD)
TABLA 997 RESTO DEL MERCADO DE BIOESTIMULANTES LÍQUIDOS DE ORIENTE MEDIO Y ÁFRICA, POR TIPO, 2018-2033 (MILES DE USD)
TABLA 998 RESTO DE ORIENTE MEDIO Y ÁFRICA MERCADO DE BIOESTIMULANTES SECOS, POR TIPO, 2018-2033 (MILES DE USD)
TABLA 999 RESTO DEL MERCADO DE BIOESTIMULANTES DE ORIENTE MEDIO Y ÁFRICA, POR FORMA, 2018-2033 (MILES DE USD)
TABLA 1000 RESTO DEL MERCADO DE BIOESTIMULANTES LÍQUIDOS DE ORIENTE MEDIO Y ÁFRICA, POR TIPO, 2018-2033 (MILES DE USD)
TABLA 1001 RESTO DE ORIENTE MEDIO Y ÁFRICA MERCADO DE BIOESTIMULANTES SECOS, POR TIPO, 2018-2033 (MILES DE USD)
TABLA 1002 RESTO DEL MERCADO DE BIOESTIMULANTES DE ORIENTE MEDIO Y ÁFRICA, POR INGREDIENTES ACTIVOS, 2018-2033 (MILES DE USD)
TABLA 1003 RESTO DEL MERCADO DE BIOESTIMULANTES A BASE DE ÁCIDO EN ORIENTE MEDIO Y ÁFRICA, POR TIPO, 2018-2033 (MILES DE USD)
TABLA 1004 RESTO DEL MERCADO DE BIOESTIMULANTES BASADOS EN EXTRACTO DE ORIENTE MEDIO Y ÁFRICA, POR TIPO, 2018-2033 (MILES DE USD)
TABLA 1005 RESTO DEL MERCADO DE BIOESTIMULANTES DE ORIENTE MEDIO Y ÁFRICA, POR MÉTODO DE APLICACIÓN, 2018-2032 (MILES DE USD)
TABLA 1006 RESTO DEL MERCADO DE BIOESTIMULANTES DE ORIENTE MEDIO Y ÁFRICA, POR CULTIVO, 2018-2033 (MILES DE USD)
TABLA 1007 RESTO DE ORIENTE MEDIO Y ÁFRICA FRUTAS Y VERDURAS EN EL MERCADO DE BIOESTIMULANTES, POR FRUTAS, 2018-2033 (MILES DE USD)
TABLA 1008 RESTO DE ORIENTE MEDIO Y ÁFRICA FRUTAS Y VERDURAS EN EL MERCADO DE BIOESTIMULANTES, POR VERDURA, 2018-2033 (MILES DE USD)
TABLA 1009 RESTO DEL MERCADO DE CEREALES Y GRANOS EN BIOESTIMULANTES DE ORIENTE MEDIO Y ÁFRICA, POR TIPO, 2018-2033 (MILES DE USD)
TABLA 1010 RESTO DEL MERCADO DE SEMILLAS OLEAGINOSAS Y LEGUMBRES EN BIOESTIMULANTES DE ORIENTE MEDIO Y ÁFRICA, POR TIPO, 2018-2033 (MILES DE USD)
TABLA 1011 RESTO DEL MERCADO DE BIOESTIMULANTES DE ORIENTE MEDIO Y ÁFRICA, POR USUARIO FINAL, 2018-2033 (MILES DE USD)
Lista de figuras
FIGURA 1 MERCADO GLOBAL DE BIOESTIMULANTES: SEGMENTACIÓN
FIGURA 2 MERCADO GLOBAL DE BIOESTIMULANTES: TRIANGULACIÓN DE DATOS
FIGURA 3 MERCADO GLOBAL DE BIOESTIMULANTES: ANÁLISIS DROC
FIGURA 4 MERCADO GLOBAL DE BIOESTIMULANTES: ANÁLISIS DEL MERCADO GLOBAL VS. REGIONAL
FIGURA 5 MERCADO GLOBAL DE BIOESTIMULANTES: ANÁLISIS DE INVESTIGACIÓN DE EMPRESAS
FIGURA 6 MERCADO MUNDIAL DE BIOESTIMULANTES: DATOS DEMOGRÁFICOS DE LAS ENTREVISTAS
FIGURA 7 MERCADO GLOBAL DE BIOESTIMULANTES: CUADRÍCULA DE POSICIÓN DE MERCADO DE DBMR
FIGURA 8 MERCADO GLOBAL DE BIOESTIMULANTES: ANÁLISIS DE LA PARTICIPACIÓN DE LOS PROVEEDORES
FIGURA 9 MERCADO GLOBAL DE BIOESTIMULANTES: MODELADO MULTIVARIADO
FIGURA 10 MERCADO GLOBAL DE BIOESTIMULANTES: CURVA DE CRONOLOGÍA POR TIPO
FIGURA 11 MERCADO MUNDIAL DE BIOESTIMULANTES: CUADRÍCULA DE COBERTURA DEL USUARIO FINAL
FIGURA 12 MERCADO GLOBAL DE BIOESTIMULANTES: SEGMENTACIÓN
FIGURA 13 DOS SEGMENTOS COMPRENDEN EL MERCADO MUNDIAL DE BIOESTIMULANTES, POR ORIGEN (2025)
FIGURA 14 MERCADO MUNDIAL DE BIOESTIMULANTES: RESUMEN EJECUTIVO
FIGURA 15 DECISIONES ESTRATÉGICAS
FIGURA 16 LA AUMENTO DE LA FRECUENCIA DEL ESTRÉS DE LOS CULTIVOS RELACIONADO CON EL CLIMA, COMO LAS SEQUÍAS, LAS INUNDACIONES Y LAS OLAS DE CALOR, ESTÁ IMPULSANDO A LOS AGRICULTORES A ADOPTAR BIOESTIMULANTES PARA MANTENER EL RENDIMIENTO Y LA CALIDAD DE LOS CULTIVOS. SE ESPERA QUE IMPULSE EL MERCADO MUNDIAL DE BIOESTIMULANTES DURANTE EL PERÍODO DE PRONÓSTICO DE 2026 A 2033.
FIGURA 17 SE ESPERA QUE EL SEGMENTO DE ORIGEN REPRESENTE LA MAYOR PARTICIPACIÓN DEL MERCADO MUNDIAL DE BIOESTIMULANTES EN 2026 Y 2033
FIGURA 18 SE ESPERA QUE EUROPA SEA LA REGIÓN DOMINANTE Y DE MÁS RÁPIDO CRECIMIENTO EN EL MERCADO MUNDIAL DE BIOESTIMULANTES EN EL PERÍODO PRONOSTICADO DE 2025 A 2032
FIGURA 19 EUROPA, LA REGIÓN DE MÁS RÁPIDO CRECIMIENTO DEL MERCADO MUNDIAL DE BIOESTIMULANTES EN EL PERÍODO DE PRONÓSTICO DE 2025 A 2032
FIGURA 20 ANÁLISIS DE LAS CINCO FUERZAS DE PORTER
FIGURA 21 ANÁLISIS DE PRECIOS (2018-2033)
FIGURA 22 ANÁLISIS DE PATENTES POR SOLICITANTES
FIGURA 23 ANÁLISIS DE PATENTES POR PAÍS
FIGURA 24 ANÁLISIS DE PATENTES POR AÑO
FIGURA 25 CUADRANTE DE EVALUACIÓN DE EMPRESAS
FIGURA 26 IMPULSORES, RESTRICCIONES, OPORTUNIDADES Y DESAFÍOS DEL MERCADO GLOBAL DE BIOESTIMULANTES
FIGURA 27 MERCADO MUNDIAL DE BIOESTIMULANTES: POR ORIGEN, 2025
FIGURA 28 MERCADO MUNDIAL DE BIOESTIMULANTES: POR FORMA, 2025
FIGURA 29 MERCADO MUNDIAL DE BIOESTIMULANTES: POR INGREDIENTES ACTIVOS, 2025
FIGURA 30 MERCADO MUNDIAL DE BIOESTIMULANTES: POR CULTIVO, 2025
FIGURA 31 MERCADO MUNDIAL DE BIOESTIMULANTES: POR MÉTODO DE APLICACIÓN, 2024
FIGURA 32 MERCADO MUNDIAL DE BIOESTIMULANTES: POR USUARIO FINAL, 2025
FIGURA 33 MERCADO MUNDIAL DE BIOESTIMULANTES: INSTANTÁNEA
FIGURA 34 MERCADO EUROPEO DE BIOESTIMULANTES: INSTANTÁNEA
FIGURA 35 MERCADO DE BIOESTIMULANTES DE AMÉRICA DEL NORTE, INSTANTÁNEA (2025)
FIGURA 36 MERCADO DE BIOESTIMULANTES DE ASIA PACÍFICO, INSTANTÁNEA (2025)
FIGURA 37 MERCADO DE BIOESTIMULANTES DE AMÉRICA DEL SUR, INSTANTÁNEA (2025)
FIGURA 38 MERCADO DE BIOESTIMULANTES DE ORIENTE MEDIO Y ÁFRICA, INSTANTÁNEA (2025)
FIGURA 39 MERCADO MUNDIAL DE BIOESTIMULANTES: PARTICIPACIÓN DE LA EMPRESA 2025 (%)
FIGURA 40 MERCADO DE BIOESTIMULANTES DE ASIA-PACÍFICO: PARTICIPACIÓN DE LA EMPRESA 2025 (%)
FIGURA 41 MERCADO DE BIOESTIMULANTES DE AMÉRICA DEL NORTE: PARTICIPACIÓN DE LA EMPRESA 2025 (%)
FIGURA 42 MERCADO EUROPEO DE BIOESTIMULANTES: CUOTA DE LA EMPRESA 2025 (%)
Metodología de investigación
La recopilación de datos y el análisis del año base se realizan utilizando módulos de recopilación de datos con muestras de gran tamaño. La etapa incluye la obtención de información de mercado o datos relacionados a través de varias fuentes y estrategias. Incluye el examen y la planificación de todos los datos adquiridos del pasado con antelación. Asimismo, abarca el examen de las inconsistencias de información observadas en diferentes fuentes de información. Los datos de mercado se analizan y estiman utilizando modelos estadísticos y coherentes de mercado. Además, el análisis de la participación de mercado y el análisis de tendencias clave son los principales factores de éxito en el informe de mercado. Para obtener más información, solicite una llamada de un analista o envíe su consulta.
La metodología de investigación clave utilizada por el equipo de investigación de DBMR es la triangulación de datos, que implica la extracción de datos, el análisis del impacto de las variables de datos en el mercado y la validación primaria (experto en la industria). Los modelos de datos incluyen cuadrícula de posicionamiento de proveedores, análisis de línea de tiempo de mercado, descripción general y guía del mercado, cuadrícula de posicionamiento de la empresa, análisis de patentes, análisis de precios, análisis de participación de mercado de la empresa, estándares de medición, análisis global versus regional y de participación de proveedores. Para obtener más información sobre la metodología de investigación, envíe una consulta para hablar con nuestros expertos de la industria.
Personalización disponible
Data Bridge Market Research es líder en investigación formativa avanzada. Nos enorgullecemos de brindar servicios a nuestros clientes existentes y nuevos con datos y análisis que coinciden y se adaptan a sus objetivos. El informe se puede personalizar para incluir análisis de tendencias de precios de marcas objetivo, comprensión del mercado de países adicionales (solicite la lista de países), datos de resultados de ensayos clínicos, revisión de literatura, análisis de mercado renovado y base de productos. El análisis de mercado de competidores objetivo se puede analizar desde análisis basados en tecnología hasta estrategias de cartera de mercado. Podemos agregar tantos competidores sobre los que necesite datos en el formato y estilo de datos que esté buscando. Nuestro equipo de analistas también puede proporcionarle datos en archivos de Excel sin procesar, tablas dinámicas (libro de datos) o puede ayudarlo a crear presentaciones a partir de los conjuntos de datos disponibles en el informe.

