Global Flat Glass Market
Tamaño del mercado en miles de millones de dólares
Tasa de crecimiento anual compuesta (CAGR) :
% 
 USD
240.52 Billion
USD
422.62 Billion
2024
2032
USD
240.52 Billion
USD
422.62 Billion
2024
2032
| 2025 –2032 | |
| USD 240.52 Billion | |
| USD 422.62 Billion | |
| % | |
|
Segmentación del mercado global de vidrio plano por tipo (vidrio flotado, vidrio extraclaro, vidrio transparente, vidrio fundido, vidrio tintado, vidrio armado, vidrio plano especial, vidrio estampado o texturizado, vidrio plano soplado, entre otros), función (vidrio con filtro UV, vidrio con aislamiento térmico, vidrio de seguridad, vidrio insonorizado, vidrio autolimpiable, vidrio de intercambio iónico, entre otros), producto (con y sin recubrimiento), aplicación (construcción, automoción, aeroespacial, electrodomésticos, energía solar, mobiliario, entre otros): tendencias y pronóstico del sector hasta 2032.
Tamaño del mercado del vidrio plano
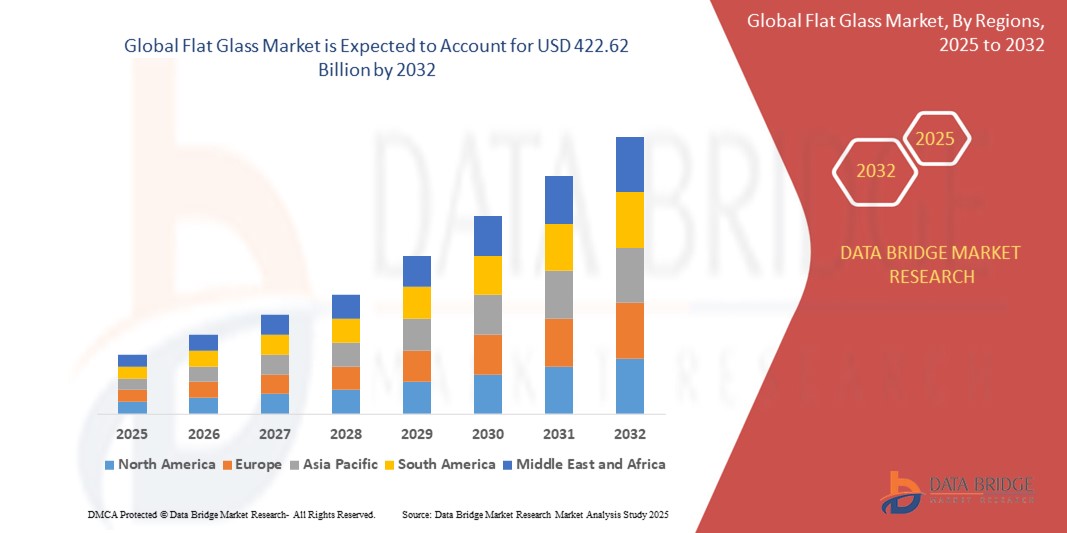
- El tamaño del mercado global de vidrio plano se valoró en USD 240,52 mil millones en 2024 y se espera que alcance los USD 422,62 mil millones para 2032 , con una CAGR del 7,3% durante el período de pronóstico.
- El crecimiento del mercado está impulsado en gran medida por la creciente demanda de los sectores de la construcción, la automoción y la energía solar, impulsada por mayores inversiones en el desarrollo de infraestructura y edificios energéticamente eficientes a nivel mundial.
- Además, el cambio hacia edificios ecológicos y ciudades inteligentes está impulsando la adopción de productos de vidrio plano de alto rendimiento con mayor durabilidad, aislamiento y características de control solar.
Análisis del mercado del vidrio plano
- El mercado está experimentando un impulso significativo debido a la creciente adopción de sistemas de acristalamiento avanzados que mejoran el aislamiento térmico y las características de seguridad en edificios residenciales y comerciales.
- Los avances tecnológicos como el vidrio inteligente, el vidrio laminado y el vidrio recubierto están ganando popularidad en múltiples industrias, incluidas el transporte y la energía renovable.
- Asia-Pacífico dominó el mercado del vidrio plano con la mayor participación en los ingresos del 42,87 % en 2024, impulsada por sólidas actividades de construcción, el aumento de la producción automotriz y la expansión de iniciativas de energía solar en países como China e India.
- Se espera que la región de Europa sea testigo de la tasa de crecimiento más alta en el mercado mundial de vidrio plano, impulsada por estrictas regulaciones de eficiencia energética, un rápido desarrollo de infraestructura y la creciente adopción de materiales de construcción sustentables en países como Alemania, Francia y el Reino Unido.
- El segmento del vidrio flotado dominó el mercado con la mayor participación en los ingresos, con un 46,3%, en 2024, gracias a su versatilidad, rentabilidad y amplia aplicación en los sectores de la construcción y la automoción. El vidrio flotado es ampliamente preferido por su espesor uniforme, superficie lisa y facilidad de procesamiento en vidrio laminado o templado, lo que mejora su utilidad en puertas, ventanas y fachadas. Su compatibilidad con una amplia gama de recubrimientos y acabados refuerza aún más su demanda en aplicaciones arquitectónicas y solares.
Alcance del informe y segmentación del mercado de vidrio plano
|
Atributos |
Perspectivas clave del mercado del vidrio plano |
|
Segmentos cubiertos |
|
|
Países cubiertos |
América del norte
Europa
Asia-Pacífico
Oriente Medio y África
Sudamerica
|
|
Actores clave del mercado |
|
|
Oportunidades de mercado |
|
|
Conjuntos de información de datos de valor añadido |
Además de los conocimientos sobre escenarios de mercado como valor de mercado, tasa de crecimiento, segmentación, cobertura geográfica y actores principales, los informes de mercado seleccionados por Data Bridge Market Research también incluyen análisis de importación y exportación, descripción general de la capacidad de producción, análisis del consumo de producción, análisis de tendencias de precios, escenario de cambio climático, análisis de la cadena de suministro, análisis de la cadena de valor, descripción general de materias primas/consumibles, criterios de selección de proveedores, análisis PESTLE, análisis de Porter y marco regulatorio. |
Tendencias del mercado del vidrio plano
Creciente adopción de vidrio de bajo consumo energético y con control solar
- Aumento del uso de vidrio Low-E y de control solar en edificios modernos para reducir el consumo de energía
- Los gobiernos exigen el uso de materiales de construcción que ahorren energía para cumplir con los estándares ambientales
- Aumento de la instalación de vidrio inteligente en edificios comerciales y vehículos para una mejor regulación térmica
- Demanda impulsada por la necesidad de reducir el consumo de electricidad relacionado con HVAC en hogares y oficinas
- Certificaciones de sostenibilidad como LEED que fomentan el uso de soluciones avanzadas de vidrio plano
- Por ejemplo, la Directiva sobre el rendimiento energético de los edificios de Europa exige el uso de vidrio de bajo consumo energético en todos los nuevos proyectos de construcción, lo que promueve el crecimiento de la demanda de control solar y vidrio de baja emisividad en toda la región.
Dinámica del mercado del vidrio plano
Conductor
“Aumento de la demanda en la industria de la construcción”
- El crecimiento de la población urbana y las mejoras en el estilo de vida impulsan la construcción en las economías emergentes
- Aumento de la demanda de vidrio plano en fachadas, puertas, mamparas y ventanas en proyectos comerciales
- El uso de vidrio templado, laminado y aislante aumenta en diseños de edificios energéticamente eficientes
- Los proyectos de infraestructura gubernamental impulsan la necesidad de materiales sostenibles y estéticos
- Los arquitectos y constructores prefieren el vidrio plano por su apariencia moderna y rendimiento térmico.
- Por ejemplo, la Misión de Ciudades Inteligentes de la India ha aumentado significativamente el uso de materiales de vidrio modernos en desarrollos residenciales y de infraestructura urbana en ciudades de nivel 1 y nivel 2.
Restricción/Desafío
Volatilidad en los costos de las materias primas y la energía
- Alto costo y disponibilidad limitada de materias primas como carbonato de sodio y arena de sílice
- La producción de vidrio plano implica procesos que consumen mucha energía y son vulnerables a las fluctuaciones del precio del combustible.
- El aumento de los precios de la electricidad y el gas incrementa los gastos operativos y logísticos
- La volatilidad de los precios afecta la rentabilidad del fabricante y conduce a precios inconsistentes de los productos.
- Riesgos de interrupción de la producción debido a choques externos, como crisis energéticas o retrasos en la cadena de suministro
- Por ejemplo, durante la crisis energética europea de 2022, muchos fabricantes de vidrio redujeron temporalmente la producción debido a los precios insostenibles de la electricidad y el gas, lo que afectó el suministro regional y la estabilidad de los precios.
Alcance del mercado del vidrio plano
El mercado del vidrio plano está segmentado en cuatro segmentos notables según el tipo, la función, el producto y la aplicación.
• Por tipo
Según el tipo, el mercado del vidrio plano se segmenta en vidrio flotado, vidrio extraclaro, vidrio transparente, vidrio fundido, vidrio tintado, vidrio armado, vidrio plano especial, vidrio estampado o texturizado, vidrio plano soplado, entre otros. El segmento del vidrio flotado dominó el mercado con la mayor participación en los ingresos, con un 46,3%, en 2024, gracias a su versatilidad, rentabilidad y amplia aplicación en los sectores de la construcción y la automoción. El vidrio flotado es ampliamente utilizado por su espesor uniforme, superficie lisa y facilidad de procesamiento en vidrio laminado o templado, lo que mejora su utilidad en puertas, ventanas y fachadas. Su compatibilidad con una amplia gama de recubrimientos y acabados refuerza aún más su demanda en aplicaciones arquitectónicas y solares.
Se prevé que el segmento de vidrio tintado experimente el mayor crecimiento entre 2025 y 2032, impulsado por la creciente demanda de soluciones energéticamente eficientes y diseños arquitectónicos estéticos. El vidrio tintado ofrece ventajas como la reducción del calor solar, el control del deslumbramiento y la protección UV, lo que lo hace ideal tanto para edificios comerciales como residenciales. Con la creciente conciencia ambiental y el énfasis en las certificaciones de construcción ecológica, la adopción del vidrio tintado está ganando terreno entre promotores y propietarios de viviendas.
• Por función
En función de su función, el mercado del vidrio plano se segmenta en vidrio con filtro UV, vidrio con aislamiento térmico, vidrio de seguridad, vidrio insonorizado, vidrio autolimpiable, vidrio de intercambio iónico, entre otros. El segmento de vidrio de seguridad registró la mayor participación en los ingresos del mercado en 2024, principalmente debido a su amplio uso en parabrisas de automóviles, fachadas comerciales y ventanas de seguridad residenciales. El vidrio de seguridad, incluyendo sus variantes templadas y laminadas, es valorado por su resistencia a los impactos y su cumplimiento con las normas de seguridad en la construcción.
Se prevé que el segmento del vidrio autolimpiable experimente el mayor crecimiento entre 2025 y 2032, impulsado por la creciente demanda de soluciones de bajo mantenimiento en la arquitectura moderna. Este tipo de vidrio utiliza recubrimientos hidrófilos y fotocatalíticos para descomponer la suciedad orgánica y permitir que el agua de lluvia la arrastre, reduciendo así la necesidad de limpieza manual. Se espera que las aplicaciones en edificios de gran altura y paneles solares aumenten aún más su cuota de mercado.
• Por producto
Según el producto, el mercado se segmenta en vidrio con y sin recubrimiento. El segmento con recubrimiento obtuvo la mayor participación en los ingresos en 2024, impulsado por su creciente aplicación en ventanas de bajo consumo, sistemas de control solar y tecnologías de acristalamiento inteligente. El vidrio con recubrimiento ofrece ventajas como mejor aislamiento, reflectividad solar y una estética mejorada, lo que lo convierte en la opción preferida tanto en entornos comerciales como residenciales.
Se espera que el segmento sin recubrimiento experimente la tasa de crecimiento más rápida entre 2025 y 2032, respaldado por su uso en diseño de interiores, muebles y aplicaciones donde la transparencia y la mínima distorsión de la luz son esenciales.
• Por aplicación
Según su aplicación, el mercado del vidrio plano se segmenta en edificación y construcción, automoción, aeroespacial, electrodomésticos, energía solar, mobiliario, entre otros. Este segmento dominó el mercado en 2024, con la mayor participación en los ingresos, impulsado por la rápida urbanización, el aumento de la inversión en infraestructura y la creciente popularidad de los edificios ecológicos. El vidrio plano se utiliza ampliamente en puertas, fachadas, claraboyas, mamparas y sistemas de acristalamiento.
Se prevé que el sector de la energía solar experimente su mayor crecimiento entre 2025 y 2032, impulsado por la transición global hacia las energías renovables y la creciente instalación de paneles fotovoltaicos. El vidrio plano es esencial en los paneles solares debido a su eficiencia de transmisión de luz, durabilidad y capacidad de protección.
Análisis regional del mercado del vidrio plano
• Asia-Pacífico dominó el mercado del vidrio plano con la mayor participación en los ingresos del 42,87 % en 2024, impulsada por sólidas actividades de construcción, el aumento de la producción automotriz y la expansión de iniciativas de energía solar en países como China e India.
• La rápida industrialización de la región, junto con el creciente desarrollo de infraestructura y la demanda de vivienda urbana, ha impulsado significativamente el consumo de vidrio plano en edificios comerciales y residenciales.
• Además, el apoyo gubernamental a proyectos de energía renovable y la creciente adopción de materiales de construcción energéticamente eficientes están acelerando la penetración en el mercado de tecnologías de vidrio avanzadas como el vidrio de baja emisividad y el vidrio de control solar.
Perspectiva del mercado del vidrio plano en China
El mercado chino de vidrio plano registró la mayor participación en ingresos en Asia-Pacífico en 2024, impulsado por la enorme demanda de los sectores de la construcción y la automoción. Los ambiciosos programas de infraestructura de China, que incluyen desarrollos de ciudades inteligentes y edificios ecológicos, están impulsando la demanda de vidrio plano energéticamente eficiente. Además, China es líder mundial en la producción de paneles fotovoltaicos, que depende en gran medida del vidrio plano de alta transparencia y durabilidad, lo que impulsa aún más el crecimiento del mercado.
Perspectiva del mercado del vidrio plano en Japón
Se prevé que el mercado japonés de vidrio plano experimente su mayor crecimiento entre 2025 y 2032, gracias a la avanzada infraestructura tecnológica del país y su enfoque en el desarrollo urbano sostenible. El fuerte énfasis de Japón en la eficiencia energética y las prácticas de construcción ecológicas impulsa la demanda de vidrio de baja emisividad, con filtro UV y aislante, tanto en la construcción residencial como comercial.
Perspectiva del mercado de vidrio plano en América del Norte
Se prevé que el mercado norteamericano de vidrio plano experimente su mayor crecimiento entre 2025 y 2032, impulsado por la creciente demanda de los sectores automotriz y de la construcción. Los consumidores de la región buscan cada vez más soluciones de vidrio avanzadas que ofrezcan aislamiento térmico y protección UV. La transición hacia certificaciones de edificios sostenibles y la creciente integración de tecnologías solares en entornos comerciales y residenciales impulsan aún más la adopción del vidrio plano.
Perspectiva del mercado del vidrio plano en EE. UU.
El mercado estadounidense de vidrio plano captó la mayor participación en los ingresos de Norteamérica en 2024, impulsado por una combinación de apoyo regulatorio para materiales de construcción energéticamente eficientes y una creciente concienciación de los consumidores sobre la arquitectura sostenible. La demanda del sector automotriz de vidrio ligero y de seguridad, sumada al creciente despliegue de paneles solares, también está impulsando la demanda de vidrios planos especializados. Estados Unidos también está experimentando un aumento de la inversión en I+D para producir vidrio inteligente y autolimpiable que mejore la eficiencia de los edificios.
Perspectiva del mercado europeo del vidrio plano
Se prevé que el mercado europeo del vidrio plano experimente su mayor crecimiento entre 2025 y 2032, gracias a las estrictas normativas ambientales y al creciente énfasis en las prácticas de construcción sostenible. La demanda de acristalamiento de seguridad y vidrio insonorizante en entornos urbanos está en aumento. Además, el vidrio plano desempeña un papel fundamental en la transición energética verde de la región, especialmente en aplicaciones solares fotovoltaicas. Países como Alemania y Francia lideran la implementación de vidrio inteligente en la arquitectura y los sistemas de transporte modernos.
Perspectivas del mercado del vidrio plano en Alemania
Se prevé que el mercado alemán de vidrio plano experimente el mayor crecimiento entre 2025 y 2032, gracias al énfasis del país en los estándares de construcción energéticamente eficientes y la integración de tecnologías inteligentes en la infraestructura. Como productor líder de vidrio de alto rendimiento, Alemania invierte en innovaciones como el vidrio electrocrómico y de control solar. El apoyo del gobierno a la construcción ecológica y la generación de energías renovables, especialmente en los sectores de la energía solar térmica y fotovoltaica, está impulsando la demanda del mercado.
Perspectivas del mercado del vidrio plano en el Reino Unido
Se prevé que el mercado británico de vidrio plano experimente su mayor crecimiento entre 2025 y 2032, impulsado por el aumento de las inversiones en bienes raíces comerciales y la renovación de edificios ecológicos. Los objetivos de cero emisiones netas y las políticas de eficiencia energética del país están impulsando la adopción de vidrio de baja emisividad y con aislamiento térmico. Además, el sector automotriz observa una creciente preferencia por el vidrio ligero y multifuncional para cumplir con las estrictas normas de eficiencia de combustible y seguridad.
Cuota de mercado del vidrio plano
La industria del vidrio plano está liderada principalmente por empresas bien establecidas, entre las que se incluyen:
- Grupo Saint-Gobain (Francia)
- SCHOTT (Alemania)
- Fenicia (EE. UU.)
- CARDINAL GLASS INDUSTRIES, INC. (EE. UU.)
- TAIWAN GLASS IND CORP. (Taiwán)
- Guardian Industries Holdings (EE. UU.)
- Nippon Sheet Glass Co., Ltd (Japón)
- AGC Inc. (Japón)
- Compañía de vidrio Zibo Yuru (China)
- Grupo Kibing (China)
- Swift Glass (EE. UU.)
- Qingdao REXI Industries Co., Ltd. (China)
- Vitro (México)
- China Glass Holdings Limited (China)
- Qingdao Laurel Glass Technology Co., Ltd. (China)
- Productos de vidrio especiales (EE. UU.)
- Dongguan CSG Solar Glass Co., Ltd (China)
- Central Glass Co. Ltd (Japón)
- Sisecam (Turquía)
Últimos avances en el mercado mundial del vidrio plano
- En octubre de 2023, Vitro anunció un contrato adicional con First Solar para el suministro de láminas frontales de vidrio de alta tecnología para paneles solares fabricados en Norteamérica. La inversión de Vitro de 180 millones de dólares en la adaptación de las instalaciones busca satisfacer la demanda del contrato, proyectando ventas adicionales de aproximadamente 1.300 millones de dólares durante la próxima década, complementando el contrato inicial de 1.200 millones de dólares.
- En julio de 2023, Cardinal Glass Industries Inc. anunció la consolidación y expansión de las operaciones de templado personalizado de Cardinal CT Company en el oeste de EE. UU. Después de la adquisición de la planta de templado de Dixon, California, Cardinal CT completó una expansión planificada del edificio, mejoró la distribución del piso e instaló nuevos equipos, lo que resultó en una mayor capacidad, eficiencia y productividad.
- En septiembre de 2022, AGC Glass Europe SA, filial de AGC, reconocido fabricante de vidrio y materiales de alta tecnología, reveló sus planes para crear una gama de vidrio flotado con una huella de carbono significativamente menor. La iniciativa busca reducir las emisiones de CO2 a menos de 7 kg por m² en vidrio transparente (4 mm de espesor).
- En junio de 2022, Saint-Gobain presentó MIRASTAR REFLECT, un nuevo vidrio altamente reflectante con excepcionales propiedades de opacidad y reflexión. Con tan solo un 0,1 % de transmisión de luz y un 55 % de reflexión de la luz, ofrece durabilidad en condiciones de alta humedad. Este producto es ideal para aplicaciones de espejos fijados a la pared, lo que proporciona mayor atractivo estético y funcionalidad.
- En marzo de 2021, SCHOTT AG presentó soluciones innovadoras de vidrio templado para electrodomésticos en la feria Appliance & Electronics World Expo 2021. Esta presentación mejora la visibilidad de la empresa y atrae nuevos clientes, contribuyendo así al crecimiento futuro de los ingresos gracias a una mayor presencia en el mercado y una mayor adopción de productos.
SKU-
Obtenga acceso en línea al informe sobre la primera nube de inteligencia de mercado del mundo

- Panel de análisis de datos interactivo
- Panel de análisis de empresas para oportunidades con alto potencial de crecimiento
- Acceso de analista de investigación para personalización y consultas
- Análisis de la competencia con panel interactivo
- Últimas noticias, actualizaciones y análisis de tendencias
- Aproveche el poder del análisis de referencia para un seguimiento integral de la competencia
Tabla de contenido
- INTRODUCCIÓN
- OBJETIVOS DEL ESTUDIO
- DEFINICIÓN DE MERCADO
- PANORAMA GENERAL DEL MERCADO MUNDIAL DE VIDRIO PLANO
- LIMITACIÓN
- MERCADOS CUBIERTOS
- SEGMENTACIÓN DEL MERCADO
- MERCADOS CUBIERTOS
- ÁMBITO GEOGRÁFICO
- AÑOS CONSIDERADOS PARA EL ESTUDIO
- MONEDA Y PRECIOS
- MODELO DE VALIDACIÓN DE DATOS TRÍPODE DBMR
- CURVA DE LÍNEA DE VIDA FUNCIONAL
- MODELADO MULTIVARIADO
- ENTREVISTAS PRINCIPALES CON LÍDERES DE OPINIÓN CLAVE
- CUADRÍCULA DE POSICIÓN DE MERCADO DBMR
- CUADRÍCULA DE COBERTURA DE APLICACIONES DEL MERCADO
- MATRIZ DE DESAFÍOS DEL MERCADO DBMR
- ANÁLISIS DE PARTICIPACIÓN DE PROVEEDORES
- DATOS DE IMPORTACIÓN Y EXPORTACIÓN
- FUENTES SECUNDARIAS
- SUPUESTOS
- RESUMEN EJECUTIVO
- INFORMACIÓN PREMIUM
- ANÁLISIS DE LA CADENA DE VALOR DEL MERCADO GLOBAL DE VIDRIO PLANO
- LOGÍSTICA DE ENTRADA
- OPERACIONES
- LOGÍSTICA DE SALIDA
- VENTAS Y MARKETING
- MANTENIMIENTOS Y SERVICIOS
- PANORAMA DEL MERCADO
- CONDUCTORES
- CRECIENTE DEMANDA DE PRODUCTOS DE VIDRIO PLANO EN LA INDUSTRIA AUTOMOTRIZ DE REPUESTOS
- AUMENTO DEL USO DE VIDRIO PLANO EN LA PRODUCCIÓN E INSTALACIÓN DE PANELES SOLARES
- IMPACTO DE LA LEGISLACIÓN Y LA REGULACIÓN EN MATERIA DE SEGURIDAD, AHORRO DE ENERGÍA Y ATENUACIÓN DEL RUIDO
- AUMENTO DE LA DEMANDA DE PRODUCTOS TEMPLADOS EN LA INDUSTRIA DE LA CONSTRUCCIÓN COMERCIAL
- RESTRICCIONES
- CRECIENTE DEMANDA DE VEHÍCULOS ELÉCTRICOS EN LOS PAÍSES DESARROLLADOS
- AUMENTO DE CASOS DE ACCIDENTES DE TRÁFICO
- LA SALIDA DE LOS FABRICANTES DE LOS PROYECTOS DE CONSTRUCCIÓN RESIDENCIAL INCURRIÓ EN GRANDES PÉRDIDAS DURANTE LA PANDEMIA
- AUMENTO DEL PRECIO DE ENTRADA DE LAS MATERIAS PRIMAS
- OPORTUNIDADES
- CRECIENTE PREFERENCIA POR PRODUCTOS DE VIDRIO DE BAJO E
- Creciente prevalencia del vidrio ultrafino para teléfonos inteligentes
- USO CRECIENTE DE VIDRIO PLANO EN LA PRÓXIMA REINICIO Y RENOVACIÓN DE PROYECTOS EN EL SECTOR DE LA CONSTRUCCIÓN TRAS LA PANDEMIA
- DESAFÍOS
- PROBLEMAS RELATIVOS A LA ELIMINACIÓN DE RESIDUOS DE VIDRIO QUE SUSCRIBE PREOCUPACIÓN AMBIENTAL
- LEY DESFAVORABLE PARA LOS ESTÁNDARES DE CALIDAD DEL VIDRIO PLANO
- ALTO COSTO DE TRANSPORTE DE PRODUCTOS DE VIDRIO PLANO
- IMPACTO DE LA COVID-19 EN EL MERCADO MUNDIAL DEL VIDRIO PLANO
- ANÁLISIS DEL IMPACTO DE LA COVID-19 EN EL MERCADO MUNDIAL DEL VIDRIO PLANO
- CONSECUENCIAS DE LA COVID-19 E INICIATIVA GUBERNAMENTAL PARA IMPULSAR EL MERCADO MUNDIAL DEL VIDRIO PLANO
- DECISIONES ESTRATÉGICAS PARA LOS FABRICANTES DESPUÉS DEL COVID-19 PARA GANAR PARTICIPACIÓN DE MERCADO COMPETITIVA
- IMPACTO EN EL PRECIO
- IMPACTO EN LA DEMANDA
- IMPACTO EN LA CADENA DE SUMINISTRO
- CONCLUSIÓN
- MERCADO MUNDIAL DE VIDRIO PLANO, POR TIPO
- DESCRIPCIÓN GENERAL
- VIDRIO FLOTADO
- VIDRIO EXTRA CLARO
- VIDRIO TRANSPARENTE
- VIDRIO FUNDIDO
- VIDRIO TINTADO
- VIDRIO ALAMBRADO
- VIDRIO PLANO ESPECIAL
- VIDRIO ESTAMPADO O VIDRIO TEXTURIZADO
- VIDRIO PLANO SOPLADO
- OTROS
- MERCADO MUNDIAL DE VIDRIO PLANO, POR FUNCIÓN
- DESCRIPCIÓN GENERAL
- VIDRIO CON FILTRO UV
- VIDRIO DE AISLAMIENTO TÉRMICO
- ACRISTALAMIENTO DE SEGURIDAD
- ACRISTALAMIENTO INSONORIZADO
- VIDRIO AUTOLIMPIANTE
- VIDRIO DE INTERCAMBIO IÓNICO
- OTROS
- MERCADO MUNDIAL DE VIDRIO PLANO, POR PRODUCTO
- DESCRIPCIÓN GENERAL
- SABURRAL
- RECUBIERTO CON RESINA DE RECUBRIMIENTO
- POLIURETANO
- EPOXY
- ACRÍLICO
- RESINA ALQUÍDICA
- RESINA DE SILICONA
- OTROS
- RECUBIERTO, MEDIANTE TECNOLOGÍA DE RECUBRIMIENTO
- A BASE DE DISOLVENTES
- A BASE DE AGUA
- RECUBRIMIENTOS NANO
- RECUBIERTO, MEDIANTE PROCESO DE RECUBRIMIENTO
- DEPOSICIÓN FÍSICA DE VAPOR (PVD) (PULVERIZACIÓN CATÓLICA CON MAGNETRÓN)
- SOL-GEL
- DEPOSICIÓN QUÍMICA DE VAPOR (CVD) (PIROLÍTICA)
- MEJORADO CON PLASMA (PECVD)
- PRESIÓN ATMOSFÉRICA (APCVD)
- BAJA PRESIÓN (LPCVD)
- SIN RECUBRIMIENTO
- MERCADO MUNDIAL DE VIDRIO PLANO, POR APLICACIÓN
- DESCRIPCIÓN GENERAL
- CONSTRUCCIÓN Y EDIFICACIÓN
- EDIFICACIÓN Y CONSTRUCCIÓN, POR APLICACIÓN
- RESIDENCIAL
- COMERCIAL
- INDUSTRIAL
- INSTITUCIONAL
- EDIFICACIÓN Y CONSTRUCCIÓN, POR TIPO
- VIDRIO FLOTADO
- VIDRIO EXTRA CLARO
- VIDRIO TRANSPARENTE
- VIDRIO FUNDIDO
- VIDRIO TINTADO
- VIDRIO ALAMBRADO
- VIDRIO PLANO ESPECIAL
- VIDRIO ESTAMPADO O VIDRIO TEXTURIZADO
- VIDRIO PLANO SOPLADO
- OTROS
- AUTOMOTOR
- AUTOMOCIÓN, POR APLICACIÓN
- Fabricante de equipos originales (OEM)
- MERCADO DE REPUESTOS
- AUTOMOTRIZ, POR TIPO
- VIDRIO FLOTADO
- VIDRIO EXTRA CLARO
- VIDRIO TRANSPARENTE
- VIDRIO FUNDIDO
- VIDRIO TINTADO
- VIDRIO ALAMBRADO
- VIDRIO PLANO ESPECIAL
- VIDRIO ESTAMPADO O VIDRIO TEXTURIZADO
- VIDRIO PLANO SOPLADO
- OTROS
- AEROESPACIAL
- AEROESPACIAL,, POR TIPO
- VIDRIO FLOTADO
- VIDRIO EXTRA CLARO
- VIDRIO TRANSPARENTE
- VIDRIO FUNDIDO
- VIDRIO TINTADO
- VIDRIO ALAMBRADO
- VIDRIO PLANO ESPECIAL
- VIDRIO ESTAMPADO O VIDRIO TEXTURIZADO
- VIDRIO PLANO SOPLADO
- OTROS
- ELECTRODOMÉSTICOS
- APARATOS ELECTRÓNICOS, POR TIPO
- VIDRIO FLOTADO
- VIDRIO EXTRA CLARO
- VIDRIO TRANSPARENTE
- VIDRIO FUNDIDO
- VIDRIO TINTADO
- VIDRIO ALAMBRADO
- VIDRIO PLANO ESPECIAL
- VIDRIO ESTAMPADO O VIDRIO TEXTURIZADO
- VIDRIO PLANO SOPLADO
- OTROS
- ENERGÍA SOLAR
- ENERGÍA SOLAR, POR APLICACIÓN
- SISTEMA DE ENERGÍA SOLAR FOTOVOLTAICA
- SISTEMA DE ENERGÍA SOLAR CONCENTRADA
- ENERGÍA SOLAR, POR TIPO
- VIDRIO FLOTADO
- VIDRIO EXTRA CLARO
- VIDRIO TRANSPARENTE
- VIDRIO FUNDIDO
- VIDRIO TINTADO
- VIDRIO ALAMBRADO
- VIDRIO PLANO ESPECIAL
- VIDRIO ESTAMPADO O VIDRIO TEXTURIZADO
- VIDRIO PLANO SOPLADO
- OTROS
- MUEBLES
- MUEBLES, POR TIPO
- VIDRIO FLOTADO
- VIDRIO EXTRA CLARO
- VIDRIO TRANSPARENTE
- VIDRIO FUNDIDO
- VIDRIO TINTADO
- VIDRIO ALAMBRADO
- VIDRIO PLANO ESPECIAL
- VIDRIO ESTAMPADO O VIDRIO TEXTURIZADO
- VIDRIO PLANO SOPLADO
- OTROS
- OTROS
- OTROS, POR TIPO
- VIDRIO FLOTADO
- VIDRIO EXTRA CLARO
- VIDRIO TRANSPARENTE
- VIDRIO FUNDIDO
- VIDRIO TINTADO
- VIDRIO ALAMBRADO
- VIDRIO PLANO ESPECIAL
- VIDRIO ESTAMPADO O VIDRIO TEXTURIZADO
- VIDRIO PLANO SOPLADO
- OTROS
- MERCADO MUNDIAL DE VIDRIO PLANO, POR REGIÓN
- DESCRIPCIÓN GENERAL
- AMÉRICA DEL NORTE
- A NOSOTROS
- CANADÁ
- MÉXICO
- EUROPA
- ALEMANIA
- Reino Unido
- FRANCIA
- ITALIA
- ESPAÑA
- PAÍSES BAJOS
- BÉLGICA
- RUSIA
- PAVO
- SUIZA
- RESTO DE EUROPA
- ASIA-PACÍFICO
- PORCELANA
- INDIA
- JAPÓN
- COREA DEL SUR
- AUSTRALIA Y NUEVA ZELANDA
- INDONESIA
- SINGAPUR
- MALASIA
- TAILANDIA
- FILIPINAS
- RESTO DE ASIA-PACÍFICO
- ORIENTE MEDIO Y ÁFRICA
- Emiratos Árabes Unidos
- ARABIA SAUDITA
- SUDÁFRICA
- EGIPTO
- ISRAEL
- RESTO DE ORIENTE MEDIO Y ÁFRICA
- SUDAMERICA
- BRASIL
- ARGENTINA
- RESTO DE SUDAMÉRICA
- MERCADO GLOBAL DE VIDRIO PLANO: PANORAMA EMPRESARIAL
- ANÁLISIS DE ACCIONES DE LA EMPRESA: GLOBAL
- ANÁLISIS DE ACCIONES DE EMPRESAS: AMÉRICA DEL NORTE
- ANÁLISIS DE ACCIONES DE EMPRESAS: EUROPA
- ANÁLISIS DE ACCIONES DE LA EMPRESA: ASIA-PACÍFICO
- EXPANSIONES
- ANÁLISIS FODA
- PERFILES DE EMPRESAS
- GUARDIAN GLASS LLC
- INSTANTÁNEA DE LA EMPRESA
- ANÁLISIS DE ACCIONES DE LA EMPRESA
- PORTAFOLIO DE PRODUCTOS
- ACTUALIZACIÓN RECIENTE
- CORPORACIÓN DE LA INDUSTRIA DEL VIDRIO DE TAIWÁN
- INSTANTÁNEA DE LA EMPRESA
- ANÁLISIS DE ACCIONES DE LA EMPRESA
- PORTAFOLIO DE PRODUCTOS
- ACTUALIZACIÓN RECIENTE
- FUNDACIÓN DE LA COMPAÑÍA DE VIDRIO ZIBO YURU
- INSTANTÁNEA DE LA EMPRESA
- ANÁLISIS DE ACCIONES DE LA EMPRESA
- PORTAFOLIO DE PRODUCTOS
- ACTUALIZACIÓN RECIENTE
- SCHOTT AG
- INSTANTÁNEA DE LA EMPRESA
- ANÁLISIS DE ACCIONES DE LA EMPRESA
- PORTAFOLIO DE PRODUCTOS
- ACTUALIZACIÓN RECIENTE
- SHENZHEN SUN GLOBAL GLASS CO., LTD
- INSTANTÁNEA DE LA EMPRESA
- ANÁLISIS DE ACCIONES DE LA EMPRESA
- PORTAFOLIO DE PRODUCTOS
- ACTUALIZACIÓN RECIENTE
- SAINT-GOBAIN
- INSTANTÁNEA DE LA EMPRESA
- ANÁLISIS DE INGRESOS
- PORTAFOLIO DE PRODUCTOS
- ACTUALIZACIÓN RECIENTE
- CHINA LAUREL GLASS TECHNOLOGY CO., LTD
- INSTANTÁNEA DE LA EMPRESA
- PORTAFOLIO DE PRODUCTOS
- ACTUALIZACIÓN RECIENTE
- VIDRIO SWIFT
- INSTANTÁNEA DE LA EMPRESA
- PORTAFOLIO DE PRODUCTOS
- ACTUALIZACIÓN RECIENTE
- AGC INC.
- INSTANTÁNEA DE LA EMPRESA
- ANÁLISIS DE INGRESOS
- PORTAFOLIO DE PRODUCTOS
- ACTUALIZACIÓN RECIENTE
- CARDINAL GLASS INDUSTRIES, INC
- INSTANTÁNEA DE LA EMPRESA
- PORTAFOLIO DE PRODUCTOS
- ACTUALIZACIÓN RECIENTE
- CENTRAL GLASS CO.LTD
- INSTANTÁNEA DE LA EMPRESA
- ANÁLISIS DE INGRESOS
- PORTAFOLIO DE PRODUCTOS
- ACTUALIZACIÓN RECIENTE
- CHINA GLASS HOLDINGS LIMITADA
- INSTANTÁNEA DE LA EMPRESA
- ANÁLISIS DE INGRESOS
- PORTAFOLIO DE PRODUCTOS
- ACTUALIZACIÓN RECIENTE
- DONGGUAN CSG SOLAR GLASS CO., LTD (UNA SUBSIDIARIA DE CSG HOLDING CO.,LTD.)
- INSTANTÁNEA DE LA EMPRESA
- ANÁLISIS DE INGRESOS
- PORTAFOLIO DE PRODUCTOS
- ACTUALIZACIÓN RECIENTE
- GRUPO KIBING
- INSTANTÁNEA DE LA EMPRESA
- PORTAFOLIO DE PRODUCTOS
- ACTUALIZACIÓN RECIENTE
- NIPPON SHEET GLASS CO., LTD
- INSTANTÁNEA DE LA EMPRESA
- ANÁLISIS DE INGRESOS
- PORTAFOLIO DE PRODUCTOS
- ACTUALIZACIONES RECIENTES
- FENICIA
- INSTANTÁNEA DE LA EMPRESA
- PORTAFOLIO DE PRODUCTOS
- ACTUALIZACIONES RECIENTES
- INDUSTRIAS CO., LTD DE QINGDAO REXI
- INSTANTÁNEA DE LA EMPRESA
- PORTAFOLIO DE PRODUCTOS
- ACTUALIZACIONES RECIENTES
- ŞIŞECAM
- INSTANTÁNEA DE LA EMPRESA
- ANÁLISIS DE INGRESOS
- PORTAFOLIO DE PRODUCTOS
- ACTUALIZACIÓN RECIENTE
- PRODUCTOS DE VIDRIO ESPECIALIZADOS
- INSTANTÁNEA DE LA EMPRESA
- PORTAFOLIO DE PRODUCTOS
- ACTUALIZACIÓN RECIENTE
- VITRO
- INSTANTÁNEA DE LA EMPRESA
- ANÁLISIS DE INGRESOS
- PORTAFOLIO DE PRODUCTOS
- ACTUALIZACIÓN RECIENTE
- CUESTIONARIO
- INFORMES RELACIONADOS
Lista de Tablas
TABLA 1 DATOS DE IMPORTACIÓN del Producto: 7005 Vidrio flotado y vidrio desbastado o pulido, en hojas, incluso con absorbente; CÓDIGO SA - 7005 (MILES USD)
CUADRO 2 DATOS DE EXPORTACIÓN del Producto: 7005 Vidrio flotado y vidrio desbastado o pulido, en hojas, incluso con absorbente; CÓDIGO SA - 7005 (MILES USD)
TABLA 3 Algunos de los estándares de calidad para los vidrios instalados en VENTANAS, conjuntos acristalados así como en puertas:
TABLA 4 Mercado mundial de vidrio plano, por tipo, 2019-2028 (miles de USD)
TABLA 5 Mercado mundial de vidrio plano, por tipo, 2019-2028 (MIL METROS CUADRADOS)
TABLA 6 Mercado global de vidrio flotado en VIDRIO PLANO, por región, 2019-2028 (en miles de USD)
TABLA 7 Mercado mundial de vidrio flotado en VIDRIO PLANO, POR región, 2019-2028 (MIL METROS CUADRADOS)
TABLA 8 Mercado global de vidrio extra claro en VIDRIO PLANO, por región, 2019-2028 (en miles de USD)
TABLA 9 Mercado global de vidrio extra claro en VIDRIO PLANO, POR región, 2019-2028 (MIL METROS CUADRADOS)
TABLA 10 Mercado global de vidrio transparente en VIDRIO PLANO, por región, 2019-2028 (en miles de USD)
TABLA 11 Mercado global de vidrio transparente en VIDRIO PLANO, POR región, 2019-2028 (MIL METROS CUADRADOS)
TABLA 12 Mercado global de vidrio fundido en vidrio plano, por región, 2019-2028 (en miles de USD)
TABLA 13 Mercado mundial de vidrio fundido en vidrio plano, por región, 2019-2028 (MIL METROS CUADRADOS)
TABLA 14 Mercado global de vidrio tintado en vidrio plano, por región, 2019-2028 (en miles de USD)
TABLA 15 Mercado global de vidrio tintado en vidrio plano, por región, 2019-2028 (MIL METROS CUADRADOS)
TABLA 16 Mercado global de vidrio armado en vidrio plano, por región, 2019-2028 (en miles de USD)
TABLA 17 Mercado global de vidrio armado en vidrio plano, por región, 2019-2028 (MIL METROS CUADRADOS)
TABLA 18 Mercado global de vidrio plano especial EN VIDRIO PLANO, POR región, 2019-2028 (Miles de USD)
TABLA 19 Mercado global de vidrio plano especial EN VIDRIO PLANO, POR región, 2019-2028 (MIL METROS CUADRADOS)
TABLA 20 Mercado mundial de vidrio estampado o texturizado en vidrio plano, por región, 2019-2028 (en miles de USD)
TABLA 21 Mercado mundial de vidrio estampado o texturizado en vidrio plano, por región, 2019-2028 (MIL METROS CUADRADOS)
TABLA 22 Mercado global de vidrio plano soplado, por región, 2019-2028 (en miles de USD)
TABLA 23 Mercado mundial de vidrio soplado plano EN VIDRIO PLANO, POR región, 2019-2028 (MIL METROS CUADRADOS)
TABLA 24 Mercado global de Otros en VIDRIO PLANO, por región, 2019-2028 (en miles de USD)
TABLA 25 Otros mercados globales de vidrio plano, por región, 2019-2028 (MIL METROS CUADRADOS)
TABLA 26 Mercado mundial de VIDRIO PLANO, por función, 2019-2028 (Miles de USD)
TABLA 27 Mercado global de vidrio con filtro UV en vidrio plano, por región, 2019-2028 (en miles de USD)
TABLA 28 Mercado global de vidrio aislante térmico en vidrio plano, por región, 2019-2028 (en miles de USD)
TABLA 29 Mercado global de acristalamiento de seguridad en vidrio plano, por región, 2019-2028 (en miles de USD)
TABLA 30 Mercado global de acristalamiento insonorizado en vidrio plano, por región, 2019-2028 (en miles de USD)
TABLA 31 Mercado mundial de vidrio autolimpiable en vidrio plano, por región, 2019-2028 (en miles de USD)
TABLA 32 Mercado global de vidrio de intercambio iónico en vidrio plano, por región, 2019-2028 (en miles de USD)
TABLA 33 Mercado global de Otros en VIDRIO PLANO, por región, 2019-2028 (Miles de USD)
TABLA 34 Mercado mundial de VIDRIO PLANO, por producto, 2019-2028 (Miles de USD)
TABLA 35 Mercado global de vidrio recubierto en plano, por región, 2019-2028 (en miles de USD)
TABLA 36 Mercado mundial de vidrio recubierto plano, por resina de recubrimiento, 2019-2028 (en miles de USD)
TABLA 37 Mercado global de RECUBRIMIENTOS en vidrio plano, por TECNOLOGÍA DE RECUBRIMIENTO, 2019-2028 (Miles de USD)
TABLA 38 Mercado mundial de RECUBRIMIENTOS en vidrio plano, por proceso de RECUBRIMIENTO, 2019-2028 (Miles de USD)
TABLA 39 Mercado global de deposición química de vapor (CVD) (pirolítica) en vidrio plano, por proceso, 2019-2028 (en miles de USD)
TABLA 40 Mercado mundial de vidrio sin recubrimiento en VIDRIO PLANO, por región, 2019-2028 (en miles de USD)
TABLA 41 Mercado mundial de VIDRIO PLANO, por aplicación, 2019-2028 (Miles de USD)
TABLA 42 Mercado global de construcción y edificación en vidrio plano, por región, 2019-2028 (en miles de USD)
TABLA 43 Mercado global de construcción y edificación en VIDRIO PLANO, POR aplicación, 2019-2028 (Miles de USD)
TABLA 44 Mercado global de construcción y edificación en vidrio plano, por tipo, 2019-2028 (miles de USD)
TABLA 45 Mercado mundial de vidrio plano automotriz, por región, 2019-2028 (en miles de USD)
TABLA 46 Mercado mundial de vidrio plano automotriz, por aplicación, 2019-2028 (en miles de USD)
TABLA 47 Mercado mundial de vidrio plano automotriz, por tipo, 2019-2028 (en miles de USD)
TABLA 48 Mercado global de la industria aeroespacial en vidrio plano, por región, 2019-2028 (en miles de USD)
TABLA 49 Mercado global de la industria aeroespacial en vidrio plano, por tipo, 2019-2028 (en miles de USD)
TABLA 50 Mercado mundial de electrodomésticos de vidrio plano, por región, 2019-2028 (en miles de USD)
TABLA 51 Mercado global de electrodomésticos de vidrio plano, por tipo, 2019-2028 (en miles de USD)
TABLA 52 Mercado global de energía solar en vidrio plano, por región, 2019-2028 (miles de USD)
TABLA 53 Mercado global de energía solar en vidrio plano, por aplicación, 2019-2028 (miles de USD)
TABLA 54 Mercado global de energía solar en vidrio plano, por tipo, 2019-2028 (miles de USD)
TABLA 55 Mercado global de muebles de vidrio plano, por región, 2019-2028 (en miles de USD)
TABLA 56 Mercado global de muebles de vidrio plano, por tipo, 2019-2028 (en miles de USD)
TABLA 57 Mercado global de Otros en VIDRIO PLANO, por región, 2019-2028 (Miles de USD)
TABLA 58 Mercado global de Otros en VIDRIO PLANO, por tipo, 2019-2028 (Miles de USD)
TABLA 59 Mercado mundial de vidrio plano, por región, 2019-2028 (miles de USD)
TABLA 60 Mercado mundial de vidrio plano, por región, 2019-2028 (miles de metros cuadrados)
TABLA 61 Mercado de vidrio plano de América del Norte, POR PAÍS, 2019-2028 (Miles de USD)
TABLA 62 Mercado de vidrio plano de América del Norte, POR PAÍS, 2019-2028 (Miles de metros cuadrados)
TABLA 63 Mercado de vidrio plano de América del Norte, por tipo, 2019-2028 (miles de USD)
TABLA 64 Mercado de vidrio plano de América del Norte, por tipo, 2019-2028 (miles de metros cuadrados)
TABLA 65 Mercado de vidrio plano de América del Norte, por función, 2019-2028 (miles de USD)
TABLA 66 Mercado de vidrio plano de América del Norte, por producto, 2019-2028 (miles de USD)
TABLA 67 Mercado de vidrio plano recubierto en América del Norte, por resina de recubrimiento, 2019-2028 (en miles de USD)
TABLA 68 Tecnología de recubrimiento en el mercado de vidrio plano de América del Norte, por tecnología de recubrimiento, 2019-2028 (en miles de USD)
TABLA 69 Mercado de vidrio plano recubierto en América del Norte, por proceso de recubrimiento, 2019-2028 (en miles de USD)
TABLA 70 Mercado de deposición química de vapor (CVD) (pirolítica) en vidrio plano de América del Norte, por proceso, 2019-2028 (en miles de USD)
TABLA 71 Mercado de vidrio plano de América del Norte, por aplicación, 2019-2028 (miles de USD)
TABLA 72 Mercado de construcción y edificación de vidrio plano en América del Norte, por aplicación, 2019-2028 (en miles de USD)
TABLA 73 Mercado de construcción y edificación de vidrio plano en América del Norte, por tipo, 2019-2028 (en miles de USD)
TABLA 74 Mercado de vidrio plano automotriz en América del Norte, por aplicación, 2019-2028 (en miles de USD)
TABLA 75 Mercado automotriz de vidrio plano en América del Norte, por tipo, 2019-2028 (en miles de USD)
TABLA 76 Mercado aeroespacial de vidrio plano en América del Norte, por tipo, 2019-2028 (en miles de USD)
TABLA 77 Mercado de electrodomésticos de vidrio plano en América del Norte, por tipo, 2019-2028 (en miles de USD)
TABLA 78 Mercado de energía solar en vidrio plano de América del Norte, por aplicación 2019-2028 (en miles de USD)
TABLA 79 Mercado de energía solar en vidrio plano en América del Norte, por tipo, 2019-2028 (en miles de USD)
TABLA 80 Mercado norteamericano de muebles de vidrio plano, por tipo, 2019-2028 (en miles de USD)
TABLA 81 América del Norte Otros en el mercado de vidrio plano, por tipo, 2019-2028 (en miles de USD)
TABLA 82 Mercado estadounidense de vidrio plano, por tipo, 2019-2028 (miles de USD)
TABLA 83 Mercado estadounidense de vidrio plano, por tipo, 2019-2028 (miles de metros cuadrados)
TABLA 84 Mercado estadounidense de vidrio plano, por función, 2019-2028 (miles de USD)
TABLA 85 Mercado estadounidense de vidrio plano, por producto, 2019-2028 (miles de USD)
TABLA 86 Mercado de vidrio plano recubierto en EE. UU., por resina de recubrimiento, 2019-2028 (en miles de USD)
TABLA 87 Tecnología de recubrimiento en el mercado estadounidense de vidrio plano, por tecnología de recubrimiento, 2019-2028 (en miles de USD)
TABLA 88 Mercado estadounidense de vidrio plano recubierto, por proceso de recubrimiento, 2019-2028 (en miles de USD)
TABLA 89 Mercado estadounidense de deposición química de vapor (CVD) (pirolítica) en vidrio plano, por proceso, 2019-2028 (en miles de USD)
TABLA 90 Mercado estadounidense de vidrio plano, por aplicación, 2019-2028 (miles de USD)
TABLA 91 Mercado estadounidense de construcción y edificación de vidrio plano, por aplicación, 2019-2028 (en miles de USD)
TABLA 92 Mercado de construcción y edificación de vidrio plano en EE. UU., por tipo, 2019-2028 (en miles de USD)
TABLA 93 Mercado de vidrio plano automotriz en EE. UU., por aplicación, 2019-2028 (en miles de USD)
TABLA 94 Mercado automotriz de vidrio plano en EE. UU., por tipo, 2019-2028 (en miles de USD)
TABLA 95 Mercado aeroespacial de EE. UU. en vidrio plano, por tipo, 2019-2028 (en miles de USD)
TABLA 96 Mercado estadounidense de electrodomésticos de vidrio plano, por tipo, 2019-2028 (en miles de USD)
TABLA 97 Mercado estadounidense de energía solar en vidrio plano, por aplicación, 2019-2028 (en miles de USD)
TABLA 98 Mercado estadounidense de energía solar en vidrio plano, por tipo, 2019-2028 (en miles de USD)
TABLA 99 Mercado estadounidense de muebles de vidrio plano, por tipo, 2019-2028 (en miles de USD)
TABLA 100 Mercado de vidrio plano en otros países de EE. UU., por tipo, 2019-2028 (en miles de USD)
TABLA 101 Mercado canadiense de vidrio plano, por tipo, 2019-2028 (miles de USD)
TABLA 102 Mercado canadiense de vidrio plano, por tipo, 2019-2028 (miles de metros cuadrados)
TABLA 103 Mercado canadiense de vidrio plano, por función, 2019-2028 (miles de USD)
TABLA 104 Mercado canadiense de vidrio plano, por producto, 2019-2028 (en miles de USD)
TABLA 105 Mercado canadiense de vidrio plano recubierto, por resina de recubrimiento, 2019-2028 (en miles de USD)
TABLA 106 Tecnología de recubrimiento en el mercado de vidrio plano de Canadá, por tecnología de recubrimiento, 2019-2028 (en miles de USD)
TABLA 107 Mercado canadiense de vidrio plano recubierto, por proceso de recubrimiento, 2019-2028 (en miles de USD)
TABLA 108 Mercado canadiense de deposición química de vapor (CVD) (pirolítica) en vidrio plano, por proceso, 2019-2028 (en miles de USD)
TABLA 109 Mercado canadiense de vidrio plano, por aplicación, 2019-2028 (en miles de USD)
TABLA 110 Mercado canadiense de construcción y edificación de vidrio plano, por aplicación, 2019-2028 (en miles de USD)
TABLA 111 Construcción y edificación en el mercado de vidrio plano de Canadá, por tipo, 2019-2028 (en miles de USD)
TABLA 112 Mercado automotriz canadiense de vidrio plano, por aplicación, 2019-2028 (en miles de USD)
TABLA 113 Mercado automotriz canadiense de vidrio plano, por tipo, 2019-2028 (en miles de USD)
TABLA 114 Industria aeroespacial canadiense en el mercado del vidrio plano, por tipo, 2019-2028 (en miles de USD)
TABLA 115 Mercado canadiense de electrodomésticos de vidrio plano, por tipo, 2019-2028 (en miles de USD)
TABLA 116 Mercado canadiense de energía solar en vidrio plano, por aplicación, 2019-2028 (en miles de USD)
TABLA 117 Mercado canadiense de energía solar en vidrio plano, por tipo, 2019-2028 (en miles de USD)
TABLA 118 Mercado canadiense de muebles de vidrio plano, por tipo, 2019-2028 (en miles de USD)
TABLA 119 Canadá Otros en el mercado del vidrio plano, por tipo, 2019-2028 (en miles de USD)
TABLA 120 Mercado de vidrio plano en México, por tipo, 2019-2028 (Miles de USD)
TABLA 121 Mercado de vidrio plano en México, por tipo, 2019-2028 (Miles de metros cuadrados)
TABLA 122 Mercado de vidrio plano en México, por función, 2019-2028 (Miles de USD)
TABLA 123 Mercado de vidrio plano en México, por producto, 2019-2028 (miles de USD)
TABLA 124 Mercado de vidrio plano recubierto en México, por resina de recubrimiento, 2019-2028 (Miles de USD)
TABLA 125 Tecnología de recubrimiento en el mercado de vidrio plano en México, por tecnología de recubrimiento, 2019-2028 (en miles de USD)
TABLA 126 Mercado de vidrio plano recubierto en México, por proceso de recubrimiento, 2019-2028 (Miles de USD)
TABLA 127 Mercado de Deposición Química de Vapor (CVD) (Pirolítica) en Vidrio Plano en México, Por Proceso, 2019-2028 (Miles de USD)
TABLA 128 Mercado de vidrio plano en México, por aplicación, 2019-2028 (Miles de USD)
TABLA 129 México: Mercado de construcción y edificación de vidrio plano, por aplicación, 2019-2028 (Miles de USD)
TABLA 130 Construcción y edificación en el mercado de vidrio plano en México, por tipo, 2019-2028 (Miles de USD)
TABLA 131 Mercado automotriz de vidrio plano en México, por aplicación, 2019-2028 (Miles de USD)
TABLA 132 Mercado automotriz de vidrio plano en México, por tipo, 2019-2028 (Miles de USD)
TABLA 133 Mercado aeroespacial de vidrio plano en México, por tipo, 2019-2028 (miles de USD)
TABLA 134 Mercado de electrodomésticos de vidrio plano en México, por tipo, 2019-2028 (en miles de USD)
TABLA 135 Mercado mexicano de energía solar en vidrio plano, por aplicación, 2019-2028 (miles de USD)
TABLA 136 Mercado de energía solar en vidrio plano en México, por tipo, 2019-2028 (Miles de USD)
TABLA 137 Mercado de muebles de vidrio plano en México, por tipo, 2019-2028 (en miles de USD)
TABLA 138 México Otros en el Mercado de Vidrio Plano, Por Tipo, 2019-2028 (Miles de USD)
TABLA 139 Mercado europeo de vidrio plano, POR PAÍS, 2019-2028 (Miles de USD)
TABLA 140 Mercado europeo de vidrio plano, POR PAÍS, 2019-2028 (Miles de metros cuadrados)
TABLA 141 Mercado europeo de vidrio plano, por tipo, 2019-2028 (miles de USD)
TABLA 142 Mercado europeo de vidrio plano, por tipo, 2019-2028 (miles de metros cuadrados)
TABLA 143 Mercado europeo de vidrio plano, por función, 2019-2028 (miles de USD)
TABLA 144 Mercado europeo de vidrio plano, por producto, 2019-2028 (miles de USD)
TABLA 145 Mercado europeo de vidrio plano recubierto, por resina de recubrimiento, 2019-2028 (en miles de USD)
TABLA 146 Tecnología de recubrimiento en el mercado europeo de vidrio plano, por tecnología de recubrimiento, 2019-2028 (en miles de USD)
TABLA 147 Mercado europeo de vidrio plano recubierto, por proceso de recubrimiento, 2019-2028 (en miles de USD)
TABLA 148 Mercado europeo de deposición química de vapor (CVD) (pirolítica) en vidrio plano por proceso, 2019-2028 (en miles de USD)
TABLA 149 Mercado europeo de vidrio plano, por aplicación, 2019-2028 (miles de USD)
TABLA 150 Mercado europeo de construcción y edificación de vidrio plano, por aplicación, 2019-2028 (en miles de USD)
TABLA 151 Mercado europeo de construcción y edificación de vidrio plano, por tipo, 2019-2028 (en miles de USD)
TABLA 152 Mercado europeo de vidrio plano automotriz, por aplicación, 2019-2028 (en miles de USD)
TABLA 153 Mercado europeo de vidrio plano automotriz, por tipo, 2019-2028 (en miles de USD)
TABLA 154 Mercado aeroespacial europeo en vidrio plano, por tipo, 2019-2028 (en miles de USD)
TABLA 155 Mercado europeo de electrodomésticos de vidrio plano, por tipo, 2019-2028 (en miles de USD)
TABLA 156 Mercado europeo de energía solar en vidrio plano, por aplicación, 2019-2028 (en miles de USD)
TABLA 157 Mercado europeo de energía solar en vidrio plano, por tipo, 2019-2028 (en miles de USD)
TABLA 158 Mercado europeo de muebles de vidrio plano, por tipo, 2019-2028 (en miles de USD)
TABLA 159 Mercado de vidrio plano en Europa, por tipo, 2019-2028 (en miles de USD)
TABLA 160 Mercado alemán de vidrio plano, por tipo, 2019-2028 (en miles de USD)
TABLA 161 Mercado alemán de vidrio plano, por tipo, 2019-2028 (miles de metros cuadrados)
TABLA 162 Mercado alemán de vidrio plano, por función, 2019-2028 (miles de USD)
TABLA 163 MERCADO DE VIDRIO PLANO DE ALEMANIA, POR PRODUCTO, 2019-2028 (Miles de USD)
TABLA 164 Mercado alemán de vidrio plano recubierto, por resina de recubrimiento, 2019-2028 (en miles de USD)
TABLA 165 Tecnología de recubrimiento en el mercado alemán de vidrio plano, por tecnología de recubrimiento, 2019-2028 (en miles de USD)
TABLA 166 Mercado alemán de vidrio plano recubierto, por proceso de recubrimiento, 2019-2028 (en miles de USD)
TABLA 167 Deposición química de vapor (CVD) (pirolítica) en el mercado de vidrio plano en Alemania, por proceso, 2019-2028 (en miles de USD)
TABLA 168 Mercado alemán de vidrio plano, por aplicación, 2019-2028 (en miles de USD)
TABLA 169 Construcción y edificación en el mercado alemán de vidrio plano, por aplicación, 2019-2028 (en miles de USD)
TABLA 170 Construcción y edificación en el mercado de vidrio plano en Alemania, por tipo, 2019-2028 (en miles de USD)
TABLA 171 Mercado automotriz alemán de vidrio plano, por aplicación, 2019-2028 (en miles de USD)
TABLA 172 Mercado automotriz de vidrio plano en Alemania, por tipo, 2019-2028 (en miles de USD)
TABLA 173 Industria aeroespacial alemana en el mercado del vidrio plano, por tipo, 2019-2028 (en miles de USD)
TABLA 174 Mercado alemán de electrodomésticos de vidrio plano, por tipo, 2019-2028 (en miles de USD)
TABLA 175 Mercado alemán de energía solar en vidrio plano, por aplicación, 2019-2028 (en miles de USD)
TABLA 176 Mercado alemán de energía solar en vidrio plano, por tipo, 2019-2028 (en miles de USD)
TABLA 177 Mercado alemán de muebles de vidrio plano, por tipo, 2019-2028 (en miles de USD)
TABLA 178 Alemania Otros en el mercado del vidrio plano, por tipo, 2019-2028 (en miles de USD)
TABLA 179 Mercado de vidrio plano del Reino Unido, por tipo, 2019-2028 (en miles de USD)
TABLA 180 Mercado de vidrio plano en el Reino Unido, por tipo, 2019-2028 (miles de metros cuadrados)
TABLA 181 Mercado de vidrio plano del Reino Unido, por función, 2019-2028 (miles de USD)
TABLA 182 Mercado de vidrio plano del Reino Unido, por producto, 2019-2028 (en miles de USD)
TABLA 183 Mercado de vidrio plano recubierto en el Reino Unido, por resina de recubrimiento, 2019-2028 (en miles de USD)
TABLA 184 Tecnología de recubrimiento del Reino Unido en el mercado de vidrio plano, por tecnología de recubrimiento, 2019-2028 (en miles de USD)
TABLA 185 Mercado de vidrio plano recubierto en el Reino Unido, por proceso de recubrimiento, 2019-2028 (en miles de USD)
TABLA 186 Mercado de deposición química de vapor (CVD) (pirolítica) en vidrio plano del Reino Unido por proceso, 2019-2028 (en miles de USD)
TABLA 187 Mercado de vidrio plano del Reino Unido, por aplicación, 2019-2028 (en miles de USD)
TABLA 188 Mercado de construcción y edificación de vidrio plano en el Reino Unido, por aplicación, 2019-2028 (en miles de USD)
TABLA 189 Mercado de construcción y edificación de vidrio plano en el Reino Unido, por tipo, 2019-2028 (en miles de USD)
TABLA 190 Mercado de vidrio plano automotriz del Reino Unido, por aplicación, 2019-2028 (en miles de USD)
TABLA 191 Mercado de vidrio plano automotriz del Reino Unido, por tipo, 2019-2028 (en miles de USD)
TABLA 192 Mercado aeroespacial del Reino Unido en el vidrio plano, por tipo, 2019-2028 (en miles de USD)
TABLA 193 Mercado de electrodomésticos de vidrio plano en el Reino Unido, por tipo, 2019-2028 (en miles de USD)
TABLA 194 Mercado de energía solar en vidrio plano del Reino Unido, por aplicación, 2019-2028 (en miles de USD)
TABLA 195 Mercado de energía solar en vidrio plano del Reino Unido, por tipo, 2019-2028 (en miles de USD)
TABLA 196 Mercado de muebles de vidrio plano del Reino Unido, por tipo, 2019-2028 (en miles de USD)
TABLA 197 Otros sectores del Reino Unido en el mercado del vidrio plano, por tipo, 2019-2028 (en miles de USD)
TABLA 198 Mercado francés de vidrio plano, por tipo, 2019-2028 (en miles de USD)
TABLA 199 Mercado francés de vidrio plano, por tipo, 2019-2028 (miles de metros cuadrados)
TABLA 200 Mercado francés de vidrio plano, por función, 2019-2028 (en miles de USD)
TABLA 201 Mercado francés de vidrio plano, por producto, 2019-2028 (en miles de USD)
TABLA 202 Mercado francés de vidrio plano revestido, por resina de recubrimiento, 2019-2028 (en miles de USD)
TABLA 203 Tecnología de recubrimiento en el mercado de vidrio plano en Francia, por tecnología de recubrimiento, 2019-2028 (en miles de USD)
TABLA 204 Mercado francés de vidrio plano revestido, por proceso de recubrimiento, 2019-2028 (en miles de USD)
TABLA 205 Mercado francés de deposición química de vapor (CVD) (pirolítica) en vidrio plano por proceso, 2019-2028 (en miles de USD)
TABLA 206 Mercado francés de vidrio plano, por aplicación, 2019-2028 (en miles de USD)
TABLA 207 Construcción y edificación en el mercado de vidrio plano en Francia, por aplicación, 2019-2028 (en miles de USD)
TABLA 208 Construcción y edificación en el mercado de vidrio plano en Francia, por tipo, 2019-2028 (en miles de USD)
TABLA 209 Mercado de vidrio plano automotriz en Francia, por aplicación, 2019-2028 (en miles de USD)
TABLA 210 Mercado de vidrio plano automotriz en Francia, por tipo, 2019-2028 (en miles de USD)
TABLA 211 Industria aeroespacial francesa en el mercado del vidrio plano, por tipo, 2019-2028 (en miles de USD)
TABLA 212 Mercado francés de electrodomésticos de vidrio plano, por tipo, 2019-2028 (en miles de USD)
TABLA 213: Mercado francés de energía solar en vidrio plano, por aplicación, 2019-2028 (en miles de USD)
TABLA 214 Mercado francés de energía solar en vidrio plano, por tipo, 2019-2028 (en miles de USD)
TABLA 215 Mercado francés de muebles de vidrio plano, por tipo, 2019-2028 (en miles de USD)
TABLA 216 Francia Otros en el mercado del vidrio plano, por tipo, 2019-2028 (en miles de USD)
TABLA 217 Mercado italiano de vidrio plano, por tipo, 2019-2028 (miles de USD)
TABLA 218 Mercado italiano de vidrio plano, por tipo, 2019-2028 (miles de metros cuadrados)
TABLA 219 Mercado italiano de vidrio plano, por función, 2019-2028 (miles de USD)
TABLA 220 Italia Mercado de vidrio plano, por producto, 2019-2028 (miles de USD)
TABLA 221 Mercado italiano de vidrio plano recubierto, por resina de recubrimiento, 2019-2028 (en miles de USD)
TABLA 222 Tecnología de recubrimiento en el mercado italiano de vidrio plano, por tecnología de recubrimiento, 2019-2028 (en miles de USD)
TABLA 223 Mercado italiano de vidrio plano recubierto, por proceso de recubrimiento, 2019-2028 (en miles de USD)
TABLA 224 Italia Deposición química de vapor (CVD) (pirolítica) en el mercado de vidrio plano por proceso, 2019-2028 (en miles de USD)
TABLA 225 Mercado italiano de vidrio plano, por aplicación, 2019-2028 (en miles de USD)
TABLA 226 Italia: Construcción y edificación en el mercado de vidrio plano, por aplicación, 2019-2028 (en miles de USD)
TABLA 227 Italia Construcción y mercado de vidrio plano, por tipo, 2019-2028 (en miles de USD)
TABLA 228 Mercado italiano de vidrio plano automotriz, por aplicación, 2019-2028 (en miles de USD)
TABLA 229 Mercado de vidrio plano automotriz en Italia, por tipo, 2019-2028 (en miles de USD)
TABLA 230 Industria aeroespacial italiana en el mercado del vidrio plano, por tipo, 2019-2028 (en miles de USD)
TABLA 231 Mercado italiano de electrodomésticos de vidrio plano, por tipo, 2019-2028 (en miles de USD)
TABLA 232 Mercado italiano de energía solar en vidrio plano, por aplicación, 2019-2028 (en miles de USD)
TABLA 233 Mercado italiano de energía solar en vidrio plano, por tipo, 2019-2028 (en miles de USD)
TABLA 234 Mercado italiano de muebles de vidrio plano, por tipo, 2019-2028 (en miles de USD)
TABLA 235 Italia Otros en el mercado del vidrio plano, por tipo, 2019-2028 (en miles de USD)
TABLA 236 Mercado español de vidrio plano, por tipo, 2019-2028 (miles de USD)
TABLA 237 Mercado español de vidrio plano, por tipo, 2019-2028 (miles de metros cuadrados)
TABLA 238 Mercado español de vidrio plano, por función, 2019-2028 (miles de USD)
TABLA 239 MERCADO DE VIDRIO PLANO DE ESPAÑA, POR PRODUCTO, 2019-2028 (Miles de USD)
TABLA 240 Mercado español de vidrio plano recubierto, por resina de recubrimiento, 2019-2028 (en miles de USD)
TABLA 241 Tecnología de recubrimiento en el mercado español de vidrio plano, por tecnología de recubrimiento, 2019-2028 (en miles de USD)
TABLA 242 Mercado español de vidrio plano recubierto, por proceso de recubrimiento, 2019-2028 (en miles de USD)
TABLA 243 Mercado español de deposición química de vapor (CVD) (pirolítica) en vidrio plano, por proceso, 2019-2028 (en miles de USD)
TABLA 244 Mercado español de vidrio plano, por aplicación, 2019-2028 (miles de USD)
TABLA 245 España: Construcción y mercado del vidrio plano, por aplicación, 2019-2028 (en miles de USD)
TABLA 246 España. Construcción y edificación en el mercado de vidrio plano, por tipo, 2019-2028 (en miles de USD)
TABLA 247 Mercado de vidrio plano automotriz en España, por aplicación, 2019-2028 (en miles de USD)
TABLA 248 Mercado de automoción en vidrio plano en España, por tipo, 2019-2028 (en miles de USD)
TABLA 249 Mercado aeroespacial español en vidrio plano, por tipo, 2019-2028 (en miles de USD)
TABLA 250 Mercado de electrodomésticos en vidrio plano en España, por tipo, 2019-2028 (en miles de USD)
TABLA 251 Mercado español de energía solar en vidrio plano, por aplicación 2019-2028 (en miles de USD)
TABLA 252 Mercado español de energía solar en vidrio plano, por tipo, 2019-2028 (en miles de USD)
TABLA 253 Mercado español de muebles de vidrio plano, por tipo, 2019-2028 (en miles de USD)
TABLA 254 España Otros en el mercado del vidrio plano, por tipo, 2019-2028 (en miles de USD)
TABLA 255 Mercado de vidrio plano en los Países Bajos, por tipo, 2019-2028 (en miles de USD)
TABLA 256 Mercado de vidrio plano en los Países Bajos, por tipo, 2019-2028 (miles de metros cuadrados)
TABLA 257 Mercado de vidrio plano de los Países Bajos, por función, 2019-2028 (en miles de USD)
TABLA 258 MERCADO DE VIDRIO PLANO DE LOS PAÍSES BAJOS, POR PRODUCTO, 2019-2028 (Miles de USD)
TABLA 259 Mercado de vidrio plano recubierto en Países Bajos, por resina de recubrimiento, 2019-2028 (en miles de USD)
TABLA 260 Tecnología de recubrimiento en el mercado de vidrio plano de los Países Bajos, por tecnología de recubrimiento, 2019-2028 (en miles de USD)
TABLA 261 Mercado de vidrio plano recubierto en Países Bajos, por proceso de recubrimiento, 2019-2028 (en miles de USD)
TABLA 262 Mercado de deposición química de vapor (CVD) (pirolítica) en vidrio plano en los Países Bajos, por proceso, 2019-2028 (en miles de USD)
TABLA 263 Mercado de vidrio plano de los Países Bajos, por aplicación, 2019-2028 (en miles de USD)
TABLA 264 Mercado de construcción y edificación de vidrio plano en los Países Bajos, por aplicación, 2019-2028 (en miles de USD)
TABLA 265 Mercado de construcción y edificación de vidrio plano en los Países Bajos, por tipo, 2019-2028 (en miles de USD)
TABLA 266 Mercado de vidrio plano automotriz en los Países Bajos, por aplicación, 2019-2028 (en miles de USD)
TABLA 267 Mercado de vidrio plano automotriz en los Países Bajos, por tipo, 2019-2028 (en miles de USD)
TABLA 268 Mercado aeroespacial neerlandés de vidrio plano, por tipo, 2019-2028 (en miles de USD)
TABLA 269 Mercado de electrodomésticos de vidrio plano en los Países Bajos, por tipo, 2019-2028 (en miles de USD)
TABLA 270 Mercado de energía solar en vidrio plano en los Países Bajos, por aplicación, 2019-2028 (en miles de USD)
TABLA 271 Mercado de energía solar en vidrio plano en los Países Bajos, por tipo, 2019-2028 (en miles de USD)
TABLA 272 Mercado de muebles de vidrio plano en los Países Bajos, por tipo, 2019-2028 (en miles de USD)
TABLA 273 Países Bajos Otros en el mercado del vidrio plano, por tipo, 2019-2028 (en miles de USD)
TABLA 274 Mercado belga de vidrio plano, por tipo, 2019-2028 (miles de USD)
TABLA 275 Mercado belga de vidrio plano, por tipo, 2019-2028 (miles de metros cuadrados)
TABLA 276 Mercado belga de vidrio plano, por función, 2019-2028 (miles de USD)
TABLA 277 MERCADO DE VIDRIO PLANO DE BERLÍN, POR PRODUCTO, 2019-2028 (Miles de USD)
TABLA 278 Mercado belga de vidrio plano recubierto, por resina de recubrimiento, 2019-2028 (en miles de USD)
TABLA 279 Tecnología de recubrimiento en el mercado de vidrio plano de Bélgica, por tecnología de recubrimiento, 2019-2028 (en miles de USD)
TABLA 280 Mercado belga de vidrio plano revestido, por proceso de recubrimiento, 2019-2028 (en miles de USD)
TABLA 281 Deposición química de vapor (CVD) (pirolítica) en el mercado de vidrio plano de Bélgica, por proceso, 2019-2028 (en miles de USD)
TABLA 282 Mercado belga de vidrio plano, por aplicación, 2019-2028 (en miles de USD)
TABLA 283 Construcción y edificación en el mercado belga de vidrio plano, por aplicación, 2019-2028 (en miles de USD)
TABLA 284 Construcción y edificación en el mercado de vidrio plano de Bélgica, por tipo, 2019-2028 (en miles de USD)
TABLA 285 Mercado belga de vidrio plano automotriz, por aplicación, 2019-2028 (en miles de USD)
TABLA 286 Mercado de vidrio plano automotriz belga, por tipo, 2019-2028 (en miles de USD)
TABLA 287 Mercado aeroespacial belga en el vidrio plano, por tipo, 2019-2028 (en miles de USD)
TABLA 288 Mercado belga de electrodomésticos de vidrio plano, por tipo, 2019-2028 (en miles de USD)
TABLA 289 Mercado belga de energía solar en vidrio plano, por aplicación, 2019-2028 (en miles de USD)
TABLA 290 Mercado belga de energía solar en vidrio plano, por tipo, 2019-2028 (en miles de USD)
TABLA 291 Mercado belga de muebles de vidrio plano, por tipo, 2019-2028 (en miles de USD)
TABLA 292 Bélgica Otros en el mercado del vidrio plano, por tipo, 2019-2028 (en miles de USD)
TABLA 293 Mercado de vidrio plano de Rusia, por tipo, 2019-2028 (miles de USD)
TABLA 294 Mercado de vidrio plano en Rusia, por tipo, 2019-2028 (miles de metros cuadrados)
TABLA 295 Mercado de vidrio plano de Rusia, por función, 2019-2028 (miles de USD)
TABLA 296 Rusia MERCADO DE VIDRIO PLANO, POR PRODUCTO, 2019-2028 (Miles de USD)
TABLA 297 Mercado de vidrio plano recubierto en Rusia, por resina de recubrimiento, 2019-2028 (en miles de USD)
TABLA 298 Tecnología de recubrimiento en el mercado de vidrio plano de Rusia, por tecnología de recubrimiento, 2019-2028 (en miles de USD)
TABLA 299 Mercado ruso de vidrio plano recubierto, por proceso de recubrimiento, 2019-2028 (en miles de USD)
TABLA 300 Deposición química de vapor (CVD) (pirolítica) en el mercado de vidrio plano de Rusia, por proceso, 2019-2028 (en miles de USD)
TABLA 301 Mercado ruso de vidrio plano, por aplicación, 2019-2028 (en miles de USD)
TABLA 302 Rusia: Construcción y edificación en el mercado de vidrio plano, por aplicación, 2019-2028 (en miles de USD)
TABLA 303 Rusia: Construcción y mercado de vidrio plano, por tipo, 2019-2028 (en miles de USD)
TABLA 304 Mercado ruso de vidrio plano automotriz, por aplicación, 2019-2028 (en miles de USD)
TABLA 305 Mercado ruso de vidrio plano automotriz, por tipo, 2019-2028 (en miles de USD)
TABLA 306 Industria aeroespacial rusa en el mercado del vidrio plano, por tipo, 2019-2028 (en miles de USD)
TABLA 307 Electrodomésticos en el mercado ruso de vidrio plano, por tipo, 2019-2028 (en miles de USD)
TABLA 308 Energía solar en el mercado de vidrio plano de Rusia, por aplicación, 2019-2028 (en miles de USD)
TABLA 309 Energía solar en el mercado de vidrio plano de Rusia, por tipo, 2019-2028 (en miles de USD)
TABLA 310 Mercado ruso de muebles de vidrio plano, por tipo, 2019-2028 (en miles de USD)
TABLA 311 Rusia Otros en el mercado del vidrio plano, por tipo, 2019-2028 (en miles de USD)
TABLA 312 Mercado de vidrio plano de Turquía, por tipo, 2019-2028 (miles de USD)
TABLA 313 Mercado de vidrio plano en Turquía, por tipo, 2019-2028 (miles de metros cuadrados)
TABLA 314 Mercado de vidrio plano de Turquía, por función, 2019-2028 (miles de USD)
TABLA 315 MERCADO DE VIDRIO PLANO DE TURQUÍA, POR PRODUCTO, 2019-2028 (Miles de USD)
TABLA 316 Mercado de vidrio plano recubierto de Turquía, por resina de recubrimiento, 2019-2028 (en miles de USD)
TABLA 317 Tecnología de recubrimiento en el mercado de vidrio plano de Turquía, por tecnología de recubrimiento, 2019-2028 (en miles de USD)
TABLA 318 Mercado de vidrio plano recubierto de Turquía, por proceso de recubrimiento, 2019-2028 (en miles de USD)
TABLA 319 Mercado de deposición química de vapor (CVD) (pirolítica) en vidrio plano en Turquía por proceso, 2019-2028 (en miles de USD)
TABLA 320 Mercado de vidrio plano de Turquía, por aplicación, 2019-2028 (en miles de USD)
TABLA 321 Turquía: Construcción y mercado de vidrio plano, por aplicación, 2019-2028 (en miles de USD)
TABLA 322 Turquía: Construcción y mercado de vidrio plano, por tipo, 2019-2028 (en miles de USD)
TABLA 323 Mercado de vidrio plano automotriz de Turquía, por aplicación, 2019-2028 (en miles de USD)
TABLA 324 Mercado de vidrio plano automotriz en Turquía, por tipo, 2019-2028 (en miles de USD)
TABLA 325 Mercado aeroespacial de vidrio plano en Turquía, por tipo, 2019-2028 (en miles de USD)
TABLA 326 Electrodomésticos en el mercado de vidrio plano de Turquía, por tipo, 2019-2028 (en miles de USD)
TABLA 327 Mercado de energía solar en vidrio plano en Turquía, por aplicación, 2019-2028 (en miles de USD)
TABLA 328 Mercado de energía solar en vidrio plano en Turquía, por tipo, 2019-2028 (en miles de USD)
TABLA 329 Mercado de muebles de vidrio plano en Turquía, por tipo, 2019-2028 (en miles de USD)
TABLA 330 Turquía Otros en el mercado del vidrio plano, por tipo, 2019-2028 (en miles de USD)
TABLA 331 Mercado suizo de vidrio plano, por tipo, 2019-2028 (miles de USD)
TABLA 332 Mercado suizo de vidrio plano, por tipo, 2019-2028 (miles de metros cuadrados)
TABLA 333 Mercado suizo de vidrio plano, por función, 2019-2028 (miles de USD)
TABLA 334 MERCADO DE VIDRIO PLANO DE SUIZA, POR PRODUCTO, 2019-2028 (Miles de USD)
TABLA 335 Mercado suizo de vidrio plano recubierto, por resina de recubrimiento, 2019-2028 (en miles de USD)
TABLA 336 Tecnología de recubrimiento en el mercado suizo de vidrio plano, por tecnología de recubrimiento, 2019-2028 (en miles de USD)
TABLA 337 Mercado suizo de vidrio plano recubierto, por proceso de recubrimiento, 2019-2028 (en miles de USD)
TABLA 338 Deposición química de vapor (CVD) (pirolítica) en el mercado de vidrio plano en Suiza, por proceso, 2019-2028 (en miles de USD)
TABLA 339 Mercado suizo de vidrio plano, por aplicación, 2019-2028 (en miles de USD)
TABLA 340 Suiza: Construcción y edificación en el mercado del vidrio plano, por aplicación, 2019-2028 (en miles de USD)
TABLA 341 Suiza: Construcción y mercado de vidrio plano, por tipo, 2019-2028 (en miles de USD)
TABLA 342 Mercado suizo de vidrio plano automotriz, por aplicación, 2019-2028 (en miles de USD)
TABLA 343 Mercado suizo de vidrio plano automotriz, por tipo, 2019-2028 (en miles de USD)
TABLA 344 Mercado aeroespacial suizo en vidrio plano, por tipo, 2019-2028 (en miles de USD)
TABLA 345 Mercado suizo de electrodomésticos de vidrio plano, por tipo, 2019-2028 (en miles de USD)
TABLA 346 Mercado suizo de energía solar en vidrio plano, por aplicación, 2019-2028 (en miles de USD)
TABLA 347 Mercado suizo de energía solar en vidrio plano, por tipo, 2019-2028 (en miles de USD)
TABLA 348 Mercado suizo de muebles de vidrio plano, por tipo, 2019-2028 (en miles de USD)
TABLA 349 Suiza Otros en el mercado del vidrio plano, por tipo, 2019-2028 (miles de USD)
TABLA 350 Mercado de vidrio plano del resto de Europa, por tipo, 2019-2028 (miles de USD)
TABLA 351 Mercado de vidrio plano del resto de Europa, por tipo, 2019-2028 (miles de metros cuadrados)
TABLA 352 Mercado de vidrio plano de Asia-Pacífico, POR PAÍS, 2019-2028 (Miles de USD)
TABLA 353 Mercado de vidrio plano de Asia-Pacífico, POR PAÍS, 2019-2028 (Miles de metros cuadrados)
TABLA 354 Mercado de vidrio plano de Asia-Pacífico, por tipo, 2019-2028 (miles de USD)
TABLA 355 Mercado de vidrio plano de Asia-Pacífico, por tipo, 2019-2028 (miles de metros cuadrados)
TABLA 356 Mercado de vidrio plano de Asia-Pacífico, por función, 2019-2028 (miles de USD)
TABLA 357 MERCADO DE VIDRIO PLANO DE ASIA-Pacífico, POR PRODUCTO, 2019-2028 (Miles de USD)
TABLA 358 Mercado de vidrio plano recubierto en Asia-Pacífico, por resina de recubrimiento, 2019-2028 (en miles de USD)
TABLA 359 Tecnología de recubrimiento en el mercado de vidrio plano de Asia-Pacífico, por tecnología de recubrimiento, 2019-2028 (en miles de USD)
TABLA 360 Mercado de vidrio plano recubierto en Asia-Pacífico, por proceso de recubrimiento, 2019-2028 (en miles de USD)
TABLA 361 Mercado de deposición química de vapor (CVD) (pirolítica) en vidrio plano de Asia-Pacífico, por proceso, 2019-2028 (en miles de USD)
TABLA 362 Mercado de vidrio plano de Asia-Pacífico, por aplicación, 2019-2028 (en miles de USD)
TABLA 363 Mercado de construcción y edificación de vidrio plano en Asia-Pacífico, por aplicación, 2019-2028 (en miles de USD)
TABLA 364 Mercado de construcción y edificación de vidrio plano en Asia-Pacífico, por tipo, 2019-2028 (en miles de USD)
TABLA 365 Mercado de vidrio plano automotriz en Asia-Pacífico, por aplicación, 2019-2028 (en miles de USD)
TABLA 366 Mercado automotriz de vidrio plano en Asia-Pacífico, por tipo, 2019-2028 (en miles de USD)
TABLA 367 Mercado aeroespacial de vidrio plano en Asia-Pacífico, por tipo, 2019-2028 (en miles de USD)
TABLA 368 Mercado de electrodomésticos de vidrio plano en Asia-Pacífico, por tipo, 2019-2028 (en miles de USD)
TABLA 369 Mercado de energía solar en vidrio plano de Asia-Pacífico, por aplicación, 2019-2028 (en miles de USD)
TABLA 370 Mercado de energía solar en vidrio plano de Asia-Pacífico, por tipo, 2019-2028 (en miles de USD)
TABLA 371 Mercado de muebles de vidrio plano en Asia-Pacífico, por tipo, 2019-2028 (en miles de USD)
TABLA 372 Mercado de vidrio plano de Asia-Pacífico, por tipo, 2019-2028 (en miles de USD)
TABLA 373 Mercado de vidrio plano de China, por tipo, 2019-2028 (miles de USD)
TABLA 374 Mercado de vidrio plano de China, por tipo, 2019-2028 (miles de metros cuadrados)
TABLA 375 Mercado de vidrio plano de China, por función, 2019-2028 (miles de USD)
TABLA 376 MERCADO DE VIDRIO PLANO DE CHINA, POR PRODUCTO, 2019-2028 (Miles de USD)
TABLA 377 Mercado de vidrio plano recubierto de China, por resina de recubrimiento, 2019-2028 (en miles de USD)
TABLA 378 Tecnología de recubrimiento de China en el mercado del vidrio plano, por tecnología de recubrimiento, 2019-2028 (en miles de USD)
TABLA 379 Mercado de vidrio plano recubierto de China, por proceso de recubrimiento, 2019-2028 (en miles de USD)
TABLA 380 Deposición química de vapor (CVD) (pirolítica) en el mercado de vidrio plano de China, por proceso, 2019-2028 (en miles de USD)
TABLA 381 Mercado de vidrio plano de China, por aplicación, 2019-2028 (en miles de USD)
TABLA 382 Mercado de construcción y edificación de vidrio plano en China, por aplicación, 2019-2028 (en miles de USD)
TABLA 383 Construcción y edificación en el mercado de vidrio plano de China, por tipo, 2019-2028 (en miles de USD)
TABLA 384 Mercado de vidrio plano automotriz de China, por aplicación, 2019-2028 (en miles de USD)
TABLA 385 Mercado de vidrio plano automotriz de China, por tipo, 2019-2028 (en miles de USD)
TABLA 386 Mercado aeroespacial de China en el vidrio plano, por tipo, 2019-2028 (en miles de USD)
TABLA 387 Electrodomésticos de China en el mercado de vidrio plano, por tipo, 2019-2028 (en miles de USD)
TABLA 388 Energía solar en el mercado de vidrio plano de China, por aplicación, 2019-2028 (en miles de USD)
TABLA 389 Energía solar en el mercado de vidrio plano de China, por tipo, 2019-2028 (en miles de USD)
TABLA 390 Mercado de muebles de vidrio plano de China, por tipo, 2019-2028 (en miles de USD)
TABLA 391 Otros mercados de China en el mercado del vidrio plano, por tipo, 2019-2028 (en miles de USD)
TABLA 392 Mercado de vidrio plano de la INDIA, por tipo, 2019-2028 (en miles de USD)
TABLA 393 Mercado de vidrio plano en India, por tipo, 2019-2028 (miles de metros cuadrados)
TABLA 394 Mercado de vidrio plano de la INDIA, por función, 2019-2028 (miles de USD)
TABLA 395 MERCADO DE VIDRIO PLANO DE LA INDIA, POR PRODUCTO, 2019-2028 (Miles de USD)
TABLA 396 INDIA: Mercado de vidrio plano recubierto, por resina de recubrimiento, 2019-2028 (en miles de USD)
TABLA 397 INDIA: Tecnología de recubrimiento en el mercado de vidrio plano, por tecnología de recubrimiento, 2019-2028 (en miles de USD)
TABLA 398 INDIA Mercado de vidrio plano revestido, por proceso de recubrimiento, 2019-2028 (en miles de USD)
TABLA 399 INDIA Deposición química de vapor (CVD) (pirolítica) en el mercado de vidrio plano por proceso, 2019-2028 (en miles de USD)
TABLA 400 Mercado de vidrio plano de la INDIA, por aplicación, 2019-2028 (en miles de USD)
TABLA 401 INDIA Construcción y edificación en el mercado de vidrio plano, por aplicación, 2019-2028 (en miles de USD)
TABLA 402 INDIA Construcción y edificación en el mercado de vidrio plano, por tipo, 2019-2028 (en miles de USD)
TABLA 403 INDIA Mercado automotriz de vidrio plano, por aplicación, 2019-2028 (en miles de USD)
TABLA 404 INDIA Mercado automotriz de vidrio plano, por tipo, 2019-2028 (en miles de USD)
TABLA 405 INDIA Aeroespacial en el mercado del vidrio plano, por tipo, 2019-2028 (en miles de USD)
TABLA 406 INDIA: Electrodomésticos en el mercado de vidrio plano, por tipo, 2019-2028 (en miles de USD)
TABLA 407 INDIA: Energía solar en el mercado del vidrio plano, por aplicación, 2019-2028 (en miles de USD)
TABLA 408 INDIA: Energía solar en el mercado de vidrio plano, por tipo, 2019-2028 (en miles de USD)
TABLA 409 INDIA: Mercado de muebles de vidrio plano, por tipo, 2019-2028 (en miles de USD)
TABLA 410 INDIA Otros en el mercado del vidrio plano, por tipo, 2019-2028 (en miles de USD)
TABLA 411 Mercado japonés de vidrio plano, por tipo, 2019-2028 (miles de USD)
TABLA 412 Mercado japonés de vidrio plano, por tipo, 2019-2028 (miles de metros cuadrados)
TABLA 413 Mercado japonés de vidrio plano, por función, 2019-2028 (miles de USD)
TABLA 414 MERCADO DE VIDRIO PLANO DE JAPÓN, POR PRODUCTO, 2019-2028 (Miles de USD)
TABLA 415 Mercado japonés de vidrio plano recubierto, por resina de recubrimiento, 2019-2028 (en miles de USD)
TABLA 416 Tecnología de recubrimiento en el mercado japonés de vidrio plano, por tecnología de recubrimiento, 2019-2028 (en miles de USD)
TABLA 417 Mercado japonés de vidrio plano recubierto, por proceso de recubrimiento, 2019-2028 (en miles de USD)
TABLA 418 Deposición química de vapor (CVD) (pirolítica) en el mercado de vidrio plano en Japón, por proceso, 2019-2028 (en miles de USD)
TABLA 419 Mercado japonés de vidrio plano, por aplicación, 2019-2028 (en miles de USD)
TABLA 420 Mercado japonés de construcción y edificación de vidrio plano, por aplicación, 2019-2028 (en miles de USD)
TABLA 421 Construcción y edificación en el mercado de vidrio plano en Japón, por tipo, 2019-2028 (en miles de USD)
TABLA 422 Mercado automotriz japonés de vidrio plano, por aplicación, 2019-2028 (en miles de USD)
TABLA 423 Mercado automotriz japonés de vidrio plano, por tipo, 2019-2028 (en miles de USD)
TABLA 424 Industria aeroespacial japonesa en el mercado del vidrio plano, por tipo, 2019-2028 (en miles de USD)
TABLA 425 Electrodomésticos japoneses en el mercado de vidrio plano, por tipo, 2019-2028 (en miles de USD)
TABLA 426 Mercado japonés de energía solar en vidrio plano, por aplicación, 2019-2028 (en miles de USD)
TABLA 427 Mercado japonés de energía solar en vidrio plano, por tipo, 2019-2028 (en miles de USD)
TABLA 428 Mercado japonés de muebles de vidrio plano, por tipo, 2019-2028 (en miles de USD)
TABLA 429 Japón Otros en el mercado del vidrio plano, por tipo, 2019-2028 (en miles de USD)
TABLA 430 Mercado de vidrio plano de Corea del Sur, por tipo, 2019-2028 (en miles de USD)
TABLA 431 Mercado de vidrio plano de Corea del Sur, por tipo, 2019-2028 (miles de metros cuadrados)
TABLA 432 Mercado de vidrio plano de Corea del Sur, por función, 2019-2028 (miles de USD)
TABLA 433 MERCADO DE VIDRIO PLANO DE COREA DEL SUR, POR PRODUCTO, 2019-2028 (Miles de USD)
TABLA 434 Mercado de vidrio plano recubierto de Corea del Sur, por resina de recubrimiento, 2019-2028 (en miles de USD)
TABLA 435 Tecnología de recubrimiento de Corea del Sur en el mercado de vidrio plano, por tecnología de recubrimiento, 2019-2028 (en miles de USD)
TABLA 436 Mercado de vidrio plano recubierto de Corea del Sur, por proceso de recubrimiento, 2019-2028 (en miles de USD)
TABLA 437 Mercado de deposición química de vapor (CVD) (pirolítica) en vidrio plano de Corea del Sur, por proceso, 2019-2028 (en miles de USD)
TABLA 438 Mercado de vidrio plano de Corea del Sur, por aplicación, 2019-2028 (en miles de USD)
TABLA 439 Mercado de construcción y edificación de vidrio plano en Corea del Sur, por aplicación, 2019-2028 (en miles de USD)
TABLA 440 Mercado de construcción y edificación de vidrio plano en Corea del Sur, por tipo, 2019-2028 (en miles de USD)
TABLA 441 Mercado de vidrio plano automotriz de Corea del Sur, por aplicación, 2019-2028 (en miles de USD)
TABLA 442 Mercado de vidrio plano automotriz de Corea del Sur, por tipo, 2019-2028 (en miles de USD)
TABLA 443 Mercado de vidrio plano de la industria aeroespacial de Corea del Sur, por tipo, 2019-2028 (en miles de USD)
TABLA 444 Electrodomésticos de Corea del Sur en el mercado de vidrio plano, por tipo, 2019-2028 (en miles de USD)
TABLA 445 Mercado de energía solar en vidrio plano de Corea del Sur, por aplicación, 2019-2028 (en miles de USD)
TABLA 446 Mercado de energía solar en vidrio plano de Corea del Sur, por tipo, 2019-2028 (en miles de USD)
TABLA 447 Mercado de muebles de vidrio plano de Corea del Sur, por tipo, 2019-2028 (en miles de USD)
TABLA 448 Corea del Sur Otros en el mercado del vidrio plano, por tipo, 2019-2028 (en miles de USD)
TABLA 449 Mercado de vidrio plano de Australia y Nueva Zelanda, por tipo, 2019-2028 (miles de USD)
TABLA 450 Mercado de vidrio plano de Australia y Nueva Zelanda, por tipo, 2019-2028 (miles de metros cuadrados)
TABLA 451 Mercado de vidrio plano de Australia y Nueva Zelanda, por función, 2019-2028 (miles de USD)
TABLA 452 Mercado de vidrio plano de Australia y Nueva Zelanda, por producto, 2019-2028 (miles de USD)
TABLA 453 Mercado de vidrio plano recubierto de Australia y Nueva Zelanda, por resina de recubrimiento, 2019-2028 (en miles de USD)
TABLA 454 Tecnología de recubrimiento de Australia y Nueva Zelanda en el mercado de vidrio plano, por tecnología de recubrimiento, 2019-2028 (en miles de USD)
TABLA 455 Mercado de vidrio plano recubierto de Australia y Nueva Zelanda, por proceso de recubrimiento, 2019-2028 (en miles de USD)
TABLA 456 Deposición química de vapor (CVD) (pirolítica) en el mercado de vidrio plano de Australia y Nueva Zelanda, por proceso, 2019-2028 (en miles de USD)
TABLA 457 Mercado de vidrio plano de Australia y Nueva Zelanda, por aplicación, 2019-2028 (miles de USD)
TABLA 458 Australia y Nueva Zelanda: Mercado de construcción y edificación de vidrio plano, por aplicación, 2019-2028 (en miles de USD)
TABLA 459 Australia y Nueva Zelanda: Construcción y mercado de vidrio plano, por tipo, 2019-2028 (en miles de USD)
TABLA 460 Mercado automotriz de vidrio plano en Australia y Nueva Zelanda, por aplicación, 2019-2028 (en miles de USD)
TABLA 461 Mercado automotriz de vidrio plano en Australia y Nueva Zelanda, por tipo, 2019-2028 (en miles de USD)
TABLA 462 Mercado aeroespacial de vidrio plano en Australia y Nueva Zelanda, por tipo, 2019-2028 (en miles de USD)
TABLA 463 Mercado de electrodomésticos de vidrio plano en Australia y Nueva Zelanda, por tipo, 2019-2028 (en miles de USD)
TABLA 464 Mercado de energía solar en vidrio plano de Australia y Nueva Zelanda, por aplicación 2019-2028 (miles de USD)
TABLA 465 Mercado de energía solar en vidrio plano de Australia y Nueva Zelanda, por tipo, 2019-2028 (en miles de USD)
TABLA 466 Mercado de muebles de vidrio plano de Australia y Nueva Zelanda, por tipo, 2019-2028 (en miles de USD)
TABLA 467 Australia y Nueva Zelanda Otros en el mercado del vidrio plano, por tipo, 2019-2028 (miles de USD)
TABLA 468 Mercado de vidrio plano de Indonesia, por tipo, 2019-2028 (miles de USD)
TABLA 469 Mercado de vidrio plano de Indonesia, por tipo, 2019-2028 (miles de metros cuadrados)
TABLA 470 Mercado de vidrio plano de Indonesia, por función, 2019-2028 (miles de USD)
TABLA 471 Mercado de vidrio plano de Indonesia, por producto, 2019-2028 (en miles de USD)
TABLA 472 Mercado de vidrio plano recubierto en Indonesia, por resina de recubrimiento, 2019-2028 (en miles de USD)
TABLA 473 Tecnología de recubrimiento en el mercado de vidrio plano de Indonesia, por tecnología de recubrimiento, 2019-2028 (en miles de USD)
TABLA 474 Mercado de vidrio plano recubierto de Indonesia, por proceso de recubrimiento, 2019-2028 (en miles de USD)
TABLA 475 Deposición química de vapor (CVD) (pirolítica) en el mercado de vidrio plano de Indonesia, por proceso, 2019-2028 (en miles de USD)
TABLA 476 Mercado de vidrio plano de Indonesia, por aplicación, 2019-2028 (miles de USD)
TABLA 477 Construcción y edificación en el mercado de vidrio plano de Indonesia, por aplicación, 2019-2028 (en miles de USD)
TABLA 478 Construcción y edificación en el mercado de vidrio plano de Indonesia, por tipo, 2019-2028 (en miles de USD)
TABLA 479 Mercado de vidrio plano automotriz de Indonesia, por aplicación, 2019-2028 (en miles de USD)
TABLA 480 Mercado de vidrio plano automotriz en Indonesia, por tipo, 2019-2028 (en miles de USD)
TABLA 481 Mercado de vidrio plano aeroespacial de Indonesia, por tipo, 2019-2028 (en miles de USD)
TABLA 482 Mercado de electrodomésticos de vidrio plano en Indonesia, por tipo, 2019-2028 (en miles de USD)
TABLA 483 Mercado de energía solar en vidrio plano de Indonesia, por aplicación, 2019-2028 (en miles de USD)
TABLA 484 Mercado de energía solar en vidrio plano de Indonesia, por tipo, 2019-2028 (en miles de USD)
TABLA 485 Mercado de muebles de vidrio plano en Indonesia, por tipo, 2019-2028 (en miles de USD)
TABLA 486 Indonesia Otros en el mercado del vidrio plano, por tipo, 2019-2028 (en miles de USD)
TABLA 487 Mercado de vidrio plano de Singapur, por tipo, 2019-2028 (en miles de USD)
TABLA 488 Mercado de vidrio plano de Singapur, por tipo, 2019-2028 (miles de metros cuadrados)
TABLA 489 Mercado de vidrio plano de Singapur, por función, 2019-2028 (miles de USD)
TABLA 490 MERCADO DE VIDRIO PLANO DE SINGAPU, POR PRODUCTO, 2019-2028 (Miles de USD)
TABLA 491 Mercado de vidrio plano recubierto de Singapur, por resina de recubrimiento, 2019-2028 (en miles de USD)
TABLA 492 Tecnología de recubrimiento en el mercado de vidrio plano de Singapur, por tecnología de recubrimiento, 2019-2028 (en miles de USD)
TABLA 493 Mercado de vidrio plano recubierto de Singapur, por proceso de recubrimiento, 2019-2028 (en miles de USD)
TABLA 494 Mercado de deposición química de vapor (CVD) (pirolítica) en vidrio plano de Singapur, por proceso, 2019-2028 (en miles de USD)
TABLA 495 Mercado de vidrio plano de Singapur, por aplicación, 2019-2028 (en miles de USD)
TABLA 496 Mercado de construcción y edificación de vidrio plano en Singapur, por aplicación, 2019-2028 (en miles de USD)
TABLA 497 Construcción y edificación en el mercado de vidrio plano de Singapur, por tipo, 2019-2028 (en miles de USD)
TABLA 498 Mercado automotriz de vidrio plano en Singapur, por aplicación, 2019-2028 (en miles de USD)
TABLA 499 Mercado automotriz de vidrio plano en Singapur, por tipo, 2019-2028 (en miles de USD)
TABLA 500 Mercado aeroespacial de Singapur en el vidrio plano, por tipo, 2019-2028 (en miles de USD)
TABLA 501 Electrodomésticos de Singapur en el mercado de vidrio plano, por tipo, 2019-2028 (en miles de USD)
TABLA 502 Mercado de energía solar en vidrio plano de Singapur, por aplicación, 2019-2028 (en miles de USD)
TABLA 503 Mercado de energía solar en vidrio plano de Singapur, por tipo, 2019-2028 (en miles de USD)
TABLA 504 Mercado de muebles de vidrio plano en Singapur, por tipo, 2019-2028 (en miles de USD)
TABLA 505 Otros sectores del mercado de vidrio plano de Singapur, por tipo, 2019-2028 (en miles de USD)
TABLA 506 Mercado de vidrio plano de Malasia, por tipo, 2019-2028 (en miles de USD)
TABLA 507 Mercado de vidrio plano de Malasia, por tipo, 2019-2028 (miles de metros cuadrados)
TABLA 508 Mercado de vidrio plano de Malasia, por función, 2019-2028 (en miles de USD)
TABLA 509 MERCADO DE VIDRIO PLANO DE MALAYA, POR PRODUCTO, 2019-2028 (Miles de USD)
TABLA 510 Mercado de vidrio plano recubierto de Malasia, por resina de recubrimiento, 2019-2028 (en miles de USD)
TABLA 511 Tecnología de recubrimiento en el mercado de vidrio plano de Malasia, por tecnología de recubrimiento, 2019-2028 (en miles de USD)
TABLA 512 Mercado de vidrio plano recubierto de Malasia, por proceso de recubrimiento, 2019-2028 (en miles de USD)
TABLA 513 Deposición química de vapor (CVD) (pirolítica) en el mercado de vidrio plano de Malasia, por proceso, 2019-2028 (en miles de USD)
TABLA 514 Mercado de vidrio plano de Malasia, por aplicación, 2019-2028 (en miles de USD)
TABLA 515 Construcción y edificación en el mercado de vidrio plano de Malasia, por aplicación, 2019-2028 (en miles de USD)
TABLA 516 Construcción y edificación en el mercado de vidrio plano de Malasia, por tipo, 2019-2028 (en miles de USD)
TABLA 517 Mercado automotriz de vidrio plano en Malasia, por aplicación, 2019-2028 (en miles de USD)
TABLA 518 Mercado automotriz de vidrio plano en Malasia, por tipo, 2019-2028 (en miles de USD)
TABLA 519 Industria aeroespacial de Malasia en el mercado del vidrio plano, por tipo, 2019-2028 (en miles de USD)
TABLA 520 Electrodomésticos de Malasia en el mercado de vidrio plano, por tipo, 2019-2028 (en miles de USD)
TABLA 521 Mercado de energía solar en vidrio plano de Malasia, por aplicación, 2019-2028 (en miles de USD)
TABLA 522 Mercado de energía solar en vidrio plano de Malasia, por tipo, 2019-2028 (en miles de USD)
TABLA 523 Mercado de muebles de vidrio plano de Malasia, por tipo, 2019-2028 (en miles de USD)
TABLA 524 Mercado de vidrio plano en Malasia, por tipo, 2019-2028 (en miles de USD)
TABLA 525 Mercado de vidrio plano de Tailandia, por tipo, 2019-2028 (en miles de USD)
TABLA 526 Mercado de vidrio plano de Tailandia, por tipo, 2019-2028 (miles de metros cuadrados)
TABLA 527 Mercado de vidrio plano de Tailandia, por función, 2019-2028 (en miles de USD)
TABLA 528 MERCADO DE VIDRIO PLANO DE TALANDIA, POR PRODUCTO, 2019-2028 (Miles de USD)
TABLA 529 Mercado de vidrio plano revestido en Tailandia, por resina de recubrimiento, 2019-2028 (en miles de USD)
TABLA 530 Tecnología de recubrimiento en el mercado de vidrio plano de Tailandia, por tecnología de recubrimiento, 2019-2028 (en miles de USD)
TABLA 531 Mercado de vidrio plano revestido en Tailandia, por proceso de recubrimiento, 2019-2028 (en miles de USD)
TABLA 532 Deposición química de vapor (CVD) (pirolítica) en el mercado de vidrio plano de Tailandia, por proceso, 2019-2028 (en miles de USD)
TABLA 533 Mercado de vidrio plano de Tailandia, por aplicación, 2019-2028 (en miles de USD)
TABLA 534 Mercado de construcción y edificación de vidrio plano en Tailandia, por aplicación, 2019-2028 (en miles de USD)
TABLA 535 Construcción y edificación en el mercado de vidrio plano de Tailandia, por tipo, 2019-2028 (en miles de USD)
TABLA 536 Mercado de vidrio plano automotriz de Tailandia, por aplicación, 2019-2028 (en miles de USD)
TABLA 537 Mercado de vidrio plano automotriz de Tailandia, por tipo, 2019-2028 (en miles de USD)
TABLA 538 Mercado de vidrio plano de la industria aeroespacial de Tailandia, por tipo, 2019-2028 (en miles de USD)
TABLA 539 Mercado de electrodomésticos de vidrio plano en Tailandia, por tipo, 2019-2028 (en miles de USD)
TABLA 540 Mercado tailandés de energía solar en vidrio plano, por aplicación, 2019-2028 (en miles de USD)
TABLA 541 Mercado de energía solar en vidrio plano en Tailandia, por tipo, 2019-2028 (en miles de USD)
TABLA 542 Mercado tailandés de muebles de vidrio plano, por tipo, 2019-2028 (en miles de USD)
TABLA 543 Otros mercados de vidrio plano en Tailandia, por tipo, 2019-2028 (en miles de USD)
TABLA 544 Mercado de vidrio plano de Filipinas, por tipo, 2019-2028 (en miles de USD)
TABLA 545 Mercado de vidrio plano de Filipinas, por tipo, 2019-2028 (miles de metros cuadrados)
TABLA 546 Mercado de vidrio plano de Filipinas, por función, 2019-2028 (miles de USD)
TABLA 547 MERCADO DE VIDRIO PLANO DE FILIPINAS, POR PRODUCTO, 2019-2028 (Miles de USD)
TABLA 548 Mercado de vidrio plano recubierto en Filipinas, por resina de recubrimiento, 2019-2028 (en miles de USD)
TABLA 549 Tecnología de recubrimiento en el mercado de vidrio plano de Filipinas, por tecnología de recubrimiento, 2019-2028 (en miles de USD)
TABLA 550 Mercado de vidrio plano recubierto en Filipinas, por proceso de recubrimiento, 2019-2028 (en miles de USD)
TABLA 551 Mercado de deposición química de vapor (CVD) (pirolítica) en vidrio plano en Filipinas, por proceso, 2019-2028 (en miles de USD)
TABLA 552 Mercado de vidrio plano de Filipinas, por aplicación, 2019-2028 (en miles de USD)
TABLA 553 Mercado de construcción y edificación de vidrio plano en Filipinas, por aplicación, 2019-2028 (en miles de USD)
TABLA 554 Construcción en Filipinas, mercado de vidrio plano, por tipo, 2019-2028 (en miles de USD)
TABLA 555 Mercado de vidrio plano automotriz en Filipinas, por aplicación, 2019-2028 (en miles de USD)
TABLA 556 Mercado de vidrio plano automotriz en Filipinas, por tipo, 2019-2028 (en miles de USD)
TABLA 557 Mercado aeroespacial de vidrio plano en Filipinas, por tipo, 2019-2028 (en miles de USD)
TABLA 558 Electrodomésticos en el mercado de vidrio plano de Filipinas, por tipo, 2019-2028 (en miles de USD)
TABLA 559 Mercado filipino de energía solar en vidrio plano, por aplicación, 2019-2028 (en miles de USD)
TABLA 560 Mercado de energía solar en vidrio plano en Filipinas, por tipo, 2019-2028 (en miles de USD)
TABLA 561 Mercado filipino de muebles de vidrio plano, por tipo, 2019-2028 (en miles de USD)
TABLA 562 Filipinas Otros en el mercado del vidrio plano, por tipo, 2019-2028 (en miles de USD)
TABLA 563 Resto del mercado de vidrio plano de Asia-Pacífico, por tipo, 2019-2028 (miles de USD)
TABLA 564 Resto del mercado de vidrio plano de Asia-Pacífico, por tipo, 2019-2028 (miles de metros cuadrados)
TABLA 565 Mercado de vidrio plano de Oriente Medio y África, POR PAÍS, 2019-2028 (Miles de USD)
TABLA 566 MERCADO DE VIDRIO PLANO DE ORIENTE MEDIO Y ÁFRICA, POR PAÍS, 2019-2028 (Miles de metros cuadrados)
TABLA 567 Mercado de vidrio plano de Oriente Medio y África, por tipo, 2019-2028 (en miles de USD)
TABLA 568 Mercado de vidrio plano en Oriente Medio y África, por tipo, 2019-2028 (miles de metros cuadrados)
TABLA 569 Mercado de vidrio plano de Oriente Medio y África, por función, 2019-2028 (en miles de USD)
TABLA 570 MERCADO DE VIDRIO PLANO DE ORIENTE MEDIO Y ÁFRICA, POR PRODUCTO, 2019-2028 (MILES DE USD)
TABLA 571 Mercado de vidrio plano recubierto en Oriente Medio y África, por resina de recubrimiento, 2019-2028 (en miles de USD)
TABLA 572 Tecnología de recubrimiento en el mercado de vidrio plano en Oriente Medio y África, por tecnología de recubrimiento, 2019-2028 (en miles de USD)
TABLA 573 Mercado de vidrio plano recubierto en Oriente Medio y África, por proceso de recubrimiento, 2019-2028 (en miles de USD)
TABLA 574 Mercado de deposición química de vapor (CVD) (pirolítica) en vidrio plano en Oriente Medio y África, por proceso, 2019-2028 (en miles de USD)
TABLA 575 Mercado de vidrio plano de Oriente Medio y África, por aplicación, 2019-2028 (en miles de USD)
TABLA 576 Mercado de construcción de vidrio plano en Oriente Medio y África, por aplicación, 2019-2028 (en miles de USD)
TABLA 577 Mercado de construcción de vidrio plano en Oriente Medio y África, por tipo, 2019-2028 (en miles de USD)
TABLA 578 Mercado automotriz de vidrio plano en Oriente Medio y África, por aplicación, 2019-2028 (en miles de USD)
TABLA 579 Mercado automotriz de vidrio plano en Oriente Medio y África, por tipo, 2019-2028 (en miles de USD)
TABLA 580 Mercado aeroespacial de vidrio plano en Oriente Medio y África, por tipo, 2019-2028 (en miles de USD)
TABLA 581 Mercado de electrodomésticos de vidrio plano en Oriente Medio y África, por tipo, 2019-2028 (en miles de USD)
TABLA 582 Mercado de energía solar en vidrio plano en Oriente Medio y África, por aplicación, 2019-2028 (en miles de USD)
TABLA 583 Mercado de energía solar en vidrio plano en Oriente Medio y África, por tipo, 2019-2028 (en miles de USD)
TABLA 584 Mercado de muebles de vidrio plano en Oriente Medio y África, por tipo, 2019-2028 (en miles de USD)
TABLA 585 Mercado de vidrio plano en Oriente Medio y África (otros), por tipo, 2019-2028 (en miles de USD)
TABLA 586 Mercado de vidrio plano de los EAU, por tipo, 2019-2028 (en miles de USD)
TABLA 587 Mercado de vidrio plano de los EAU, por tipo, 2019-2028 (miles de metros cuadrados)
TABLA 588 Mercado de vidrio plano de los EAU, por función, 2019-2028 (en miles de USD)
TABLA 589 MERCADO DE VIDRIO PLANO DE LOS EAU, POR PRODUCTO, 2019-2028 (Miles de USD)
TABLA 590 Mercado de vidrio plano recubierto en Emiratos Árabes Unidos, por resina de recubrimiento, 2019-2028 (en miles de USD)
TABLA 591 Tecnología de recubrimiento en el mercado de vidrio plano de los EAU, por tecnología de recubrimiento, 2019-2028 (en miles de USD)
TABLA 592 Mercado de vidrio plano recubierto en EAU, por proceso de recubrimiento, 2019-2028 (en miles de USD)
TABLA 593 Mercado de deposición química de vapor (CVD) (pirolítica) en vidrio plano de los EAU por proceso, 2019-2028 (en miles de USD)
TABLA 594 Mercado de vidrio plano de los EAU, por aplicación, 2019-2028 (en miles de USD)
TABLA 595 Mercado de construcción y edificación de vidrio plano en los EAU, por aplicación, 2019-2028 (en miles de USD)
TABLA 596 Mercado de construcción y edificación de vidrio plano en los EAU, por tipo, 2019-2028 (en miles de USD)
TABLA 597 Mercado automotriz de vidrio plano en los EAU, por aplicación, 2019-2028 (en miles de USD)
TABLA 598 Mercado automotriz de vidrio plano en los EAU, por tipo, 2019-2028 (en miles de USD)
TABLA 599 Mercado aeroespacial de vidrio plano de los EAU, por tipo, 2019-2028 (en miles de USD)
TABLA 600 Mercado de electrodomésticos de vidrio plano en los EAU, por tipo, 2019-2028 (en miles de USD)
TABLA 601 Energía solar en el mercado de vidrio plano de los EAU, por aplicación, 2019-2028 (en miles de USD)
TABLA 602 Mercado de energía solar en vidrio plano de los EAU, por tipo, 2019-2028 (en miles de USD)
TABLA 603 Mercado de muebles de vidrio plano en los EAU, por tipo, 2019-2028 (en miles de USD)
TABLA 604 Mercado de vidrio plano en Emiratos Árabes Unidos, por tipo, 2019-2028 (en miles de USD)
TABLA 605 Mercado de vidrio plano de Arabia Saudita, por tipo, 2019-2028 (en miles de USD)
TABLA 606 Mercado de vidrio plano de Arabia Saudita, por tipo, 2019-2028 (miles de metros cuadrados)
TABLA 607 Mercado de vidrio plano de Arabia Saudita, por función, 2019-2028 (en miles de USD)
TABLA 608 MERCADO DE VIDRIO PLANO DE ARABIA SAUDITA, POR PRODUCTO, 2019-2028 (Miles de USD)
TABLA 609 Arabia Saudita, mercado de vidrio plano recubierto, por resina de recubrimiento, 2019-2028 (en miles de USD)
TABLA 610 Tecnología de recubrimiento en el mercado de vidrio plano de Arabia Saudita, por tecnología de recubrimiento, 2019-2028 (en miles de USD)
TABLA 611 Mercado de vidrio plano recubierto en Arabia Saudita, por proceso de recubrimiento, 2019-2028 (en miles de USD)
TABLA 612 Deposición química de vapor (CVD) (pirolítica) en el mercado de vidrio plano de Arabia Saudita, por proceso, 2019-2028 (en miles de USD)
TABLA 613 Mercado de vidrio plano de Arabia Saudita, por aplicación, 2019-2028 (en miles de USD)
TABLA 614 Arabia Saudita: Construcción y mercado de vidrio plano, por aplicación, 2019-2028 (en miles de USD)
TABLA 615 Construcción y edificación en el mercado de vidrio plano de Arabia Saudita, por tipo, 2019-2028 (en miles de USD)
TABLA 616 Arabia Saudita: Mercado de vidrio plano automotriz, por aplicación, 2019-2028 (en miles de USD)
TABLA 617 Mercado automotriz de vidrio plano en Arabia Saudita, por tipo, 2019-2028 (en miles de USD)
TABLA 618 Mercado aeroespacial de vidrio plano en Arabia Saudita, por tipo, 2019-2028 (en miles de USD)
TABLA 619 Mercado de electrodomésticos de vidrio plano en Arabia Saudita, por tipo, 2019-2028 (en miles de USD)
TABLA 620 Mercado de energía solar en vidrio plano de Arabia Saudita, por aplicación, 2019-2028 (en miles de USD)
TABLA 621 Mercado de energía solar en vidrio plano en Arabia Saudita, por tipo, 2019-2028 (en miles de USD)
TABLA 622 Mercado de muebles de vidrio plano en Arabia Saudita, por tipo, 2019-2028 (en miles de USD)
TABLA 623 Arabia Saudita Otros en el mercado del vidrio plano, por tipo, 2019-2028 (en miles de USD)
TABLA 624 Mercado de vidrio plano de Sudáfrica, por tipo, 2019-2028 (en miles de USD)
TABLA 625 Mercado de vidrio plano de Sudáfrica, por tipo, 2019-2028 (miles de metros cuadrados)
TABLA 626 Mercado de vidrio plano de Sudáfrica, por función, 2019-2028 (en miles de USD)
TABLA 627 MERCADO DE VIDRIO PLANO DE SURÁFRICA, POR PRODUCTO, 2019-2028 (Miles de USD)
TABLA 628 Mercado de vidrio plano recubierto en Sudáfrica, por resina de recubrimiento, 2019-2028 (en miles de USD)
TABLA 629 Tecnología de recubrimiento en el mercado de vidrio plano de Sudáfrica, por tecnología de recubrimiento, 2019-2028 (en miles de USD)
TABLA 630 Mercado de vidrio plano revestido en Sudáfrica, por proceso de recubrimiento, 2019-2028 (en miles de USD)
TABLA 631 Mercado de deposición química de vapor (CVD) (pirolítica) en vidrio plano en Sudáfrica por proceso, 2019-2028 (en miles de USD)
TABLA 632 Mercado de vidrio plano de Sudáfrica, por aplicación, 2019-2028 (en miles de USD)
TABLA 633 Sudáfrica: Construcción y mercado de vidrio plano, por aplicación, 2019-2028 (en miles de USD)
TABLA 634 Sudáfrica: Construcción y mercado de vidrio plano, por tipo, 2019-2028 (en miles de USD)
TABLA 635 Mercado automotriz de vidrio plano en Sudáfrica, por aplicación, 2019-2028 (en miles de USD)
TABLA 636 Mercado automotriz de vidrio plano en Sudáfrica, por tipo, 2019-2028 (en miles de USD)
TABLA 637 Mercado aeroespacial sudafricano de vidrio plano, por tipo, 2019-2028 (en miles de USD)
TABLA 638 Mercado de electrodomésticos de vidrio plano en Sudáfrica, por tipo, 2019-2028 (en miles de USD)
TABLA 639 Mercado de energía solar en vidrio plano de Sudáfrica, por aplicación, 2019-2028 (en miles de USD)
TABLA 640 Mercado de energía solar en vidrio plano en Sudáfrica, por tipo, 2019-2028 (en miles de USD)
TABLA 641 Mercado sudafricano de muebles de vidrio plano, por tipo, 2019-2028 (en miles de USD)
TABLA 642 Sudáfrica Otros en el mercado del vidrio plano, por tipo, 2019-2028 (en miles de USD)
TABLA 643 Mercado egipcio de vidrio plano, por tipo, 2019-2028 (en miles de USD)
TABLA 644 Mercado de vidrio plano en Egipto, por tipo, 2019-2028 (miles de metros cuadrados)
TABLA 645 Mercado egipcio de vidrio plano, por función, 2019-2028 (en miles de USD)
TABLA 646 MERCADO DE VIDRIO PLANO DE EGIPTO, POR PRODUCTO, 2019-2028 (Miles de USD)
TABLA 647 Mercado egipcio de vidrio plano recubierto, por resina de recubrimiento, 2019-2028 (en miles de USD)
TABLA 648 Tecnología de recubrimiento en el mercado de vidrio plano de Egipto, por tecnología de recubrimiento, 2019-2028 (en miles de USD)
TABLA 649 Mercado egipcio de vidrio plano revestido, por proceso de recubrimiento, 2019-2028 (en miles de USD)
TABLA 650 Mercado egipcio de deposición química de vapor (CVD) (pirolítica) en vidrio plano por proceso, 2019-2028 (en miles de USD)
TABLA 651 Mercado egipcio de vidrio plano, por aplicación, 2019-2028 (en miles de USD)
TABLA 652 Egipto: Construcción y mercado de vidrio plano, por aplicación, 2019-2028 (en miles de USD)
TABLA 653 Construcción y edificación en el mercado de vidrio plano de Egipto, por tipo, 2019-2028 (en miles de USD)
TABLA 654 Mercado de vidrio plano automotriz en Egipto, por aplicación, 2019-2028 (en miles de USD)
TABLA 655 Mercado de vidrio plano automotriz en Egipto, por tipo, 2019-2028 (en miles de USD)
TABLA 656 Mercado de vidrio plano de la industria aeroespacial egipcia, por tipo, 2019-2028 (en miles de USD)
TABLA 657 Mercado egipcio de electrodomésticos de vidrio plano, por tipo, 2019-2028 (en miles de USD)
TABLA 658 Energía solar en el mercado egipcio de vidrio plano, por aplicación, 2019-2028 (en miles de USD)
TABLA 659 Mercado egipcio de energía solar en vidrio plano, por tipo, 2019-2028 (en miles de USD)
TABLA 660 Mercado egipcio de muebles de vidrio plano, por tipo, 2019-2028 (en miles de USD)
TABLA 661 Egipto Otros en el mercado del vidrio plano, por tipo, 2019-2028 (en miles de USD)
TABLA 662 Mercado de vidrio plano de Israel, por tipo, 2019-2028 (miles de USD)
TABLA 663 Mercado de vidrio plano de Israel, por tipo, 2019-2028 (miles de metros cuadrados)
TABLA 664 Mercado de vidrio plano de Israel, por función, 2019-2028 (miles de USD)
TABLA 665 MERCADO DE VIDRIO PLANO DE ISRAEL, POR PRODUCTO, 2019-2028 (Miles de USD)
TABLA 666 Mercado de vidrio plano recubierto en Israel, por resina de recubrimiento, 2019-2028 (en miles de USD)
TABLA 667 Tecnología de recubrimiento israelí en el mercado del vidrio plano, por tecnología de recubrimiento, 2019-2028 (en miles de USD)
TABLA 668 Mercado de vidrio plano recubierto en Israel, por proceso de recubrimiento, 2019-2028 (en miles de USD)
TABLA 669 Mercado israelí de deposición química de vapor (CVD) (pirolítica) en vidrio plano por proceso, 2019-2028 (en miles de USD)
TABLA 670 Mercado de vidrio plano de Israel, por aplicación, 2019-2028 (en miles de USD)
TABLA 671 Construcción y edificación en el mercado de vidrio plano de Israel, por aplicación, 2019-2028 (en miles de USD)
TABLA 672 Construcción y edificación en el mercado de vidrio plano de Israel, por tipo, 2019-2028 (en miles de USD)
TABLA 673 Mercado de vidrio plano automotriz de Israel, por aplicación, 2019-2028 (en miles de USD)
TABLA 674 Mercado de vidrio plano automotriz de Israel, por tipo, 2019-2028 (en miles de USD)
TABLA 675 Industria aeroespacial israelí en el mercado del vidrio plano, por tipo, 2019-2028 (en miles de USD)
TABLA 676 Electrodomésticos de Israel en el mercado de vidrio plano, por tipo, 2019-2028 (en miles de USD)
TABLA 677 Energía solar en el mercado de vidrio plano de Israel, por aplicación, 2019-2028 (en miles de USD)
TABLA 678 Energía solar en el mercado de vidrio plano de Israel, por tipo, 2019-2028 (en miles de USD)
TABLA 679 Mercado israelí de muebles de vidrio plano, por tipo, 2019-2028 (en miles de USD)
TABLA 680 Israel Otros en el mercado del vidrio plano, por tipo, 2019-2028 (en miles de USD)
TABLA 681 Resto del mercado de vidrio plano de Oriente Medio y África, por tipo, 2019-2028 (miles de USD)
TABLA 682 Resto del mercado de vidrio plano de Oriente Medio y África, por tipo, 2019-2028 (miles de metros cuadrados)
TABLA 683 Mercado de vidrio plano de América del Sur, POR PAÍS, 2019-2028 (Miles de USD)
TABLA 684 Mercado de vidrio plano en América del Sur, POR PAÍS, 2019-2028 (Miles de Unidades)
TABLA 685 Mercado de vidrio plano de América del Sur, por tipo, 2019-2028 (miles de USD)
TABLA 686 Mercado de vidrio plano en América del Sur, por tipo, 2019-2028 (miles de metros cuadrados)
TABLA 687 Mercado de vidrio plano de América del Sur, por función, 2019-2028 (miles de USD)
TABLA 688 Mercado de vidrio plano de América del Sur, por producto, 2019-2028 (miles de USD)
TABLA 689 Mercado de vidrio plano recubierto en Sudamérica, por resina de recubrimiento, 2019-2028 (en miles de USD)
TABLA 690 Tecnología de recubrimiento en el mercado de vidrio plano en Sudamérica, por tecnología de recubrimiento, 2019-2028 (en miles de USD)
TABLA 691 Mercado de vidrio plano recubierto en Sudamérica, por proceso de recubrimiento, 2019-2028 (en miles de USD)
TABLA 692 Mercado de deposición química de vapor (CVD) (pirolítica) en vidrio plano en América del Sur, por proceso, 2019-2028 (miles de USD)
TABLA 693 Mercado de vidrio plano de América del Sur, por aplicación, 2019-2028 (miles de USD)
TABLA 694 Mercado de construcción y edificación de vidrio plano en América del Sur, por aplicación, 2019-2028 (en miles de USD)
TABLA 695 Mercado de construcción y edificación de vidrio plano en América del Sur, por tipo, 2019-2028 (en miles de USD)
TABLA 696 Mercado automotriz de vidrio plano en Sudamérica, por aplicación, 2019-2028 (en miles de USD)
TABLA 697 Mercado automotriz de vidrio plano en Sudamérica, por tipo, 2019-2028 (en miles de USD)
TABLA 698 Mercado aeroespacial de vidrio plano en Sudamérica, por tipo, 2019-2028 (en miles de USD)
TABLA 699 Mercado de electrodomésticos de vidrio plano en Sudamérica, por tipo, 2019-2028 (en miles de USD)
TABLA 700 Mercado de energía solar en vidrio plano en Sudamérica, por aplicación 2019-2028 (en miles de USD)
TABLA 701 Mercado de energía solar en vidrio plano en América del Sur, por tipo, 2019-2028 (en miles de USD)
TABLA 702 Mercado de muebles de vidrio plano en Sudamérica, por tipo, 2019-2028 (en miles de USD)
TABLA 703 Sudamérica Otros en el mercado de vidrio plano, por tipo, 2019-2028 (miles de USD)
TABLA 704 BRASIL Mercado de vidrio plano, por tipo, 2019-2028 (Miles de USD)
TABLA 705 BRASIL Mercado de vidrio plano, por tipo, 2019-2028 (Miles de metros cuadrados)
TABLA 706 BRASIL Mercado de vidrio plano, por función, 2019-2028 (Miles de USD)
TABLA 707 BRASIL Mercado de vidrio plano, por producto, 2019-2028 (Miles de USD)
TABLA 708 BRASIL Mercado de vidrio plano recubierto, por resina de recubrimiento, 2019-2028 (en miles de USD)
TABLA 709 BRASIL Tecnología de recubrimiento en el mercado de vidrio plano, por tecnología de recubrimiento, 2019-2028 (en miles de USD)
TABLA 710 BRASIL Mercado de vidrio plano recubierto, por proceso de recubrimiento, 2019-2028 (en miles de USD)
TABLA 711 BRASIL Deposición química de vapor (CVD) (pirolítica) en el mercado de vidrio plano por proceso, 2019-2028 (miles de USD)
TABLA 712 BRASIL Mercado de vidrio plano, por aplicación, 2019-2028 (Miles de USD)
TABLA 713 BRASIL Construcción y Edificación en el Mercado de Vidrio Plano, por Aplicación, 2019-2028 (Miles de USD)
TABLA 714 BRASIL Construcción y Edificación en el Mercado de Vidrio Plano, por Tipo, 2019-2028 (Miles de USD)
TABLA 715 BRASIL Mercado Automotriz de Vidrio Plano, Por Aplicación, 2019-2028 (Miles de USD)
TABLA 716 BRASIL Mercado Automotriz de Vidrio Plano, Por Tipo, 2019-2028 (Miles de USD)
TABLA 717 BRASIL Aeroespacial en el mercado de vidrio plano, por tipo, 2019-2028 (en miles de USD)
TABLA 718 BRASIL Electrodomésticos en el mercado de vidrio plano, por tipo, 2019-2028 (en miles de USD)
TABLA 719 BRASIL Energía solar en el mercado de vidrio plano, por aplicación 2019-2028 (en miles de USD)
TABLA 720 BRASIL Energía solar en el mercado de vidrio plano, por tipo, 2019-2028 (en miles de USD)
TABLA 721 BRASIL Mercado de muebles de vidrio plano, por tipo, 2019-2028 (en miles de USD)
TABLA 722 BRASIL Otros en el mercado de vidrio plano, por tipo, 2019-2028 (en miles de USD)
TABLA 723 Mercado argentino de vidrio plano, por tipo, 2019-2028 (miles de USD)
TABLA 724 Mercado Argentino de Vidrio Plano, Por Tipo, 2019-2028 (Miles de Metros Cuadrados)
TABLA 725 Mercado argentino de vidrio plano, por función, 2019-2028 (Miles de USD)
TABLA 726 Mercado argentino de vidrio plano, por producto, 2019-2028 (Miles de USD)
TABLA 727 Mercado argentino de vidrio plano recubierto, por resina de recubrimiento, 2019-2028 (en miles de USD)
TABLA 728 Tecnología de recubrimiento en el mercado argentino de vidrio plano, por tecnología de recubrimiento, 2019-2028 (en miles de USD)
TABLA 729 Mercado argentino de vidrio plano recubierto, por proceso de recubrimiento, 2019-2028 (en miles de USD)
TABLA 730 Mercado Argentino de Deposición Química de Vapor (CVD) (Pirolítica) en Vidrio Plano por Proceso, 2019-2028 (Miles de USD)
TABLA 731 Mercado Argentino de Vidrio Plano, por Aplicación, 2019-2028 (Miles de USD)
TABLA 732 Argentina Construcción y Mercado de Vidrio Plano, Por Aplicación, 2019-2028 (Miles de USD)
TABLA 733 Argentina Construcción y Mercado de Vidrio Plano, Por Tipo, 2019-2028 (Miles de USD)
TABLA 734 Mercado automotriz argentino de vidrio plano, por aplicación, 2019-2028 (en miles de USD)
TABLA 735 Mercado Automotriz de Vidrio Plano en Argentina, por Tipo, 2019-2028 (Miles de USD)
TABLA 736 Argentina Aeroespacial en el Mercado de Vidrio Plano, Por Tipo, 2019-2028 (Miles de USD)
TABLA 737 Mercado argentino de electrodomésticos en vidrio plano, por tipo, 2019-2028 (en miles de USD)
TABLA 738 Mercado argentino de energía solar en vidrio plano, por aplicación 2019-2028 (en miles de USD)
TABLA 739 Mercado argentino de energía solar en vidrio plano, por tipo, 2019-2028 (en miles de USD)
TABLA 740 Mercado argentino de muebles de vidrio plano, por tipo, 2019-2028 (en miles de USD)
TABLA 741 Argentina Otros en el Mercado de Vidrio Plano, por Tipo, 2019-2028 (Miles de USD)
TABLA 742 Resto de Sudamérica Mercado de vidrio plano, por tipo, 2019-2028 (Miles de USD)
TABLA 743 Mercado de vidrio plano del resto de Sudamérica, por tipo, 2019-2028 (miles de metros cuadrados)
Lista de figuras
FIGURA 1 MERCADO MUNDIAL DE VIDRIO PLANO: segmentación
FIGURA 2 MERCADO MUNDIAL DE VIDRIO PLANO: triangulación de datos
FIGURA 3 MERCADO MUNDIAL DE VIDRIO PLANO: ANÁLISIS DROC
FIGURA 4 MERCADO MUNDIAL DE VIDRIO PLANO: análisis del mercado global vs. regional
FIGURA 5 MERCADO MUNDIAL DE VIDRIO PLANO: análisis de investigación de empresas
FIGURA 6 MERCADO MUNDIAL DE VIDRIO PLANO: LA CURVA DE LA LÍNEA DE VIDA FUNCIONAL
FIGURA 7 MERCADO MUNDIAL DE VIDRIO PLANO: MODELADO MULTIVARIADO
FIGURA 8 MERCADO MUNDIAL DE VIDRIO PLANO: DATOS DEMOGRÁFICOS DE LAS ENTREVISTAS
FIGURA 9 MERCADO MUNDIAL DE VIDRIO PLANO: CUADRÍCULA DE POSICIÓN DE MERCADO DE DBMR
FIGURA 10 MERCADO MUNDIAL DE VIDRIO PLANO: CUADRÍCULA DE COBERTURA DE APLICACIONES DEL MERCADO
FIGURA 11 MERCADO MUNDIAL DE VIDRIO PLANO: LA MATRIZ DE DESAFÍOS DEL MERCADO
FIGURA 12 Mercado mundial de vidrio plano: análisis de la participación de los proveedores
FIGURA 13 MERCADO MUNDIAL DE VIDRIO PLANO: SEGMENTACIÓN
FIGURA 14 Se espera que Asia-Pacífico DOMINE el mercado mundial de vidrio plano y SE ESPERA QUE CREZCA CON LA CAGR MÁS ALTA EN el período de pronóstico de 2021 a 2028
FIGURA 15 El aumento en el uso de vidrio plano en la producción e instalación de paneles solares ESTÁ IMPULSANDO EL MERCADO MUNDIAL DE VIDRIO PLANO en el período de pronóstico de 2021 a 2028
FIGURA 16 Se espera que el SEGMENTO de vidrio FLOTADO represente la mayor participación del MERCADO GLOBAL DE VIDRIO PLANO en 2021 y 2028
FIGURA 17 Asia-Pacífico es el mercado de más rápido crecimiento para los fabricantes de VIDRIO PLANO en el período de pronóstico de 2021 a 2028
FIGURA 18 IMPULSORES, RESTRICCIONES, OPORTUNIDADES Y DESAFÍOS DEL MERCADO MUNDIAL DE VIDRIO PLANO
FIGURA 19 VENTAS TOTALES DE AUTOS DE 2015 A 2020 (USD MILLONES)
FIGURA 20 IMPLEMENTACIÓN DE VEHÍCULOS ELÉCTRICOS EN TODO EL MUNDO (2015-2018) (MILLONES DE USD)
FIGURA 21 AUMENTO DEL NÚMERO DE ACCIDENTES DE TRÁFICO EN FILIPINAS (2007-2018)
FIGURA 22 PRECIO PROMEDIO POR UNIDAD DE MATERIA PRIMA DE VIDRIO (USD)
FIGURA 23 Mercado mundial de VIDRIO PLANO: POR tipo, 2020
FIGURA 24 Mercado mundial de VIDRIO PLANO: POR función, 2020
FIGURA 25 Mercado mundial de VIDRIO PLANO: POR producto, 2020
FIGURA 26 Mercado mundial de VIDRIO PLANO: POR aplicación, 2020
FIGURA 27 Mercado mundial de vidrio plano: INSTANTÁNEA (2020)
FIGURA 28 Mercado mundial de vidrio plano: por región (2020)
FIGURA 29 Mercado mundial de vidrio plano: por región (2021 y 2028)
FIGURA 30 Mercado mundial de vidrio plano: por región (2020 y 2028)
FIGURA 31 Mercado mundial de vidrio plano: por tipo (2021 y 2028)
FIGURA 32 Mercado de vidrio plano de América del Norte: INSTANTÁNEA (2020)
FIGURA 33 Mercado de vidrio plano de AMÉRICA DEL NORTE: por PAÍS (2020)
FIGURA 34 Mercado de vidrio plano de AMÉRICA DEL NORTE: por PAÍS (2021 y 2028)
FIGURA 35 Mercado de vidrio plano de AMÉRICA DEL NORTE: por PAÍS (2020 y 2028)
FIGURA 36 Mercado de vidrio plano de AMÉRICA DEL NORTE: por TIPO (2021-2028)
FIGURA 37 Mercado de vidrio plano en EUROPA: INSTANTÁNEA (2020)
FIGURA 38 EUROPA Mercado de vidrio plano: por PAÍS (2020)
FIGURA 39 EUROPA Mercado de vidrio plano: por PAÍS (2021 y 2028)
FIGURA 40 Mercado de vidrio plano en EUROPA: por PAÍS (2020 y 2028)
FIGURA 41 EUROPA Mercado de vidrio plano: por TIPO (2021-2028)
FIGURA 42 Mercado de vidrio plano de Asia-Pacífico: Panorama (2020)
FIGURA 43 Mercado de vidrio plano de ASIA-PACÍFICO: por PAÍS (2020)
FIGURA 44 Mercado de vidrio plano de ASIA-PACÍFICO: por PAÍS (2021 y 2028)
FIGURA 45 Mercado de vidrio plano de ASIA-PACÍFICO: por PAÍS (2020 y 2028)
FIGURA 46 Mercado de vidrio plano de ASIA-PACÍFICO: por TIPO (2021-2028)
FIGURA 47 ORIENTE MEDIO Y ÁFRICA Mercado de vidrio plano: INSTANTÁNEA (2020)
FIGURA 48 ORIENTE MEDIO Y ÁFRICA Mercado de vidrio plano: por PAÍS (2020)
FIGURA 49 ORIENTE MEDIO Y ÁFRICA Mercado de vidrio plano: por PAÍS (2021 y 2028)
FIGURA 50 ORIENTE MEDIO Y ÁFRICA Mercado de vidrio plano: por PAÍS (2020 y 2028)
FIGURA 51 ORIENTE MEDIO Y ÁFRICA Mercado de vidrio plano: por TIPO (2021-2028)
FIGURA 52 Mercado de vidrio plano de América del Sur: INSTANTÁNEA (2020)
FIGURA 53 Mercado de vidrio plano de SUDAMÉRICA: por PAÍS (2020)
FIGURA 54 Mercado de vidrio plano de SUDAMÉRICA: por PAÍS (2021 y 2028)
FIGURA 55 Mercado de vidrio plano de SUDAMÉRICA: por PAÍS (2020 y 2028)
FIGURA 56 Mercado de vidrio plano de SUDAMÉRICA: por TIPO (2021-2028)
FIGURA 57 MERCADO MUNDIAL DE VIDRIO PLANO: participación de la empresa 2020 (%)
FIGURA 58 MERCADO DE VIDRIO PLANO DE AMÉRICA DEL NORTE: PARTICIPACIÓN DE LA EMPRESA 2020 (%)
FIGURA 59 MERCADO EUROPEO DE VIDRIO PLANO: cuota de mercado de la empresa 2020 (%)
FIGURA 60 MERCADO DE VIDRIO PLANO DE ASIA-Pacífico: PARTICIPACIÓN DE LA EMPRESA 2020 (%)
Metodología de investigación
La recopilación de datos y el análisis del año base se realizan utilizando módulos de recopilación de datos con muestras de gran tamaño. La etapa incluye la obtención de información de mercado o datos relacionados a través de varias fuentes y estrategias. Incluye el examen y la planificación de todos los datos adquiridos del pasado con antelación. Asimismo, abarca el examen de las inconsistencias de información observadas en diferentes fuentes de información. Los datos de mercado se analizan y estiman utilizando modelos estadísticos y coherentes de mercado. Además, el análisis de la participación de mercado y el análisis de tendencias clave son los principales factores de éxito en el informe de mercado. Para obtener más información, solicite una llamada de un analista o envíe su consulta.
La metodología de investigación clave utilizada por el equipo de investigación de DBMR es la triangulación de datos, que implica la extracción de datos, el análisis del impacto de las variables de datos en el mercado y la validación primaria (experto en la industria). Los modelos de datos incluyen cuadrícula de posicionamiento de proveedores, análisis de línea de tiempo de mercado, descripción general y guía del mercado, cuadrícula de posicionamiento de la empresa, análisis de patentes, análisis de precios, análisis de participación de mercado de la empresa, estándares de medición, análisis global versus regional y de participación de proveedores. Para obtener más información sobre la metodología de investigación, envíe una consulta para hablar con nuestros expertos de la industria.
Personalización disponible
Data Bridge Market Research es líder en investigación formativa avanzada. Nos enorgullecemos de brindar servicios a nuestros clientes existentes y nuevos con datos y análisis que coinciden y se adaptan a sus objetivos. El informe se puede personalizar para incluir análisis de tendencias de precios de marcas objetivo, comprensión del mercado de países adicionales (solicite la lista de países), datos de resultados de ensayos clínicos, revisión de literatura, análisis de mercado renovado y base de productos. El análisis de mercado de competidores objetivo se puede analizar desde análisis basados en tecnología hasta estrategias de cartera de mercado. Podemos agregar tantos competidores sobre los que necesite datos en el formato y estilo de datos que esté buscando. Nuestro equipo de analistas también puede proporcionarle datos en archivos de Excel sin procesar, tablas dinámicas (libro de datos) o puede ayudarlo a crear presentaciones a partir de los conjuntos de datos disponibles en el informe.

