Global Flexible Packaging Market
Tamaño del mercado en miles de millones de dólares
Tasa de crecimiento anual compuesta (CAGR) :
% 
 USD
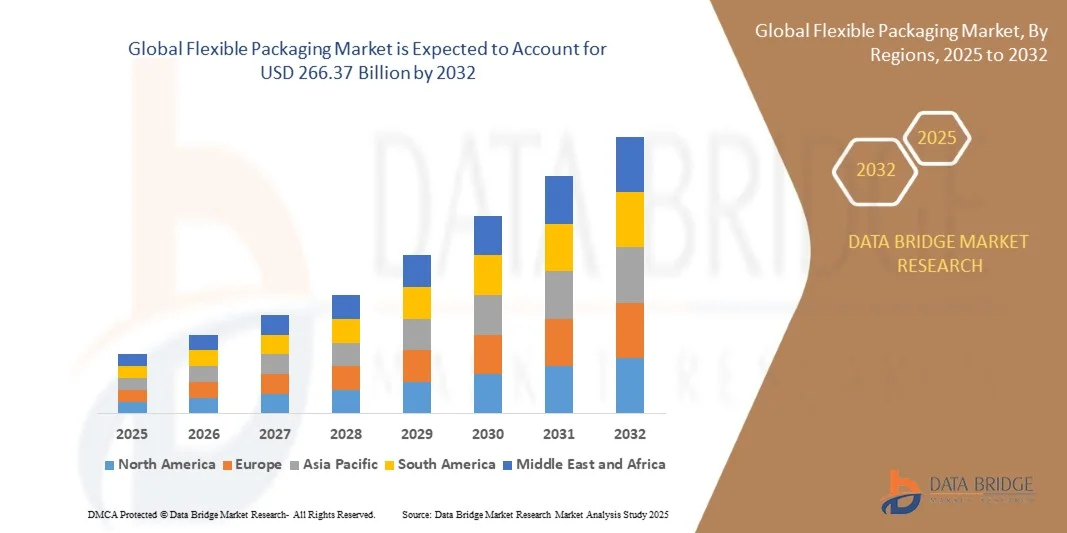
164.64 Billion
USD
266.37 Billion
2024
2032
USD
164.64 Billion
USD
266.37 Billion
2024
2032
| 2025 –2032 | |
| USD 164.64 Billion | |
| USD 266.37 Billion | |
| % | |
|
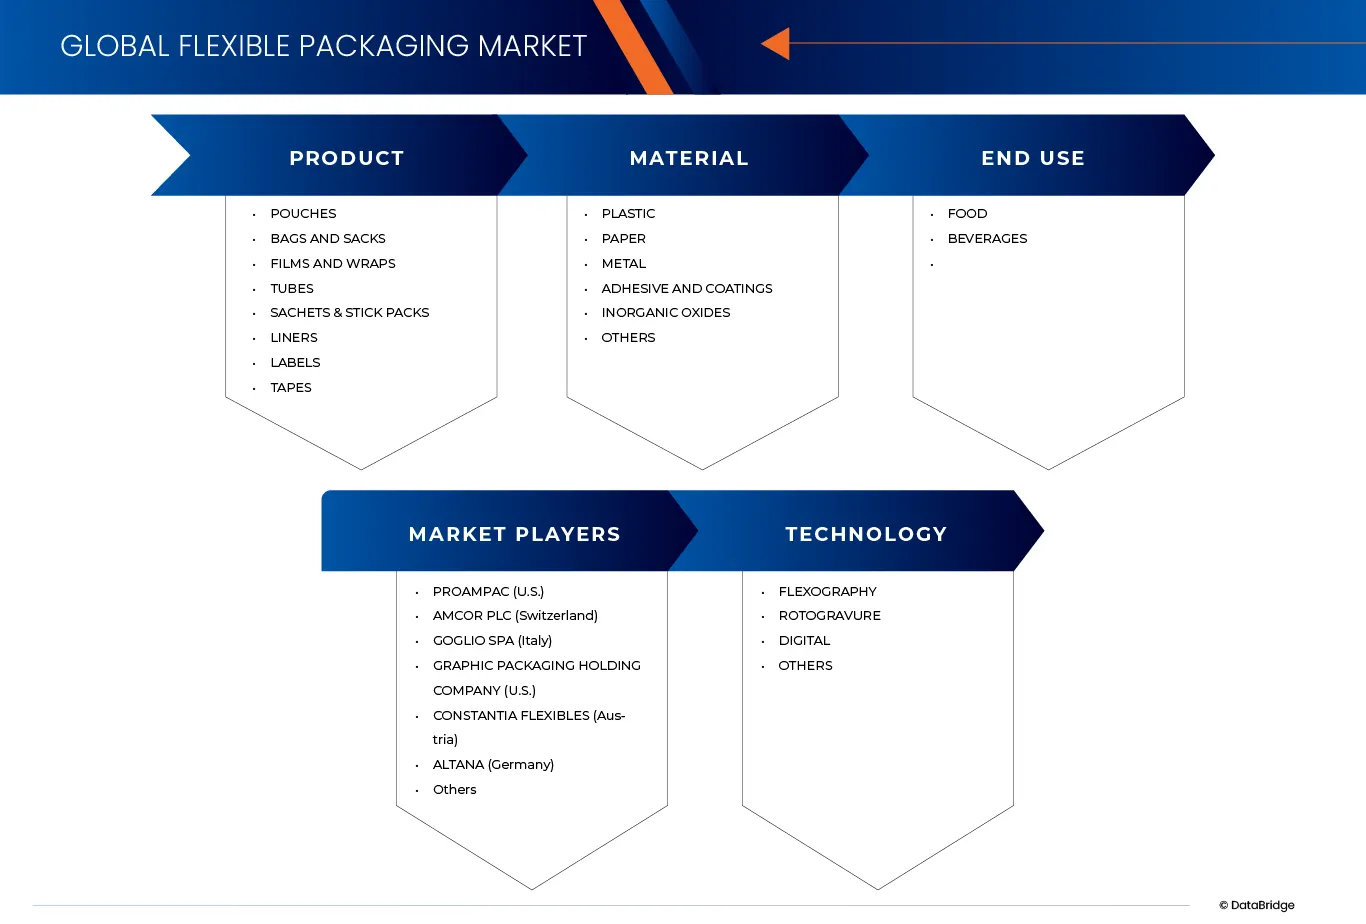
Segmentación del mercado global de envases flexibles, por producto (bolsas, sacos, tubos, revestimientos, bolsitas y paquetes de barra, etiquetas, cintas, películas y envoltorios), material (plástico, papel, metal, óxidos inorgánicos, adhesivos y recubrimientos, otros), uso final (alimentos y bebidas), tecnología (flexografía, rotograbado, digital y otros), país (EE. UU., Canadá, México, Alemania, Reino Unido, Francia, Italia, España, Rusia, Turquía, Países Bajos, Luxemburgo, Suecia, Polonia, Suiza, Bélgica, resto de Europa, China, Japón, India, Corea del Sur, Australia, Indonesia, Tailandia, Malasia, Singapur, Filipinas, resto de Asia-Pacífico, Brasil, Argentina, resto de Sudamérica, Emiratos Árabes Unidos, Arabia Saudita, Sudáfrica, Egipto, Israel y resto de Oriente Medio y África), tendencias de la industria y pronóstico hasta 2032.
Tamaño del mercado de envases flexibles
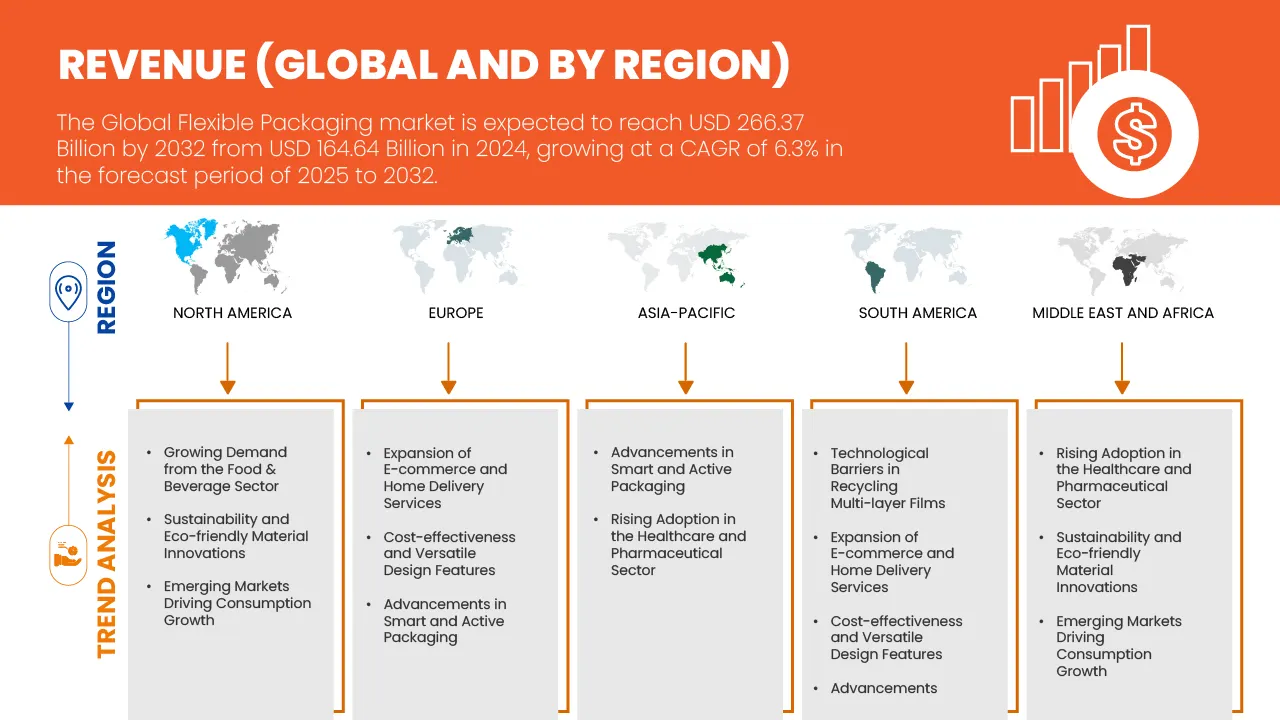
- El tamaño del mercado de envases flexibles se valoró en USD 164,64 mil millones en 2024 y se espera que alcance los USD 266,37 mil millones para 2032 , con una CAGR del 6,3% durante el período de pronóstico.
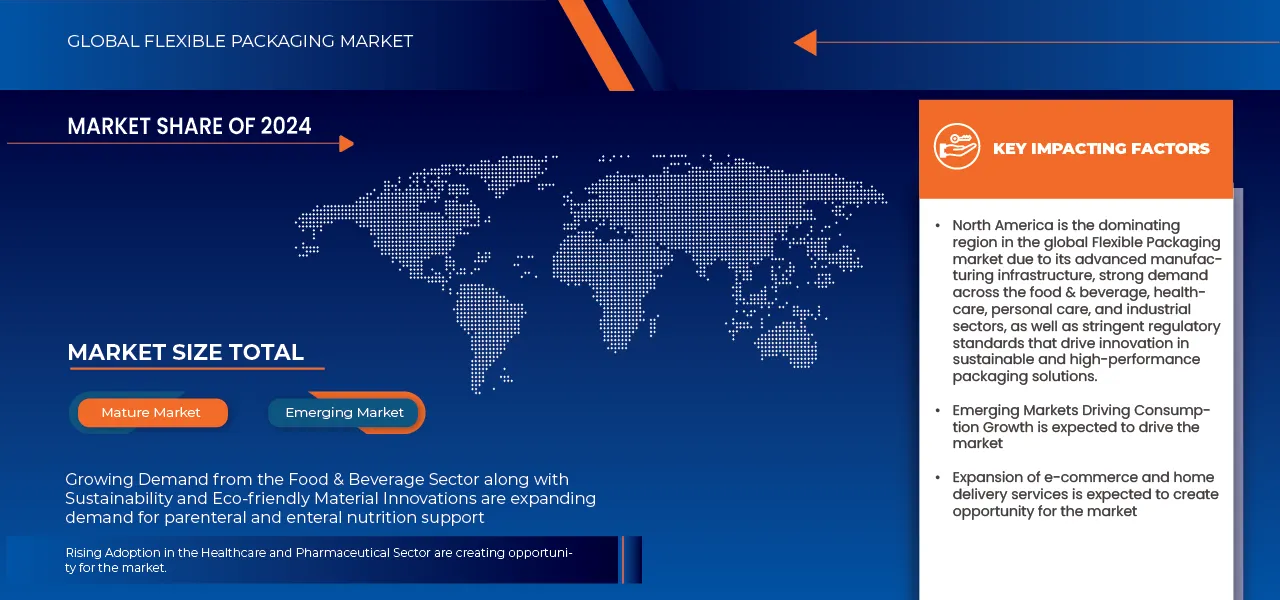
- La creciente demanda del sector de alimentos y bebidas es un factor importante que impulsa la demanda en toda la región.
- Los avances en envases inteligentes y activos que mejoran la vida útil del producto y la experiencia del consumidor están fortaleciendo aún más el alcance del mercado.
Análisis del mercado de envases flexibles
- Los embalajes flexibles son embalajes fabricados con materiales flexibles, como películas, láminas o papel, que pueden cambiar de forma fácilmente para proteger, almacenar y transportar productos.
- El mercado de envases flexibles está impulsado principalmente por la creciente demanda de conveniencia, diseño liviano, vida útil prolongada, crecimiento del comercio electrónico, tendencias de sostenibilidad, rentabilidad e innovaciones tecnológicas en materiales e impresión.
- La creciente demanda de envases flexibles sostenibles y reciclables presenta una importante oportunidad de crecimiento, ya que los consumidores y los reguladores favorecen cada vez más soluciones ecológicas en el sector de alimentos y bebidas.
- Asia-Pacífico domina el mercado de envases flexibles, respaldada por la rápida urbanización y el aumento de los ingresos disponibles en países como China e India que están aumentando la demanda de alimentos y bebidas envasados, impulsando el mercado de envases flexibles.
- En 2025, se prevé que el segmento de bolsas domine el mercado con una cuota de mercado del 43,73% gracias a su diseño ligero y resellable, sus excelentes propiedades de barrera, su versatilidad para alimentos líquidos y sólidos, su larga vida útil, su portabilidad y su comodidad para el almacenamiento, el transporte y la presentación en tiendas. Su capacidad para mantener la frescura del producto y su facilidad de uso las convierten en la opción preferida en el envasado de alimentos y bebidas a nivel mundial.
- Se prevé que el mercado de envases flexibles de Asia-Pacífico crezca a la tasa de crecimiento anual compuesta (TCAC) más rápida, de aproximadamente el 6,7 % entre 2025 y 2032, impulsado por la rápida urbanización, el aumento de la renta disponible y la creciente demanda de alimentos envasados y procesados. Este crecimiento también se ve respaldado por la expansión del comercio electrónico y los canales minoristas, la adopción de formatos de envases flexibles ligeros, prácticos y sostenibles, y las inversiones de los fabricantes regionales en tecnologías innovadoras de impresión y barrera para satisfacer las necesidades de los consumidores y las normativas.
Alcance del informe y segmentación del mercado de envases flexibles
|
Atributos |
Perspectivas clave del mercado global de envases flexibles |
|
Segmentos cubiertos |
|
|
Países cubiertos |
|
|
Actores clave del mercado |
|
|
Oportunidades de mercado |
|
|
Conjuntos de información de datos de valor añadido |
Además de los conocimientos sobre escenarios de mercado como el valor de mercado, la tasa de crecimiento, la segmentación, la cobertura geográfica y los principales actores, los informes de mercado seleccionados por Data Bridge Market Research también incluyen un análisis en profundidad de expertos, análisis de Porter, cobertura de materias primas, escenario de cambio climático, estrategias de entrada al mercado, análisis de la cadena de suministro, avances tecnológicos, análisis de precios, criterios de selección de proveedores, desglose del análisis de costos y análisis del ecosistema de la industria. |
Tendencias del mercado de envases flexibles
Embalaje flexible sostenible y reciclable
- En el sector de alimentos y bebidas, hay un fuerte cambio hacia soluciones de embalaje flexible que enfatizan la sostenibilidad, la reciclabilidad y el pensamiento de economía circular.
- Las marcas utilizan cada vez más películas monomateriales (de un solo polímero en lugar de laminados multicapa) para simplificar el reciclaje y reducir la complejidad.
- Se está adoptando cada vez más el uso de envases flexibles de origen biológico, compostables o hechos de papel, especialmente para alimentos secos y refrigerios, para reducir la dependencia de plásticos de origen fósil.
- Presión regulatoria y de marketing: los gobiernos están estableciendo objetivos (por ejemplo, los envases de un solo uso deben ser reciclables/compostables) y los consumidores esperan credenciales ecológicas.
- Los embalajes flexibles y livianos reducen el uso de material, el peso/volumen del envío y la huella de carbono en comparación con las alternativas rígidas, una ventaja en la logística de alimentos y bebidas.
- Los formatos de envases flexibles (como las bolsas de fondo plano y las bolsas con boquilla) predominan por su comodidad y adaptabilidad, lo que hace que las versiones sostenibles sean especialmente impactantes. Tendencias de Alimentación
- Las mejoras en el rendimiento de las barreras (para la humedad, el oxígeno y la luz) se combinan con opciones sustentables, lo que significa que las marcas no tienen que sacrificar la vida útil ni la integridad del producto cuando se vuelven más ecológicas.
Dinámica del mercado de envases flexibles
Conductor
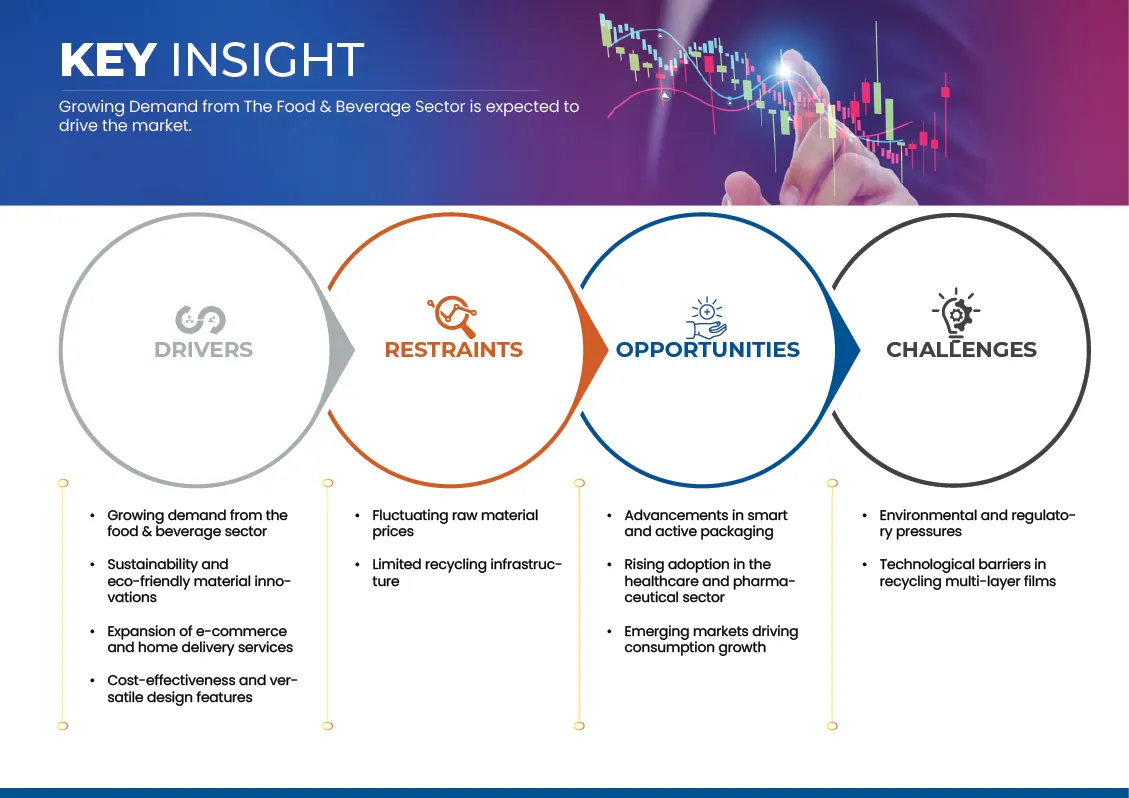
Creciente demanda del sector de alimentos y bebidas
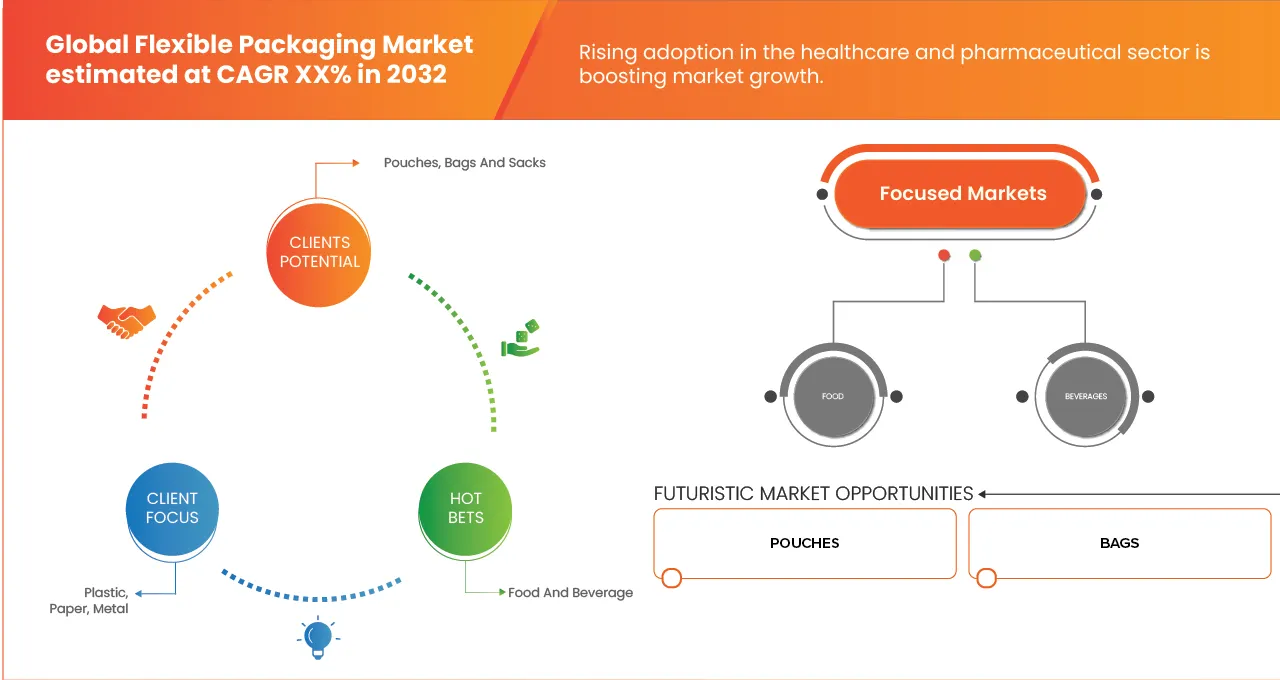
- El sector de alimentos y bebidas continúa impulsando una demanda sustancial de envases flexibles debido a sus excelentes propiedades de barrera, su larga vida útil y su rentabilidad. El creciente consumo de comidas preparadas, snacks y alimentos para llevar, especialmente en economías emergentes como India, China y Brasil, está contribuyendo al crecimiento del mercado. Los formatos de envases flexibles como bolsas, wraps y sobres son los preferidos por su comodidad, diseño ligero y menor consumo de material en comparación con las alternativas rígidas. Además, la expansión de las entregas de comestibles a través del comercio electrónico y la adopción de prácticas de envasado sostenibles por parte de las marcas de alimentos están acelerando la transición hacia materiales flexibles reciclables y de origen biológico. Se espera que esta creciente dependencia de los envases flexibles continúe impulsando la expansión del mercado global en los próximos años.
- Por ejemplo, como destacó el Instituto de Fabricantes de Maquinaria de Envasado (PMMI) en junio de 2025, el 68 % de las empresas de bebidas prevén aumentos de moderados a significativos en las inversiones en maquinaria de envasado, y casi el 90 % planea realizar compras. Este impulso inversor se ve impulsado por la creciente demanda de bebidas para llevar y el mayor uso de envases flexibles.
- En mayo de 2025, la firma india Jindal Poly Films Limited anunció una inversión de USD 84,34 millones para ampliar su capacidad de películas BOPP, PET y CPP en sus instalaciones de Nashik, específicamente para respaldar el crecimiento en sectores clave, incluidos los envases flexibles de alimentos y bebidas.
- La creciente demanda del sector de alimentos y bebidas es un factor clave para el mercado de envases flexibles para alimentos. La creciente preferencia de los consumidores por la comodidad, el consumo para llevar y la frescura de los productos impulsa a los fabricantes a adoptar soluciones de envasado innovadoras y sostenibles. Como resultado, la demanda de alimentos y bebidas no solo impulsa el crecimiento del mercado, sino que también acelera el desarrollo de formatos flexibles adaptados a diversos tipos de productos y estándares regulatorios.
Restricción/Desafío
Precios fluctuantes de las materias primas
- La fluctuación de los precios de las materias primas sigue siendo un desafío crítico para el mercado de envases flexibles. Las variaciones en el costo de polímeros como el polietileno, el polipropileno y el PET pueden influir significativamente en los gastos de producción, los márgenes de beneficio y las estrategias de precios. Estas fluctuaciones suelen estar impulsadas por desequilibrios globales entre la oferta y la demanda, la volatilidad de los precios de la energía y factores geopolíticos, lo que obliga a los fabricantes a adoptar estrategias de abastecimiento, materiales alternativos y medidas de gestión de costos. Como resultado, la inestabilidad de los precios de las materias primas continúa influyendo en las decisiones operativas y la competitividad del sector.
- Por ejemplo, en agosto de 2025, Castrol India experimentó un aumento del 5,1 % en sus beneficios del segundo trimestre, alcanzando los 29.400 USD, impulsado por la constante demanda de sus lubricantes para automóviles e industriales. Los ingresos operativos aumentaron un 7,1 % hasta los 14.970 millones, impulsados por un aumento cercano al 5 % en las ventas minoristas de vehículos en India durante el trimestre. Sin embargo, los gastos totales crecieron un 6,6 %, debido principalmente a un aumento del 3,2 % en los costes de las materias primas, lo que pone de manifiesto el impacto de la fluctuación de los precios de las materias primas en los costes de producción y los márgenes de beneficio.
- La fluctuación de los precios de las materias primas sigue representando un desafío importante para la industria del embalaje flexible, afectando directamente los costos de producción, los márgenes de beneficio y las estrategias de precios. La variabilidad en los costos de los polímeros, el papel y otros insumos esenciales obliga a los fabricantes a implementar un abastecimiento estratégico, adoptar materiales alternativos y optimizar las cadenas de suministro. Estas fluctuaciones no solo influyen en la rentabilidad a corto plazo, sino que también condicionan las decisiones operativas y de inversión a largo plazo, lo que pone de relieve la necesidad de resiliencia y una gestión proactiva de los costos en un mercado global dinámico.
Alcance del mercado de envases flexibles
El mercado está segmentado en función del producto, el material, la industria de uso final y la tecnología.
Por producto
Según el producto, el mercado se segmenta en bolsas, sacos, tubos, revestimientos, sobres y stick packs, etiquetas, cintas, películas y envoltorios. En 2025, las bolsas dominarán el mercado de envases flexibles con una cuota de mercado del 43,73% gracias a su diseño ligero y resellable, sus excelentes propiedades de barrera, su versatilidad para alimentos líquidos y sólidos, su larga vida útil, su portabilidad y su comodidad para el almacenamiento, el transporte y la presentación en tiendas. Su capacidad para mantener la frescura del producto y su facilidad de uso las convierten en la opción preferida en aplicaciones globales de envasado de alimentos y bebidas.
Además, se proyecta que este segmento registre la CAGR más alta del 6,6 % durante el período de pronóstico de 2025 a 2032, debido a la creciente demanda de comidas individuales listas para comer y bocadillos para llevar, la creciente urbanización, los estilos de vida centrados en la conveniencia, las necesidades de empaquetado del comercio electrónico, los diseños innovadores de bolsas y la adopción por parte de las marcas de alimentos emergentes de soluciones de empaquetado rentables, sostenibles y visualmente atractivas.
Por material
Según el material, el mercado se segmenta en plástico, papel, metal, óxidos inorgánicos, adhesivos y recubrimientos, entre otros. En 2025, el plástico dominará el mercado mundial con una cuota de mercado del 69,37 % gracias a su durabilidad, flexibilidad, ligereza, rentabilidad, excelentes propiedades de barrera a la humedad y al oxígeno, compatibilidad con diversas tecnologías de impresión y laminación, y capacidad para preservar la calidad, la vida útil y la apariencia del producto en diversas aplicaciones de alimentos y bebidas a nivel mundial.
Además, se proyecta que el segmento de papel registre la CAGR más alta del 6,7% durante el período de pronóstico de 2025 a 2032. El alto crecimiento se debe principalmente a las crecientes tendencias de sostenibilidad, la preferencia de los consumidores por materiales reciclables o biodegradables, las regulaciones gubernamentales sobre plásticos de un solo uso, la creciente adopción de bolsas y envoltorios a base de papel y las crecientes iniciativas de envasado con conciencia ecológica por parte de las marcas mundiales de alimentos y bebidas.
Por industria de uso final
Según la industria de uso final, el mercado se segmenta en alimentos y bebidas. En 2025, el sector alimentario dominará el mercado con una cuota del 83,78 % debido al alto consumo mundial de alimentos envasados, la creciente demanda de productos de conveniencia y listos para consumir, el estilo de vida urbano, la mayor durabilidad, el aumento de la distribución minorista y la preferencia por formatos de envasado seguros, higiénicos y visualmente atractivos.
Además, se espera que este segmento sea testigo del crecimiento más rápido del 6,4% durante el período de pronóstico, debido a la expansión de los mercados de alimentos procesados y envasados, el aumento de los ingresos disponibles, la adopción de formatos de porciones individuales y refrigerios, el aumento de las ventas de alimentos a través del comercio electrónico, la creciente conciencia sobre la conservación de alimentos y la necesidad de soluciones de envasado sostenibles, convenientes y portátiles.
Por tecnología
En función de la tecnología, el mercado se segmenta en flexografía, rotograbado, digital y otros. En 2025, la flexografía dominará el mercado de envases flexibles con una cuota de mercado del 46,61 %, ya que ofrece impresión de alta velocidad y rentable en diversos sustratos, calidad de color uniforme, adaptabilidad para películas flexibles, escalabilidad para grandes tiradas de producción, excelente adhesión de la tinta, tiempo de configuración mínimo y la capacidad de ofrecer diseños vibrantes y de alta resolución para la imagen de marca y el atractivo del producto.
Además, se prevé que este segmento experimente el crecimiento más rápido, del 6,6 %, durante el período de pronóstico. Este crecimiento se debe principalmente a los avances en automatización, las tecnologías mejoradas de fabricación de planchas, la integración de sistemas híbridos digitales, la demanda de impresiones de alta calidad y tiradas cortas, las innovaciones en tintas orientadas a la sostenibilidad, la capacidad de personalizar rápidamente los envases y la mayor adopción por parte de las marcas que buscan soluciones de impresión visualmente atractivas, eficientes y rentables.
Análisis regional del mercado de envases flexibles
- Asia-Pacífico dominó el mercado de envases flexibles con una gran participación en los ingresos del 41,34%, impulsada por la rápida urbanización y el aumento de los ingresos disponibles en países como China e India que están aumentando la demanda de alimentos y bebidas envasados, impulsando el mercado de envases flexibles.
- La expansión del comercio electrónico y de los canales minoristas modernos en la región Asia-Pacífico está impulsando la adopción de soluciones de embalaje flexibles convenientes, livianas y duraderas.
- La creciente conciencia de la seguridad alimentaria, los requisitos de una vida útil más larga y el uso cada vez mayor de productos alimenticios listos para consumir y procesados están impulsando aún más el crecimiento del mercado, lo que contribuye a la gran participación de la región en los ingresos.
Perspectiva del mercado de envases flexibles de EE. UU.
El mercado estadounidense de envases flexibles representó una cuota significativa en Norteamérica en 2024, debido a la fuerte demanda de alimentos de conveniencia, la creciente adopción de productos listos para consumir y para llevar, y las crecientes necesidades de envasado en el comercio electrónico. Además, los avances en soluciones de envasado sostenibles y reciclables, junto con las elevadas inversiones de los principales fabricantes en formatos flexibles innovadores, han consolidado el dominio del mercado y han impulsado un crecimiento constante en los segmentos de alimentación, bebidas y cuidado personal.
Perspectiva del mercado europeo de envases flexibles
Se prevé un crecimiento sostenido del mercado europeo de envases flexibles durante el período de pronóstico, impulsado por la creciente concienciación de los consumidores sobre la sostenibilidad, las regulaciones gubernamentales sobre plásticos de un solo uso y la creciente demanda de soluciones de envasado reciclables y ecológicas. Este crecimiento se ve impulsado además por la expansión de los sectores de alimentos y bebidas envasados, los avances tecnológicos en impresión y películas de barrera, y la creciente adopción de formatos flexibles y prácticos como bolsas, sobres y envoltorios.
Perspectivas del mercado de envases flexibles del Reino Unido
Se espera que el mercado británico de envases flexibles registre un crecimiento sostenido durante el período de pronóstico, impulsado por la creciente demanda de soluciones de envasado prácticas y ligeras en los sectores de alimentación, bebidas y cuidado personal. La preferencia de los consumidores por materiales sostenibles, reciclables y biodegradables, junto con las crecientes necesidades de envasado en el comercio electrónico y la venta minorista, está impulsando su adopción. Las innovaciones tecnológicas en películas flexibles, barreras y soluciones de impresión mejoran aún más la diferenciación de los productos y la competitividad en el mercado.
Análisis del mercado de envases flexibles en Alemania
Se prevé que el mercado alemán de envases flexibles se expanda a una tasa de crecimiento anual compuesta (TCAC) notable durante el período de pronóstico, impulsado por la creciente preferencia de los consumidores por formatos de envases sostenibles y reciclables. El crecimiento se ve impulsado por la solidez del sector de alimentos y bebidas, el apoyo regulatorio a los envases ecológicos y la creciente adopción de películas flexibles avanzadas con mejores propiedades de barrera e impresión. Los fabricantes están invirtiendo en innovación y automatización para satisfacer la demanda de soluciones de envasado prácticas y de alta calidad.
Perspectiva del mercado de envases flexibles de Asia-Pacífico
Se prevé que el mercado de envases flexibles de Asia-Pacífico crezca a la tasa de crecimiento anual compuesta (TCAC) más rápida, de aproximadamente el 6,7 % entre 2025 y 2032, impulsado por la rápida urbanización, el aumento de la renta disponible y la creciente demanda de alimentos envasados y procesados. Este crecimiento también se ve respaldado por la expansión del comercio electrónico y los canales minoristas, la adopción de formatos de envases flexibles ligeros, prácticos y sostenibles, y las inversiones de los fabricantes regionales en tecnologías innovadoras de impresión y barrera para satisfacer las necesidades de los consumidores y las normativas.
Perspectiva del mercado de envases flexibles de China
China poseerá la mayor participación en el mercado de envases flexibles de Asia-Pacífico en 2024, debido a su rápido crecimiento poblacional, la creciente urbanización y la creciente demanda de alimentos y bebidas envasados. La expansión de los canales modernos de venta minorista y comercio electrónico, las iniciativas gubernamentales que promueven los envases sostenibles y las crecientes inversiones de fabricantes nacionales e internacionales en formatos flexibles avanzados y tecnologías de impresión han fortalecido el dominio de China, lo que ha permitido su adopción generalizada en múltiples industrias de uso final.
Perspectiva del mercado de envases flexibles de Japón
El mercado japonés de envases flexibles está en constante crecimiento, impulsado por la preferencia de los consumidores por productos alimenticios prácticos, con porciones controladas y listos para consumir. Este crecimiento se ve impulsado por la creciente demanda de soluciones de envasado sostenibles y reciclables, los avances tecnológicos en películas flexibles y la presencia de sectores consolidados en la fabricación de alimentos y bebidas. Los fabricantes se centran en diseños de envases innovadores, materiales de alta barrera y una estética premium para satisfacer las necesidades tanto del mercado nacional como de la exportación.
Los principales líderes del mercado que operan en el mercado son:
- PROAMPAC (EE. UU.)
- AMCOR PLC (Suiza)
- GOGLIO SPA (Italia)
- COMPAÑÍA DE EMPAQUES GRÁFICOS (EE. UU.)
- CONSTANTIA FLEXIBLES (Austria)
- ALTANA (Alemania)
- COMPAÑÍA DE PRODUCTOS SONOCO (EE. UU.)
- FLAIR FLEXIBLE PACKAGING CORPORATION (EE. UU.)
- MONDI (Reino Unido)
- COMPAÑÍA WESTROCK (EE. UU.)
- TRANSCONTINENTAL INC. (Canadá)
- GRUPO WIPAK (Finlandia)
- AIRE SELLADO (EE. UU.)
- BBC CELLPACK PACKAGING (Suiza)
- SCHUR FLEXIBLES (Austria)
- COVERIS (Austria)
- HUHTAMÄKI (Finlandia)
- BISCHOF + KLEIN SE & CO. KG (Alemania)
- SÜDPAC (Alemania)
Últimos avances en el mercado mundial de envases flexibles
- En septiembre, Sealed Air presentó la máquina envasadora híbrida AUTOBAG 850HB, diseñada para operaciones de logística que utilizan sobres de papel o polietileno. Esta máquina ofrece flexibilidad para procesar ambos tipos de sustrato, lo que ayuda a los clientes a optimizar sus necesidades de equipo y a aceptar formatos reciclables para entrega en la acera.
- En septiembre de 2025, Graphic Packaging, junto con Henkel Adhesive Technologies y Kraton Corporation, formó una alianza estratégica para desarrollar soluciones de embalaje sostenibles de última generación. Esta colaboración se centra en alinear la innovación con los principios de la economía circular, acelerando la transición hacia materiales más sostenibles y de alto rendimiento. La alianza busca impulsar el progreso sostenible en la industria del embalaje mediante la combinación de experiencia y recursos.
- En julio, BBC Cellpack Packaging mejoró su capacidad de producción en su planta de Lauterecken (Alemania) con la instalación de una prensa flexográfica BOBST EXPERT CI con once unidades de impresión. La inversión permite cambios de trabajo más rápidos, menos residuos y una mayor versatilidad en envases flexibles reciclables y sostenibles, lo que refuerza la presencia de la empresa en los segmentos de confitería, alimentos secos y cuidado personal.
- En agosto de 2024, ACTEGA presentó la plataforma tecnológica YUNICO, una solución de recubrimiento a base de agua diseñada para mejorar la sostenibilidad de los envases de alimentos. Esta plataforma permite la dispersión de compuestos altamente personalizables, lo que proporciona propiedades de barrera, reciclabilidad y adhesión a los materiales de envasado. YUNICO se alinea con el compromiso de ALTANA con las soluciones de envasado sostenibles.
- En agosto de 2023, Amcor adquirió Phoenix Flexibles, una empresa con sede en Gujarat que genera aproximadamente 20 millones de dólares en ingresos anuales gracias a soluciones de embalaje flexible para los sectores de alimentación, cuidado del hogar y cuidado personal. Esta adquisición refuerza la capacidad de Amcor en el mercado indio, un mercado de alto crecimiento, e introduce tecnologías avanzadas de film, lo que permite la producción local de soluciones de embalaje sostenibles.
- En abril, Huhtamaki amplió su portafolio de envases flexibles con el lanzamiento de sus películas monomaterial de última generación bajo la plataforma blueloop. La nueva gama, fabricada en PE y PP, ofrece reciclabilidad total y una alta protección del producto, respondiendo a la demanda de soluciones flexibles y sostenibles en los mercados de alimentación y cuidado personal. Esta innovación refleja el enfoque de Huhtamaki en soluciones de envasado circulares y su compromiso a largo plazo con la reducción de residuos plásticos mediante la innovación en materiales.
SKU-
Obtenga acceso en línea al informe sobre la primera nube de inteligencia de mercado del mundo

- Panel de análisis de datos interactivo
- Panel de análisis de empresas para oportunidades con alto potencial de crecimiento
- Acceso de analista de investigación para personalización y consultas
- Análisis de la competencia con panel interactivo
- Últimas noticias, actualizaciones y análisis de tendencias
- Aproveche el poder del análisis de referencia para un seguimiento integral de la competencia
Tabla de contenido
1 INTRODUCCIÓN
1.1 OBJETIVOS DEL ESTUDIO
1.2 DEFINICIÓN DE MERCADO
1.3 DESCRIPCIÓN GENERAL DEL MERCADO MUNDIAL DE EMBALAJES FLEXIBLES
1.4 MONEDA Y PRECIOS
1.5 LIMITACIONES
1.6 MERCADOS CUBIERTOS
2 SEGMENTACIÓN DEL MERCADO
2.1 MERCADOS CUBIERTOS
2.2 ÁMBITO GEOGRÁFICO
2,3 AÑOS CONSIDERADOS PARA EL ESTUDIO
2.4 MODELO DE VALIDACIÓN DE DATOS TRÍPODE DBMR
2.5 ENTREVISTAS PRINCIPALES CON LÍDERES DE OPINIÓN CLAVE
2.6 CUADRÍCULA DE POSICIÓN DE MERCADO DBMR
2.7 ANÁLISIS DE LA PARTICIPACIÓN DE LOS PROVEEDORES
2.8 MODELADO MULTIVARIADO
2.9 CURVA DE CRONOLOGÍA DEL MATERIAL
2.1 CUADRÍCULA DE COBERTURA DE LA INDUSTRIA DE USO FINAL DEL MERCADO
2.11 FUENTES SECUNDARIAS
2.12 SUPUESTOS
3 RESUMEN EJECUTIVO
4 INFORMACIÓN PREMIUM
4.1 ANÁLISIS PESTEL
4.1.1 FACTORES POLÍTICOS
4.1.2 FACTORES ECONÓMICOS
4.1.3 FACTORES SOCIALES
4.1.4 FACTORES TECNOLÓGICOS
4.1.5 FACTORES AMBIENTALES
4.1.6 FACTORES LEGALES
4.2 ANÁLISIS DE LAS CINCO FUERZAS DE PORTER
4.2.1 AMENAZA DE NUEVOS ENTRANTES
4.2.2 PODER DE NEGOCIACIÓN DE LOS PROVEEDORES
4.2.3 PODER DE NEGOCIACIÓN DE LOS COMPRADORES
4.2.4 AMENAZA DE PRODUCTOS SUSTITUTOS
4.2.5 RIVALIDAD EN LA INDUSTRIA
4.3 ESCENARIO DE CAMBIO CLIMÁTICO
4.3.1 PREOCUPACIONES AMBIENTALES
4.3.2 RESPUESTA DE LA INDUSTRIA
4.3.3 EL PAPEL DEL GOBIERNO
4.3.4 RECOMENDACIONES DE LOS ANALISTAS
4.4 COBERTURA DE MATERIA PRIMA
4.4.1 POLIETILENO (PE)
4.4.2 POLIPROPILENO (PP)
4.4.3 TEREFTALATO DE POLIETILENO (PET)
4.4.4 PAPEL DE ALUMINIO
4.4.5 PAPEL Y MATERIALES CELULÓSICOS
4.5 ANÁLISIS DE LA CADENA DE SUMINISTRO
4.5.1 DESCRIPCIÓN GENERAL
4.5.2 ESCENARIO DE COSTOS LOGÍSTICOS
4.5.3 IMPORTANCIA DE LOS PROVEEDORES DE SERVICIOS LOGÍSTICOS
4.6 RESUMEN DE LA CAPACIDAD DE PRODUCCIÓN DEL MERCADO DE EMBALAJES FLEXIBLES
4.7 AVANCES TECNOLÓGICOS DE LOS FABRICANTES
4.7.1 PELÍCULAS DE BARRERA DE ALTO RENDIMIENTO Y ESTRUCTURAS NANOCOMPUESTAS
4.7.2 INNOVACIONES MONO-MATERIALES PARA LA CIRCULARIDAD
4.7.3 TECNOLOGÍAS DE IMPRESIÓN DIGITAL Y CONVERSIÓN INTELIGENTE
4.7.4 DESARROLLO DE POLÍMEROS DE BASE BIOLÓGICA Y COMPOSTABLES
4.7.5 INTEGRACIÓN DE EMBALAJES INTELIGENTES Y FUNCIONALES
4.7.6 MECANISMOS AVANZADOS DE SELLADO Y FORMADO
4.7.7 AUTOMATIZACIÓN, ROBÓTICA Y FABRICACIÓN CON IA
4.7.8 ADHESIVOS Y RECUBRIMIENTOS COMPATIBLES CON EL RECICLAJE
4.7.9 DISEÑO IMPULSADO POR DATOS Y ANÁLISIS DEL CICLO DE VIDA
4.7.10 HACIA UN FUTURO INTELIGENTE Y CIRCULAR
4.8 CRITERIOS DE SELECCIÓN DE PROVEEDORES
4.8.1 AMPLITUD DE LA CARTERA DE MATERIALES Y PRODUCTOS
4.8.2 CAPACIDAD TECNOLÓGICA Y PREPARACIÓN PARA LA INNOVACIÓN
4.8.3 SOSTENIBILIDAD Y CUMPLIMIENTO NORMATIVO
4.8.4 CAPACIDAD DE FABRICACIÓN Y PRESENCIA GLOBAL
4.8.5 NORMAS DE GARANTÍA DE CALIDAD Y CERTIFICACIÓN
4.8.6 PERSONALIZACIÓN Y FLEXIBILIDAD DE DISEÑO
4.8.7 TRANSPARENCIA Y TRAZABILIDAD DE LA CADENA DE SUMINISTRO
4.8.8 COMPETITIVIDAD EN COSTOS Y PROPUESTA DE VALOR TOTAL
4.8.9 INTEGRACIÓN DIGITAL Y SOPORTE POSVENTA
4.8.10 REPUTACIÓN, ALIANZAS ESTRATÉGICAS Y RESPALDO DEL MERCADO
4.8.11 RESUMEN
4.9 ANÁLISIS DE PRECIOS
5 COBERTURA REGLAMENTARIA
5.1 CÓDIGO DEL PRODUCTO
5.1.1 CÓDIGOS ESTÁNDAR DE LA INDIA (IS)
5.1.2 CÓDIGOS ESTÁNDAR INTERNACIONALES
5.2 NORMAS CERTIFICADAS
5.3 NORMAS DE SEGURIDAD
5.3.1 MANEJO Y ALMACENAMIENTO DE MATERIALES
5.3.2 TRANSPORTE Y PRECAUCIONES
5.3.3 IDENTIFICACIÓN DE HARAD
6 PANORAMA GENERAL DEL MERCADO
6.1 CONDUCTORES
6.1.1 CRECIENTE DEMANDA DEL SECTOR DE ALIMENTOS Y BEBIDAS
6.1.2 SOSTENIBILIDAD E INNOVACIONES DE MATERIALES ECOLÓGICOS
6.1.3 RENTABILIDAD Y CARACTERÍSTICAS DE DISEÑO VERSÁTILES
6.1.4 EXPANSIÓN DEL COMERCIO ELECTRÓNICO Y DE LOS SERVICIOS DE ENTREGA A DOMICILIO
6.2 RESTRICCIONES
6.2.1 PRECIOS FLUCTUANTES DE LAS MATERIAS PRIMAS QUE AFECTAN LOS COSTOS DE PRODUCCIÓN Y LOS MÁRGENES DE GANANCIA
6.2.2 LA INFRAESTRUCTURA DE RECICLAJE LIMITADA OBSTACULIZA LOS OBJETIVOS DE LA ECONOMÍA CIRCULAR Y LA SOSTENIBILIDAD
6.3 OPORTUNIDADES
6.3.1 AVANCES EN ENVASES INTELIGENTES Y ACTIVOS QUE MEJORAN LA VIDA ÚTIL DEL PRODUCTO Y LA EXPERIENCIA DEL CONSUMIDOR
6.3.2 AUMENTO DE LA ADOPCIÓN EN EL SECTOR SANITARIO Y FARMACÉUTICO
6.3.3 LOS MERCADOS EMERGENTES IMPULSAN EL CRECIMIENTO DEL CONSUMO A TRAVÉS DEL AUMENTO DE LA RENTA DISPONIBLE Y EL CAMBIO DE LAS PREFERENCIAS DE LOS CONSUMIDORES
6.4 DESAFÍOS
6.4.1 PRESIONES AMBIENTALES Y REGULADORAS QUE CONFORMAN EL DISEÑO DE ENVASES Y LAS PRÁCTICAS DE SOSTENIBILIDAD
6.4.2 BARRERAS TECNOLÓGICAS EN EL RECICLAJE DE PELÍCULAS MULTICAPA
7 MERCADO MUNDIAL DE EMBALAJES FLEXIBLES, POR PRODUCTO
7.1 DESCRIPCIÓN GENERAL
7.2 BOLSAS
7.3 BOLSAS Y SACOS
7.4 PELÍCULAS Y ENVOLTURAS
7.5 TUBOS
7.6 SOBRES Y PAQUETES DE BARRAS
7.7 REVESTIMIENTOS
7.8 ETIQUETAS
7.9 CINTAS
8 MERCADO MUNDIAL DE EMBALAJES FLEXIBLES, POR MATERIAL
8.1 DESCRIPCIÓN GENERAL
8.2 PLÁSTICO
8.3 PAPEL
8.4 METAL
8.5 ADHESIVOS Y RECUBRIMIENTOS
8.6 ÓXIDOS INORGÁNICOS
8.7 OTROS
9 MERCADO MUNDIAL DE EMBALAJES FLEXIBLES, POR TECNOLOGÍA
9.1 DESCRIPCIÓN GENERAL
9.2 FLEXOGRAFÍA
9.3 ROTOGRABADO
9.4 DIGITAL
9.5 OTROS
10 MERCADO MUNDIAL DE EMBALAJES FLEXIBLES, POR USO FINAL
10.1 DESCRIPCIÓN GENERAL
10.2 ALIMENTOS
10.3 BEBIDAS
11 MERCADO MUNDIAL DE EMBALAJES FLEXIBLES POR REGIONES
11.1 DESCRIPCIÓN GENERAL
11.2 ASIA PACÍFICO
11.2.1 CHINA
11.2.2 INDIA
11.2.3 JAPÓN
11.2.4 AUSTRALIA Y NUEVA ZELANDA
11.2.5 COREA DEL SUR
11.2.6 INDONESIA
11.2.7 TAILANDIA
11.2.8 MALASIA
11.2.9 FILIPINAS
11.2.10 SINGAPUR
11.2.11 RESTO DE ASIA-PACÍFICO
11.3 AMÉRICA DEL NORTE
11.3.1 EE. UU.
11.3.2 CANADÁ
11.3.3 MÉXICO
11.4 EUROPA
11.4.1 ALEMANIA
11.4.2 FRANCIA
11.4.3 Reino Unido
11.4.4 ITALIA
11.4.5 ESPAÑA
11.4.6 RUSIA
11.4.7 TURQUÍA
11.4.8 PAÍSES BAJOS
11.4.9 BÉLGICA
11.4.10 SUIZA
11.4.11 LUXEMBURGO
11.4.12 RESTO DE EUROPA
11.5 SUDAMÉRICA
11.5.1 BRASIL
11.5.2 ARGENTINA
11.5.3 RESTO DE SUDAMÉRICA
11.6 ORIENTE MEDIO Y ÁFRICA
11.6.1 ARABIA SAUDITA
11.6.2 Emiratos Árabes Unidos
11.6.3 SUDÁFRICA
11.6.4 EGIPTO
11.6.5 ISRAEL
11.6.6 RESTO DE ORIENTE MEDIO Y ÁFRICA
12 MERCADO GLOBAL DE EMBALAJES FLEXIBLES: PANORAMA EMPRESARIAL
12.1 ANÁLISIS DE LAS ACCIONES DE LAS EMPRESAS FABRICANTES: GLOBAL
12.2 ANÁLISIS DE ACCIONES DE EMPRESAS: EUROPA
12.3 ANÁLISIS DE ACCIONES DE LA EMPRESA: ASIA-PACÍFICO
12.4 ANÁLISIS DE ACCIONES DE EMPRESAS: AMÉRICA DEL NORTE
13 ANÁLISIS FODA
14 PERFILES DE EMPRESAS
14.1 COMPAÑÍA WESTROCK
14.1.1 INSTANTÁNEA DE LA EMPRESA
14.1.2 ANÁLISIS DE INGRESOS
14.1.3 ANÁLISIS DE LAS ACCIONES DE LA EMPRESA
14.1.4 PORTAFOLIO DE PRODUCTOS
14.1.5 DESARROLLO RECIENTE
14.2 AMCOR PLC
14.2.1 INSTANTÁNEA DE LA EMPRESA
14.2.2 ANÁLISIS DE INGRESOS
14.2.3 ANÁLISIS DE LAS ACCIONES DE LA EMPRESA
14.2.4 PORTAFOLIO DE PRODUCTOS
14.2.5 DESARROLLO RECIENTE
14.3 GRAPHIC PACKAGING INTERNATIONAL, LLC (SUBSIDIARIA DE AR PACKAGING SOLUTIONS)
14.3.1 INSTANTÁNEA DE LA EMPRESA
14.3.2 ANÁLISIS DE INGRESOS
14.3.3 ANÁLISIS DE LAS ACCIONES DE LA EMPRESA
14.3.4 PORTAFOLIO DE PRODUCTOS
14.3.5 DESARROLLO RECIENTE
14.4 AIRE SELLADO
14.4.1 INSTANTÁNEA DE LA EMPRESA
14.4.2 ANÁLISIS DE INGRESOS
14.4.3 ANÁLISIS DE LAS ACCIONES DE LA EMPRESA
14.4.4 PORTAFOLIO DE PRODUCTOS
14.4.5 DESARROLLO RECIENTE
14.5 HUHTAMÄKI OYJ
14.5.1 INSTANTÁNEA DE LA EMPRESA
14.5.2 ANÁLISIS DE INGRESOS
14.5.3 ANÁLISIS DE LAS ACCIONES DE LA EMPRESA
14.5.4 PORTAFOLIO DE PRODUCTOS
14.5.5 DESARROLLO RECIENTE
14.6 ALTANA
14.6.1 INSTANTÁNEA DE LA EMPRESA
14.6.2 ANÁLISIS DE INGRESOS
14.6.3 PORTAFOLIO DE PRODUCTOS
14.6.4 DESARROLLO RECIENTE
14.7 EMBALAJE BBC CELLPACK
14.7.1 INSTANTÁNEA DE LA EMPRESA
14.7.2 PORTAFOLIO DE PRODUCTOS
14.7.3 DESARROLLO RECIENTE
14.8 BISCHOF+KLEIN SE & CO.KG
14.8.1 INSTANTÁNEA DE LA EMPRESA
14.8.2 PORTAFOLIO DE PRODUCTOS
14.8.3 DESARROLLO RECIENTE
14.9 FLEXIBLES DE CONSTANTIA
14.9.1 INSTANTÁNEA DE LA EMPRESA
14.9.2 PORTAFOLIO DE PRODUCTOS
14.9.3 DESARROLLO RECIENTE
14.1 COBERTURA
14.10.1 INSTANTÁNEA DE LA EMPRESA
14.10.2 PORTAFOLIO DE PRODUCTOS
14.10.3 DESARROLLO RECIENTE
14.11 FLAIR CORPORACIÓN DE EMBALAJE FLEXIBLE.
14.11.1 INSTANTÁNEA DE LA EMPRESA
14.11.2 PORTAFOLIO DE PRODUCTOS
14.11.3 DESARROLLO RECIENTE
14.12 GOGLIO SPA
14.12.1 INSTANTÁNEA DE LA EMPRESA
14.12.2 PORTAFOLIO DE PRODUCTOS
14.12.3 DESARROLLO RECIENTE
14.13 LUNES.
14.13.1 INSTANTÁNEA DE LA EMPRESA
14.13.2 ANÁLISIS DE INGRESOS
14.13.3 PORTAFOLIO DE PRODUCTOS
14.13.4 DESARROLLO RECIENTE
14.14 PROAMPAC.
14.14.1 INSTANTÁNEA DE LA EMPRESA
14.14.2 PORTAFOLIO DE PRODUCTOS
14.14.3 DESARROLLO RECIENTE
14.15 SCHUR
14.15.1 INSTANTÁNEA DE LA EMPRESA
14.15.2 PORTAFOLIO DE PRODUCTOS
14.15.3 DESARROLLO RECIENTE
14.16 EMPRESA DE PRODUCTOS SONOCO
14.16.1 INSTANTÁNEA DE LA EMPRESA
14.16.2 ANÁLISIS DE INGRESOS
14.16.3 PORTAFOLIO DE PRODUCTOS
14.16.4 DESARROLLO RECIENTE
14.17 SÜDPACK
14.17.1 INSTANTÁNEA DE LA EMPRESA
14.17.2 PORTAFOLIO DE PRODUCTOS
14.17.3 DESARROLLO RECIENTE
14.18 WIPAK
14.18.1 INSTANTÁNEA DE LA EMPRESA
14.18.2 PORTAFOLIO DE PRODUCTOS
14.18.3 DESARROLLO RECIENTE
15 CUESTIONARIO
16 INFORMES RELACIONADOS
Lista de Tablas
TABLA 1 MERCADO MUNDIAL DE ENVASES FLEXIBLES, POR PRODUCTO, 2018-2032 (MILLONES DE USD)
TABLA 2 MERCADO MUNDIAL DE BOLSAS EN EMBALAJES FLEXIBLES, POR REGIÓN, 2018-2032 (MILLONES DE USD)
TABLA 3 MERCADO MUNDIAL DE BOLSAS Y SACOS EN EMBALAJES FLEXIBLES, POR REGIÓN, 2018-2032 (MILLONES DE USD)
TABLA 4 MERCADO MUNDIAL DE PELÍCULAS Y ENVOLTURAS EN EMBALAJES FLEXIBLES, POR REGIÓN, 2018-2032 (MILLONES DE USD)
TABLA 5 MERCADO MUNDIAL DE TUBOS EN ENVASES FLEXIBLES, POR REGIÓN, 2018-2032 (MILLONES DE USD)
TABLA 6 MERCADO MUNDIAL DE SOBRES Y PAQUETES DE BARRA EN EL ENVASE FLEXIBLE, POR REGIÓN, 2018-2032 (MILLONES DE USD)
TABLA 7 MERCADO GLOBAL DE REVESTIMIENTOS EN EMBALAJES FLEXIBLES, POR REGIÓN, 2018-2032 (MILLONES DE USD)
TABLA 8 ETIQUETAS GLOBALES EN EL MERCADO DE ENVASES FLEXIBLES, POR REGIÓN, 2018-2032 (MILLONES DE USD)
TABLA 9 MERCADO MUNDIAL DE CINTAS EN EMBALAJES FLEXIBLES, POR REGIÓN, 2018-2032 (MILLONES DE USD)
TABLA 10 MERCADO MUNDIAL DE EMBALAJES FLEXIBLES, POR MATERIAL, 2018-2032 (MILLONES DE USD)
TABLA 11 MERCADO MUNDIAL DE PLÁSTICO EN ENVASES FLEXIBLES, POR REGIÓN, 2018-2032 (MILLONES DE USD)
TABLA 12 MERCADO MUNDIAL DE PAPEL EN EMBALAJES FLEXIBLES, POR REGIÓN, 2018-2032 (MILLONES DE USD)
TABLA 13 MERCADO MUNDIAL DE METAL EN ENVASES FLEXIBLES, POR REGIÓN, 2018-2032 (MILLONES DE USD)
TABLA 14 MERCADO MUNDIAL DE ADHESIVOS Y RECUBRIMIENTOS EN ENVASES FLEXIBLES, POR REGIÓN, 2018-2032 (MILLONES DE USD)
TABLA 15 ÓXIDOS INORGÁNICOS GLOBALES EN EL MERCADO DE ENVASES FLEXIBLES, POR REGIÓN, 2018-2032 (MILLONES DE USD)
TABLA 16 OTROS MERCADOS MUNDIALES DE ENVASES FLEXIBLES, POR REGIÓN, 2018-2032 (MILLONES DE USD)
TABLA 17 MERCADO MUNDIAL DE ENVASES FLEXIBLES, POR TECNOLOGÍA, 2018-2032 (MILES DE USD)
TABLA 18 MERCADO MUNDIAL DE ENVASES FLEXIBLES, POR USO FINAL, 2018-2032 (MILLONES DE USD)
TABLA 19 MERCADO MUNDIAL DE ALIMENTOS EN ENVASES FLEXIBLES, POR REGIÓN, 2018-2032 (MILLONES DE USD)
TABLA 20 MERCADO MUNDIAL DE ALIMENTOS EN ENVASES FLEXIBLES, POR TIPO, 2018-2032 (MILLONES DE USD)
TABLA 21 MERCADO MUNDIAL DE BEBIDAS EN ENVASES FLEXIBLES, POR REGIÓN, 2018-2032 (MILLONES DE USD)
TABLA 22 MERCADO MUNDIAL DE ENVASES FLEXIBLES, POR REGIÓN, 2018-2032 (MILLONES DE USD)
TABLA 23 MERCADO MUNDIAL DE ENVASES FLEXIBLES, POR PRODUCTO, 2018-2032 (MILLONES DE USD)
TABLA 24 MERCADO MUNDIAL DE EMBALAJES FLEXIBLES, POR MATERIAL, 2018-2032 (MILLONES DE USD)
TABLA 25 MERCADO MUNDIAL DE ENVASES FLEXIBLES, POR USO FINAL, 2018-2032 (MILLONES DE USD)
TABLA 26 MERCADO MUNDIAL DE ALIMENTOS EN ENVASES FLEXIBLES, POR TIPO, 2018-2032 (MILLONES DE USD)
TABLA 27 MERCADO MUNDIAL DE ENVASES FLEXIBLES, POR TECNOLOGÍA, 2018-2032 (MILLONES DE USD)
TABLA 28 MERCADO DE EMBALAJES FLEXIBLES DE ASIA-PACÍFICO, POR PAÍS, 2018-2032 (MILLONES DE USD)
TABLA 29 MERCADO DE EMBALAJES FLEXIBLES DE ASIA-PACÍFICO, POR PRODUCTO, 2018-2032 (MILLONES DE USD)
TABLA 30 MERCADO DE EMBALAJES FLEXIBLES DE ASIA-PACÍFICO, POR MATERIAL, 2018-2032 (MILLONES DE USD)
TABLA 31 MERCADO DE ENVASES FLEXIBLES DE ASIA-PACÍFICO, POR USO FINAL, 2018-2032 (MILLONES DE USD)
TABLA 32 MERCADO DE ALIMENTOS EN ENVASES FLEXIBLES DE ASIA-PACÍFICO, POR TIPO, 2018-2032 (MILLONES DE USD)
TABLA 33 MERCADO DE EMBALAJES FLEXIBLES DE ASIA-PACÍFICO, POR TECNOLOGÍA, 2018-2032 (MILLONES DE USD)
TABLA 34 MERCADO DE EMBALAJES FLEXIBLES DE CHINA, POR PRODUCTO, 2018-2032 (MILLONES DE USD)
TABLA 35 MERCADO DE EMBALAJES FLEXIBLES DE CHINA, POR MATERIAL, 2018-2032 (MILLONES DE USD)
TABLA 36 MERCADO DE ENVASES FLEXIBLES DE CHINA, POR USO FINAL, 2018-2032 (MILLONES DE USD)
TABLA 37 ALIMENTOS DE CHINA EN EL MERCADO DE ENVASES FLEXIBLES, POR TIPO, 2018-2032 (MILLONES DE USD)
TABLA 38 MERCADO DE EMBALAJES FLEXIBLES DE CHINA, POR TECNOLOGÍA, 2018-2032 (MILLONES DE USD)
TABLA 39 MERCADO DE EMBALAJES FLEXIBLES DE LA INDIA, POR PRODUCTO, 2018-2032 (MILLONES DE USD)
TABLA 40 MERCADO DE EMBALAJES FLEXIBLES DE LA INDIA, POR MATERIAL, 2018-2032 (MILLONES DE USD)
TABLA 41 MERCADO DE EMBALAJES FLEXIBLES DE LA INDIA, POR USO FINAL, 2018-2032 (MILLONES DE USD)
TABLA 42 MERCADO DE ALIMENTOS EN ENVASES FLEXIBLES DE LA INDIA, POR TIPO, 2018-2032 (MILLONES DE USD)
TABLA 43 MERCADO DE EMBALAJES FLEXIBLES DE LA INDIA, POR TECNOLOGÍA, 2018-2032 (MILLONES DE USD)
TABLA 44 MERCADO DE EMBALAJES FLEXIBLES DE JAPÓN, POR PRODUCTO, 2018-2032 (MILLONES DE USD)
TABLA 45 MERCADO DE EMBALAJES FLEXIBLES DE JAPÓN, POR MATERIAL, 2018-2032 (MILLONES DE USD)
TABLA 46 MERCADO DE ENVASES FLEXIBLES DE JAPÓN, POR USO FINAL, 2018-2032 (MILLONES DE USD)
TABLA 47 MERCADO DE ALIMENTOS EN ENVASES FLEXIBLES DE JAPÓN, POR TIPO, 2018-2032 (MILLONES DE USD)
TABLA 48 MERCADO DE EMBALAJES FLEXIBLES DE JAPÓN, POR TECNOLOGÍA, 2018-2032 (MILLONES DE USD)
TABLA 49 MERCADO DE EMBALAJES FLEXIBLES DE AUSTRALIA Y NUEVA ZELANDA, POR PRODUCTO, 2018-2032 (MILLONES DE USD)
TABLA 50 MERCADO DE EMBALAJES FLEXIBLES DE AUSTRALIA Y NUEVA ZELANDA, POR MATERIAL, 2018-2032 (MILLONES DE USD)
TABLA 51 MERCADO DE EMBALAJES FLEXIBLES DE AUSTRALIA Y NUEVA ZELANDA, POR USO FINAL, 2018-2032 (MILLONES DE USD)
TABLA 52 AUSTRALIA Y NUEVA ZELANDA MERCADO DE ALIMENTOS EN ENVASES FLEXIBLES, POR TIPO, 2018-2032 (MILLONES DE USD)
TABLA 53 MERCADO DE EMBALAJES FLEXIBLES DE AUSTRALIA Y NUEVA ZELANDA, POR TECNOLOGÍA, 2018-2032 (MILLONES DE USD)
TABLA 54 MERCADO DE EMBALAJES FLEXIBLES DE COREA DEL SUR, POR PRODUCTO, 2018-2032 (MILLONES DE USD)
TABLA 55 MERCADO DE EMBALAJES FLEXIBLES DE COREA DEL SUR, POR MATERIAL, 2018-2032 (MILLONES DE USD)
TABLA 56 MERCADO DE EMBALAJES FLEXIBLES DE COREA DEL SUR, POR USO FINAL, 2018-2032 (MILLONES DE USD)
TABLA 57 MERCADO DE ALIMENTOS EN ENVASES FLEXIBLES DE COREA DEL SUR, POR TIPO, 2018-2032 (MILLONES DE USD)
TABLA 58 MERCADO DE EMBALAJES FLEXIBLES DE COREA DEL SUR, POR TECNOLOGÍA, 2018-2032 (MILLONES DE USD)
TABLA 59 MERCADO DE EMBALAJES FLEXIBLES DE INDONESIA, POR PRODUCTO, 2018-2032 (MILLONES DE USD)
TABLA 60 MERCADO DE EMBALAJES FLEXIBLES DE INDONESIA, POR MATERIAL, 2018-2032 (MILLONES DE USD)
TABLA 61 MERCADO DE ENVASES FLEXIBLES DE INDONESIA, POR USO FINAL, 2018-2032 (MILLONES DE USD)
TABLA 62 MERCADO DE ALIMENTOS EN ENVASES FLEXIBLES DE INDONESIA, POR TIPO, 2018-2032 (MILLONES DE USD)
TABLA 63 MERCADO DE EMBALAJES FLEXIBLES DE INDONESIA, POR TECNOLOGÍA, 2018-2032 (MILLONES DE USD)
TABLA 64 MERCADO DE EMBALAJES FLEXIBLES DE TAILANDIA, POR PRODUCTO, 2018-2032 (MILLONES DE USD)
TABLA 65 MERCADO DE EMBALAJES FLEXIBLES DE TAILANDIA, POR MATERIAL, 2018-2032 (MILLONES DE USD)
TABLA 66 MERCADO DE ENVASES FLEXIBLES DE TAILANDIA, POR USO FINAL, 2018-2032 (MILLONES DE USD)
TABLA 67 MERCADO DE ALIMENTOS EN ENVASES FLEXIBLES DE TAILANDIA, POR TIPO, 2018-2032 (MILLONES DE USD)
TABLA 68 MERCADO DE EMBALAJES FLEXIBLES DE TAILANDIA, POR TECNOLOGÍA, 2018-2032 (MILLONES DE USD)
TABLA 69 MERCADO DE EMBALAJES FLEXIBLES DE MALASIA, POR PRODUCTO, 2018-2032 (MILLONES DE USD)
TABLA 70 MERCADO DE EMBALAJES FLEXIBLES DE MALASIA, POR MATERIAL, 2018-2032 (MILLONES DE USD)
TABLA 71 MERCADO DE ENVASES FLEXIBLES DE MALASIA, POR USO FINAL, 2018-2032 (MILLONES DE USD)
TABLA 72 MERCADO DE ALIMENTOS EN ENVASES FLEXIBLES DE MALASIA, POR TIPO, 2018-2032 (MILLONES DE USD)
TABLA 73 MERCADO DE EMBALAJES FLEXIBLES DE MALASIA, POR TECNOLOGÍA, 2018-2032 (MILLONES DE USD)
TABLA 74 MERCADO DE EMBALAJES FLEXIBLES DE FILIPINAS, POR PRODUCTO, 2018-2032 (MILLONES DE USD)
TABLA 75 MERCADO DE EMBALAJES FLEXIBLES DE FILIPINAS, POR MATERIAL, 2018-2032 (MILLONES DE USD)
TABLA 76 MERCADO DE ENVASES FLEXIBLES DE FILIPINAS, POR USO FINAL, 2018-2032 (MILLONES DE USD)
TABLA 77 MERCADO DE ALIMENTOS EN ENVASES FLEXIBLES DE FILIPINAS, POR TIPO, 2018-2032 (MILLONES DE USD)
TABLA 78 MERCADO DE EMBALAJES FLEXIBLES DE FILIPINAS, POR TECNOLOGÍA, 2018-2032 (MILLONES DE USD)
TABLA 79 MERCADO DE EMBALAJES FLEXIBLES DE SINGAPUR, POR PRODUCTO, 2018-2032 (MILLONES DE USD)
TABLA 80 MERCADO DE EMBALAJES FLEXIBLES DE SINGAPUR, POR MATERIAL, 2018-2032 (MILLONES DE USD)
TABLA 81 MERCADO DE EMBALAJES FLEXIBLES DE SINGAPUR, POR USO FINAL, 2018-2032 (MILLONES DE USD)
TABLA 82 MERCADO DE ALIMENTOS EN ENVASES FLEXIBLES DE SINGAPUR, POR TIPO, 2018-2032 (MILLONES DE USD)
TABLA 83 MERCADO DE EMBALAJES FLEXIBLES DE SINGAPUR, POR TECNOLOGÍA, 2018-2032 (MILLONES DE USD)
TABLA 84 RESTO DEL MERCADO DE EMBALAJES FLEXIBLES DE ASIA-PACÍFICO, POR PRODUCTO, 2018-2032 (MILLONES DE USD)
TABLA 85 RESTO DEL MERCADO DE EMBALAJES FLEXIBLES DE ASIA-PACÍFICO, POR MATERIAL, 2018-2032 (MILLONES DE USD)
TABLA 86 RESTO DEL MERCADO DE EMBALAJES FLEXIBLES DE ASIA-PACÍFICO, POR USO FINAL, 2018-2032 (MILLONES DE USD)
TABLA 87 RESTO DEL MERCADO DE ALIMENTOS EN ENVASES FLEXIBLES DE ASIA-PACÍFICO, POR TIPO, 2018-2032 (MILLONES DE USD)
TABLA 88 RESTO DEL MERCADO DE EMBALAJES FLEXIBLES DE ASIA-PACÍFICO, POR TECNOLOGÍA, 2018-2032 (MILLONES DE USD)
TABLA 89 MERCADO DE EMPAQUES FLEXIBLES DE AMÉRICA DEL NORTE, POR PAÍS, 2018-2032 (MILLONES DE USD)
TABLA 90 MERCADO DE EMPAQUES FLEXIBLES DE AMÉRICA DEL NORTE, POR PRODUCTO, 2018-2032 (MILLONES DE USD)
TABLA 91 MERCADO DE EMPAQUES FLEXIBLES DE AMÉRICA DEL NORTE, POR MATERIAL, 2018-2032 (MILLONES DE USD)
TABLA 92 MERCADO DE ENVASES FLEXIBLES DE AMÉRICA DEL NORTE, POR USO FINAL, 2018-2032 (MILLONES DE USD)
TABLA 93 MERCADO DE ALIMENTOS EN ENVASES FLEXIBLES DE AMÉRICA DEL NORTE, POR TIPO, 2018-2032 (MILLONES DE USD)
TABLA 94 MERCADO DE EMPAQUES FLEXIBLES DE AMÉRICA DEL NORTE, POR TECNOLOGÍA, 2018-2032 (MILLONES DE USD)
TABLA 95 MERCADO DE EMBALAJES FLEXIBLES DE EE. UU., POR PRODUCTO, 2018-2032 (MILLONES DE USD)
TABLA 96 MERCADO DE EMBALAJES FLEXIBLES DE EE. UU., POR MATERIAL, 2018-2032 (MILLONES DE USD)
TABLA 97 MERCADO DE ENVASES FLEXIBLES DE EE. UU., POR USO FINAL, 2018-2032 (MILLONES DE USD)
TABLA 98 MERCADO DE ALIMENTOS EN ENVASES FLEXIBLES DE EE. UU., POR TIPO, 2018-2032 (MILLONES DE USD)
TABLA 99 MERCADO DE EMBALAJES FLEXIBLES DE EE. UU., POR TECNOLOGÍA, 2018-2032 (MILLONES DE USD)
TABLA 100 MERCADO DE ENVASES FLEXIBLES DE CANADÁ, POR PRODUCTO, 2018-2032 (MILLONES DE USD)
TABLA 101 MERCADO DE EMBALAJES FLEXIBLES DE CANADÁ, POR MATERIAL, 2018-2032 (MILLONES DE USD)
TABLA 102 MERCADO DE ENVASES FLEXIBLES DE CANADÁ, POR USO FINAL, 2018-2032 (MILLONES DE USD)
TABLA 103 MERCADO DE ALIMENTOS EN ENVASES FLEXIBLES DE CANADÁ, POR TIPO, 2018-2032 (MILLONES DE USD)
TABLA 104 MERCADO DE EMBALAJES FLEXIBLES DE CANADÁ, POR TECNOLOGÍA, 2018-2032 (MILLONES DE USD)
TABLA 105 MERCADO DE EMPAQUES FLEXIBLES EN MÉXICO, POR PRODUCTO, 2018-2032 (MILLONES DE USD)
TABLA 106 MERCADO DE EMPAQUES FLEXIBLES EN MÉXICO, POR MATERIAL, 2018-2032 (MILLONES DE USD)
TABLA 107 MERCADO DE EMPAQUES FLEXIBLES EN MÉXICO, POR USO FINAL, 2018-2032 (MILLONES DE USD)
TABLA 108 MERCADO DE ALIMENTOS EN EMPAQUE FLEXIBLE DE MÉXICO, POR TIPO, 2018-2032 (USD MILLONES)
TABLA 109 MERCADO DE EMPAQUES FLEXIBLES EN MÉXICO, POR TECNOLOGÍA, 2018-2032 (MILLONES DE USD)
TABLA 110 MERCADO EUROPEO DE EMBALAJES FLEXIBLES, POR PAÍS, 2018-2032 (MILLONES DE USD)
TABLA 111 MERCADO EUROPEO DE EMBALAJES FLEXIBLES, POR PRODUCTO, 2018-2032 (MILLONES DE USD)
TABLA 112 MERCADO EUROPEO DE EMBALAJES FLEXIBLES, POR MATERIAL, 2018-2032 (MILLONES DE USD)
TABLA 113 MERCADO EUROPEO DE ENVASES FLEXIBLES, POR USO FINAL, 2018-2032 (MILLONES DE USD)
TABLA 114 MERCADO EUROPEO DE ALIMENTOS EN ENVASES FLEXIBLES, POR TIPO, 2018-2032 (MILLONES DE USD)
TABLA 115 MERCADO EUROPEO DE EMBALAJES FLEXIBLES, POR TECNOLOGÍA, 2018-2032 (MILLONES DE USD)
TABLA 116 MERCADO DE EMBALAJES FLEXIBLES DE ALEMANIA, POR PRODUCTO, 2018-2032 (MILLONES DE USD)
TABLA 117 MERCADO DE EMBALAJES FLEXIBLES DE ALEMANIA, POR MATERIAL, 2018-2032 (MILLONES DE USD)
TABLA 118 MERCADO DE ENVASES FLEXIBLES DE ALEMANIA, POR USO FINAL, 2018-2032 (MILLONES DE USD)
TABLA 119 MERCADO DE ALIMENTOS EN ENVASES FLEXIBLES DE ALEMANIA, POR TIPO, 2018-2032 (MILLONES DE USD)
TABLA 120 MERCADO DE EMBALAJES FLEXIBLES DE ALEMANIA, POR TECNOLOGÍA, 2018-2032 (MILLONES DE USD)
TABLA 121 MERCADO DE ENVASES FLEXIBLES DE FRANCIA, POR PRODUCTO, 2018-2032 (MILLONES DE USD)
TABLA 122 MERCADO DE EMBALAJES FLEXIBLES EN FRANCIA, POR MATERIAL, 2018-2032 (MILLONES DE USD)
TABLA 123 MERCADO DE ENVASES FLEXIBLES DE FRANCIA, POR USO FINAL, 2018-2032 (MILLONES DE USD)
TABLA 124 MERCADO DE ALIMENTOS EN ENVASES FLEXIBLES DE FRANCIA, POR TIPO, 2018-2032 (MILLONES DE USD)
TABLA 125 MERCADO DE ENVASES FLEXIBLES EN FRANCIA, POR TECNOLOGÍA, 2018-2032 (MILLONES DE USD)
TABLA 126 MERCADO DE EMBALAJES FLEXIBLES DEL REINO UNIDO, POR PRODUCTO, 2018-2032 (MILLONES DE USD)
TABLA 127 MERCADO DE EMBALAJES FLEXIBLES DEL REINO UNIDO, POR MATERIAL, 2018-2032 (MILLONES DE USD)
TABLA 128 MERCADO DE ENVASES FLEXIBLES DEL REINO UNIDO, POR USO FINAL, 2018-2032 (MILLONES DE USD)
TABLA 129 MERCADO DE ALIMENTOS EN ENVASES FLEXIBLES DEL REINO UNIDO, POR TIPO, 2018-2032 (MILLONES DE USD)
TABLA 130 MERCADO DE EMBALAJES FLEXIBLES DEL REINO UNIDO, POR TECNOLOGÍA, 2018-2032 (MILLONES DE USD)
TABLA 131 MERCADO DE EMBALAJES FLEXIBLES DE ITALIA, POR PRODUCTO, 2018-2032 (MILLONES DE USD)
TABLA 132 MERCADO DE EMBALAJES FLEXIBLES DE ITALIA, POR MATERIAL, 2018-2032 (MILLONES DE USD)
TABLA 133 MERCADO DE ENVASES FLEXIBLES DE ITALIA, POR USO FINAL, 2018-2032 (MILLONES DE USD)
TABLA 134 MERCADO DE ALIMENTOS EN ENVASES FLEXIBLES DE ITALIA, POR TIPO, 2018-2032 (MILLONES DE USD)
TABLA 135 MERCADO DE EMBALAJES FLEXIBLES DE ITALIA, POR TECNOLOGÍA, 2018-2032 (MILLONES DE USD)
TABLA 136 MERCADO ESPAÑOL DE EMBALAJES FLEXIBLES, POR PRODUCTO, 2018-2032 (MILLONES DE USD)
TABLA 137 MERCADO ESPAÑOL DE EMBALAJES FLEXIBLES, POR MATERIAL, 2018-2032 (MILLONES DE USD)
TABLA 138 MERCADO ESPAÑOL DE ENVASES FLEXIBLES, POR USO FINAL, 2018-2032 (MILLONES DE USD)
TABLA 139 MERCADO ESPAÑOL DE ALIMENTOS EN ENVASES FLEXIBLES, POR TIPO, 2018-2032 (MILLONES DE USD)
TABLA 140 MERCADO ESPAÑOL DE EMBALAJES FLEXIBLES, POR TECNOLOGÍA, 2018-2032 (MILLONES DE USD)
TABLA 141 MERCADO DE EMBALAJES FLEXIBLES DE RUSIA, POR PRODUCTO, 2018-2032 (MILLONES DE USD)
TABLA 142 MERCADO DE EMBALAJES FLEXIBLES DE RUSIA, POR MATERIAL, 2018-2032 (MILLONES DE USD)
TABLA 143 MERCADO DE ENVASES FLEXIBLES DE RUSIA, POR USO FINAL, 2018-2032 (MILLONES DE USD)
TABLA 144 MERCADO DE ALIMENTOS EN ENVASES FLEXIBLES DE RUSIA, POR TIPO, 2018-2032 (MILLONES DE USD)
TABLA 145 MERCADO DE EMBALAJES FLEXIBLES DE RUSIA, POR TECNOLOGÍA, 2018-2032 (MILLONES DE USD)
TABLA 146 MERCADO DE ENVASES FLEXIBLES DE TURQUÍA, POR PRODUCTO, 2018-2032 (MILLONES DE USD)
TABLA 147 MERCADO DE EMBALAJES FLEXIBLES DE TURQUÍA, POR MATERIAL, 2018-2032 (MILLONES DE USD)
TABLA 148 MERCADO DE ENVASES FLEXIBLES DE TURQUÍA, POR USO FINAL, 2018-2032 (MILLONES DE USD)
TABLA 149 MERCADO DE ALIMENTOS DE PAVO EN ENVASES FLEXIBLES, POR TIPO, 2018-2032 (MILLONES DE USD)
TABLA 150 MERCADO DE EMBALAJES FLEXIBLES DE TURQUÍA, POR TECNOLOGÍA, 2018-2032 (MILLONES DE USD)
TABLA 151 MERCADO DE EMBALAJES FLEXIBLES DE LOS PAÍSES BAJOS, POR PRODUCTO, 2018-2032 (MILLONES DE USD)
TABLA 152 MERCADO DE EMBALAJES FLEXIBLES DE LOS PAÍSES BAJOS, POR MATERIAL, 2018-2032 (MILLONES DE USD)
TABLA 153 MERCADO DE ENVASES FLEXIBLES DE LOS PAÍSES BAJOS, POR USO FINAL, 2018-2032 (MILLONES DE USD)
TABLA 154 MERCADO DE ALIMENTOS EN ENVASES FLEXIBLES DE LOS PAÍSES BAJOS, POR TIPO, 2018-2032 (MILLONES DE USD)
TABLA 155 MERCADO DE EMBALAJES FLEXIBLES DE LOS PAÍSES BAJOS, POR TECNOLOGÍA, 2018-2032 (MILLONES DE USD)
TABLA 156 MERCADO DE ENVASES FLEXIBLES DE BÉLGICA, POR PRODUCTO, 2018-2032 (MILLONES DE USD)
TABLA 157 MERCADO DE EMBALAJES FLEXIBLES DE BÉLGICA, POR MATERIAL, 2018-2032 (MILLONES DE USD)
TABLA 158 MERCADO DE ENVASES FLEXIBLES DE BÉLGICA, POR USO FINAL, 2018-2032 (MILLONES DE USD)
TABLA 159 MERCADO DE ALIMENTOS EN ENVASES FLEXIBLES DE BÉLGICA, POR TIPO, 2018-2032 (MILLONES DE USD)
TABLA 160 MERCADO DE EMBALAJES FLEXIBLES DE BÉLGICA, POR TECNOLOGÍA, 2018-2032 (MILLONES DE USD)
TABLA 161 MERCADO DE EMBALAJES FLEXIBLES DE SUIZA, POR PRODUCTO, 2018-2032 (MILLONES DE USD)
TABLA 162 MERCADO DE EMBALAJES FLEXIBLES DE SUIZA, POR MATERIAL, 2018-2032 (MILLONES DE USD)
TABLA 163 MERCADO DE ENVASES FLEXIBLES DE SUIZA, POR USO FINAL, 2018-2032 (MILLONES DE USD)
TABLA 164 MERCADO SUIZO DE ALIMENTOS EN ENVASES FLEXIBLES, POR TIPO, 2018-2032 (MILLONES DE USD)
TABLA 165 MERCADO DE EMBALAJES FLEXIBLES DE SUIZA, POR TECNOLOGÍA, 2018-2032 (MILLONES DE USD)
TABLA 166 MERCADO DE EMBALAJES FLEXIBLES DE LUXEMBURGO, POR PRODUCTO, 2018-2032 (MILLONES DE USD)
TABLA 167 MERCADO DE EMBALAJES FLEXIBLES DE LUXEMBURGO, POR MATERIAL, 2018-2032 (MILLONES DE USD)
TABLA 168 MERCADO DE ENVASES FLEXIBLES DE LUXEMBURGO, POR USO FINAL, 2018-2032 (MILLONES DE USD)
TABLA 169 MERCADO DE ALIMENTOS EN ENVASES FLEXIBLES DE LUXEMBURGO, POR TIPO, 2018-2032 (MILLONES DE USD)
TABLA 170 MERCADO DE EMBALAJES FLEXIBLES DE LUXEMBURGO, POR TECNOLOGÍA, 2018-2032 (MILLONES DE USD)
TABLA 171 RESTO DE EUROPA MERCADO DE EMBALAJES FLEXIBLES, POR PRODUCTO, 2018-2032 (MILLONES DE USD)
TABLA 172 RESTO DE EUROPA MERCADO DE EMBALAJES FLEXIBLES, POR MATERIAL, 2018-2032 (MILLONES DE USD)
TABLA 173 RESTO DEL MERCADO DE ENVASES FLEXIBLES DE EUROPA, POR USO FINAL, 2018-2032 (MILLONES DE USD)
TABLA 174 RESTO DE EUROPA MERCADO DE ALIMENTOS EN ENVASES FLEXIBLES, POR TIPO, 2018-2032 (MILLONES DE USD)
TABLA 175 RESTO DE EUROPA MERCADO DE EMBALAJES FLEXIBLES, POR TECNOLOGÍA, 2018-2032 (MILLONES DE USD)
TABLA 176 MERCADO DE EMPAQUES FLEXIBLES DE AMÉRICA DEL SUR, POR PAÍS, 2018-2032 (MILLONES DE USD)
TABLA 177 MERCADO DE EMPAQUES FLEXIBLES DE AMÉRICA DEL SUR, POR PRODUCTO, 2018-2032 (MILLONES DE USD)
TABLA 178 MERCADO DE EMPAQUES FLEXIBLES DE AMÉRICA DEL SUR, POR MATERIAL, 2018-2032 (MILLONES DE USD)
TABLA 179 MERCADO DE ENVASES FLEXIBLES DE AMÉRICA DEL SUR, POR USO FINAL, 2018-2032 (MILLONES DE USD)
TABLA 180 MERCADO DE ALIMENTOS EN ENVASES FLEXIBLES DE AMÉRICA DEL SUR, POR TIPO, 2018-2032 (MILLONES DE USD)
TABLA 181 MERCADO DE EMPAQUES FLEXIBLES DE AMÉRICA DEL SUR, POR TECNOLOGÍA, 2018-2032 (MILLONES DE USD)
TABLA 182 MERCADO DE EMBALAJES FLEXIBLES DE BRASIL, POR PRODUCTO, 2018-2032 (USD MILLONES)
TABLA 183 MERCADO DE EMBALAJES FLEXIBLES DE BRASIL, POR MATERIAL, 2018-2032 (USD MILLONES)
TABLA 184 MERCADO DE EMBALAJES FLEXIBLES DE BRASIL, POR USO FINAL, 2018-2032 (MILLONES DE USD)
TABLA 185 MERCADO DE ALIMENTOS EN ENVASES FLEXIBLES DE BRASIL, POR TIPO, 2018-2032 (USD MILLONES)
TABLA 186 MERCADO DE EMBALAJES FLEXIBLES DE BRASIL, POR TECNOLOGÍA, 2018-2032 (USD MILLONES)
TABLA 187 MERCADO ARGENTINO DE ENVASES FLEXIBLES, POR PRODUCTO, 2018-2032 (MILLONES DE USD)
TABLA 188 MERCADO ARGENTINO DE EMBALAJES FLEXIBLES, POR MATERIAL, 2018-2032 (USD MILLONES)
TABLA 189 MERCADO ARGENTINO DE ENVASES FLEXIBLES, POR USO FINAL, 2018-2032 (MILLONES DE USD)
TABLA 190 MERCADO ARGENTINO DE ALIMENTOS EN ENVASES FLEXIBLES, POR TIPO, 2018-2032 (USD MILLONES)
TABLA 191 MERCADO ARGENTINO DE ENVASES FLEXIBLES, POR TECNOLOGÍA, 2018-2032 (USD MILLONES)
TABLA 192 RESTO DE AMÉRICA DEL SUR MERCADO DE EMBALAJES FLEXIBLES, POR PRODUCTO, 2018-2032 (MILLONES DE USD)
TABLA 193 RESTO DEL MERCADO DE EMBALAJES FLEXIBLES DE SUDAMÉRICA, POR MATERIAL, 2018-2032 (MILLONES DE USD)
TABLA 194 RESTO DEL MERCADO DE ENVASES FLEXIBLES DE SUDAMÉRICA, POR USO FINAL, 2018-2032 (MILLONES DE USD)
TABLA 195 RESTO DE SUDAMÉRICA MERCADO DE ALIMENTOS EN ENVASES FLEXIBLES, POR TIPO, 2018-2032 (USD MILLONES)
TABLA 196 RESTO DEL MERCADO DE EMPAQUES FLEXIBLES DE SUDAMÉRICA, POR TECNOLOGÍA, 2018-2032 (USD MILLONES)
TABLA 197 MERCADO DE EMBALAJES FLEXIBLES DE ORIENTE MEDIO Y ÁFRICA, POR PAÍS, 2018-2032 (MILLONES DE USD)
TABLA 198 MERCADO DE EMBALAJES FLEXIBLES DE ORIENTE MEDIO Y ÁFRICA, POR PRODUCTO, 2018-2032 (MILLONES DE USD)
TABLA 199 MERCADO DE EMBALAJES FLEXIBLES DE ORIENTE MEDIO Y ÁFRICA, POR MATERIAL, 2018-2032 (MILLONES DE USD)
TABLA 200 MERCADO DE EMBALAJES FLEXIBLES DE ORIENTE MEDIO Y ÁFRICA, POR USO FINAL, 2018-2032 (MILLONES DE USD)
TABLA 201 MERCADO DE ALIMENTOS EN ENVASES FLEXIBLES DE ORIENTE MEDIO Y ÁFRICA, POR TIPO, 2018-2032 (MILLONES DE USD)
TABLA 202 MERCADO DE EMBALAJES FLEXIBLES DE ORIENTE MEDIO Y ÁFRICA, POR TECNOLOGÍA, 2018-2032 (MILLONES DE USD)
TABLA 203 MERCADO DE EMBALAJES FLEXIBLES DE ARABIA SAUDITA, POR PRODUCTO, 2018-2032 (MILLONES DE USD)
TABLA 204 MERCADO DE EMBALAJES FLEXIBLES DE ARABIA SAUDITA, POR MATERIAL, 2018-2032 (MILLONES DE USD)
TABLA 205 MERCADO DE ENVASES FLEXIBLES DE ARABIA SAUDITA, POR USO FINAL, 2018-2032 (MILLONES DE USD)
TABLA 206 MERCADO DE ALIMENTOS EN ENVASES FLEXIBLES DE ARABIA SAUDITA, POR TIPO, 2018-2032 (MILLONES DE USD)
TABLA 207 MERCADO DE EMBALAJES FLEXIBLES DE ARABIA SAUDITA, POR TECNOLOGÍA, 2018-2032 (MILLONES DE USD)
TABLA 208 MERCADO DE EMBALAJES FLEXIBLES DE LOS EAU, POR PRODUCTO, 2018-2032 (MILLONES DE USD)
TABLA 209 MERCADO DE EMBALAJES FLEXIBLES DE LOS EAU, POR MATERIAL, 2018-2032 (MILLONES DE USD)
TABLA 210 MERCADO DE EMBALAJES FLEXIBLES DE LOS EAU, POR USO FINAL, 2018-2032 (MILLONES DE USD)
TABLA 211 MERCADO DE ALIMENTOS EN ENVASES FLEXIBLES DE LOS EAU, POR TIPO, 2018-2032 (MILLONES DE USD)
TABLA 212 MERCADO DE EMBALAJES FLEXIBLES DE LOS EAU, POR TECNOLOGÍA, 2018-2032 (MILLONES DE USD)
TABLA 213 MERCADO DE EMBALAJES FLEXIBLES DE SUDÁFRICA, POR PRODUCTO, 2018-2032 (MILLONES DE USD)
TABLA 214 MERCADO DE EMBALAJES FLEXIBLES DE SUDÁFRICA, POR MATERIAL, 2018-2032 (MILLONES DE USD)
TABLA 215 MERCADO DE ENVASES FLEXIBLES DE SUDÁFRICA, POR USO FINAL, 2018-2032 (MILLONES DE USD)
TABLA 216 MERCADO DE ALIMENTOS EN ENVASES FLEXIBLES DE SUDÁFRICA, POR TIPO, 2018-2032 (MILLONES DE USD)
TABLA 217 MERCADO DE EMBALAJES FLEXIBLES DE SUDÁFRICA, POR TECNOLOGÍA, 2018-2032 (MILLONES DE USD)
TABLA 218 MERCADO DE EMBALAJES FLEXIBLES DE EGIPTO, POR PRODUCTO, 2018-2032 (MILLONES DE USD)
TABLA 219 MERCADO DE EMBALAJES FLEXIBLES DE EGIPTO, POR MATERIAL, 2018-2032 (MILLONES DE USD)
TABLA 220 MERCADO DE ENVASES FLEXIBLES DE EGIPTO, POR USO FINAL, 2018-2032 (MILLONES DE USD)
TABLA 221 MERCADO DE ALIMENTOS EN ENVASES FLEXIBLES DE EGIPTO, POR TIPO, 2018-2032 (MILLONES DE USD)
TABLA 222 MERCADO DE EMBALAJES FLEXIBLES DE EGIPTO, POR TECNOLOGÍA, 2018-2032 (MILLONES DE USD)
TABLA 223 MERCADO DE EMBALAJES FLEXIBLES DE ISRAEL, POR PRODUCTO, 2018-2032 (MILLONES DE USD)
TABLA 224 MERCADO DE EMBALAJES FLEXIBLES DE ISRAEL, POR MATERIAL, 2018-2032 (MILLONES DE USD)
TABLA 225 MERCADO DE ENVASES FLEXIBLES DE ISRAEL, POR USO FINAL, 2018-2032 (MILLONES DE USD)
TABLA 226 MERCADO DE ALIMENTOS EN ENVASES FLEXIBLES DE ISRAEL, POR TIPO, 2018-2032 (MILLONES DE USD)
TABLA 227 MERCADO DE EMBALAJES FLEXIBLES DE ISRAEL, POR TECNOLOGÍA, 2018-2032 (MILLONES DE USD)
TABLA 228 RESTO DEL MERCADO DE EMBALAJES FLEXIBLES DE ORIENTE MEDIO Y ÁFRICA, POR PRODUCTO, 2018-2032 (MILLONES DE USD)
TABLA 229 RESTO DEL MERCADO DE EMBALAJES FLEXIBLES DE ORIENTE MEDIO Y ÁFRICA, POR MATERIAL, 2018-2032 (MILLONES DE USD)
TABLA 230 RESTO DEL MERCADO DE EMBALAJES FLEXIBLES DE ORIENTE MEDIO Y ÁFRICA, POR USO FINAL, 2018-2032 (MILLONES DE USD)
TABLA 231 RESTO DEL MERCADO DE ALIMENTOS EN ENVASES FLEXIBLES DE ORIENTE MEDIO Y ÁFRICA, POR TIPO, 2018-2032 (MILLONES DE USD)
TABLA 232 RESTO DEL MERCADO DE EMBALAJES FLEXIBLES DE ORIENTE MEDIO Y ÁFRICA, POR TECNOLOGÍA, 2018-2032 (MILLONES DE USD)
Lista de figuras
FIGURA 1 MERCADO MUNDIAL DE EMBALAJES FLEXIBLES: SEGMENTACIÓN
FIGURA 2 MERCADO MUNDIAL DE EMBALAJES FLEXIBLES: TRIANGULACIÓN DE DATOS
FIGURA 3 MERCADO MUNDIAL DE EMBALAJES FLEXIBLES: ANÁLISIS DROC
FIGURA 4 MERCADO MUNDIAL DE EMBALAJES FLEXIBLES: ANÁLISIS DEL MERCADO MUNDIAL VS. REGIONAL
FIGURA 5 MERCADO GLOBAL DE EMBALAJES FLEXIBLES: ANÁLISIS DE INVESTIGACIÓN DE LA EMPRESA
FIGURA 6 MERCADO MUNDIAL DE ENVASES FLEXIBLES: DATOS DEMOGRÁFICOS DE LAS ENTREVISTAS
FIGURA 7 MERCADO GLOBAL DE EMBALAJES FLEXIBLES: CUADRÍCULA DE POSICIÓN DE MERCADO DE DBMR
FIGURA 8 MERCADO MUNDIAL DE EMBALAJES FLEXIBLES: ANÁLISIS DE LA PARTICIPACIÓN DE LOS PROVEEDORES
FIGURA 9 MERCADO MUNDIAL DE ENVASES FLEXIBLES: MODELADO MULTIVARIABLE
FIGURA 10 MERCADO GLOBAL DE EMBALAJES FLEXIBLES: CURVA DE CRONOLOGÍA DEL MATERIAL
FIGURA 11 MERCADO MUNDIAL DE EMBALAJES FLEXIBLES: CUADRÍCULA DE COBERTURA DE LA INDUSTRIA DE USO FINAL
FIGURA 12 MERCADO MUNDIAL DE EMBALAJES FLEXIBLES: SEGMENTACIÓN
FIGURA 13 DOS SEGMENTOS COMPRENDEN EL MERCADO MUNDIAL DE ENVASES FLEXIBLES, POR INDUSTRIA DE USO FINAL (2024)
FIGURA 14 MERCADO MUNDIAL DE EMBALAJES FLEXIBLES: RESUMEN EJECUTIVO
FIGURA 15 DECISIONES ESTRATÉGICAS
FIGURA 16 SE ESPERA QUE LA CRECIENTE DEMANDA EN EL SECTOR DE ALIMENTOS Y BEBIDAS IMPULSE EL MERCADO MUNDIAL DE ENVASES FLEXIBLES DURANTE EL PERÍODO DE PRONÓSTICO DE 2025 A 2032
FIGURA 17 SE ESPERA QUE EL SEGMENTO DE LA INDUSTRIA DE USO FINAL REPRESENTE LA MAYOR PARTICIPACIÓN DEL MERCADO MUNDIAL DE ENVASES FLEXIBLES EN 2025 Y 2032
FIGURA 18 SE ESPERA QUE ASIA-PACÍFICO SEA LA REGIÓN DOMINANTE Y DE MÁS RÁPIDO CRECIMIENTO EN EL MERCADO MUNDIAL DE EMBALAJES FLEXIBLES EN EL PERÍODO PRONOSTICADO DE 2025 A 2032
FIGURA 19 ASIA PACÍFICO ES LA REGIÓN DE MÁS RÁPIDO CRECIMIENTO PARA EL MERCADO MUNDIAL DE EMBALAJES FLEXIBLES EN EL PERÍODO PRONOSTICADO DE 2025 A 2032
FIGURA 20 ANÁLISIS PESTEL
FIGURA 21 ANÁLISIS DE LAS CINCO FUERZAS DE PORTER
FIGURA 22 MERCADO MUNDIAL DE ENVASES FLEXIBLES, 2024-2040, PRECIO DE VENTA PROMEDIO (USD/KG)
FIGURA 23 ANÁLISIS DROC
FIGURA 24 MERCADO MUNDIAL DE EMBALAJES FLEXIBLES, POR PRODUCTO, 2024
FIGURA 25 MERCADO MUNDIAL DE EMBALAJES FLEXIBLES: POR MATERIAL, 2024
FIGURA 26 MERCADO MUNDIAL DE EMBALAJES FLEXIBLES: POR TECNOLOGÍA, 2024
FIGURA 27 MERCADO MUNDIAL DE ENVASES FLEXIBLES: POR USO FINAL, 2024
FIGURA 28 INSTANTÁNEA DEL MERCADO MUNDIAL DE EMBALAJES FLEXIBLES
FIGURA 29 MERCADO MUNDIAL DE EMBALAJES FLEXIBLES: PARTICIPACIÓN DE LA EMPRESA 2024 (%)
FIGURA 30 MERCADO EUROPEO DE EMBALAJES FLEXIBLES: CUOTA DE LA EMPRESA 2024 (%)
FIGURA 31 MERCADO DE EMBALAJES FLEXIBLES DE ASIA-PACÍFICO: PARTICIPACIÓN DE LA EMPRESA 2024 (%)
FIGURA 32 MERCADO DE EMPAQUES FLEXIBLES DE AMÉRICA DEL NORTE: PARTICIPACIÓN DE LA EMPRESA 2024 (%)
Metodología de investigación
La recopilación de datos y el análisis del año base se realizan utilizando módulos de recopilación de datos con muestras de gran tamaño. La etapa incluye la obtención de información de mercado o datos relacionados a través de varias fuentes y estrategias. Incluye el examen y la planificación de todos los datos adquiridos del pasado con antelación. Asimismo, abarca el examen de las inconsistencias de información observadas en diferentes fuentes de información. Los datos de mercado se analizan y estiman utilizando modelos estadísticos y coherentes de mercado. Además, el análisis de la participación de mercado y el análisis de tendencias clave son los principales factores de éxito en el informe de mercado. Para obtener más información, solicite una llamada de un analista o envíe su consulta.
La metodología de investigación clave utilizada por el equipo de investigación de DBMR es la triangulación de datos, que implica la extracción de datos, el análisis del impacto de las variables de datos en el mercado y la validación primaria (experto en la industria). Los modelos de datos incluyen cuadrícula de posicionamiento de proveedores, análisis de línea de tiempo de mercado, descripción general y guía del mercado, cuadrícula de posicionamiento de la empresa, análisis de patentes, análisis de precios, análisis de participación de mercado de la empresa, estándares de medición, análisis global versus regional y de participación de proveedores. Para obtener más información sobre la metodología de investigación, envíe una consulta para hablar con nuestros expertos de la industria.
Personalización disponible
Data Bridge Market Research es líder en investigación formativa avanzada. Nos enorgullecemos de brindar servicios a nuestros clientes existentes y nuevos con datos y análisis que coinciden y se adaptan a sus objetivos. El informe se puede personalizar para incluir análisis de tendencias de precios de marcas objetivo, comprensión del mercado de países adicionales (solicite la lista de países), datos de resultados de ensayos clínicos, revisión de literatura, análisis de mercado renovado y base de productos. El análisis de mercado de competidores objetivo se puede analizar desde análisis basados en tecnología hasta estrategias de cartera de mercado. Podemos agregar tantos competidores sobre los que necesite datos en el formato y estilo de datos que esté buscando. Nuestro equipo de analistas también puede proporcionarle datos en archivos de Excel sin procesar, tablas dinámicas (libro de datos) o puede ayudarlo a crear presentaciones a partir de los conjuntos de datos disponibles en el informe.

