Global Goat Milk Market
Tamaño del mercado en miles de millones de dólares
Tasa de crecimiento anual compuesta (CAGR) :
% 
 USD
10.74 Billion
USD
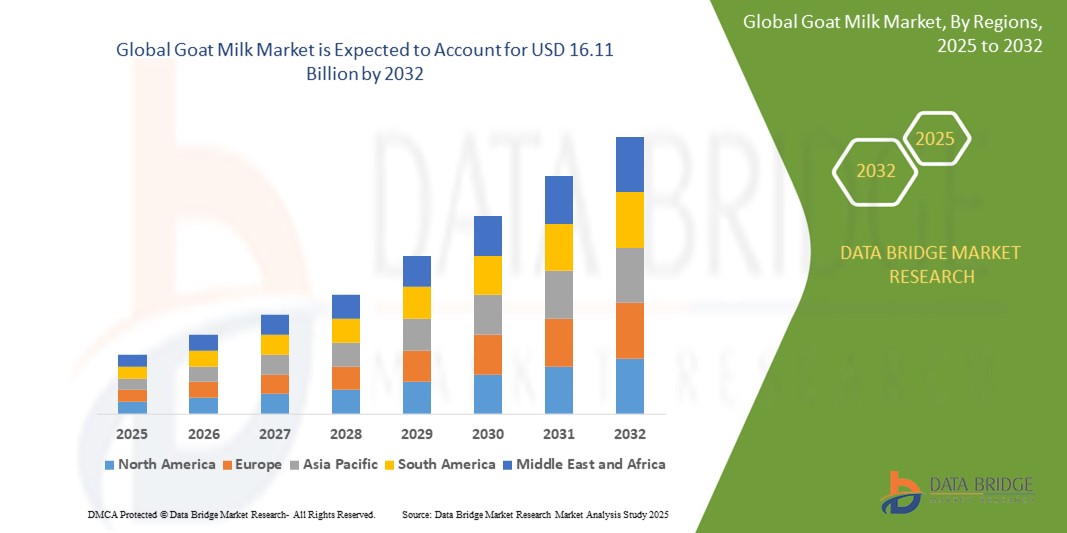
16.11 Billion
2024
2032
USD
10.74 Billion
USD
16.11 Billion
2024
2032
| 2025 –2032 | |
| USD 10.74 Billion | |
| USD 16.11 Billion | |
| % | |
|
Mercado mundial de leche de cabra, por producto (leche entera, leche semidesnatada y desnatada UHT, leche semidesnatada y leche entera UHT), sabor (original/clásico y con sabor), contenido de grasa (normal, bajo en grasa y sin grasa), tipo de envase (botella, tetrabrik, sobre/bolsa, lata y otros), canal de distribución (minoristas en tiendas y minoristas fuera de tiendas), usuario final (hogar/minorista y sector de servicios de alimentación): tendencias de la industria y pronóstico hasta 2032.
Tamaño del mercado de leche de cabra
- El tamaño del mercado mundial de leche de cabra se valoró en USD 10,74 mil millones en 2024 y se espera que alcance los USD 16,11 mil millones para 2032 , con una CAGR del 5,2% durante el período de pronóstico.
- El crecimiento del mercado está impulsado principalmente por la creciente conciencia del consumidor sobre los beneficios para la salud asociados con la leche de cabra, como una mayor digestibilidad y contenido nutricional en comparación con la leche de vaca, junto con la creciente demanda de productos lácteos naturales y orgánicos.
- Las crecientes preferencias por alternativas lácteas sin lactosa e hipoalergénicas, junto con las aplicaciones en expansión en la industria de servicios de alimentos, están impulsando aún más la adopción de productos de leche de cabra, lo que aumenta significativamente la expansión del mercado.
Análisis del mercado de la leche de cabra
- La leche de cabra y sus derivados, como el queso, el yogur y la leche en polvo, están ganando popularidad como alternativas nutritivas y digeribles a los productos lácteos tradicionales, en particular para los consumidores intolerantes a la lactosa y aquellos que buscan opciones alimentarias sostenibles.
- La creciente demanda de leche de cabra está impulsada por una mayor conciencia sobre la salud, una mayor prevalencia de la intolerancia a la lactosa y un cambio hacia productos lácteos premium y especiales tanto en los sectores domésticos como de servicios de alimentación.
- Asia-Pacífico dominó el mercado de la leche de cabra con la mayor participación en los ingresos del 42,5 % en 2024, impulsada por una fuerte aceptación cultural de los productos lácteos de cabra, la producción lechera a gran escala y la creciente demanda de los consumidores de alternativas lácteas saludables, particularmente en países como China e India.
- Se espera que América del Norte sea la región de más rápido crecimiento durante el período de pronóstico, atribuido a la creciente conciencia sobre la salud, la creciente adopción de productos orgánicos y naturales y la creciente demanda de fórmulas infantiles a base de leche de cabra y alimentos especiales.
- El segmento de leche entera dominó la mayor participación en los ingresos del mercado con un 43,42 % en 2024, impulsado por su alto valor nutricional y la preferencia generalizada de los consumidores por productos lácteos enteros y sin procesar, particularmente en el consumo doméstico.
Alcance del informe y segmentación del mercado de leche de cabra
|
Atributos |
Información clave sobre el mercado de la leche de cabra |
|
Segmentos cubiertos |
|
|
Países cubiertos |
América del norte
Europa
Asia-Pacífico
Oriente Medio y África
Sudamerica
|
|
Actores clave del mercado |
|
|
Oportunidades de mercado |
|
|
Conjuntos de información de datos de valor añadido |
Además de los conocimientos sobre escenarios de mercado, como valor de mercado, tasa de crecimiento, segmentación, cobertura geográfica y actores principales, los informes de mercado seleccionados por Data Bridge Market Research también incluyen análisis en profundidad de expertos, análisis de precios, análisis de participación de marca, encuesta de consumidores, análisis demográfico, análisis de la cadena de suministro, análisis de la cadena de valor, descripción general de materias primas/consumibles, criterios de selección de proveedores, análisis PESTLE, análisis de Porter y marco regulatorio. |
Tendencias del mercado de la leche de cabra
Mayor integración de innovaciones centradas en la salud y análisis del consumidor
- El mercado mundial de la leche de cabra está experimentando una notable tendencia hacia la integración de innovaciones centradas en la salud y análisis de los consumidores para satisfacer las preferencias dietéticas cambiantes.
- Estos avances permiten a los fabricantes obtener conocimientos más profundos sobre los patrones de compra de los consumidores, las demandas nutricionales y las preferencias de productos, lo que facilita el desarrollo de productos de leche de cabra personalizados.
- Las innovaciones impulsadas por la salud, como la leche de cabra fortificada con probióticos, vitaminas o minerales añadidos, satisfacen la creciente demanda de alimentos funcionales que favorezcan la digestión y la inmunidad.
- Por ejemplo, las empresas están aprovechando el análisis de datos de los consumidores para crear variantes de leche de cabra con sabores, como chocolate o mezclas de frutas, dirigidas a grupos demográficos más jóvenes y ampliando el alcance del mercado.
- Esta tendencia aumenta el atractivo de los productos de leche de cabra, haciéndolos más atractivos para los consumidores, los hogares y las industrias de servicios de alimentos preocupados por la salud.
- El análisis puede evaluar los comportamientos de los consumidores, como las preferencias por opciones bajas en grasas u orgánicas, lo que permite a los productores optimizar las ofertas de productos y las estrategias de marketing.
Dinámica del mercado de la leche de cabra
Conductor
Creciente demanda de alternativas lácteas ricas en nutrientes y sin lactosa
- La creciente demanda de los consumidores de alternativas lácteas ricas en nutrientes y sin lactosa, impulsada por la creciente intolerancia a la lactosa y la concienciación sobre la salud, es un factor clave para el mercado mundial de la leche de cabra.
- Los productos de leche de cabra, conocidos por su menor contenido de lactosa y su mayor digestibilidad en comparación con la leche de vaca, ofrecen características como perfiles nutricionales mejorados, incluidos altos niveles de calcio, proteínas y vitaminas.
- Las iniciativas gubernamentales en regiones como Asia-Pacífico, que promueven la diversificación de los productos lácteos y la salud nutricional, están contribuyendo a la adopción generalizada de la leche de cabra.
- La expansión del comercio electrónico y los avances en la tecnología de envasado, como los tetrabriks y las botellas, están permitiendo aún más el crecimiento del mercado al mejorar la accesibilidad y la vida útil de los productos.
- Los fabricantes ofrecen cada vez más productos de leche de cabra, como leche entera, leche semidesnatada UHT y variantes saborizadas, como opciones estándar o premium para satisfacer las expectativas de los consumidores y mejorar el valor del producto.
Restricción/Desafío
“Altos costos de producción y limitaciones en la cadena de suministro”
- El alto costo de la producción de leche de cabra, incluyendo mano de obra, alimento y procesamiento, representa una barrera importante para su adopción en el mercado, particularmente en mercados emergentes donde la sensibilidad a los costos es alta.
- Establecer cadenas de suministro eficientes para la leche de cabra, especialmente para la leche UHT semidesnatada y desnatada, puede ser complejo y costoso debido a la escala de producción limitada en comparación con la leche de vaca.
- Además, la preocupación por las interrupciones en la cadena de suministro y la disponibilidad de productos plantea importantes desafíos. El número limitado de granjas lecheras de cabra a gran escala, especialmente en regiones fuera de Asia-Pacífico, limita el suministro constante para satisfacer la creciente demanda.
- Las variaciones regulatorias entre países con respecto a las certificaciones orgánicas, los estándares de calidad y los requisitos de etiquetado complican aún más las operaciones para los productores y distribuidores globales.
- Estos factores pueden disuadir a los compradores potenciales y limitar la expansión del mercado, especialmente en regiones como América del Norte, donde el crecimiento rápido se ve limitado por los desafíos de suministro y costos.
Alcance del mercado de la leche de cabra
El mercado está segmentado en función del producto, el sabor, el contenido de grasa, el tipo de embalaje, el canal de distribución y el usuario final.
- Por producto
En cuanto al producto, el mercado mundial de la leche de cabra se segmenta en leche entera, leche UHT semidesnatada y desnatada, leche semidesnatada y leche UHT entera. El segmento de la leche entera dominó la mayor cuota de mercado, con un 43,42 % en 2024, gracias a su alto valor nutricional y a la amplia preferencia de los consumidores por los productos lácteos enteros sin procesar, especialmente en el consumo doméstico.
Se prevé que el segmento de leche semidesnatada y desnatada UHT experimente el mayor crecimiento entre 2025 y 2032, impulsado por su mayor vida útil, su conveniencia y su adaptación a las tendencias saludables. La búsqueda de alternativas lácteas bajas en grasa por parte de los consumidores y la idoneidad del procesamiento UHT para el comercio internacional impulsan aún más su adopción.
- Por sabor
En función del sabor, el mercado mundial de la leche de cabra se segmenta en original/clásica y saborizada. El segmento original/clásica dominó el mercado con una participación en los ingresos del 86,03 % en 2024, gracias a su auténtico sabor, su amplia aceptación entre los consumidores y su versatilidad en aplicaciones culinarias en diferentes regiones.
Se prevé que el segmento de sabores experimente el mayor crecimiento entre 2025 y 2032, impulsado por la creciente demanda de los consumidores más jóvenes y quienes buscan variedad. Sabores como chocolate, vainilla y mezclas de frutas atraen a niños y a consumidores de leche de cabra no tradicionales, gracias a un marketing innovador y formatos listos para beber.
- Por contenido de grasa
Según el contenido de grasa, el mercado mundial de leche de cabra se segmenta en regular, baja en grasa y descremada. El segmento regular representó la mayor participación en los ingresos del mercado, con un 50,63%, en 2024, gracias a su rico sabor y perfil nutricional, que atrae a los consumidores que priorizan los productos naturales y mínimamente procesados.
Se prevé un crecimiento significativo del segmento bajo en grasa entre 2025 y 2032, impulsado por la creciente concienciación sobre la salud y la demanda de opciones lácteas que favorezcan el control de peso. La leche de cabra baja en grasa se ajusta a las preferencias dietéticas de reducir la ingesta calórica, conservando al mismo tiempo sus beneficios nutricionales.
- Por tipo de embalaje
Según el tipo de envase, el mercado mundial de la leche de cabra se segmenta en botellas, tetrabriks, sobres/bolsas, latas y otros. El segmento de las botellas obtuvo la mayor cuota de mercado, con aproximadamente el 40 % en 2024, gracias a su practicidad, reciclabilidad y amplio uso tanto en el sector minorista como en el de la restauración. Las innovaciones en envases sostenibles refuerzan aún más su dominio.
Se proyecta que el segmento de envases tetrabrik experimentará el mayor crecimiento entre 2025 y 2032, impulsado por su diseño ligero, su larga vida útil y su idoneidad para productos UHT. La creciente demanda de envases portátiles y ecológicos en las regiones urbanizadas impulsa su crecimiento.
- Por canal de distribución
Según el canal de distribución, el mercado mundial de leche de cabra se segmenta en minoristas con presencia física y minoristas sin presencia física. El segmento de minoristas con presencia física dominó el mercado con una participación en los ingresos de aproximadamente el 70 % en 2024, impulsado por la preferencia de los consumidores por comprar en tiendas físicas en supermercados, hipermercados y tiendas especializadas, que ofrecen una amplia gama de productos de leche de cabra.
Se prevé que el segmento de minoristas sin tiendas físicas experimente un rápido crecimiento entre 2025 y 2032, impulsado por la creciente popularidad de las plataformas de comercio electrónico y las compras de comestibles en línea. La comodidad de la entrega a domicilio y la posibilidad de llegar a consumidores en zonas remotas impulsan su adopción, especialmente tras la COVID-19.
- Por el usuario final
En función del usuario final, el mercado mundial de leche de cabra se segmenta en el sector doméstico/minorista y el de servicios de alimentación. El segmento doméstico/minorista obtuvo la mayor cuota de mercado en ingresos, con un 77,07 % en 2024, impulsado por la alta demanda de leche de cabra como alternativa nutritiva a la leche de vaca, especialmente entre las personas intolerantes a la lactosa y preocupadas por su salud.
Se prevé que el segmento de la industria de servicios de alimentación experimente un sólido crecimiento entre 2025 y 2032, impulsado por la creciente incorporación de productos lácteos de cabra en cafeterías, restaurantes y panaderías. La demanda de productos lácteos premium y especiales en aplicaciones culinarias impulsa su adopción en este sector.
Análisis regional del mercado de la leche de cabra
- Asia-Pacífico dominó el mercado de la leche de cabra con la mayor participación en los ingresos del 42,5 % en 2024, impulsada por una fuerte aceptación cultural de los productos lácteos de cabra, la producción lechera a gran escala y la creciente demanda de los consumidores de alternativas lácteas saludables, particularmente en países como China e India.
- Los consumidores priorizan la leche de cabra por sus ventajas para la salud, que incluyen una digestión más fácil, una menor alergenicidad en comparación con la leche de vaca y su idoneidad para personas intolerantes a la lactosa, particularmente en regiones con diversas preferencias dietéticas.
- El crecimiento está respaldado por avances en tecnologías de procesamiento, como el procesamiento UHT (temperatura ultra alta), y una creciente adopción en las industrias domésticas, minoristas y de servicios de alimentos, con un enfoque en variantes saborizadas y bajas en grasa.
Perspectivas del mercado de leche de cabra en EE. UU.
Se prevé un crecimiento significativo del mercado estadounidense de la leche de cabra, impulsado por la creciente concienciación de los consumidores sobre los beneficios de la leche de cabra para la salud y la creciente demanda de alternativas lácteas naturales y orgánicas. La tendencia hacia productos lácteos premium y especializados, sumada a la creciente disponibilidad en los principales canales minoristas, impulsa la expansión del mercado. La adopción de la leche de cabra en la industria de la restauración en cafeterías y restaurantes complementa las ventas minoristas, creando un sólido ecosistema de mercado.
Perspectivas del mercado europeo de leche de cabra
Se prevé un crecimiento significativo del mercado europeo de la leche de cabra, impulsado por la creciente demanda de productos lácteos alternativos y un fuerte enfoque en la agricultura sostenible. Los consumidores buscan la leche de cabra por su perfil nutricional y su uso en productos especiales como quesos y yogures. El crecimiento es notable tanto en el sector minorista como en el de la restauración, con países como Francia y España mostrando una importante aceptación gracias a las tradiciones culinarias y las tendencias saludables.
Perspectivas del mercado de la leche de cabra en el Reino Unido
Se prevé un rápido crecimiento del mercado británico de leche de cabra, impulsado por el creciente interés de los consumidores en alternativas lácteas saludables y opciones alimentarias sostenibles. La mayor concienciación sobre los beneficios de la leche de cabra para la intolerancia a la lactosa y la salud cutánea fomenta su adopción. La evolución de las tendencias dietéticas y la expansión de los productos lácteos de cabra en supermercados y plataformas online impulsan aún más el crecimiento del mercado.
Análisis del mercado de la leche de cabra en Alemania
Se espera que Alemania experimente un fuerte crecimiento en el mercado de la leche de cabra, gracias a su avanzada industria láctea y a la gran atención del consumidor a la salud y el bienestar. Los consumidores alemanes prefieren productos de leche de cabra con certificaciones orgánicas y bajas en grasa, que se alinean con los objetivos de sostenibilidad. La integración de la leche de cabra en productos lácteos premium y su creciente disponibilidad en los canales minoristas impulsan el crecimiento sostenido del mercado.
Perspectivas del mercado de leche de cabra en Asia-Pacífico
La región Asia-Pacífico domina el mercado mundial de la leche de cabra, impulsada por el consumo y la producción a gran escala en países como China, India y Pakistán. El aumento de los ingresos disponibles y la creciente concienciación sobre los beneficios de la leche de cabra para la salud, incluyendo su papel en la nutrición infantil y la salud digestiva, impulsan la demanda. Las iniciativas gubernamentales que promueven la diversificación de la producción láctea y la seguridad nutricional incentivan aún más el uso de productos lácteos de cabra.
Perspectivas del mercado de la leche de cabra en Japón
Se prevé un crecimiento significativo del mercado japonés de leche de cabra debido a la fuerte preferencia de los consumidores por productos lácteos de alta calidad y saludables. La presencia de importantes fabricantes de alimentos y bebidas y la integración de la leche de cabra en alimentos y bebidas funcionales aceleran la penetración en el mercado. El creciente interés en productos de leche de cabra premium y orgánicos también contribuye a este crecimiento.
Análisis del mercado de leche de cabra en China
China posee la mayor participación en el mercado de leche de cabra de Asia-Pacífico, impulsada por la rápida urbanización, la creciente concienciación sobre la salud y la creciente demanda de alternativas lácteas nutritivas. La creciente clase media del país y su enfoque en la nutrición infantil y los alimentos funcionales impulsan la adopción de la leche de cabra. La sólida capacidad de producción nacional y los precios competitivos mejoran la accesibilidad al mercado.
Cuota de mercado de la leche de cabra
La industria de la leche de cabra está liderada principalmente por empresas bien establecidas, entre las que se incluyen:
- Ansnutria Dairy Corporation Ltd. (China)
- Grupo Emmi (Suiza)
- Cooperativa de cabras lecheras (Nueva Zelanda)
- Holle baby food AG (Suiza)
- Granarolo SpA (Italia)
- Bubs Australia Limited (Australia)
- CapriLac (Australia)
- Castle Dairy sa (Bélgica)
- DEFEEM SDN. BHD. (Malasia)
- Delamere Dairy (Reino Unido)
- Granja de leche fresca Sdn. Bhd. (Malasia)
- Hay Dairies Pte Ltd. (Singapur)
- LACTALIS (Francia)
- Orient EuroPharma CO. Ltd. (Taiwán)
- UK Farm SDN BHD (Malasia)
¿Cuáles son los desarrollos recientes en el mercado mundial de leche de cabra?
- En octubre de 2023, ICAR – Instituto Central de Investigación sobre Cabras (CIRG) y Heifer India formalizaron una alianza estratégica para transformar el panorama caprino de la India. Firmado el 6 de octubre en el campus Makhdoom del CIRG en Mathura, el memorando de entendimiento se centra en la investigación pionera, la capacitación avanzada y las prácticas sostenibles para impulsar a los pequeños productores y fortalecer la cadena de valor de la leche de cabra. La colaboración busca impulsar la productividad, mejorar las prácticas de cría y atención médica, y garantizar la sostenibilidad a largo plazo mediante el empoderamiento comunitario y la vinculación con el sector privado. Esta iniciativa apoya la creciente demanda de derivados de la leche de cabra tanto en la India como a nivel mundial.
- En julio de 2023, Ausnutria Dairy Corporation Ltd. anunció que su fórmula infantil Kabrita a base de leche de cabra había superado con éxito la revisión nutricional y de seguridad de la FDA estadounidense, convirtiéndose en la primera fórmula infantil europea a base de leche de cabra en recibir dicha autorización. Este hito permite a Kabrita expandir su presencia en el mercado estadounidense, ofreciendo una alternativa sin lactosa y de fácil digestión a las fórmulas a base de leche de vaca. Diseñada para bebés de 0 a 12 meses, la fórmula contiene beta-caseína A2 y una proporción de suero de leche/caseína similar a la de la leche materna, lo que favorece un crecimiento saludable y una digestión saludable.
- En junio de 2023, Vilvah presentó su Mascarilla Capilar de Leche de Cabra, un tratamiento de acondicionamiento profundo 3 en 1 diseñado para nutrir, fortalecer y peinar el cabello con leche de cabra y ceramidas de origen vegetal. Esta innovadora fórmula ayuda a reparar la barrera capilar, reducir la rotura y retener la hidratación, lo que la hace ideal para cabello seco, dañado o rizado. Enriquecida con algas pardas marinas y xilitilglucósido, la mascarilla realza el brillo, controla el encrespamiento y favorece la salud del cuero cabelludo. Se puede usar como acondicionador con enjuague, mascarilla sin enjuague o crema de peinado con protección térmica, respondiendo a la creciente demanda de productos naturales y sostenibles para el cuidado capilar.
- En noviembre de 2022, Redwood Hill Farm & Creamery Inc. y Jackson-Mitchell Inc. se fusionaron para formar Darey Brands Inc., uniendo a dos empresas pioneras en lácteos especializados bajo una misma marca. La nueva entidad combina los yogures y kéfir de leche de cabra de Redwood Hill con la leche y mantequilla de cabra Meyenberg® de Jackson-Mitchell, creando una sólida cartera de productos lácteos de cabra, vaca y vegetales. Con el respaldo de su empresa matriz, Emmi Group, Darey Brands está posicionada para un crecimiento acelerado en múltiples categorías, con un enfoque en productos lácteos sostenibles y saludables que satisfacen las cambiantes preferencias de los consumidores.
- En junio de 2022, Canada Royal Milk (CRM) formó una alianza estratégica con la Cooperativa de Lechería de Cabra de Ontario (ODGC) y Producteurs de lait de chèvre du Québec (PLCQ), asegurando el acceso a la leche de cabra de más de 120 granjas en Ontario y Quebec. Esta colaboración permite a CRM abastecerse constantemente de leche de cabra de alta calidad para sus instalaciones de Kingston, Ontario, lo que impulsa la producción de productos lácteos de cabra en polvo, incluyendo fórmulas infantiles. Esta iniciativa marca un paso significativo en la expansión de CRM en el mercado norteamericano de leche de cabra, ofreciendo a los productores mayor estabilidad y abriendo nuevas vías para la innovación y la exportación.
SKU-
Obtenga acceso en línea al informe sobre la primera nube de inteligencia de mercado del mundo

- Panel de análisis de datos interactivo
- Panel de análisis de empresas para oportunidades con alto potencial de crecimiento
- Acceso de analista de investigación para personalización y consultas
- Análisis de la competencia con panel interactivo
- Últimas noticias, actualizaciones y análisis de tendencias
- Aproveche el poder del análisis de referencia para un seguimiento integral de la competencia
Tabla de contenido
1 INTRODUCCIÓN
1.1 OBJETIVOS DEL ESTUDIO
1.2 DEFINICIÓN DE MERCADO
1.3 PANORAMA GENERAL DEL MERCADO MUNDIAL DE LECHE DE CABRA
1.4 MONEDA Y PRECIOS
1.5 LIMITACIONES
1.6 MERCADOS CUBIERTOS
2 SEGMENTACIÓN DEL MERCADO
2.1 MERCADOS CUBIERTOS
2.2 ÁMBITO GEOGRÁFICO
2,3 AÑOS CONSIDERADOS PARA EL ESTUDIO
2.4 MODELO DE VALIDACIÓN DE DATOS TRIPOD DBMR
2.5 ENTREVISTAS PRINCIPALES CON LÍDERES DE OPINIÓN CLAVE
2.6 MODELADO MULTIVARIADO
2.7 CUADRÍCULA DE COBERTURA DE USUARIOS FINALES DEL MERCADO
2.8 CUADRÍCULA DE POSICIÓN DE MERCADO DBMR
2.9 ANÁLISIS DE LA PARTICIPACIÓN DE LOS PROVEEDORES
2.1 FUENTES SECUNDARIAS
2.11 SUPUESTOS
3 RESUMEN EJECUTIVO
4 INFORMACIÓN PREMIUM
4.1 ACTIVIDADES PROMOCIONALES
4.2 FACTORES QUE INFLUYEN EN LA DECISIÓN DE COMPRA DEL CLIENTE
5 COBERTURA REGLAMENTARIA
5.1 SEGUIMIENTO Y ADAPTACIÓN REGLAMENTARIA
5.2 PRUEBAS Y CERTIFICACIÓN DE TERCEROS
5.3 INICIATIVAS DE SOSTENIBILIDAD
5.4 DOCUMENTACIÓN Y TRANSPARENCIA
6 PANORAMA GENERAL DEL MERCADO
6.1 CONDUCTORES
6.1.1 AUMENTO DE LA PREVALENCIA DE LA INTOLERANCIA A LA LACTOSA
6.1.2 AVANCES EN LAS FÓRMULAS INFANTILES A BASE DE LECHE DE CABRA
6.1.3 AUMENTO DE LA DEMANDA DE LECHE DE CABRA
6.1.4 VENTAJAS DE LA LECHE DE CABRA SOBRE LA LECHE DE VACA
6.2 RESTRICCIONES
6.2.1 ALTOS COSTOS DE PRODUCCIÓN DE LA LECHE DE CABRA
6.2.2 REQUISITOS REGLAMENTARIOS ESTRICTOS PARA LA PRODUCCIÓN, EL PROCESAMIENTO Y LA COMERCIALIZACIÓN
6.3 OPORTUNIDADES
6.3.1 ALTA PREVALENCIA DE TRASTORNOS DEL ESTILO DE VIDA
6.3.2 AUMENTO DE LA DISPONIBILIDAD DE PRODUCTOS DE LECHE DE CABRA DIVERSIFICADOS
6.3.3 RIESGOS ASOCIADOS AL CONSUMO DE LECHE DE VACA
6.4 DESAFÍOS
6.4.1 OFERTA LIMITADA EN EL MERCADO
6.4.2 AUMENTO DE LA COMPETENCIA DE LAS ALTERNATIVAS DE ORIGEN VEGETAL
7 MERCADO MUNDIAL DE LECHE DE CABRA, POR PRODUCTO
7.1 INFORMACIÓN GENERAL
7.2 LECHE ENTERA
7.3 LECHE UHT SEMIDESNATADA Y DESNATADA
7.4 LECHE SEMIDESNATADA
7.5 LECHE ENTERA UHT
8 MERCADO MUNDIAL DE LECHE DE CABRA, POR TIPO DE ENVASE
8.1 INFORMACIÓN GENERAL
8.2 BOTELLA
8.2.1 PLÁSTICO
8.2.2 VIDRIO
8.3 TETRA PAK
8.4 SOBRE/BOLSA
8.5 lata
8.6 OTROS
9 MERCADO MUNDIAL DE LECHE DE CABRA, POR SABOR
9.1 INFORMACIÓN GENERAL
9.2 ORIGINAL/CLÁSICO
9.3 SABORIZADO
9.3.1 CHOCOLATE
9.3.2 OTROS
10 MERCADO MUNDIAL DE LECHE DE CABRA, POR CONTENIDO DE GRASA
10.1 INFORMACIÓN GENERAL
10.2 REGULAR
10.3 BAJO EN GRASA
10.4 SIN GRASA
11 MERCADO MUNDIAL DE LECHE DE CABRA, POR USUARIO FINAL
11.1 INFORMACIÓN GENERAL
11.2 HOGAR/VENTA MINORISTA
11.3 INDUSTRIA DE SERVICIOS DE ALIMENTOS
12 MERCADO MUNDIAL DE LECHE DE CABRA, POR CANAL DE DISTRIBUCIÓN
12.1 INFORMACIÓN GENERAL
12.2 MINORISTAS CON TIENDAS
12.2.1 SUPERMERCADOS/HIPERMERCADOS
12.2.2 TIENDAS DE CONVENIENCIA
12.2.3 MINORISTAS DE COMESTIBLES
12.2.4 OTROS
12.3 MINORISTAS SIN TIENDAS
12.3.1 MINORISTAS EN LÍNEA
12.3.2 SITIOS WEB DE LA EMPRESA
13 MERCADO MUNDIAL DE LECHE DE CABRA, POR REGIÓN
13.1 AMÉRICA DEL NORTE
13.1.1 MÉXICO
13.1.2 EE. UU.
13.1.3 CANADÁ
13.2 EUROPA
13.2.1 FRANCIA
13.2.2 ESPAÑA
13.2.3 PAÍSES BAJOS
13.2.4 ITALIA
13.2.5 ALEMANIA
13.2.6 BÉLGICA
13.2.7 SUIZA
13.2.8 Reino Unido
13.2.9 RUSIA
13.2.10 TURQUÍA
13.2.11 RESTO DE EUROPA
13.3 ASIA-PACÍFICO
13.3.1 INDIA
13.3.2 CHINA
13.3.3 INDONESIA
13.3.4 AUSTRALIA
13.3.5 MALASIA
13.3.6 TAILANDIA
13.3.7 FILIPINAS
13.3.8 SINGAPUR
13.3.9 COREA DEL SUR
13.3.10 JAPÓN
13.3.11 RESTO DE ASIA-PACÍFICO
13.4 ORIENTE MEDIO Y ÁFRICA
13.4.1 SUDÁFRICA
13.4.2 ARABIA SAUDITA
13.4.3 Emiratos Árabes Unidos
13.4.4 KUWAIT
13.4.5 RESTO DE ORIENTE MEDIO ÁFRICA
13.5 SUDAMÉRICA
13.5.1 BRASIL
13.5.2 ARGENTINA
13.5.3 RESTO DE SUDAMÉRICA
14 MERCADO MUNDIAL DE LECHE DE CABRA: PANORAMA EMPRESARIAL
14.1 ANÁLISIS DE ACCIONES DE LA EMPRESA: GLOBAL
14.2 ANÁLISIS DE ACCIONES DE EMPRESAS: AMÉRICA DEL NORTE
14.3 ANÁLISIS DE ACCIONES DE EMPRESAS: EUROPA
14.4 ANÁLISIS DE ACCIONES DE LA EMPRESA: ASIA-PACÍFICO
15 ANÁLISIS FODA
16 PERFILES DE EMPRESAS
16.1 AUSNUTRIA DAIRY CORPORATION LTD.
16.1.1 INSTANTÁNEA DE LA EMPRESA
16.1.2 ANÁLISIS DE INGRESOS
16.1.3 ANÁLISIS DE LAS ACCIONES DE LA EMPRESA
16.1.4 PORTAFOLIO DE PRODUCTOS
16.1.5 DESARROLLO RECIENTE
16.2 GRUPO EMMI
16.2.1 INSTANTÁNEA DE LA EMPRESA
16.2.2 ANÁLISIS DE INGRESOS
16.2.3 ANÁLISIS DE LAS ACCIONES DE LA EMPRESA
16.2.4 PORTAFOLIO DE PRODUCTOS
16.2.5 DESARROLLO RECIENTE
16.3 COOPERATIVA DE CABRAS LECHERAS (NZ) LTD
16.3.1 INSTANTÁNEA DE LA EMPRESA
16.3.2 ANÁLISIS DE LAS ACCIONES DE LA EMPRESA
16.3.3 PORTAFOLIO DE PRODUCTOS
16.3.4 DESARROLLO RECIENTE
16.4 HOLLE BABY FOOD AG
16.4.1 INSTANTÁNEA DE LA EMPRESA
16.4.2 ANÁLISIS DE LAS ACCIONES DE LA EMPRESA
16.4.3 PORTAFOLIO DE PRODUCTOS
16.4.4 DESARROLLO RECIENTE
16.5 GRANAROLO SPA
16.5.1 INSTANTÁNEA DE LA EMPRESA
16.5.2 ANÁLISIS DE LAS ACCIONES DE LA EMPRESA
16.5.3 PORTAFOLIO DE PRODUCTOS
16.5.4 DESARROLLOS RECIENTES
16.6 BUBS AUSTRALIA LIMITED.
16.6.1 COMPANY SNAPSHOT
16.6.2 PRODUCT PORTFOLIO
16.6.3 RECENT DEVELOPMENT
16.7 CAPRILAC
16.7.1 COMPANY SNAPSHOT
16.7.2 PRODUCT PORTFOLIO
16.7.3 RECENT DEVELOPMENTS
16.8 CASTLE DAIRY S.A.
16.8.1 COMPANY SNAPSHOT
16.8.2 PRODUCT PORTFOLIO
16.8.3 RECENT DEVELOPMENTS
16.9 DEFEEM SDN. BHD.
16.9.1 COMPANY SNAPSHOT
16.9.2 PRODUCT PORTFOLIO
16.9.3 RECENT DEVELOPMENTS
16.1 DELAMERE DAIRY
16.10.1 COMPANY SNAPSHOT
16.10.2 PRODUCT PORTFOLIO
16.10.3 RECENT DEVELOPMENTS
16.11 FARM FRESH MILK SDN. BHD.
16.11.1 COMPANY SNAPSHOT
16.11.2 REVENUE ANALYSIS
16.11.3 PRODUCT PORTFOLIO
16.11.4 RECENT DEVELOPMENTS
16.12 GOOD GOAT MILK CO.
16.12.1 COMPANY SNAPSHOT
16.12.2 PRODUCT PORTFOLIO
16.12.3 RECENT DEVELOPMENT
16.13 HAY DAIRIES PTE LTD.
16.13.1 COMPANY SNAPSHOT
16.13.2 PRODUCT PORTFOLIO
16.13.3 RECENT DEVELOPMENT
16.14 LACTALIS
16.14.1 COMPANY SNAPSHOT
16.14.2 PRODUCT PORTFOLIO
16.14.3 RECENT DEVELOPMENT
16.15 ORIENT EUROPHARMA CO., LTD.
16.15.1 COMPANY SNAPSHOT
16.15.2 PRODUCT PORTFOLIO
16.15.3 RECENT DEVELOPMENT
16.16 UK FARM SDN BHD
16.16.1 COMPANY SNAPSHOT
16.16.2 PRODUCT PORTFOLIO
16.16.3 RECENT DEVELOPMENT
17 QUESTIONNAIRE
18 RELATED REPORTS
Lista de Tablas
CUADRO 1 REGULACIONES EN VARIAS REGIONES Y PAÍSES
TABLA 2 MERCADO MUNDIAL DE LECHE DE CABRA, POR PRODUCTO, 2022-2031 (MILLONES DE USD)
TABLA 3 MERCADO MUNDIAL DE LECHE ENTERA EN LECHE DE CABRA, POR REGIÓN, 2022-2031 (MILLONES DE USD)
TABLA 4 MERCADO MUNDIAL DE LECHE UHT SEMIDESNATADA Y DESNATADA DE CABRA, POR REGIÓN, 2022-2031 (MILLONES DE USD)
TABLA 5 MERCADO MUNDIAL DE LECHE SEMIDESNATADA EN LECHE DE CABRA, POR REGIÓN, 2022-2031 (MILLONES DE USD)
TABLA 6 MERCADO MUNDIAL DE LECHE ENTERA UHT EN LECHE DE CABRA, POR REGIÓN, 2022-2031 (MILLONES DE USD)
TABLA 7 MERCADO MUNDIAL DE LECHE DE CABRA, POR TIPO DE ENVASE, 2022-2031 (MILLONES DE USD)
TABLA 8 MERCADO MUNDIAL DE LECHE DE CABRA EN BOTELLA, POR REGIÓN, 2022-2031 (MILLONES DE USD)
TABLA 9 MERCADO MUNDIAL DE LECHE DE CABRA EN BOTELLA, POR TIPO DE ENVASE, 2022-2031 (MILLONES DE USD)
TABLA 10 MERCADO MUNDIAL DE LECHE DE CABRA TETRA PAK, POR REGIÓN, 2022-2031 (MILLONES DE USD)
TABLA 11 MERCADO MUNDIAL DE SOBRES/BOLSAS DE LECHE DE CABRA, POR REGIÓN, 2022-2031 (MILLONES DE USD)
TABLA 12 MERCADO MUNDIAL DE ESTAÑO EN LECHE DE CABRA, POR REGIÓN, 2022-2031 (MILLONES DE USD)
TABLA 13 OTROS MERCADOS MUNDIALES DE LECHE DE CABRA, POR REGIÓN, 2022-2031 (MILLONES DE USD)
TABLA 14 MERCADO MUNDIAL DE LECHE DE CABRA, POR SABOR, 2022-2031 (MILLONES DE USD)
TABLA 15 MERCADO MUNDIAL DE LECHE DE CABRA ORIGINAL/CLÁSICA, POR REGIÓN, 2022-2031 (MILLONES DE USD)
TABLA 16 MERCADO MUNDIAL DE LECHE DE CABRA CON SABOR, POR REGIÓN, 2022-2031 (MILLONES DE USD)
TABLA 17 MERCADO MUNDIAL DE LECHE DE CABRA CON SABOR, POR SABOR, 2022-2031 (MILLONES DE USD)
TABLA 18 MERCADO MUNDIAL DE LECHE DE CABRA, POR CONTENIDO DE GRASA, 2022-2031 (MILLONES DE USD)
TABLA 19 MERCADO MUNDIAL REGULAR DE LECHE DE CABRA, POR REGIÓN, 2022-2031 (USD MILLONES)
TABLA 20 MERCADO MUNDIAL DE LECHE DE CABRA BAJA EN GRASA, POR REGIÓN, 2022-2031 (MILLONES DE USD)
TABLA 21 MERCADO MUNDIAL DE LECHE DE CABRA SIN GRASA, POR REGIÓN, 2022-2031 (MILLONES DE USD)
TABLA 22 MERCADO MUNDIAL DE LECHE DE CABRA, POR USUARIO FINAL, 2022-2031 (MILLONES DE USD)
TABLA 23 MERCADO MUNDIAL DE LECHE DE CABRA EN HOGARES/VENTA MINORISTA, POR REGIÓN, 2022-2031 (MILLONES DE USD)
TABLA 24 INDUSTRIA GLOBAL DE SERVICIOS DE ALIMENTOS EN EL MERCADO DE LECHE DE CABRA, POR REGIÓN, 2022-2031 (MILLONES DE USD)
TABLA 25 MERCADO MUNDIAL DE LECHE DE CABRA, POR CANAL DE DISTRIBUCIÓN, 2022-2031 (MILLONES DE USD)
TABLA 26 MINORISTAS MUNDIALES EN TIENDAS DEL MERCADO DE LECHE DE CABRA, POR REGIÓN, 2022-2031 (MILLONES DE USD)
TABLA 27 MINORISTAS MUNDIALES EN TIENDAS DEL MERCADO DE LECHE DE CABRA, POR CANAL DE DISTRIBUCIÓN, 2022-2031 (MILLONES DE USD)
TABLA 28 MINORISTAS MUNDIALES SIN TIENDAS EN EL MERCADO DE LECHE DE CABRA, POR REGIÓN, 2022-2031 (MILLONES DE USD)
TABLA 29 MINORISTAS MUNDIALES SIN TIENDAS EN EL MERCADO DE LECHE DE CABRA, POR CANAL DE DISTRIBUCIÓN, 2022-2031 (MILLONES DE USD)
TABLA 30 MERCADO MUNDIAL DE LECHE DE CABRA, POR REGIÓN, 2022-2031 (MILLONES DE USD)
TABLA 31 MERCADO DE LECHE DE CABRA EN AMÉRICA DEL NORTE, POR PAÍS, 2022-2031 (MILLONES DE USD)
TABLA 32 MERCADO DE LECHE DE CABRA DE AMÉRICA DEL NORTE, POR PRODUCTO, 2022-2031 (MILLONES DE USD)
TABLA 33 MERCADO DE LECHE DE CABRA EN AMÉRICA DEL NORTE, POR SABOR, 2022-2031 (MILLONES DE USD)
TABLA 34 MERCADO DE LECHE DE CABRA CON SABOR EN AMÉRICA DEL NORTE, POR SABOR, 2022-2031 (MILLONES DE USD)
TABLA 35 MERCADO DE LECHE DE CABRA DE AMÉRICA DEL NORTE, POR CONTENIDO DE GRASA, 2022-2031 (MILLONES DE USD)
TABLA 36 MERCADO DE LECHE DE CABRA DE AMÉRICA DEL NORTE, POR TIPO DE ENVASE, 2022-2031 (MILLONES DE USD)
TABLA 37 MERCADO DE LECHE DE CABRA EN BOTELLA EN AMÉRICA DEL NORTE, POR TIPO DE ENVASE, 2022-2031 (MILLONES DE USD)
TABLA 38 MERCADO DE LECHE DE CABRA DE AMÉRICA DEL NORTE, POR CANAL DE DISTRIBUCIÓN, 2022-2031 (MILLONES DE USD)
TABLA 39 MINORISTAS DE AMÉRICA DEL NORTE CON TIENDAS EN EL MERCADO DE LECHE DE CABRA, POR CANAL DE DISTRIBUCIÓN, 2022-2031 (MILLONES DE USD)
TABLA 40 MINORISTAS SIN TIENDAS EN AMÉRICA DEL NORTE EN EL MERCADO DE LECHE DE CABRA, POR CANAL DE DISTRIBUCIÓN, 2022-2031 (MILLONES DE USD)
TABLA 41 MERCADO DE LECHE DE CABRA DE AMÉRICA DEL NORTE, POR USUARIO FINAL, 2022-2031 (MILLONES DE USD)
TABLA 42 MERCADO DE LECHE DE CABRA EN MÉXICO, POR PRODUCTO, 2022-2031 (USD MILLONES)
TABLA 43 MERCADO DE LECHE DE CABRA EN MÉXICO, POR SABOR, 2022-2031 (USD MILLONES)
TABLA 44 MERCADO DE LECHE DE CABRA SABORIZADA EN MÉXICO, POR SABOR, 2022-2031 (USD MILLONES)
TABLA 45 MERCADO DE LECHE DE CABRA EN MÉXICO, POR CONTENIDO DE GRASA, 2022-2031 (USD MILLONES)
TABLA 46 MERCADO DE LECHE DE CABRA EN MÉXICO, POR TIPO DE ENVASE, 2022-2031 (MILLONES DE USD)
TABLA 47 MERCADO DE LECHE DE CABRA EN BOTELLA EN MÉXICO, POR TIPO DE ENVASE, 2022-2031 (MILLONES DE USD)
TABLA 48 MERCADO DE LECHE DE CABRA EN MÉXICO, POR CANAL DE DISTRIBUCIÓN, 2022-2031 (USD MILLONES)
TABLA 49 MINORISTAS EN TIENDAS DE MÉXICO EN EL MERCADO DE LECHE DE CABRA, POR CANAL DE DISTRIBUCIÓN, 2022-2031 (MILLONES DE USD)
TABLA 50 MÉXICO: COMERCIANTES MINORISTAS SIN TIENDA EN EL MERCADO DE LECHE DE CABRA, POR CANAL DE DISTRIBUCIÓN, 2022-2031 (USD MILLONES)
TABLA 51 MERCADO DE LECHE DE CABRA EN MÉXICO, POR USUARIO FINAL, 2022-2031 (MILLONES DE USD)
TABLA 52 MERCADO DE LECHE DE CABRA DE EE. UU., POR PRODUCTO, 2022-2031 (MILLONES DE USD)
TABLA 53 MERCADO DE LECHE DE CABRA DE EE. UU., POR SABOR, 2022-2031 (MILLONES DE USD)
TABLA 54 MERCADO DE LECHE DE CABRA CON SABORIZANTES DE EE. UU., POR SABOR, 2022-2031 (MILLONES DE USD)
TABLA 55 MERCADO DE LECHE DE CABRA DE EE. UU., POR CONTENIDO DE GRASA, 2022-2031 (MILLONES DE USD)
TABLA 56 MERCADO DE LECHE DE CABRA DE EE. UU., POR TIPO DE ENVASE, 2022-2031 (MILLONES DE USD)
TABLA 57 MERCADO DE LECHE DE CABRA EN BOTELLA EN EE. UU., POR TIPO DE ENVASE, 2022-2031 (MILLONES DE USD)
TABLA 58 MERCADO DE LECHE DE CABRA DE EE. UU., POR CANAL DE DISTRIBUCIÓN, 2022-2031 (MILLONES DE USD)
TABLA 59 MINORISTAS ESTADOUNIDENSES EN TIENDAS DEL MERCADO DE LECHE DE CABRA, POR CANAL DE DISTRIBUCIÓN, 2022-2031 (MILLONES DE USD)
TABLA 60 MINORISTAS ESTADOUNIDENSES SIN TIENDAS EN EL MERCADO DE LECHE DE CABRA, POR CANAL DE DISTRIBUCIÓN, 2022-2031 (MILLONES DE USD)
TABLA 61 MERCADO DE LECHE DE CABRA DE EE. UU., POR USUARIO FINAL, 2022-2031 (MILLONES DE USD)
TABLA 62 MERCADO DE LECHE DE CABRA DE CANADÁ, POR PRODUCTO, 2022-2031 (MILLONES DE USD)
TABLA 63 MERCADO DE LECHE DE CABRA DE CANADÁ, POR SABOR, 2022-2031 (MILLONES DE USD)
TABLA 64 MERCADO DE LECHE DE CABRA CON SABOR CANADIENSE, POR SABOR, 2022-2031 (MILLONES DE USD)
TABLA 65 MERCADO DE LECHE DE CABRA DE CANADÁ, POR CONTENIDO DE GRASA, 2022-2031 (MILLONES DE USD)
TABLA 66 MERCADO DE LECHE DE CABRA DE CANADÁ, POR TIPO DE ENVASE, 2022-2031 (MILLONES DE USD)
TABLA 67 MERCADO DE LECHE DE CABRA EN BOTELLA EN CANADÁ, POR TIPO DE ENVASE, 2022-2031 (MILLONES DE USD)
TABLA 68 MERCADO DE LECHE DE CABRA DE CANADÁ, POR CANAL DE DISTRIBUCIÓN, 2022-2031 (MILLONES DE USD)
TABLA 69 MINORISTAS DE LECHE DE CABRA EN TIENDAS DE CANADÁ, POR CANAL DE DISTRIBUCIÓN, 2022-2031 (MILLONES DE USD)
TABLA 70 MINORISTAS NO TIENDAS DE CANADÁ EN EL MERCADO DE LECHE DE CABRA, POR CANAL DE DISTRIBUCIÓN, 2022-2031 (MILLONES DE USD)
TABLA 71 MERCADO DE LECHE DE CABRA DE CANADÁ, POR USUARIO FINAL, 2022-2031 (MILLONES DE USD)
TABLA 72 MERCADO EUROPEO DE LECHE DE CABRA, POR PAÍS, 2022-2031 (MILLONES DE USD)
TABLA 73 MERCADO EUROPEO DE LECHE DE CABRA, POR PRODUCTO, 2022-2031 (MILLONES DE USD)
TABLA 74 MERCADO EUROPEO DE LECHE DE CABRA, POR SABOR, 2022-2031 (MILLONES DE USD)
TABLA 75 MERCADO EUROPEO DE LECHE DE CABRA CON SABOR, POR SABOR, 2022-2031 (MILLONES DE USD)
TABLA 76 MERCADO EUROPEO DE LECHE DE CABRA, POR CONTENIDO DE GRASA, 2022-2031 (MILLONES DE USD)
TABLA 77 MERCADO EUROPEO DE LECHE DE CABRA, POR TIPO DE ENVASE, 2022-2031 (MILLONES DE USD)
TABLA 78 MERCADO EUROPEO DE LECHE DE CABRA EN BOTELLA, POR TIPO DE ENVASE, 2022-2031 (MILLONES DE USD)
TABLA 79 MERCADO EUROPEO DE LECHE DE CABRA, POR CANAL DE DISTRIBUCIÓN, 2022-2031 (MILLONES DE USD)
TABLA 80 MINORISTAS EUROPEOS CON TIENDAS EN EL MERCADO DE LECHE DE CABRA, POR CANAL DE DISTRIBUCIÓN, 2022-2031 (MILLONES DE USD)
TABLA 81 MINORISTAS EUROPEOS SIN TIENDAS EN EL MERCADO DE LECHE DE CABRA, POR CANAL DE DISTRIBUCIÓN, 2022-2031 (MILLONES DE USD)
TABLA 82 MERCADO EUROPEO DE LECHE DE CABRA, POR USUARIO FINAL, 2022-2031 (MILLONES DE USD)
TABLA 83 MERCADO DE LECHE DE CABRA EN FRANCIA, POR PRODUCTO, 2022-2031 (MILLONES DE USD)
TABLA 84 MERCADO DE LECHE DE CABRA EN FRANCIA, POR SABOR, 2022-2031 (MILLONES DE USD)
TABLA 85. SABORIZADO EN FRANCIA EN EL MERCADO DE LECHE DE CABRA, POR SABOR, 2022-2031 (MILLONES DE USD)
TABLA 86 MERCADO DE LECHE DE CABRA EN FRANCIA, POR CONTENIDO DE GRASA, 2022-2031 (MILLONES DE USD)
TABLA 87 MERCADO DE LECHE DE CABRA EN FRANCIA, POR TIPO DE ENVASE, 2022-2031 (MILLONES DE USD)
TABLA 88. MERCADO DE LECHE DE CABRA EN BOTELLA EN FRANCIA, POR TIPO DE ENVASE, 2022-2031 (MILLONES DE USD)
TABLA 89 MERCADO DE LECHE DE CABRA EN FRANCIA, POR CANAL DE DISTRIBUCIÓN, 2022-2031 (MILLONES DE USD)
TABLA 90 MINORISTAS DE LECHE DE CABRA EN TIENDAS FRANCESAS, POR CANAL DE DISTRIBUCIÓN, 2022-2031 (MILLONES DE USD)
TABLA 91 FRANCIA MINORISTAS SIN TIENDAS EN EL MERCADO DE LECHE DE CABRA, POR CANAL DE DISTRIBUCIÓN, 2022-2031 (MILLONES DE USD)
TABLA 92 MERCADO DE LECHE DE CABRA EN FRANCIA, POR USUARIO FINAL, 2022-2031 (MILLONES DE USD)
TABLA 93 MERCADO DE LECHE DE CABRA EN ESPAÑA, POR PRODUCTO, 2022-2031 (MILLONES DE USD)
TABLA 94 MERCADO ESPAÑOL DE LECHE DE CABRA, POR SABOR, 2022-2031 (MILLONES DE USD)
TABLA 95 MERCADO DE LECHE DE CABRA CON SABOR EN ESPAÑA, POR SABOR, 2022-2031 (MILLONES DE USD)
TABLA 96 MERCADO DE LECHE DE CABRA EN ESPAÑA, POR CONTENIDO DE GRASA, 2022-2031 (MILLONES DE USD)
TABLA 97 MERCADO DE LECHE DE CABRA EN ESPAÑA, POR TIPO DE ENVASE, 2022-2031 (MILLONES DE USD)
TABLA 98. MERCADO DE LECHE DE CABRA EN BOTELLA EN ESPAÑA, POR TIPO DE ENVASE, 2022-2031 (MILLONES DE USD)
TABLA 99 MERCADO DE LECHE DE CABRA EN ESPAÑA, POR CANAL DE DISTRIBUCIÓN, 2022-2031 (MILLONES DE USD)
TABLA 100 MINORISTAS DE LECHE DE CABRA EN TIENDAS DE ESPAÑA, POR CANAL DE DISTRIBUCIÓN, 2022-2031 (MILLONES DE USD)
TABLA 101. MINORISTAS NO ESTANCOS EN ESPAÑA EN EL MERCADO DE LECHE DE CABRA, POR CANAL DE DISTRIBUCIÓN, 2022-2031 (MILLONES DE USD)
TABLA 102 MERCADO DE LECHE DE CABRA EN ESPAÑA, POR USUARIO FINAL, 2022-2031 (MILLONES DE USD)
TABLA 103 MERCADO DE LECHE DE CABRA DE LOS PAÍSES BAJOS, POR PRODUCTO, 2022-2031 (MILLONES DE USD)
TABLA 104 MERCADO DE LECHE DE CABRA DE LOS PAÍSES BAJOS, POR SABOR, 2022-2031 (MILLONES DE USD)
TABLA 105 PAÍSES BAJOS SABORIZADOS EN EL MERCADO DE LECHE DE CABRA, POR SABOR, 2022-2031 (MILLONES DE USD)
TABLA 106 MERCADO DE LECHE DE CABRA DE LOS PAÍSES BAJOS, POR CONTENIDO DE GRASA, 2022-2031 (MILLONES DE USD)
TABLA 107 MERCADO DE LECHE DE CABRA DE LOS PAÍSES BAJOS, POR TIPO DE ENVASE, 2022-2031 (MILLONES DE USD)
TABLA 108 MERCADO DE LECHE DE CABRA EN BOTELLAS DE LOS PAÍSES BAJOS, POR TIPO DE ENVASE, 2022-2031 (MILLONES DE USD)
TABLA 109 MERCADO DE LECHE DE CABRA DE LOS PAÍSES BAJOS, POR CANAL DE DISTRIBUCIÓN, 2022-2031 (MILLONES DE USD)
TABLA 110 MINORISTAS DE LECHE DE CABRA EN TIENDAS DE LOS PAÍSES BAJOS, POR CANAL DE DISTRIBUCIÓN, 2022-2031 (MILLONES DE USD)
TABLA 111 PAÍSES BAJOS: MINORISTAS NO ESTANCOS EN EL MERCADO DE LECHE DE CABRA, POR CANAL DE DISTRIBUCIÓN, 2022-2031 (MILLONES DE USD)
TABLA 112 MERCADO DE LECHE DE CABRA DE LOS PAÍSES BAJOS, POR USUARIO FINAL, 2022-2031 (MILLONES DE USD)
TABLA 113 MERCADO DE LECHE DE CABRA EN ITALIA, POR PRODUCTO, 2022-2031 (MILLONES DE USD)
TABLA 114 MERCADO DE LECHE DE CABRA EN ITALIA, POR SABOR, 2022-2031 (MILLONES DE USD)
TABLA 115 SABORIZADO EN EL MERCADO DE LECHE DE CABRA DE ITALIA, POR SABOR, 2022-2031 (MILLONES DE USD)
TABLA 116 MERCADO DE LECHE DE CABRA EN ITALIA, POR CONTENIDO DE GRASA, 2022-2031 (MILLONES DE USD)
TABLA 117 MERCADO DE LECHE DE CABRA EN ITALIA, POR TIPO DE ENVASE, 2022-2031 (MILLONES DE USD)
TABLA 118 ITALIA BOTELLA EN EL MERCADO DE LECHE DE CABRA, POR TIPO DE ENVASE, 2022-2031 (MILLONES DE USD)
TABLA 119 MERCADO DE LECHE DE CABRA EN ITALIA, POR CANAL DE DISTRIBUCIÓN, 2022-2031 (MILLONES DE USD)
TABLA 120 MINORISTAS DE LECHE DE CABRA EN TIENDAS DE ITALIA, POR CANAL DE DISTRIBUCIÓN, 2022-2031 (MILLONES DE USD)
TABLA 121 ITALIA MINORISTAS SIN TIENDAS EN EL MERCADO DE LECHE DE CABRA, POR CANAL DE DISTRIBUCIÓN, 2022-2031 (MILLONES DE USD)
TABLA 122 MERCADO DE LECHE DE CABRA EN ITALIA, POR USUARIO FINAL, 2022-2031 (MILLONES DE USD)
TABLA 123 MERCADO DE LECHE DE CABRA DE ALEMANIA, POR PRODUCTO, 2022-2031 (MILLONES DE USD)
TABLA 124 MERCADO DE LECHE DE CABRA EN ALEMANIA, POR SABOR, 2022-2031 (MILLONES DE USD)
TABLA 125 SABORIZADO EN EL MERCADO DE LECHE DE CABRA EN ALEMANIA, POR SABOR, 2022-2031 (MILLONES DE USD)
TABLA 126 MERCADO DE LECHE DE CABRA DE ALEMANIA, POR CONTENIDO DE GRASA, 2022-2031 (MILLONES DE USD)
TABLA 127 MERCADO DE LECHE DE CABRA EN ALEMANIA, POR TIPO DE ENVASE, 2022-2031 (MILLONES DE USD)
TABLA 128. BOTELLAS EN EL MERCADO DE LECHE DE CABRA DE ALEMANIA, POR TIPO DE ENVASE, 2022-2031 (MILLONES DE USD)
TABLA 129 MERCADO DE LECHE DE CABRA DE ALEMANIA, POR CANAL DE DISTRIBUCIÓN, 2022-2031 (MILLONES DE USD)
TABLA 130 MINORISTAS DE LECHE DE CABRA EN TIENDAS ALEMANAS, POR CANAL DE DISTRIBUCIÓN, 2022-2031 (MILLONES DE USD)
TABLA 131 ALEMANIA: MINORISTAS SIN TIENDAS EN EL MERCADO DE LECHE DE CABRA, POR CANAL DE DISTRIBUCIÓN, 2022-2031 (MILLONES DE USD)
TABLA 132 MERCADO DE LECHE DE CABRA DE ALEMANIA, POR USUARIO FINAL, 2022-2031 (MILLONES DE USD)
TABLA 133 MERCADO DE LECHE DE CABRA DE BÉLGICA, POR PRODUCTO, 2022-2031 (MILLONES DE USD)
TABLA 134 MERCADO DE LECHE DE CABRA EN BÉLGICA, POR SABOR, 2022-2031 (MILLONES DE USD)
TABLA 135 SABOR BÉLGICO EN EL MERCADO DE LECHE DE CABRA, POR SABOR, 2022-2031 (MILLONES DE USD)
TABLA 136 MERCADO DE LECHE DE CABRA DE BÉLGICA, POR CONTENIDO DE GRASA, 2022-2031 (MILLONES DE USD)
TABLA 137 MERCADO DE LECHE DE CABRA DE BÉLGICA, POR TIPO DE ENVASE, 2022-2031 (MILLONES DE USD)
TABLA 138 MERCADO DE LECHE DE CABRA EN BOTELLA EN BÉLGICA, POR TIPO DE ENVASE, 2022-2031 (MILLONES DE USD)
TABLA 139 MERCADO DE LECHE DE CABRA DE BÉLGICA, POR CANAL DE DISTRIBUCIÓN, 2022-2031 (MILLONES DE USD)
TABLA 140 MINORISTAS BÉLGICOS EN TIENDAS DEL MERCADO DE LECHE DE CABRA, POR CANAL DE DISTRIBUCIÓN, 2022-2031 (MILLONES DE USD)
TABLA 141 MINORISTAS BÉLGICOS SIN TIENDAS EN EL MERCADO DE LECHE DE CABRA, POR CANAL DE DISTRIBUCIÓN, 2022-2031 (MILLONES DE USD)
TABLA 142 MERCADO DE LECHE DE CABRA DE BÉLGICA, POR USUARIO FINAL, 2022-2031 (MILLONES DE USD)
TABLA 143 MERCADO DE LECHE DE CABRA DE SUIZA, POR PRODUCTO, 2022-2031 (MILLONES DE USD)
TABLA 144 MERCADO DE LECHE DE CABRA EN SUIZA, POR SABOR, 2022-2031 (MILLONES DE USD)
TABLA 145 SUIZA SABORIZADA EN EL MERCADO DE LECHE DE CABRA, POR SABOR, 2022-2031 (MILLONES DE USD)
TABLA 146 MERCADO DE LECHE DE CABRA DE SUIZA, POR CONTENIDO DE GRASA, 2022-2031 (MILLONES DE USD)
TABLA 147 MERCADO DE LECHE DE CABRA DE SUIZA, POR TIPO DE ENVASE, 2022-2031 (MILLONES DE USD)
TABLA 148 SUIZA BOTELLA EN EL MERCADO DE LECHE DE CABRA, POR TIPO DE ENVASE, 2022-2031 (MILLONES DE USD)
TABLA 149 MERCADO DE LECHE DE CABRA DE SUIZA, POR CANAL DE DISTRIBUCIÓN, 2022-2031 (MILLONES DE USD)
TABLA 150 MINORISTAS SUIZOS CON TIENDAS EN EL MERCADO DE LECHE DE CABRA, POR CANAL DE DISTRIBUCIÓN, 2022-2031 (MILLONES DE USD)
TABLA 151 SUIZA: MINORISTAS SIN TIENDA EN EL MERCADO DE LECHE DE CABRA, POR CANAL DE DISTRIBUCIÓN, 2022-2031 (MILLONES DE USD)
TABLA 152 MERCADO DE LECHE DE CABRA DE SUIZA, POR USUARIO FINAL, 2022-2031 (MILLONES DE USD)
TABLA 153 MERCADO DE LECHE DE CABRA DEL REINO UNIDO, POR PRODUCTO, 2022-2031 (MILLONES DE USD)
TABLA 154 MERCADO DE LECHE DE CABRA DEL REINO UNIDO, POR SABOR, 2022-2031 (MILLONES DE USD)
TABLA 155 MERCADO DE LECHE DE CABRA CON SABOR REINO UNIDO, POR SABOR, 2022-2031 (MILLONES DE USD)
TABLA 156 MERCADO DE LECHE DE CABRA DEL REINO UNIDO, POR CONTENIDO DE GRASA, 2022-2031 (MILLONES DE USD)
TABLA 157 MERCADO DE LECHE DE CABRA DEL REINO UNIDO, POR TIPO DE ENVASE, 2022-2031 (MILLONES DE USD)
TABLA 158. BOTELLAS EN EL MERCADO DE LECHE DE CABRA DEL REINO UNIDO, POR TIPO DE ENVASE, 2022-2031 (MILLONES DE USD)
TABLA 159 MERCADO DE LECHE DE CABRA DEL REINO UNIDO, POR CANAL DE DISTRIBUCIÓN, 2022-2031 (MILLONES DE USD)
TABLA 160 MINORISTAS DEL REINO UNIDO EN EL MERCADO DE LECHE DE CABRA, POR CANAL DE DISTRIBUCIÓN, 2022-2031 (MILLONES DE USD)
TABLA 161 MINORISTAS DEL REINO UNIDO SIN TIENDAS EN EL MERCADO DE LECHE DE CABRA, POR CANAL DE DISTRIBUCIÓN, 2022-2031 (MILLONES DE USD)
TABLA 162 MERCADO DE LECHE DE CABRA DEL REINO UNIDO, POR USUARIO FINAL, 2022-2031 (MILLONES DE USD)
TABLA 163 MERCADO DE LECHE DE CABRA EN RUSIA, POR PRODUCTO, 2022-2031 (MILLONES DE USD)
TABLA 164 MERCADO DE LECHE DE CABRA EN RUSIA, POR SABOR, 2022-2031 (MILLONES DE USD)
TABLA 165 SABORIZADO EN EL MERCADO DE LECHE DE CABRA, POR SABOR, 2022-2031 (MILLONES DE USD)
TABLA 166 MERCADO DE LECHE DE CABRA EN RUSIA, POR CONTENIDO DE GRASA, 2022-2031 (MILLONES DE USD)
TABLA 167 MERCADO DE LECHE DE CABRA EN RUSIA, POR TIPO DE ENVASE, 2022-2031 (MILLONES DE USD)
TABLA 168 RUSIA BOTELLA EN EL MERCADO DE LECHE DE CABRA, POR TIPO DE ENVASE, 2022-2031 (MILLONES DE USD)
TABLA 169 MERCADO DE LECHE DE CABRA EN RUSIA, POR CANAL DE DISTRIBUCIÓN, 2022-2031 (MILLONES DE USD)
TABLA 170 MINORISTAS DE LECHE DE CABRA EN TIENDAS DE RUSIA, POR CANAL DE DISTRIBUCIÓN, 2022-2031 (MILLONES DE USD)
TABLA 171 RUSIA: MINORISTAS SIN TIENDAS EN EL MERCADO DE LECHE DE CABRA, POR CANAL DE DISTRIBUCIÓN, 2022-2031 (MILLONES DE USD)
TABLA 172 MERCADO DE LECHE DE CABRA EN RUSIA, POR USUARIO FINAL, 2022-2031 (MILLONES DE USD)
TABLA 173 MERCADO DE LECHE DE CABRA DE PAVO, POR PRODUCTO, 2022-2031 (MILLONES DE USD)
TABLA 174 MERCADO DE LECHE DE CABRA DE PAVO, POR SABOR, 2022-2031 (MILLONES DE USD)
TABLA 175 LECHE DE CABRA CON SABOR A PAVO, POR SABOR, 2022-2031 (MILLONES DE USD)
TABLA 176 MERCADO DE LECHE DE CABRA DE PAVO, POR CONTENIDO DE GRASA, 2022-2031 (MILLONES DE USD)
TABLA 177 MERCADO DE LECHE DE CABRA DE PAVO, POR TIPO DE ENVASE, 2022-2031 (MILLONES DE USD)
TABLA 178 PAVO EN BOTELLA EN EL MERCADO DE LECHE DE CABRA, POR TIPO DE ENVASE, 2022-2031 (MILLONES DE USD)
TABLA 179 MERCADO DE LECHE DE CABRA DE PAVO, POR CANAL DE DISTRIBUCIÓN, 2022-2031 (MILLONES DE USD)
TABLA 180 MINORISTAS DE LECHE DE CABRA EN TIENDAS DE PAVO, POR CANAL DE DISTRIBUCIÓN, 2022-2031 (MILLONES DE USD)
TABLA 181 Distribuidores minoristas de pavos sin tiendas en el mercado de leche de cabra, por canal de distribución, 2022-2031 (USD millones)
TABLA 182 MERCADO DE LECHE DE CABRA DE PAVO, POR USUARIO FINAL, 2022-2031 (MILLONES DE USD)
TABLA 183 RESTO DE EUROPA MERCADO DE LECHE DE CABRA, POR PRODUCTO, 2022-2031 (MILLONES DE USD)
TABLA 184 MERCADO DE LECHE DE CABRA DE ASIA-PACÍFICO, POR PAÍS, 2022-2031 (MILLONES DE USD)
TABLA 185 MERCADO DE LECHE DE CABRA DE ASIA-PACÍFICO, POR PRODUCTO, 2022-2031 (MILLONES DE USD)
TABLA 186 MERCADO DE LECHE DE CABRA DE ASIA-PACÍFICO, POR SABOR, 2022-2031 (MILLONES DE USD)
TABLA 187 MERCADO DE LECHE DE CABRA CON SABOR EN ASIA-PACÍFICO, POR SABOR, 2022-2031 (MILLONES DE USD)
TABLA 188 MERCADO DE LECHE DE CABRA DE ASIA-PACÍFICO, POR CONTENIDO DE GRASA, 2022-2031 (MILLONES DE USD)
TABLA 189 MERCADO DE LECHE DE CABRA DE ASIA-PACÍFICO, POR TIPO DE ENVASE, 2022-2031 (MILLONES DE USD)
TABLA 190 MERCADO DE LECHE DE CABRA EN BOTELLA EN ASIA-PACÍFICO, POR TIPO DE ENVASE, 2022-2031 (MILLONES DE USD)
TABLA 191 MERCADO DE LECHE DE CABRA DE ASIA-PACÍFICO, POR CANAL DE DISTRIBUCIÓN, 2022-2031 (MILLONES DE USD)
TABLA 192 MINORISTAS DE ASIA-PACÍFICO EN TIENDAS DEL MERCADO DE LECHE DE CABRA, POR CANAL DE DISTRIBUCIÓN, 2022-2031 (MILLONES DE USD)
TABLA 193 MINORISTAS SIN TIENDAS DE ASIA-PACÍFICO EN EL MERCADO DE LECHE DE CABRA, POR CANAL DE DISTRIBUCIÓN, 2022-2031 (MILLONES DE USD)
TABLA 194 MERCADO DE LECHE DE CABRA DE ASIA-PACÍFICO, POR USUARIO FINAL, 2022-2031 (MILLONES DE USD)
TABLA 195 MERCADO DE LECHE DE CABRA DE LA INDIA, POR PRODUCTO, 2022-2031 (MILLONES DE USD)
TABLA 196 MERCADO DE LECHE DE CABRA EN LA INDIA, POR SABOR, 2022-2031 (MILLONES DE USD)
TABLA 197 INDIA SABORIZADO EN EL MERCADO DE LECHE DE CABRA, POR SABOR, 2022-2031 (MILLONES DE USD)
TABLA 198 MERCADO DE LECHE DE CABRA EN LA INDIA, POR CONTENIDO DE GRASA, 2022-2031 (MILLONES DE USD)
TABLA 199 MERCADO DE LECHE DE CABRA EN LA INDIA, POR TIPO DE ENVASE, 2022-2031 (MILLONES DE USD)
TABLA 200 BOTELLAS EN EL MERCADO DE LECHE DE CABRA EN INDIA, POR TIPO DE ENVASE, 2022-2031 (MILLONES DE USD)
TABLA 201 MERCADO DE LECHE DE CABRA EN LA INDIA, POR CANAL DE DISTRIBUCIÓN, 2022-2031 (MILLONES DE USD)
TABLA 202 MINORISTAS EN TIENDAS DEL MERCADO DE LECHE DE CABRA EN INDIA, POR CANAL DE DISTRIBUCIÓN, 2022-2031 (MILLONES DE USD)
TABLA 203 MINORISTAS SIN TIENDAS EN EL MERCADO DE LECHE DE CABRA DE LA INDIA, POR CANAL DE DISTRIBUCIÓN, 2022-2031 (MILLONES DE USD)
TABLA 204 MERCADO DE LECHE DE CABRA EN LA INDIA, POR USUARIO FINAL, 2022-2031 (MILLONES DE USD)
TABLA 205 MERCADO DE LECHE DE CABRA DE CHINA, POR PRODUCTO, 2022-2031 (MILLONES DE USD)
TABLA 206 MERCADO DE LECHE DE CABRA EN CHINA, POR SABOR, 2022-2031 (MILLONES DE USD)
TABLA 207 SABORIZANTES DE CHINA EN EL MERCADO DE LECHE DE CABRA, POR SABOR, 2022-2031 (MILLONES DE USD)
TABLA 208 MERCADO DE LECHE DE CABRA DE CHINA, POR CONTENIDO DE GRASA, 2022-2031 (MILLONES DE USD)
TABLA 209 MERCADO DE LECHE DE CABRA EN CHINA, POR TIPO DE ENVASE, 2022-2031 (MILLONES DE USD)
TABLA 210 BOTELLAS DE LECHE DE CABRA EN CHINA, POR TIPO DE ENVASE, 2022-2031 (MILLONES DE USD)
TABLA 211 MERCADO DE LECHE DE CABRA DE CHINA, POR CANAL DE DISTRIBUCIÓN, 2022-2031 (MILLONES DE USD)
TABLA 212 MINORISTAS CON TIENDAS EN CHINA EN EL MERCADO DE LECHE DE CABRA, POR CANAL DE DISTRIBUCIÓN, 2022-2031 (MILLONES DE USD)
TABLA 213 MINORISTAS SIN TIENDAS EN CHINA EN EL MERCADO DE LECHE DE CABRA, POR CANAL DE DISTRIBUCIÓN, 2022-2031 (MILLONES DE USD)
TABLA 214 MERCADO DE LECHE DE CABRA DE CHINA, POR USUARIO FINAL, 2022-2031 (MILLONES DE USD)
TABLA 215 MERCADO DE LECHE DE CABRA DE INDONESIA, POR PRODUCTO, 2022-2031 (MILLONES DE USD)
TABLA 216 MERCADO DE LECHE DE CABRA DE INDONESIA, POR SABOR, 2022-2031 (MILLONES DE USD)
TABLA 217 MERCADO DE LECHE DE CABRA CON SABOR EN INDONESIA, POR SABOR, 2022-2031 (MILLONES DE USD)
TABLA 218 MERCADO DE LECHE DE CABRA DE INDONESIA, POR CONTENIDO DE GRASA, 2022-2031 (MILLONES DE USD)
TABLA 219 MERCADO DE LECHE DE CABRA DE INDONESIA, POR TIPO DE ENVASE, 2022-2031 (MILLONES DE USD)
TABLA 220. BOTELLAS EN EL MERCADO DE LECHE DE CABRA DE INDONESIA, POR TIPO DE ENVASE, 2022-2031 (MILLONES DE USD)
TABLA 221 MERCADO DE LECHE DE CABRA DE INDONESIA, POR CANAL DE DISTRIBUCIÓN, 2022-2031 (MILLONES DE USD)
TABLA 222 MINORISTAS EN TIENDAS DEL MERCADO DE LECHE DE CABRA DE INDONESIA, POR CANAL DE DISTRIBUCIÓN, 2022-2031 (MILLONES DE USD)
TABLA 223 MINORISTAS SIN TIENDAS EN EL MERCADO DE LECHE DE CABRA DE INDONESIA, POR CANAL DE DISTRIBUCIÓN, 2022-2031 (MILLONES DE USD)
TABLA 224 MERCADO DE LECHE DE CABRA DE INDONESIA, POR USUARIO FINAL, 2022-2031 (MILLONES DE USD)
TABLA 225 MERCADO DE LECHE DE CABRA DE AUSTRALIA, POR PRODUCTO, 2022-2031 (MILLONES DE USD)
TABLA 226 MERCADO DE LECHE DE CABRA DE AUSTRALIA, POR SABOR, 2022-2031 (MILLONES DE USD)
TABLA 227 MERCADO DE LECHE DE CABRA CON SABOR EN AUSTRALIA, POR SABOR, 2022-2031 (MILLONES DE USD)
TABLA 228 MERCADO DE LECHE DE CABRA DE AUSTRALIA, POR CONTENIDO DE GRASA, 2022-2031 (MILLONES DE USD)
TABLA 229 MERCADO DE LECHE DE CABRA DE AUSTRALIA, POR TIPO DE ENVASE, 2022-2031 (MILLONES DE USD)
TABLA 230 MERCADO DE LECHE DE CABRA EN BOTELLA EN AUSTRALIA, POR TIPO DE ENVASE, 2022-2031 (MILLONES DE USD)
TABLA 231 MERCADO DE LECHE DE CABRA DE AUSTRALIA, POR CANAL DE DISTRIBUCIÓN, 2022-2031 (MILLONES DE USD)
TABLA 232 MINORISTAS DE AUSTRALIA EN TIENDAS DEL MERCADO DE LECHE DE CABRA, POR CANAL DE DISTRIBUCIÓN, 2022-2031 (MILLONES DE USD)
TABLA 233 AUSTRALIA MINORISTAS SIN TIENDAS EN EL MERCADO DE LECHE DE CABRA, POR CANAL DE DISTRIBUCIÓN, 2022-2031 (MILLONES DE USD)
TABLA 234 MERCADO DE LECHE DE CABRA DE AUSTRALIA, POR USUARIO FINAL, 2022-2031 (MILLONES DE USD)
TABLA 235 MERCADO DE LECHE DE CABRA DE MALASIA, POR PRODUCTO, 2022-2031 (MILLONES DE USD)
TABLA 236 MERCADO DE LECHE DE CABRA DE MALASIA, POR SABOR, 2022-2031 (MILLONES DE USD)
TABLA 237 SABORIZADO EN EL MERCADO DE LECHE DE CABRA DE MALASIA, POR SABOR, 2022-2031 (MILLONES DE USD)
TABLA 238 MERCADO DE LECHE DE CABRA DE MALASIA, POR CONTENIDO DE GRASA, 2022-2031 (MILLONES DE USD)
TABLA 239 MERCADO DE LECHE DE CABRA DE MALASIA, POR TIPO DE ENVASE, 2022-2031 (MILLONES DE USD)
TABLA 240 BOTELLAS DE LECHE DE CABRA EN EL MERCADO DE MALASIA, POR TIPO DE ENVASE, 2022-2031 (MILLONES DE USD)
TABLA 241 MERCADO DE LECHE DE CABRA DE MALASIA, POR CANAL DE DISTRIBUCIÓN, 2022-2031 (MILLONES DE USD)
TABLA 242 MINORISTAS DE MALASIA EN EL MERCADO DE LECHE DE CABRA, POR CANAL DE DISTRIBUCIÓN, 2022-2031 (MILLONES DE USD)
TABLA 243 MINORISTAS SIN TIENDAS EN MALASIA EN EL MERCADO DE LECHE DE CABRA, POR CANAL DE DISTRIBUCIÓN, 2022-2031 (MILLONES DE USD)
TABLA 244 MERCADO DE LECHE DE CABRA DE MALASIA, POR USUARIO FINAL, 2022-2031 (MILLONES DE USD)
TABLA 245 MERCADO DE LECHE DE CABRA DE TAILANDIA, POR PRODUCTO, 2022-2031 (MILLONES DE USD)
TABLA 246 MERCADO DE LECHE DE CABRA DE TAILANDIA, POR SABOR, 2022-2031 (MILLONES DE USD)
TABLA 247 MERCADO DE LECHE DE CABRA CON SABOR A TAILANDIA, POR SABOR, 2022-2031 (MILLONES DE USD)
TABLA 248 MERCADO DE LECHE DE CABRA DE TAILANDIA, POR CONTENIDO DE GRASA, 2022-2031 (MILLONES DE USD)
TABLA 249 MERCADO DE LECHE DE CABRA DE TAILANDIA, POR TIPO DE ENVASE, 2022-2031 (MILLONES DE USD)
TABLA 250 BOTELLAS DE LECHE DE CABRA EN EL MERCADO DE TAILANDIA, POR TIPO DE ENVASE, 2022-2031 (MILLONES DE USD)
TABLA 251 MERCADO DE LECHE DE CABRA DE TAILANDIA, POR CANAL DE DISTRIBUCIÓN, 2022-2031 (MILLONES DE USD)
TABLA 252 MINORISTAS DE LECHE DE CABRA EN TAILANDIA, POR CANAL DE DISTRIBUCIÓN, 2022-2031 (MILLONES DE USD)
TABLA 253 MINORISTAS DE LECHE DE CABRA SIN TIENDAS DE TAILANDIA, POR CANAL DE DISTRIBUCIÓN, 2022-2031 (MILLONES DE USD)
TABLA 254 MERCADO DE LECHE DE CABRA DE TAILANDIA, POR USUARIO FINAL, 2022-2031 (MILLONES DE USD)
TABLA 255 MERCADO DE LECHE DE CABRA DE FILIPINAS, POR PRODUCTO, 2022-2031 (MILLONES DE USD)
TABLA 256 MERCADO DE LECHE DE CABRA DE FILIPINAS, POR SABOR, 2022-2031 (MILLONES DE USD)
TABLA 257 MERCADO DE LECHE DE CABRA CON SABOR EN FILIPINAS, POR SABOR, 2022-2031 (MILLONES DE USD)
TABLA 258 MERCADO DE LECHE DE CABRA DE FILIPINAS, POR CONTENIDO DE GRASA, 2022-2031 (MILLONES DE USD)
TABLA 259 MERCADO DE LECHE DE CABRA DE FILIPINAS, POR TIPO DE ENVASE, 2022-2031 (MILLONES DE USD)
TABLA 260 MERCADO DE LECHE DE CABRA EN BOTELLAS DE FILIPINAS, POR TIPO DE ENVASE, 2022-2031 (MILLONES DE USD)
TABLA 261 MERCADO DE LECHE DE CABRA DE FILIPINAS, POR CANAL DE DISTRIBUCIÓN, 2022-2031 (MILLONES DE USD)
TABLA 262 MINORISTAS DE LECHE DE CABRA EN TIENDAS FILIPINAS, POR CANAL DE DISTRIBUCIÓN, 2022-2031 (MILLONES DE USD)
TABLA 263 MINORISTAS SIN TIENDAS EN FILIPINAS EN EL MERCADO DE LECHE DE CABRA, POR CANAL DE DISTRIBUCIÓN, 2022-2031 (MILLONES DE USD)
TABLA 264 MERCADO DE LECHE DE CABRA DE FILIPINAS, POR USUARIO FINAL, 2022-2031 (MILLONES DE USD)
TABLA 265 MERCADO DE LECHE DE CABRA DE SINGAPUR, POR PRODUCTO, 2022-2031 (MILLONES DE USD)
TABLA 266 MERCADO DE LECHE DE CABRA DE SINGAPUR, POR SABOR, 2022-2031 (MILLONES DE USD)
TABLA 267 SABORIZADO EN EL MERCADO DE LECHE DE CABRA DE SINGAPUR, POR SABOR, 2022-2031 (MILLONES DE USD)
TABLA 268 MERCADO DE LECHE DE CABRA DE SINGAPUR, POR CONTENIDO DE GRASA, 2022-2031 (MILLONES DE USD)
TABLA 269 MERCADO DE LECHE DE CABRA DE SINGAPUR, POR TIPO DE ENVASE, 2022-2031 (MILLONES DE USD)
TABLA 270 BOTELLAS DE LECHE DE CABRA EN EL MERCADO DE SINGAPUR, POR TIPO DE ENVASE, 2022-2031 (MILLONES DE USD)
TABLA 271 MERCADO DE LECHE DE CABRA DE SINGAPUR, POR CANAL DE DISTRIBUCIÓN, 2022-2031 (MILLONES DE USD)
TABLA 272 MINORISTAS CON TIENDAS EN SINGAPUR EN EL MERCADO DE LECHE DE CABRA, POR CANAL DE DISTRIBUCIÓN, 2022-2031 (MILLONES DE USD)
TABLA 273 MINORISTAS SIN TIENDAS EN EL MERCADO DE LECHE DE CABRA DE SINGAPUR, POR CANAL DE DISTRIBUCIÓN, 2022-2031 (MILLONES DE USD)
TABLA 274 MERCADO DE LECHE DE CABRA DE SINGAPUR, POR USUARIO FINAL, 2022-2031 (MILLONES DE USD)
TABLA 275 MERCADO DE LECHE DE CABRA DE COREA DEL SUR, POR PRODUCTO, 2022-2031 (MILLONES DE USD)
TABLA 276 MERCADO DE LECHE DE CABRA DE COREA DEL SUR, POR SABOR, 2022-2031 (MILLONES DE USD)
TABLA 277 MERCADO DE LECHE DE CABRA CON SABOR A COREA DEL SUR, POR SABOR, 2022-2031 (MILLONES DE USD)
TABLA 278 MERCADO DE LECHE DE CABRA DE COREA DEL SUR, POR CONTENIDO DE GRASA, 2022-2031 (MILLONES DE USD)
TABLA 279 MERCADO DE LECHE DE CABRA DE COREA DEL SUR, POR TIPO DE ENVASE, 2022-2031 (MILLONES DE USD)
TABLA 280 MERCADO DE LECHE DE CABRA EN BOTELLA EN COREA DEL SUR, POR TIPO DE ENVASE, 2022-2031 (MILLONES DE USD)
TABLA 281 MERCADO DE LECHE DE CABRA DE COREA DEL SUR, POR CANAL DE DISTRIBUCIÓN, 2022-2031 (MILLONES DE USD)
TABLA 282 MINORISTAS DE COREA DEL SUR CON TIENDAS EN EL MERCADO DE LECHE DE CABRA, POR CANAL DE DISTRIBUCIÓN, 2022-2031 (MILLONES DE USD)
TABLA 283 COMERCIANTES MINORISTAS SIN TIENDAS DE COREA DEL SUR EN EL MERCADO DE LECHE DE CABRA, POR CANAL DE DISTRIBUCIÓN, 2022-2031 (MILLONES DE USD)
TABLA 284 MERCADO DE LECHE DE CABRA DE COREA DEL SUR, POR USUARIO FINAL, 2022-2031 (MILLONES DE USD)
TABLA 285 MERCADO DE LECHE DE CABRA DE JAPÓN, POR PRODUCTO, 2022-2031 (MILLONES DE USD)
TABLA 286 MERCADO DE LECHE DE CABRA EN JAPÓN, POR SABOR, 2022-2031 (MILLONES DE USD)
TABLA 287 MERCADO DE LECHE DE CABRA CON SABOR JAPONÉS, POR SABOR, 2022-2031 (MILLONES DE USD)
TABLA 288 MERCADO DE LECHE DE CABRA DE JAPÓN, POR CONTENIDO DE GRASA, 2022-2031 (MILLONES DE USD)
TABLA 289 MERCADO DE LECHE DE CABRA EN JAPÓN, POR TIPO DE ENVASE, 2022-2031 (MILLONES DE USD)
TABLA 290 BOTELLAS DE LECHE DE CABRA EN EL MERCADO DE JAPÓN, POR TIPO DE ENVASE, 2022-2031 (MILLONES DE USD)
TABLA 291 MERCADO DE LECHE DE CABRA DE JAPÓN, POR CANAL DE DISTRIBUCIÓN, 2022-2031 (MILLONES DE USD)
TABLA 292 MINORISTAS JAPONES CON TIENDAS EN EL MERCADO DE LECHE DE CABRA, POR CANAL DE DISTRIBUCIÓN, 2022-2031 (MILLONES DE USD)
TABLA 293 MINORISTAS JAPONES SIN TIENDAS EN EL MERCADO DE LECHE DE CABRA, POR CANAL DE DISTRIBUCIÓN, 2022-2031 (MILLONES DE USD)
TABLA 294 MERCADO DE LECHE DE CABRA DE JAPÓN, POR USUARIO FINAL, 2022-2031 (MILLONES DE USD)
TABLA 295 RESTO DEL MERCADO DE LECHE DE CABRA DE ASIA-PACÍFICO, POR PRODUCTO, 2022-2031 (MILLONES DE USD)
CUADRO 296 MERCADO DE LECHE DE CABRA EN ORIENTE MEDIO Y ÁFRICA, POR PAÍS, 2022-2031 (MILLONES DE USD)
CUADRO 297 MERCADO DE LECHE DE CABRA DE ORIENTE MEDIO Y ÁFRICA, POR PRODUCTO, 2022-2031 (MILLONES DE USD)
TABLA 298 MERCADO DE LECHE DE CABRA EN ORIENTE MEDIO Y ÁFRICA, POR SABOR, 2022-2031 (MILLONES DE USD)
TABLA 299 MERCADO DE LECHE DE CABRA CON SABOR EN ORIENTE MEDIO Y ÁFRICA, POR SABOR, 2022-2031 (MILLONES DE USD)
TABLA 300 MERCADO DE LECHE DE CABRA EN ORIENTE MEDIO Y ÁFRICA, POR CONTENIDO DE GRASA, 2022-2031 (MILLONES DE USD)
TABLA 301 MERCADO DE LECHE DE CABRA EN ORIENTE MEDIO Y ÁFRICA, POR TIPO DE ENVASE, 2022-2031 (MILLONES DE USD)
TABLA 302 MERCADO DE LECHE DE CABRA EN BOTELLA EN ORIENTE MEDIO Y ÁFRICA, POR TIPO DE ENVASE, 2022-2031 (MILLONES DE USD)
TABLA 303 MERCADO DE LECHE DE CABRA DE ORIENTE MEDIO Y ÁFRICA, POR CANAL DE DISTRIBUCIÓN, 2022-2031 (MILLONES DE USD)
TABLA 304 MINORISTAS DE LECHE DE CABRA EN TIENDAS DE ORIENTE MEDIO Y ÁFRICA, POR CANAL DE DISTRIBUCIÓN, 2022-2031 (MILLONES DE USD)
TABLA 305 ORIENTE MEDIO Y ÁFRICA MINORISTAS SIN TIENDAS EN EL MERCADO DE LECHE DE CABRA, POR CANAL DE DISTRIBUCIÓN, 2022-2031 (MILLONES DE USD)
TABLA 306 MERCADO DE LECHE DE CABRA DE ORIENTE MEDIO Y ÁFRICA, POR USUARIO FINAL, 2022-2031 (MILLONES DE USD)
TABLA 307 MERCADO DE LECHE DE CABRA DE SUDÁFRICA, POR PRODUCTO, 2022-2031 (MILLONES DE USD)
TABLA 308 MERCADO DE LECHE DE CABRA DE SUDÁFRICA, POR SABOR, 2022-2031 (MILLONES DE USD)
TABLA 309 MERCADO DE LECHE DE CABRA CON SABOR EN SUDÁFRICA, POR SABOR, 2022-2031 (MILLONES DE USD)
TABLA 310 MERCADO DE LECHE DE CABRA DE SUDÁFRICA, POR CONTENIDO DE GRASA, 2022-2031 (MILLONES DE USD)
TABLA 311 MERCADO DE LECHE DE CABRA DE SUDÁFRICA, POR TIPO DE ENVASE, 2022-2031 (MILLONES DE USD)
TABLA 312 MERCADO DE LECHE DE CABRA EN BOTELLA EN SUDÁFRICA, POR TIPO DE ENVASE, 2022-2031 (MILLONES DE USD)
TABLA 313 MERCADO DE LECHE DE CABRA DE SUDÁFRICA, POR CANAL DE DISTRIBUCIÓN, 2022-2031 (MILLONES DE USD)
TABLA 314 MINORISTAS DE SUDÁFRICA EN TIENDAS DEL MERCADO DE LECHE DE CABRA, POR CANAL DE DISTRIBUCIÓN, 2022-2031 (MILLONES DE USD)
TABLA 315 MINORISTAS SIN TIENDAS EN EL MERCADO DE LECHE DE CABRA DE SUDÁFRICA, POR CANAL DE DISTRIBUCIÓN, 2022-2031 (MILLONES DE USD)
TABLA 316 MERCADO DE LECHE DE CABRA DE SUDÁFRICA, POR USUARIO FINAL, 2022-2031 (MILLONES DE USD)
TABLA 317 MERCADO DE LECHE DE CABRA DE ARABIA SAUDITA, POR PRODUCTO, 2022-2031 (MILLONES DE USD)
TABLA 318 MERCADO DE LECHE DE CABRA DE ARABIA SAUDITA, POR SABOR, 2022-2031 (MILLONES DE USD)
TABLA 319 SAUDITA, SABORIZADO EN EL MERCADO DE LECHE DE CABRA, POR SABOR, 2022-2031 (MILLONES DE USD)
TABLA 320 MERCADO DE LECHE DE CABRA DE ARABIA SAUDITA, POR CONTENIDO DE GRASA, 2022-2031 (MILLONES DE USD)
TABLA 321 MERCADO DE LECHE DE CABRA DE ARABIA SAUDITA, POR TIPO DE ENVASE, 2022-2031 (MILLONES DE USD)
TABLA 322 ARABIA SAUDITA MERCADO DE LECHE DE CABRA EN BOTELLA, POR TIPO DE ENVASE, 2022-2031 (MILLONES DE USD)
TABLA 323 MERCADO DE LECHE DE CABRA DE ARABIA SAUDITA, POR CANAL DE DISTRIBUCIÓN, 2022-2031 (MILLONES DE USD)
TABLA 324 MINORISTAS DE LECHE DE CABRA EN TIENDAS DE ARABIA SAUDITA, POR CANAL DE DISTRIBUCIÓN, 2022-2031 (MILLONES DE USD)
TABLA 325 MINORISTAS SIN TIENDA EN ARABIA SAUDITA EN EL MERCADO DE LECHE DE CABRA, POR CANAL DE DISTRIBUCIÓN, 2022-2031 (MILLONES DE USD)
TABLA 326 MERCADO DE LECHE DE CABRA DE ARABIA SAUDITA, POR USUARIO FINAL, 2022-2031 (MILLONES DE USD)
TABLA 327 MERCADO DE LECHE DE CABRA DE LOS EAU, POR PRODUCTO, 2022-2031 (MILLONES DE USD)
TABLA 328 MERCADO DE LECHE DE CABRA DE LOS EAU, POR SABOR, 2022-2031 (MILLONES DE USD)
TABLA 329 MERCADO DE LECHE DE CABRA CON SABOR EN LOS EAU, POR SABOR, 2022-2031 (MILLONES DE USD)
TABLA 330 MERCADO DE LECHE DE CABRA DE LOS EAU, POR CONTENIDO DE GRASA, 2022-2031 (MILLONES DE USD)
TABLA 331 MERCADO DE LECHE DE CABRA DE LOS EAU, POR TIPO DE ENVASE, 2022-2031 (MILLONES DE USD)
TABLA 332 BOTELLAS EN EL MERCADO DE LECHE DE CABRA DE LOS EMIRATOS ÁRABES UNIDOS, POR TIPO DE ENVASE, 2022-2031 (MILLONES DE USD)
TABLA 333 MERCADO DE LECHE DE CABRA DE LOS EAU, POR CANAL DE DISTRIBUCIÓN, 2022-2031 (MILLONES DE USD)
TABLA 334 MINORISTAS EN TIENDAS DE LOS EAU EN EL MERCADO DE LECHE DE CABRA, POR CANAL DE DISTRIBUCIÓN, 2022-2031 (MILLONES DE USD)
TABLA 335 MINORISTAS SIN TIENDAS DE LOS EAU EN EL MERCADO DE LECHE DE CABRA, POR CANAL DE DISTRIBUCIÓN, 2022-2031 (MILLONES DE USD)
TABLA 336 MERCADO DE LECHE DE CABRA DE LOS EAU, POR USUARIO FINAL, 2022-2031 (MILLONES DE USD)
TABLA 337 MERCADO DE LECHE DE CABRA DE KUWAIT, POR PRODUCTO, 2022-2031 (MILLONES DE USD)
TABLA 338 MERCADO DE LECHE DE CABRA DE KUWAIT, POR SABOR, 2022-2031 (MILLONES DE USD)
TABLA 339 SABOR A KUWAIT EN EL MERCADO DE LECHE DE CABRA, POR SABOR, 2022-2031 (MILLONES DE USD)
TABLA 340 MERCADO DE LECHE DE CABRA DE KUWAIT, POR CONTENIDO DE GRASA, 2022-2031 (MILLONES DE USD)
TABLA 341 MERCADO DE LECHE DE CABRA DE KUWAIT, POR TIPO DE ENVASE, 2022-2031 (MILLONES DE USD)
TABLA 342 BOTELLA DE LECHE DE CABRA DE KUWAIT, POR TIPO DE ENVASE, 2022-2031 (MILLONES DE USD)
TABLA 343 MERCADO DE LECHE DE CABRA DE KUWAIT, POR CANAL DE DISTRIBUCIÓN, 2022-2031 (MILLONES DE USD)
TABLA 344 MINORISTAS DE LECHE DE CABRA CON TIENDAS EN KUWAIT, POR CANAL DE DISTRIBUCIÓN, 2022-2031 (MILLONES DE USD)
TABLA 345 MINORISTAS DE LECHE DE CABRA SIN TIENDAS DE KUWAIT, POR CANAL DE DISTRIBUCIÓN, 2022-2031 (MILLONES DE USD)
TABLA 346 MERCADO DE LECHE DE CABRA DE KUWAIT, POR USUARIO FINAL, 2022-2031 (MILLONES DE USD)
TABLA 347 RESTO DEL MERCADO DE LECHE DE CABRA DE ORIENTE MEDIO Y ÁFRICA, POR PRODUCTO, 2022-2031 (MILLONES DE USD)
TABLA 348 MERCADO DE LECHE DE CABRA EN AMÉRICA DEL SUR, POR PAÍS, 2022-2031 (USD MILLONES)
TABLA 349 MERCADO DE LECHE DE CABRA EN AMÉRICA DEL SUR, POR PRODUCTO, 2022-2031 (MILLONES DE USD)
TABLA 350 MERCADO DE LECHE DE CABRA EN AMÉRICA DEL SUR, POR SABOR, 2022-2031 (MILLONES DE USD)
TABLA 351 SUDAMÉRICA MERCADO DE LECHE DE CABRA CON SABOR, POR SABOR, 2022-2031 (USD MILLONES)
TABLA 352 MERCADO DE LECHE DE CABRA EN AMÉRICA DEL SUR, POR CONTENIDO DE GRASA, 2022-2031 (MILLONES DE USD)
TABLA 353 MERCADO DE LECHE DE CABRA EN AMÉRICA DEL SUR, POR TIPO DE ENVASE, 2022-2031 (MILLONES DE USD)
TABLA 354 MERCADO DE LECHE DE CABRA EN BOTELLA EN SUDAMÉRICA, POR TIPO DE ENVASE, 2022-2031 (MILLONES DE USD)
TABLA 355 MERCADO DE LECHE DE CABRA EN AMÉRICA DEL SUR, POR CANAL DE DISTRIBUCIÓN, 2022-2031 (MILLONES DE USD)
TABLA 356 MINORISTAS DE AMÉRICA DEL SUR CON TIENDAS EN EL MERCADO DE LECHE DE CABRA, POR CANAL DE DISTRIBUCIÓN, 2022-2031 (MILLONES DE USD)
TABLA 357 COMERCIANTES MINORISTAS SIN TIENDA EN AMÉRICA DEL SUR EN EL MERCADO DE LECHE DE CABRA, POR CANAL DE DISTRIBUCIÓN, 2022-2031 (MILLONES DE USD)
TABLA 358 MERCADO DE LECHE DE CABRA EN AMÉRICA DEL SUR, POR USUARIO FINAL, 2022-2031 (MILLONES DE USD)
TABLA 359 MERCADO DE LECHE DE CABRA DE BRASIL, POR PRODUCTO, 2022-2031 (USD MILLONES)
TABLA 360 MERCADO DE LECHE DE CABRA DE BRASIL, POR SABOR, 2022-2031 (USD MILLONES)
TABLA 361 SABORIZADO EN EL MERCADO DE LECHE DE CABRA DE BRASIL, POR SABOR, 2022-2031 (USD MILLONES)
TABLA 362 MERCADO DE LECHE DE CABRA DE BRASIL, POR CONTENIDO DE GRASA, 2022-2031 (USD MILLONES)
TABLA 363 MERCADO DE LECHE DE CABRA DE BRASIL, POR TIPO DE ENVASE, 2022-2031 (USD MILLONES)
TABLA 364 MERCADO DE LECHE DE CABRA EN BOTELLA EN BRASIL, POR TIPO DE ENVASE, 2022-2031 (USD MILLONES)
TABLA 365 MERCADO DE LECHE DE CABRA DE BRASIL, POR CANAL DE DISTRIBUCIÓN, 2022-2031 (USD MILLONES)
TABLA 366 Distribuidores minoristas de leche de cabra en tiendas de Brasil, por canal de distribución, 2022-2031 (USD millones)
TABLA 367 VENTAS MINORISTAS SIN TIENDA EN BRASIL EN EL MERCADO DE LECHE DE CABRA, POR CANAL DE DISTRIBUCIÓN, 2022-2031 (USD MILLONES)
TABLA 368 MERCADO DE LECHE DE CABRA DE BRASIL, POR USUARIO FINAL, 2022-2031 (USD MILLONES)
TABLA 369 MERCADO ARGENTINO DE LECHE DE CABRA, POR PRODUCTO, 2022-2031 (USD MILLONES)
TABLA 370 MERCADO ARGENTINO DE LECHE DE CABRA, POR SABOR, 2022-2031 (USD MILLONES)
TABLA 371 MERCADO DE LECHE DE CABRA SABORIZADA EN ARGENTINA, POR SABOR, 2022-2031 (USD MILLONES)
TABLA 372 MERCADO ARGENTINO DE LECHE DE CABRA, POR CONTENIDO DE GRASA, 2022-2031 (USD MILLONES)
TABLA 373 MERCADO ARGENTINO DE LECHE DE CABRA, POR TIPO DE ENVASE, 2022-2031 (USD MILLONES)
TABLA 374 MERCADO ARGENTINO DE LECHE DE CABRA EN BOTELLA, POR TIPO DE ENVASE, 2022-2031 (USD MILLONES)
TABLA 375 MERCADO ARGENTINO DE LECHE DE CABRA, POR CANAL DE DISTRIBUCIÓN, 2022-2031 (USD MILLONES)
TABLA 376 MINORISTAS EN TIENDA DE ARGENTINA EN EL MERCADO DE LECHE DE CABRA, POR CANAL DE DISTRIBUCIÓN, 2022-2031 (USD MILLONES)
TABLA 377 COMERCIANTES MINORISTAS SIN TIENDA EN ARGENTINA EN EL MERCADO DE LECHE DE CABRA, POR CANAL DE DISTRIBUCIÓN, 2022-2031 (USD MILLONES)
TABLA 378 MERCADO ARGENTINO DE LECHE DE CABRA, POR USUARIO FINAL, 2022-2031 (USD MILLONES)
TABLA 379 RESTO DE SUDAMÉRICA MERCADO DE LECHE DE CABRA, POR PRODUCTO, 2022-2031 (USD MILLONES)
Lista de figuras
FIGURA 1 MERCADO MUNDIAL DE LECHE DE CABRA: SEGMENTACIÓN
FIGURA 2 MERCADO MUNDIAL DE LECHE DE CABRA: TRIANGULACIÓN DE DATOS
FIGURA 3 MERCADO MUNDIAL DE LECHE DE CABRA: ANÁLISIS DROC
FIGURA 4 MERCADO MUNDIAL DE LECHE DE CABRA: ANÁLISIS DEL MERCADO MUNDIAL VS. REGIONAL
FIGURA 5 MERCADO MUNDIAL DE LECHE DE CABRA: ANÁLISIS DE INVESTIGACIÓN DE EMPRESAS
FIGURA 6 MERCADO MUNDIAL DE LECHE DE CABRA: DATOS DEMOGRÁFICOS DE LA ENTREVISTA
FIGURA 7 MERCADO MUNDIAL DE LECHE DE CABRA: CUADRÍCULA DE COBERTURA DE APLICACIONES DEL MERCADO
FIGURA 8 MERCADO MUNDIAL DE LECHE DE CABRA: CUADRÍCULA DE POSICIÓN DE MERCADO DBMR
FIGURA 9 MERCADO MUNDIAL DE LECHE DE CABRA: ANÁLISIS DE LA PARTICIPACIÓN DE LOS PROVEEDORES
FIGURA 10 MERCADO MUNDIAL DE LECHE DE CABRA: SEGMENTACIÓN
FIGURA 11 DOS SEGMENTOS COMPRENDEN EL MERCADO MUNDIAL DE LECHE DE CABRA
FIGURA 12 RESUMEN EJECUTIVO DEL MERCADO MUNDIAL DE LECHE DE CABRA
FIGURA 13 DECISIONES ESTRATÉGICAS DEL MERCADO MUNDIAL DE LECHE DE CABRA
FIGURA 14 LA AUMENTO DE LA PREVALENCIA DE LA INTOLERANCIA A LA LACTOSA ESTÁ IMPULSANDO EL CRECIMIENTO DEL MERCADO MUNDIAL DE LECHE DE CABRA DE 2024 A 2031
FIGURA 15 SE ESPERA QUE EL SEGMENTO DE PRODUCTOS REPRESENTE LA MAYOR PARTICIPACIÓN DEL MERCADO MUNDIAL DE LECHE DE CABRA EN 2024 Y 2031
FIGURA 16 SE ESPERA QUE ASIA-PACÍFICO DOMINE EL MERCADO MUNDIAL DE LECHE DE CABRA Y SE ESPERA QUE EUROPA CREZCA CON LA CAGR MÁS ALTA EN EL PERÍODO PRONOSTICADO DE 2024 A 2031
FIGURA 17 EUROPA ES LA REGIÓN DE MAYOR CRECIMIENTO PARA LOS FABRICANTES DEL MERCADO DE LECHE DE CABRA EN EL PERÍODO DE PRONÓSTICO DE 2024 A 2031
FIGURA 18 ANÁLISIS DROC
FIGURA 19 MERCADO MUNDIAL DE LECHE DE CABRA: POR PRODUCTO, 2023
FIGURA 20 MERCADO MUNDIAL DE LECHE DE CABRA: POR TIPO DE ENVASE, 2023
FIGURA 21 MERCADO MUNDIAL DE LECHE DE CABRA: POR SABOR, 2023
FIGURA 22 MERCADO MUNDIAL DE LECHE DE CABRA: POR CONTENIDO DE GRASA, 2023
FIGURA 23 MERCADO MUNDIAL DE LECHE DE CABRA: POR USUARIO FINAL, 2023
FIGURA 24 MERCADO MUNDIAL DE LECHE DE CABRA: POR CANAL DE DISTRIBUCIÓN, 2023
FIGURA 25 MERCADO MUNDIAL DE LECHE DE CABRA: INSTANTÁNEA (2023)
FIGURA 26 MERCADO MUNDIAL DE LECHE DE CABRA: PARTICIPACIÓN DE LA EMPRESA 2023 (%)
FIGURA 27 MERCADO DE LECHE DE CABRA DE AMÉRICA DEL NORTE: PARTICIPACIÓN DE LA EMPRESA 2023 (%)
FIGURA 28 MERCADO EUROPEO DE LECHE DE CABRA: PARTICIPACIÓN DE LA EMPRESA 2023 (%)
FIGURA 29 MERCADO DE LECHE DE CABRA DE ASIA-PACÍFICO: PARTICIPACIÓN DE LA EMPRESA 2023 (%)
Metodología de investigación
La recopilación de datos y el análisis del año base se realizan utilizando módulos de recopilación de datos con muestras de gran tamaño. La etapa incluye la obtención de información de mercado o datos relacionados a través de varias fuentes y estrategias. Incluye el examen y la planificación de todos los datos adquiridos del pasado con antelación. Asimismo, abarca el examen de las inconsistencias de información observadas en diferentes fuentes de información. Los datos de mercado se analizan y estiman utilizando modelos estadísticos y coherentes de mercado. Además, el análisis de la participación de mercado y el análisis de tendencias clave son los principales factores de éxito en el informe de mercado. Para obtener más información, solicite una llamada de un analista o envíe su consulta.
La metodología de investigación clave utilizada por el equipo de investigación de DBMR es la triangulación de datos, que implica la extracción de datos, el análisis del impacto de las variables de datos en el mercado y la validación primaria (experto en la industria). Los modelos de datos incluyen cuadrícula de posicionamiento de proveedores, análisis de línea de tiempo de mercado, descripción general y guía del mercado, cuadrícula de posicionamiento de la empresa, análisis de patentes, análisis de precios, análisis de participación de mercado de la empresa, estándares de medición, análisis global versus regional y de participación de proveedores. Para obtener más información sobre la metodología de investigación, envíe una consulta para hablar con nuestros expertos de la industria.
Personalización disponible
Data Bridge Market Research es líder en investigación formativa avanzada. Nos enorgullecemos de brindar servicios a nuestros clientes existentes y nuevos con datos y análisis que coinciden y se adaptan a sus objetivos. El informe se puede personalizar para incluir análisis de tendencias de precios de marcas objetivo, comprensión del mercado de países adicionales (solicite la lista de países), datos de resultados de ensayos clínicos, revisión de literatura, análisis de mercado renovado y base de productos. El análisis de mercado de competidores objetivo se puede analizar desde análisis basados en tecnología hasta estrategias de cartera de mercado. Podemos agregar tantos competidores sobre los que necesite datos en el formato y estilo de datos que esté buscando. Nuestro equipo de analistas también puede proporcionarle datos en archivos de Excel sin procesar, tablas dinámicas (libro de datos) o puede ayudarlo a crear presentaciones a partir de los conjuntos de datos disponibles en el informe.

