Global Hanger Market
Tamaño del mercado en miles de millones de dólares
Tasa de crecimiento anual compuesta (CAGR) :
% 
 USD
2.02 Billion
USD
2.89 Billion
2024
2032
USD
2.02 Billion
USD
2.89 Billion
2024
2032
| 2025 –2032 | |
| USD 2.02 Billion | |
| USD 2.89 Billion | |
| % | |
|
Segmentación del mercado global de perchas, por producto (percha de plástico, percha de madera, acero inoxidablealeación de aluminio y otros), aplicación (comercial y doméstica), modo de venta (minorista y online): tendencias de la industria y pronóstico hasta 2032.
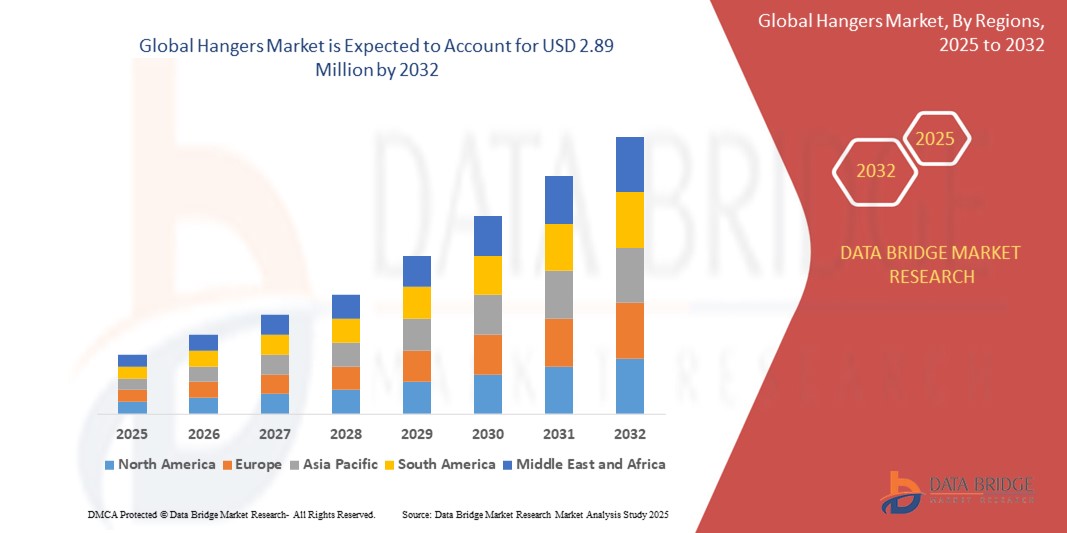
Tamaño del mercado de perchas
- El mercado mundial de perchas se valoró en 2.020 millones de dólares en 2024 y se espera que alcance los 2.890 millones de dólares en 2032.
- Durante el período de pronóstico de 2025 a 2032, es probable que el mercado crezca a una CAGR del 4,60 %, impulsado principalmente por la creciente demanda de productos sostenibles y ecológicos.
- Este crecimiento está impulsado por la rápida urbanización y el aumento de los ingresos disponibles, especialmente en las economías emergentes, que están alimentando la demanda de soluciones de almacenamiento organizadas y estéticamente agradables.
Análisis del mercado de perchas
- El mercado de perchas está experimentando un crecimiento constante debido a su papel crucial en el comercio minorista de moda, la organización del hogar y los espacios comerciales. Las perchas sirven como herramientas prácticas para el almacenamiento de prendas y como importantes elementos de exhibición que mejoran la presentación del producto y la experiencia del cliente, especialmente en tiendas minoristas de alta gama. La demanda de perchas innovadoras, que ahorren espacio y sean sostenibles está en aumento, impulsada por las cambiantes preferencias de los consumidores y la importancia de un estilo de vida organizado.
- Los factores clave que impulsan el mercado incluyen la creciente adopción de materiales ecológicos, el crecimiento de las industrias textil y de la moda, y la creciente demanda de diseños de perchas personalizados que se adapten a la estética interior en constante evolución. Además, la expansión del sector hotelero y el auge del comercio electrónico están creando nuevas oportunidades para productos de perchas especializados y duraderos.
- Europa domina el mercado de perchas, impulsada por estrictas regulaciones ambientales, altos ingresos disponibles y la presencia de importantes marcas y minoristas de moda que priorizan soluciones sostenibles para la venta minorista. El firme compromiso de la región con el desarrollo de productos ecológicos y las prácticas de economía circular impulsa aún más la demanda de soluciones innovadoras para perchas.
- Por ejemplo, en 2024, varios minoristas europeos cambiaron a perchas de materiales biodegradables y reciclados como parte de sus iniciativas de sostenibilidad más amplias para reducir los residuos plásticos y mejorar la reputación de la marca.
- A nivel mundial, el mercado de perchas está evolucionando con un fuerte enfoque en la innovación de materiales, diseños elegantes y sostenibilidad. Se espera que tendencias como el estilo de vida minimalista, el auge de los sistemas de almacenamiento modulares y la transición hacia un consumo responsable con el medio ambiente transformen el panorama del mercado. Los fabricantes invierten cada vez más en materiales inteligentes, diseños ligeros y prácticas de producción responsables con el medio ambiente para aprovechar las oportunidades emergentes y satisfacer la creciente demanda de soluciones de perchas elegantes y sostenibles.
Segmentación del mercado de perchas y alcance del informe
|
Atributos |
Perchas: Perspectivas clave del mercado |
|
Segmentos cubiertos |
|
|
Países cubiertos |
América del norte
Europa
Asia-Pacífico
Oriente Medio y África
Sudamerica
|
|
Actores clave del mercado |
|
|
Oportunidades de mercado |
|
|
Conjuntos de información de datos de valor añadido |
Además de los conocimientos sobre escenarios de mercado como valor de mercado, tasa de crecimiento, segmentación, cobertura geográfica y actores principales, los informes de mercado seleccionados por Data Bridge Market Research también incluyen análisis de importación y exportación, descripción general de la capacidad de producción, análisis del consumo de producción, análisis de tendencias de precios, escenario de cambio climático, análisis de la cadena de suministro, análisis de la cadena de valor, descripción general de materias primas/consumibles, criterios de selección de proveedores, análisis PESTLE, análisis de Porter y marco regulatorio. |
Tendencias del mercado de perchas
Creciente demanda de perchas sostenibles y ecológicas
- La creciente conciencia ambiental y las regulaciones más estrictas contra los desechos plásticos están impulsando la demanda de perchas sostenibles y ecológicas hechas de materiales reciclados, compuestos biodegradables y recursos renovables.
- Las principales marcas de moda y venta minorista están adoptando iniciativas ecológicas, lo que lleva a un cambio hacia perchas producidas con un impacto ambiental mínimo, como las hechas de madera certificada por el FSC, papel reciclado o materias primas climáticamente positivas.
- Los avances tecnológicos en la ciencia de los materiales están permitiendo el desarrollo de perchas ecológicas duraderas, livianas y estéticamente agradables, que se adaptan tanto a las exhibiciones minoristas de alta gama como al uso doméstico diario.
Por ejemplo,
- En septiembre de 2024, Mainetti lanzó su línea Paperform Hanger, que ofrece una solución 100 % reciclable y libre de plástico destinada a reducir la huella de carbono en las tiendas minoristas.
- En noviembre de 2021, Mainetti colaboró con UBQ Materials Ltd. para fabricar perchas a partir de termoplásticos positivos para el clima, estableciendo un nuevo referente de sostenibilidad en la industria de la moda.
- En febrero de 2023, EISHO CO., LTD. presentó una serie de perchas biodegradables fabricadas con materiales renovables, dirigidas a consumidores con conciencia ecológica en Europa y Asia.
- Con las industrias de la moda y el comercio minorista bajo presión para cumplir con los objetivos de sostenibilidad, se espera que la demanda de perchas ecológicas aumente, impulsando a los fabricantes hacia la innovación y reforzando la responsabilidad ambiental en toda la cadena de suministro.
Dinámica del mercado de perchas
Conductor
Crecimiento del sector minorista y demanda de soluciones de exhibición de alta calidad
- La rápida expansión del sector minorista global, especialmente en moda y ropa, está impulsando la demanda de perchas de alta calidad, duraderas y estéticamente agradables para mejorar la presentación del producto y la experiencia en la tienda.
- A medida que las marcas enfatizan la estética de la tienda y el merchandising visual, existe una creciente preferencia por perchas premium hechas de madera, metal y materiales ecológicos que se alinean con la identidad de marca y los objetivos de sostenibilidad.
- El auge de las compras en línea y la venta minorista omnicanal también está impulsando la necesidad de perchas especializadas que garanticen un transporte seguro, protejan las prendas y mantengan su forma durante el envío y la manipulación.
Por ejemplo,
- En septiembre de 2024, Absoluteblack presentó su primer colgador de pared para bicicletas de primera calidad, que combina estilo con funcionalidad para satisfacer los mercados minoristas y de decoración del hogar de alto nivel.
- En febrero de 2023, GuitarGrip lanzó una colección especial de colgadores de guitarra de diseño, que mejoran el atractivo visual y la marca de las exhibiciones de instrumentos musicales.
- En julio de 2021, Mainetti presentó su línea Paperform Hanger, que ofrece soluciones de exhibición sostenibles y visualmente atractivas para los minoristas de moda de todo el mundo.
- A medida que se intensifica la competencia en la industria minorista, se espera que crezca la demanda de perchas innovadoras, elegantes y sostenibles, lo que las convierte en un elemento crucial de la diferenciación de marca y las estrategias de experiencia del cliente.
Oportunidad
Ampliación de soluciones de perchas ecológicas y reciclables
- La creciente preferencia de los consumidores por productos sostenibles y ecológicos está impulsando la demanda de perchas reciclables y biodegradables hechas de materiales como papel reciclado, madera y plásticos biodegradables.
- Las marcas se centran cada vez más en ofrecer opciones de perchas ambientalmente responsables como parte de sus compromisos de sostenibilidad, lo que crea importantes oportunidades de crecimiento para los fabricantes que innovan en este espacio.
- Las crecientes regulaciones ambientales sobre los plásticos de un solo uso y las iniciativas de sostenibilidad corporativa están fomentando la adopción de perchas ecológicas en las industrias de la moda, el comercio minorista y la hostelería.
Por ejemplo,
- En septiembre de 2024, Absoluteblack presentó un colgador de pared para bicicletas elaborado con madera con certificación FSC y gamuza italiana, que satisface la demanda de soluciones de exhibición premium y sostenibles.
- En noviembre de 2021, Mainetti se asoció con UBQ Materials Ltd. para desarrollar perchas con termoplásticos respetuosos con el medio ambiente, lo que refuerza su compromiso con la sostenibilidad y las prácticas de economía circular.
- En julio de 2021, Mainetti lanzó su línea de perchas Paperform 100 % libres de plástico, fabricadas con papel y acero reciclados, para abordar el creciente mercado de soluciones ecológicas para el comercio minorista.
- A medida que aumenta la conciencia global sobre los problemas ambientales, la demanda de perchas ecológicas y reciclables creará oportunidades significativas para la innovación, la diferenciación de marca y la expansión del mercado en los próximos años.
Restricción/Desafío
Fluctuación de los precios de las materias primas e interrupciones en la cadena de suministro
- El mercado de perchas es muy sensible a las fluctuaciones en los precios de las materias primas como metales, madera y plásticos, lo que puede afectar significativamente los costos de producción y los márgenes de ganancia de los fabricantes.
- Las interrupciones de la cadena de suministro global, impulsadas por factores como tensiones geopolíticas, cuellos de botella en el transporte y escasez de materiales, han provocado retrasos en la producción de perchas y mayores desafíos operativos.
- La dependencia de un número limitado de proveedores y regiones para materiales clave aumenta la vulnerabilidad a los choques externos, lo que hace esencial que las empresas diversifiquen sus estrategias de abastecimiento.
Por ejemplo,
- En febrero de 2024, Whitmor, Inc. informó retrasos en los envíos de perchas debido a la escasez de materia prima causada por interrupciones en la cadena de suministro en el sudeste asiático.
- Como persisten la volatilidad de la cadena de suministro y las fluctuaciones de los precios de las materias primas, las empresas del mercado de perchas deben mejorar su resiliencia adoptando estrategias de abastecimiento flexibles, optimizando la logística y explorando materiales alternativos para mantener la competitividad.
Alcance del mercado de perchas
El mercado está segmentado según el producto, la aplicación y el modo de venta.
|
Segmentación |
Subsegmentación |
|
Por producto |
|
|
Por aplicación |
|
|
Por modo de venta |
|
Análisis regional del mercado de perchas
Europa es la región dominante en el mercado de perchas
- Europa domina el mercado mundial de perchas, impulsada por un sector minorista fuerte y maduro, altos estándares de la industria de la moda y un énfasis creciente en la sostenibilidad y los productos ecológicos.
- Los centros de fabricación de prendas de vestir bien establecidos de la región, particularmente en países como Italia, Francia y Alemania, contribuyen significativamente a la demanda de perchas premium y personalizadas.
- Las estrictas regulaciones medioambientales y la preferencia de los consumidores por perchas reciclables y biodegradables están reforzando aún más el liderazgo de Europa en el mercado global.
Por ejemplo,
- En 2024, Alemania fue testigo de una mayor demanda de perchas sostenibles de madera y plástico reciclado por parte de marcas de moda de lujo centradas en iniciativas con conciencia ecológica.
- En 2023, Francia vio a las principales casas de moda asociarse con fabricantes para desarrollar colecciones de perchas personalizadas hechas de materiales biodegradables.
- Con su infraestructura minorista avanzada, su base de consumidores impulsada por el medio ambiente y su compromiso con la calidad superior, se espera que Europa mantenga su posición dominante en el mercado de perchas en los próximos años.
Se proyecta que Asia-Pacífico registre la mayor tasa de crecimiento.
- Se espera que Asia-Pacífico experimente la tasa de crecimiento más alta en el mercado de perchas, impulsada por la rápida expansión de las industrias minoristas, de la moda y del comercio electrónico, junto con la creciente demanda de los consumidores de soluciones de almacenamiento organizado.
- Una creciente población de clase media, la urbanización y los crecientes niveles de ingresos disponibles están impulsando un mayor gasto en ropa, lo que aumenta la demanda de perchas personalizadas y de alta calidad.
- Las fuertes inversiones en los sectores textil y de la confección, en particular en países como China, India, Vietnam y Bangladesh, están contribuyendo aún más al sólido crecimiento del consumo de perchas en la región.
Por ejemplo,
- En 2024, Bangladesh amplió sus instalaciones de fabricación de prendas de vestir, lo que generó una mayor demanda de perchas duraderas y ecológicas.
- En 2023, Vietnam experimentó un aumento en el uso de perchas con el crecimiento de su sector de indumentaria de comercio electrónico y la industria de la moda impulsada por la exportación.
- Con estos factores impulsores, Asia-Pacífico está preparada para mantener su fuerte impulso de crecimiento, consolidando su papel fundamental en la configuración de la trayectoria futura del mercado mundial de perchas.
Cuota de mercado de perchas
El panorama competitivo del mercado ofrece detalles por competidor. Se incluye información general de la empresa, sus estados financieros, ingresos generados, potencial de mercado, inversión en investigación y desarrollo, nuevas iniciativas de mercado, presencia global, plantas de producción, capacidad de producción, fortalezas y debilidades de la empresa, lanzamiento de productos, alcance y variedad de productos, y dominio de las aplicaciones. Los datos anteriores se refieren únicamente al enfoque de mercado de las empresas.
Los principales líderes del mercado que operan en el mercado son:
- Mainetti (Italia)
- Perchas M&B (EE. UU.)
- EISHO CO., LTD. (China)
- Perchas (EE. UU.)
- Whitmor, Inc. (EE. UU.)
- GUILIN IANGO HOME COLLECTION CO., LTD. (China)
- Perchas MAWA (Alemania)
- NAHANCO (National Hanger Company) (EE. UU.)
- Bend & Hook (EE. UU.)
- Concept Mannequins (Reino Unido)
Últimos avances en el mercado global de perchas
- En septiembre de 2024, Absoluteblack lanzó su primer colgador de pared para bicicletas, que ofrece una "combinación de estilo y funcionalidad" inspirada en la necesidad de soluciones elegantes que ahorren espacio, elaborado con chapa de madera laminada de haya y roble de origen responsable con certificación FSC, junto con auténtica gamuza italiana, lo que lo hace ideal para espacios de vida modernos y refuerza su posición en el mercado de accesorios premium para el hogar.
- En febrero de 2023, GuitarGrip, la empresa de accesorios musicales de renombre mundial, anunció el lanzamiento de su colección Jerry Garcia, una línea de colgadores de guitarra con licencia oficial creada en colaboración con Jerry Garcia Family LLC y su agente de licencias, Epic Rights, como un proyecto de tributo, ayudando a la marca a expandir su alcance entre los entusiastas y coleccionistas de la música.
- En noviembre de 2021, MAINETTI, un proveedor global de soluciones minoristas, anunció su colaboración con UBQ Materials Ltd., con el objetivo de establecer un nuevo estándar para la innovación y la sostenibilidad de productos en el sector de la moda mediante el uso del termoplástico patentado de UBQ para producir artículos sostenibles y positivos para el clima para minoristas de todo el mundo, reforzando su compromiso con el desarrollo sostenible y la innovación.
- En julio de 2021, MAINETTI presentó su línea Paperform Hanger, que ofrece a los comerciantes una adición sostenible y renovable a su inventario de perchas, con perchas 100 % libres de plástico y reciclables, hechas de papel reciclado y acero a pedido, disponibles en varios diseños para aumentar la visibilidad de la marca y la producción, mejorando su ventaja competitiva en el segmento de productos ecológicos.
SKU-
Obtenga acceso en línea al informe sobre la primera nube de inteligencia de mercado del mundo

- Panel de análisis de datos interactivo
- Panel de análisis de empresas para oportunidades con alto potencial de crecimiento
- Acceso de analista de investigación para personalización y consultas
- Análisis de la competencia con panel interactivo
- Últimas noticias, actualizaciones y análisis de tendencias
- Aproveche el poder del análisis de referencia para un seguimiento integral de la competencia
Tabla de contenido
1 INTRODUCCIÓN
1.1 OBJETIVOS DEL ESTUDIO
1.2 DEFINICIÓN DE MERCADO
1.3 DESCRIPCIÓN GENERAL DEL MERCADO MUNDIAL DE PERCHAS
1.4 LIMITACIÓN
1.5 MERCADOS CUBIERTOS
2 SEGMENTACIÓN DEL MERCADO
2.1 MERCADOS CUBIERTOS
2.2 ÁMBITO GEOGRÁFICO
2,3 AÑOS CONSIDERADOS PARA EL ESTUDIO
2.4 MONEDA Y PRECIOS
2.5 MODELO DE VALIDACIÓN DE DATOS TRÍPODE DBMR
2.6 CURVA DE LA LÍNEA DE VIDA DEL PRODUCTO
2.7 MODELADO MULTIVARIADO
2.8 ENTREVISTAS PRINCIPALES CON LÍDERES DE OPINIÓN CLAVE
2.9 CUADRÍCULA DE POSICIÓN DE MERCADO DBMR
2.1 CUADRÍCULA DE COBERTURA DE APLICACIONES DEL MERCADO
2.11 MATRIZ DE DESAFÍOS DEL MERCADO DBMR
2.12 ANÁLISIS DE PARTICIPACIÓN DE PROVEEDORES DE DBMR
2.13 DATOS DE IMPORTACIÓN Y EXPORTACIÓN
2.14 FUENTES SECUNDARIAS
2.15 SUPUESTOS
3 RESUMEN EJECUTIVO
4 INFORMACIÓN PREMIUM
4.1 LAS CINCO FUERZAS DE PORTER:
4.1.1 AMENAZA DE NUEVOS ENTRANTES:
4.1.2 AMENAZA DE SUSTITUTOS:
4.1.3 PODER DE NEGOCIACIÓN DEL CLIENTE:
4.1.4 PODER DE NEGOCIACIÓN DE LOS PROVEEDORES:
4.1.5 COMPETENCIA INTERNA (RIVALIDAD):
4.2 ANÁLISIS DE CUOTA DE MARCA
4.3 COMPORTAMIENTO DE COMPRA DEL CONSUMIDOR
4.3.1 DESCRIPCIÓN GENERAL
4.3.2 COMPORTAMIENTO DE COMPRA COMPLEJO
4.3.3 COMPORTAMIENTO DE COMPRA QUE REDUCE LA DISONANCIA
4.3.4 COMPORTAMIENTO DE COMPRA HABITUAL
4.3.5 COMPORTAMIENTO DE BÚSQUEDA DE VARIEDAD
4.3.6 CONCLUSIÓN
4.4 FACTORES QUE AFECTAN LA DECISIÓN DE COMPRA
4.4.1 FACTOR ECONÓMICO
4.4.2 FACTOR FUNCIONAL
4.5 ADSORCIÓN DE PRODUCTOS DE CONSUMO
4.5.1 DESCRIPCIÓN GENERAL
4.5.2 CONOCIMIENTO DEL PRODUCTO
4.5.3 INTERÉS EN EL PRODUCTO
4.5.4 EVALUACIÓN DEL PRODUCTO
4.5.5 PRUEBA DEL PRODUCTO
4.5.6 ADOPCIÓN DEL PRODUCTO
4.5.7 CONCLUSIÓN
4.6 IMPACTO DE LA DESACELERACIÓN ECONÓMICA
4.6.1 IMPACTO EN EL PRECIO
4.6.2 IMPACTO EN LA CADENA DE SUMINISTRO
4.6.3 IMPACTO EN EL ENVÍO
4.6.4 IMPACTO EN LAS DECISIONES ESTRATÉGICAS DE LA EMPRESA
4.7 ESCENARIO DE IMPORTACIÓN Y EXPORTACIÓN
4.8 PERSPECTIVAS DE CAPACIDAD DE PRODUCCIÓN
4.9 ANÁLISIS DE LA CADENA DE SUMINISTRO
4.9.1 DESCRIPCIÓN GENERAL
4.9.2 ESCENARIO DE COSTOS LOGÍSTICOS
4.9.3 IMPORTANCIA DE LOS PROVEEDORES DE SERVICIOS LOGÍSTICOS
4.1 ANÁLISIS DE ABASTECIMIENTO DE MATERIA PRIMA
4.10.1 METAL
4.10.2 PLÁSTICOS
4.10.3 MADERA
5 COBERTURA REGLAMENTARIA
6 PANORAMA GENERAL DEL MERCADO
6.1 CONDUCTORES
6.1.1 UN SECTOR MINORISTA Y DE HOSTELERÍA PRÓSPERO CONDUCE A UN CRECIMIENTO CONTINUO
6.1.2 LA PREFERENCIA POR LAS PERCHAS DE MADERA ESTÁ DE MODA EN EL MERCADO DE PERCHAS
6.1.3 EL USO DE DIVERSOS TIPOS DE PERCHAS EN LOS HOGARES ESTÁ AUMENTANDO
6.2 RESTRICCIONES
6.2.1 LAS VENTAS EN LÍNEA TIENEN UN EFECTO EN LAS VENTAS DE LOS MAYORISTAS Y MINORISTAS CONVENCIONALES
6.2.2 UNA ALTERNATIVA ECONÓMICA Y FÁCIL PARA LAS PERCHAS
6.3 OPORTUNIDADES
6.3.1 INNOVACIONES DE INTELIGENCIA LAS PERCHAS SON LA NUEVA OPCIÓN PARA SECAR LA ROPA
6.3.2 AUMENTO DEL SEGMENTO COMERCIAL Y ACCESIBILIDAD DE LOS PRODUCTOS
6.4 DESAFÍOS
6.4.1 PRECIOS FLUCTUANTES DE LAS MATERIAS PRIMAS Y PROHIBICIÓN DEL USO DE PLÁSTICO
6.4.2 PROBLEMAS ASOCIADOS A LOS DISTINTOS TIPOS DE PERCHAS
7 MERCADO MUNDIAL DE PERCHAS, POR PRODUCTO
7.1 INFORMACIÓN GENERAL
7.2 PERCHAS DE PLÁSTICO
7.3 PERCHA DE MADERA
7.4 ACERO INOXIDABLE
7.5 ALEACIÓN DE ALUMINIO
7.6 OTROS
8 MERCADO MUNDIAL DE PERCHAS, POR APLICACIÓN
8.1 DESCRIPCIÓN GENERAL
8.2 COMERCIAL
8.2.1 COMERCIAL, POR PRODUCTO
8.2.1.1 PERCHA DE PLÁSTICO
8.2.1.2 PERCHA DE MADERA
8.2.1.3 ACERO INOXIDABLE
8.2.1.4 ALEACIÓN DE ALUMINIO
8.2.1.5 OTROS
8.3 HOGAR
8.3.1 HOGAR, POR PRODUCTO
8.3.1.1 PERCHA DE PLÁSTICO
8.3.1.2 PERCHA DE MADERA
8.3.1.3 ACERO INOXIDABLE
8.3.1.4 ALEACIÓN DE ALUMINIO
8.3.1.5 OTROS
9 MERCADO MUNDIAL DE PERCHAS, POR MODO DE VENTA
9.1 INFORMACIÓN GENERAL
9.2 VENTA AL POR MENOR
9.3 EN LÍNEA
10 MERCADO MUNDIAL DE PERCHAS, POR REGIÓN
10.1 INFORMACIÓN GENERAL
10.2 ASIA-PACÍFICO
10.2.1 CHINA
10.2.2 INDIA
10.2.3 JAPÓN
10.2.4 COREA DEL SUR
10.2.5 TAILANDIA
10.2.6 SINGAPUR
10.2.7 INDONESIA
10.2.8 AUSTRALIA Y NUEVA ZELANDA
10.2.9 FILIPINAS
10.2.10 MALASIA
10.2.11 RESTO DE ASIA-PACÍFICO
10.3 AMÉRICA DEL NORTE
10.3.1 EE. UU.
10.3.2 CANADÁ
10.3.3 MÉXICO
10.4 EUROPA
10.4.1 ALEMANIA
10.4.2 Reino Unido
10.4.3 FRANCIA
10.4.4 ITALIA
10.4.5 ESPAÑA
10.4.6 RUSIA
10.4.7 TURQUÍA
10.4.8 SUIZA
10.4.9 BÉLGICA
10.4.10 PAÍSES BAJOS
10.4.11 RESTO DE EUROPA
10.5 SUDAMÉRICA
10.5.1 BRASIL
10.5.2 ARGENTINA
10.5.3 RESTO DE SUDAMÉRICA
10.6 ORIENTE MEDIO Y ÁFRICA
10.6.1 EMIRATOS ÁRABES UNIDOS
10.6.2 SUDÁFRICA
10.6.3 ARABIA SAUDITA
10.6.4 EGIPTO
10.6.5 ISRAEL
10.6.6 RESTO DE ORIENTE MEDIO Y ÁFRICA
11 MERCADO GLOBAL DE PERCHAS: PANORAMA EMPRESARIAL
11.1 ANÁLISIS DE LAS ACCIONES DE LA EMPRESA: GLOBAL
11.2 ANÁLISIS DE ACCIONES DE EMPRESAS: AMÉRICA DEL NORTE
11.3 ANÁLISIS DE ACCIONES DE EMPRESAS: EUROPA
11.4 ANÁLISIS DE ACCIONES DE LA EMPRESA: ASIA-PACÍFICO
11.5 LANZAMIENTO DEL PRODUCTO
11.6 ASOCIACIÓN
12 ANÁLISIS FODA
13 PERFILES DE EMPRESAS
13.1 MAINETTI
13.1.1 INSTANTÁNEA DE LA EMPRESA
13.1.2 ANÁLISIS DE LAS ACCIONES DE LA EMPRESA
13.1.3 PORTAFOLIO DE PRODUCTOS
13.1.4 ACTUALIZACIONES RECIENTES
13.2 PERCHAS M&B
13.2.1 INSTANTÁNEA DE LA EMPRESA
13.2.2 ANÁLISIS DE LAS ACCIONES DE LA EMPRESA
13.2.3 PORTAFOLIO DE PRODUCTOS
13.2.4 ACTUALIZACIONES RECIENTES
13.3 EISHO CO., LTD.
13.3.1 INSTANTÁNEA DE LA EMPRESA
13.3.2 ANÁLISIS DE LAS ACCIONES DE LA EMPRESA
13.3.3 PORTAFOLIO DE PRODUCTOS
13.3.4 ACTUALIZACIONES RECIENTES
13.4 HANGERS.COM
13.4.1 INSTANTÁNEA DE LA EMPRESA
13.4.2 ANÁLISIS DE LAS ACCIONES DE LA EMPRESA
13.4.3 PORTAFOLIO DE PRODUCTOS
13.4.4 ACTUALIZACIÓN RECIENTE
13.5 WHITMOR, INC.
13.5.1 INSTANTÁNEA DE LA EMPRESA
13.5.2 ANÁLISIS DE LAS ACCIONES DE LA EMPRESA
13.5.3 PORTAFOLIO DE PRODUCTOS
13.5.4 ACTUALIZACIONES RECIENTES
13.6 DOBLAR Y GANCHAR
13.6.1 INSTANTÁNEA DE LA EMPRESA
13.6.2 PORTAFOLIO DE PRODUCTOS
13.6.3 ACTUALIZACIONES RECIENTES
13.7 MANIQUÍES CONCEPTUALES
13.7.1 INSTANTÁNEA DE LA EMPRESA
13.7.2 PORTAFOLIO DE PRODUCTOS
13.7.3 ACTUALIZACIÓN RECIENTE
13.8 GUILIN IANGO COLECCIÓN DE HOGARES CO., LTD.
13.8.1 INSTANTÁNEA DE LA EMPRESA
13.8.2 PORTAFOLIO DE PRODUCTOS
13.8.3 ACTUALIZACIONES RECIENTES
13.9 MAWA-HANGERS.COM.
13.9.1 INSTANTÁNEA DE LA EMPRESA
13.9.2 PORTAFOLIO DE PRODUCTOS
13.9.3 ACTUALIZACIONES RECIENTES
13.1 NAHANC0
13.10.1 INSTANTÁNEA DE LA EMPRESA
13.10.2 PORTAFOLIO DE PRODUCTOS
13.10.3 ACTUALIZACIÓN RECIENTE
14 CUESTIONARIO
15 INFORME RELACIONADO
Lista de Tablas
CUADRO 1 DATOS DE IMPORTACIÓN DE PERCHAS DE MADERA PARA ROPA; CÓDIGO SA – 442110 (MILES DE USD)
CUADRO 2 DATOS DE EXPORTACIÓN DE PERCHAS DE MADERA PARA ROPA; CÓDIGO SA – 442110 (MILES DE USD)
CUADRO 3 MARCO REGULATORIO
TABLA 4 MERCADO MUNDIAL DE PERCHAS, POR PRODUCTO, 2021-2030 (MILES DE USD)
TABLA 5 MERCADO MUNDIAL DE PERCHAS, POR PRODUCTO, 2021-2030 (MILES DE UNIDADES)
TABLA 6 MERCADO MUNDIAL DE PERCHAS DE PLÁSTICO, POR REGIÓN, 2021-2030 (MILES DE USD)
TABLA 7 MERCADO MUNDIAL DE PERCHAS DE MADERA, POR REGIÓN, 2021-2030 (MILES DE USD)
TABLA 8 MERCADO MUNDIAL DE ACERO INOXIDABLE EN PERCHAS, POR REGIÓN, 2021-2030 (MILES DE USD)
TABLA 9 MERCADO MUNDIAL DE ALEACIONES DE ALUMINIO EN PERCHAS, POR REGIÓN, 2021-2030 (MILES DE USD)
TABLA 10 MERCADO MUNDIAL DE OTROS EN PERCHAS, POR REGIÓN, 2021-2030 (MILES DE USD)
TABLA 11 MERCADO MUNDIAL DE PERCHAS, POR APLICACIÓN, 2021-2030 (MILES DE USD)
TABLA 12 MERCADO MUNDIAL DE PERCHAS, POR APLICACIÓN, 2021-2030 (MILES DE UNIDADES)
TABLA 13 MERCADO MUNDIAL DE PERCHAS COMERCIALES, POR REGIÓN, 2021-2030 (MILES DE USD)
TABLA 14 MERCADO MUNDIAL DE PERCHAS COMERCIALES, POR PRODUCTO, 2021-2030 (MILES DE USD)
TABLA 15 MERCADO MUNDIAL DE PERCHAS PARA EL HOGAR, POR REGIÓN, 2021-2030 (MILES DE USD)
TABLA 16 MERCADO MUNDIAL DE PERCHAS PARA EL HOGAR, POR PRODUCTO, 2021-2030 (MILES DE USD)
TABLA 17 MERCADO MUNDIAL DE PERCHAS, POR MODO DE VENTA, 2021-2030 (MILES DE USD)
TABLA 18 MERCADO MUNDIAL DE VENTA MINORISTA DE PERCHAS, POR REGIÓN, 2021-2030 (MILES DE USD)
TABLA 19 MERCADO GLOBAL DE PERCHAS EN LÍNEA, POR REGIÓN, 2021-2030 (MILES DE USD)
TABLA 20 MERCADO MUNDIAL DE PERCHAS, POR REGIÓN, 2021-2030 (MILES DE USD)
TABLA 21 MERCADO MUNDIAL DE PERCHAS, POR REGIÓN, 2021-2030 (MILES DE UNIDADES)
TABLA 22 MERCADO MUNDIAL DE PERCHAS, POR PRODUCTO, 2021-2030 (MILES DE USD)
TABLA 23 MERCADO MUNDIAL DE PERCHAS, POR PRODUCTO, 2021-2030 (MILES DE UNIDADES)
TABLA 24 MERCADO MUNDIAL DE PERCHAS, POR PRODUCTO, 2021-2030 (PRECIO (USD) POR UNIDAD)
TABLA 25 MERCADO DE PERCHAS DE ASIA-PACÍFICO, POR PAÍS, 2021-2030 (MILES DE USD)
TABLA 26 MERCADO DE PERCHAS DE ASIA-PACÍFICO, POR PAÍS, 2021-2030 (MILES DE UNIDADES)
TABLA 27 MERCADO DE PERCHAS DE ASIA-PACÍFICO, POR PRODUCTO, 2021-2030 (MILES DE USD)
TABLA 28 MERCADO DE PERCHAS DE ASIA-PACÍFICO, POR PRODUCTO, 2021-2030 (MILES DE UNIDADES)
TABLA 29 MERCADO DE PERCHAS DE ASIA-PACÍFICO, POR APLICACIÓN, 2021-2030 (MILES DE USD)
TABLA 30 MERCADO DE PERCHAS DE ASIA-PACÍFICO, POR APLICACIÓN, 2021-2030 (MILES DE UNIDADES)
TABLA 31 MERCADO DE PERCHAS COMERCIALES DE ASIA-PACÍFICO, POR PRODUCTO, 2021-2030 (MILES DE USD)
TABLA 32 MERCADO DE PERCHAS PARA EL HOGAR EN ASIA-PACÍFICO, POR PRODUCTO, 2021-2030 (MILES DE USD)
TABLA 33 MERCADO DE PERCHAS DE ASIA-PACÍFICO, POR MODO DE VENTA, 2021-2030 (MILES DE USD)
TABLA 34 MERCADO DE PERCHAS DE PORCELANA, POR PRODUCTO, 2021-2030 (MILES DE USD)
TABLA 35 MERCADO DE PERCHAS DE PORCELANA, POR PRODUCTO, 2021-2030 (MILES DE UNIDADES)
TABLA 36 MERCADO DE PERCHAS DE PORCELANA, POR APLICACIÓN, 2021-2030 (MILES DE USD)
TABLA 37 MERCADO DE PERCHAS DE PORCELANA, POR APLICACIÓN, 2021-2030 (MILES DE UNIDADES)
TABLA 38 MERCADO DE PERCHAS COMERCIALES DE CHINA, POR PRODUCTO, 2021-2030 (MILES DE USD)
TABLA 39 MERCADO DE PERCHAS PARA EL HOGAR EN CHINA, POR PRODUCTO, 2021-2030 (MILES DE USD)
TABLA 40 MERCADO DE PERCHAS DE PORCELANA, POR MODO DE VENTA, 2021-2030 (MILES DE USD)
TABLA 41 MERCADO DE PERCHAS DE LA INDIA, POR PRODUCTO, 2021-2030 (MILES DE USD)
TABLA 42 MERCADO DE PERCHAS EN INDIA, POR PRODUCTO, 2021-2030 (MILES DE UNIDADES)
TABLA 43 MERCADO DE PERCHAS DE LA INDIA, POR APLICACIÓN, 2021-2030 (MILES DE USD)
TABLA 44 MERCADO DE PERCHAS EN INDIA, POR APLICACIÓN, 2021-2030 (MILES DE UNIDADES)
TABLA 45 MERCADO DE PERCHAS COMERCIALES DE INDIA, POR PRODUCTO, 2021-2030 (MILES DE USD)
TABLA 46 MERCADO DE PERCHAS PARA EL HOGAR EN INDIA, POR PRODUCTO, 2021-2030 (MILES DE USD)
TABLA 47 MERCADO DE PERCHAS DE LA INDIA, POR MODO DE VENTA, 2021-2030 (MILES DE USD)
TABLA 48 MERCADO DE PERCHAS DE JAPÓN, POR PRODUCTO, 2021-2030 (MILES DE USD)
TABLA 49 MERCADO DE PERCHAS DE JAPÓN, POR PRODUCTO, 2021-2030 (MILES DE UNIDADES)
TABLA 50 MERCADO DE PERCHAS EN JAPÓN, POR APLICACIÓN, 2021-2030 (MILES DE USD)
TABLA 51 MERCADO DE PERCHAS DE JAPÓN, POR APLICACIÓN, 2021-2030 (MILES DE UNIDADES)
TABLA 52 MERCADO DE PERCHAS COMERCIALES DE JAPÓN, POR PRODUCTO, 2021-2030 (MILES DE USD)
TABLA 53 MERCADO DE PERCHAS PARA EL HOGAR EN JAPÓN, POR PRODUCTO, 2021-2030 (MILES DE USD)
TABLA 54 MERCADO DE PERCHAS DE JAPÓN, POR MODO DE VENTA, 2021-2030 (MILES DE USD)
TABLA 55 MERCADO DE PERCHAS DE COREA DEL SUR, POR PRODUCTO, 2021-2030 (MILES DE USD)
TABLA 56 MERCADO DE PERCHAS DE COREA DEL SUR, POR PRODUCTO, 2021-2030 (MILES DE UNIDADES)
TABLA 57 MERCADO DE PERCHAS DE COREA DEL SUR, POR APLICACIÓN, 2021-2030 (MILES DE USD)
TABLA 58 MERCADO DE PERCHAS DE COREA DEL SUR, POR APLICACIÓN, 2021-2030 (MILES DE UNIDADES)
TABLA 59 MERCADO DE PERCHAS COMERCIALES DE COREA DEL SUR, POR PRODUCTO, 2021-2030 (MILES DE USD)
TABLA 60 MERCADO DE PERCHAS PARA HOGARES EN COREA DEL SUR, POR PRODUCTO, 2021-2030 (MILES DE USD)
TABLA 61 MERCADO DE PERCHAS DE COREA DEL SUR, POR MODO DE VENTA, 2021-2030 (MILES DE USD)
TABLA 62 MERCADO DE PERCHAS DE TAILANDIA, POR PRODUCTO, 2021-2030 (MILES DE USD)
TABLA 63 MERCADO DE PERCHAS DE TAILANDIA, POR PRODUCTO, 2021-2030 (MILES DE UNIDADES)
TABLA 64 MERCADO DE PERCHAS DE TAILANDIA, POR APLICACIÓN, 2021-2030 (MILES DE USD)
TABLA 65 MERCADO DE PERCHAS DE TAILANDIA, POR APLICACIÓN, 2021-2030 (MILES DE UNIDADES)
TABLA 66 MERCADO DE PERCHAS COMERCIALES DE TAILANDIA, POR PRODUCTO, 2021-2030 (MILES DE USD)
TABLA 67 MERCADO DE PERCHAS PARA EL HOGAR EN TAILANDIA, POR PRODUCTO, 2021-2030 (MILES DE USD)
TABLA 68 MERCADO DE PERCHAS DE TAILANDIA, POR MODO DE VENTA, 2021-2030 (MILES DE USD)
TABLA 69 MERCADO DE PERCHAS DE SINGAPUR, POR PRODUCTO, 2021-2030 (MILES DE USD)
TABLA 70 MERCADO DE PERCHAS DE SINGAPUR, POR PRODUCTO, 2021-2030 (MILES DE UNIDADES)
TABLA 71 MERCADO DE PERCHAS DE SINGAPUR, POR APLICACIÓN, 2021-2030 (MILES DE USD)
TABLA 72 MERCADO DE PERCHAS DE SINGAPUR, POR APLICACIÓN, 2021-2030 (MILES DE UNIDADES)
TABLA 73 MERCADO DE PERCHAS COMERCIALES DE SINGAPUR, POR PRODUCTO, 2021-2030 (MILES DE USD)
TABLA 74 MERCADO DE PERCHAS PARA EL HOGAR DE SINGAPUR, POR PRODUCTO, 2021-2030 (MILES DE USD)
TABLA 75 MERCADO DE PERCHAS DE SINGAPUR, POR MODO DE VENTA, 2021-2030 (MILES DE USD)
TABLA 76 MERCADO DE PERCHAS DE INDONESIA, POR PRODUCTO, 2021-2030 (MILES DE USD)
TABLA 77 MERCADO DE PERCHAS DE INDONESIA, POR PRODUCTO, 2021-2030 (MILES DE UNIDADES)
TABLA 78 MERCADO DE PERCHAS DE INDONESIA, POR APLICACIÓN, 2021-2030 (MILES DE USD)
TABLA 79 MERCADO DE PERCHAS DE INDONESIA, POR APLICACIÓN, 2021-2030 (MILES DE UNIDADES)
TABLA 80 MERCADO DE PERCHAS COMERCIALES DE INDONESIA, POR PRODUCTO, 2021-2030 (MILES DE USD)
TABLA 81 MERCADO DE PERCHAS PARA EL HOGAR EN INDONESIA, POR PRODUCTO, 2021-2030 (MILES DE USD)
TABLA 82 MERCADO DE PERCHAS DE INDONESIA, POR MODO DE VENTA, 2021-2030 (MILES DE USD)
TABLA 83 MERCADO DE PERCHAS DE AUSTRALIA Y NUEVA ZELANDA, POR PRODUCTO, 2021-2030 (MILES DE USD)
TABLA 84 MERCADO DE PERCHAS DE AUSTRALIA Y NUEVA ZELANDA, POR PRODUCTO, 2021-2030 (MILES DE UNIDADES)
TABLA 85 MERCADO DE PERCHAS DE AUSTRALIA Y NUEVA ZELANDA, POR APLICACIÓN, 2021-2030 (MILES DE USD)
TABLA 86 MERCADO DE PERCHAS DE AUSTRALIA Y NUEVA ZELANDA, POR APLICACIÓN, 2021-2030 (MILES DE UNIDADES)
TABLA 87 MERCADO DE PERCHAS COMERCIALES DE AUSTRALIA Y NUEVA ZELANDA, POR PRODUCTO, 2021-2030 (MILES DE USD)
TABLA 88 MERCADO DE PERCHAS PARA EL HOGAR EN AUSTRALIA Y NUEVA ZELANDA, POR PRODUCTO, 2021-2030 (MILES DE USD)
TABLA 89 MERCADO DE PERCHAS DE AUSTRALIA Y NUEVA ZELANDA, POR MODO DE VENTA, 2021-2030 (MILES DE USD)
TABLA 90 MERCADO DE PERCHAS DE FILIPINAS, POR PRODUCTO, 2021-2030 (MILES DE USD)
TABLA 91 MERCADO DE PERCHAS DE FILIPINAS, POR PRODUCTO, 2021-2030 (MILES DE UNIDADES)
TABLA 92 MERCADO DE PERCHAS DE FILIPINAS, POR APLICACIÓN, 2021-2030 (MILES DE USD)
TABLA 93 MERCADO DE PERCHAS DE FILIPINAS, POR APLICACIÓN, 2021-2030 (MILES DE UNIDADES)
TABLA 94 MERCADO DE PERCHAS COMERCIALES DE FILIPINAS, POR PRODUCTO, 2021-2030 (MILES DE USD)
TABLA 95 MERCADO DE PERCHAS PARA EL HOGAR EN FILIPINAS, POR PRODUCTO, 2021-2030 (MILES DE USD)
TABLA 96 MERCADO DE PERCHAS DE FILIPINAS, POR MODO DE VENTA, 2021-2030 (MILES DE USD)
TABLA 97 MERCADO DE PERCHAS DE MALASIA, POR PRODUCTO, 2021-2030 (MILES DE USD)
TABLA 98 MERCADO DE PERCHAS DE MALASIA, POR PRODUCTO, 2021-2030 (MILES DE UNIDADES)
TABLA 99 MERCADO DE PERCHAS DE MALASIA, POR APLICACIÓN, 2021-2030 (MILES DE USD)
TABLA 100 MERCADO DE PERCHAS DE MALASIA, POR APLICACIÓN, 2021-2030 (MILES DE UNIDADES)
TABLA 101 MERCADO DE PERCHAS COMERCIALES DE MALASIA, POR PRODUCTO, 2021-2030 (MILES DE USD)
TABLA 102 MERCADO DE PERCHAS PARA EL HOGAR EN MALASIA, POR PRODUCTO, 2021-2030 (MILES DE USD)
TABLA 103 MERCADO DE PERCHAS DE MALASIA, POR MODO DE VENTA, 2021-2030 (MILES DE USD)
TABLA 104 RESTO DEL MERCADO DE PERCHAS DE ASIA-PACÍFICO, POR PRODUCTO, 2021-2030 (MILES DE USD)
TABLA 105 RESTO DEL MERCADO DE PERCHAS DE ASIA-PACÍFICO, POR PRODUCTO, 2021-2030 (MILES DE UNIDADES)
TABLA 106 MERCADO DE PERCHAS DE AMÉRICA DEL NORTE, POR PAÍS, 2021-2030 (MILES DE USD)
TABLA 107 MERCADO DE PERCHAS DE AMÉRICA DEL NORTE, POR PAÍS, 2021-2030 (MILES DE UNIDADES)
TABLA 108 MERCADO DE PERCHAS DE AMÉRICA DEL NORTE, POR PRODUCTO, 2021-2030 (MILES DE USD)
TABLA 109 MERCADO DE PERCHAS DE AMÉRICA DEL NORTE, POR PRODUCTO, 2021-2030 (MILES DE UNIDADES)
TABLA 110 MERCADO DE PERCHAS DE AMÉRICA DEL NORTE, POR APLICACIÓN, 2021-2030 (MILES DE USD)
TABLA 111 MERCADO DE PERCHAS DE AMÉRICA DEL NORTE, POR APLICACIÓN, 2021-2030 (MILES DE UNIDADES)
TABLA 112 MERCADO DE PERCHAS COMERCIALES DE AMÉRICA DEL NORTE, POR PRODUCTO, 2021-2030 (MILES DE USD)
TABLA 113 MERCADO DE PERCHAS PARA EL HOGAR EN AMÉRICA DEL NORTE, POR PRODUCTO, 2021-2030 (MILES DE USD)
TABLA 114 MERCADO DE PERCHAS DE AMÉRICA DEL NORTE, POR MODO DE VENTA, 2021-2030 (MILES DE USD)
TABLA 115 MERCADO DE PERCHAS DE ESTADOS UNIDOS, POR PRODUCTO, 2021-2030 (MILES DE USD)
TABLA 116 MERCADO DE PERCHAS DE ESTADOS UNIDOS, POR PRODUCTO, 2021-2030 (MILES DE UNIDADES)
TABLA 117 MERCADO DE PERCHAS DE ESTADOS UNIDOS, POR APLICACIÓN, 2021-2030 (MILES DE USD)
TABLA 118 MERCADO DE PERCHAS DE ESTADOS UNIDOS, POR APLICACIÓN, 2021-2030 (MILES DE UNIDADES)
TABLA 119 MERCADO DE PERCHAS COMERCIALES DE EE. UU., POR PRODUCTO, 2021-2030 (MILES DE USD)
TABLA 120 MERCADO DE PERCHAS PARA EL HOGAR EN EE. UU., POR PRODUCTO, 2021-2030 (MILES DE USD)
TABLA 121 MERCADO DE PERCHAS DE ESTADOS UNIDOS, POR MODO DE VENTA, 2021-2030 (MILES DE USD)
TABLA 122 MERCADO DE PERCHAS DE CANADÁ, POR PRODUCTO, 2021-2030 (MILES DE USD)
TABLA 123 MERCADO DE PERCHAS DE CANADÁ, POR PRODUCTO, 2021-2030 (MILES DE UNIDADES)
TABLA 124 MERCADO DE PERCHAS DE CANADÁ, POR APLICACIÓN, 2021-2030 (MILES DE USD)
TABLA 125 MERCADO DE PERCHAS DE CANADÁ, POR APLICACIÓN, 2021-2030 (MILES DE UNIDADES)
TABLA 126 MERCADO DE PERCHAS COMERCIALES DE CANADÁ, POR PRODUCTO, 2021-2030 (MILES DE USD)
TABLA 127 MERCADO DE PERCHAS PARA EL HOGAR EN CANADÁ, POR PRODUCTO, 2021-2030 (MILES DE USD)
TABLA 128 MERCADO DE PERCHAS DE CANADÁ, POR MODO DE VENTA, 2021-2030 (MILES DE USD)
TABLA 129 MERCADO DE PERCHAS EN MÉXICO, POR PRODUCTO, 2021-2030 (MILES DE USD)
TABLA 130 MERCADO DE PERCHAS EN MÉXICO, POR PRODUCTO, 2021-2030 (MILES DE UNIDADES)
TABLA 131 MERCADO DE PERCHAS EN MÉXICO, POR APLICACIÓN, 2021-2030 (MILES DE USD)
TABLA 132 MERCADO DE PERCHAS EN MÉXICO, POR APLICACIÓN, 2021-2030 (MILES DE UNIDADES)
TABLA 133 MERCADO COMERCIAL DE PERCHAS EN MÉXICO, POR PRODUCTO, 2021-2030 (MILES DE USD)
TABLA 134 MERCADO DE PERCHAS PARA EL HOGAR EN MÉXICO, POR PRODUCTO, 2021-2030 (MILES DE USD)
TABLA 135 MERCADO DE PERCHAS EN MÉXICO, POR MODO DE VENTA, 2021-2030 (MILES DE USD)
TABLA 136 MERCADO EUROPEO DE PERCHAS, POR PAÍS, 2021-2030 (MILES DE USD)
TABLA 137 MERCADO EUROPEO DE PERCHAS, POR PAÍS, 2021-2030 (MILES DE UNIDADES)
TABLA 138 MERCADO EUROPEO DE PERCHAS, POR PRODUCTO, 2021-2030 (MILES DE USD)
TABLA 139 MERCADO EUROPEO DE PERCHAS, POR PRODUCTO, 2021-2030 (MILES DE UNIDADES)
TABLA 140 MERCADO EUROPEO DE PERCHAS, POR APLICACIÓN, 2021-2030 (MILES DE USD)
TABLA 141 MERCADO EUROPEO DE PERCHAS, POR APLICACIÓN, 2021-2030 (MILES DE UNIDADES)
TABLA 142 MERCADO EUROPEO DE PERCHAS COMERCIALES, POR PRODUCTO, 2021-2030 (MILES DE USD)
TABLA 143 MERCADO EUROPEO DE PERCHAS PARA EL HOGAR, POR PRODUCTO, 2021-2030 (MILES DE USD)
TABLA 144 MERCADO EUROPEO DE PERCHAS, POR MODO DE VENTA, 2021-2030 (MILES DE USD)
TABLA 145 MERCADO DE PERCHAS DE ALEMANIA, POR PRODUCTO, 2021-2030 (MILES DE USD)
TABLA 146 MERCADO DE PERCHAS DE ALEMANIA, POR PRODUCTO, 2021-2030 (MILES DE UNIDADES)
TABLA 147 MERCADO DE PERCHAS DE ALEMANIA, POR APLICACIÓN, 2021-2030 (MILES DE USD)
TABLA 148 MERCADO DE PERCHAS DE ALEMANIA, POR APLICACIÓN, 2021-2030 (MILES DE UNIDADES)
TABLA 149 MERCADO DE PERCHAS COMERCIALES DE ALEMANIA, POR PRODUCTO, 2021-2030 (MILES DE USD)
TABLA 150 MERCADO DE PERCHAS PARA EL HOGAR EN ALEMANIA, POR PRODUCTO, 2021-2030 (MILES DE USD)
TABLA 151 MERCADO DE PERCHAS DE ALEMANIA, POR MODO DE VENTA, 2021-2030 (MILES DE USD)
TABLA 152 MERCADO DE PERCHAS DEL REINO UNIDO, POR PRODUCTO, 2021-2030 (MILES DE USD)
TABLA 153 MERCADO DE PERCHAS DEL REINO UNIDO, POR PRODUCTO, 2021-2030 (MILES DE UNIDADES)
TABLA 154 MERCADO DE PERCHAS DEL REINO UNIDO, POR APLICACIÓN, 2021-2030 (MILES DE USD)
TABLA 155 MERCADO DE PERCHAS DEL REINO UNIDO, POR APLICACIÓN, 2021-2030 (MILES DE UNIDADES)
TABLA 156 MERCADO DE PERCHAS COMERCIALES DEL REINO UNIDO, POR PRODUCTO, 2021-2030 (MILES DE USD)
TABLA 157 MERCADO DE PERCHAS PARA EL HOGAR EN EL REINO UNIDO, POR PRODUCTO, 2021-2030 (MILES DE USD)
TABLA 158 MERCADO DE PERCHAS DEL REINO UNIDO, POR MODO DE VENTA, 2021-2030 (MILES DE USD)
TABLA 159 MERCADO DE PERCHAS EN FRANCIA, POR PRODUCTO, 2021-2030 (MILES DE USD)
TABLA 160 MERCADO DE PERCHAS EN FRANCIA, POR PRODUCTO, 2021-2030 (MILES DE UNIDADES)
TABLA 161 MERCADO DE PERCHAS EN FRANCIA, POR APLICACIÓN, 2021-2030 (MILES DE USD)
TABLA 162 MERCADO DE PERCHAS EN FRANCIA, POR APLICACIÓN, 2021-2030 (MILES DE UNIDADES)
TABLA 163 MERCADO DE PERCHAS COMERCIALES EN FRANCIA, POR PRODUCTO, 2021-2030 (MILES DE USD)
TABLA 164 MERCADO DE PERCHAS PARA HOGARES EN FRANCIA, POR PRODUCTO, 2021-2030 (MILES DE USD)
TABLA 165 MERCADO DE PERCHAS EN FRANCIA, POR MODO DE VENTA, 2021-2030 (MILES DE USD)
TABLA 166 MERCADO DE PERCHAS EN ITALIA, POR PRODUCTO, 2021-2030 (MILES DE USD)
TABLA 167 MERCADO DE PERCHAS EN ITALIA, POR PRODUCTO, 2021-2030 (MILES DE UNIDADES)
TABLA 168 MERCADO DE PERCHAS EN ITALIA, POR APLICACIÓN, 2021-2030 (MILES DE USD)
TABLA 169 MERCADO DE PERCHAS EN ITALIA, POR APLICACIÓN, 2021-2030 (MILES DE UNIDADES)
TABLA 170 MERCADO DE PERCHAS COMERCIALES EN ITALIA, POR PRODUCTO, 2021-2030 (MILES DE USD)
TABLA 171 MERCADO DE PERCHAS PARA EL HOGAR EN ITALIA, POR PRODUCTO, 2021-2030 (MILES DE USD)
TABLA 172 MERCADO DE PERCHAS EN ITALIA, POR MODO DE VENTA, 2021-2030 (MILES DE USD)
TABLA 173 MERCADO DE PERCHAS EN ESPAÑA, POR PRODUCTO, 2021-2030 (MILES DE USD)
TABLA 174 MERCADO DE PERCHAS EN ESPAÑA, POR PRODUCTO, 2021-2030 (MILES DE UNIDADES)
TABLA 175 MERCADO DE PERCHAS EN ESPAÑA, POR APLICACIÓN, 2021-2030 (MILES DE USD)
TABLA 176 MERCADO DE PERCHAS EN ESPAÑA, POR APLICACIÓN, 2021-2030 (MILES DE UNIDADES)
TABLA 177 MERCADO DE PERCHAS COMERCIALES EN ESPAÑA, POR PRODUCTO, 2021-2030 (MILES DE USD)
TABLA 178 MERCADO DE PERCHAS PARA EL HOGAR EN ESPAÑA, POR PRODUCTO, 2021-2030 (MILES DE USD)
TABLA 179 MERCADO DE PERCHAS EN ESPAÑA, POR MODO DE VENTA, 2021-2030 (MILES DE USD)
TABLA 180 MERCADO DE PERCHAS EN RUSIA, POR PRODUCTO, 2021-2030 (MILES DE USD)
TABLA 181 MERCADO DE PERCHAS DE RUSIA, POR PRODUCTO, 2021-2030 (MILES DE UNIDADES)
TABLA 182 MERCADO DE PERCHAS DE RUSIA, POR APLICACIÓN, 2021-2030 (MILES DE USD)
TABLA 183 MERCADO DE PERCHAS DE RUSIA, POR APLICACIÓN, 2021-2030 (MILES DE UNIDADES)
TABLA 184 MERCADO DE PERCHAS COMERCIALES EN RUSIA, POR PRODUCTO, 2021-2030 (MILES DE USD)
TABLA 185 MERCADO DE PERCHAS PARA EL HOGAR EN RUSIA, POR PRODUCTO, 2021-2030 (MILES DE USD)
TABLA 186 MERCADO DE PERCHAS EN RUSIA, POR MODO DE VENTA, 2021-2030 (MILES DE USD)
TABLA 187 MERCADO DE PERCHAS PARA PAVO, POR PRODUCTO, 2021-2030 (MILES DE USD)
TABLA 188 MERCADO DE PERCHAS PARA PAVOS, POR PRODUCTO, 2021-2030 (MILES DE UNIDADES)
TABLA 189 MERCADO DE PERCHAS PARA PAVOS, POR APLICACIÓN, 2021-2030 (MILES DE USD)
TABLA 190 MERCADO DE PERCHAS PARA PAVOS, POR APLICACIÓN, 2021-2030 (MILES DE UNIDADES)
TABLA 191 MERCADO DE PERCHAS COMERCIALES DE PAVO, POR PRODUCTO, 2021-2030 (MILES DE USD)
TABLA 192 MERCADO DE PERCHAS PARA HOGARES DE TURQUÍA, POR PRODUCTO, 2021-2030 (MILES DE USD)
TABLA 193 MERCADO DE PERCHAS PARA PAVOS, POR MODO DE VENTA, 2021-2030 (MILES DE USD)
TABLA 194 MERCADO DE PERCHAS DE SUIZA, POR PRODUCTO, 2021-2030 (MILES DE USD)
TABLA 195 MERCADO DE PERCHAS DE SUIZA, POR PRODUCTO, 2021-2030 (MILES DE UNIDADES)
TABLA 196 MERCADO DE PERCHAS DE SUIZA, POR APLICACIÓN, 2021-2030 (MILES DE USD)
TABLA 197 MERCADO DE PERCHAS DE SUIZA, POR APLICACIÓN, 2021-2030 (MILES DE UNIDADES)
TABLA 198 MERCADO DE PERCHAS COMERCIALES DE SUIZA, POR PRODUCTO, 2021-2030 (MILES DE USD)
TABLA 199 MERCADO DE PERCHAS PARA EL HOGAR EN SUIZA, POR PRODUCTO, 2021-2030 (MILES DE USD)
TABLA 200 MERCADO DE PERCHAS EN SUIZA, POR MODO DE VENTA, 2021-2030 (MILES DE USD)
TABLA 201 MERCADO DE PERCHAS DE BÉLGICA, POR PRODUCTO, 2021-2030 (MILES DE USD)
TABLA 202 MERCADO DE PERCHAS DE BÉLGICA, POR PRODUCTO, 2021-2030 (MILES DE UNIDADES)
TABLA 203 MERCADO DE PERCHAS DE BÉLGICA, POR APLICACIÓN, 2021-2030 (MILES DE USD)
TABLA 204 MERCADO DE PERCHAS DE BÉLGICA, POR APLICACIÓN, 2021-2030 (MILES DE UNIDADES)
TABLA 205 MERCADO DE PERCHAS COMERCIALES DE BÉLGICA, POR PRODUCTO, 2021-2030 (MILES DE USD)
TABLA 206 MERCADO DE PERCHAS PARA HOGARES EN BÉLGICA, POR PRODUCTO, 2021-2030 (MILES DE USD)
TABLA 207 MERCADO DE PERCHAS DE BÉLGICA, POR MODO DE VENTA, 2021-2030 (MILES DE USD)
TABLA 208 MERCADO DE PERCHAS DE LOS PAÍSES BAJOS, POR PRODUCTO, 2021-2030 (MILES DE USD)
TABLA 209 MERCADO DE PERCHAS DE LOS PAÍSES BAJOS, POR PRODUCTO, 2021-2030 (MILES DE UNIDADES)
TABLA 210 MERCADO DE PERCHAS DE LOS PAÍSES BAJOS, POR APLICACIÓN, 2021-2030 (MILES DE USD)
TABLA 211 MERCADO DE PERCHAS DE LOS PAÍSES BAJOS, POR APLICACIÓN, 2021-2030 (MILES DE UNIDADES)
TABLA 212 MERCADO DE PERCHAS COMERCIALES DE PAÍSES BAJOS, POR PRODUCTO, 2021-2030 (MILES DE USD)
TABLA 213 MERCADO DE PERCHAS PARA EL HOGAR EN LOS PAÍSES BAJOS, POR PRODUCTO, 2021-2030 (MILES DE USD)
TABLA 214 MERCADO DE PERCHAS DE LOS PAÍSES BAJOS, POR MODO DE VENTA, 2021-2030 (MILES DE USD)
TABLA 215 MERCADO DE PERCHAS DEL RESTO DE EUROPA, POR PRODUCTO, 2021-2030 (MILES DE USD)
TABLA 216 MERCADO DE PERCHAS DEL RESTO DE EUROPA, POR PRODUCTO, 2021-2030 (MILES DE UNIDADES)
TABLA 217 MERCADO DE PERCHAS DE AMÉRICA DEL SUR, POR PAÍS, 2021-2030 (MILES DE USD)
TABLA 218 MERCADO DE PERCHAS DE AMÉRICA DEL SUR, POR PAÍS, 2021-2030 (MILES DE UNIDADES)
TABLA 219 MERCADO DE PERCHAS DE AMÉRICA DEL SUR, POR PRODUCTO, 2021-2030 (MILES DE USD)
TABLA 220 MERCADO DE PERCHAS DE AMÉRICA DEL SUR, POR PRODUCTO, 2021-2030 (MILES DE UNIDADES)
TABLA 221 MERCADO DE PERCHAS DE AMÉRICA DEL SUR, POR APLICACIÓN, 2021-2030 (MILES DE USD)
TABLA 222 MERCADO DE PERCHAS DE AMÉRICA DEL SUR, POR APLICACIÓN, 2021-2030 (MILES DE UNIDADES)
TABLA 223 MERCADO DE PERCHAS COMERCIALES DE AMÉRICA DEL SUR, POR PRODUCTO, 2021-2030 (MILES DE USD)
TABLA 224 MERCADO DE PERCHAS PARA EL HOGAR EN AMÉRICA DEL SUR, POR PRODUCTO, 2021-2030 (MILES DE USD)
TABLA 225 MERCADO DE PERCHAS DE AMÉRICA DEL SUR, POR MODO DE VENTA, 2021-2030 (MILES DE USD)
TABLA 226 MERCADO DE PERCHAS DE BRASIL, POR PRODUCTO, 2021-2030 (MILES DE USD)
TABLA 227 MERCADO DE PERCHAS DE BRASIL, POR PRODUCTO, 2021-2030 (MILES DE UNIDADES)
TABLA 228 MERCADO DE PERCHAS DE BRASIL, POR APLICACIÓN, 2021-2030 (MILES DE USD)
TABLA 229 MERCADO DE PERCHAS DE BRASIL, POR APLICACIÓN, 2021-2030 (MILES DE UNIDADES)
TABLA 230 MERCADO COMERCIAL DE PERCHAS DE BRASIL, POR PRODUCTO, 2021-2030 (MILES DE USD)
TABLA 231 MERCADO DE PERCHAS PARA HOGARES EN BRASIL, POR PRODUCTO, 2021-2030 (MILES DE USD)
TABLA 232 MERCADO DE PERCHAS DE BRASIL, POR MODO DE VENTA, 2021-2030 (MILES DE USD)
TABLA 233 MERCADO DE PERCHAS EN ARGENTINA, POR PRODUCTO, 2021-2030 (MILES DE USD)
TABLA 234 MERCADO DE PERCHAS EN ARGENTINA, POR PRODUCTO, 2021-2030 (MILES DE UNIDADES)
TABLA 235 MERCADO DE PERCHAS EN ARGENTINA, POR APLICACIÓN, 2021-2030 (MILES DE USD)
TABLA 236 MERCADO ARGENTINO DE PERCHAS, POR APLICACIÓN, 2021-2030 (MILES DE UNIDADES)
TABLA 237 MERCADO COMERCIAL DE PERCHAS EN ARGENTINA, POR PRODUCTO, 2021-2030 (MILES DE USD)
TABLA 238 MERCADO DE PERCHAS PARA EL HOGAR EN ARGENTINA, POR PRODUCTO, 2021-2030 (MILES DE USD)
TABLA 239 MERCADO DE PERCHAS DE ARGENTINA, POR MODO DE VENTA, 2021-2030 (MILES DE USD)
TABLA 240 RESTO DE SUDAMÉRICA MERCADO DE PERCHAS, POR PRODUCTO, 2021-2030 (MILES DE USD)
TABLA 241 RESTO DE SUDAMÉRICA MERCADO DE PERCHAS, POR PRODUCTO, 2021-2030 (MILES DE UNIDADES)
TABLA 242 MERCADO DE PERCHAS DE ORIENTE MEDIO Y ÁFRICA, POR PAÍS, 2021-2030 (MILES DE USD)
TABLA 243 MERCADO DE PERCHAS DE ORIENTE MEDIO Y ÁFRICA, POR PAÍS, 2021-2030 (MILES DE UNIDADES)
TABLA 244 MERCADO DE PERCHAS DE ORIENTE MEDIO Y ÁFRICA, POR PRODUCTO, 2021-2030 (MILES DE USD)
TABLA 245 MERCADO DE PERCHAS DE ORIENTE MEDIO Y ÁFRICA, POR PRODUCTO, 2021-2030 (MILES DE UNIDADES)
TABLA 246 MERCADO DE PERCHAS DE ORIENTE MEDIO Y ÁFRICA, POR APLICACIÓN, 2021-2030 (MILES DE USD)
TABLA 247 MERCADO DE PERCHAS DE ORIENTE MEDIO Y ÁFRICA, POR APLICACIÓN, 2021-2030 (MILES DE UNIDADES)
TABLA 248 MERCADO DE PERCHAS COMERCIALES DE ORIENTE MEDIO Y ÁFRICA, POR PRODUCTO, 2021-2030 (MILES DE USD)
TABLA 249 MERCADO DE PERCHAS PARA EL HOGAR EN ORIENTE MEDIO Y ÁFRICA, POR PRODUCTO, 2021-2030 (MILES DE USD)
TABLA 250 MERCADO DE PERCHAS DE ORIENTE MEDIO Y ÁFRICA, POR MODO DE VENTA, 2021-2030 (MILES DE USD)
TABLA 251 MERCADO DE PERCHAS DE LOS EMIRATOS ÁRABES UNIDOS, POR PRODUCTO, 2021-2030 (MILES DE USD)
TABLA 252 MERCADO DE PERCHAS DE LOS EMIRATOS ÁRABES UNIDOS, POR PRODUCTO, 2021-2030 (MILES DE UNIDADES)
TABLA 253 MERCADO DE PERCHAS DE LOS EMIRATOS ÁRABES UNIDOS, POR APLICACIÓN, 2021-2030 (MILES DE USD)
TABLA 254 MERCADO DE PERCHAS DE LOS EMIRATOS ÁRABES UNIDOS, POR APLICACIÓN, 2021-2030 (MILES DE UNIDADES)
TABLA 255 MERCADO DE PERCHAS COMERCIALES DE EMIRATOS ÁRABES UNIDOS, POR PRODUCTO, 2021-2030 (MILES DE USD)
TABLA 256 MERCADO DE PERCHAS PARA EL HOGAR EN EMIRATOS ÁRABES UNIDOS, POR PRODUCTO, 2021-2030 (MILES DE USD)
TABLA 257 MERCADO DE PERCHAS DE LOS EMIRATOS ÁRABES UNIDOS, POR MODO DE VENTA, 2021-2030 (MILES DE USD)
TABLA 258 MERCADO DE PERCHAS DE SUDÁFRICA, POR PRODUCTO, 2021-2030 (MILES DE USD)
TABLA 259 MERCADO DE PERCHAS DE SUDÁFRICA, POR PRODUCTO, 2021-2030 (MILES DE UNIDADES)
TABLA 260 MERCADO DE PERCHAS DE SUDÁFRICA, POR APLICACIÓN, 2021-2030 (MILES DE USD)
TABLA 261 MERCADO DE PERCHAS DE SUDÁFRICA, POR APLICACIÓN, 2021-2030 (MILES DE UNIDADES)
TABLA 262 MERCADO DE PERCHAS COMERCIALES DE SUDÁFRICA, POR PRODUCTO, 2021-2030 (MILES DE USD)
TABLA 263 MERCADO DE PERCHAS PARA EL HOGAR EN SUDÁFRICA, POR PRODUCTO, 2021-2030 (MILES DE USD)
TABLA 264 MERCADO DE PERCHAS DE SUDÁFRICA, POR MODO DE VENTA, 2021-2030 (MILES DE USD)
TABLA 265 MERCADO DE PERCHAS DE ARABIA SAUDITA, POR PRODUCTO, 2021-2030 (MILES DE USD)
TABLA 266 MERCADO DE PERCHAS DE ARABIA SAUDITA, POR PRODUCTO, 2021-2030 (MILES DE UNIDADES)
TABLA 267 MERCADO DE PERCHAS DE ARABIA SAUDITA, POR APLICACIÓN, 2021-2030 (MILES DE USD)
TABLA 268 MERCADO DE PERCHAS DE ARABIA SAUDITA, POR APLICACIÓN, 2021-2030 (MILES DE UNIDADES)
TABLA 269 MERCADO DE PERCHAS COMERCIALES DE ARABIA SAUDITA, POR PRODUCTO, 2021-2030 (MILES DE USD)
TABLA 270 MERCADO DE PERCHAS PARA EL HOGAR EN ARABIA SAUDITA, POR PRODUCTO, 2021-2030 (MILES DE USD)
TABLA 271 MERCADO DE PERCHAS DE ARABIA SAUDITA, POR MODO DE VENTA, 2021-2030 (MILES DE USD)
TABLA 272 MERCADO DE PERCHAS DE EGIPTO, POR PRODUCTO, 2021-2030 (MILES DE USD)
TABLA 273 MERCADO DE PERCHAS DE EGIPTO, POR PRODUCTO, 2021-2030 (MILES DE UNIDADES)
TABLA 274 MERCADO DE PERCHAS DE EGIPTO, POR APLICACIÓN, 2021-2030 (MILES DE USD)
TABLA 275 MERCADO DE PERCHAS DE EGIPTO, POR APLICACIÓN, 2021-2030 (MILES DE UNIDADES)
TABLA 276 MERCADO DE PERCHAS COMERCIALES DE EGIPTO, POR PRODUCTO, 2021-2030 (MILES DE USD)
TABLA 277 MERCADO DE PERCHAS PARA EL HOGAR EN EGIPTO, POR PRODUCTO, 2021-2030 (MILES DE USD)
TABLA 278 MERCADO DE PERCHAS DE EGIPTO, POR MODO DE VENTA, 2021-2030 (MILES DE USD)
TABLA 279 MERCADO DE PERCHAS DE ISRAEL, POR PRODUCTO, 2021-2030 (MILES DE USD)
TABLA 280 MERCADO DE PERCHAS DE ISRAEL, POR PRODUCTO, 2021-2030 (MILES DE UNIDADES)
TABLA 281 MERCADO DE PERCHAS DE ISRAEL, POR APLICACIÓN, 2021-2030 (MILES DE USD)
TABLA 282 MERCADO DE PERCHAS DE ISRAEL, POR APLICACIÓN, 2021-2030 (MILES DE UNIDADES)
TABLA 283 MERCADO DE PERCHAS COMERCIALES DE ISRAEL, POR PRODUCTO, 2021-2030 (MILES DE USD)
TABLA 284 MERCADO DE PERCHAS PARA EL HOGAR EN ISRAEL, POR PRODUCTO, 2021-2030 (MILES DE USD)
TABLA 285 MERCADO DE PERCHAS DE ISRAEL, POR MODO DE VENTA, 2021-2030 (MILES DE USD)
TABLA 286 RESTO DEL MERCADO DE PERCHAS DE ORIENTE MEDIO Y ÁFRICA, POR PRODUCTO, 2021-2030 (MILES DE USD)
TABLA 287 RESTO DEL MERCADO DE PERCHAS DE ORIENTE MEDIO Y ÁFRICA, POR PRODUCTO, 2021-2030 (MILES DE UNIDADES)
Lista de figuras
FIGURA 1 MERCADO MUNDIAL DE PERCHAS
FIGURA 2 MERCADO GLOBAL DE PERCHAS: TRIANGULACIÓN DE DATOS
FIGURA 3 MERCADO MUNDIAL DE PERCHAS: ANÁLISIS DROC
FIGURA 4 MERCADO GLOBAL DE PERCHAS: ANÁLISIS DEL MERCADO GLOBAL VS. REGIONAL
FIGURA 5 MERCADO GLOBAL DE PERCHAS: ANÁLISIS DE INVESTIGACIÓN DE LA EMPRESA
FIGURA 6 MERCADO MUNDIAL DE PERCHAS: CURVA DE LA LÍNEA DE VIDA DEL PRODUCTO
FIGURA 7 MERCADO GLOBAL DE PERCHAS: MODELADO MULTIVARIADO
FIGURA 8 MERCADO MUNDIAL DE PERCHAS: DATOS DEMOGRÁFICOS DE LA ENTREVISTA
FIGURA 9 MERCADO GLOBAL DE PERCHAS: CUADRÍCULA DE POSICIÓN DE MERCADO DE DBMR
FIGURA 10 MERCADO GLOBAL DE PERCHAS: CUADRÍCULA DE COBERTURA DE APLICACIONES DEL MERCADO
FIGURA 11 MERCADO GLOBAL DE PERCHAS: LA MATRIZ DE DESAFÍOS DEL MERCADO
FIGURA 12 MERCADO MUNDIAL DE PERCHAS: ANÁLISIS DE LA PARTICIPACIÓN DE LOS PROVEEDORES
FIGURA 13 MERCADO MUNDIAL DE PERCHAS: SEGMENTACIÓN
FIGURA 14 SE ESPERA QUE ASIA-PACÍFICO DOMINE EL MERCADO MUNDIAL DE PERCHAS CON LA CAGR MÁS ALTA EN EL PERÍODO DE PRONÓSTICO
FIGURA 15 EL PRÓSPERO SECTOR DE LA VENTA MINORISTA Y LA HOSTELERÍA CONDUCE A UN CONTINUO IMPULSO DEL MERCADO MUNDIAL DE PERCHAS EN EL PERÍODO DE PRONÓSTICO
FIGURA 16 SE ESPERA QUE EL SEGMENTO DE PERCHAS DE PLÁSTICO REPRESENTE LA MAYOR PARTICIPACIÓN DEL MERCADO MUNDIAL DE PERCHAS EN 2023 Y 2030
FIGURA 17 ASIA-PACÍFICO ES EL MERCADO DE MAYOR CRECIMIENTO PARA LOS FABRICANTES DE PERCHAS EN EL PERÍODO DE PRONÓSTICO
FIGURA 18 MERCADO MUNDIAL DE PERCHAS: TIPOS DE COMPORTAMIENTO DE COMPRA DEL CONSUMIDOR
FIGURA 19 MERCADO MUNDIAL DE PERCHAS: ESCENARIO DE ADOPCIÓN DEL PRODUCTO
FIGURA 20 ESCENARIO DE IMPORTACIÓN Y EXPORTACIÓN (MILES DE USD)
FIGURA 21 IMPULSORES, RESTRICCIONES, OPORTUNIDADES Y DESAFÍOS DEL MERCADO GLOBAL DE PERCHAS
FIGURA 22 MERCADO MUNDIAL DE PERCHAS, POR PRODUCTO, 2022
FIGURA 23 MERCADO MUNDIAL DE PERCHAS, POR APLICACIÓN, 2022
FIGURA 24 MERCADO MUNDIAL DE PERCHAS, POR MODO DE VENTA, 2022
FIGURA 25 MERCADO GLOBAL DE PERCHAS: INSTANTÁNEA (2022)
FIGURA 26 MERCADO MUNDIAL DE PERCHAS: POR REGIÓN (2022)
FIGURA 27 MERCADO MUNDIAL DE PERCHAS: POR REGIÓN (2023 Y 2030)
FIGURA 28 MERCADO MUNDIAL DE PERCHAS: POR REGIÓN (2022 Y 2030)
FIGURA 29 MERCADO MUNDIAL DE PERCHAS: POR PRODUCTO (2023-2030)
FIGURA 30 MERCADO DE PERCHAS DE ASIA-PACÍFICO: INSTANTÁNEA (2022)
FIGURA 31 MERCADO DE PERCHAS DE ASIA-PACÍFICO: POR PAÍS (2022)
FIGURA 32 MERCADO DE PERCHAS DE ASIA-PACÍFICO: POR PAÍS (2023 Y 2030)
FIGURA 33 MERCADO DE PERCHAS DE ASIA-PACÍFICO: POR PAÍS (2022 Y 2030)
FIGURA 34 MERCADO DE PERCHAS DE ASIA-PACÍFICO: POR PRODUCTO (2023-2030)
FIGURA 35 MERCADO DE PERCHAS DE AMÉRICA DEL NORTE: UNA INSTANTÁNEA (2022)
FIGURA 36 MERCADO DE PERCHAS DE AMÉRICA DEL NORTE: POR PAÍS (2022)
FIGURA 37 MERCADO DE PERCHAS DE AMÉRICA DEL NORTE: POR PAÍS (2023 Y 2030)
FIGURA 38 MERCADO DE PERCHAS DE AMÉRICA DEL NORTE: POR PAÍS (2022 Y 2030)
FIGURA 39 MERCADO DE PERCHAS DE AMÉRICA DEL NORTE: POR PRODUCTO (2023-2030)
FIGURA 40 MERCADO EUROPEO DE PERCHAS: UNA INSTANTÁNEA (2022)
FIGURA 41 MERCADO EUROPEO DE PERCHAS: POR PAÍS (2022)
FIGURA 42 MERCADO EUROPEO DE PERCHAS: POR PAÍS (2023 Y 2030)
FIGURA 43 MERCADO EUROPEO DE PERCHAS: POR PAÍS (2022 Y 2030)
FIGURA 44 MERCADO EUROPEO DE PERCHAS: POR PRODUCTO (2023 - 2030)
FIGURA 45 MERCADO DE PERCHAS DE AMÉRICA DEL SUR: UNA INSTANTÁNEA (2022)
FIGURA 46 MERCADO DE PERCHAS DE AMÉRICA DEL SUR: POR PAÍS (2022)
FIGURA 47 MERCADO DE PERCHAS DE AMÉRICA DEL SUR: POR PAÍS (2023 Y 2030)
FIGURA 48 MERCADO DE PERCHAS EN AMÉRICA DEL SUR: POR PAÍS (2022 Y 2030)
FIGURA 49 MERCADO DE PERCHAS DE AMÉRICA DEL SUR: POR PRODUCTO (2023 - 2030)
FIGURA 50 MERCADO DE PERCHAS DE ORIENTE MEDIO Y ÁFRICA: INSTANTÁNEA (2022)
FIGURA 51 MERCADO DE PERCHAS DE ORIENTE MEDIO Y ÁFRICA: POR PAÍS (2022)
FIGURA 52 MERCADO DE PERCHAS DE ORIENTE MEDIO Y ÁFRICA: POR PAÍS (2023 Y 2030)
FIGURA 53 MERCADO DE PERCHAS DE ORIENTE MEDIO Y ÁFRICA: POR PAÍS (2022 Y 2030)
FIGURA 54 MERCADO DE PERCHAS DE ORIENTE MEDIO Y ÁFRICA: POR PRODUCTO (2023-2030)
FIGURA 55 MERCADO MUNDIAL DE PERCHAS: PARTICIPACIÓN DE LA EMPRESA 2022 (%)
FIGURA 56 MERCADO DE PERCHAS DE AMÉRICA DEL NORTE: PARTICIPACIÓN DE LA EMPRESA 2022 (%)
FIGURA 57 MERCADO EUROPEO DE PERCHAS: CUOTA DE LA EMPRESA 2022 (%)
FIGURA 58 MERCADO DE PERCHAS DE ASIA-PACÍFICO: PARTICIPACIÓN DE LA EMPRESA 2022 (%)
Metodología de investigación
La recopilación de datos y el análisis del año base se realizan utilizando módulos de recopilación de datos con muestras de gran tamaño. La etapa incluye la obtención de información de mercado o datos relacionados a través de varias fuentes y estrategias. Incluye el examen y la planificación de todos los datos adquiridos del pasado con antelación. Asimismo, abarca el examen de las inconsistencias de información observadas en diferentes fuentes de información. Los datos de mercado se analizan y estiman utilizando modelos estadísticos y coherentes de mercado. Además, el análisis de la participación de mercado y el análisis de tendencias clave son los principales factores de éxito en el informe de mercado. Para obtener más información, solicite una llamada de un analista o envíe su consulta.
La metodología de investigación clave utilizada por el equipo de investigación de DBMR es la triangulación de datos, que implica la extracción de datos, el análisis del impacto de las variables de datos en el mercado y la validación primaria (experto en la industria). Los modelos de datos incluyen cuadrícula de posicionamiento de proveedores, análisis de línea de tiempo de mercado, descripción general y guía del mercado, cuadrícula de posicionamiento de la empresa, análisis de patentes, análisis de precios, análisis de participación de mercado de la empresa, estándares de medición, análisis global versus regional y de participación de proveedores. Para obtener más información sobre la metodología de investigación, envíe una consulta para hablar con nuestros expertos de la industria.
Personalización disponible
Data Bridge Market Research es líder en investigación formativa avanzada. Nos enorgullecemos de brindar servicios a nuestros clientes existentes y nuevos con datos y análisis que coinciden y se adaptan a sus objetivos. El informe se puede personalizar para incluir análisis de tendencias de precios de marcas objetivo, comprensión del mercado de países adicionales (solicite la lista de países), datos de resultados de ensayos clínicos, revisión de literatura, análisis de mercado renovado y base de productos. El análisis de mercado de competidores objetivo se puede analizar desde análisis basados en tecnología hasta estrategias de cartera de mercado. Podemos agregar tantos competidores sobre los que necesite datos en el formato y estilo de datos que esté buscando. Nuestro equipo de analistas también puede proporcionarle datos en archivos de Excel sin procesar, tablas dinámicas (libro de datos) o puede ayudarlo a crear presentaciones a partir de los conjuntos de datos disponibles en el informe.

