Global Lymphedema Treatment Market
Tamaño del mercado en miles de millones de dólares
Tasa de crecimiento anual compuesta (CAGR) :
% 
 USD
1.05 Billion
USD
2.30 Billion
2024
2032
USD
1.05 Billion
USD
2.30 Billion
2024
2032
| 2025 –2032 | |
| USD 1.05 Billion | |
| USD 2.30 Billion | |
| % | |
|
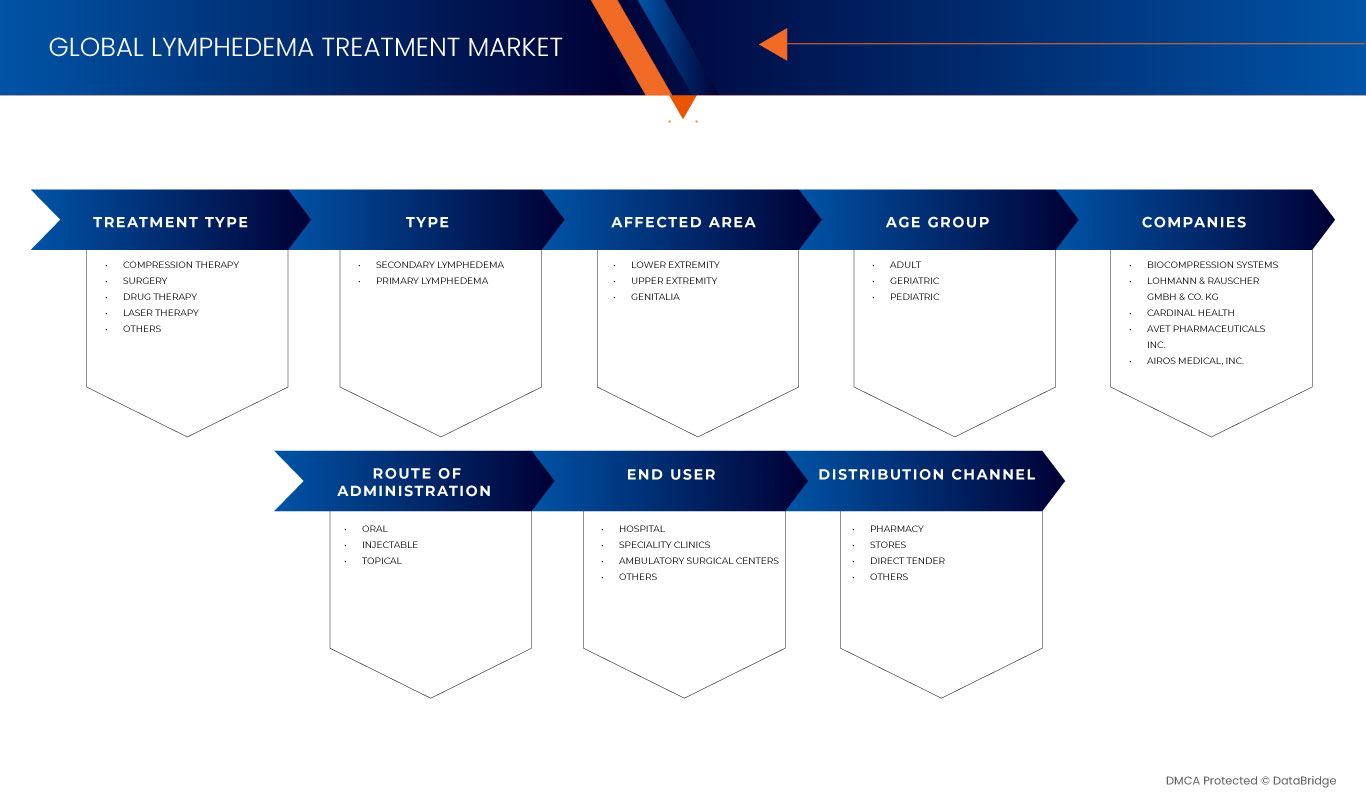
Segmentación del mercado global de tratamiento del linfedema, por tipo de tratamiento (terapia de compresión, cirugía, farmacoterapia, terapia con láser y otros), tipo (linfedema secundario y linfedema primario), área afectada (extremidad inferior, extremidad superior y genitales), grupo de edad (adulto, geriátrico y pediátrico), vía de administración (oral, inyectable y tópica), usuario final (hospital, clínicas especializadas, centros quirúrgicos ambulatorios y otros), canal de distribución (farmacia, tiendas, licitación directa y otros), tendencias de la industria y pronóstico hasta 2032
Tamaño del mercado de tratamiento del linfedema
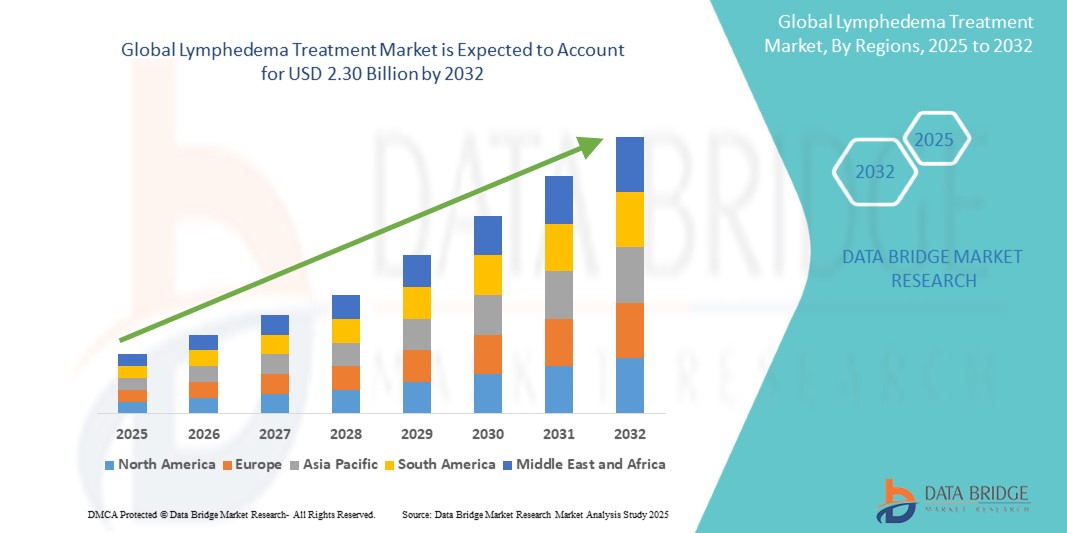
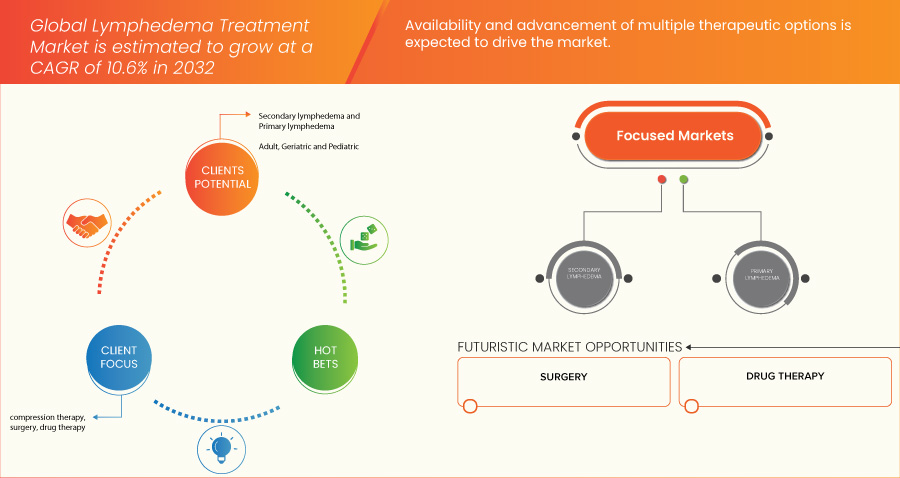
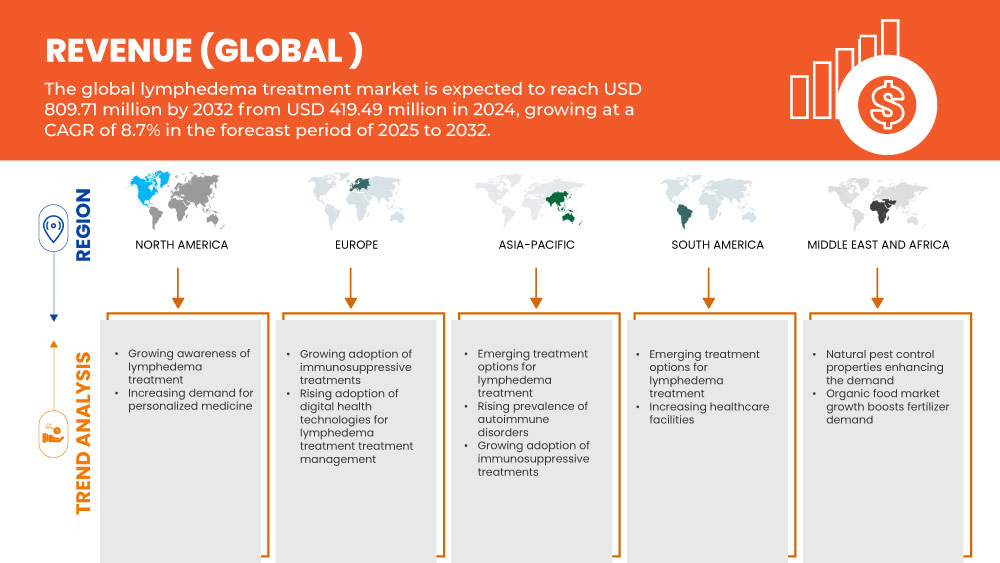
- El tamaño del mercado mundial de tratamiento del linfedema se valoró en USD 1.050 millones en 2024 y se espera que alcance los USD 2.300 millones para 2032 , con una CAGR del 10,6 % durante el período de pronóstico.
- El crecimiento del mercado está impulsado en gran medida por la creciente prevalencia mundial del linfedema y el linfedema relacionado con el cáncer, junto con importantes avances tecnológicos en las modalidades de diagnóstico por imágenes y enfoques de tratamiento innovadores, lo que conduce a una mejor identificación y gestión de la afección.
- Además, la creciente demanda de pacientes y profesionales clínicos de soluciones más efectivas, accesibles e integradas para el manejo de la inflamación crónica y la mejora de la calidad de vida está consolidando las terapias de compresión avanzadas, las técnicas de drenaje linfático y las intervenciones microquirúrgicas como el estándar moderno para el tratamiento del linfedema. Estos factores convergentes están acelerando la adopción de soluciones para el manejo del linfedema, impulsando así significativamente el crecimiento de la industria.
Análisis del mercado del tratamiento del linfedema
- El linfedema, caracterizado por la hinchazón crónica causada por un deterioro del funcionamiento del sistema linfático, es un área de enfoque cada vez más vital en la atención médica moderna debido a su impacto significativo en la calidad de vida del paciente, y a menudo surge como una complicación del tratamiento del cáncer o predisposiciones genéticas.
- La creciente demanda de tratamientos para el linfedema se ve impulsada principalmente por la creciente prevalencia mundial del linfedema y del linfedema relacionado con el cáncer, la creciente conciencia entre los profesionales de la salud y los pacientes, y los continuos avances tecnológicos en las modalidades de diagnóstico y terapéuticas.
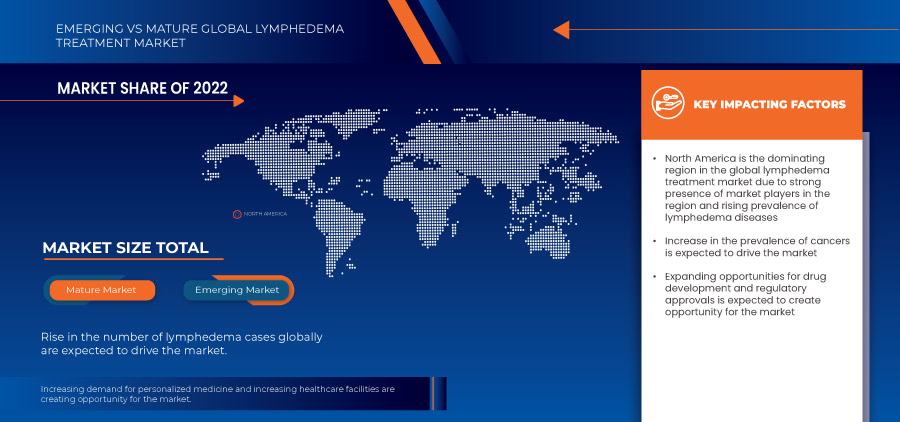
- América del Norte dominó el mercado mundial de tratamiento del linfedema, representando una participación sustancial en los ingresos del 53,30 % en 2024, caracterizado por una alta carga de incidencia de cáncer, una infraestructura de atención médica bien establecida, altos ingresos disponibles y la fuerte presencia de actores clave de la industria, con EE. UU. experimentando un crecimiento significativo impulsado por herramientas de diagnóstico avanzadas y programas de concientización crecientes.
- Se espera que Asia-Pacífico sea la región de más rápido crecimiento en el mercado del linfedema durante el período de pronóstico debido al aumento del gasto en atención médica, una población de pacientes grande y envejecida, la creciente conciencia sobre el diagnóstico y el tratamiento tempranos y la mejora del acceso a la atención médica en economías emergentes como China e India.
- El segmento de terapia de compresión dominó el mercado de tratamiento del linfedema en 2024, impulsado por su reputación establecida como el tratamiento de primera línea y más común para controlar la hinchazón, su naturaleza no invasiva y las innovaciones continuas en prendas y dispositivos de compresión que ofrecen mayor comodidad y eficacia.
Alcance del informe y segmentación del mercado de tratamiento del linfedema
|
Atributos |
Perspectivas clave del mercado del tratamiento del linfedema |
|
Segmentos cubiertos |
|
|
Países cubiertos |
América del norte
Europa
Asia-Pacífico
Oriente Medio y África
Sudamerica
|
|
Actores clave del mercado |
|
|
Oportunidades de mercado |
|
|
Conjuntos de información de datos de valor añadido |
Además de los conocimientos sobre escenarios de mercado, como valor de mercado, tasa de crecimiento, segmentación, cobertura geográfica y actores principales, los informes de mercado seleccionados por Data Bridge Market Research también incluyen análisis en profundidad de expertos, análisis de precios, análisis de participación de marca, encuesta de consumidores, análisis demográfico, análisis de la cadena de suministro, análisis de la cadena de valor, descripción general de materias primas/consumibles, criterios de selección de proveedores, análisis PESTLE, análisis de Porter y marco regulatorio. |
Tendencias del mercado del tratamiento del linfedema
Atención al paciente mejorada mediante IA e integración digital
- Una tendencia significativa y en auge en el mercado global del linfedema es la creciente integración con la inteligencia artificial (IA) y las plataformas de salud digital, que abarcan la monitorización remota, algoritmos de tratamiento personalizados y soluciones de telesalud. Esta fusión de tecnologías está mejorando significativamente la comodidad del paciente, la adherencia al tratamiento y el manejo integral de su enfermedad crónica.
- Por ejemplo, en noviembre de 2014, según la Sociedad Estadounidense del Cáncer, más de 4 millones de sobrevivientes de cáncer de mama vivían en los EE. UU., con un estimado de 20 a 40 % en riesgo de desarrollar linfedema después del tratamiento, lo que destaca un segmento crítico de pacientes que impulsa la demanda de soluciones de manejo del linfedema a largo plazo.
- La integración de la IA en la atención del linfedema permite funciones como el análisis de amplios datos de pacientes para predecir posibles brotes, optimizar la presión de las prendas de compresión según las respuestas individuales y proporcionar alertas más inteligentes para una intervención temprana. Por ejemplo, se están explorando soluciones emergentes basadas en IA para mejorar la precisión de la detección temprana del linfedema mediante el análisis de datos de imágenes y para guiar a los pacientes mediante ejercicios de rehabilitación personalizados. Además, las plataformas digitales con capacidades de comunicación integradas ofrecen a los pacientes la facilidad de las consultas virtuales, permitiéndoles hablar sobre los síntomas y recibir orientación a distancia.
- La integración fluida de los dispositivos de monitorización del linfedema y las herramientas de autogestión con ecosistemas de salud digital más amplios facilita el control centralizado de diversos aspectos de la atención del paciente. A través de una única interfaz, los usuarios pueden gestionar las medidas de sus extremidades, la adherencia al tratamiento y comunicarse con su equipo de atención, creando una experiencia de gestión de la salud unificada y más proactiva.
- Esta tendencia hacia sistemas de gestión del linfedema más inteligentes, intuitivos e interconectados está transformando radicalmente las expectativas de los pacientes respecto al cuidado de las enfermedades crónicas. En consecuencia, las empresas están desarrollando herramientas de diagnóstico basadas en IA y plataformas digitales con funciones como análisis automatizado de datos, alertas personalizadas y ajustes remotos de la terapia.
- La demanda de soluciones para el linfedema que ofrezcan una integración digital e IA perfecta está creciendo rápidamente en los entornos de atención médica y los grupos demográficos de los pacientes, ya que tanto los médicos como los pacientes priorizan cada vez más el manejo eficaz, conveniente e integral de esta afección de por vida.
Dinámica del mercado del tratamiento del linfedema
Conductor
Necesidad creciente debido a la creciente prevalencia de enfermedades y las capacidades de diagnóstico mejoradas
- La creciente prevalencia mundial del linfedema, en particular el linfedema secundario resultante de los tratamientos contra el cáncer, junto con los avances acelerados en las tecnologías de diagnóstico y la creciente concienciación, es un impulsor importante de la mayor demanda de soluciones para el tratamiento del linfedema.
- Por ejemplo, en abril de 2020, un artículo publicado por ResearchGate GmbH indicó que la prevalencia combinada de linfedema de brazo era del 27 %, con una heterogeneidad considerable. La incidencia combinada de linfedema de brazo era del 21 %, también con una heterogeneidad considerable. Existía evidencia de que un índice de masa corporal (> 25) se asociaba con un mayor riesgo de linfedema de brazo.
- A medida que los profesionales de la salud y los pacientes se vuelven más conscientes de las implicaciones a largo plazo del linfedema no tratado y buscan una intervención más temprana, las herramientas de diagnóstico avanzadas como la espectroscopia de bioimpedancia (BIS) y las imágenes sofisticadas (por ejemplo, la linfografía ICG) ofrecen mediciones precisas y detección temprana, lo que proporciona una ventaja convincente sobre las mediciones con cinta tradicionales.
- Además, el enfoque creciente en la atención centrada en el paciente y el deseo de una mejor calidad de vida para quienes viven con enfermedades crónicas están haciendo que el tratamiento integral del linfedema sea un componente integral de la atención poscáncer y el manejo de enfermedades crónicas, ofreciendo una integración perfecta con programas de rehabilitación y terapias de apoyo.
- La comodidad del diagnóstico temprano, los planes de tratamiento personalizados que facilitan las herramientas de salud digital y la capacidad de autocontrolar los síntomas mediante regímenes avanzados de compresión y ejercicio son factores clave que impulsan la adopción de soluciones para el linfedema tanto en entornos clínicos como domiciliarios. La tendencia hacia la detección proactiva y la creciente disponibilidad de productos de autocontrol fáciles de usar contribuyen aún más al crecimiento del mercado.
Restricción/Desafío
Preocupaciones sobre el infradiagnóstico y los altos costos del tratamiento
- La preocupación por el infradiagnóstico generalizado y el diagnóstico erróneo del linfedema, sumada a la considerable carga financiera que supone el tratamiento continuo, supone un reto considerable para una mayor penetración en el mercado y una atención eficaz al paciente. Dado que el linfedema suele presentarse de forma sutil en las primeras etapas y a menudo es pasado por alto por los profesionales sanitarios, esto conlleva un retraso en la intervención y la progresión de la enfermedad, lo que genera ansiedad en los pacientes sobre sus consecuencias a largo plazo.
- Por ejemplo, en Australia, el costo financiero promedio de bolsillo para la atención del linfedema asumido por las mujeres fue de 977 dólares australianos por año, variando desde 207 dólares australianos para el linfedema subclínico hasta más de 1400 dólares australianos para el linfedema moderado o severo.
- Abordar estas preocupaciones sobre el infradiagnóstico mediante una mejor educación médica, protocolos de detección estandarizados y campañas de concienciación pública es crucial para mejorar los resultados de los pacientes. Organizaciones como la Red de Educación e Investigación Linfática (LE&RN) y la Red Nacional de Linfedema (NLN) enfatizan sus iniciativas de defensa y educación para mejorar la detección temprana y la atención. Además, el costo relativamente alto y continuo de las prendas de compresión especializadas, las bombas neumáticas y la terapia de drenaje linfático manual puede ser un obstáculo importante para el tratamiento consistente para los consumidores sensibles a los precios, especialmente en regiones con cobertura de seguro limitada o para pacientes con dificultades económicas. Si bien las iniciativas legislativas recientes, como la Ley de Tratamiento del Linfedema en EE. UU., buscan mejorar el reembolso de algunos artículos, los gastos de bolsillo para el tratamiento de por vida siguen siendo considerables.
- Si bien la concientización está aumentando gradualmente, la percepción de falta de una "cura" y la naturaleza crónica de la enfermedad aún pueden obstaculizar el tratamiento proactivo, especialmente para aquellos que no tienen una cobertura de seguro adecuada o acceso a atención especializada.
- Superar estos desafíos a través de mejores iniciativas educativas para los proveedores de atención médica y el público, mejorando las políticas de reembolso de seguros y el desarrollo de opciones de tratamiento del linfedema más asequibles y accesibles será vital para el crecimiento sostenido del mercado y la mejora de la calidad de vida de millones de personas afectadas por el linfedema.

Alcance del mercado del tratamiento del linfedema
El mercado global de tratamiento del linfedema se clasifica en siete segmentos notables que se basan en el tipo de tratamiento, tipo, área afectada, grupo etario, vía de administración, usuario final y canal de distribución.
Por tipo de tratamiento
Según el tipo de tratamiento, el mercado del linfedema se segmenta en terapia de compresión, procedimientos quirúrgicos, farmacoterapia, drenaje linfático manual y otros (p. ej., terapia láser, fisioterapia). El segmento de la terapia de compresión domina la mayor cuota de mercado (se estima que superará el 68,04 % en 2025 para el mercado de la terapia de compresión, donde el linfedema es una aplicación importante), gracias a su sólida reputación como el tratamiento de referencia para el linfedema y a su naturaleza no invasiva, lo que la hace accesible para una amplia gama de pacientes. Los pacientes suelen priorizar la terapia de compresión por su eficacia para reducir la inflamación y mejorar la comodidad. El mercado también registra una fuerte demanda de prendas y bombas de compresión debido a los continuos avances en materiales y diseños, que mejoran la comodidad y la adherencia.
Se prevé que el segmento de procedimientos quirúrgicos experimente el mayor crecimiento durante el período de pronóstico, impulsado por los crecientes avances en técnicas microquirúrgicas como la anastomosis linfovenosa (LVA) y la transferencia de ganglios linfáticos vascularizados (VLNT), y la creciente concienciación de los pacientes sobre estas opciones potencialmente curativas en casos graves. Las intervenciones quirúrgicas ofrecen la posibilidad de una reducción significativa del volumen de las extremidades a largo plazo, lo que las hace adecuadas para pacientes que no responden a los tratamientos conservadores. El creciente número de centros quirúrgicos especializados en linfedema y el creciente reconocimiento de su eficacia también contribuyen a su creciente popularidad.
Por tipo
Según el tipo, el mercado global de tratamiento del linfedema se segmenta en linfedema primario y linfedema secundario. El segmento de linfedema secundario domina la mayor cuota de mercado en ingresos, con un 79,26 % en 2025, debido a su prevalencia significativamente mayor a nivel mundial, atribuida en gran medida a tratamientos oncológicos como la disección de ganglios linfáticos y la radioterapia. Los profesionales sanitarios y los pacientes suelen priorizar el tratamiento del linfedema secundario debido a su asociación con intervenciones oncológicas que salvan vidas y a su inicio más fácil de identificar. El mercado también observa una fuerte demanda de soluciones dirigidas al linfedema secundario debido al aumento de las tasas de supervivencia al cáncer y a una mayor concienciación sobre sus complicaciones posteriores al tratamiento.
Se prevé que el segmento del linfedema primario experimente un crecimiento más rápido durante el período de pronóstico, impulsado por una mayor concienciación y capacidad de diagnóstico para esta afección, a menudo hereditaria y de inicio temprano, junto con los avances en las pruebas genéticas y la atención especializada del linfedema pediátrico. Una mayor comprensión de las mutaciones genéticas asociadas al linfedema primario está llevando a un diagnóstico e intervención más tempranos. El creciente enfoque en las enfermedades raras y el desarrollo de clínicas especializadas también contribuyen a la creciente demanda de atención y tratamiento para el linfedema primario.
Por zona afectada
Según la zona afectada, el mercado global de tratamiento del linfedema se segmenta en extremidades inferiores, extremidades superiores, cabeza y cuello, genitales y otros (p. ej., tronco, mama). El segmento de extremidades inferiores domina la mayor cuota de mercado en ingresos, con un 53,61 % en 2025, impulsado por la mayor incidencia de linfedema en las piernas, frecuentemente relacionado con afecciones como la insuficiencia venosa crónica, la obesidad y los tratamientos para el cáncer ginecológico o de próstata. Los pacientes con linfedema en las extremidades inferiores suelen buscar tratamiento debido a problemas de movilidad y molestias importantes. El mercado también observa una fuerte demanda de soluciones para el linfedema en las extremidades inferiores debido a la gran cantidad de pacientes y al continuo desarrollo de prendas y dispositivos de compresión especializados para piernas.
Se prevé un crecimiento significativo del segmento de extremidades superiores durante el período de pronóstico, impulsado por el creciente número de sobrevivientes de cáncer de mama, un importante factor de riesgo para el linfedema de extremidades superiores tras la disección de ganglios linfáticos axilares y la radioterapia. La mayor concienciación entre los pacientes oncológicos y los profesionales de la salud sobre la detección e intervención temprana del linfedema de brazo impulsa la demanda de soluciones personalizadas. El desarrollo de mangas de brazo especializadas y dispositivos de compresión neumática diseñados para la extremidad superior también contribuye a su creciente presencia en el mercado.
Por grupo de edad
Según el grupo de edad, el mercado mundial de tratamiento del linfedema se segmenta en adultos, geriátrico y pediátrico. El segmento adulto domina la mayor cuota de mercado, representando a menudo el 51,72 % del mercado en 2025, impulsado por la mayor incidencia de linfedema secundario relacionado con tratamientos oncológicos, que son más prevalentes en la población adulta, así como por factores relacionados con la edad que contribuyen a la disfunción linfática. Los pacientes adultos suelen constituir el mayor grupo demográfico que busca tratamiento para el linfedema debido a diversas causas adquiridas. El mercado también observa una fuerte demanda de soluciones específicas para adultos debido a la amplia base de pacientes existente y al desarrollo de una amplia gama de productos adaptados a ellos.
Se prevé que el segmento geriátrico experimente la tasa de crecimiento más rápida, con una tasa de crecimiento anual compuesta (TCAC) del 10,1 %, impulsada por el aumento global de la población envejecida, que es más susceptible al deterioro linfático relacionado con la edad, a comorbilidades como la insuficiencia venosa crónica y a afecciones que requieren tratamiento y que derivan en linfedema. A medida que aumenta la esperanza de vida, también aumenta la carga de enfermedades crónicas, incluido el linfedema, en los adultos mayores. El creciente enfoque en mejorar la calidad de vida de las personas mayores y los avances en el manejo de afecciones linfáticas complejas en este grupo demográfico también contribuyen a su crecimiento acelerado.
Por vía de administración
Según la vía de administración, el mercado global del tratamiento del linfedema, en particular las intervenciones farmacológicas, se segmenta en oral, inyectable y tópico. El segmento oral suele tener una cuota de mercado significativa, por ejemplo, alrededor del 52,47 % en 2025 según algunos análisis regionales, gracias a la comodidad del uso en casa de medicamentos de apoyo (p. ej., diuréticos para el control de los síntomas, antibióticos para la prevención de la celulitis), antiinflamatorios o terapias orales emergentes que se están investigando para la función linfática. Los pacientes suelen preferir los medicamentos orales por su facilidad de autoadministración y adherencia fuera del ámbito clínico. El mercado también observa una demanda de formulaciones orales debido a su accesibilidad e integración en la rutina diaria.
Se prevé que el segmento de inyectables experimente la tasa de crecimiento más rápida, con una tasa de crecimiento anual compuesta (TCAC) del 9,31 %, impulsada por la investigación y el desarrollo continuos de nuevas terapias biológicas, factores de crecimiento o terapias génicas que requieren administración parenteral para estimular la regeneración linfática o reducir la inflamación. Si bien actualmente se trata de un segmento más pequeño, el potencial de tratamientos dirigidos y modificadores de la enfermedad administrados mediante inyección, especialmente en casos graves o refractarios, está impulsando una inversión significativa. Los avances en los sistemas de administración de fármacos y la promesa de efectos terapéuticos más directos también contribuyen a su rápida expansión prevista.
Por el usuario final
En función del usuario final, el mercado del tratamiento del linfedema se segmenta en hospitales, clínicas especializadas, centros de cirugía ambulatoria (CAA) y otros. Se espera que el segmento hospitalario posea la mayor cuota de mercado. Este predominio se atribuye a la capacidad del hospital para ofrecer una gama completa de opciones de tratamiento para el linfedema, desde terapias conservadoras en etapas tempranas, como el drenaje linfático manual y la terapia compresiva, hasta procedimientos quirúrgicos avanzados, como la anastomosis linfovenosa y la transferencia de ganglios linfáticos vascularizados. Los hospitales también sirven como punto de referencia principal para casos complicados o en etapas avanzadas, que requieren atención multidisciplinaria, que incluye imágenes, diagnóstico e intervención quirúrgica.
Se prevé que el segmento de clínicas especializadas experimente el mayor crecimiento durante el período de pronóstico. Este crecimiento se debe al creciente número de centros de rehabilitación y atención ambulatoria especializados en linfedema, que ofrecen terapias no invasivas y control de enfermedades crónicas. Estas clínicas atienden especialmente a pacientes con linfedema leve a moderado que requieren sesiones de terapia regulares, lo que las convierte en alternativas rentables y convenientes a las visitas hospitalarias. Su auge se ve impulsado por las crecientes campañas de concienciación e iniciativas gubernamentales para el control del edema crónico, especialmente en entornos urbanos.
Por canal de distribución
Según el canal de distribución, el mercado global del tratamiento del linfedema se segmenta en farmacias, tiendas, licitación directa, etc. Se prevé que el segmento de licitación directa domine el mercado. Esto se debe principalmente a la adquisición masiva de dispositivos médicos, como bombas de compresión, prendas y kits quirúrgicos, por parte de hospitales públicos, centros de rehabilitación y organismos gubernamentales de salud. Los canales de licitación directa garantizan procesos de adquisición optimizados, el cumplimiento de las normas regulatorias y precios preferenciales, lo que los convierte en la opción preferida de los grandes compradores institucionales.
Se prevé que el segmento de tiendas físicas, que incluye tanto los canales minoristas como los online, sea el de mayor crecimiento durante el período de pronóstico. Esta rápida expansión se atribuye a un cambio en el comportamiento de los pacientes hacia el tratamiento del linfedema en casa, especialmente tras la COVID-19. La comodidad de las compras online, la creciente penetración del comercio electrónico y la disponibilidad de dispositivos de autogestión, como mangas y vendajes de compresión, han acelerado el crecimiento del segmento. Además, el auge de los servicios de telesalud ha permitido a los pacientes gestionar el linfedema en fase inicial en casa, aumentando la dependencia de los tratamientos de venta libre y online.
Análisis regional del mercado del tratamiento del linfedema
- Se espera que América del Norte domine el mercado mundial de tratamiento del linfedema con la mayor participación en los ingresos, que a menudo rondará el 53,56 % en 2025, impulsada por una alta prevalencia de casos de linfedema (en particular, linfedema relacionado con el cáncer), una sólida infraestructura de atención médica e importantes inversiones en investigación y desarrollo médico.
- Los proveedores de atención médica y los pacientes de la región valoran enormemente las herramientas de diagnóstico avanzadas disponibles, las opciones de tratamiento integrales y las campañas de concientización crecientes que ofrecen las clínicas y hospitales especializados.
- Esta adopción generalizada se ve respaldada además por los altos ingresos disponibles, la fuerte penetración del seguro de salud y un enfoque proactivo para el manejo de enfermedades crónicas, estableciendo el cuidado del linfedema como una parte integrada de las vías de atención de los pacientes, tanto para los sobrevivientes de cáncer como para aquellos con otros trastornos linfáticos.
Perspectiva del mercado estadounidense de tratamiento del linfedema
El mercado estadounidense del linfedema captó una importante cuota de ingresos en Norteamérica, representando con frecuencia más del 92,24 % en 2024, impulsado por la rápida adopción de herramientas de diagnóstico avanzadas y la creciente tendencia hacia la atención integral del linfedema. Los profesionales sanitarios y los pacientes priorizan cada vez más la detección temprana y el tratamiento eficaz del linfedema mediante protocolos de tratamiento integrales. El creciente reconocimiento de la afección entre los profesionales clínicos, sumado a la sólida demanda de terapias de compresión especializadas, bombas neumáticas y monitorización digital de la salud , impulsa aún más la industria del linfedema.
Además, la creciente integración de políticas de apoyo como la Ley de Tratamiento del Linfedema, junto con los avances tecnológicos en espectroscopia de bioimpedancia (BIS) y plataformas de monitoreo remoto de pacientes, está contribuyendo significativamente a la expansión del mercado, mejorando el acceso de los pacientes y la adherencia a la atención a largo plazo.
Perspectivas del mercado europeo del tratamiento del linfedema
Se proyecta que el mercado europeo del linfedema se expanda a una tasa de crecimiento anual compuesta (TCAC) sustancial de aproximadamente el 9,1 % durante el período de pronóstico, impulsado principalmente por la creciente prevalencia del linfedema, las estrictas directrices sanitarias que promueven el diagnóstico precoz y la creciente necesidad de un tratamiento integral del paciente en los sistemas nacionales de salud. Esta mayor concienciación, sumada a la demanda de dispositivos diagnósticos y terapéuticos avanzados y no invasivos, está impulsando la adopción de soluciones para el linfedema. Los sistemas sanitarios europeos y los pacientes también se ven atraídos por el énfasis en las vías de atención integradas y la educación del paciente que ofrecen estas estrategias de tratamiento. La región está experimentando un crecimiento significativo en hospitales, clínicas especializadas y atención domiciliaria, con la incorporación de tratamientos para el linfedema tanto en protocolos de atención consolidados como en centros especializados emergentes.
Perspectivas del mercado del tratamiento del linfedema en el Reino Unido
Se prevé que el mercado del linfedema en el Reino Unido crezca a una notable tasa de crecimiento anual compuesto (TCAC) de aproximadamente el 10,60 % durante el período de pronóstico, impulsado por la creciente prevalencia de casos de linfedema, en particular después del tratamiento oncológico, y el deseo de mejorar los resultados y la calidad de vida de los pacientes. Además, la creciente concienciación tanto de pacientes como de profesionales sanitarios sobre el diagnóstico y el tratamiento tempranos está fomentando la demanda de servicios especializados para el linfedema. Se espera que las iniciativas del Servicio Nacional de Salud (NHS) del Reino Unido centradas en el tratamiento de enfermedades crónicas, junto con la investigación y el desarrollo en curso en el cuidado linfático, sigan impulsando el crecimiento del mercado.
Análisis del mercado alemán de tratamiento del linfedema
Se prevé que el mercado alemán del linfedema se expanda a una considerable tasa de crecimiento anual compuesta (TCAC) de aproximadamente el 10,3 % entre 2025 y 2032, impulsado por una mayor concienciación sobre la enfermedad, un fuerte énfasis en la atención integral dentro de su sólido sistema de salud y la demanda de soluciones terapéuticas tecnológicamente avanzadas y de alta calidad. La sólida infraestructura alemana de clínicas especializadas y terapeutas expertos, junto con su énfasis en la innovación y el reembolso de las terapias para el linfedema, promueve la adopción de estrategias de tratamiento avanzadas, especialmente en la atención a pacientes tanto crónicos como postoperatorios. La integración del diagnóstico y el tratamiento del linfedema en la práctica médica habitual también es cada vez más frecuente, con una marcada preferencia por soluciones basadas en la evidencia y centradas en el paciente, que se ajusten a las expectativas de los consumidores y los profesionales médicos locales.
Perspectivas del mercado de tratamiento del linfedema en Asia-Pacífico
Se prevé que el mercado de tratamiento del linfedema en Asia-Pacífico crezca a la tasa de crecimiento anual compuesta (TCAC) más rápida, de aproximadamente el 12,80 % entre 2018 y 2032, impulsado por una mayor concienciación, el aumento del gasto sanitario y los importantes avances tecnológicos en países como China, Japón e India. La creciente comprensión del linfedema en la región, respaldada por la financiación pública para la atención médica y las iniciativas para controlar la filariasis linfática (una causa común de linfedema secundario), está impulsando la adopción de soluciones de diagnóstico y tratamiento. Además, a medida que la infraestructura sanitaria de Asia-Pacífico continúa desarrollándose y el acceso a la atención especializada se amplía, la asequibilidad y la accesibilidad del tratamiento del linfedema se están extendiendo a una base de pacientes más amplia, especialmente en las principales economías como China, que se espera que crezca a la mayor tasa debido al aumento de la financiación pública.
Análisis del mercado del tratamiento del linfedema en Japón
El mercado japonés del linfedema está cobrando impulso gracias al avanzado sistema sanitario del país, el rápido envejecimiento de la población y la fuerte demanda de tratamientos eficaces y de alta calidad. El mercado japonés prioriza el diagnóstico precoz y la atención integral, y la adopción del tratamiento del linfedema se ve impulsada por el creciente número de clínicas especializadas y una mayor concienciación sobre las complicaciones post-cáncer. La integración de tecnologías diagnósticas avanzadas con técnicas quirúrgicas y de tratamiento conservador de vanguardia está impulsando el crecimiento. Además, la población japonesa, que envejece cada vez más, es cada vez más susceptible a enfermedades crónicas que contribuyen al linfedema, lo que impulsa la demanda de soluciones de tratamiento accesibles y de alta calidad, tanto en el ámbito residencial (atención domiciliaria) como en el clínico.
Análisis del mercado del tratamiento del linfedema en China
El mercado chino del linfedema representa una importante cuota de mercado en Asia Pacífico, debido a la vasta población del país, la creciente incidencia de cáncer y la rápida expansión de la infraestructura sanitaria. China se posiciona como uno de los mercados más grandes para servicios de salud, y el manejo del linfedema es cada vez más crucial en hospitales, clínicas especializadas y centros de salud comunitarios. El esfuerzo del gobierno por mejorar los resultados de salud pública y la creciente disponibilidad tanto de la medicina tradicional china como de soluciones médicas occidentales avanzadas son factores clave que impulsan el mercado en China.
Cuota de mercado del tratamiento del linfedema
La industria del tratamiento del linfedema está liderada principalmente por empresas bien establecidas, entre las que se incluyen:
- Tactile Medical (EE. UU.)
- Essity Aktiebolag (publ) (Suecia)
- 3M (EE. UU.)
- Cardinal Health (EE. UU.)
- Lohmann & Rauscher GmbH & Co. KG (Alemania)
- PAUL HARTMANN AG (Alemania)
- medi GmbH & Co. KG (Alemania)
- ConvaTec Inc. (Reino Unido)
- Juzo (Alemania)
- Smith + Nephew (Reino Unido)
- GRUPO SIGVARIS (Suiza)
- Sanyleg Srl (Italia)
- Avet Pharmaceuticals Inc. (EE. UU.)
- ThermoTek Inc. (EE. UU.)
- Huntleigh Healthcare Limited (Reino Unido)
- KOYA MEDICAL (EE. UU.)
- AIROS Medical, Inc. (EE. UU.)
- SISTEMAS DE BIOCOMPRESIÓN (EE. UU.)
- Mego Afek Ltd. (Israel)
- GRUPO SIGVARIS (Suiza)
- Sanyleg Srl (Italia)
- Thusane (Francia)
Últimos avances en el mercado mundial del tratamiento del linfedema
- En marzo de 2025, ConvaTec anunció una colaboración global con la Sociedad de Enfermeras de Heridas, Ostomía y Continencia (WOCN) para mejorar la educación sobre el cuidado de las ostomías. La alianza lanza dos programas gratuitos —el Programa de Cuidado Avanzado de Ostomías y el Programa de Asociado en Cuidado de Ostomías (OCA)— para capacitar a más de 750 profesionales de la salud en todo el mundo. La iniciativa busca mejorar los estándares de atención y ampliar el acceso de los pacientes a la atención experta en ostomías.
- En abril de 2025, el Grupo Lohmann & Rauscher (L&R) adquirió Unisurge International Ltd., proveedor líder en el Reino Unido de paquetes de procedimientos personalizados y productos quirúrgicos. Esta adquisición estratégica amplía el acceso de L&R al mercado hospitalario británico. Unisurge operará de forma independiente, manteniendo su liderazgo y personal, y se beneficiará de la experiencia global de L&R y su compromiso con la innovación médica.
- En febrero de 2025, Tactile Medical amplió el lanzamiento en EE. UU. de su dispositivo de compresión neumática Nimbl para el tratamiento del linfedema de las extremidades inferiores, tras su lanzamiento inicial para afecciones de las extremidades superiores. Nimbl es el dispositivo de compresión neumática (PCD) más pequeño de su tipo, con Bluetooth, diseñado para ofrecer comodidad, portabilidad y una mejor adherencia. Se integra con la aplicación Kylee, optimizando la experiencia del paciente y la autogestión de la atención en casa.
- En octubre de 2024, Tactile Medical lanzó Nimbl, su dispositivo de compresión neumática de última generación para el tratamiento del linfedema de las extremidades superiores. Aprobado por la FDA y los CMS, Nimbl es un 68 % más ligero y un 40 % más pequeño que los modelos anteriores. Diseñado para uso doméstico y comodidad diaria, se integra con la aplicación Kylee para optimizar la monitorización del paciente. Se espera el lanzamiento nacional de una versión para las extremidades inferiores próximamente.
- En julio de 2022, Tactile Medical lanzó las prendas ComfortEase para su sistema Flexitouch Plus, rediseñadas para un mejor ajuste, comodidad y facilidad de uso. Además, la compañía presentó la aplicación móvil Kylee, que permite a los pacientes hacer un seguimiento de los síntomas del linfedema, registrar los tratamientos y acceder a recursos educativos. Ambas innovaciones buscan mejorar la adherencia a la terapia en casa y la participación del paciente en el manejo de las afecciones inflamatorias crónicas.
SKU-
Obtenga acceso en línea al informe sobre la primera nube de inteligencia de mercado del mundo

- Panel de análisis de datos interactivo
- Panel de análisis de empresas para oportunidades con alto potencial de crecimiento
- Acceso de analista de investigación para personalización y consultas
- Análisis de la competencia con panel interactivo
- Últimas noticias, actualizaciones y análisis de tendencias
- Aproveche el poder del análisis de referencia para un seguimiento integral de la competencia
Tabla de contenido
1 INTRODUCCIÓN
1.1 OBJETIVOS DEL ESTUDIO
1.2 DEFINICIÓN DE MERCADO
1.3 DESCRIPCIÓN GENERAL DEL MERCADO MUNDIAL DE TRATAMIENTO DEL LINFEDEMA
1.4 LIMITACIONES
1.5 MERCADOS CUBIERTOS
2 SEGMENTACIÓN DEL MERCADO
2.1 MERCADOS CUBIERTOS
2.2 ÁMBITO GEOGRÁFICO
2,3 AÑOS CONSIDERADOS PARA EL ESTUDIO
2.4 MONEDA Y PRECIOS
2.5 MODELO DE VALIDACIÓN DE DATOS TRÍPODE DBMR
2.6 MODELADO MULTIVARIADO
2.7 TIPO DE PRODUCTO CURVA DE LÍNEA DE VIDA
2.8 ENTREVISTAS PRINCIPALES CON LÍDERES DE OPINIÓN CLAVE
2.9 CUADRÍCULA DE POSICIÓN DE MERCADO DBMR
2.1 CUADRÍCULA DE COBERTURA DE USUARIOS FINALES DEL MERCADO
2.11 ANÁLISIS DE LA PARTICIPACIÓN DE LOS PROVEEDORES
2.12 FUENTES SECUNDARIAS
2.13 SUPUESTOS
3 RESUMEN EJECUTIVO
4 INFORMACIÓN PREMIUM
4.1 LAS CINCO FUERZAS DE PORTER
4.2 ANÁLISIS PESTEL
4.3 INFORMACIÓN SOBRE LA INDUSTRIA –
4.3.1 FACTORES MICRO Y MACROECONÓMICOS
4.3.2 MAPEO DE PERSPECTIVAS DE PENETRACIÓN Y CRECIMIENTO
4.3.3 ESTRATEGIAS CLAVE DE PRECIOS
4.3.4 ANÁLISIS Y RECOMENDACIÓN
4.4 SEGUIMIENTO DE INNOVACIÓN Y ANÁLISIS ESTRATÉGICO
4.4.1 ANÁLISIS DE GRANDES ACUERDOS Y ALIANZAS ESTRATÉGICAS
4.4.1.1 FUSIONES Y ADQUISICIONES
4.4.1.2 COLABORACIONES TECNOLÓGICAS
4.4.2 NÚMERO DE PRODUCTOS EN DESARROLLO
4.4.3 ETAPA DE DESARROLLO
4.4.4 CRONOGRAMAS E HITOS
4.4.5 ESTRATEGIAS Y METODOLOGÍAS DE INNOVACIÓN
4.4.6 EVALUACIÓN Y MITIGACIÓN DE RIESGOS
4.4.7 PERSPECTIVAS FUTURAS
4.5 ANÁLISIS DE PROYECTOS EN PRODUCCIÓN – MERCADO GLOBAL DE TRATAMIENTO DEL LINFEDEMA
4.5.1 ENSAYOS CLÍNICOS Y ANÁLISIS DE FASE
4.5.2 PROCESO DE FARMACIA
4.5.3 CANDIDATOS DE LA FASE III
4.5.4 CANDIDATOS DE LA FASE II
4.5.5 CANDIDATOS DE LA FASE I
4.5.6 OTROS (PRECLÍNICOS Y DE INVESTIGACIÓN)
4.5.7 CONCLUSIÓN
4.6 EPIDEMIOLOGÍA–
4.6.1 INCIDENCIA DEL LINFEDEMA (GLOBAL Y POR GÉNERO)
4.6.2 INCIDENCIA DE LINFEDEMA POR GÉNERO
4.6.3 TASA DE TRATAMIENTO
4.6.4 TASA DE MORTALIDAD
4.6.5 MODELO DE ADHERENCIA A MEDICAMENTOS Y CAMBIO DE TERAPIA
4.6.6 TASAS DE ÉXITO DEL TRATAMIENTO DEL PACIENTE
4.7 TARIFA
4.7.1 DESCRIPCIÓN GENERAL
4.7.2 ESTRUCTURAS TARIFARIAS
4.7.2.1 ESTRUCTURAS ARANCELARIAS GLOBALES VS. REGIONALES
4.7.2.2 ESTADOS UNIDOS: POLÍTICAS TARIFARIAS DE MEDICARE/MEDICAID, MODELOS DE PRECIOS DE CMS
4.7.2.3 UNIÓN EUROPEA: REGLAMENTOS ARANCELARIOS TRANSFRONTERIZOS Y POLÍTICAS DE REEMBOLSO
4.7.2.4 ASIA-PACÍFICO: ARANCELES IMPUESTOS POR EL GOBIERNO A LOS PRODUCTOS MÉDICOS IMPORTADOS
4.7.2.5 MERCADOS EMERGENTES: DESAFÍOS EN LA IMPLEMENTACIÓN ARANCELARIA
4.7.3 ARANCELES FARMACÉUTICOS Y BARRERAS COMERCIALES
4.7.3.1 DERECHOS DE IMPORTACIÓN DE MEDICAMENTOS CON RECETA VS. GENÉRICOS
4.7.3.2 IMPACTO EN LA ASEQUIBILIDAD Y EL ACCESO A LOS MEDICAMENTOS
4.7.3.3 ACUERDOS COMERCIALES CLAVE QUE AFECTAN A LOS ARANCELES FARMACÉUTICOS
4.7.4 IMPACTO DE LAS TARIFAS DE ATENCIÓN MÉDICA EN LOS PROVEEDORES Y PACIENTES
4.7.4.1 CARGA COSTUMBRES SOBRE HOSPITALES Y CENTROS DE SALUD
4.7.4.2 EFECTO EN LA ASEQUIBILIDAD DEL PACIENTE Y LA COBERTURA DEL SEGURO
4.7.4.3 LAS TARIFAS Y SU PAPEL EN EL TURISMO MÉDICO
4.7.5 ACUERDOS COMERCIALES Y ARANCELES DE ATENCIÓN SANITARIA
4.7.5.1 REGLAMENTO DE LA OMC SOBRE ARANCELES DE ATENCIÓN SANITARIA
4.7.5.2 IMPACTO DE LAS GUERRAS COMERCIALES EN LA CADENA DE SUMINISTRO DE ATENCIÓN MÉDICA
4.7.5.3 EL PAPEL DE LOS TRATADOS DE LIBRE COMERCIO (TLC) EN LA REDUCCIÓN DE ARANCELES
4.7.6 IMPACTO DE LAS TARIFAS EN LOS COSTOS Y LA ACCESIBILIDAD DE LA ATENCIÓN SANITARIA
4.7.7 IMPORTANCIA DE LAS TARIFAS EN EL SECTOR SANITARIO
5 MARCO REGULADOR–
5.1 AMÉRICA DEL NORTE
5.2 SUDAMÉRICA
5.3 EUROPA
5.4 ASIA-PACÍFICO
5.5 ORIENTE MEDIO Y ÁFRICA
6 PANORAMA GENERAL DEL MERCADO
6.1 CONDUCTORES
6.1.1 AUMENTO DEL NÚMERO DE CASOS DE LINFEDEMA A NIVEL MUNDIAL
6.1.2 AUMENTO DE LA PREVALENCIA DE CÁNCERES
6.1.3 AUMENTO DEL NÚMERO DE CENTROS DE SALUD
6.1.4 DISPONIBILIDAD Y AVANCE DE MÚLTIPLES OPCIONES TERAPÉUTICAS
6.2 RESTRICCIONES
6.2.1 COSTOS IMPORTANTES ASOCIADOS CON EL TRATAMIENTO DEL LINFEDEMA
6.2.2 FALTA DE CONCIENCIA SOBRE LA ENFERMEDAD
6.3 OPORTUNIDADES
6.3.1 AMPLIACIÓN DE LAS OPORTUNIDADES PARA EL DESARROLLO DE MEDICAMENTOS Y LAS APROBACIONES REGULATORIAS
6.3.2 COLABORACIONES Y ALIANZAS ESTRATÉGICAS ENTRE LOS ACTORES DE LA INDUSTRIA
6.4 DESAFÍOS
6.4.1 AUSENCIA DE UN TRATAMIENTO CURATIVO DEFINITIVO
6.4.2 POLÍTICAS DE REEMBOLSO RESTRICTIVAS E INCONSISTENTES
7 MERCADO MUNDIAL DE TRATAMIENTO DEL LINFEDEMA, POR TIPO DE TRATAMIENTO
7.1 INFORMACIÓN GENERAL
7.2 TERAPIA DE COMPRESIÓN
7.3 CIRUGÍA
7.4 TERAPIA FARMACÉUTICA
7.5 TERAPIA LÁSER
7.6 OTROS
8 MERCADO MUNDIAL DE TRATAMIENTO DEL LINFEDEMA, POR TIPO
8.1 INFORMACIÓN GENERAL
8.2 LINFEDEMA SECUNDARIO
8.3 LINFEDEMA PRIMARIO
9 MERCADO MUNDIAL DE TRATAMIENTO DEL LINFEDEMA, POR ÁREA AFECTADA
9.1 INFORMACIÓN GENERAL
9.2 EXTREMIDAD INFERIOR
9.3 EXTREMIDAD SUPERIOR
9.4 GENITALES
10 MERCADO MUNDIAL DE TRATAMIENTO DEL LINFEDEMA, POR GRUPO DE EDAD
10.1 INFORMACIÓN GENERAL
10.2 ADULT
10.3 GERIÁTRICO
10.4 PEDIÁTRICO
11 MERCADO MUNDIAL DE TRATAMIENTO DEL LINFEDEMA, POR VÍA DE ADMINISTRACIÓN
11.1 INFORMACIÓN GENERAL
11.2 ORAL
11.3 INYECTABLE
11.4 TÓPICO
12 MERCADO MUNDIAL DE TRATAMIENTO DEL LINFEDEMA, POR USUARIO FINAL
12.1 INFORMACIÓN GENERAL
12.2 HOSPITAL
12.3 CLÍNICAS ESPECIALIZADAS
12.4 CENTROS DE CIRUGÍA AMBULATORIA
12.5 OTROS
13 MERCADO MUNDIAL DE TRATAMIENTO DEL LINFEDEMA, POR CANAL DE DISTRIBUCIÓN
13.1 DESCRIPCIÓN GENERAL
13.2 FARMACIAS
13.3 LICITACIÓN DIRECTA
13.4 OTROS
14 MERCADO MUNDIAL DE TRATAMIENTO DEL LINFEDEMA, POR REGIÓN
14.1 INFORMACIÓN GENERAL
14.2 AMÉRICA DEL NORTE
14.2.1 EE. UU.
14.2.2 CANADÁ
14.2.3 MÉXICO
14.3 EUROPA
14.3.1 ALEMANIA
14.3.2 FRANCIA
14.3.3 REINO UNIDO
14.3.4 ITALIA
14.3.5 RUSIA
14.3.6 ESPAÑA
14.3.7 TURQUÍA
14.3.8 PAÍSES BAJOS
14.3.9 SUIZA
14.3.10 BÉLGICA
14.3.11 POLONIA
14.3.12 AUSTRIA
14.3.13 HUNGRÍA
14.3.14 NORUEGA
14.3.15 IRLANDA
14.3.16 LITUANIA
14.3.17 RESTO DE EUROPA
14.4 ASIA-PACÍFICO
14.4.1 CHINA
14.4.2 JAPÓN
14.4.3 INDIA
14.4.4 COREA DEL SUR
14.4.5 AUSTRALIA
14.4.6 INDONESIA
14.4.7 SINGAPUR
14.4.8 FILIPINAS
14.4.9 TAILANDIA
14.4.10 MALASIA
14.4.11 VIETNAM
14.4.12 RESTO DE ASIA-PACÍFICO
14.5 ORIENTE MEDIO Y ÁFRICA
14.5.1 SUDÁFRICA
14.5.2 ARABIA SAUDITA
14.5.3 EGIPTO
14.5.4 Emiratos Árabes Unidos
14.5.5 ISRAEL
14.5.6 KUWAIT
14.5.7 RESTO DE ORIENTE MEDIO Y ÁFRICA
14.6 SUDAMÉRICA
14.6.1 BRASIL
14.6.2 ARGENTINA
14.6.3 PERÚ
14.6.4 RESTO DE SUDAMÉRICA
15 MERCADO GLOBAL DE TRATAMIENTO DEL LINFEDEMA, PANORAMA EMPRESARIAL
15.1 ANÁLISIS DE LAS ACCIONES DE LA EMPRESA: GLOBAL
15.2 ANÁLISIS DE ACCIONES DE LA EMPRESA: AMÉRICA DEL NORTE
15.3 ANÁLISIS DE ACCIONES DE EMPRESAS: EUROPA
15.4 ANÁLISIS DE ACCIONES DE LA EMPRESA: ASIA-PACÍFICO
16 ANÁLISIS FODA
17 PERFIL DE LA EMPRESA
17.1 MEDICINA TÁCTIL
17.1.1 INSTANTÁNEA DE LA EMPRESA
17.1.2 ANÁLISIS DE INGRESOS
17.1.3 ANÁLISIS DE LAS ACCIONES DE LA EMPRESA
17.1.4 PORTAFOLIO DE PRODUCTOS
17.1.5 DESARROLLO RECIENTE
17.2 ESSITY AKTIEBOLAG (PÚBLICO)
17.2.1 INSTANTÁNEA DE LA EMPRESA
17.2.2 ANÁLISIS DE INGRESOS
17.2.3 ANÁLISIS DE LAS ACCIONES DE LA EMPRESA
17.2.4 PORTAFOLIO DE PRODUCTOS
17.2.5 DESARROLLO RECIENTE
17.3 3M
17.3.1 INSTANTÁNEA DE LA EMPRESA
17.3.2 ANÁLISIS DE INGRESOS
17.3.3 ANÁLISIS DE LAS ACCIONES DE LA EMPRESA
17.3.4 PORTAFOLIO DE PRODUCTOS
17.3.5 DESARROLLOS RECIENTES
17.4 SALUD CARDENAL
17.4.1 INSTANTÁNEA DE LA EMPRESA
17.4.2 ANÁLISIS DE INGRESOS
17.4.3 ANÁLISIS DE LAS ACCIONES DE LA EMPRESA
17.4.4 PORTAFOLIO DE PRODUCTOS
17.4.5 DESARROLLO RECIENTE
17.5 LOHMANN & RAUSCHER GMBH & CO.KG
17.5.1 INSTANTÁNEA DE LA EMPRESA
17.5.2 ANÁLISIS DE LAS ACCIONES DE LA EMPRESA
17.5.3 PORTAFOLIO DE PRODUCTOS
17.5.4 DESARROLLO RECIENTE
17.6 AIROS MEDICAL, INC.
17.6.1 INSTANTÁNEA DE LA EMPRESA
17.6.2 PORTAFOLIO DE PRODUCTOS
17.6.3 DESARROLLO RECIENTE
17.7 ARJO
17.7.1 INSTANTÁNEA DE LA EMPRESA
17.7.2 ANÁLISIS DE INGRESOS
17.7.3 PORTAFOLIO DE PRODUCTOS
17.7.4 DESARROLLOS RECIENTES
17.8 AVET PHARMACEUTICALS INC.
17.8.1 INSTANTÁNEA DE LA EMPRESA
17.8.2 PORTAFOLIO DE PRODUCTOS
17.8.3 DESARROLLO RECIENTE
17.9 BAUERFEIND
17.9.1 INSTANTÁNEA DE LA EMPRESA
17.9.2 PORTAFOLIO DE PRODUCTOS
17.9.3 DESARROLLOS RECIENTES
17.1 SISTEMAS DE BIOCOMPRESIÓN
17.10.1 INSTANTÁNEA DE LA EMPRESA
17.10.2 PORTAFOLIO DE PRODUCTOS
17.10.3 DESARROLLO RECIENTE
17.11 CONVATEC INC.
17.11.1 INSTANTÁNEA DE LA EMPRESA
17.11.2 PORTAFOLIO DE PRODUCTOS
17.11.3 DESARROLLO RECIENTE
17.12 CORPORACIÓN ENOVIS
17.12.1 INSTANTÁNEA DE LA EMPRESA
17.12.2 ANÁLISIS DE INGRESOS
17.12.3 PORTAFOLIO DE PRODUCTOS
17.12.4 DESARROLLOS RECIENTES
17.13 HUNTLEIGH HEALTHCARE LIMITED
17.13.1 INSTANTÁNEA DE LA EMPRESA
17.13.2 PORTAFOLIO DE PRODUCTOS
17.13.3 DESARROLLO RECIENTE
17.14 IMPEDIMED LIMITADA
17.14.1 INSTANTÁNEA DE LA EMPRESA
17.14.2 ANÁLISIS DE INGRESOS
17.14.3 PORTAFOLIO DE PRODUCTOS
17.14.4 DESARROLLO RECIENTE/NOTICIAS
17.15 JODAS EXPOIM PVT. LTD.
17.15.1 INSTANTÁNEA DE LA EMPRESA
17.15.2 PORTAFOLIO DE PRODUCTOS
17.15.3 DESARROLLO RECIENTE
17.16 JUZO
17.16.1 INSTANTÁNEA DE LA EMPRESA
17.16.2 PORTAFOLIO DE PRODUCTOS
17.16.3 DESARROLLO RECIENTE
17.17 KOYA MEDICAL
17.17.1 INSTANTÁNEA DE LA EMPRESA
17.17.2 PORTAFOLIO DE PRODUCTOS
17.17.3 DESARROLLO RECIENTE
17.18 LLC GRUPO BINNOPHARM
17.18.1 INSTANTÁNEA DE LA EMPRESA
17.18.2 PORTAFOLIO DE PRODUCTOS
17.18.3 DESARROLLO RECIENTE
17.19 MCKESSON MÉDICO-QUIRÚRGICO INC.
17.19.1 INSTANTÁNEA DE LA EMPRESA
17.19.2 ANÁLISIS DE INGRESOS
17.19.3 PORTAFOLIO DE PRODUCTOS
17.19.4 DESARROLLO RECIENTE
17.2 MEDI GMBH & CO. KG
17.20.1 INSTANTÁNEA DE LA EMPRESA
17.20.2 PORTAFOLIO DE PRODUCTOS
17.20.3 DESARROLLO RECIENTE
17.21 MEDTRONIC
17.21.1 INSTANTÁNEA DE LA EMPRESA
17.21.2 ANÁLISIS DE INGRESOS
17.21.3 PORTAFOLIO DE PRODUCTOS
17.21.4 DESARROLLOS RECIENTES
17.22 MEGO AFEK LTD
17.22.1 INSTANTÁNEA DE LA EMPRESA
17.22.2 PORTAFOLIO DE PRODUCTOS
17.22.3 DESARROLLO RECIENTE
17.23 PAUL HARTMANN AG
17.23.1 INSTANTÁNEA DE LA EMPRESA
17.23.2 ANÁLISIS DE INGRESOS
17.23.3 PORTAFOLIO DE PRODUCTOS
17.23.4 DESARROLLO RECIENTE
17.24 SALUD DEL RENDIMIENTO
17.24.1 INSTANTÁNEA DE LA EMPRESA
17.24.2 PORTAFOLIO DE PRODUCTOS
17.24.3 DESARROLLOS RECIENTES
17.25 PURETECH HEALTH INC
17.25.1 INSTANTÁNEA DE LA EMPRESA
17.25.2 CARTERA DE OLEODUCTO
17.25.3 DESARROLLO RECIENTE
17.26 SANYLEG SRL A SOCIO ÚNICO
17.26.1 INSTANTÁNEA DE LA EMPRESA
17.26.2 PORTAFOLIO DE PRODUCTOS
17.26.3 DESARROLLO RECIENTE
17.27 GRUPO SIGVARIS
17.27.1 INSTANTÁNEA DE LA EMPRESA
17.27.2 PORTAFOLIO DE PRODUCTOS
17.27.3 DESARROLLOS RECIENTES
17.28 SMITH+SOBRINO
17.28.1 INSTANTÁNEA DE LA EMPRESA
17.28.2 ANÁLISIS DE INGRESOS
17.28.3 PORTAFOLIO DE PRODUCTOS
17.28.4 DESARROLLO RECIENTE
17.29 THERMOTEK
17.29.1 INSTANTÁNEA DE LA EMPRESA
17.29.2 PORTAFOLIO DE PRODUCTOS
17.29.3 DESARROLLO RECIENTE
17.3 THUASNE
17.30.1 INSTANTÁNEA DE LA EMPRESA
17.30.2 PORTAFOLIO DE PRODUCTOS
17.30.3 DESARROLLO RECIENTE
17.31 VIATRIS INC.
17.31.1 INSTANTÁNEA DE LA EMPRESA
17.31.2 ANÁLISIS DE INGRESOS
17.31.3 PORTAFOLIO DE PRODUCTOS
17.31.4 DESARROLLO RECIENTE
17.32 WHITE SWAN PHARMACEUTICAL
17.32.1 INSTANTÁNEA DE LA EMPRESA
17.32.2 PORTAFOLIO DE PRODUCTOS
17.32.3 ACONTECIMIENTOS RECIENTES
18 CUESTIONARIO
19 INFORMES RELACIONADOS
Lista de Tablas
CUADRO 1 PRODUCTOS Y SUS ETAPAS DE DESARROLLO.
TABLA 2 DISTRIBUCIÓN POR FASES: ENSAYOS CLÍNICOS
TABLA 3 CANDIDATOS DE LA FASE 2
TABLA 4 MERCADO MUNDIAL DE TRATAMIENTO DEL LINFEDEMA, POR TIPO DE TRATAMIENTO, 2018-2032 (MILES DE USD)
TABLA 5 MERCADO MUNDIAL DE TRATAMIENTO DEL LINFEDEMA, POR TIPO DE TRATAMIENTO, 2018-2032 (VOLUMEN EN MILES DE UNIDADES)
TABLA 6 MERCADO GLOBAL DE TERAPIA DE COMPRESIÓN EN EL TRATAMIENTO DEL LINFEDEMA, POR REGIÓN 2018-2032 (MILES DE USD)
TABLA 7 MERCADO GLOBAL DE TERAPIA DE COMPRESIÓN EN EL TRATAMIENTO DEL LINFEDEMA, POR PRODUCTO, 2018-2032 (MILES DE USD)
TABLA 8 MERCADO GLOBAL DE PRENDAS DE COMPRESIÓN PARA EL TRATAMIENTO DEL LINFEDEMA, POR PRODUCTO, 2018-2032 (MILES DE USD)
TABLA 9 MERCADO GLOBAL DE TERAPIA DE COMPRESIÓN EN EL TRATAMIENTO DEL LINFEDEMA, POR TÉCNICA, 2018-2032 (MILES DE USD)
TABLA 10 MERCADO MUNDIAL DE CIRUGÍA PARA EL TRATAMIENTO DEL LINFEDEMA, POR REGIÓN, 2018-2032 (MILES DE USD)
TABLA 11 MERCADO GLOBAL DE TRATAMIENTO DE CIRUGÍA PARA LINFEDEMA, POR TIPO DE TRATAMIENTO, 2018-2032 (MILES DE USD)
TABLA 12 MERCADO MUNDIAL DE TERAPIA FARMACÉUTICA PARA EL TRATAMIENTO DEL LINFEDEMA, POR REGIÓN, 2018-2032 (MILES DE USD)
TABLA 13 MERCADO MUNDIAL DE TERAPIA FARMACÉUTICA PARA EL TRATAMIENTO DEL LINFEDEMA, POR TIPO DE TRATAMIENTO, 2018-2032 (MILES DE USD)
TABLA 14 MERCADO MUNDIAL DE TERAPIA LÁSER PARA EL TRATAMIENTO DEL LINFEDEMA, POR REGIÓN, 2018-2032 (MILES DE USD)
TABLA 15 MERCADO MUNDIAL DE OTROS EN EL TRATAMIENTO DEL LINFEDEMA, POR REGIÓN, 2018-2032 (MILES DE USD)
TABLA 16 MERCADO MUNDIAL DE TRATAMIENTO DEL LINFEDEMA, POR TIPO, 2018-2032 (MILES DE USD)
TABLA 17 MERCADO MUNDIAL DE TRATAMIENTO DEL LINFEDEMA SECUNDARIO, POR REGIÓN, 2018-2032 (MILES DE USD)
TABLA 18 MERCADO MUNDIAL DE TRATAMIENTO DEL LINFEDEMA PRIMARIO, POR REGIÓN, 2018-2032 (MILES DE USD)
TABLA 19 MERCADO MUNDIAL DE TRATAMIENTO DEL LINFEDEMA PRIMARIO, POR TIPO, 2018-2032 (MILES DE USD)
TABLA 20 MERCADO MUNDIAL DE TRATAMIENTO DEL LINFEDEMA, POR ÁREA AFECTADA, 2018-2032 (MILES DE USD)
TABLA 21 MERCADO MUNDIAL DE TRATAMIENTO DE LINFEDEMA EN LAS EXTREMIDADES INFERIORES, POR REGIÓN, 2018-2032 (MILES DE USD)
TABLA 22 MERCADO MUNDIAL DE TRATAMIENTO DE EXTREMIDADES SUPERIORES EN LINFEDEMA, POR REGIÓN, 2018-2032 (MILES DE USD)
TABLA 23 MERCADO MUNDIAL DE TRATAMIENTO DE GENITALES EN EL LINFEDEMA, POR REGIÓN, 2018-2032 (MILES DE USD)
TABLA 24 MERCADO MUNDIAL DE TRATAMIENTO DEL LINFEDEMA, POR GRUPO DE EDAD, 2018-2032 (MILES DE USD)
TABLA 25 MERCADO MUNDIAL DE TRATAMIENTO DEL LINFEDEMA EN ADULTOS, POR REGIÓN, 2018-2032 (MILES DE USD)
TABLA 26 MERCADO MUNDIAL DE TRATAMIENTO DEL LINFEDEMA EN GERIÁTRICOS, POR REGIÓN, 2018-2032 (MILES DE USD)
TABLA 27 MERCADO MUNDIAL DE TRATAMIENTO DEL LINFEDEMA PEDIÁTRICO, POR REGIÓN, 2018-2032 (MILES DE USD)
TABLA 28 MERCADO MUNDIAL DE TRATAMIENTO DEL LINFEDEMA, POR VÍA DE ADMINISTRACIÓN, 2018-2032 (MILES DE USD)
TABLA 29 MERCADO MUNDIAL DE TRATAMIENTO ORAL PARA EL LINFEDEMA, POR REGIÓN, 2018-2032 (MILES DE USD)
TABLA 30 MERCADO MUNDIAL DE INYECTABLES PARA EL TRATAMIENTO DEL LINFEDEMA, POR REGIÓN, 2018-2032 (MILES DE USD)
TABLA 31 MERCADO MUNDIAL DE PRODUCTOS TÓPICOS PARA EL TRATAMIENTO DEL LINFEDEMA, POR REGIÓN, 2018-2032 (MILES DE USD)
TABLA 32 MERCADO MUNDIAL DE TRATAMIENTO DEL LINFEDEMA, POR USUARIO FINAL, 2018-2032 (MILES DE USD)
TABLA 33 MERCADO MUNDIAL DE TRATAMIENTO DE HOSPITALES EN LINFEDEMA, POR REGIÓN, 2018-2032 (MILES DE USD)
TABLA 34 MERCADO MUNDIAL DE CLÍNICAS ESPECIALIZADAS EN EL TRATAMIENTO DEL LINFEDEMA, POR REGIÓN, 2018-2032 (MILES DE USD)
TABLA 35 CENTROS DE CIRUGÍA AMBULATORIA GLOBAL EN EL MERCADO DE TRATAMIENTO DEL LINFEDEMA, POR REGIÓN, 2018-2032 (MILES DE USD)
TABLA 36 MERCADO MUNDIAL DE OTROS EN EL TRATAMIENTO DEL LINFEDEMA, POR REGIÓN, 2018-2032 (MILES DE USD)
TABLA 37 MERCADO MUNDIAL DE TRATAMIENTO DEL LINFEDEMA, POR CANAL DE DISTRIBUCIÓN, 2018-2032 (MILES DE USD)
TABLA 38 FARMACIAS GLOBALES EN EL MERCADO DE TRATAMIENTO DEL LINFEDEMA, POR REGIÓN, 2018-2032 (MILES DE USD)
TABLA 39 LICITACIÓN DIRECTA GLOBAL EN EL MERCADO DE TRATAMIENTO DEL LINFEDEMA, POR REGIÓN, 2018-2032 (MILES DE USD)
TABLA 40 MERCADO MUNDIAL DE OTROS EN EL TRATAMIENTO DEL LINFEDEMA, POR REGIÓN, 2018-2032 (MILES DE USD)
TABLA 41 MERCADO MUNDIAL DE TRATAMIENTO DEL LINFEDEMA, POR REGIÓN, 2018-2032 (MILES DE USD)
TABLA 42 MERCADO DE TRATAMIENTO DEL LINFEDEMA EN AMÉRICA DEL NORTE, POR PAÍS, 2018-2032 (MILES DE USD)
TABLA 43 MERCADO DE TRATAMIENTO DEL LINFEDEMA EN AMÉRICA DEL NORTE, POR TIPO DE TRATAMIENTO, 2018-2032 (MILES DE USD)
TABLA 44 MERCADO DE TRATAMIENTO DEL LINFEDEMA EN AMÉRICA DEL NORTE, POR TIPO DE TRATAMIENTO, 2018-2032 (VOLUMEN EN MILES DE UNIDADES)
TABLA 45 MERCADO DE TRATAMIENTO DEL LINFEDEMA EN AMÉRICA DEL NORTE, POR TIPO DE TRATAMIENTO, 2018-2032 (ASP EN USD/UNIDADES)
TABLA 46 MERCADO DE TERAPIA DE COMPRESIÓN PARA EL TRATAMIENTO DEL LINFEDEMA EN AMÉRICA DEL NORTE, POR PRODUCTO, 2018-2032 (MILES DE USD)
TABLA 47 PRENDAS DE COMPRESIÓN EN EL MERCADO DE TRATAMIENTO DEL LINFEDEMA EN AMÉRICA DEL NORTE, POR PRODUCTO, 2018-2032 (MILES DE USD)
TABLA 48 MERCADO DE TERAPIA DE COMPRESIÓN PARA EL TRATAMIENTO DEL LINFEDEMA EN AMÉRICA DEL NORTE, POR TÉCNICA, 2018-2032 (MILES DE USD)
TABLA 49 MERCADO DE TRATAMIENTO DE CIRUGÍA PARA LINFEDEMA EN AMÉRICA DEL NORTE, POR TIPO DE TRATAMIENTO, 2018-2032 (MILES DE USD)
TABLA 50 MERCADO DE TERAPIA FARMACÉUTICA PARA EL TRATAMIENTO DEL LINFEDEMA EN AMÉRICA DEL NORTE, POR TIPO DE TRATAMIENTO, 2018-2032 (MILES DE USD)
TABLA 51 MERCADO DE TRATAMIENTO DEL LINFEDEMA EN AMÉRICA DEL NORTE, POR TIPO, 2018-2032 (MILES DE USD)
TABLA 52 LINFEDEMA PRIMARIO EN EL MERCADO DE TRATAMIENTO DEL LINFEDEMA DE AMÉRICA DEL NORTE, POR TIPO, 2018-2032 (MILES DE USD)
TABLA 53 MERCADO DE TRATAMIENTO DEL LINFEDEMA EN AMÉRICA DEL NORTE, POR ÁREA AFECTADA, 2018-2032 (MILES DE USD)
TABLA 54 MERCADO DE TRATAMIENTO DEL LINFEDEMA EN AMÉRICA DEL NORTE, POR GRUPO DE EDAD, 2018-2032 (MILES DE USD)
TABLA 55 MERCADO DE TRATAMIENTO DEL LINFEDEMA EN AMÉRICA DEL NORTE, POR VÍA DE ADMINISTRACIÓN, 2018-2032 (MILES DE USD)
TABLA 56 MERCADO DE TRATAMIENTO DEL LINFEDEMA EN AMÉRICA DEL NORTE, POR USUARIO FINAL, 2018-2032 (MILES DE USD)
TABLA 57 MERCADO DE TRATAMIENTO DEL LINFEDEMA EN AMÉRICA DEL NORTE, POR CANAL DE DISTRIBUCIÓN, 2018-2032 (MILES DE USD)
TABLA 58 MERCADO DE TRATAMIENTO DEL LINFEDEMA EN EE. UU., POR TIPO DE TRATAMIENTO, 2018-2032 (MILES DE USD)
TABLA 59 MERCADO ESTADOUNIDENSE DE TRATAMIENTO DEL LINFEDEMA, POR TIPO DE TRATAMIENTO, 2018-2032 (VOLUMEN EN MILES DE UNIDADES)
TABLA 60 MERCADO DE TRATAMIENTO DEL LINFEDEMA EN EE. UU., POR TIPO DE TRATAMIENTO, 2018-2032 (ASP EN USD/UNIDADES)
TABLA 61 MERCADO DE TERAPIA DE COMPRESIÓN EN EE. UU. PARA EL TRATAMIENTO DEL LINFEDEMA, POR PRODUCTO, 2018-2032 (MILES DE USD)
TABLA 62 PRENDAS DE COMPRESIÓN EN EL MERCADO DE TRATAMIENTO DEL LINFEDEMA DE EE. UU., POR PRODUCTO, 2018-2032 (MILES DE USD)
TABLA 63 MERCADO DE TERAPIA DE COMPRESIÓN EN EE. UU. PARA EL TRATAMIENTO DEL LINFEDEMA, POR TÉCNICA, 2018-2032 (MILES DE USD)
TABLA 64 MERCADO DE TRATAMIENTO DE CIRUGÍA EN ESTADOS UNIDOS PARA EL LINFEDEMA, POR TIPO DE TRATAMIENTO, 2018-2032 (MILES DE USD)
TABLA 65 MERCADO DE TRATAMIENTO FARMACÉUTICO PARA EL LINFEDEMA EN EE. UU., POR TIPO DE TRATAMIENTO, 2018-2032 (MILES DE USD)
TABLA 66 MERCADO DE TRATAMIENTO DEL LINFEDEMA EN EE. UU., POR TIPO, 2018-2032 (MILES DE USD)
TABLA 67 LINFEDEMA PRIMARIO EN EL MERCADO DE TRATAMIENTO DEL LINFEDEMA DE EE. UU., POR TIPO, 2018-2032 (MILES DE USD)
TABLA 68 MERCADO ESTADOUNIDENSE DE TRATAMIENTO DEL LINFEDEMA, POR ÁREA AFECTADA, 2018-2032 (MILES DE USD)
TABLA 69 MERCADO DE TRATAMIENTO DEL LINFEDEMA EN EE. UU., POR GRUPO DE EDAD, 2018-2032 (MILES DE USD)
TABLA 70 MERCADO DE TRATAMIENTO DEL LINFEDEMA EN EE. UU., POR VÍA DE ADMINISTRACIÓN, 2018-2032 (MILES DE USD)
TABLA 71 MERCADO DE TRATAMIENTO DEL LINFEDEMA EN EE. UU., POR USUARIO FINAL, 2018-2032 (MILES DE USD)
TABLA 72 MERCADO DE TRATAMIENTO DEL LINFEDEMA EN EE. UU., POR CANAL DE DISTRIBUCIÓN, 2018-2032 (MILES DE USD)
TABLA 73 MERCADO DE TRATAMIENTO DEL LINFEDEMA EN CANADÁ, POR TIPO DE TRATAMIENTO, 2018-2032 (MILES DE USD)
TABLA 74 MERCADO DE TRATAMIENTO DEL LINFEDEMA EN CANADÁ, POR TIPO DE TRATAMIENTO, 2018-2032 (VOLUMEN EN MILES DE UNIDADES)
TABLA 75 MERCADO DE TRATAMIENTO DEL LINFEDEMA EN CANADÁ, POR TIPO DE TRATAMIENTO, 2018-2032 (ASP EN USD/UNIDADES)
TABLA 76 MERCADO DE TERAPIA DE COMPRESIÓN EN CANADÁ PARA EL TRATAMIENTO DEL LINFEDEMA, POR PRODUCTO, 2018-2032 (MILES DE USD)
TABLA 77 PRENDAS DE COMPRESIÓN EN EL MERCADO DE TRATAMIENTO DEL LINFEDEMA DE CANADÁ, POR PRODUCTO, 2018-2032 (MILES DE USD)
TABLA 78 MERCADO DE TERAPIA DE COMPRESIÓN EN CANADÁ PARA EL TRATAMIENTO DEL LINFEDEMA, POR TÉCNICA, 2018-2032 (MILES DE USD)
TABLA 79 MERCADO DE TRATAMIENTO DE CIRUGÍA PARA LINFEDEMA EN CANADÁ, POR TIPO DE TRATAMIENTO, 2018-2032 (MILES DE USD)
TABLA 80 MERCADO CANADIENSE DE FARMACOLOGÍA PARA EL TRATAMIENTO DEL LINFEDEMA, POR TIPO DE TRATAMIENTO, 2018-2032 (MILES DE USD)
TABLA 81 MERCADO DE TRATAMIENTO DEL LINFEDEMA EN CANADÁ, POR TIPO, 2018-2032 (MILES DE USD)
TABLA 82 MERCADO DE TRATAMIENTO DEL LINFEDEMA PRIMARIO DE CANADÁ, POR TIPO, 2018-2032 (MILES DE USD)
TABLA 83 MERCADO DE TRATAMIENTO DEL LINFEDEMA EN CANADÁ, POR ÁREA AFECTADA, 2018-2032 (MILES DE USD)
TABLA 84 MERCADO DE TRATAMIENTO DEL LINFEDEMA EN CANADÁ, POR GRUPO DE EDAD, 2018-2032 (MILES DE USD)
TABLA 85 MERCADO CANADIENSE DE TRATAMIENTO DEL LINFEDEMA, POR VÍA DE ADMINISTRACIÓN, 2018-2032 (MILES DE USD)
TABLA 86 MERCADO DE TRATAMIENTO DEL LINFEDEMA EN CANADÁ, POR USUARIO FINAL, 2018-2032 (MILES DE USD)
TABLA 87 MERCADO DE TRATAMIENTO DEL LINFEDEMA EN CANADÁ, POR CANAL DE DISTRIBUCIÓN, 2018-2032 (MILES DE USD)
TABLA 88 MERCADO DE TRATAMIENTO DEL LINFEDEMA EN MÉXICO, POR TIPO DE TRATAMIENTO, 2018-2032 (MILES DE USD)
TABLA 89 MERCADO DE TRATAMIENTO DEL LINFEDEMA EN MÉXICO, POR TIPO DE TRATAMIENTO, 2018-2032 (VOLUMEN EN MILES DE UNIDADES)
TABLA 90 MERCADO DE TRATAMIENTO DEL LINFEDEMA EN MÉXICO, POR TIPO DE TRATAMIENTO, 2018-2032 (ASP EN USD/UNIDADES)
TABLA 91 MERCADO DE TERAPIA DE COMPRESIÓN EN EL TRATAMIENTO DEL LINFEDEMA EN MÉXICO, POR PRODUCTO, 2018-2032 (MILES DE USD)
TABLA 92 PRENDAS DE COMPRESIÓN EN EL MERCADO DE TRATAMIENTO DEL LINFEDEMA EN MÉXICO, POR PRODUCTO, 2018-2032 (MILES DE USD)
TABLA 93 MERCADO DE TERAPIA DE COMPRESIÓN EN EL TRATAMIENTO DEL LINFEDEMA EN MÉXICO, POR TÉCNICA, 2018-2032 (MILES DE USD)
TABLA 94 MERCADO DE TRATAMIENTO DE CIRUGÍA EN MÉXICO PARA EL LINFEDEMA, POR TIPO DE TRATAMIENTO, 2018-2032 (MILES DE USD)
TABLA 95 MERCADO DE TERAPIA FARMACÉUTICA PARA EL TRATAMIENTO DEL LINFEDEMA EN MÉXICO, POR TIPO DE TRATAMIENTO, 2018-2032 (MILES DE USD)
TABLA 96 MERCADO DE TRATAMIENTO DEL LINFEDEMA EN MÉXICO, POR TIPO, 2018-2032 (MILES DE USD)
TABLA 97 MÉXICO LINFEDEMA PRIMARIO EN EL MERCADO DE TRATAMIENTO DEL LINFEDEMA, POR TIPO, 2018-2032 (MILES DE USD)
TABLA 98 MERCADO DE TRATAMIENTO DEL LINFEDEMA EN MÉXICO, POR ZONA AFECTADA, 2018-2032 (MILES DE USD)
TABLA 99 MERCADO DE TRATAMIENTO DEL LINFEDEMA EN MÉXICO, POR GRUPO DE EDAD, 2018-2032 (MILES DE USD)
TABLA 100 MERCADO DE TRATAMIENTO DEL LINFEDEMA EN MÉXICO, POR VÍA DE ADMINISTRACIÓN, 2018-2032 (MILES DE USD)
TABLA 101 MERCADO DE TRATAMIENTO DEL LINFEDEMA EN MÉXICO, POR USUARIO FINAL, 2018-2032 (MILES DE USD)
TABLA 102 MERCADO DE TRATAMIENTO DEL LINFEDEMA EN MÉXICO, POR CANAL DE DISTRIBUCIÓN, 2018-2032 (MILES DE USD)
TABLA 103 MERCADO EUROPEO DE TRATAMIENTO DEL LINFEDEMA, POR PAÍS, 2018-2032 (MILES DE USD)
TABLA 104 MERCADO EUROPEO DE TRATAMIENTO DEL LINFEDEMA, POR TIPO DE TRATAMIENTO, 2018-2032 (MILES DE USD)
TABLA 105 MERCADO EUROPEO DE TRATAMIENTO DEL LINFEDEMA, POR TIPO DE TRATAMIENTO, 2018-2032 (VOLUMEN EN MILES DE UNIDADES)
TABLA 106 MERCADO EUROPEO DE TRATAMIENTO DEL LINFEDEMA, POR TIPO DE TRATAMIENTO, 2018-2032 (ASP EN USD/UNIDADES)
TABLA 107 MERCADO EUROPEO DE TERAPIA DE COMPRESIÓN PARA EL TRATAMIENTO DEL LINFEDEMA, POR PRODUCTO, 2018-2032 (MILES DE USD)
TABLA 108 MERCADO EUROPEO DE PRENDAS DE COMPRESIÓN PARA EL TRATAMIENTO DEL LINFEDEMA, POR PRODUCTO, 2018-2032 (MILES DE USD)
TABLA 109 MERCADO EUROPEO DE TERAPIA DE COMPRESIÓN PARA EL TRATAMIENTO DEL LINFEDEMA, POR TÉCNICA, 2018-2032 (MILES DE USD)
TABLA 110 MERCADO EUROPEO DE TRATAMIENTO DE CIRUGÍA PARA EL LINFEDEMA, POR TIPO DE TRATAMIENTO, 2018-2032 (MILES DE USD)
TABLA 111 MERCADO EUROPEO DE FARMACOLOGÍA PARA EL TRATAMIENTO DEL LINFEDEMA, POR TIPO DE TRATAMIENTO, 2018-2032 (MILES DE USD)
TABLA 112 MERCADO EUROPEO DE TRATAMIENTO DEL LINFEDEMA, POR TIPO, 2018-2032 (MILES DE USD)
TABLA 113 MERCADO EUROPEO DE TRATAMIENTO DEL LINFEDEMA PRIMARIO, POR TIPO, 2018-2032 (MILES DE USD)
TABLA 114 MERCADO EUROPEO DE TRATAMIENTO DEL LINFEDEMA, POR ÁREA AFECTADA, 2018-2032 (MILES DE USD)
TABLA 115 MERCADO EUROPEO DE TRATAMIENTO DEL LINFEDEMA, POR GRUPO DE EDAD, 2018-2032 (MILES DE USD)
TABLA 116 MERCADO EUROPEO DE TRATAMIENTO DEL LINFEDEMA, POR VÍA DE ADMINISTRACIÓN, 2018-2032 (MILES DE USD)
TABLA 117 MERCADO EUROPEO DE TRATAMIENTO DEL LINFEDEMA, POR USUARIO FINAL, 2018-2032 (MILES DE USD)
TABLA 118 MERCADO EUROPEO DE TRATAMIENTO DEL LINFEDEMA, POR CANAL DE DISTRIBUCIÓN, 2018-2032 (MILES DE USD)
TABLA 119 MERCADO DE TRATAMIENTO DEL LINFEDEMA EN ALEMANIA, POR TIPO DE TRATAMIENTO, 2018-2032 (MILES DE USD)
TABLA 120 MERCADO DE TRATAMIENTO DEL LINFEDEMA EN ALEMANIA, POR TIPO DE TRATAMIENTO, 2018-2032 (VOLUMEN EN MILES DE UNIDADES)
TABLA 121 MERCADO DE TRATAMIENTO DEL LINFEDEMA EN ALEMANIA, POR TIPO DE TRATAMIENTO, 2018-2032 (ASP EN USD/UNIDADES)
TABLA 122 MERCADO DE TERAPIA DE COMPRESIÓN EN EL TRATAMIENTO DEL LINFEDEMA EN ALEMANIA, POR PRODUCTO, 2018-2032 (MILES DE USD)
TABLA 123 PRENDAS DE COMPRESIÓN EN EL MERCADO DE TRATAMIENTO DEL LINFEDEMA DE ALEMANIA, POR PRODUCTO, 2018-2032 (MILES DE USD)
TABLA 124 MERCADO DE TERAPIA DE COMPRESIÓN EN ALEMANIA PARA EL TRATAMIENTO DEL LINFEDEMA, POR TÉCNICA, 2018-2032 (MILES DE USD)
TABLA 125 MERCADO ALEMÁN DE TRATAMIENTO DE CIRUGÍA PARA EL LINFEDEMA, POR TIPO DE TRATAMIENTO, 2018-2032 (MILES DE USD)
TABLA 126 MERCADO DE TRATAMIENTO FARMACÉUTICO PARA EL LINFEDEMA EN ALEMANIA, POR TIPO DE TRATAMIENTO, 2018-2032 (MILES DE USD)
TABLA 127 MERCADO DE TRATAMIENTO DEL LINFEDEMA EN ALEMANIA, POR TIPO, 2018-2032 (MILES DE USD)
TABLA 128 LINFEDEMA PRIMARIO EN EL MERCADO DE TRATAMIENTO DEL LINFEDEMA DE ALEMANIA, POR TIPO, 2018-2032 (MILES DE USD)
TABLA 129 MERCADO DE TRATAMIENTO DEL LINFEDEMA EN ALEMANIA, POR ÁREA AFECTADA, 2018-2032 (MILES DE USD)
TABLA 130 MERCADO DE TRATAMIENTO DEL LINFEDEMA EN ALEMANIA, POR GRUPO DE EDAD, 2018-2032 (MILES DE USD)
TABLA 131 MERCADO DE TRATAMIENTO DEL LINFEDEMA EN ALEMANIA, POR VÍA DE ADMINISTRACIÓN, 2018-2032 (MILES DE USD)
TABLA 132 MERCADO DE TRATAMIENTO DEL LINFEDEMA EN ALEMANIA, POR USUARIO FINAL, 2018-2032 (MILES DE USD)
TABLA 133 MERCADO DE TRATAMIENTO DEL LINFEDEMA EN ALEMANIA, POR CANAL DE DISTRIBUCIÓN, 2018-2032 (MILES DE USD)
TABLA 134 MERCADO FRANCESO DE TRATAMIENTO DEL LINFEDEMA, POR TIPO DE TRATAMIENTO, 2018-2032 (MILES DE USD)
TABLA 135 MERCADO FRANCESO DE TRATAMIENTO DEL LINFEDEMA, POR TIPO DE TRATAMIENTO, 2018-2032 (VOLUMEN EN MILES DE UNIDADES)
TABLA 136 MERCADO FRANCESO DE TRATAMIENTO DEL LINFEDEMA, POR TIPO DE TRATAMIENTO, 2018-2032 (ASP EN USD/UNIDADES)
TABLA 137 MERCADO DE TERAPIA DE COMPRESIÓN EN FRANCIA PARA EL TRATAMIENTO DEL LINFEDEMA, POR PRODUCTO, 2018-2032 (MILES DE USD)
TABLA 138 FRANCIA PRENDAS DE COMPRESIÓN EN EL MERCADO DE TRATAMIENTO DEL LINFEDEMA, POR PRODUCTO, 2018-2032 (MILES DE USD)
TABLA 139 MERCADO DE TERAPIA DE COMPRESIÓN EN FRANCIA PARA EL TRATAMIENTO DEL LINFEDEMA, POR TÉCNICA, 2018-2032 (MILES DE USD)
TABLA 140 MERCADO DE TRATAMIENTO DE CIRUGÍA EN FRANCIA PARA EL LINFEDEMA, POR TIPO DE TRATAMIENTO, 2018-2032 (MILES DE USD)
TABLA 141 MERCADO FRANCESO DE FARMACOLOGÍA PARA EL TRATAMIENTO DEL LINFEDEMA, POR TIPO DE TRATAMIENTO, 2018-2032 (MILES DE USD)
TABLA 142 MERCADO FRANCESO DE TRATAMIENTO DEL LINFEDEMA, POR TIPO, 2018-2032 (MILES DE USD)
TABLA 143 LINFEDEMA PRIMARIO EN FRANCIA EN EL MERCADO DE TRATAMIENTO DEL LINFEDEMA, POR TIPO, 2018-2032 (MILES DE USD)
TABLA 144 MERCADO FRANCESO DE TRATAMIENTO DEL LINFEDEMA, POR ÁREA AFECTADA, 2018-2032 (MILES DE USD)
TABLA 145 MERCADO FRANCESO DE TRATAMIENTO DEL LINFEDEMA, POR GRUPO DE EDAD, 2018-2032 (MILES DE USD)
TABLA 146 MERCADO FRANCESO DE TRATAMIENTO DEL LINFEDEMA, POR VÍA DE ADMINISTRACIÓN, 2018-2032 (MILES DE USD)
TABLA 147 MERCADO FRANCESO DE TRATAMIENTO DEL LINFEDEMA, POR USUARIO FINAL, 2018-2032 (MILES DE USD)
TABLA 148 MERCADO FRANCESO DE TRATAMIENTO DEL LINFEDEMA, POR CANAL DE DISTRIBUCIÓN, 2018-2032 (MILES DE USD)
TABLA 149 MERCADO DE TRATAMIENTO DEL LINFEDEMA DEL REINO UNIDO, POR TIPO DE TRATAMIENTO, 2018-2032 (MILES DE USD)
TABLA 150 MERCADO DE TRATAMIENTO DEL LINFEDEMA DEL REINO UNIDO, POR TIPO DE TRATAMIENTO, 2018-2032 (VOLUMEN EN MILES DE UNIDADES)
TABLA 151 MERCADO DE TRATAMIENTO DEL LINFEDEMA DEL REINO UNIDO, POR TIPO DE TRATAMIENTO, 2018-2032 (ASP EN USD/UNIDADES)
TABLA 152 MERCADO DE TERAPIA DE COMPRESIÓN PARA EL TRATAMIENTO DEL LINFEDEMA EN EL REINO UNIDO, POR PRODUCTO, 2018-2032 (MILES DE USD)
TABLA 153 PRENDAS DE COMPRESIÓN EN EL MERCADO DE TRATAMIENTO DEL LINFEDEMA DEL REINO UNIDO, POR PRODUCTO, 2018-2032 (MILES DE USD)
TABLA 154 MERCADO DE TERAPIA DE COMPRESIÓN PARA EL TRATAMIENTO DEL LINFEDEMA EN EL REINO UNIDO, POR TÉCNICA, 2018-2032 (MILES DE USD)
TABLA 155 MERCADO DE TRATAMIENTO DE CIRUGÍA PARA LINFEDEMA EN EL REINO UNIDO, POR TIPO DE TRATAMIENTO, 2018-2032 (MILES DE USD)
TABLA 156 MERCADO DE FARMACOLÓGICOS PARA EL TRATAMIENTO DEL LINFEDEMA EN EL REINO UNIDO, POR TIPO DE TRATAMIENTO, 2018-2032 (MILES DE USD)
TABLA 157 MERCADO DE TRATAMIENTO DEL LINFEDEMA DEL REINO UNIDO, POR TIPO, 2018-2032 (MILES DE USD)
TABLA 158 LINFEDEMA PRIMARIO EN EL MERCADO DE TRATAMIENTO DEL LINFEDEMA DEL REINO UNIDO, POR TIPO, 2018-2032 (MILES DE USD)
TABLA 159 MERCADO DE TRATAMIENTO DEL LINFEDEMA DEL REINO UNIDO, POR ÁREA AFECTADA, 2018-2032 (MILES DE USD)
TABLA 160 MERCADO DE TRATAMIENTO DEL LINFEDEMA DEL REINO UNIDO, POR GRUPO DE EDAD, 2018-2032 (MILES DE USD)
TABLA 161 MERCADO DE TRATAMIENTO DEL LINFEDEMA DEL REINO UNIDO, POR VÍA DE ADMINISTRACIÓN, 2018-2032 (MILES DE USD)
TABLA 162 MERCADO DE TRATAMIENTO DEL LINFEDEMA DEL REINO UNIDO, POR USUARIO FINAL, 2018-2032 (MILES DE USD)
TABLA 163 MERCADO DE TRATAMIENTO DEL LINFEDEMA DEL REINO UNIDO, POR CANAL DE DISTRIBUCIÓN, 2018-2032 (MILES DE USD)
TABLA 164 MERCADO DE TRATAMIENTO DEL LINFEDEMA EN ITALIA, POR TIPO DE TRATAMIENTO, 2018-2032 (MILES DE USD)
TABLA 165 MERCADO DE TRATAMIENTO DEL LINFEDEMA EN ITALIA, POR TIPO DE TRATAMIENTO, 2018-2032 (VOLUMEN EN MILES DE UNIDADES)
TABLA 166 MERCADO DE TRATAMIENTO DEL LINFEDEMA EN ITALIA, POR TIPO DE TRATAMIENTO, 2018-2032 (ASP EN USD/UNIDADES)
TABLA 167 ITALIA MERCADO DE TERAPIA DE COMPRESIÓN PARA EL TRATAMIENTO DEL LINFEDEMA, POR PRODUCTO, 2018-2032 (MILES DE USD)
TABLA 168 ITALIA PRENDAS DE COMPRESIÓN EN EL MERCADO DE TRATAMIENTO DEL LINFEDEMA, POR PRODUCTO, 2018-2032 (MILES DE USD)
TABLA 169 ITALIA MERCADO DE TERAPIA DE COMPRESIÓN PARA EL TRATAMIENTO DEL LINFEDEMA, POR TÉCNICA, 2018-2032 (MILES DE USD)
TABLA 170 MERCADO DE TRATAMIENTO DE CIRUGÍA EN ITALIA PARA EL LINFEDEMA, POR TIPO DE TRATAMIENTO, 2018-2032 (MILES DE USD)
TABLA 171 MERCADO DE TERAPIA FARMACÉUTICA PARA EL TRATAMIENTO DEL LINFEDEMA EN ITALIA, POR TIPO DE TRATAMIENTO, 2018-2032 (MILES DE USD)
TABLA 172 MERCADO DE TRATAMIENTO DEL LINFEDEMA EN ITALIA, POR TIPO, 2018-2032 (MILES DE USD)
TABLA 173 LINFEDEMA PRIMARIO EN EL MERCADO DE TRATAMIENTO DEL LINFEDEMA DE ITALIA, POR TIPO, 2018-2032 (MILES DE USD)
TABLA 174 MERCADO DE TRATAMIENTO DEL LINFEDEMA EN ITALIA, POR ÁREA AFECTADA, 2018-2032 (MILES DE USD)
TABLA 175 MERCADO DE TRATAMIENTO DEL LINFEDEMA EN ITALIA, POR GRUPO DE EDAD, 2018-2032 (MILES DE USD)
TABLA 176 MERCADO DE TRATAMIENTO DEL LINFEDEMA EN ITALIA, POR VÍA DE ADMINISTRACIÓN, 2018-2032 (MILES DE USD)
TABLA 177 MERCADO DE TRATAMIENTO DEL LINFEDEMA EN ITALIA, POR USUARIO FINAL, 2018-2032 (MILES DE USD)
TABLA 178 MERCADO DE TRATAMIENTO DEL LINFEDEMA EN ITALIA, POR CANAL DE DISTRIBUCIÓN, 2018-2032 (MILES DE USD)
TABLA 179 MERCADO DE TRATAMIENTO DEL LINFEDEMA EN RUSIA, POR TIPO DE TRATAMIENTO, 2018-2032 (MILES DE USD)
TABLA 180 MERCADO RUSO DE TRATAMIENTO DEL LINFEDEMA, POR TIPO DE TRATAMIENTO, 2018-2032 (VOLUMEN EN MILES DE UNIDADES)
TABLA 181 MERCADO DE TRATAMIENTO DEL LINFEDEMA EN RUSIA, POR TIPO DE TRATAMIENTO, 2018-2032 (ASP EN USD/UNIDADES)
TABLA 182 TERAPIA DE COMPRESIÓN EN EL MERCADO DE TRATAMIENTO DEL LINFEDEMA EN RUSIA, POR PRODUCTO, 2018-2032 (MILES DE USD)
TABLA 183 PRENDAS DE COMPRESIÓN EN EL MERCADO DE TRATAMIENTO DEL LINFEDEMA DE RUSIA, POR PRODUCTO, 2018-2032 (MILES DE USD)
TABLA 184 TERAPIA DE COMPRESIÓN EN EL MERCADO DE TRATAMIENTO DEL LINFEDEMA EN RUSIA, POR TÉCNICA, 2018-2032 (MILES DE USD)
TABLA 185 MERCADO RUSO DE CIRUGÍA PARA EL TRATAMIENTO DEL LINFEDEMA, POR TIPO DE TRATAMIENTO, 2018-2032 (MILES DE USD)
TABLA 186 MERCADO RUSO DE FARMACOLOGÍA PARA EL TRATAMIENTO DEL LINFEDEMA, POR TIPO DE TRATAMIENTO, 2018-2032 (MILES DE USD)
TABLA 187 MERCADO DE TRATAMIENTO DEL LINFEDEMA EN RUSIA, POR TIPO, 2018-2032 (MILES DE USD)
TABLA 188 LINFEDEMA PRIMARIO EN RUSIA EN EL MERCADO DE TRATAMIENTO DEL LINFEDEMA, POR TIPO, 2018-2032 (MILES DE USD)
TABLA 189 MERCADO DE TRATAMIENTO DEL LINFEDEMA EN RUSIA, POR ÁREA AFECTADA, 2018-2032 (MILES DE USD)
TABLA 190 MERCADO DE TRATAMIENTO DEL LINFEDEMA EN RUSIA, POR GRUPO DE EDAD, 2018-2032 (MILES DE USD)
TABLA 191 MERCADO DE TRATAMIENTO DEL LINFEDEMA EN RUSIA, POR VÍA DE ADMINISTRACIÓN, 2018-2032 (MILES DE USD)
TABLA 192 MERCADO DE TRATAMIENTO DEL LINFEDEMA EN RUSIA, POR USUARIO FINAL, 2018-2032 (MILES DE USD)
TABLA 193 MERCADO RUSO DE TRATAMIENTO DEL LINFEDEMA, POR CANAL DE DISTRIBUCIÓN, 2018-2032 (MILES DE USD)
TABLA 194 MERCADO ESPAÑOL DE TRATAMIENTO DEL LINFEDEMA, POR TIPO DE TRATAMIENTO, 2018-2032 (MILES DE USD)
TABLA 195 MERCADO ESPAÑOL DE TRATAMIENTO DEL LINFEDEMA, POR TIPO DE TRATAMIENTO, 2018-2032 (VOLUMEN EN MILES DE UNIDADES)
TABLA 196 MERCADO ESPAÑOL DE TRATAMIENTO DEL LINFEDEMA, POR TIPO DE TRATAMIENTO, 2018-2032 (ASP EN USD/UNIDADES)
TABLA 197 MERCADO ESPAÑOL DE TERAPIA DE COMPRESIÓN PARA EL TRATAMIENTO DEL LINFEDEMA, POR PRODUCTO, 2018-2032 (MILES DE USD)
TABLA 198 MERCADO DE PRENDAS DE COMPRESIÓN EN ESPAÑA PARA EL TRATAMIENTO DEL LINFEDEMA, POR PRODUCTO, 2018-2032 (MILES DE USD)
TABLA 199 MERCADO ESPAÑOL DE TERAPIA DE COMPRESIÓN EN EL TRATAMIENTO DEL LINFEDEMA, POR TÉCNICA, 2018-2032 (MILES DE USD)
TABLA 200 MERCADO ESPAÑOL DE CIRUGÍA PARA EL TRATAMIENTO DEL LINFEDEMA, POR TIPO DE TRATAMIENTO, 2018-2032 (MILES DE USD)
TABLA 201 MERCADO ESPAÑOL DE FARMACOLOGÍA PARA EL TRATAMIENTO DEL LINFEDEMA, POR TIPO DE TRATAMIENTO, 2018-2032 (MILES DE USD)
TABLA 202 MERCADO ESPAÑOL DE TRATAMIENTO DEL LINFEDEMA, POR TIPO, 2018-2032 (MILES DE USD)
TABLA 203 LINFEDEMA PRIMARIO EN ESPAÑA EN EL MERCADO DE TRATAMIENTO DEL LINFEDEMA, POR TIPO, 2018-2032 (MILES DE USD)
TABLA 204 MERCADO ESPAÑOL DE TRATAMIENTO DEL LINFEDEMA, POR ÁREA AFECTADA, 2018-2032 (MILES DE USD)
TABLA 205 MERCADO ESPAÑOL DE TRATAMIENTO DEL LINFEDEMA, POR GRUPO DE EDAD, 2018-2032 (MILES DE USD)
TABLA 206 MERCADO ESPAÑOL DE TRATAMIENTO DEL LINFEDEMA, POR VÍA DE ADMINISTRACIÓN, 2018-2032 (MILES DE USD)
TABLA 207 MERCADO ESPAÑOL DE TRATAMIENTO DEL LINFEDEMA, POR USUARIO FINAL, 2018-2032 (MILES DE USD)
TABLA 208 MERCADO ESPAÑOL DE TRATAMIENTO DEL LINFEDEMA, POR CANAL DE DISTRIBUCIÓN, 2018-2032 (MILES DE USD)
TABLA 209 MERCADO DE TRATAMIENTO DEL LINFEDEMA EN TURQUÍA, POR TIPO DE TRATAMIENTO, 2018-2032 (MILES DE USD)
TABLA 210 MERCADO DE TRATAMIENTO DEL LINFEDEMA EN TURQUÍA, POR TIPO DE TRATAMIENTO, 2018-2032 (VOLUMEN EN MILES DE UNIDADES)
TABLA 211 MERCADO DE TRATAMIENTO DEL LINFEDEMA EN TURQUÍA, POR TIPO DE TRATAMIENTO, 2018-2032 (ASP EN USD/UNIDADES)
TABLA 212 MERCADO DE TERAPIA DE COMPRESIÓN DE PAVO PARA EL TRATAMIENTO DEL LINFEDEMA, POR PRODUCTO, 2018-2032 (MILES DE USD)
TABLA 213 PRENDAS DE COMPRESIÓN DE PAVO EN EL MERCADO DE TRATAMIENTO DEL LINFEDEMA, POR PRODUCTO, 2018-2032 (MILES DE USD)
TABLA 214 MERCADO DE TERAPIA DE COMPRESIÓN DE TURQUÍA EN EL TRATAMIENTO DEL LINFEDEMA, POR TÉCNICA, 2018-2032 (MILES DE USD)
TABLA 215 MERCADO DE TRATAMIENTO DE CIRUGÍA EN TURQUÍA PARA EL LINFEDEMA, POR TIPO DE TRATAMIENTO, 2018-2032 (MILES DE USD)
TABLA 216 MERCADO DE FARMACÉUTICOS PARA EL TRATAMIENTO DEL LINFEDEMA EN TURQUÍA, POR TIPO DE TRATAMIENTO, 2018-2032 (MILES DE USD)
TABLA 217 MERCADO DE TRATAMIENTO DEL LINFEDEMA EN TURQUÍA, POR TIPO, 2018-2032 (MILES DE USD)
TABLA 218 LINFEDEMA PRIMARIO EN EL MERCADO DE TRATAMIENTO DEL LINFEDEMA DE TURQUÍA, POR TIPO, 2018-2032 (MILES DE USD)
TABLA 219 MERCADO DE TRATAMIENTO DEL LINFEDEMA EN TURQUÍA, POR ÁREA AFECTADA, 2018-2032 (MILES DE USD)
TABLA 220 MERCADO DE TRATAMIENTO DEL LINFEDEMA EN TURQUÍA, POR GRUPO DE EDAD, 2018-2032 (MILES DE USD)
TABLA 221 MERCADO DE TRATAMIENTO DEL LINFEDEMA EN TURQUÍA, POR VÍA DE ADMINISTRACIÓN, 2018-2032 (MILES DE USD)
TABLA 222 MERCADO DE TRATAMIENTO DEL LINFEDEMA EN TURQUÍA, POR USUARIO FINAL, 2018-2032 (MILES DE USD)
TABLA 223 MERCADO DE TRATAMIENTO DEL LINFEDEMA EN TURQUÍA, POR CANAL DE DISTRIBUCIÓN, 2018-2032 (MILES DE USD)
TABLA 224 MERCADO DE TRATAMIENTO DEL LINFEDEMA EN LOS PAÍSES BAJOS, POR TIPO DE TRATAMIENTO, 2018-2032 (MILES DE USD)
TABLA 225 MERCADO DE TRATAMIENTO DEL LINFEDEMA EN LOS PAÍSES BAJOS, POR TIPO DE TRATAMIENTO, 2018-2032 (VOLUMEN EN MILES DE UNIDADES)
TABLA 226 MERCADO DE TRATAMIENTO DEL LINFEDEMA EN LOS PAÍSES BAJOS, POR TIPO DE TRATAMIENTO, 2018-2032 (ASP EN USD/UNIDADES)
TABLA 227 MERCADO DE TERAPIA DE COMPRESIÓN PARA EL TRATAMIENTO DEL LINFEDEMA EN LOS PAÍSES BAJOS, POR PRODUCTO, 2018-2032 (MILES DE USD)
TABLA 228 PRENDAS DE COMPRESIÓN EN EL MERCADO DE TRATAMIENTO DEL LINFEDEMA DE LOS PAÍSES BAJOS, POR PRODUCTO, 2018-2032 (MILES DE USD)
TABLA 229 MERCADO DE TERAPIA DE COMPRESIÓN PARA EL TRATAMIENTO DEL LINFEDEMA EN LOS PAÍSES BAJOS, POR TÉCNICA, 2018-2032 (MILES DE USD)
TABLA 230 MERCADO DE TRATAMIENTO DE CIRUGÍA PARA EL LINFEDEMA EN LOS PAÍSES BAJOS, POR TIPO DE TRATAMIENTO, 2018-2032 (MILES DE USD)
TABLA 231 MERCADO DE TRATAMIENTO FARMACÉUTICO PARA EL LINFEDEMA EN LOS PAÍSES BAJOS, POR TIPO DE TRATAMIENTO, 2018-2032 (MILES DE USD)
TABLA 232 MERCADO DE TRATAMIENTO DEL LINFEDEMA EN LOS PAÍSES BAJOS, POR TIPO, 2018-2032 (MILES DE USD)
TABLA 233 PAÍSES BAJOS: LINFEDEMA PRIMARIO EN EL MERCADO DE TRATAMIENTO DEL LINFEDEMA, POR TIPO, 2018-2032 (MILES DE USD)
TABLA 234 MERCADO DE TRATAMIENTO DEL LINFEDEMA EN LOS PAÍSES BAJOS, POR ÁREA AFECTADA, 2018-2032 (MILES DE USD)
TABLA 235 MERCADO DE TRATAMIENTO DEL LINFEDEMA EN LOS PAÍSES BAJOS, POR GRUPO DE EDAD, 2018-2032 (MILES DE USD)
TABLA 236 MERCADO DE TRATAMIENTO DEL LINFEDEMA EN LOS PAÍSES BAJOS, POR VÍA DE ADMINISTRACIÓN, 2018-2032 (MILES DE USD)
TABLA 237 MERCADO DE TRATAMIENTO DEL LINFEDEMA EN LOS PAÍSES BAJOS, POR USUARIO FINAL, 2018-2032 (MILES DE USD)
TABLA 238 MERCADO DE TRATAMIENTO DEL LINFEDEMA EN LOS PAÍSES BAJOS, POR CANAL DE DISTRIBUCIÓN, 2018-2032 (MILES DE USD)
TABLA 239 MERCADO SUIZO DE TRATAMIENTO DEL LINFEDEMA, POR TIPO DE TRATAMIENTO, 2018-2032 (MILES DE USD)
TABLA 240 MERCADO SUIZO DE TRATAMIENTO DEL LINFEDEMA, POR TIPO DE TRATAMIENTO, 2018-2032 (VOLUMEN EN MILES DE UNIDADES)
TABLA 241 MERCADO SUIZO DE TRATAMIENTO DEL LINFEDEMA, POR TIPO DE TRATAMIENTO, 2018-2032 (ASP EN USD/UNIDADES)
TABLA 242 MERCADO SUIZO DE TERAPIA DE COMPRESIÓN PARA EL TRATAMIENTO DEL LINFEDEMA, POR PRODUCTO, 2018-2032 (MILES DE USD)
TABLA 243 SUIZA PRENDAS DE COMPRESIÓN EN EL MERCADO DE TRATAMIENTO DEL LINFEDEMA, POR PRODUCTO, 2018-2032 (MILES DE USD)
TABLA 244 MERCADO SUIZO DE TERAPIA DE COMPRESIÓN PARA EL TRATAMIENTO DEL LINFEDEMA, POR TÉCNICA, 2018-2032 (MILES DE USD)
TABLA 245 MERCADO SUIZO DE TRATAMIENTO DE CIRUGÍA PARA EL LINFEDEMA, POR TIPO DE TRATAMIENTO, 2018-2032 (MILES DE USD)
TABLA 246 MERCADO SUIZO DE FARMACOTERAPIA PARA EL TRATAMIENTO DEL LINFEDEMA, POR TIPO DE TRATAMIENTO, 2018-2032 (MILES DE USD)
TABLA 247 MERCADO SUIZO DE TRATAMIENTO DEL LINFEDEMA, POR TIPO, 2018-2032 (MILES DE USD)
TABLA 248 LINFEDEMA PRIMARIO EN EL MERCADO DE TRATAMIENTO DEL LINFEDEMA DE SUIZA, POR TIPO, 2018-2032 (MILES DE USD)
TABLA 249 MERCADO SUIZO DE TRATAMIENTO DEL LINFEDEMA, POR ÁREA AFECTADA, 2018-2032 (MILES DE USD)
TABLA 250 MERCADO SUIZO DE TRATAMIENTO DEL LINFEDEMA, POR GRUPO DE EDAD, 2018-2032 (MILES DE USD)
TABLA 251 MERCADO SUIZO DE TRATAMIENTO DEL LINFEDEMA, POR VÍA DE ADMINISTRACIÓN, 2018-2032 (MILES DE USD)
TABLA 252 MERCADO SUIZO DE TRATAMIENTO DEL LINFEDEMA, POR USUARIO FINAL, 2018-2032 (MILES DE USD)
TABLA 253 MERCADO SUIZO DE TRATAMIENTO DEL LINFEDEMA, POR CANAL DE DISTRIBUCIÓN, 2018-2032 (MILES DE USD)
TABLA 254 MERCADO BÉLGICO DE TRATAMIENTO DEL LINFEDEMA, POR TIPO DE TRATAMIENTO, 2018-2032 (MILES DE USD)
TABLA 255 MERCADO BÉLGICO DE TRATAMIENTO DEL LINFEDEMA, POR TIPO DE TRATAMIENTO, 2018-2032 (VOLUMEN EN MILES DE UNIDADES)
TABLA 256 MERCADO BÉLGICO DE TRATAMIENTO DEL LINFEDEMA, POR TIPO DE TRATAMIENTO, 2018-2032 (ASP EN USD/UNIDADES)
TABLA 257 MERCADO DE TERAPIA DE COMPRESIÓN EN BÉLGICA PARA EL TRATAMIENTO DEL LINFEDEMA, POR PRODUCTO, 2018-2032 (MILES DE USD)
TABLA 258 PRENDAS DE COMPRESIÓN EN EL MERCADO DE TRATAMIENTO DEL LINFEDEMA EN BÉLGICA, POR PRODUCTO, 2018-2032 (MILES DE USD)
TABLA 259 MERCADO DE TERAPIA DE COMPRESIÓN EN BÉLGICA PARA EL TRATAMIENTO DEL LINFEDEMA, POR TÉCNICA, 2018-2032 (MILES DE USD)
TABLA 260 MERCADO DE TRATAMIENTO DE CIRUGÍA EN BELGICA PARA EL LINFEDEMA, POR TIPO DE TRATAMIENTO, 2018-2032 (MILES DE USD)
TABLA 261 MERCADO BÉLGICO DE FARMACÉUTICA PARA EL TRATAMIENTO DEL LINFEDEMA, POR TIPO DE TRATAMIENTO, 2018-2032 (MILES DE USD)
TABLA 262 MERCADO BÉLGICO DE TRATAMIENTO DEL LINFEDEMA, POR TIPO, 2018-2032 (MILES DE USD)
TABLA 263 LINFEDEMA PRIMARIO EN EL MERCADO DE TRATAMIENTO DEL LINFEDEMA DE BÉLGICA, POR TIPO, 2018-2032 (MILES DE USD)
TABLA 264 MERCADO BÉLGICO DE TRATAMIENTO DEL LINFEDEMA, POR ÁREA AFECTADA, 2018-2032 (MILES DE USD)
TABLA 265 MERCADO DE TRATAMIENTO DEL LINFEDEMA EN BÉLGICA, POR GRUPO DE EDAD, 2018-2032 (MILES DE USD)
TABLA 266 MERCADO BÉLGICO DE TRATAMIENTO DEL LINFEDEMA, POR VÍA DE ADMINISTRACIÓN, 2018-2032 (MILES DE USD)
TABLA 267 MERCADO BÉLGICO DE TRATAMIENTO DEL LINFEDEMA, POR USUARIO FINAL, 2018-2032 (MILES DE USD)
TABLA 268 MERCADO BÉLGICO DE TRATAMIENTO DEL LINFEDEMA, POR CANAL DE DISTRIBUCIÓN, 2018-2032 (MILES DE USD)
TABLA 269 MERCADO DE TRATAMIENTO DEL LINFEDEMA EN POLONIA, POR TIPO DE TRATAMIENTO, 2018-2032 (MILES DE USD)
TABLA 270 MERCADO DE TRATAMIENTO DEL LINFEDEMA EN POLONIA, POR TIPO DE TRATAMIENTO, 2018-2032 (VOLUMEN EN MILES DE UNIDADES)
TABLA 271 MERCADO DE TRATAMIENTO DEL LINFEDEMA EN POLONIA, POR TIPO DE TRATAMIENTO, 2018-2032 (ASP EN USD/UNIDADES)
TABLA 272 MERCADO DE TERAPIA DE COMPRESIÓN EN POLONIA PARA EL TRATAMIENTO DEL LINFEDEMA, POR PRODUCTO, 2018-2032 (MILES DE USD)
TABLA 273 PRENDAS DE COMPRESIÓN EN EL MERCADO DE TRATAMIENTO DEL LINFEDEMA DE POLONIA, POR PRODUCTO, 2018-2032 (MILES DE USD)
TABLA 274 MERCADO DE TERAPIA DE COMPRESIÓN EN POLONIA PARA EL TRATAMIENTO DEL LINFEDEMA, POR TÉCNICA, 2018-2032 (MILES DE USD)
TABLA 275 MERCADO DE TRATAMIENTO DE CIRUGÍA PARA EL LINFEDEMA EN POLONIA, POR TIPO DE TRATAMIENTO, 2018-2032 (MILES DE USD)
TABLA 276 MERCADO DE TRATAMIENTO FARMACÉUTICO PARA EL LINFEDEMA EN POLONIA, POR TIPO DE TRATAMIENTO, 2018-2032 (MILES DE USD)
TABLA 277 MERCADO DE TRATAMIENTO DEL LINFEDEMA EN POLONIA, POR TIPO, 2018-2032 (MILES DE USD)
TABLA 278 LINFEDEMA PRIMARIO EN EL MERCADO DE TRATAMIENTO DEL LINFEDEMA DE POLONIA, POR TIPO, 2018-2032 (MILES DE USD)
TABLA 279 MERCADO DE TRATAMIENTO DEL LINFEDEMA EN POLONIA, POR ÁREA AFECTADA, 2018-2032 (MILES DE USD)
TABLA 280 MERCADO DE TRATAMIENTO DEL LINFEDEMA EN POLONIA, POR GRUPO DE EDAD, 2018-2032 (MILES DE USD)
TABLA 281 MERCADO DE TRATAMIENTO DEL LINFEDEMA EN POLONIA, POR VÍA DE ADMINISTRACIÓN, 2018-2032 (MILES DE USD)
TABLA 282 MERCADO DE TRATAMIENTO DEL LINFEDEMA EN POLONIA, POR USUARIO FINAL, 2018-2032 (MILES DE USD)
TABLA 283 MERCADO DE TRATAMIENTO DEL LINFEDEMA EN POLONIA, POR CANAL DE DISTRIBUCIÓN, 2018-2032 (MILES DE USD)
TABLA 284 MERCADO DE TRATAMIENTO DEL LINFEDEMA EN AUSTRIA, POR TIPO DE TRATAMIENTO, 2018-2032 (MILES DE USD)
TABLA 285 MERCADO DE TRATAMIENTO DEL LINFEDEMA EN AUSTRIA, POR TIPO DE TRATAMIENTO, 2018-2032 (VOLUMEN EN MILES DE UNIDADES)
TABLA 286 MERCADO DE TRATAMIENTO DEL LINFEDEMA EN AUSTRIA, POR TIPO DE TRATAMIENTO, 2018-2032 (ASP EN USD/UNIDADES)
TABLA 287 MERCADO DE TERAPIA DE COMPRESIÓN EN AUSTRIA PARA EL TRATAMIENTO DEL LINFEDEMA, POR PRODUCTO, 2018-2032 (MILES DE USD)
TABLA 288 PRENDAS DE COMPRESIÓN DE AUSTRIA EN EL MERCADO DE TRATAMIENTO DEL LINFEDEMA, POR PRODUCTO, 2018-2032 (MILES DE USD)
TABLA 289 MERCADO DE TERAPIA DE COMPRESIÓN EN AUSTRIA PARA EL TRATAMIENTO DEL LINFEDEMA, POR TÉCNICA, 2018-2032 (MILES DE USD)
TABLA 290 MERCADO DE TRATAMIENTO DE CIRUGÍA EN AUSTRIA PARA EL LINFEDEMA, POR TIPO DE TRATAMIENTO, 2018-2032 (MILES DE USD)
TABLA 291 MERCADO DE TRATAMIENTO FARMACÉUTICO PARA EL LINFEDEMA, POR TIPO DE TRATAMIENTO, 2018-2032 (MILES DE USD)
TABLA 292 MERCADO DE TRATAMIENTO DEL LINFEDEMA EN AUSTRIA, POR TIPO, 2018-2032 (MILES DE USD)
TABLA 293 AUSTRIA LINFEDEMA PRIMARIO EN EL MERCADO DE TRATAMIENTO DEL LINFEDEMA, POR TIPO, 2018-2032 (MILES DE USD)
TABLA 294 MERCADO DE TRATAMIENTO DEL LINFEDEMA EN AUSTRIA, POR ÁREA AFECTADA, 2018-2032 (MILES DE USD)
TABLA 295 MERCADO DE TRATAMIENTO DEL LINFEDEMA EN AUSTRIA, POR GRUPO DE EDAD, 2018-2032 (MILES DE USD)
TABLA 296 MERCADO DE TRATAMIENTO DEL LINFEDEMA EN AUSTRIA, POR VÍA DE ADMINISTRACIÓN, 2018-2032 (MILES DE USD)
TABLA 297 MERCADO DE TRATAMIENTO DEL LINFEDEMA EN AUSTRIA, POR USUARIO FINAL, 2018-2032 (MILES DE USD)
TABLA 298 MERCADO DE TRATAMIENTO DEL LINFEDEMA EN AUSTRIA, POR CANAL DE DISTRIBUCIÓN, 2018-2032 (MILES DE USD)
TABLA 299 MERCADO DE TRATAMIENTO DEL LINFEDEMA EN HUNGRÍA, POR TIPO DE TRATAMIENTO, 2018-2032 (MILES DE USD)
TABLA 300 MERCADO DE TRATAMIENTO DEL LINFEDEMA EN HUNGRÍA, POR TIPO DE TRATAMIENTO, 2018-2032 (VOLUMEN EN MILES DE UNIDADES)
TABLA 301 MERCADO DE TRATAMIENTO DEL LINFEDEMA EN HUNGRÍA, POR TIPO DE TRATAMIENTO, 2018-2032 (ASP EN USD/UNIDADES)
TABLA 302 MERCADO DE TERAPIA DE COMPRESIÓN PARA EL TRATAMIENTO DEL LINFEDEMA EN HUNGRÍA, POR PRODUCTO, 2018-2032 (MILES DE USD)
TABLA 303 PRENDAS DE COMPRESIÓN EN EL MERCADO DE TRATAMIENTO DEL LINFEDEMA EN HUNGRÍA, POR PRODUCTO, 2018-2032 (MILES DE USD)
TABLA 304 MERCADO DE TERAPIA DE COMPRESIÓN EN HUNGRÍA PARA EL TRATAMIENTO DEL LINFEDEMA, POR TÉCNICA, 2018-2032 (MILES DE USD)
TABLA 305 MERCADO DE TRATAMIENTO DE CIRUGÍA PARA EL LINFEDEMA EN HUNGRÍA, POR TIPO DE TRATAMIENTO, 2018-2032 (MILES DE USD)
TABLA 306 MERCADO DE TRATAMIENTO FARMACÉUTICO PARA EL LINFEDEMA EN HUNGRÍA, POR TIPO DE TRATAMIENTO, 2018-2032 (MILES DE USD)
TABLA 307 MERCADO DE TRATAMIENTO DEL LINFEDEMA EN HUNGRÍA, POR TIPO, 2018-2032 (MILES DE USD)
TABLA 308 LINFEDEMA PRIMARIO EN EL MERCADO DE TRATAMIENTO DEL LINFEDEMA DE HUNGRÍA, POR TIPO, 2018-2032 (MILES DE USD)
TABLA 309 MERCADO DE TRATAMIENTO DEL LINFEDEMA EN HUNGRÍA, POR ÁREA AFECTADA, 2018-2032 (MILES DE USD)
TABLA 310 MERCADO DE TRATAMIENTO DEL LINFEDEMA EN HUNGRÍA, POR GRUPO DE EDAD, 2018-2032 (MILES DE USD)
TABLA 311 MERCADO DE TRATAMIENTO DEL LINFEDEMA EN HUNGRÍA, POR VÍA DE ADMINISTRACIÓN, 2018-2032 (MILES DE USD)
TABLA 312 MERCADO DE TRATAMIENTO DEL LINFEDEMA EN HUNGRÍA, POR USUARIO FINAL, 2018-2032 (MILES DE USD)
TABLA 313 MERCADO DE TRATAMIENTO DEL LINFEDEMA EN HUNGRÍA, POR CANAL DE DISTRIBUCIÓN, 2018-2032 (MILES DE USD)
TABLA 314 MERCADO NORUEGO DE TRATAMIENTO DEL LINFEDEMA, POR TIPO DE TRATAMIENTO, 2018-2032 (MILES DE USD)
TABLA 315 MERCADO NORUEGO DE TRATAMIENTO DEL LINFEDEMA, POR TIPO DE TRATAMIENTO, 2018-2032 (VOLUMEN EN MILES DE UNIDADES)
TABLA 316 MERCADO NORUEGO DE TRATAMIENTO DEL LINFEDEMA, POR TIPO DE TRATAMIENTO, 2018-2032 (ASP EN USD/UNIDADES)
TABLA 317 MERCADO NORUEGO DE TERAPIA DE COMPRESIÓN PARA EL TRATAMIENTO DEL LINFEDEMA, POR PRODUCTO, 2018-2032 (MILES DE USD)
TABLA 318 PRENDAS DE COMPRESIÓN EN EL MERCADO DE TRATAMIENTO DEL LINFEDEMA DE NORUEGA, POR PRODUCTO, 2018-2032 (MILES DE USD)
TABLA 319 MERCADO NORUEGO DE TERAPIA DE COMPRESIÓN PARA EL TRATAMIENTO DEL LINFEDEMA, POR TÉCNICA, 2018-2032 (MILES DE USD)
TABLA 320 MERCADO NORUEGO DE CIRUGÍA PARA EL TRATAMIENTO DEL LINFEDEMA, POR TIPO DE TRATAMIENTO, 2018-2032 (MILES DE USD)
TABLA 321 MERCADO NORUEGO DE FARMACOLOGÍA PARA EL TRATAMIENTO DEL LINFEDEMA, POR TIPO DE TRATAMIENTO, 2018-2032 (MILES DE USD)
TABLA 322 MERCADO NORUEGO DE TRATAMIENTO DEL LINFEDEMA, POR TIPO, 2018-2032 (MILES DE USD)
TABLA 323 MERCADO DE TRATAMIENTO DEL LINFEDEMA PRIMARIO DE NORUEGA, POR TIPO, 2018-2032 (MILES DE USD)
TABLA 324 MERCADO NORUEGO DE TRATAMIENTO DEL LINFEDEMA, POR ÁREA AFECTADA, 2018-2032 (MILES DE USD)
TABLA 325 MERCADO NORUEGO DE TRATAMIENTO DEL LINFEDEMA, POR GRUPO DE EDAD, 2018-2032 (MILES DE USD)
TABLA 326 MERCADO NORUEGO DE TRATAMIENTO DEL LINFEDEMA, POR VÍA DE ADMINISTRACIÓN, 2018-2032 (MILES DE USD)
TABLA 327 MERCADO NORUEGO DE TRATAMIENTO DEL LINFEDEMA, POR USUARIO FINAL, 2018-2032 (MILES DE USD)
TABLA 328 MERCADO NORUEGO DE TRATAMIENTO DEL LINFEDEMA, POR CANAL DE DISTRIBUCIÓN, 2018-2032 (MILES DE USD)
TABLA 329 MERCADO DE TRATAMIENTO DEL LINFEDEMA EN IRLANDA, POR TIPO DE TRATAMIENTO, 2018-2032 (MILES DE USD)
TABLA 330 MERCADO IRLANDÉS DE TRATAMIENTO DEL LINFEDEMA, POR TIPO DE TRATAMIENTO, 2018-2032 (VOLUMEN EN MILES DE UNIDADES)
TABLA 331 MERCADO DE TRATAMIENTO DEL LINFEDEMA EN IRLANDA, POR TIPO DE TRATAMIENTO, 2018-2032 (ASP EN USD/UNIDADES)
TABLA 332 MERCADO IRLANDÉS DE TERAPIA DE COMPRESIÓN PARA EL TRATAMIENTO DEL LINFEDEMA, POR PRODUCTO, 2018-2032 (MILES DE USD)
TABLA 333 PRENDAS DE COMPRESIÓN EN EL MERCADO DE TRATAMIENTO DEL LINFEDEMA DE IRLANDA, POR PRODUCTO, 2018-2032 (MILES DE USD)
TABLA 334 MERCADO IRLANDÉS DE TERAPIA DE COMPRESIÓN PARA EL TRATAMIENTO DEL LINFEDEMA, POR TÉCNICA, 2018-2032 (MILES DE USD)
TABLA 335 MERCADO IRLANDÉS DE TRATAMIENTO DE CIRUGÍA PARA EL LINFEDEMA, POR TIPO DE TRATAMIENTO, 2018-2032 (MILES DE USD)
TABLA 336 MERCADO IRLANDÉS DE FARMACOLOGÍA PARA EL TRATAMIENTO DEL LINFEDEMA, POR TIPO DE TRATAMIENTO, 2018-2032 (MILES DE USD)
TABLA 337 MERCADO IRLANDÉS DE TRATAMIENTO DEL LINFEDEMA, POR TIPO, 2018-2032 (MILES DE USD)
TABLA 338 LINFEDEMA PRIMARIO EN EL MERCADO DE TRATAMIENTO DEL LINFEDEMA DE IRLANDA, POR TIPO, 2018-2032 (MILES DE USD)
TABLA 339 MERCADO IRLANDÉS DE TRATAMIENTO DEL LINFEDEMA, POR ÁREA AFECTADA, 2018-2032 (MILES DE USD)
TABLA 340 MERCADO DE TRATAMIENTO DEL LINFEDEMA EN IRLANDA, POR GRUPO DE EDAD, 2018-2032 (MILES DE USD)
TABLA 341 MERCADO IRLANDÉS DE TRATAMIENTO DEL LINFEDEMA, POR VÍA DE ADMINISTRACIÓN, 2018-2032 (MILES DE USD)
TABLA 342 MERCADO IRLANDÉS DE TRATAMIENTO DEL LINFEDEMA, POR USUARIO FINAL, 2018-2032 (MILES DE USD)
TABLA 343 MERCADO IRLANDÉS DE TRATAMIENTO DEL LINFEDEMA, POR CANAL DE DISTRIBUCIÓN, 2018-2032 (MILES DE USD)
TABLA 344 MERCADO DE TRATAMIENTO DEL LINFEDEMA EN LITUANIA, POR TIPO DE TRATAMIENTO, 2018-2032 (MILES DE USD)
TABLA 345 MERCADO DE TRATAMIENTO DEL LINFEDEMA EN LITUANIA, POR TIPO DE TRATAMIENTO, 2018-2032 (VOLUMEN EN MILES DE UNIDADES)
TABLA 346 MERCADO DE TRATAMIENTO DEL LINFEDEMA EN LITUANIA, POR TIPO DE TRATAMIENTO, 2018-2032 (ASP EN USD/UNIDADES)
TABLA 347 MERCADO DE TERAPIA DE COMPRESIÓN PARA EL TRATAMIENTO DEL LINFEDEMA EN LITUANIA, POR PRODUCTO, 2018-2032 (MILES DE USD)
TABLA 348 PRENDAS DE COMPRESIÓN DE LITUANIA EN EL MERCADO DE TRATAMIENTO DEL LINFEDEMA, POR PRODUCTO, 2018-2032 (MILES DE USD)
TABLA 349 MERCADO DE TERAPIA DE COMPRESIÓN PARA EL TRATAMIENTO DEL LINFEDEMA EN LITUANIA, POR TÉCNICA, 2018-2032 (MILES DE USD)
TABLA 350 MERCADO DE TRATAMIENTO DE CIRUGÍA PARA EL LINFEDEMA EN LITUANIA, POR TIPO DE TRATAMIENTO, 2018-2032 (MILES DE USD)
TABLA 351 MERCADO DE TRATAMIENTO FARMACÉUTICO PARA EL LINFEDEMA EN LITUANIA, POR TIPO DE TRATAMIENTO, 2018-2032 (MILES DE USD)
TABLA 352 MERCADO DE TRATAMIENTO DEL LINFEDEMA DE LITUANIA, POR TIPO, 2018-2032 (MILES DE USD)
TABLA 353 LITUANIA: MERCADO DE TRATAMIENTO DEL LINFEDEMA PRIMARIO, POR TIPO, 2018-2032 (MILES DE USD)
TABLA 354 MERCADO DE TRATAMIENTO DEL LINFEDEMA DE LITUANIA, POR ÁREA AFECTADA, 2018-2032 (MILES DE USD)
TABLA 355 MERCADO DE TRATAMIENTO DEL LINFEDEMA EN LITUANIA, POR GRUPO DE EDAD, 2018-2032 (MILES DE USD)
TABLA 356 MERCADO DE TRATAMIENTO DEL LINFEDEMA EN LITUANIA, POR VÍA DE ADMINISTRACIÓN, 2018-2032 (MILES DE USD)
TABLA 357 MERCADO DE TRATAMIENTO DEL LINFEDEMA EN LITUANIA, POR USUARIO FINAL, 2018-2032 (MILES DE USD)
TABLA 358 MERCADO DE TRATAMIENTO DEL LINFEDEMA EN LITUANIA, POR CANAL DE DISTRIBUCIÓN, 2018-2032 (MILES DE USD)
TABLA 359 RESTO DE EUROPA MERCADO DE TRATAMIENTO DEL LINFEDEMA, POR TIPO DE TRATAMIENTO, 2018-2032 (MILES DE USD)
TABLA 360 RESTO DE EUROPA MERCADO DE TRATAMIENTO DEL LINFEDEMA, POR TIPO DE TRATAMIENTO, 2018-2032 (VOLUMEN EN MILES DE UNIDADES)
TABLA 361 RESTO DE EUROPA MERCADO DE TRATAMIENTO DEL LINFEDEMA, POR TIPO DE TRATAMIENTO, 2018-2032 (ASP EN USD/UNIDADES)
TABLA 362 MERCADO DE TRATAMIENTO DEL LINFEDEMA EN ASIA-PACÍFICO, POR PAÍS, 2018-2032 (MILES DE USD)
TABLA 363 MERCADO DE TRATAMIENTO DEL LINFEDEMA EN ASIA-PACÍFICO, POR TIPO DE TRATAMIENTO, 2018-2032 (MILES DE USD)
TABLA 364 MERCADO DE TRATAMIENTO DEL LINFEDEMA EN ASIA-PACÍFICO, POR TIPO DE TRATAMIENTO, 2018-2032 (VOLUMEN EN MILES DE UNIDADES)
TABLA 365 MERCADO DE TRATAMIENTO DEL LINFEDEMA EN ASIA-PACÍFICO, POR TIPO DE TRATAMIENTO, 2018-2032 (ASP EN USD/UNIDADES)
TABLA 366 MERCADO DE TERAPIA DE COMPRESIÓN EN EL TRATAMIENTO DEL LINFEDEMA EN ASIA-PACÍFICO, POR PRODUCTO, 2018-2032 (MILES DE USD)
TABLA 367 PRENDAS DE COMPRESIÓN DE ASIA-PACÍFICO EN EL MERCADO DE TRATAMIENTO DEL LINFEDEMA, POR PRODUCTO, 2018-2032 (MILES DE USD)
TABLA 368 MERCADO DE TERAPIA DE COMPRESIÓN EN EL TRATAMIENTO DEL LINFEDEMA EN ASIA-PACÍFICO, POR TÉCNICA, 2018-2032 (MILES DE USD)
TABLA 369 MERCADO DE TRATAMIENTO DE CIRUGÍA PARA EL LINFEDEMA EN ASIA-PACÍFICO, POR TIPO DE TRATAMIENTO, 2018-2032 (MILES DE USD)
TABLA 370 MERCADO DE TERAPIA FARMACÉUTICA PARA EL TRATAMIENTO DEL LINFEDEMA EN ASIA-PACÍFICO, POR TIPO DE TRATAMIENTO, 2018-2032 (MILES DE USD)
TABLA 371 MERCADO DE TRATAMIENTO DEL LINFEDEMA EN ASIA-PACÍFICO, POR TIPO, 2018-2032 (MILES DE USD)
TABLA 372 LINFEDEMA PRIMARIO EN EL MERCADO DE TRATAMIENTO DEL LINFEDEMA DE ASIA-PACÍFICO, POR TIPO, 2018-2032 (MILES DE USD)
TABLA 373 MERCADO DE TRATAMIENTO DEL LINFEDEMA EN ASIA-PACÍFICO, POR ÁREA AFECTADA, 2018-2032 (MILES DE USD)
TABLA 374 MERCADO DE TRATAMIENTO DEL LINFEDEMA EN ASIA-PACÍFICO, POR GRUPO DE EDAD, 2018-2032 (MILES DE USD)
TABLA 375 MERCADO DE TRATAMIENTO DEL LINFEDEMA EN ASIA-PACÍFICO, POR VÍA DE ADMINISTRACIÓN, 2018-2032 (MILES DE USD)
TABLA 376 MERCADO DE TRATAMIENTO DEL LINFEDEMA EN ASIA-PACÍFICO, POR USUARIO FINAL, 2018-2032 (MILES DE USD)
TABLA 377 MERCADO DE TRATAMIENTO DEL LINFEDEMA EN ASIA-PACÍFICO, POR CANAL DE DISTRIBUCIÓN, 2018-2032 (MILES DE USD)
TABLA 378 MERCADO DE TRATAMIENTO DEL LINFEDEMA EN CHINA, POR TIPO DE TRATAMIENTO, 2018-2032 (MILES DE USD)
TABLA 379 MERCADO DE TRATAMIENTO DEL LINFEDEMA EN CHINA, POR TIPO DE TRATAMIENTO, 2018-2032 (VOLUMEN EN MILES DE UNIDADES)
TABLA 380 MERCADO DE TRATAMIENTO DEL LINFEDEMA EN CHINA, POR TIPO DE TRATAMIENTO, 2018-2032 (ASP EN USD/UNIDADES)
TABLA 381 MERCADO DE TERAPIA DE COMPRESIÓN EN CHINA PARA EL TRATAMIENTO DEL LINFEDEMA, POR PRODUCTO, 2018-2032 (MILES DE USD)
TABLA 382 PRENDAS DE COMPRESIÓN DE CHINA EN EL MERCADO DE TRATAMIENTO DEL LINFEDEMA, POR PRODUCTO, 2018-2032 (MILES DE USD)
TABLA 383 MERCADO DE TERAPIA DE COMPRESIÓN EN CHINA PARA EL TRATAMIENTO DEL LINFEDEMA, POR TÉCNICA, 2018-2032 (MILES DE USD)
TABLA 384 MERCADO DE TRATAMIENTO DE CIRUGÍA PARA EL LINFEDEMA EN CHINA, POR TIPO DE TRATAMIENTO, 2018-2032 (MILES DE USD)
TABLA 385 MERCADO DE FARMACÉUTICOS PARA EL TRATAMIENTO DEL LINFEDEMA EN CHINA, POR TIPO DE TRATAMIENTO, 2018-2032 (MILES DE USD)
TABLA 386 MERCADO DE TRATAMIENTO DEL LINFEDEMA EN CHINA, POR TIPO, 2018-2032 (MILES DE USD)
TABLA 387 LINFEDEMA PRIMARIO EN EL MERCADO DE TRATAMIENTO DEL LINFEDEMA DE CHINA, POR TIPO, 2018-2032 (MILES DE USD)
TABLA 388 MERCADO DE TRATAMIENTO DEL LINFEDEMA EN CHINA, POR ÁREA AFECTADA, 2018-2032 (MILES DE USD)
TABLA 389 MERCADO DE TRATAMIENTO DEL LINFEDEMA EN CHINA, POR GRUPO DE EDAD, 2018-2032 (MILES DE USD)
TABLA 390 MERCADO DE TRATAMIENTO DEL LINFEDEMA EN CHINA, POR VÍA DE ADMINISTRACIÓN, 2018-2032 (MILES DE USD)
TABLA 391 MERCADO DE TRATAMIENTO DEL LINFEDEMA EN CHINA, POR USUARIO FINAL, 2018-2032 (MILES DE USD)
TABLA 392 MERCADO DE TRATAMIENTO DEL LINFEDEMA EN CHINA, POR CANAL DE DISTRIBUCIÓN, 2018-2032 (MILES DE USD)
TABLA 393 MERCADO DE TRATAMIENTO DEL LINFEDEMA EN JAPÓN, POR TIPO DE TRATAMIENTO, 2018-2032 (MILES DE USD)
TABLA 394 MERCADO DE TRATAMIENTO DEL LINFEDEMA EN JAPÓN, POR TIPO DE TRATAMIENTO, 2018-2032 (VOLUMEN EN MILES DE UNIDADES)
TABLA 395 MERCADO DE TRATAMIENTO DEL LINFEDEMA EN JAPÓN, POR TIPO DE TRATAMIENTO, 2018-2032 (ASP EN USD/UNIDADES)
TABLA 396 MERCADO DE TERAPIA DE COMPRESIÓN EN JAPÓN PARA EL TRATAMIENTO DEL LINFEDEMA, POR PRODUCTO, 2018-2032 (MILES DE USD)
TABLA 397 PRENDAS DE COMPRESIÓN EN EL MERCADO DE TRATAMIENTO DEL LINFEDEMA DE JAPÓN, POR PRODUCTO, 2018-2032 (MILES DE USD)
TABLA 398 MERCADO DE TERAPIA DE COMPRESIÓN EN EL TRATAMIENTO DEL LINFEDEMA EN JAPÓN, POR TÉCNICA, 2018-2032 (MILES DE USD)
TABLA 399 MERCADO DE TRATAMIENTO DE CIRUGÍA PARA LINFEDEMA EN JAPÓN, POR TIPO DE TRATAMIENTO, 2018-2032 (MILES DE USD)
TABLA 400 MERCADO DE FARMACOLÓGICOS PARA EL TRATAMIENTO DEL LINFEDEMA EN JAPÓN, POR TIPO DE TRATAMIENTO, 2018-2032 (MILES DE USD)
TABLA 401 MERCADO DE TRATAMIENTO DEL LINFEDEMA EN JAPÓN, POR TIPO, 2018-2032 (MILES DE USD)
TABLA 402 LINFEDEMA PRIMARIO EN EL MERCADO DE TRATAMIENTO DEL LINFEDEMA DE JAPÓN, POR TIPO, 2018-2032 (MILES DE USD)
TABLA 403 MERCADO DE TRATAMIENTO DEL LINFEDEMA EN JAPÓN, POR ÁREA AFECTADA, 2018-2032 (MILES DE USD)
TABLA 404 MERCADO DE TRATAMIENTO DEL LINFEDEMA EN JAPÓN, POR GRUPO DE EDAD, 2018-2032 (MILES DE USD)
TABLA 405 MERCADO DE TRATAMIENTO DEL LINFEDEMA EN JAPÓN, POR VÍA DE ADMINISTRACIÓN, 2018-2032 (MILES DE USD)
TABLA 406 MERCADO DE TRATAMIENTO DEL LINFEDEMA EN JAPÓN, POR USUARIO FINAL, 2018-2032 (MILES DE USD)
TABLA 407 MERCADO DE TRATAMIENTO DEL LINFEDEMA EN JAPÓN, POR CANAL DE DISTRIBUCIÓN, 2018-2032 (MILES DE USD)
TABLA 408 MERCADO DE TRATAMIENTO DEL LINFEDEMA EN LA INDIA, POR TIPO DE TRATAMIENTO, 2018-2032 (MILES DE USD)
TABLA 409 MERCADO DE TRATAMIENTO DEL LINFEDEMA EN INDIA, POR TIPO DE TRATAMIENTO, 2018-2032 (VOLUMEN EN MILES DE UNIDADES)
TABLA 410 MERCADO DE TRATAMIENTO DEL LINFEDEMA EN INDIA, POR TIPO DE TRATAMIENTO, 2018-2032 (ASP EN USD/UNIDADES)
TABLA 411 MERCADO DE TERAPIA DE COMPRESIÓN PARA EL TRATAMIENTO DEL LINFEDEMA EN INDIA, POR PRODUCTO, 2018-2032 (MILES DE USD)
TABLA 412 PRENDAS DE COMPRESIÓN EN EL MERCADO DE TRATAMIENTO DEL LINFEDEMA EN LA INDIA, POR PRODUCTO, 2018-2032 (MILES DE USD)
TABLA 413 MERCADO DE TERAPIA DE COMPRESIÓN PARA EL TRATAMIENTO DEL LINFEDEMA EN INDIA, POR TÉCNICA, 2018-2032 (MILES DE USD)
TABLA 414 MERCADO DE TRATAMIENTO DE CIRUGÍA PARA EL LINFEDEMA EN INDIA, POR TIPO DE TRATAMIENTO, 2018-2032 (MILES DE USD)
TABLA 415 MERCADO DE FARMACOLÓGICOS PARA EL TRATAMIENTO DEL LINFEDEMA EN INDIA, POR TIPO DE TRATAMIENTO, 2018-2032 (MILES DE USD)
TABLA 416 MERCADO DE TRATAMIENTO DEL LINFEDEMA EN LA INDIA, POR TIPO, 2018-2032 (MILES DE USD)
TABLA 417 INDIA: LINFEDEMA PRIMARIO EN EL MERCADO DE TRATAMIENTO DEL LINFEDEMA, POR TIPO, 2018-2032 (MILES DE USD)
TABLA 418 MERCADO DE TRATAMIENTO DEL LINFEDEMA EN LA INDIA, POR ÁREA AFECTADA, 2018-2032 (MILES DE USD)
TABLA 419 MERCADO DE TRATAMIENTO DEL LINFEDEMA EN LA INDIA, POR GRUPO DE EDAD, 2018-2032 (MILES DE USD)
TABLA 420 MERCADO DE TRATAMIENTO DEL LINFEDEMA EN LA INDIA, POR VÍA DE ADMINISTRACIÓN, 2018-2032 (MILES DE USD)
TABLA 421 MERCADO DE TRATAMIENTO DEL LINFEDEMA EN LA INDIA, POR USUARIO FINAL, 2018-2032 (MILES DE USD)
TABLA 422 MERCADO DE TRATAMIENTO DEL LINFEDEMA EN LA INDIA, POR CANAL DE DISTRIBUCIÓN, 2018-2032 (MILES DE USD)
TABLA 423 MERCADO DE TRATAMIENTO DEL LINFEDEMA DE COREA DEL SUR, POR TIPO DE TRATAMIENTO, 2018-2032 (MILES DE USD)
TABLA 424 MERCADO DE TRATAMIENTO DEL LINFEDEMA DE COREA DEL SUR, POR TIPO DE TRATAMIENTO, 2018-2032 (VOLUMEN EN MILES DE UNIDADES)
TABLA 425 MERCADO DE TRATAMIENTO DEL LINFEDEMA DE COREA DEL SUR, POR TIPO DE TRATAMIENTO, 2018-2032 (ASP EN USD/UNIDADES)
TABLA 426 MERCADO DE TERAPIA DE COMPRESIÓN PARA EL TRATAMIENTO DEL LINFEDEMA EN COREA DEL SUR, POR PRODUCTO, 2018-2032 (MILES DE USD)
TABLA 427 PRENDAS DE COMPRESIÓN DE COREA DEL SUR EN EL MERCADO DE TRATAMIENTO DEL LINFEDEMA, POR PRODUCTO, 2018-2032 (MILES DE USD)
TABLA 428 MERCADO DE TERAPIA DE COMPRESIÓN PARA EL TRATAMIENTO DEL LINFEDEMA EN COREA DEL SUR, POR TÉCNICA, 2018-2032 (MILES DE USD)
TABLA 429 MERCADO DE TRATAMIENTO DE CIRUGÍA PARA LINFEDEMA EN COREA DEL SUR, POR TIPO DE TRATAMIENTO, 2018-2032 (MILES DE USD)
TABLA 430 MERCADO DE TRATAMIENTO FARMACÉUTICO PARA EL LINFEDEMA EN COREA DEL SUR, POR TIPO DE TRATAMIENTO, 2018-2032 (MILES DE USD)
TABLA 431 MERCADO DE TRATAMIENTO DEL LINFEDEMA DE COREA DEL SUR, POR TIPO, 2018-2032 (MILES DE USD)
TABLA 432 COREA DEL SUR LINFEDEMA PRIMARIO EN EL MERCADO DE TRATAMIENTO DEL LINFEDEMA, POR TIPO, 2018-2032 (MILES DE USD)
TABLA 433 MERCADO DE TRATAMIENTO DEL LINFEDEMA DE COREA DEL SUR, POR ÁREA AFECTADA, 2018-2032 (MILES DE USD)
TABLA 434 MERCADO DE TRATAMIENTO DEL LINFEDEMA EN COREA DEL SUR, POR GRUPO DE EDAD, 2018-2032 (MILES DE USD)
TABLA 435 MERCADO DE TRATAMIENTO DEL LINFEDEMA DE COREA DEL SUR, POR VÍA DE ADMINISTRACIÓN, 2018-2032 (MILES DE USD)
TABLA 436 MERCADO DE TRATAMIENTO DEL LINFEDEMA DE COREA DEL SUR, POR USUARIO FINAL, 2018-2032 (MILES DE USD)
TABLA 437 MERCADO DE TRATAMIENTO DEL LINFEDEMA DE COREA DEL SUR, POR CANAL DE DISTRIBUCIÓN, 2018-2032 (MILES DE USD)
TABLA 438 MERCADO DE TRATAMIENTO DEL LINFEDEMA EN AUSTRALIA, POR TIPO DE TRATAMIENTO, 2018-2032 (MILES DE USD)
TABLA 439 MERCADO DE TRATAMIENTO DEL LINFEDEMA EN AUSTRALIA, POR TIPO DE TRATAMIENTO, 2018-2032 (VOLUMEN EN MILES DE UNIDADES)
TABLA 440 MERCADO DE TRATAMIENTO DEL LINFEDEMA EN AUSTRALIA, POR TIPO DE TRATAMIENTO, 2018-2032 (ASP EN USD/UNIDADES)
TABLA 441 MERCADO DE TERAPIA DE COMPRESIÓN PARA EL TRATAMIENTO DEL LINFEDEMA EN AUSTRALIA, POR PRODUCTO, 2018-2032 (MILES DE USD)
TABLA 442 PRENDAS DE COMPRESIÓN EN EL MERCADO DE TRATAMIENTO DEL LINFEDEMA DE AUSTRALIA, POR PRODUCTO, 2018-2032 (MILES DE USD)
TABLA 443 MERCADO DE TERAPIA DE COMPRESIÓN EN AUSTRALIA PARA EL TRATAMIENTO DEL LINFEDEMA, POR TÉCNICA, 2018-2032 (MILES DE USD)
TABLA 444 MERCADO DE TRATAMIENTO DE CIRUGÍA PARA EL LINFEDEMA EN AUSTRALIA, POR TIPO DE TRATAMIENTO, 2018-2032 (MILES DE USD)
TABLA 445 MERCADO DE TERAPIA FARMACÉUTICA PARA EL TRATAMIENTO DEL LINFEDEMA EN AUSTRALIA, POR TIPO DE TRATAMIENTO, 2018-2032 (MILES DE USD)
TABLA 446 MERCADO DE TRATAMIENTO DEL LINFEDEMA EN AUSTRALIA, POR TIPO, 2018-2032 (MILES DE USD)
TABLA 447 LINFEDEMA PRIMARIO EN EL MERCADO DE TRATAMIENTO DEL LINFEDEMA DE AUSTRALIA, POR TIPO, 2018-2032 (MILES DE USD)
TABLA 448 MERCADO DE TRATAMIENTO DEL LINFEDEMA EN AUSTRALIA, POR ÁREA AFECTADA, 2018-2032 (MILES DE USD)
TABLA 449 MERCADO DE TRATAMIENTO DEL LINFEDEMA EN AUSTRALIA, POR GRUPO DE EDAD, 2018-2032 (MILES DE USD)
TABLA 450 MERCADO DE TRATAMIENTO DEL LINFEDEMA EN AUSTRALIA, POR VÍA DE ADMINISTRACIÓN, 2018-2032 (MILES DE USD)
TABLA 451 MERCADO DE TRATAMIENTO DEL LINFEDEMA EN AUSTRALIA, POR USUARIO FINAL, 2018-2032 (MILES DE USD)
TABLA 452 MERCADO DE TRATAMIENTO DEL LINFEDEMA EN AUSTRALIA, POR CANAL DE DISTRIBUCIÓN, 2018-2032 (MILES DE USD)
TABLA 453 MERCADO DE TRATAMIENTO DEL LINFEDEMA EN INDONESIA, POR TIPO DE TRATAMIENTO, 2018-2032 (MILES DE USD)
TABLA 454 MERCADO DE TRATAMIENTO DEL LINFEDEMA EN INDONESIA, POR TIPO DE TRATAMIENTO, 2018-2032 (VOLUMEN EN MILES DE UNIDADES)
TABLA 455 MERCADO DE TRATAMIENTO DEL LINFEDEMA EN INDONESIA, POR TIPO DE TRATAMIENTO, 2018-2032 (ASP EN USD/UNIDADES)
TABLA 456 MERCADO DE TERAPIA DE COMPRESIÓN PARA EL TRATAMIENTO DEL LINFEDEMA EN INDONESIA, POR PRODUCTO, 2018-2032 (MILES DE USD)
TABLA 457 PRENDAS DE COMPRESIÓN EN EL MERCADO DE TRATAMIENTO DEL LINFEDEMA DE INDONESIA, POR PRODUCTO, 2018-2032 (MILES DE USD)
TABLA 458 MERCADO DE TERAPIA DE COMPRESIÓN PARA EL TRATAMIENTO DEL LINFEDEMA EN INDONESIA, POR TÉCNICA, 2018-2032 (MILES DE USD)
TABLA 459 MERCADO DE TRATAMIENTO DE CIRUGÍA PARA EL LINFEDEMA EN INDONESIA, POR TIPO DE TRATAMIENTO, 2018-2032 (MILES DE USD)
TABLA 460 MERCADO DE TRATAMIENTO FARMACÉUTICO PARA EL LINFEDEMA EN INDONESIA, POR TIPO DE TRATAMIENTO, 2018-2032 (MILES DE USD)
TABLA 461 MERCADO DE TRATAMIENTO DEL LINFEDEMA EN INDONESIA, POR TIPO, 2018-2032 (MILES DE USD)
TABLA 462 LINFEDEMA PRIMARIO EN EL MERCADO DE TRATAMIENTO DEL LINFEDEMA DE INDONESIA, POR TIPO, 2018-2032 (MILES DE USD)
TABLA 463 MERCADO DE TRATAMIENTO DEL LINFEDEMA EN INDONESIA, POR ÁREA AFECTADA, 2018-2032 (MILES DE USD)
TABLA 464 MERCADO DE TRATAMIENTO DEL LINFEDEMA EN INDONESIA, POR GRUPO DE EDAD, 2018-2032 (MILES DE USD)
TABLA 465 MERCADO DE TRATAMIENTO DEL LINFEDEMA EN INDONESIA, POR VÍA DE ADMINISTRACIÓN, 2018-2032 (MILES DE USD)
TABLA 466 MERCADO DE TRATAMIENTO DEL LINFEDEMA EN INDONESIA, POR USUARIO FINAL, 2018-2032 (MILES DE USD)
TABLA 467 MERCADO DE TRATAMIENTO DEL LINFEDEMA EN INDONESIA, POR CANAL DE DISTRIBUCIÓN, 2018-2032 (MILES DE USD)
TABLA 468 MERCADO DE TRATAMIENTO DEL LINFEDEMA DE SINGAPUR, POR TIPO DE TRATAMIENTO, 2018-2032 (MILES DE USD)
TABLA 469 MERCADO DE TRATAMIENTO DEL LINFEDEMA DE SINGAPUR, POR TIPO DE TRATAMIENTO, 2018-2032 (VOLUMEN EN MILES DE UNIDADES)
TABLA 470 MERCADO DE TRATAMIENTO DEL LINFEDEMA DE SINGAPUR, POR TIPO DE TRATAMIENTO, 2018-2032 (ASP EN USD/UNIDADES)
TABLA 471 MERCADO DE TERAPIA DE COMPRESIÓN EN SINGAPUR PARA EL TRATAMIENTO DEL LINFEDEMA, POR PRODUCTO, 2018-2032 (MILES DE USD)
TABLA 472 PRENDAS DE COMPRESIÓN DE SINGAPUR EN EL MERCADO DE TRATAMIENTO DEL LINFEDEMA, POR PRODUCTO, 2018-2032 (MILES DE USD)
TABLA 473 MERCADO DE TERAPIA DE COMPRESIÓN EN SINGAPUR PARA EL TRATAMIENTO DEL LINFEDEMA, POR TÉCNICA, 2018-2032 (MILES DE USD)
TABLA 474 MERCADO DE TRATAMIENTO DE CIRUGÍA PARA EL LINFEDEMA EN SINGAPUR, POR TIPO DE TRATAMIENTO, 2018-2032 (MILES DE USD)
TABLA 475 MERCADO DE TRATAMIENTO FARMACÉUTICO PARA EL LINFEDEMA EN SINGAPUR, POR TIPO DE TRATAMIENTO, 2018-2032 (MILES DE USD)
TABLA 476 MERCADO DE TRATAMIENTO DEL LINFEDEMA DE SINGAPUR, POR TIPO, 2018-2032 (MILES DE USD)
TABLA 477 LINFEDEMA PRIMARIO EN EL MERCADO DE TRATAMIENTO DEL LINFEDEMA DE SINGAPUR, POR TIPO, 2018-2032 (MILES DE USD)
TABLA 478 MERCADO DE TRATAMIENTO DEL LINFEDEMA DE SINGAPUR, POR ÁREA AFECTADA, 2018-2032 (MILES DE USD)
TABLA 479 MERCADO DE TRATAMIENTO DEL LINFEDEMA EN SINGAPUR, POR GRUPO DE EDAD, 2018-2032 (MILES DE USD)
TABLA 480 MERCADO DE TRATAMIENTO DEL LINFEDEMA DE SINGAPUR, POR VÍA DE ADMINISTRACIÓN, 2018-2032 (MILES DE USD)
TABLA 481 MERCADO DE TRATAMIENTO DEL LINFEDEMA DE SINGAPUR, POR USUARIO FINAL, 2018-2032 (MILES DE USD)
TABLA 482 MERCADO DE TRATAMIENTO DEL LINFEDEMA DE SINGAPUR, POR CANAL DE DISTRIBUCIÓN, 2018-2032 (MILES DE USD)
TABLA 483 MERCADO DE TRATAMIENTO DEL LINFEDEMA EN FILIPINAS, POR TIPO DE TRATAMIENTO, 2018-2032 (MILES DE USD)
TABLA 484 MERCADO DE TRATAMIENTO DEL LINFEDEMA EN FILIPINAS, POR TIPO DE TRATAMIENTO, 2018-2032 (VOLUMEN EN MILES DE UNIDADES)
TABLA 485 MERCADO DE TRATAMIENTO DEL LINFEDEMA EN FILIPINAS, POR TIPO DE TRATAMIENTO, 2018-2032 (ASP EN USD/UNIDADES)
TABLA 486 MERCADO DE TERAPIA DE COMPRESIÓN PARA EL TRATAMIENTO DEL LINFEDEMA EN FILIPINAS, POR PRODUCTO, 2018-2032 (MILES DE USD)
TABLA 487 PRENDAS DE COMPRESIÓN EN EL MERCADO DE TRATAMIENTO DEL LINFEDEMA DE FILIPINAS, POR PRODUCTO, 2018-2032 (MILES DE USD)
TABLA 488 MERCADO DE TERAPIA DE COMPRESIÓN PARA EL TRATAMIENTO DEL LINFEDEMA EN FILIPINAS, POR TÉCNICA, 2018-2032 (MILES DE USD)
TABLA 489 MERCADO DE TRATAMIENTO DE CIRUGÍA PARA EL LINFEDEMA EN FILIPINAS, POR TIPO DE TRATAMIENTO, 2018-2032 (MILES DE USD)
TABLA 490 MERCADO DE TERAPIA FARMACÉUTICA PARA EL TRATAMIENTO DEL LINFEDEMA EN FILIPINAS, POR TIPO DE TRATAMIENTO, 2018-2032 (MILES DE USD)
TABLA 491 MERCADO DE TRATAMIENTO DEL LINFEDEMA EN FILIPINAS, POR TIPO, 2018-2032 (MILES DE USD)
TABLA 492 LINFEDEMA PRIMARIO EN EL MERCADO DE TRATAMIENTO DEL LINFEDEMA DE FILIPINAS, POR TIPO, 2018-2032 (MILES DE USD)
TABLA 493 MERCADO DE TRATAMIENTO DEL LINFEDEMA EN FILIPINAS, POR ÁREA AFECTADA, 2018-2032 (MILES DE USD)
TABLA 494 MERCADO DE TRATAMIENTO DEL LINFEDEMA EN FILIPINAS, POR GRUPO DE EDAD, 2018-2032 (MILES DE USD)
TABLA 495 MERCADO DE TRATAMIENTO DEL LINFEDEMA EN FILIPINAS, POR VÍA DE ADMINISTRACIÓN, 2018-2032 (MILES DE USD)
TABLA 496 MERCADO DE TRATAMIENTO DEL LINFEDEMA EN FILIPINAS, POR USUARIO FINAL, 2018-2032 (MILES DE USD)
TABLA 497 MERCADO DE TRATAMIENTO DEL LINFEDEMA EN FILIPINAS, POR CANAL DE DISTRIBUCIÓN, 2018-2032 (MILES DE USD)
TABLA 498 MERCADO DE TRATAMIENTO DEL LINFEDEMA EN TAILANDIA, POR TIPO DE TRATAMIENTO, 2018-2032 (MILES DE USD)
TABLA 499 MERCADO DE TRATAMIENTO DEL LINFEDEMA EN TAILANDIA, POR TIPO DE TRATAMIENTO, 2018-2032 (VOLUMEN EN MILES DE UNIDADES)
TABLA 500 MERCADO DE TRATAMIENTO DEL LINFEDEMA EN TAILANDIA, POR TIPO DE TRATAMIENTO, 2018-2032 (ASP EN USD/UNIDADES)
TABLA 501 MERCADO DE TERAPIA DE COMPRESIÓN PARA EL TRATAMIENTO DEL LINFEDEMA EN TAILANDIA, POR PRODUCTO, 2018-2032 (MILES DE USD)
TABLA 502 PRENDAS DE COMPRESIÓN EN EL MERCADO DE TRATAMIENTO DEL LINFEDEMA DE TAILANDIA, POR PRODUCTO, 2018-2032 (MILES DE USD)
TABLA 503 MERCADO DE TERAPIA DE COMPRESIÓN EN EL TRATAMIENTO DEL LINFEDEMA EN TAILANDIA, POR TÉCNICA, 2018-2032 (MILES DE USD)
TABLA 504 MERCADO DE CIRUGÍA PARA EL TRATAMIENTO DEL LINFEDEMA EN TAILANDIA, POR TIPO DE TRATAMIENTO, 2018-2032 (MILES DE USD)
TABLA 505 MERCADO DE FARMACOLÓGICOS PARA EL TRATAMIENTO DEL LINFEDEMA EN TAILANDIA, POR TIPO DE TRATAMIENTO, 2018-2032 (MILES DE USD)
TABLA 506 MERCADO DE TRATAMIENTO DEL LINFEDEMA EN TAILANDIA, POR TIPO, 2018-2032 (MILES DE USD)
TABLA 507 LINFEDEMA PRIMARIO EN EL MERCADO DE TRATAMIENTO DEL LINFEDEMA DE TAILANDIA, POR TIPO, 2018-2032 (MILES DE USD)
TABLA 508 MERCADO DE TRATAMIENTO DEL LINFEDEMA EN TAILANDIA, POR ÁREA AFECTADA, 2018-2032 (MILES DE USD)
TABLA 509 MERCADO DE TRATAMIENTO DEL LINFEDEMA EN TAILANDIA, POR GRUPO DE EDAD, 2018-2032 (MILES DE USD)
TABLA 510 MERCADO DE TRATAMIENTO DEL LINFEDEMA EN TAILANDIA, POR VÍA DE ADMINISTRACIÓN, 2018-2032 (MILES DE USD)
TABLA 511 MERCADO DE TRATAMIENTO DEL LINFEDEMA EN TAILANDIA, POR USUARIO FINAL, 2018-2032 (MILES DE USD)
TABLA 512 MERCADO DE TRATAMIENTO DEL LINFEDEMA EN TAILANDIA, POR CANAL DE DISTRIBUCIÓN, 2018-2032 (MILES DE USD)
TABLA 513 MERCADO DE TRATAMIENTO DEL LINFEDEMA EN MALASIA, POR TIPO DE TRATAMIENTO, 2018-2032 (MILES DE USD)
TABLA 514 MERCADO DE TRATAMIENTO DEL LINFEDEMA EN MALASIA, POR TIPO DE TRATAMIENTO, 2018-2032 (VOLUMEN EN MILES DE UNIDADES)
TABLA 515 MERCADO DE TRATAMIENTO DEL LINFEDEMA EN MALASIA, POR TIPO DE TRATAMIENTO, 2018-2032 (ASP EN USD/UNIDADES)
TABLA 516 MERCADO DE MALASIA PARA EL TRATAMIENTO DEL LINFEDEMA CON TERAPIA DE COMPRESIÓN, POR PRODUCTO, 2018-2032 (MILES DE USD)
TABLA 517 PRENDAS DE COMPRESIÓN DE MALASIA EN EL MERCADO DE TRATAMIENTO DEL LINFEDEMA, POR PRODUCTO, 2018-2032 (MILES DE USD)
TABLA 518 MERCADO DE MALASIA PARA EL TRATAMIENTO DE LA TERAPIA DE COMPRESIÓN EN EL LINFEDEMA, POR TÉCNICA, 2018-2032 (MILES DE USD)
TABLA 519 MERCADO DE TRATAMIENTO DE CIRUGÍA PARA EL LINFEDEMA EN MALASIA, POR TIPO DE TRATAMIENTO, 2018-2032 (MILES DE USD)
TABLA 520 MERCADO DE FARMACÉUTICA PARA EL TRATAMIENTO DEL LINFEDEMA EN MALASIA, POR TIPO DE TRATAMIENTO, 2018-2032 (MILES DE USD)
TABLA 521 MERCADO DE TRATAMIENTO DEL LINFEDEMA DE MALASIA, POR TIPO, 2018-2032 (MILES DE USD)
TABLA 522 LINFEDEMA PRIMARIO EN EL MERCADO DE TRATAMIENTO DEL LINFEDEMA DE MALASIA, POR TIPO, 2018-2032 (MILES DE USD)
TABLA 523 MERCADO DE TRATAMIENTO DEL LINFEDEMA DE MALASIA, POR ÁREA AFECTADA, 2018-2032 (MILES DE USD)
TABLA 524 MERCADO DE TRATAMIENTO DEL LINFEDEMA EN MALASIA, POR GRUPO DE EDAD, 2018-2032 (MILES DE USD)
TABLA 525 MERCADO DE TRATAMIENTO DEL LINFEDEMA EN MALASIA, POR VÍA DE ADMINISTRACIÓN, 2018-2032 (MILES DE USD)
TABLA 526 MERCADO DE TRATAMIENTO DEL LINFEDEMA EN MALASIA, POR USUARIO FINAL, 2018-2032 (MILES DE USD)
TABLA 527 MERCADO DE TRATAMIENTO DEL LINFEDEMA EN MALASIA, POR CANAL DE DISTRIBUCIÓN, 2018-2032 (MILES DE USD)
TABLA 528 MERCADO DE TRATAMIENTO DEL LINFEDEMA EN VIETNAM, POR TIPO DE TRATAMIENTO, 2018-2032 (MILES DE USD)
TABLA 529 MERCADO DE TRATAMIENTO DEL LINFEDEMA EN VIETNAM, POR TIPO DE TRATAMIENTO, 2018-2032 (VOLUMEN EN MILES DE UNIDADES)
TABLA 530 MERCADO DE TRATAMIENTO DEL LINFEDEMA EN VIETNAM, POR TIPO DE TRATAMIENTO, 2018-2032 (ASP EN USD/UNIDADES)
TABLA 531 MERCADO DE TERAPIA DE COMPRESIÓN EN VIETNAM PARA EL TRATAMIENTO DEL LINFEDEMA, POR PRODUCTO, 2018-2032 (MILES DE USD)
TABLA 532 PRENDAS DE COMPRESIÓN DE VIETNAM EN EL MERCADO DE TRATAMIENTO DEL LINFEDEMA, POR PRODUCTO, 2018-2032 (MILES DE USD)
TABLA 533 MERCADO DE TERAPIA DE COMPRESIÓN EN VIETNAM PARA EL TRATAMIENTO DEL LINFEDEMA, POR TÉCNICA, 2018-2032 (MILES DE USD)
TABLA 534 MERCADO DE TRATAMIENTO DE CIRUGÍA PARA EL LINFEDEMA EN VIETNAM, POR TIPO DE TRATAMIENTO, 2018-2032 (MILES DE USD)
TABLA 535 MERCADO DE TRATAMIENTO FARMACÉUTICO PARA EL LINFEDEMA EN VIETNAM, POR TIPO DE TRATAMIENTO, 2018-2032 (MILES DE USD)
TABLA 536 MERCADO DE TRATAMIENTO DEL LINFEDEMA EN VIETNAM, POR TIPO, 2018-2032 (MILES DE USD)
TABLA 537 VIETNAM: LINFEDEMA PRIMARIO EN EL MERCADO DE TRATAMIENTO DEL LINFEDEMA, POR TIPO, 2018-2032 (MILES DE USD)
TABLA 538 MERCADO DE TRATAMIENTO DEL LINFEDEMA DE VIETNAM, POR ÁREA AFECTADA, 2018-2032 (MILES DE USD)
TABLA 539 MERCADO DE TRATAMIENTO DEL LINFEDEMA EN VIETNAM, POR GRUPO DE EDAD, 2018-2032 (MILES DE USD)
TABLA 540 MERCADO DE TRATAMIENTO DEL LINFEDEMA EN VIETNAM, POR VÍA DE ADMINISTRACIÓN, 2018-2032 (MILES DE USD)
TABLA 541 MERCADO DE TRATAMIENTO DEL LINFEDEMA EN VIETNAM, POR USUARIO FINAL, 2018-2032 (MILES DE USD)
TABLA 542 MERCADO DE TRATAMIENTO DEL LINFEDEMA EN VIETNAM, POR CANAL DE DISTRIBUCIÓN, 2018-2032 (MILES DE USD)
TABLA 543 RESTO DEL MERCADO DE TRATAMIENTO DEL LINFEDEMA DE ASIA-PACÍFICO, POR TIPO DE TRATAMIENTO, 2018-2032 (MILES DE USD)
TABLA 544 RESTO DEL MERCADO DE TRATAMIENTO DEL LINFEDEMA DE ASIA-PACÍFICO, POR TIPO DE TRATAMIENTO, 2018-2032 (VOLUMEN EN MILES DE UNIDADES)
TABLA 545 RESTO DEL MERCADO DE TRATAMIENTO DEL LINFEDEMA DE ASIA-PACÍFICO, POR TIPO DE TRATAMIENTO, 2018-2032 (ASP EN USD/UNIDADES)
TABLA 546 MERCADO DE TRATAMIENTO DEL LINFEDEMA EN ORIENTE MEDIO Y ÁFRICA, POR PAÍS, 2018-2032 (MILES DE USD)
TABLA 547 MERCADO DE TRATAMIENTO DEL LINFEDEMA EN ORIENTE MEDIO Y ÁFRICA, POR TIPO DE TRATAMIENTO, 2018-2032 (MILES DE USD)
TABLA 548 MERCADO DE TRATAMIENTO DEL LINFEDEMA EN ORIENTE MEDIO Y ÁFRICA, POR TIPO DE TRATAMIENTO, 2018-2032 (VOLUMEN EN MILES DE UNIDADES)
TABLA 549 MERCADO DE TRATAMIENTO DEL LINFEDEMA EN ORIENTE MEDIO Y ÁFRICA, POR TIPO DE TRATAMIENTO, 2018-2032 (ASP EN USD/UNIDADES)
TABLA 550 MERCADO DE TERAPIA DE COMPRESIÓN PARA EL TRATAMIENTO DEL LINFEDEMA EN ORIENTE MEDIO Y ÁFRICA, POR PRODUCTO, 2018-2032 (MILES DE USD)
TABLA 551 ORIENTE MEDIO Y ÁFRICA PRENDAS DE COMPRESIÓN EN EL MERCADO DE TRATAMIENTO DEL LINFEDEMA, POR PRODUCTO, 2018-2032 (MILES DE USD)
TABLA 552 MERCADO DE TERAPIA DE COMPRESIÓN PARA EL TRATAMIENTO DEL LINFEDEMA EN ORIENTE MEDIO Y ÁFRICA, POR TÉCNICA, 2018-2032 (MILES DE USD)
TABLA 553 MERCADO DE TRATAMIENTO DE CIRUGÍA PARA LINFEDEMA EN ORIENTE MEDIO Y ÁFRICA, POR TIPO DE TRATAMIENTO, 2018-2032 (MILES DE USD)
TABLA 554 MERCADO DE FARMACOTERAPIA PARA EL TRATAMIENTO DEL LINFEDEMA EN ORIENTE MEDIO Y ÁFRICA, POR TIPO DE TRATAMIENTO, 2018-2032 (MILES DE USD)
TABLA 555 MERCADO DE TRATAMIENTO DEL LINFEDEMA EN ORIENTE MEDIO Y ÁFRICA, POR TIPO, 2018-2032 (MILES DE USD)
TABLA 556 ORIENTE MEDIO Y ÁFRICA LINFEDEMA PRIMARIO EN EL MERCADO DE TRATAMIENTO DEL LINFEDEMA, POR TIPO, 2018-2032 (MILES DE USD)
TABLA 557 MERCADO DE TRATAMIENTO DEL LINFEDEMA EN ORIENTE MEDIO Y ÁFRICA, POR ÁREA AFECTADA, 2018-2032 (MILES DE USD)
TABLA 558 MERCADO DE TRATAMIENTO DEL LINFEDEMA EN ORIENTE MEDIO Y ÁFRICA, POR GRUPO DE EDAD, 2018-2032 (MILES DE USD)
TABLA 559 MERCADO DE TRATAMIENTO DEL LINFEDEMA EN ORIENTE MEDIO Y ÁFRICA, POR VÍA DE ADMINISTRACIÓN, 2018-2032 (MILES DE USD)
TABLA 560 MERCADO DE TRATAMIENTO DEL LINFEDEMA EN ORIENTE MEDIO Y ÁFRICA, POR USUARIO FINAL, 2018-2032 (MILES DE USD)
TABLA 561 MERCADO DE TRATAMIENTO DEL LINFEDEMA EN ORIENTE MEDIO Y ÁFRICA, POR CANAL DE DISTRIBUCIÓN, 2018-2032 (MILES DE USD)
TABLA 562 MERCADO DE TRATAMIENTO DEL LINFEDEMA EN SUDÁFRICA, POR TIPO DE TRATAMIENTO, 2018-2032 (MILES DE USD)
TABLA 563 MERCADO DE TRATAMIENTO DEL LINFEDEMA EN SUDÁFRICA, POR TIPO DE TRATAMIENTO, 2018-2032 (VOLUMEN EN MILES DE UNIDADES)
TABLA 564 MERCADO DE TRATAMIENTO DEL LINFEDEMA EN SUDÁFRICA, POR TIPO DE TRATAMIENTO, 2018-2032 (ASP EN USD/UNIDADES)
TABLA 565 MERCADO DE TERAPIA DE COMPRESIÓN PARA EL TRATAMIENTO DEL LINFEDEMA EN SUDÁFRICA, POR PRODUCTO, 2018-2032 (MILES DE USD)
TABLA 566 PRENDAS DE COMPRESIÓN EN EL MERCADO DE TRATAMIENTO DEL LINFEDEMA DE SUDÁFRICA, POR PRODUCTO, 2018-2032 (MILES DE USD)
TABLA 567 MERCADO DE TERAPIA DE COMPRESIÓN PARA EL TRATAMIENTO DEL LINFEDEMA EN SUDÁFRICA, POR TÉCNICA, 2018-2032 (MILES DE USD)
TABLA 568 MERCADO DE TRATAMIENTO DE CIRUGÍA PARA EL LINFEDEMA EN SUDÁFRICA, POR TIPO DE TRATAMIENTO, 2018-2032 (MILES DE USD)
TABLA 569 MERCADO DE TRATAMIENTO FARMACÉUTICO PARA EL LINFEDEMA EN SUDÁFRICA, POR TIPO DE TRATAMIENTO, 2018-2032 (MILES DE USD)
TABLA 570 MERCADO DE TRATAMIENTO DEL LINFEDEMA EN SUDÁFRICA, POR TIPO, 2018-2032 (MILES DE USD)
TABLA 571 SUDÁFRICA LINFEDEMA PRIMARIO EN EL MERCADO DE TRATAMIENTO DEL LINFEDEMA, POR TIPO, 2018-2032 (MILES DE USD)
TABLA 572 MERCADO DE TRATAMIENTO DEL LINFEDEMA EN SUDÁFRICA, POR ÁREA AFECTADA, 2018-2032 (MILES DE USD)
TABLA 573 MERCADO DE TRATAMIENTO DEL LINFEDEMA EN SUDÁFRICA, POR GRUPO DE EDAD, 2018-2032 (MILES DE USD)
TABLA 574 MERCADO DE TRATAMIENTO DEL LINFEDEMA EN SUDÁFRICA, POR VÍA DE ADMINISTRACIÓN, 2018-2032 (MILES DE USD)
TABLA 575 MERCADO DE TRATAMIENTO DEL LINFEDEMA EN SUDÁFRICA, POR USUARIO FINAL, 2018-2032 (MILES DE USD)
TABLA 576 MERCADO DE TRATAMIENTO DEL LINFEDEMA EN SUDÁFRICA, POR CANAL DE DISTRIBUCIÓN, 2018-2032 (MILES DE USD)
TABLA 577 MERCADO DE TRATAMIENTO DEL LINFEDEMA EN ARABIA SAUDITA, POR TIPO DE TRATAMIENTO, 2018-2032 (MILES DE USD)
TABLA 578 MERCADO DE TRATAMIENTO DEL LINFEDEMA EN ARABIA SAUDITA, POR TIPO DE TRATAMIENTO, 2018-2032 (VOLUMEN EN MILES DE UNIDADES)
TABLA 579 MERCADO DE TRATAMIENTO DEL LINFEDEMA EN ARABIA SAUDITA, POR TIPO DE TRATAMIENTO, 2018-2032 (ASP EN USD/UNIDADES)
TABLA 580 ARABIA SAUDITA: MERCADO DE TERAPIA DE COMPRESIÓN PARA EL TRATAMIENTO DEL LINFEDEMA, POR PRODUCTO, 2018-2032 (MILES DE USD)
TABLA 581 PRENDAS DE COMPRESIÓN EN ARABIA SAUDITA EN EL MERCADO DE TRATAMIENTO DEL LINFEDEMA, POR PRODUCTO, 2018-2032 (MILES DE USD)
TABLA 582 ARABIA SAUDITA MERCADO DE TERAPIA DE COMPRESIÓN PARA EL TRATAMIENTO DEL LINFEDEMA, POR TÉCNICA, 2018-2032 (MILES DE USD)
TABLA 583 MERCADO DE TRATAMIENTO DE CIRUGÍA PARA EL LINFEDEMA EN ARABIA SAUDITA, POR TIPO DE TRATAMIENTO, 2018-2032 (MILES DE USD)
TABLA 584 MERCADO DE FARMACÉUTICA PARA EL TRATAMIENTO DEL LINFEDEMA EN ARABIA SAUDITA, POR TIPO DE TRATAMIENTO, 2018-2032 (MILES DE USD)
TABLA 585 MERCADO DE TRATAMIENTO DEL LINFEDEMA EN ARABIA SAUDITA, POR TIPO, 2018-2032 (MILES DE USD)
TABLA 586 ARABIA SAUDITA LINFEDEMA PRIMARIO EN EL MERCADO DE TRATAMIENTO DEL LINFEDEMA, POR TIPO, 2018-2032 (MILES DE USD)
TABLA 587 MERCADO DE TRATAMIENTO DEL LINFEDEMA EN ARABIA SAUDITA, POR ÁREA AFECTADA, 2018-2032 (MILES DE USD)
TABLA 588 MERCADO DE TRATAMIENTO DEL LINFEDEMA EN ARABIA SAUDITA, POR GRUPO DE EDAD, 2018-2032 (MILES DE USD)
TABLA 589 MERCADO DE TRATAMIENTO DEL LINFEDEMA EN ARABIA SAUDITA, POR VÍA DE ADMINISTRACIÓN, 2018-2032 (MILES DE USD)
TABLA 590 MERCADO DE TRATAMIENTO DEL LINFEDEMA EN ARABIA SAUDITA, POR USUARIO FINAL, 2018-2032 (MILES DE USD)
TABLA 591 MERCADO DE TRATAMIENTO DEL LINFEDEMA EN ARABIA SAUDITA, POR CANAL DE DISTRIBUCIÓN, 2018-2032 (MILES DE USD)
TABLA 592 MERCADO DE TRATAMIENTO DEL LINFEDEMA EN EGIPTO, POR TIPO DE TRATAMIENTO, 2018-2032 (MILES DE USD)
TABLA 593 MERCADO DE TRATAMIENTO DEL LINFEDEMA EN EGIPTO, POR TIPO DE TRATAMIENTO, 2018-2032 (VOLUMEN EN MILES DE UNIDADES)
TABLA 594 MERCADO DE TRATAMIENTO DEL LINFEDEMA EN EGIPTO, POR TIPO DE TRATAMIENTO, 2018-2032 (ASP EN USD/UNIDADES)
TABLA 595 EGIPTO TERAPIA DE COMPRESIÓN EN EL MERCADO DE TRATAMIENTO DEL LINFEDEMA, POR PRODUCTO, 2018-2032 (MILES DE USD)
TABLA 596 EGIPTO PRENDAS DE COMPRESIÓN EN EL MERCADO DE TRATAMIENTO DEL LINFEDEMA, POR PRODUCTO, 2018-2032 (MILES DE USD)
TABLA 597 EGIPTO TERAPIA DE COMPRESIÓN EN EL MERCADO DE TRATAMIENTO DEL LINFEDEMA, POR TÉCNICA, 2018-2032 (MILES DE USD)
TABLA 598 MERCADO DE TRATAMIENTO DE CIRUGÍA EN EGIPTO PARA EL LINFEDEMA, POR TIPO DE TRATAMIENTO, 2018-2032 (MILES DE USD)
TABLA 599 MERCADO DE FARMACÉUTICOS PARA EL TRATAMIENTO DEL LINFEDEMA EN EGIPTO, POR TIPO DE TRATAMIENTO, 2018-2032 (MILES DE USD)
TABLA 600 MERCADO DE TRATAMIENTO DEL LINFEDEMA EN EGIPTO, POR TIPO, 2018-2032 (MILES DE USD)
TABLA 601 LINFEDEMA PRIMARIO EN EGIPTO, MERCADO DE TRATAMIENTO DEL LINFEDEMA, POR TIPO, 2018-2032 (MILES DE USD)
TABLA 602 MERCADO DE TRATAMIENTO DEL LINFEDEMA EN EGIPTO, POR ÁREA AFECTADA, 2018-2032 (MILES DE USD)
TABLA 603 MERCADO DE TRATAMIENTO DEL LINFEDEMA EN EGIPTO, POR GRUPO DE EDAD, 2018-2032 (MILES DE USD)
TABLA 604 MERCADO DE TRATAMIENTO DEL LINFEDEMA EN EGIPTO, POR VÍA DE ADMINISTRACIÓN, 2018-2032 (MILES DE USD)
TABLA 605 MERCADO DE TRATAMIENTO DEL LINFEDEMA EN EGIPTO, POR USUARIO FINAL, 2018-2032 (MILES DE USD)
TABLA 606 MERCADO DE TRATAMIENTO DEL LINFEDEMA EN EGIPTO, POR CANAL DE DISTRIBUCIÓN, 2018-2032 (MILES DE USD)
TABLA 607 MERCADO DE TRATAMIENTO DEL LINFEDEMA EN LOS EAU, POR TIPO DE TRATAMIENTO, 2018-2032 (MILES DE USD)
TABLA 608 MERCADO DE TRATAMIENTO DEL LINFEDEMA EN LOS EAU, POR TIPO DE TRATAMIENTO, 2018-2032 (VOLUMEN EN MILES DE UNIDADES)
TABLA 609 MERCADO DE TRATAMIENTO DEL LINFEDEMA EN LOS EAU, POR TIPO DE TRATAMIENTO, 2018-2032 (ASP EN USD/UNIDADES)
TABLA 610 MERCADO DE TERAPIA DE COMPRESIÓN PARA EL TRATAMIENTO DEL LINFEDEMA EN LOS EAU, POR PRODUCTO, 2018-2032 (MILES DE USD)
TABLA 611 PRENDAS DE COMPRESIÓN DE LOS EAU EN EL MERCADO DE TRATAMIENTO DEL LINFEDEMA, POR PRODUCTO, 2018-2032 (MILES DE USD)
TABLA 612 MERCADO DE TRATAMIENTO DE LINFEDEMA CON TERAPIA DE COMPRESIÓN EN LOS EAU, POR TÉCNICA, 2018-2032 (MILES DE USD)
TABLA 613 MERCADO DE TRATAMIENTO DE CIRUGÍA PARA EL LINFEDEMA EN LOS EAU, POR TIPO DE TRATAMIENTO, 2018-2032 (MILES DE USD)
TABLA 614 MERCADO DE FARMACOLÓGICOS PARA EL TRATAMIENTO DEL LINFEDEMA EN LOS EAU, POR TIPO DE TRATAMIENTO, 2018-2032 (MILES DE USD)
TABLA 615 MERCADO DE TRATAMIENTO DEL LINFEDEMA EN LOS EAU, POR TIPO, 2018-2032 (MILES DE USD)
TABLA 616 LINFEDEMA PRIMARIO EN EL MERCADO DE TRATAMIENTO DEL LINFEDEMA DE LOS EAU, POR TIPO, 2018-2032 (MILES DE USD)
TABLA 617 MERCADO DE TRATAMIENTO DEL LINFEDEMA DE LOS EAU, POR ÁREA AFECTADA, 2018-2032 (MILES DE USD)
TABLA 618 MERCADO DE TRATAMIENTO DEL LINFEDEMA EN LOS EAU, POR GRUPO DE EDAD, 2018-2032 (MILES DE USD)
TABLA 619 MERCADO DE TRATAMIENTO DEL LINFEDEMA EN LOS EAU, POR VÍA DE ADMINISTRACIÓN, 2018-2032 (MILES DE USD)
TABLA 620 MERCADO DE TRATAMIENTO DEL LINFEDEMA EN LOS EAU, POR USUARIO FINAL, 2018-2032 (MILES DE USD)
TABLA 621 MERCADO DE TRATAMIENTO DEL LINFEDEMA EN LOS EAU, POR CANAL DE DISTRIBUCIÓN, 2018-2032 (MILES DE USD)
TABLA 622 MERCADO DE TRATAMIENTO DEL LINFEDEMA EN ISRAEL, POR TIPO DE TRATAMIENTO, 2018-2032 (MILES DE USD)
TABLA 623 MERCADO DE TRATAMIENTO DEL LINFEDEMA EN ISRAEL, POR TIPO DE TRATAMIENTO, 2018-2032 (VOLUMEN EN MILES DE UNIDADES)
TABLA 624 MERCADO DE TRATAMIENTO DEL LINFEDEMA EN ISRAEL, POR TIPO DE TRATAMIENTO, 2018-2032 (ASP EN USD/UNIDADES)
TABLA 625 MERCADO DE TERAPIA DE COMPRESIÓN EN EL TRATAMIENTO DEL LINFEDEMA EN ISRAEL, POR PRODUCTO, 2018-2032 (MILES DE USD)
TABLA 626 PRENDAS DE COMPRESIÓN EN EL MERCADO DE TRATAMIENTO DEL LINFEDEMA DE ISRAEL, POR PRODUCTO, 2018-2032 (MILES DE USD)
TABLA 627 MERCADO DE TERAPIA DE COMPRESIÓN EN EL TRATAMIENTO DEL LINFEDEMA EN ISRAEL, POR TÉCNICA, 2018-2032 (MILES DE USD)
TABLA 628 MERCADO DE TRATAMIENTO DE CIRUGÍA PARA LINFEDEMA EN ISRAEL, POR TIPO DE TRATAMIENTO, 2018-2032 (MILES DE USD)
TABLA 629 MERCADO DE FARMACÉUTICOS PARA EL TRATAMIENTO DEL LINFEDEMA EN ISRAEL, POR TIPO DE TRATAMIENTO, 2018-2032 (MILES DE USD)
TABLA 630 MERCADO DE TRATAMIENTO DEL LINFEDEMA EN ISRAEL, POR TIPO, 2018-2032 (MILES DE USD)
TABLA 631 LINFEDEMA PRIMARIO EN EL MERCADO DE TRATAMIENTO DEL LINFEDEMA DE ISRAEL, POR TIPO, 2018-2032 (MILES DE USD)
TABLA 632 MERCADO DE TRATAMIENTO DEL LINFEDEMA EN ISRAEL, POR ÁREA AFECTADA, 2018-2032 (MILES DE USD)
TABLA 633 MERCADO DE TRATAMIENTO DEL LINFEDEMA EN ISRAEL, POR GRUPO DE EDAD, 2018-2032 (MILES DE USD)
TABLA 634 MERCADO DE TRATAMIENTO DEL LINFEDEMA EN ISRAEL, POR VÍA DE ADMINISTRACIÓN, 2018-2032 (MILES DE USD)
TABLA 635 MERCADO DE TRATAMIENTO DEL LINFEDEMA EN ISRAEL, POR USUARIO FINAL, 2018-2032 (MILES DE USD)
TABLA 636 MERCADO DE TRATAMIENTO DEL LINFEDEMA EN ISRAEL, POR CANAL DE DISTRIBUCIÓN, 2018-2032 (MILES DE USD)
TABLA 637 MERCADO DE TRATAMIENTO DEL LINFEDEMA DE KUWAIT, POR TIPO DE TRATAMIENTO, 2018-2032 (MILES DE USD)
TABLA 638 MERCADO DE TRATAMIENTO DEL LINFEDEMA DE KUWAIT, POR TIPO DE TRATAMIENTO, 2018-2032 (VOLUMEN EN MILES DE UNIDADES)
TABLA 639 MERCADO DE TRATAMIENTO DEL LINFEDEMA DE KUWAIT, POR TIPO DE TRATAMIENTO, 2018-2032 (ASP EN USD/UNIDADES)
TABLA 640 MERCADO DE TERAPIA DE COMPRESIÓN PARA EL TRATAMIENTO DEL LINFEDEMA EN KUWAIT, POR PRODUCTO, 2018-2032 (MILES DE USD)
TABLA 641 PRENDAS DE COMPRESIÓN DE KUWAIT EN EL MERCADO DE TRATAMIENTO DEL LINFEDEMA, POR PRODUCTO, 2018-2032 (MILES DE USD)
TABLA 642 MERCADO DE TERAPIA DE COMPRESIÓN EN KUWAIT PARA EL TRATAMIENTO DEL LINFEDEMA, POR TÉCNICA, 2018-2032 (MILES DE USD)
TABLA 643 MERCADO DE TRATAMIENTO DE CIRUGÍA PARA EL LINFEDEMA EN KUWAIT, POR TIPO DE TRATAMIENTO, 2018-2032 (MILES DE USD)
TABLA 644 MERCADO DE TERAPIA FARMACÉUTICA PARA EL TRATAMIENTO DEL LINFEDEMA EN KUWAIT, POR TIPO DE TRATAMIENTO, 2018-2032 (MILES DE USD)
TABLA 645 MERCADO DE TRATAMIENTO DEL LINFEDEMA DE KUWAIT, POR TIPO, 2018-2032 (MILES DE USD)
TABLA 646 LINFEDEMA PRIMARIO EN EL MERCADO DE TRATAMIENTO DEL LINFEDEMA DE KUWAIT, POR TIPO, 2018-2032 (MILES DE USD)
TABLA 647 MERCADO DE TRATAMIENTO DEL LINFEDEMA DE KUWAIT, POR ÁREA AFECTADA, 2018-2032 (MILES DE USD)
TABLA 648 MERCADO DE TRATAMIENTO DEL LINFEDEMA EN KUWAIT, POR GRUPO DE EDAD, 2018-2032 (MILES DE USD)
TABLA 649 MERCADO DE TRATAMIENTO DEL LINFEDEMA DE KUWAIT, POR VÍA DE ADMINISTRACIÓN, 2018-2032 (MILES DE USD)
TABLA 650 MERCADO DE TRATAMIENTO DEL LINFEDEMA DE KUWAIT, POR USUARIO FINAL, 2018-2032 (MILES DE USD)
TABLA 651 MERCADO DE TRATAMIENTO DEL LINFEDEMA DE KUWAIT, POR CANAL DE DISTRIBUCIÓN, 2018-2032 (MILES DE USD)
TABLA 652 RESTO DEL MERCADO DE TRATAMIENTO DEL LINFEDEMA EN ORIENTE MEDIO Y ÁFRICA, POR TIPO DE TRATAMIENTO, 2018-2032 (MILES DE USD)
TABLA 653 RESTO DEL MERCADO DE TRATAMIENTO DEL LINFEDEMA EN ORIENTE MEDIO Y ÁFRICA, POR TIPO DE TRATAMIENTO, 2018-2032 (VOLUMEN EN MILES DE UNIDADES)
TABLA 654 RESTO DEL MERCADO DE TRATAMIENTO DEL LINFEDEMA EN ORIENTE MEDIO Y ÁFRICA, POR TIPO DE TRATAMIENTO, 2018-2032 (ASP EN USD/UNIDADES)
TABLA 655 MERCADO DE TRATAMIENTO DEL LINFEDEMA EN AMÉRICA DEL SUR, POR PAÍS, 2018-2032 (MILES DE USD)
TABLA 656 MERCADO DE TRATAMIENTO DEL LINFEDEMA EN AMÉRICA DEL SUR, POR TIPO DE TRATAMIENTO, 2018-2032 (MILES DE USD)
TABLA 657 MERCADO DE TRATAMIENTO DEL LINFEDEMA EN AMÉRICA DEL SUR, POR TIPO DE TRATAMIENTO, 2018-2032 (VOLUMEN EN MILES DE UNIDADES)
TABLA 658 MERCADO DE TRATAMIENTO DEL LINFEDEMA EN AMÉRICA DEL SUR, POR TIPO DE TRATAMIENTO, 2018-2032 (ASP EN USD/UNIDADES)
TABLA 659 MERCADO DE TERAPIA DE COMPRESIÓN PARA EL TRATAMIENTO DEL LINFEDEMA EN AMÉRICA DEL SUR, POR PRODUCTO, 2018-2032 (MILES DE USD)
TABLA 660 PRENDAS DE COMPRESIÓN EN EL MERCADO DE TRATAMIENTO DEL LINFEDEMA EN AMÉRICA DEL SUR, POR PRODUCTO, 2018-2032 (MILES DE USD)
TABLA 661 MERCADO DE TERAPIA DE COMPRESIÓN EN AMÉRICA DEL SUR PARA EL TRATAMIENTO DEL LINFEDEMA, POR TÉCNICA, 2018-2032 (MILES DE USD)
TABLA 662 MERCADO DE TRATAMIENTO DE CIRUGÍA PARA LINFEDEMA EN SUDAMÉRICA, POR TIPO DE TRATAMIENTO, 2018-2032 (MILES DE USD)
TABLA 663 MERCADO DE TRATAMIENTO FARMACÉUTICO PARA EL LINFEDEMA EN AMÉRICA DEL SUR, POR TIPO DE TRATAMIENTO, 2018-2032 (MILES DE USD)
TABLA 664 MERCADO DE TRATAMIENTO DEL LINFEDEMA EN AMÉRICA DEL SUR, POR TIPO, 2018-2032 (MILES DE USD)
TABLA 665 AMÉRICA DEL SUR LINFEDEMA PRIMARIO EN EL MERCADO DE TRATAMIENTO DEL LINFEDEMA, POR TIPO, 2018-2032 (MILES DE USD)
TABLA 666 MERCADO DE TRATAMIENTO DEL LINFEDEMA EN AMÉRICA DEL SUR, POR ÁREA AFECTADA, 2018-2032 (MILES DE USD)
TABLA 667 MERCADO DE TRATAMIENTO DEL LINFEDEMA EN AMÉRICA DEL SUR, POR GRUPO DE EDAD, 2018-2032 (MILES DE USD)
TABLA 668 MERCADO DE TRATAMIENTO DEL LINFEDEMA EN AMÉRICA DEL SUR, POR VÍA DE ADMINISTRACIÓN, 2018-2032 (MILES DE USD)
TABLA 669 MERCADO DE TRATAMIENTO DEL LINFEDEMA EN AMÉRICA DEL SUR, POR USUARIO FINAL, 2018-2032 (MILES DE USD)
TABLA 670 MERCADO DE TRATAMIENTO DEL LINFEDEMA EN AMÉRICA DEL SUR, POR CANAL DE DISTRIBUCIÓN, 2018-2032 (MILES DE USD)
TABLA 671 MERCADO DE TRATAMIENTO DEL LINFEDEMA EN BRASIL, POR TIPO DE TRATAMIENTO, 2018-2032 (MILES DE USD)
TABLA 672 MERCADO DE TRATAMIENTO DEL LINFEDEMA EN BRASIL, POR TIPO DE TRATAMIENTO, 2018-2032 (VOLUMEN EN MILES DE UNIDADES)
TABLA 673 MERCADO DE TRATAMIENTO DEL LINFEDEMA EN BRASIL, POR TIPO DE TRATAMIENTO, 2018-2032 (ASP EN USD/UNIDADES)
TABLA 674 MERCADO DE TERAPIA DE COMPRESIÓN EN BRASIL PARA EL TRATAMIENTO DEL LINFEDEMA, POR PRODUCTO, 2018-2032 (MILES DE USD)
TABLA 675 MERCADO DE PRENDAS DE COMPRESIÓN PARA EL TRATAMIENTO DEL LINFEDEMA EN BRASIL, POR PRODUCTO, 2018-2032 (MILES DE USD)
TABLA 676 MERCADO DE TERAPIA DE COMPRESIÓN EN BRASIL PARA EL TRATAMIENTO DEL LINFEDEMA, POR TÉCNICA, 2018-2032 (MILES DE USD)
TABLA 677 MERCADO DE TRATAMIENTO DE CIRUGÍA EN BRASIL PARA EL LINFEDEMA, POR TIPO DE TRATAMIENTO, 2018-2032 (MILES DE USD)
TABLA 678 MERCADO DE TERAPIA FARMACÉUTICA PARA EL TRATAMIENTO DEL LINFEDEMA EN BRASIL, POR TIPO DE TRATAMIENTO, 2018-2032 (MILES DE USD)
TABLA 679 MERCADO DE TRATAMIENTO DEL LINFEDEMA EN BRASIL, POR TIPO, 2018-2032 (MILES DE USD)
TABLA 680 LINFEDEMA PRIMARIO EN EL MERCADO DE TRATAMIENTO DEL LINFEDEMA DE BRASIL, POR TIPO, 2018-2032 (MILES DE USD)
TABLA 681 MERCADO DE TRATAMIENTO DEL LINFEDEMA EN BRASIL, POR ÁREA AFECTADA, 2018-2032 (MILES DE USD)
TABLA 682 MERCADO DE TRATAMIENTO DEL LINFEDEMA EN BRASIL, POR GRUPO DE EDAD, 2018-2032 (MILES DE USD)
TABLA 683 MERCADO DE TRATAMIENTO DEL LINFEDEMA EN BRASIL, POR VÍA DE ADMINISTRACIÓN, 2018-2032 (MILES DE USD)
TABLA 684 MERCADO DE TRATAMIENTO DEL LINFEDEMA EN BRASIL, POR USUARIO FINAL, 2018-2032 (MILES DE USD)
TABLA 685 MERCADO DE TRATAMIENTO DEL LINFEDEMA EN BRASIL, POR CANAL DE DISTRIBUCIÓN, 2018-2032 (MILES DE USD)
TABLA 686 MERCADO ARGENTINO DE TRATAMIENTO DEL LINFEDEMA, POR TIPO DE TRATAMIENTO, 2018-2032 (MILES DE USD)
TABLA 687 MERCADO ARGENTINO DE TRATAMIENTO DEL LINFEDEMA, POR TIPO DE TRATAMIENTO, 2018-2032 (VOLUMEN EN MILES DE UNIDADES)
TABLA 688 MERCADO ARGENTINO DE TRATAMIENTO DEL LINFEDEMA, POR TIPO DE TRATAMIENTO, 2018-2032 (ASP EN USD/UNIDADES)
TABLA 689 MERCADO ARGENTINO DE TERAPIA DE COMPRESIÓN PARA EL TRATAMIENTO DEL LINFEDEMA, POR PRODUCTO, 2018-2032 (MILES DE USD)
TABLA 690 MERCADO ARGENTINO DE PRENDAS DE COMPRESIÓN PARA EL TRATAMIENTO DEL LINFEDEMA, POR PRODUCTO, 2018-2032 (MILES DE USD)
TABLA 691 MERCADO ARGENTINO DE TERAPIA DE COMPRESIÓN PARA EL TRATAMIENTO DEL LINFEDEMA, POR TÉCNICA, 2018-2032 (MILES DE USD)
TABLA 692 MERCADO ARGENTINO DE CIRUGÍA PARA EL TRATAMIENTO DEL LINFEDEMA, POR TIPO DE TRATAMIENTO, 2018-2032 (MILES DE USD)
TABLA 693 MERCADO ARGENTINO DE FARMACOLOGÍA PARA EL TRATAMIENTO DEL LINFEDEMA, POR TIPO DE TRATAMIENTO, 2018-2032 (MILES DE USD)
TABLA 694 MERCADO ARGENTINO DE TRATAMIENTO DEL LINFEDEMA, POR TIPO, 2018-2032 (MILES DE USD)
TABLA 695 LINFEDEMA PRIMARIO EN EL MERCADO DE TRATAMIENTO DEL LINFEDEMA DE ARGENTINA, POR TIPO, 2018-2032 (MILES DE USD)
TABLA 696 MERCADO ARGENTINO DE TRATAMIENTO DEL LINFEDEMA, POR ÁREA AFECTADA, 2018-2032 (MILES DE USD)
TABLA 697 MERCADO ARGENTINO DE TRATAMIENTO DEL LINFEDEMA, POR GRUPO EDAD, 2018-2032 (MILES DE USD)
TABLA 698 MERCADO ARGENTINO DE TRATAMIENTO DEL LINFEDEMA, POR VÍA DE ADMINISTRACIÓN, 2018-2032 (MILES DE USD)
TABLA 699 MERCADO ARGENTINO DE TRATAMIENTO DEL LINFEDEMA, POR USUARIO FINAL, 2018-2032 (MILES DE USD)
TABLA 700 MERCADO ARGENTINO DE TRATAMIENTO DEL LINFEDEMA, POR CANAL DE DISTRIBUCIÓN, 2018-2032 (MILES DE USD)
TABLA 701 MERCADO DE TRATAMIENTO DEL LINFEDEMA EN PERÚ, POR TIPO DE TRATAMIENTO, 2018-2032 (MILES DE USD)
TABLA 702 MERCADO DE TRATAMIENTO DEL LINFEDEMA EN PERÚ, POR TIPO DE TRATAMIENTO, 2018-2032 (VOLUMEN EN MILES DE UNIDADES)
TABLA 703 MERCADO DE TRATAMIENTO DEL LINFEDEMA EN PERÚ, POR TIPO DE TRATAMIENTO, 2018-2032 (ASP EN USD/UNIDADES)
TABLA 704 MERCADO DE TERAPIA DE COMPRESIÓN EN EL TRATAMIENTO DEL LINFEDEMA EN PERÚ, POR PRODUCTO, 2018-2032 (MILES DE USD)
TABLA 705 MERCADO DE PRENDAS DE COMPRESIÓN EN EL TRATAMIENTO DEL LINFEDEMA EN PERÚ, POR PRODUCTO, 2018-2032 (MILES DE USD)
TABLA 706 MERCADO DE TERAPIA DE COMPRESIÓN EN EL TRATAMIENTO DEL LINFEDEMA EN PERÚ, POR TÉCNICA, 2018-2032 (MILES DE USD)
TABLA 707 MERCADO DE TRATAMIENTO DE CIRUGÍA EN LINFEDEMA EN PERÚ, POR TIPO DE TRATAMIENTO, 2018-2032 (MILES DE USD)
TABLA 708 MERCADO PERUANO DE FARMACÉUTICA PARA EL TRATAMIENTO DEL LINFEDEMA, POR TIPO DE TRATAMIENTO, 2018-2032 (MILES DE USD)
TABLA 709 MERCADO DE TRATAMIENTO DEL LINFEDEMA EN PERÚ, POR TIPO, 2018-2032 (MILES DE USD)
TABLA 710 PERÚ LINFEDEMA PRIMARIO EN EL MERCADO DE TRATAMIENTO DEL LINFEDEMA, POR TIPO, 2018-2032 (MILES DE USD)
TABLA 711 MERCADO DE TRATAMIENTO DEL LINFEDEMA EN PERÚ, POR ÁREA AFECTADA, 2018-2032 (MILES DE USD)
TABLA 712 MERCADO DE TRATAMIENTO DEL LINFEDEMA EN PERÚ, POR GRUPO DE EDAD, 2018-2032 (MILES DE USD)
TABLA 713 MERCADO DE TRATAMIENTO DEL LINFEDEMA EN PERÚ, POR VÍA DE ADMINISTRACIÓN, 2018-2032 (MILES DE USD)
TABLA 714 MERCADO DE TRATAMIENTO DEL LINFEDEMA EN PERÚ, POR USUARIO FINAL, 2018-2032 (MILES DE USD)
TABLA 715 MERCADO DE TRATAMIENTO DEL LINFEDEMA EN PERÚ, POR CANAL DE DISTRIBUCIÓN, 2018-2032 (MILES DE USD)
TABLA 716 RESTO DEL MERCADO DE TRATAMIENTO DEL LINFEDEMA EN SUDAMÉRICA, POR TIPO DE TRATAMIENTO, 2018-2032 (MILES DE USD)
TABLA 717 RESTO DE AMÉRICA DEL SUR MERCADO DE TRATAMIENTO DEL LINFEDEMA, POR TIPO DE TRATAMIENTO, 2018-2032 (VOLUMEN EN MILES DE UNIDADES)
TABLA 718 RESTO DEL MERCADO DE TRATAMIENTO DEL LINFEDEMA EN SUDAMÉRICA, POR TIPO DE TRATAMIENTO, 2018-2032 (ASP EN USD/UNIDADES)
Lista de figuras
FIGURA 1 MERCADO MUNDIAL DE TRATAMIENTO DEL LINFEDEMA: SEGMENTACIÓN
FIGURA 2 MERCADO MUNDIAL DE TRATAMIENTO DEL LINFEDEMA: TRIANGULACIÓN DE DATOS
FIGURA 3 MERCADO MUNDIAL DE TRATAMIENTO DEL LINFEDEMA: ANÁLISIS DROC
FIGURA 4 MERCADO MUNDIAL DE TRATAMIENTO DEL LINFEDEMA: ANÁLISIS GLOBAL VS. REGIONAL
FIGURA 5 MERCADO MUNDIAL DE TRATAMIENTO DEL LINFEDEMA: ANÁLISIS DE INVESTIGACIÓN DE EMPRESAS
FIGURA 6 MERCADO MUNDIAL DE TRATAMIENTO DEL LINFEDEMA: DATOS DEMOGRÁFICOS DE LAS ENTREVISTAS
FIGURA 7 MERCADO MUNDIAL DE TRATAMIENTO DEL LINFEDEMA: CUADRÍCULA DE POSICIÓN EN EL MERCADO DE DBMR
FIGURA 8 MERCADO MUNDIAL DE TRATAMIENTO DEL LINFEDEMA: CUADRÍCULA DE COBERTURA DE USUARIOS FINALES DEL MERCADO
FIGURA 9 MERCADO MUNDIAL DE TRATAMIENTO DEL LINFEDEMA: ANÁLISIS DE LA PARTICIPACIÓN DE LOS PROVEEDORES
FIGURA 10 RESUMEN EJECUTIVO
FIGURA 11 CINCO SEGMENTOS COMPONEN EL MERCADO MUNDIAL DE TRATAMIENTO DEL LINFEDEMA, POR TIPO DE TRATAMIENTO (2024)
FIGURA 12 DECISIONES ESTRATÉGICAS
FIGURA 13 MERCADO MUNDIAL DE TRATAMIENTO DEL LINFEDEMA: SEGMENTACIÓN
FIGURA 14 SE ESPERA QUE AMÉRICA DEL NORTE DOMINE Y SE ESPERA QUE ASIA-PACÍFICO CREZCA CON LA CAGR MÁS ALTA EN EL PERÍODO DE PRONÓSTICO
FIGURA 15 SE ESPERA QUE EL AUMENTO EN LA PREVALENCIA DE CÁNCERES IMPULSE EL MERCADO MUNDIAL DE TRATAMIENTO DEL LINFEDEMA EN EL PERÍODO PRONOSTICADO DE 2025 A 2032
FIGURA 16 SE ESPERA QUE EL SEGMENTO DE TERAPIA DE COMPRESIÓN REPRESENTE LA MAYOR PARTICIPACIÓN DEL MERCADO MUNDIAL DE TRATAMIENTO DEL LINFEDEMA EN 2025 Y 2032
FIGURA 17 ASIA-PACÍFICO ES LA REGIÓN DE MÁS RÁPIDO CRECIMIENTO PARA EL MERCADO MUNDIAL DE TRATAMIENTO DEL LINFEDEMA EN EL PERÍODO DE PRONÓSTICO
FIGURA 18 IMPULSORES, RESTRICCIONES, OPORTUNIDADES Y DESAFÍOS DEL MERCADO DE ZEOLITA EN INDONESIA
FIGURA 19 MERCADO MUNDIAL DE TRATAMIENTO DEL LINFEDEMA: POR TIPO DE TRATAMIENTO, 2024
FIGURA 20 MERCADO MUNDIAL DE TRATAMIENTO DEL LINFEDEMA: POR TIPO DE TRATAMIENTO, 2025-2032 (MILES DE USD)
FIGURA 21 MERCADO MUNDIAL DE TRATAMIENTO DEL LINFEDEMA: POR TIPO DE TRATAMIENTO, CAGR (2025-2032)
FIGURA 22 MERCADO MUNDIAL DE TRATAMIENTO DEL LINFEDEMA: POR TIPO DE TRATAMIENTO, CURVA LIFELINE
FIGURA 23 MERCADO MUNDIAL DE TRATAMIENTO DEL LINFEDEMA: POR TIPO, 2024
FIGURA 24 MERCADO MUNDIAL DE TRATAMIENTO DEL LINFEDEMA: POR TIPO, 2025-2032 (MILES DE USD)
FIGURA 25 MERCADO MUNDIAL DE TRATAMIENTO DEL LINFEDEMA: POR TIPO, CAGR (2025-2032)
FIGURA 26 MERCADO MUNDIAL DE TRATAMIENTO DEL LINFEDEMA: POR TIPO, CURVA DE LÍNEA DE VIDA
FIGURA 27 MERCADO MUNDIAL DE TRATAMIENTO DEL LINFEDEMA: POR ÁREA AFECTADA, 2024
FIGURA 28 MERCADO MUNDIAL DE TRATAMIENTO DEL LINFEDEMA: POR ÁREA AFECTADA, 2025-2032 (MILES DE USD)
FIGURA 29 MERCADO MUNDIAL DE TRATAMIENTO DEL LINFEDEMA: POR ÁREA AFECTADA, CAGR (2025-2032)
FIGURA 30 MERCADO MUNDIAL DE TRATAMIENTO DEL LINFEDEMA: POR ÁREA AFECTADA, CURVA DE LÍNEA DE VIDA
FIGURA 31 MERCADO MUNDIAL DE TRATAMIENTO DEL LINFEDEMA: POR GRUPO DE EDAD, 2024
FIGURA 32 MERCADO MUNDIAL DE TRATAMIENTO DEL LINFEDEMA: POR GRUPO DE EDAD, 2025-2032 (MILES DE USD)
FIGURA 33 MERCADO MUNDIAL DE TRATAMIENTO DEL LINFEDEMA: POR GRUPO DE EDAD, CAGR (2025-2032)
FIGURA 34 MERCADO MUNDIAL DE TRATAMIENTO DEL LINFEDEMA: POR GRUPO DE EDAD, CURVA DE LÍNEA DE VIDA
FIGURA 35 MERCADO MUNDIAL DE TRATAMIENTO DEL LINFEDEMA: POR VÍA DE ADMINISTRACIÓN, 2024
FIGURA 36 MERCADO MUNDIAL DE TRATAMIENTO DEL LINFEDEMA: POR VÍA DE ADMINISTRACIÓN, 2025-2032 (MILES DE USD)
FIGURA 37 MERCADO MUNDIAL DE TRATAMIENTO DEL LINFEDEMA: POR VÍA DE ADMINISTRACIÓN, CAGR (2025-2032)
FIGURA 38 MERCADO MUNDIAL DE TRATAMIENTO DEL LINFEDEMA: POR VÍA DE ADMINISTRACIÓN, CURVA DE LÍNEA DE VIDA
FIGURA 39 MERCADO MUNDIAL DE TRATAMIENTO DEL LINFEDEMA: POR USUARIO FINAL, 2024
FIGURA 40 MERCADO MUNDIAL DE TRATAMIENTO DEL LINFEDEMA: POR USUARIO FINAL, 2025-2032 (MILES DE USD)
FIGURA 41 MERCADO MUNDIAL DE TRATAMIENTO DEL LINFEDEMA: POR USUARIO FINAL, CAGR (2025-2032)
FIGURA 42 MERCADO MUNDIAL DE TRATAMIENTO DEL LINFEDEMA: POR USUARIO FINAL, CURVA LIFELINE
FIGURA 43 MERCADO MUNDIAL DE TRATAMIENTO DEL LINFEDEMA: POR CANAL DE DISTRIBUCIÓN, 2024
FIGURA 44 MERCADO MUNDIAL DE TRATAMIENTO DEL LINFEDEMA: POR CANAL DE DISTRIBUCIÓN, 2025-2032 (MILES DE USD)
FIGURA 45 MERCADO MUNDIAL DE TRATAMIENTO DEL LINFEDEMA: POR CANAL DE DISTRIBUCIÓN, CAGR (2025-2032)
FIGURA 46 MERCADO MUNDIAL DE TRATAMIENTO DEL LINFEDEMA: POR CANAL DE DISTRIBUCIÓN, CURVA LIFELINE
FIGURA 47 MERCADO MUNDIAL DE TRATAMIENTO DEL LINFEDEMA: INSTANTÁNEA (2024)
FIGURA 48 MERCADO MUNDIAL DE TRATAMIENTO DEL LINFEDEMA: PARTICIPACIÓN DE LA EMPRESA 2024 (%)
FIGURA 49 MERCADO DE TRATAMIENTO DEL LINFEDEMA EN AMÉRICA DEL NORTE: PARTICIPACIÓN DE LA EMPRESA 2024 (%)
FIGURA 50 MERCADO EUROPEO DE TRATAMIENTO DEL LINFEDEMA: CUOTA DE LA EMPRESA 2024 (%)
FIGURA 51 TRATAMIENTO DEL LINFEDEMA EN ASIA-PACÍFICO: PARTICIPACIÓN DE LA EMPRESA 2024 (%)
Metodología de investigación
La recopilación de datos y el análisis del año base se realizan utilizando módulos de recopilación de datos con muestras de gran tamaño. La etapa incluye la obtención de información de mercado o datos relacionados a través de varias fuentes y estrategias. Incluye el examen y la planificación de todos los datos adquiridos del pasado con antelación. Asimismo, abarca el examen de las inconsistencias de información observadas en diferentes fuentes de información. Los datos de mercado se analizan y estiman utilizando modelos estadísticos y coherentes de mercado. Además, el análisis de la participación de mercado y el análisis de tendencias clave son los principales factores de éxito en el informe de mercado. Para obtener más información, solicite una llamada de un analista o envíe su consulta.
La metodología de investigación clave utilizada por el equipo de investigación de DBMR es la triangulación de datos, que implica la extracción de datos, el análisis del impacto de las variables de datos en el mercado y la validación primaria (experto en la industria). Los modelos de datos incluyen cuadrícula de posicionamiento de proveedores, análisis de línea de tiempo de mercado, descripción general y guía del mercado, cuadrícula de posicionamiento de la empresa, análisis de patentes, análisis de precios, análisis de participación de mercado de la empresa, estándares de medición, análisis global versus regional y de participación de proveedores. Para obtener más información sobre la metodología de investigación, envíe una consulta para hablar con nuestros expertos de la industria.
Personalización disponible
Data Bridge Market Research es líder en investigación formativa avanzada. Nos enorgullecemos de brindar servicios a nuestros clientes existentes y nuevos con datos y análisis que coinciden y se adaptan a sus objetivos. El informe se puede personalizar para incluir análisis de tendencias de precios de marcas objetivo, comprensión del mercado de países adicionales (solicite la lista de países), datos de resultados de ensayos clínicos, revisión de literatura, análisis de mercado renovado y base de productos. El análisis de mercado de competidores objetivo se puede analizar desde análisis basados en tecnología hasta estrategias de cartera de mercado. Podemos agregar tantos competidores sobre los que necesite datos en el formato y estilo de datos que esté buscando. Nuestro equipo de analistas también puede proporcionarle datos en archivos de Excel sin procesar, tablas dinámicas (libro de datos) o puede ayudarlo a crear presentaciones a partir de los conjuntos de datos disponibles en el informe.

