Global Lyophilized Injectable Drugs Market
Tamaño del mercado en miles de millones de dólares
Tasa de crecimiento anual compuesta (CAGR) :
% 
 USD
3.39 Billion
USD
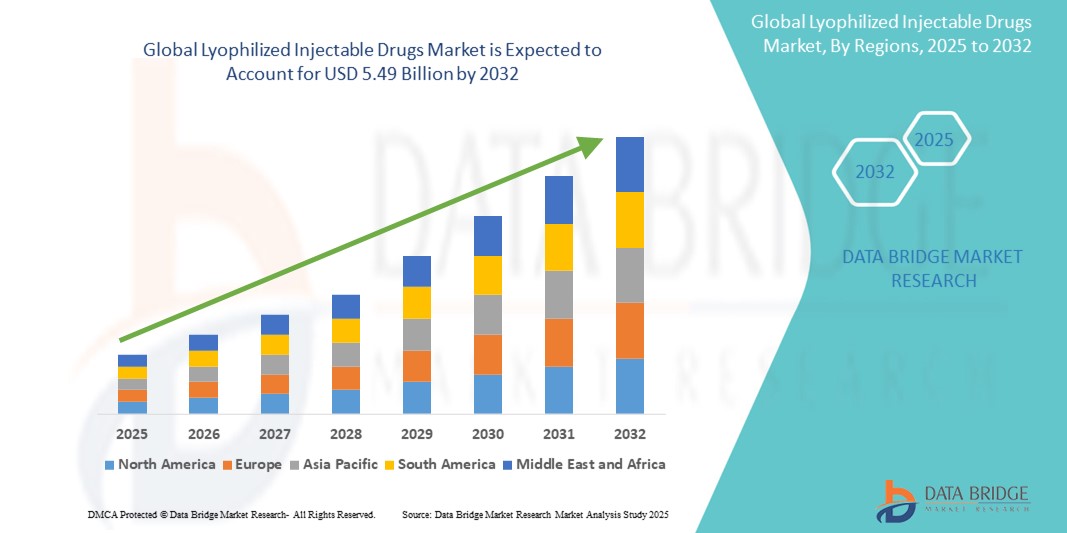
5.49 Billion
2024
2032
USD
3.39 Billion
USD
5.49 Billion
2024
2032
| 2025 –2032 | |
| USD 3.39 Billion | |
| USD 5.49 Billion | |
| % | |
|
Segmentación del mercado global de medicamentos inyectables liofilizados por presentación (viales, jeringas de doble cámara, cartuchos de doble cámara, presentaciones especiales, reconstitución en el punto de atención, viales de un solo uso y otros), tipo de administración (dispositivos de un solo paso, dispositivos de varios pasos, jeringas precargadas con diluyente y dispositivos de reconstitución patentados), clase de fármaco (antiinfeccioso, antineoplásico, diurético, inhibidor de la bomba de protones, anestésico, anticoagulante, AINE, corticosteroides y otros), presentación (polvo y líquido), indicación (oncología, enfermedades autoinmunes, trastornos hormonales, afecciones metabólicas, enfermedades respiratorias, trastornos gastrointestinales, trastornos dermatológicos, enfermedades oftálmicas, enfermedades infecciosas y otras), vía de administración (intravenosa/infusión, intramuscular y otras), usuario final (Hospitales, Clínicas, Centros de Cirugía Ambulatoria (CAA), Atención Médica Domiciliaria y Otros), Canal de Distribución (Licitación Directa, Ventas Minoristas y Otros): Tendencias de la Industria y Pronóstico hasta 2032
Tamaño del mercado de medicamentos inyectables liofilizados
- El tamaño del mercado mundial de medicamentos inyectables liofilizados se valoró en USD 3.39 mil millones en 2024 y se espera que alcance los USD 5.49 mil millones para 2032, con una CAGR del 6,2% durante el período de pronóstico.
- El crecimiento del mercado se debe en gran medida a la creciente adopción de formulaciones farmacéuticas avanzadas y al progreso tecnológico en técnicas de liofilización, lo que conduce a una mayor estabilidad de los medicamentos, una vida útil más prolongada y una mejor transportabilidad en entornos de atención médica globales.
- Además, la creciente demanda de formulaciones inyectables más estables y eficaces, especialmente para productos biológicos, vacunas y terapias antiinfecciosas, está consolidando los medicamentos inyectables liofilizados como la opción preferida por los profesionales sanitarios. Estos factores convergentes están acelerando la adopción de soluciones de medicamentos inyectables liofilizados, impulsando así significativamente el crecimiento de la industria.
Análisis del mercado de medicamentos inyectables liofilizados
- Los medicamentos inyectables liofilizados, conocidos por su mayor estabilidad, mayor vida útil y facilidad de transporte, se están volviendo cada vez más esenciales en la administración de productos biológicos, antibióticos , vacunas y terapias oncológicas en entornos de atención hospitalaria y especializada debido a su mayor facilidad de uso y menor dependencia de la cadena de frío.
- La creciente demanda de medicamentos inyectables liofilizados se ve impulsada principalmente por la creciente prevalencia de enfermedades crónicas, la creciente necesidad de administración parenteral de productos biológicos complejos y la creciente cartera de productos biofarmacéuticos dirigidos a enfermedades infecciosas y autoinmunes.
- América del Norte dominó el mercado de medicamentos inyectables liofilizados con la mayor participación en los ingresos del 38,7 % en 2024, caracterizada por la fuerte presencia de centros de fabricación farmacéutica, infraestructura de atención médica avanzada y la adopción generalizada de nuevas tecnologías de administración de medicamentos, particularmente en los EE. UU., que lidera las aprobaciones de la FDA para formulaciones liofilizadas e inversiones en alternativas logísticas de cadena de frío.
- Se espera que Asia-Pacífico sea la región de más rápido crecimiento en el mercado de medicamentos inyectables liofilizados, con una expansión estimada a una CAGR del 10,6 % entre 2025 y 2032, impulsada por la creciente urbanización, el rápido crecimiento de la subcontratación farmacéutica, la creciente incidencia de enfermedades infecciosas y la mejora del acceso a la atención médica en economías emergentes como China e India.
- El segmento antiinfeccioso dominó el mercado de medicamentos inyectables liofilizados con una participación de mercado del 41,3 % en 2024, impulsado por la creciente carga de resistencia a los antimicrobianos y la creciente utilización de formulaciones liofilizadas en cuidados críticos y entornos de emergencia debido a su larga vida útil y facilidad de reconstitución.
Alcance del informe y segmentación del mercado de medicamentos inyectables liofilizados
|
Atributos |
Análisis clave del mercado de medicamentos inyectables liofilizados |
|
Segmentos cubiertos |
|
|
Países cubiertos |
América del norte
Europa
Asia-Pacífico
Oriente Medio y África
Sudamerica
|
|
Actores clave del mercado |
|
|
Oportunidades de mercado |
|
|
Conjuntos de información de datos de valor añadido |
Además de los conocimientos sobre escenarios de mercado, como valor de mercado, tasa de crecimiento, segmentación, cobertura geográfica y actores principales, los informes de mercado seleccionados por Data Bridge Market Research también incluyen análisis en profundidad de expertos, análisis de precios, análisis de participación de marca, encuesta de consumidores, análisis demográfico, análisis de la cadena de suministro, análisis de la cadena de valor, descripción general de materias primas/consumibles, criterios de selección de proveedores, análisis PESTLE, análisis de Porter y marco regulatorio. |
Tendencias del mercado de medicamentos inyectables liofilizados
Los avances en las tecnologías de administración de fármacos impulsan la transformación del mercado.
- Una tendencia significativa y en auge en el mercado global de medicamentos inyectables liofilizados es la integración de tecnologías innovadoras de administración de fármacos y sistemas de reconstitución, con el objetivo de mejorar la comodidad del paciente, el cumplimiento terapéutico y la estabilidad de los fármacos. Esta evolución tecnológica está transformando la forma en que se almacenan, manipulan y administran los medicamentos inyectables, especialmente en entornos clínicos y de atención domiciliaria.
- Por ejemplo, el desarrollo de jeringas y cartuchos de doble cámara permite almacenar por separado el fármaco liofilizado y el diluyente, y mezclarlos justo antes de su administración. Esto garantiza la potencia del fármaco y simplifica la preparación tanto para profesionales sanitarios como para pacientes. Empresas como SCHOTT y West Pharmaceutical Services son pioneras en sistemas de reconstitución fáciles de usar para reducir errores y optimizar el uso.
- Los dispositivos de reconstitución patentados y de un solo paso son cada vez más populares en terapias crónicas, ya que ofrecen una dosificación precisa y minimizan la necesidad de una preparación manual compleja. Estas tecnologías son especialmente útiles en la atención médica domiciliaria, ya que permiten a los pacientes autoadministrarse los tratamientos con mínima supervisión, reduciendo así las visitas al hospital.
- Las soluciones de envasado inteligente que proporcionan indicadores para la correcta reconstitución y caducidad también están ganando terreno, mejorando el perfil de seguridad de los inyectables liofilizados. La incorporación de diseños con precinto de seguridad y seguridad para agujas respalda la creciente importancia de la seguridad del usuario y la integridad del producto.
- Además, el enfoque de la industria farmacéutica en prolongar la vida útil y mejorar la estabilidad térmica está impulsando la investigación en técnicas avanzadas de liofilización. Las formulaciones mejoradas que se pueden almacenar y transportar sin refrigeración son fundamentales para ampliar el acceso a medicamentos vitales en regiones remotas o de escasos recursos.
- Esta tendencia hacia sistemas de fármacos inyectables más inteligentes, prácticos y altamente estables está marcando nuevos estándares en el sector farmacéutico. Como resultado, las empresas líderes están invirtiendo fuertemente en I+D para lanzar fármacos inyectables liofilizados de nueva generación, equipados con mecanismos de administración avanzados, adaptados a la atención centrada en el paciente.
Dinámica del mercado de medicamentos inyectables liofilizados
Conductor
Creciente necesidad debido a la creciente demanda de terapias inyectables estables y de acción prolongada.
- La creciente carga mundial de enfermedades crónicas y enfermedades infecciosas, y la necesidad de formulaciones farmacológicas estables a largo plazo, han impulsado significativamente la demanda de medicamentos inyectables liofilizados. Estas formulaciones ofrecen mayor estabilidad, mayor vida útil y facilidad de almacenamiento y transporte, lo que las hace ideales tanto para entornos clínicos como para entornos de atención médica remotos.
- Por ejemplo, en abril de 2024, Baxter International Inc. introdujo una gama ampliada de medicamentos antiinfecciosos inyectables liofilizados, diseñados para uso ambulatorio y hospitalario, con el objetivo de mejorar la estabilidad del producto y los resultados de los pacientes. Se espera que estas iniciativas aceleren el crecimiento del mercado durante el período de pronóstico.
- Los sistemas de atención médica de todo el mundo están adoptando cada vez más inyectables liofilizados debido a su estabilidad química y física superior en comparación con las formulaciones líquidas, particularmente en regiones con infraestructura de cadena de frío limitada.
- Además, estos medicamentos son cruciales en oncología, enfermedades autoinmunes y medicina de emergencia, donde la reconstitución rápida y la administración inmediata son fundamentales.
- La creciente preferencia por sistemas de reconstitución listos para usar o en el punto de atención, respaldada por innovaciones en jeringas y viales de doble cámara, impulsa aún más el mercado, lo que permite una administración de medicamentos más segura, más rápida y más eficiente en entornos hospitalarios y de atención domiciliaria.
- A medida que los fabricantes farmacéuticos amplían sus líneas de productos para incluir versiones liofilizadas de medicamentos críticos y las organizaciones de fabricación por contrato (CMO) mejoran sus capacidades de liofilización, el mercado está experimentando un fuerte impulso tanto en los países desarrollados como en los países en desarrollo.
Restricción/Desafío
“Proceso de fabricación complejo y altos costos de producción”
- A pesar de su sólido crecimiento, el mercado de medicamentos inyectables liofilizados enfrenta importantes desafíos derivados de la complejidad y el alto costo de los procesos de liofilización. Los equipos especializados, las rigurosas condiciones asépticas y los plazos de producción más largos contribuyen a costos más elevados en comparación con las formulaciones tradicionales.
- Por ejemplo, establecer una instalación de liofilización a escala comercial requiere una inversión de capital sustancial, lo que puede disuadir a las empresas farmacéuticas más pequeñas o a las nuevas empresas de ingresar al mercado.
- Además, los requisitos reglamentarios para los medicamentos inyectables estériles son estrictos, lo que añade capas de control de calidad, documentación y pruebas, factores que prolongan los plazos de desarrollo de los productos y aumentan los gastos generales operativos.
- El requisito de tecnologías de envasado avanzadas, como sistemas de doble cámara, y la necesidad de logística de cadena de frío en algunos casos a pesar de la liofilización, pueden aumentar la complejidad de la cadena de suministro y el costo general del producto.
- Para superar estas barreras, los fabricantes están invirtiendo en tecnologías de liofilización continua y sistemas modulares de salas blancas para optimizar las operaciones y reducir costos. Las colaboraciones con las CDMO y los incentivos gubernamentales para expandir las capacidades de fabricación local también están ayudando a mitigar estos desafíos.
- Sin embargo, superar estas limitaciones a través de la innovación en la fabricación, la optimización de procesos y la adopción de tecnología escalable es esencial para liberar todo el potencial de crecimiento del mercado de medicamentos inyectables liofilizados a nivel mundial.
Alcance del mercado de medicamentos inyectables liofilizados
El mercado está segmentado en función del embalaje, el tipo de administración, la clase de medicamento, la forma, la indicación, la vía de administración, el usuario final y el canal de distribución.
• Por embalaje
En función del empaque, el mercado de medicamentos inyectables liofilizados se segmenta en viales, jeringas de doble cámara, cartuchos de doble cámara, envases especiales, reconstitución en el punto de atención, viales de un solo uso y otros. Los viales representaron la mayor participación en los ingresos del mercado, con un 36,5 % en 2024, gracias a su relación calidad-precio y compatibilidad entre las distintas clases de fármacos.
Se proyecta que las jeringas de doble cámara crecerán a la CAGR más rápida del 9,8 % entre 2025 y 2032, impulsada por la demanda de sistemas de administración estériles listos para usar.
• Por tipo de entrega
Según el tipo de administración, el mercado de medicamentos inyectables liofilizados se segmenta en dispositivos de un solo paso, dispositivos de varios pasos, jeringas precargadas con diluyente y dispositivos de reconstitución patentados. Los dispositivos de un solo paso representaron el 34,7 % de la cuota de mercado en 2024, favorecidos por su simplicidad y rapidez.
Se espera que los dispositivos de reconstitución patentados registren la CAGR más rápida del 10,1 % entre 2025 y 2032, debido a su tecnología avanzada y características de seguridad.
• Por clase de fármaco
Según la clase de fármaco, el mercado de medicamentos inyectables liofilizados se segmenta en antiinfecciosos, antineoplásicos, diuréticos, inhibidores de la bomba de protones, anestésicos, anticoagulantes, AINE, corticosteroides y otros. Los antiinfecciosos dominaron el mercado con una cuota de mercado del 41,3 % en 2024, debido a la prevalencia mundial de enfermedades infecciosas.
Se proyecta que los medicamentos antineoplásicos crecerán a una CAGR del 9,6 % entre 2025 y 2032, debido a la creciente incidencia del cáncer y a las necesidades de formulaciones estables.
• Por formulario
En cuanto a su presentación, el mercado de medicamentos inyectables liofilizados se segmenta en polvo y líquido. El polvo representó la mayor participación (65,4%) en 2024, gracias a su mayor vida útil y mejor estabilidad en el transporte.
Se espera que el segmento líquido crezca a una CAGR del 6,2% entre 2025 y 2032, debido a su facilidad de uso y preferencia en la atención de emergencias.
• Por indicación
Según la indicación, el mercado de medicamentos inyectables liofilizados se segmenta en oncología, enfermedades autoinmunes, trastornos hormonales, enfermedades metabólicas, enfermedades respiratorias, trastornos gastrointestinales, trastornos dermatológicos, enfermedades oftálmicas, enfermedades infecciosas, entre otros. La oncología lideró el mercado con una participación del 26,9 % en 2024, debido a la alta demanda de agentes quimioterapéuticos inyectables.
Se prevé que las enfermedades infecciosas crezcan a una CAGR del 8,8% entre 2025 y 2032, respaldadas por el creciente uso de antimicrobianos liofilizados.
• Por vía de administración
Según la clase de fármaco, el mercado de medicamentos inyectables liofilizados se segmenta en intravenosos/infusionales, intramusculares y otros. Los intravenosos/infusionales representaron la mayor cuota de mercado, con un 58,1 %, en 2024, debido a su uso en cuidados intensivos.
Se proyecta que la vía intramuscular crecerá a una CAGR del 6,4 % entre 2025 y 2032, impulsada por las tendencias de atención ambulatoria y domiciliaria.
• Por el usuario final
Según la clase de fármaco, el mercado de medicamentos inyectables liofilizados se segmenta en hospitales, clínicas, centros de cirugía ambulatoria (CAA), atención médica domiciliaria, entre otros. Los hospitales dominaron el mercado con un 42,7 % en 2024, gracias al alto volumen de procedimientos y a su avanzada infraestructura.
Se proyecta que la atención médica domiciliaria se expandirá a la CAGR más rápida del 10,5 % entre 2025 y 2032, debido a la creciente preferencia de los pacientes por el tratamiento domiciliario y la autoadministración.
• Por canal de distribución
Según la clase de fármaco, el mercado de medicamentos inyectables liofilizados se segmenta en licitación directa, venta minorista y otros. La licitación directa fue el canal principal, con una participación del 53,2 % en 2024, impulsada por las compras institucionales a hospitales públicos y privados.
Se espera que las ventas minoristas crezcan a una CAGR del 9,1 % entre 2025 y 2032, a medida que haya más inyectables disponibles en los canales ambulatorios y de comercio electrónico.
Análisis regional del mercado de medicamentos inyectables liofilizados
- América del Norte dominó el mercado de medicamentos inyectables liofilizados con la mayor participación en los ingresos del 38,7 % en 2024, impulsada por una sólida base de fabricación farmacéutica, una prevalencia creciente de enfermedades crónicas y una infraestructura de atención médica bien establecida.
- El crecimiento de la región está respaldado por importantes inversiones en sistemas avanzados de administración de medicamentos y una alta tasa de adopción de formulaciones liofilizadas debido a su prolongada vida útil y estabilidad.
- Además, las principales compañías farmacéuticas que operan en Estados Unidos y Canadá siguen priorizando el desarrollo de fármacos inyectables liofilizados para oncología, enfermedades infecciosas y trastornos autoinmunes, lo que contribuye a la expansión sostenida del mercado.
Análisis del mercado estadounidense de medicamentos inyectables liofilizados
El mercado estadounidense de medicamentos inyectables liofilizados capturó la mayor participación en los ingresos, con un 80,1 %, en 2024 en Norteamérica, gracias a una sólida cartera de productos clínicos, una infraestructura de fabricación avanzada y una creciente preferencia por formulaciones estables y de larga duración. La creciente prevalencia de enfermedades crónicas como el cáncer y las enfermedades autoinmunes está fomentando el uso de inyectables liofilizados que reducen la necesidad de refrigeración y garantizan la estabilidad del producto. Además, el sólido respaldo regulatorio de la FDA y la presencia de importantes empresas biofarmacéuticas contribuyen significativamente a la expansión del mercado.
Análisis del mercado europeo de medicamentos inyectables liofilizados
Se proyecta que el mercado europeo de medicamentos inyectables liofilizados crecerá a una tasa de crecimiento anual compuesta (TCAC) sustancial del 8,9 % entre 2025 y 2032, impulsado por la creciente demanda de formulaciones estables a la temperatura y al almacenamiento en diversos entornos sanitarios. El mayor enfoque en optimizar la logística de la cadena de frío y abordar las necesidades no cubiertas en oncología y enfermedades infecciosas está acelerando su adopción. Además, el auge del desarrollo de biosimilares y la externalización a organizaciones de fabricación por contrato (CMO) está impulsando el crecimiento regional en el sector de los inyectables liofilizados.
Análisis del mercado de medicamentos inyectables liofilizados del Reino Unido
Se espera que el mercado británico de medicamentos inyectables liofilizados crezca a una notable tasa de crecimiento anual compuesta (TCAC) del 9,1 % durante el período de pronóstico, impulsado por el aumento de los ingresos hospitalarios por enfermedades crónicas y un mayor énfasis en la innovación farmacéutica. El sistema sanitario británico, liderado por el NHS, prioriza cada vez más las formulaciones rentables y estables que facilitan una mejor administración y almacenamiento de los medicamentos. Además, el creciente número de ensayos clínicos y la expansión de la fabricación de medicamentos especializados están impulsando el dinamismo del mercado.
Análisis del mercado alemán de medicamentos inyectables liofilizados
Se prevé que el mercado alemán de medicamentos inyectables liofilizados crezca a una considerable tasa de crecimiento anual compuesta (TCAC) del 8,5 %, gracias a su avanzada infraestructura farmacéutica y a la creciente inversión en productos biológicos y biosimilares. Los hospitales y centros ambulatorios alemanes están adoptando activamente las formulaciones liofilizadas para mejorar la estabilidad, reducir los requisitos de almacenamiento en frío y prolongar la vida útil. El mercado también se beneficia del compromiso del país con la sostenibilidad sanitaria y la medicina de precisión .
Análisis del mercado de medicamentos inyectables liofilizados de Asia-Pacífico
Se prevé que el mercado de medicamentos inyectables liofilizados de Asia-Pacífico crezca a la tasa de crecimiento anual compuesta (TCAC) más rápida, del 10,6 %, entre 2025 y 2032, impulsado por el aumento del gasto sanitario, la rápida urbanización y la expansión de la producción farmacéutica en países como China, India y Japón. El impulso de la región hacia terapias inyectables rentables y estables, especialmente en entornos con recursos limitados, está acelerando significativamente su adopción. Además, las iniciativas gubernamentales que apoyan la fabricación farmacéutica nacional y la investigación clínica están impulsando el crecimiento del mercado regional.
Análisis del mercado japonés de medicamentos inyectables liofilizados
El mercado japonés de medicamentos inyectables liofilizados está cobrando impulso, representando el 18,2 % de los ingresos de Asia-Pacífico en 2024, impulsado por el envejecimiento de la población, la alta prevalencia de enfermedades crónicas y un fuerte enfoque en la innovación sanitaria. Las formulaciones liofilizadas se adoptan cada vez más por su mayor vida útil y la minimización de desperdicios. El liderazgo de Japón en I+D biofarmacéutico y sus estrictas normas de calidad impulsan aún más la demanda de soluciones inyectables estables, especialmente en el tratamiento de oncología y enfermedades metabólicas.
Análisis del mercado de medicamentos inyectables liofilizados en China
El mercado chino de medicamentos inyectables liofilizados representó la mayor participación en los ingresos, con un 44,5 %, en la región Asia-Pacífico en 2024, impulsado por el rápido crecimiento de la industria farmacéutica, la fuerte demanda de terapias oncológicas y antiinfecciosas, y las profundas reformas sanitarias. Como uno de los principales mercados para la producción biofarmacéutica y la fabricación por contrato, China está experimentando una creciente demanda de inyectables liofilizados en hospitales, clínicas y comercios minoristas. El apoyo gubernamental a la innovación y el mayor acceso a la atención médica en ciudades de menor nivel están acelerando aún más el crecimiento del mercado.
Cuota de mercado de medicamentos inyectables liofilizados
La industria de medicamentos inyectables liofilizados está liderada principalmente por empresas bien establecidas, entre las que se incluyen:
- GENEX PHARMA (India)
- Aurobindo Pharma USA (EE. UU.)
- Astellas Pharma Inc. (EE. UU.)
- Pfizer Inc. (EE. UU.)
- Viatris Inc. (EE. UU.)
- Gilead Sciences, Inc. (EE. UU.)
- Cirondrugs (India)
- Amneal Pharmaceuticals LLC (EE. UU.)
- Jubilant Generics Limited (India)
- Novartis AG (Suiza)
- Otsuka America Pharmaceutical, Inc. (EE. UU.)
- Grupo Zydus (India)
- Cipla Inc. (India)
- Merck & Co., Inc. (Alemania)
- Fresenius Kabi AG (EE. UU.)
- Sanofi (Francia)
- Laboratorios CELON (India)
- Baxter (EE. UU.)
Últimos avances en el mercado mundial de medicamentos inyectables liofilizados
- En mayo de 2024, Pfizer Inc. anunció la expansión de sus instalaciones de liofilización en su planta de Kalamazoo, Michigan, para satisfacer la creciente demanda de productos biológicos inyectables estables y terapias basadas en ARNm. La inversión busca mejorar la escalabilidad de la producción y minimizar la dependencia de la cadena de frío, reforzando así el liderazgo de Pfizer en tecnologías innovadoras de administración de fármacos.
- En abril de 2024, Recipharm AB, organización líder en desarrollo y fabricación por contrato (CDMO), inauguró una nueva línea de liofilización de vanguardia en sus instalaciones de Brescia, Italia. Esta expansión está diseñada para satisfacer la creciente demanda mundial de inyectables liofilizados, especialmente en los sectores de oncología y enfermedades raras, y refuerza la presencia de Recipharm en el mercado europeo de fabricación por contrato.
- En febrero de 2024, Baxter International Inc. colaboró con la Autoridad de Investigación y Desarrollo Biomédico Avanzado de EE. UU. (BARDA) para mejorar la fabricación nacional de inyectables liofilizados utilizados en la preparación para emergencias. La colaboración se centra en mejorar la resiliencia de la cadena de suministro y aumentar las reservas nacionales de medicamentos esenciales termoestables.
- En enero de 2024, Aurobindo Pharma Limited recibió la aprobación de la FDA estadounidense para su versión genérica liofilizada de Meropenem inyectable, ampliando así su cartera de productos inyectables estériles para uso hospitalario. Este hito consolida la posición de la compañía en el competitivo mercado de genéricos inyectables, ofreciendo soluciones rentables para tratamientos de cuidados intensivos.
- En diciembre de 2023, Cipla Limited anunció la comercialización en el mercado indio de Docetaxel Inyectable USP, su fármaco oncológico liofilizado de desarrollo propio. El lanzamiento del producto busca ofrecer tratamientos de quimioterapia asequibles y de alta calidad con mayor durabilidad y ventajas de almacenamiento, lo que refuerza el compromiso de Cipla con la atención oncológica accesible.
- En noviembre de 2023, Vetter Pharma-Fertigung GmbH & Co. KG, una empresa global de desarrollo de productos farmacéuticos (CDMO), inició la construcción de una nueva planta en Austria dedicada a la producción a gran escala de fármacos inyectables liofilizados. La planta brindará apoyo a socios biotecnológicos y farmacéuticos con capacidades avanzadas de llenado y acabado para productos biológicos de alto valor y compuestos sensibles.
- En octubre de 2023, Hikma Pharmaceuticals PLC amplió su oferta de inyectables liofilizados en EE. UU. con el lanzamiento de nuevos antiinfecciosos genéricos y tratamientos cardiovasculares. Esta medida ayuda a los hospitales a gestionar la escasez de medicamentos, ofreciendo alternativas de suministro fiables con una vida útil más larga.
SKU-
Obtenga acceso en línea al informe sobre la primera nube de inteligencia de mercado del mundo

- Panel de análisis de datos interactivo
- Panel de análisis de empresas para oportunidades con alto potencial de crecimiento
- Acceso de analista de investigación para personalización y consultas
- Análisis de la competencia con panel interactivo
- Últimas noticias, actualizaciones y análisis de tendencias
- Aproveche el poder del análisis de referencia para un seguimiento integral de la competencia
Tabla de contenido
- introduction
- OBJECTIVES OF THE STUDY
- MARKET DEFINITION
- OVERVIEW of GLOBAL lyophilized injectable drugs market
- LIMITATIONs
- MARKETS COVERED
- MARKET SEGMENTATION
- MARKETS COVERED
- geographical scope
- years considered for the study
- currency and pricing
- DBMR TRIPOD DATA VALIDATION MODEL
- MULTIVARIATE MODELLING
- packaging LIFELINE CURVE
- primary interviews with key opinion leaders
- DBMR MARKET POSITION GRID
- vendor share analysis
- MARKET end user COVERAGE GRID
- secondary sourcEs
- assumptions
- EXECUTIVE SUMMARY
- GLOBAL LYOPHILIZED INJECTABLE DRUGS MARKET: REGULATORY FRAMEWORK
- Epidemiology
- Market Overview
- drivers
- rise in chronic health conditions
- safe transit and storage of these substances until their end-use
- increase in geriatric population with chronic diseases
- expansion of pipeline of lyophilized injectable drugs
- technological advancements
- Restraints
- Risk of needlestick injuries
- IncreasE IN number of product recalls for lyophilized drugs and packaging type
- OPPORTUNITIES
- RisE IN regulatory approvals for lyophilized drugs
- STRATEGIC INITIATIVES OF KEY MARKET PLAYERS
- quality concerns
- challenges
- challenges associated with manufacturing lyophilized vials for parenteral products
- Time-consuming process and high cost
- IMPACT OF COVID-19 ON THE GLOBAL LYOPHILIZED INJECTABLE DRUGS MARKET
- IMPACT ON PRICE
- IMPACT IN DEMAND
- IMPACT ON SUPPLY
- STRATEGIC INITIATIVE
- CONCLUSION
- Global lyophilized injectable drugs market, By packaging
- overview
- vials
- Dual-Chamber Syringes
- Dual-Chamber Cartridges
- Others
- global lyophilized injectable drugs market, By drug class
- overview
- Anti-Infective’s
- Antibiotics
- Azithromycin
- Doxycycline
- Vancomycin
- Polymyxin B
- Piperacillin
- Tazobactam
- Others
- Antifungal
- Mycamine
- Caspofungin Acetate
- Isavuconazonium Sulfate
- Amphotericin
- Others
- Antiviral
- Acyclovir
- Ganciclovir
- Remdesivir
- Others
- Others
- Antineoplastic
- Methotrexate
- Gemcitabine
- Cytarabine
- Fludarabine
- Doxorubicin
- Oxaliplatin
- Zoledronic Acid
- Others
- Diuretics
- Chlorothiazide
- Ethacrynic Acid
- Acetazolamide
- Others
- Proton Pump Inhibitor
- Esomeprazole Sodium
- Pantoprazole Sodium
- Omeprazole
- Others
- Anesthetic
- Vecuronium Bromide
- Sodium Thiopental
- Lidocaine
- Others
- Anticoagulant
- Coumadin
- Urokinase
- Antithrombin (Recombinant)
- Apixaban
- Rivaroxaban
- Others
- Nsaid’s
- Indomethacin
- Ibuprofen
- Diclofenac
- Ketorolac
- Others
- Corticosteroids
- Hydrocortisone
- Methylprednisolone
- Others
- Others
- global lyophilized injectable drugs market, By form
- overview
- Powder
- Liquid
- Global lyophilized injectable drugs market, By indication
- overview
- Oncology
- Autoimmune Diseases
- Hormonal Disorders
- Respiratory Diseases
- Gastrointestinal Disorders
- Dermatological Disorders
- Ophthalmic Diseases
- Others
- Global lyophilized injectable drugs market, By Route of administration
- overview
- Intravenous/Infusion
- Intramuscular
- Others
- Global lyophilized injectable drugs market, By end user
- overview
- Hospital
- Clinics
- Home Healthcare
- Others
- global lyophilized injectable drugs market, By distribution channel
- overview
- Direct Tenders
- Retail Sales
- Others
- global LYOPHILIZED INJECTABLE DRUGS MARKET, BY Region
- Overview
- north america
- u.s.
- Canada
- mexico
- europe
- Germany
- France
- U.K.
- ITALY
- SPAIN
- NETHERLANDS
- RUSSIA
- SWITZERLAND
- TURKEY
- AUSTRIA
- NORWAY
- HUNGARY
- LITHUANIA
- IRELAND
- POLAND
- REST OF EUROPE
- Asia-Pacific
- japan
- china
- south korea
- india
- australia
- singapore
- thailand
- malaysia
- indonesia
- philippines
- vietnam
- rest of asia-pacific
- South america
- Brazil
- argentina
- Peru
- rest of south america
- MIDDLE EAST & AFRICA
- South Africa
- Saudi Arabia
- U.A.E.
- EGYPT
- KUWAIT
- ISRAEL
- REST OF MIDDLE EAST & AFRICA
- Global Lyophilized Injectable Drugs Market: COMPANY landscape
- company share analysis: Global
- company share analysis: North America
- company share analysis: Europe
- company share analysis: Asia-Pacific
- Swot analysis
- Company profile
- pfizer Inc.
- COMPANY SNAPSHOT
- REVENUE ANALYSIS
- COMPANY SHARE ANALYSIS
- PRODUCT PORTFOLIO
- RECENT DEVELOPMENT
- Fresenius Kabi USA (A subsidiary of Fresenius Kabi AG)
- COMPANY SNAPSHOT
- REVENUE ANALYSIS
- COMPANY SHARE ANALYSIS
- PRODUCT PORTFOLIO
- RECENT DEVELOPMENTS
- Cipla Inc.
- COMPANY SNAPSHOT
- REVENUE ANALYSIS
- COMPANY SHARE ANALYSIS
- PRODUCT PORTFOLIO
- RECENT DEVELOPMENT
- Novartis AG
- COMPANY SNAPSHOT
- REVENUE ANALYSIS
- COMPANY SHARE ANALYSIS
- PRODUCT PORTFOLIO
- RECENT DEVELOPMENT
- Merck Sharp & Dohme Corp., A subsidiary of Merck & Co., Inc.
- COMPANY SNAPSHOT
- REVENUE ANALYSIS
- PRODUCT PORTFOLIO
- RECENT DEVELOPMENT
- Baxter
- COMPANY SNAPSHOT
- REVENUE ANALYSIS
- PRODUCT PORTFOLIO
- RECENT DEVELOPMENTS
- zydus cadila
- COMPANY SNAPSHOT
- REVENUE ANALYSIS
- PRODUCT PORTFOLIO
- RECENT DEVELOPMENT
- Affy Pharma Pvt Ltd.
- COMPANY SNAPSHOT
- PRODUCT PORTFOLIO
- RECENT DEVELOPMENT
- Amneal Pharmaceuticals LLC
- COMPANY SNAPSHOT
- REVENUE ANALYSIS
- PRODUCT PORTFOLIO
- RECENT DEVELOPMENTS
- Aristopharma Ltd.
- COMPANY SNAPSHOT
- PRODUCT PORTFOLIO
- RECENT DEVELOPMENT
- Astellas Pharma US, Inc. (A subsidiary of Astellas Pharma Inc.)
- COMPANY SNAPSHOT
- REVENUE ANALYSIS
- PRODUCT PORTFOLIO
- RECENT DEVELOPMENTS
- AuroMedics Pharma LLC (A subsidiary of Aurobindo Pharma)
- COMPANY SNAPSHOT
- REVENUE ANALYSIS
- PRODUCT PORTFOLIO
- RECENT DEVELOPMENTS
- celon laboratories pvt.ltd.
- COMPANY SNAPSHOT
- PRODUCT PORTFOLIO
- RECENT DEVELOPMENT
- Cirondrugs
- COMPANY SNAPSHOT
- PRODUCT PORTFOLIO
- RECENT DEVELOPMENT
- Genex Pharma
- COMPANY SNAPSHOT
- PRODUCT PORTFOLIO
- RECENT DEVELOPMENT
- Gilead Sciences, Inc.
- COMPANY SNAPSHOT
- REVENUE ANALYSIS
- PRODUCT PORTFOLIO
- RECENT DEVELOPMENTS
- Jubilant Generics Limited – A Jubilant Pharma Company
- COMPANY SNAPSHOT
- REVENUE ANALYSIS
- PRODUCT PORTFOLIO
- RECENT DEVELOPMENTS
- Otsuka America Pharmaceutical, Inc
- COMPANY SNAPSHOT
- PRODUCT PORTFOLIO
- RECENT DEVELOPMENTS
- sanofi
- COMPANY SNAPSHOT
- REVENUE ANALYSIS
- PRODUCT PORTFOLIO
- RECENT DEVELOPMENT
- viatris Inc.
- COMPANY SNAPSHOT
- REVENUE ANALYSIS
- PRODUCT PORTFOLIO
- RECENT DEVELOPMENT
- questionnaire
- related reports
Lista de Tablas
TABLA 1 Medicamentos inyectables liofilizados en desarrollo
TABLA 2 Mercado mundial de medicamentos inyectables liofilizados, por envase, 2019-2028 (millones de USD)
TABLA 3 Mercado mundial de viales de medicamentos inyectables liofilizados, por región, 2019-2028 (millones de USD)
TABLA 4 Mercado mundial de jeringas de doble cámara en medicamentos inyectables liofilizados, por región, 2019-2028 (millones de USD)
TABLA 5 Mercado mundial de cartuchos de doble cámara en medicamentos inyectables liofilizados, por región, 2019-2028 (millones de USD)
TABLA 6 Mercado global de medicamentos inyectables liofilizados (Otros), por región, 2019-2028 (millones de USD)
TABLA 7 Mercado mundial de medicamentos inyectables liofilizados, por clase de medicamento, 2019-2028 (millones de USD)
TABLA 8 Mercado mundial de medicamentos inyectables liofilizados, por clase de medicamento, 2019-2028 (Unidades)
TABLA 9 Mercado mundial de antiinfecciosos en medicamentos inyectables liofilizados, por región, 2019-2028 (millones de USD)
TABLA 10 Mercado mundial de antiinfecciosos en medicamentos inyectables liofilizados, por clase de medicamento, 2019-2028 (millones de USD)
TABLA 11 Mercado mundial de antibióticos en medicamentos inyectables liofilizados, por clase de medicamento, 2019-2028 (millones de USD)
TABLA 12 Mercado mundial de antimicóticos en medicamentos inyectables liofilizados, por clase de medicamento, 2019-2028 (millones de USD)
TABLA 13 Mercado mundial de antivirales en medicamentos inyectables liofilizados, por clase de medicamento, 2019-2028 (millones de USD)
TABLA 14 Mercado mundial de antineoplásicos en fármacos inyectables liofilizados, por región, 2019-2028 (millones de USD)
TABLA 15 Mercado mundial de antineoplásicos en fármacos inyectables liofilizados, por clase de fármaco, 2019-2028 (millones de USD)
TABLA 16 Mercado mundial de diuréticos en medicamentos inyectables liofilizados, por región, 2019-2028 (millones de USD)
TABLA 17 Mercado mundial de diuréticos en medicamentos inyectables liofilizados, por clase de medicamento, 2019-2028 (millones de USD)
TABLA 18 Mercado global de inhibidores de la bomba de protones en medicamentos inyectables liofilizados, por región, 2019-2028 (millones de USD)
TABLA 19 Mercado mundial de inhibidores de la bomba de protones en medicamentos inyectables liofilizados, por clase de medicamento, 2019-2028 (millones de USD)
TABLA 20 Mercado mundial de anestésicos en medicamentos inyectables liofilizados, por región, 2019-2028 (millones de USD)
TABLA 21 Mercado mundial de anestésicos en medicamentos inyectables liofilizados, por clase de medicamento, 2019-2028 (millones de USD)
TABLA 22 Mercado mundial de anticoagulantes en medicamentos inyectables liofilizados, por región, 2019-2028 (millones de USD)
TABLA 23 Mercado mundial de anticoagulantes en medicamentos inyectables liofilizados, por clase de medicamento, 2019-2028 (millones de USD)
TABLA 24 Mercado global de AINE en medicamentos inyectables liofilizados, por región, 2019-2028 (millones de USD)
TABLA 25 Mercado mundial de AINE en medicamentos inyectables liofilizados, por clase de medicamento, 2019-2028 (millones de USD)
TABLA 26 Mercado mundial de corticosteroides en medicamentos inyectables liofilizados, por región, 2019-2028 (millones de USD)
TABLA 27 Mercado mundial de corticosteroides en medicamentos inyectables liofilizados, por clase de medicamento, 2019-2028 (millones de USD)
TABLA 28. Otros en el mercado global de medicamentos inyectables liofilizados, por región, 2019-2028 (millones de USD)
TABLA 29 Mercado mundial de medicamentos inyectables liofilizados, por formato, 2019-2028 (millones de USD)
TABLA 30 Mercado mundial de medicamentos inyectables liofilizados en polvo, por región, 2019-2028 (millones de USD)
TABLA 31 Mercado mundial de medicamentos inyectables liofilizados, por región, 2019-2028 (millones de USD)
CUADRO 32 Mercado mundial de medicamentos inyectables liofilizados, por indicación, 2019-2028 (millones de USD)
TABLA 33 Mercado mundial de medicamentos inyectables liofilizados en oncología, por región, 2019-2028 (millones de USD)
TABLA 34 Mercado mundial de medicamentos inyectables liofilizados para enfermedades autoinmunes, por región, 2019-2028 (millones de USD)
TABLA 35 Mercado mundial de trastornos hormonales en medicamentos inyectables liofilizados, por región, 2019-2028 (millones de USD)
TABLA 36 Mercado mundial de medicamentos inyectables liofilizados para enfermedades respiratorias, por región, 2019-2028 (millones de USD)
TABLA 37 Mercado mundial de medicamentos inyectables liofilizados para trastornos gastrointestinales, por región, 2019-2028 (millones de USD)
TABLA 38 Mercado mundial de trastornos dermatológicos en medicamentos inyectables liofilizados, por región, 2019-2028 (millones de USD)
TABLA 39 Mercado mundial de enfermedades oftálmicas en medicamentos inyectables liofilizados, por región, 2019-2028 (millones de USD)
TABLA 40 Mercado global de medicamentos inyectables liofilizados (Otros), por región, 2019-2028 (millones de USD)
TABLA 41 Mercado mundial de medicamentos inyectables liofilizados, por vía de administración, 2019-2028 (millones de USD)
TABLA 42 Mercado mundial de medicamentos inyectables intravenosos/de infusión liofilizados, por región, 2019-2028 (millones de USD)
TABLA 43 Mercado mundial de fármacos inyectables intramusculares liofilizados, por región, 2019-2028 (millones de USD)
TABLA 44 Mercado global de medicamentos inyectables liofilizados (Otros), por región, 2019-2028 (millones de USD)
CUADRO 45 Mercado mundial de medicamentos inyectables liofilizados, por usuario final, 2019-2028 (millones de USD)
TABLA 46 Mercado mundial de medicamentos inyectables liofilizados en hospitales, por región, 2019-2028 (millones de USD)
TABLA 47 Clínicas globales en el mercado de medicamentos inyectables liofilizados, por región, 2019-2028 (millones de USD)
TABLA 48 Mercado mundial de atención médica domiciliaria con medicamentos inyectables liofilizados, por región, 2019-2028 (millones de USD)
TABLA 49 Mercado global de medicamentos inyectables liofilizados (Otros), por región, 2019-2028 (millones de USD)
TABLA 50 Mercado mundial de medicamentos inyectables liofilizados, por canal de distribución, 2019-2028 (millones de USD)
TABLA 51 Licitación directa global en el mercado de medicamentos inyectables liofilizados, por región, 2019-2028 (millones de USD)
TABLA 52 Ventas minoristas globales del mercado de medicamentos inyectables liofilizados, por región, 2019-2028 (millones de USD)
TABLA 53 Otros en el mercado global de medicamentos inyectables liofilizados, por región, 2019-2028 (millones de USD)
TABLA 54 MERCADO MUNDIAL DE MEDICAMENTOS INYECTABLES LIOFILIZADOS, POR REGIÓN, 2019-2028 (MILLONES DE USD)
TABLA 55 Mercado de medicamentos inyectables liofilizados de América del Norte, por PAÍS, 2019-2028 (millones de USD)
TABLA 56 Mercado de medicamentos inyectables liofilizados de América del Norte, por envase, 2019-2028 (millones de USD)
TABLA 57 Mercado de medicamentos inyectables liofilizados de América del Norte, por clase de medicamento, 2019-2028 (millones de USD)
TABLA 58 Mercado de medicamentos inyectables liofilizados de América del Norte, por clase de medicamento, 2019-2028 (Unidades)
TABLA 59 Mercado de medicamentos antiinfecciosos inyectables liofilizados en América del Norte, por clase de medicamento, 2019-2028 (millones de USD)
TABLA 60 Mercado de antibióticos inyectables liofilizados en América del Norte, por clase de fármaco, 2019-2028 (millones de USD)
TABLA 61 Mercado norteamericano de antifúngicos en medicamentos inyectables liofilizados, por clase de medicamento, 2019-2028 (millones de USD)
TABLA 62 Mercado norteamericano de medicamentos antivirales inyectables liofilizados, por clase de medicamento, 2019-2028 (millones de USD)
TABLA 63 Mercado norteamericano de fármacos antineoplásicos inyectables liofilizados, por clase de fármaco, 2019-2028 (millones de USD)
TABLA 64 Mercado norteamericano de diuréticos en medicamentos inyectables liofilizados, por clase de medicamento, 2019-2028 (millones de USD)
TABLA 65 Mercado norteamericano de inhibidores de la bomba de protones en medicamentos inyectables liofilizados, por clase de medicamento, 2019-2028 (millones de USD)
TABLA 66 Mercado norteamericano de anestésicos inyectables liofilizados, por clase de fármaco, 2019-2028 (millones de USD)
TABLA 67 Mercado norteamericano de anticoagulantes en medicamentos inyectables liofilizados, por clase de medicamento, 2019-2028 (millones de USD)
TABLA 68 Mercado de AINE en medicamentos inyectables liofilizados de América del Norte, por clase de medicamento, 2019-2028 (millones de USD)
TABLA 69 Mercado de corticosteroides en medicamentos inyectables liofilizados de América del Norte, por clase de medicamento, 2019-2028 (millones de USD)
TABLA 70 Mercado de medicamentos inyectables liofilizados de América del Norte, por formato, 2019-2028 (millones de USD)
TABLA 71 Mercado de medicamentos inyectables liofilizados de América del Norte, por indicación, 2019-2028 (millones de USD)
TABLA 72 Mercado de medicamentos inyectables liofilizados de América del Norte, por vía de administración, 2019-2028 (millones de USD)
TABLA 73 Mercado de medicamentos inyectables liofilizados de América del Norte, por usuario final, 2019-2028 (millones de USD)
TABLA 74 Mercado de medicamentos inyectables liofilizados de América del Norte, por canal de distribución, 2019-2028 (millones de USD)
TABLA 75 Mercado estadounidense de medicamentos inyectables liofilizados, por envase, 2019-2028 (millones de USD)
TABLA 76 Mercado estadounidense de medicamentos inyectables liofilizados, por clase de medicamento, 2019-2028 (millones de USD)
TABLA 77 Mercado estadounidense de medicamentos inyectables liofilizados, por clase de medicamento, 2019-2028 (unidades)
TABLA 78 Mercado estadounidense de antiinfecciosos en medicamentos inyectables liofilizados, por clase de medicamento, 2019-2028 (millones de USD)
TABLA 79 Mercado estadounidense de antibióticos inyectables liofilizados, por clase de fármaco, 2019-2028 (millones de USD)
TABLA 80 Mercado estadounidense de antifúngicos inyectables liofilizados, por clase de fármaco, 2019-2028 (millones de USD)
TABLA 81 Mercado estadounidense de medicamentos antivirales inyectables liofilizados, por clase de medicamento, 2019-2028 (millones de USD)
TABLA 82 Mercado estadounidense de fármacos antineoplásicos inyectables liofilizados, por clase de fármaco, 2019-2028 (millones de USD)
TABLA 83 Mercado estadounidense de diuréticos en medicamentos inyectables liofilizados, por clase de medicamento, 2019-2028 (millones de USD)
TABLA 84 Mercado estadounidense de inhibidores de la bomba de protones en medicamentos inyectables liofilizados, por clase de medicamento, 2019-2028 (millones de USD)
TABLA 85 Mercado estadounidense de anestésicos inyectables liofilizados, por clase de fármaco, 2019-2028 (millones de USD)
TABLA 86 Mercado estadounidense de anticoagulantes inyectables liofilizados, por clase de fármaco, 2019-2028 (millones de USD)
TABLA 87 AINE en el mercado estadounidense de medicamentos inyectables liofilizados, por clase de medicamento, 2019-2028 (millones de USD)
TABLA 88 Mercado estadounidense de corticosteroides en medicamentos inyectables liofilizados, por clase de medicamento, 2019-2028 (millones de USD)
TABLA 89 Mercado estadounidense de medicamentos inyectables liofilizados, por formato, 2019-2028 (millones de USD)
TABLA 90 Mercado estadounidense de medicamentos inyectables liofilizados, por indicación, 2019-2028 (millones de USD)
TABLA 91 Mercado estadounidense de medicamentos inyectables liofilizados, por vía de administración, 2019-2028 (millones de USD)
TABLA 92 Mercado estadounidense de medicamentos inyectables liofilizados, por usuario final, 2019-2028 (millones de USD)
TABLA 93 Mercado estadounidense de medicamentos inyectables liofilizados, por canal de distribución, 2019-2028 (millones de USD)
TABLA 94 Mercado canadiense de medicamentos inyectables liofilizados, por envase, 2019-2028 (millones de USD)
TABLA 95 Mercado de medicamentos inyectables liofilizados de Canadá, por clase de medicamento, 2019-2028 (millones de USD)
TABLA 96 Mercado de medicamentos inyectables liofilizados de Canadá, por clase de medicamento, 2019-2028 (unidades)
TABLA 97 CANADÁ Mercado de medicamentos antiinfecciosos inyectables liofilizados, por clase de medicamento, 2019-2028 (millones de USD)
TABLA 98 CANADÁ Mercado de antibióticos en medicamentos inyectables liofilizados, por clase de medicamento, 2019-2028 (millones de USD)
TABLA 99 Mercado de medicamentos antimicóticos inyectables liofilizados de Canadá, por clase de medicamento, 2019-2028 (millones de USD)
TABLA 100 Mercado de medicamentos antivirales inyectables liofilizados de Canadá, por clase de medicamento, 2019-2028 (millones de USD)
TABLA 101 CANADÁ Mercado de medicamentos antineoplásicos inyectables liofilizados, por clase de medicamento, 2019-2028 (millones de USD)
TABLA 102 CANADÁ Mercado de diuréticos en medicamentos inyectables liofilizados, por clase de medicamento, 2019-2028 (millones de USD)
TABLA 103 CANADÁ Mercado de inhibidores de la bomba de protones en medicamentos inyectables liofilizados, por clase de medicamento, 2019-2028 (millones de USD)
TABLA 104 CANADÁ Mercado de anestésicos en medicamentos inyectables liofilizados, por clase de medicamento, 2019-2028 (millones de USD)
TABLA 105 CANADÁ Mercado de anticoagulantes en medicamentos inyectables liofilizados, por clase de medicamento, 2019-2028 (millones de USD)
TABLA 106 CANADÁ: AINE en el mercado de medicamentos inyectables liofilizados, por clase de medicamento, 2019-2028 (millones de USD)
TABLA 107 CANADÁ Mercado de corticosteroides en medicamentos inyectables liofilizados, por clase de medicamento, 2019-2028 (millones de USD)
TABLA 108 CANADÁ Mercado de medicamentos inyectables liofilizados, por formato, 2019-2028 (millones de USD)
TABLA 109 Mercado de medicamentos inyectables liofilizados de Canadá, por indicación, 2019-2028 (millones de USD)
TABLA 110 Mercado de medicamentos inyectables liofilizados de Canadá, por vía de administración, 2019-2028 (millones de USD)
TABLA 111 CANADÁ Mercado de medicamentos inyectables liofilizados, por usuario final, 2019-2028 (millones de USD)
TABLA 112 Mercado de medicamentos inyectables liofilizados de Canadá, por canal de distribución, 2019-2028 (millones de USD)
TABLA 113 Mercado de medicamentos inyectables liofilizados en México, por envase, 2019-2028 (millones de USD)
TABLA 114 Mercado de medicamentos inyectables liofilizados en MÉXICO, por clase de medicamento, 2019-2028 (millones de USD)
TABLA 115 Mercado de medicamentos inyectables liofilizados en MÉXICO, por clase de medicamento, 2019-2028 (Unidades)
TABLA 116 MÉXICO Mercado de antiinfecciosos en medicamentos inyectables liofilizados, por clase de medicamento, 2019-2028 (millones de USD)
TABLA 117 MÉXICO Mercado de antibióticos en medicamentos inyectables liofilizados, por clase de medicamento, 2019-2028 (millones de USD)
TABLA 118 MÉXICO Mercado de antifúngicos en medicamentos inyectables liofilizados, por clase de medicamento, 2019-2028 (millones de USD)
TABLA 119 MÉXICO Mercado de medicamentos antivirales inyectables liofilizados, por clase de medicamento, 2019-2028 (USD millones)
TABLA 120 MÉXICO Mercado de medicamentos antineoplásicos inyectables liofilizados, por clase de medicamento, 2019-2028 (USD millones)
TABLA 121 MÉXICO Mercado de diuréticos en medicamentos inyectables liofilizados, por clase de medicamento, 2019-2028 (millones de USD)
TABLA 122 MÉXICO Mercado de inhibidores de la bomba de protones en medicamentos inyectables liofilizados, por clase de medicamento, 2019-2028 (millones de USD)
TABLA 123 MÉXICO Mercado de anestésicos en medicamentos inyectables liofilizados, por clase de medicamento, 2019-2028 (millones de USD)
TABLA 124 MÉXICO Mercado de anticoagulantes en medicamentos inyectables liofilizados, por clase de medicamento, 2019-2028 (millones de USD)
TABLA 125 MÉXICO AINE en el mercado de medicamentos inyectables liofilizados, por clase de medicamento, 2019-2028 (millones de USD)
TABLA 126 MÉXICO Mercado de corticosteroides en medicamentos inyectables liofilizados, por clase de medicamento, 2019-2028 (millones de USD)
TABLA 127 Mercado de medicamentos inyectables liofilizados en México, por formato, 2019-2028 (millones de USD)
TABLA 128 MÉXICO Mercado de medicamentos inyectables liofilizados, por indicación, 2019-2028 (millones de USD)
TABLA 129 Mercado de medicamentos inyectables liofilizados en MÉXICO, por vía de administración, 2019-2028 (millones de USD)
TABLA 130 Mercado de medicamentos inyectables liofilizados en MÉXICO, por usuario final, 2019-2028 (millones de USD)
TABLA 131 Mercado de medicamentos inyectables liofilizados en México, por canal de distribución, 2019-2028 (millones de USD)
TABLA 132 MERCADO EUROPEO DE MEDICAMENTOS INYECTABLES LIOFILIZADOS, POR PAÍS, 2019-2028 (MILLONES DE USD)
TABLA 133 Mercado europeo de medicamentos inyectables liofilizados, por envase, 2019-2028 (millones de USD)
TABLA 134 Mercado europeo de medicamentos inyectables liofilizados, por clase de medicamento, 2019-2028 (millones de USD)
TABLA 135 Mercado europeo de medicamentos inyectables liofilizados, por clase de medicamento, 2019-2028 (unidades)
TABLA 136 Mercado europeo de antiinfecciosos en medicamentos inyectables liofilizados, por clase de medicamento, 2019-2028 (millones de USD)
TABLA 137 Mercado europeo de antibióticos en medicamentos inyectables liofilizados, por clase de medicamento, 2019-2028 (millones de USD)
TABLA 138 Mercado europeo de antifúngicos en medicamentos inyectables liofilizados, por clase de medicamento, 2019-2028 (millones de USD)
TABLA 139 Mercado europeo de medicamentos antivirales inyectables liofilizados, por clase de medicamento, 2019-2028 (millones de USD)
TABLA 140 Mercado europeo de fármacos antineoplásicos inyectables liofilizados, por clase de fármaco, 2019-2028 (millones de USD)
TABLA 141 Mercado europeo de diuréticos en medicamentos inyectables liofilizados, por clase de medicamento, 2019-2028 (millones de USD)
TABLA 142 Mercado europeo de inhibidores de la bomba de protones en medicamentos inyectables liofilizados, por clase de medicamento, 2019-2028 (millones de USD)
TABLA 143 Mercado europeo de anestésicos inyectables liofilizados, por clase de fármaco, 2019-2028 (millones de USD)
TABLA 144 Mercado europeo de anticoagulantes en medicamentos inyectables liofilizados, por clase de medicamento, 2019-2028 (millones de USD)
TABLA 145 Mercado europeo de AINE en medicamentos inyectables liofilizados, por clase de medicamento, 2019-2028 (millones de USD)
TABLA 146 Mercado europeo de corticosteroides en medicamentos inyectables liofilizados, por clase de medicamento, 2019-2028 (millones de USD)
TABLA 147 Mercado europeo de medicamentos inyectables liofilizados, por formato, 2019-2028 (millones de USD)
TABLA 148 Mercado europeo de medicamentos inyectables liofilizados, por indicación, 2019-2028 (millones de USD)
TABLA 149 Mercado europeo de medicamentos inyectables liofilizados, por vía de administración, 2019-2028 (millones de USD)
TABLA 150 Mercado europeo de medicamentos inyectables liofilizados, por usuario final, 2019-2028 (millones de USD)
TABLA 151 Mercado europeo de medicamentos inyectables liofilizados, por canal de distribución, 2019-2028 (millones de USD)
TABLA 152 Mercado alemán de medicamentos inyectables liofilizados, por envase, 2019-2028 (millones de USD)
TABLA 153 Mercado alemán de medicamentos inyectables liofilizados, por clase de medicamento, 2019-2028 (millones de USD)
TABLA 154 Mercado alemán de medicamentos inyectables liofilizados, por clase de medicamento, 2019-2028 (unidades)
TABLA 155 Mercado alemán de antiinfecciosos en medicamentos inyectables liofilizados, por clase de medicamento, 2019-2028 (millones de USD)
TABLA 156 Mercado alemán de antibióticos inyectables liofilizados, por clase de fármaco, 2019-2028 (millones de USD)
TABLA 157 Mercado alemán de antifúngicos en medicamentos inyectables liofilizados, por clase de medicamento, 2019-2028 (millones de USD)
TABLA 158 Mercado alemán de medicamentos antivirales inyectables liofilizados, por clase de medicamento, 2019-2028 (millones de USD)
TABLA 159 Mercado alemán de antineoplásicos en fármacos inyectables liofilizados, por clase de fármaco, 2019-2028 (millones de USD)
TABLA 160 Mercado alemán de diuréticos en medicamentos inyectables liofilizados, por clase de medicamento, 2019-2028 (millones de USD)
TABLA 161 Mercado alemán de inhibidores de la bomba de protones en medicamentos inyectables liofilizados, por clase de medicamento, 2019-2028 (millones de USD)
TABLA 162 Mercado alemán de anestésicos inyectables liofilizados, por clase de fármaco, 2019-2028 (millones de USD)
TABLA 163 Mercado alemán de anticoagulantes en medicamentos inyectables liofilizados, por clase de medicamento, 2019-2028 (millones de USD)
TABLA 164 AINE en el mercado alemán de medicamentos inyectables liofilizados, por clase de medicamento, 2019-2028 (millones de USD)
TABLA 165 Mercado alemán de corticosteroides en medicamentos inyectables liofilizados, por clase de medicamento, 2019-2028 (millones de USD)
TABLA 166 Mercado alemán de medicamentos inyectables liofilizados, por formato, 2019-2028 (millones de USD)
TABLA 167 Mercado alemán de medicamentos inyectables liofilizados, por indicación, 2019-2028 (millones de USD)
TABLA 168 Mercado alemán de medicamentos inyectables liofilizados, por vía de administración, 2019-2028 (millones de USD)
TABLA 169 Mercado alemán de medicamentos inyectables liofilizados, por usuario final, 2019-2028 (millones de USD)
TABLA 170 Mercado alemán de medicamentos inyectables liofilizados, por canal de distribución, 2019-2028 (millones de USD)
TABLA 171 Mercado francés de medicamentos inyectables liofilizados, por envase, 2019-2028 (millones de USD)
TABLA 172 Mercado francés de medicamentos inyectables liofilizados, por clase de medicamento, 2019-2028 (millones de USD)
TABLA 173 Mercado francés de medicamentos inyectables liofilizados, por clase de medicamento, 2019-2028 (unidades)
TABLA 174 Mercado francés de antiinfecciosos en medicamentos inyectables liofilizados, por clase de medicamento, 2019-2028 (millones de USD)
TABLA 175 Mercado francés de antibióticos inyectables liofilizados, por clase de fármaco, 2019-2028 (millones de USD)
TABLA 176 Mercado francés de antifúngicos en medicamentos inyectables liofilizados, por clase de medicamento, 2019-2028 (millones de USD)
TABLA 177 Mercado francés de medicamentos antivirales inyectables liofilizados, por clase de medicamento, 2019-2028 (millones de USD)
TABLA 178 Mercado francés de antineoplásicos en medicamentos inyectables liofilizados, por clase de medicamento, 2019-2028 (millones de USD)
TABLA 179 Mercado francés de diuréticos en medicamentos inyectables liofilizados, por clase de medicamento, 2019-2028 (millones de USD)
TABLA 180 Mercado francés de inhibidores de la bomba de protones en medicamentos inyectables liofilizados, por clase de medicamento, 2019-2028 (millones de USD)
TABLA 181 Mercado francés de anestésicos inyectables liofilizados, por clase de fármaco, 2019-2028 (millones de USD)
TABLA 182 Mercado francés de anticoagulantes en medicamentos inyectables liofilizados, por clase de medicamento, 2019-2028 (millones de USD)
TABLA 183 Mercado francés de AINE en medicamentos inyectables liofilizados, por clase de medicamento, 2019-2028 (millones de USD)
TABLA 184 Mercado francés de corticosteroides en medicamentos inyectables liofilizados, por clase de medicamento, 2019-2028 (millones de USD)
TABLA 185 Mercado francés de medicamentos inyectables liofilizados, por formato, 2019-2028 (millones de USD)
TABLA 186 Mercado francés de medicamentos inyectables liofilizados, por indicación, 2019-2028 (millones de USD)
TABLA 187 Mercado francés de medicamentos inyectables liofilizados, por vía de administración, 2019-2028 (millones de USD)
TABLA 188 Mercado francés de medicamentos inyectables liofilizados, por usuario final, 2019-2028 (millones de USD)
TABLA 189 Mercado francés de medicamentos inyectables liofilizados, por canal de distribución, 2019-2028 (millones de USD)
TABLA 190 Mercado de medicamentos inyectables liofilizados del Reino Unido, por envase, 2019-2028 (millones de USD)
TABLA 191 Mercado de medicamentos inyectables liofilizados del Reino Unido, por clase de medicamento, 2019-2028 (millones de USD)
TABLA 192 Mercado de medicamentos inyectables liofilizados del Reino Unido, por clase de medicamento, 2019-2028 (unidades)
TABLA 193 Mercado de medicamentos antiinfecciosos inyectables liofilizados en el Reino Unido, por clase de medicamento, 2019-2028 (millones de USD)
TABLA 194 Mercado de antibióticos inyectables liofilizados en el Reino Unido, por clase de fármaco, 2019-2028 (millones de USD)
TABLA 195 Mercado de medicamentos antimicóticos inyectables liofilizados en el Reino Unido, por clase de medicamento, 2019-2028 (millones de USD)
TABLA 196 Mercado de medicamentos antivirales inyectables liofilizados en el Reino Unido, por clase de medicamento, 2019-2028 (millones de USD)
TABLA 197 Mercado de fármacos antineoplásicos inyectables liofilizados en el Reino Unido, por clase de fármaco, 2019-2028 (millones de USD)
TABLA 198 Mercado de diuréticos en medicamentos inyectables liofilizados del Reino Unido, por clase de medicamento, 2019-2028 (millones de USD)
TABLA 199 Mercado de inhibidores de la bomba de protones en medicamentos inyectables liofilizados del Reino Unido, por clase de medicamento, 2019-2028 (millones de USD)
TABLA 200 Mercado de anestésicos inyectables liofilizados en el Reino Unido, por clase de fármaco, 2019-2028 (millones de USD)
TABLA 201 Mercado de anticoagulantes en medicamentos inyectables liofilizados del Reino Unido, por clase de medicamento, 2019-2028 (millones de USD)
TABLA 202 AINE en el mercado británico de medicamentos inyectables liofilizados, por clase de medicamento, 2019-2028 (millones de USD)
TABLA 203 Mercado de corticosteroides en medicamentos inyectables liofilizados del Reino Unido, por clase de medicamento, 2019-2028 (millones de USD)
TABLA 204 Mercado de medicamentos inyectables liofilizados del Reino Unido, por formato, 2019-2028 (millones de USD)
TABLA 205 Mercado de medicamentos inyectables liofilizados del Reino Unido, por indicación, 2019-2028 (millones de USD)
TABLA 206 Mercado de medicamentos inyectables liofilizados del Reino Unido, por vía de administración, 2019-2028 (millones de USD)
TABLA 207 Mercado de medicamentos inyectables liofilizados del Reino Unido, por usuario final, 2019-2028 (millones de USD)
TABLA 208 Mercado de medicamentos inyectables liofilizados del Reino Unido, por canal de distribución, 2019-2028 (millones de USD)
TABLA 209 ITALIA Mercado de medicamentos inyectables liofilizados, por envase, 2019-2028 (millones de USD)
TABLA 210 ITALIA Mercado de medicamentos inyectables liofilizados, por clase de medicamento, 2019-2028 (millones de USD)
TABLA 211 ITALIA Mercado de medicamentos inyectables liofilizados, por clase de medicamento, 2019-2028 (Unidades)
TABLA 212 ITALIA Mercado de medicamentos antiinfecciosos inyectables liofilizados, por clase de medicamento, 2019-2028 (millones de USD)
TABLA 213 ITALIA Mercado de antibióticos en medicamentos inyectables liofilizados, por clase de medicamento, 2019-2028 (millones de USD)
TABLA 214 ITALIA Mercado de medicamentos antifúngicos inyectables liofilizados, por clase de medicamento, 2019-2028 (millones de USD)
TABLA 215 ITALIA Mercado de medicamentos antivirales inyectables liofilizados, por clase de medicamento, 2019-2028 (millones de USD)
TABLA 216 ITALIA Mercado de medicamentos antineoplásicos inyectables liofilizados, por clase de medicamento, 2019-2028 (millones de USD)
TABLA 217 ITALIA Mercado de diuréticos en medicamentos inyectables liofilizados, por clase de medicamento, 2019-2028 (millones de USD)
TABLA 218 ITALIA Mercado de inhibidores de la bomba de protones en medicamentos inyectables liofilizados, por clase de medicamento, 2019-2028 (millones de USD)
TABLA 219 ITALIA Mercado de anestésicos en medicamentos inyectables liofilizados, por clase de medicamento, 2019-2028 (millones de USD)
TABLA 220 ITALIA Mercado de anticoagulantes en medicamentos inyectables liofilizados, por clase de medicamento, 2019-2028 (millones de USD)
TABLA 221 ITALIA AINE en el mercado de medicamentos inyectables liofilizados, por clase de medicamento, 2019-2028 (millones de USD)
TABLA 222 ITALIA Mercado de corticosteroides en medicamentos inyectables liofilizados, por clase de medicamento, 2019-2028 (millones de USD)
TABLA 223 ITALIA Mercado de medicamentos inyectables liofilizados, por formato, 2019-2028 (millones de USD)
TABLA 224 ITALIA Mercado de medicamentos inyectables liofilizados, por indicación, 2019-2028 (millones de USD)
TABLA 225 ITALIA Mercado de medicamentos inyectables liofilizados, por vía de administración, 2019-2028 (millones de USD)
TABLA 226 ITALIA Mercado de medicamentos inyectables liofilizados, por usuario final, 2019-2028 (millones de USD)
TABLA 227 ITALIA Mercado de medicamentos inyectables liofilizados, por canal de distribución, 2019-2028 (millones de USD)
TABLA 228 ESPAÑA Mercado de medicamentos inyectables liofilizados, por envase, 2019-2028 (millones de USD)
TABLA 229 ESPAÑA Mercado de medicamentos inyectables liofilizados, por clase de medicamento, 2019-2028 (millones de USD)
TABLA 230 Mercado de medicamentos inyectables liofilizados en España, por clase de medicamento, 2019-2028 (Unidades)
TABLA 231 ESPAÑA Mercado de antiinfecciosos en medicamentos inyectables liofilizados, por clase de medicamento, 2019-2028 (millones de USD)
TABLA 232 ESPAÑA Mercado de antibióticos en medicamentos inyectables liofilizados, por clase de medicamento, 2019-2028 (millones de USD)
TABLA 233 ESPAÑA Mercado de antifúngicos en medicamentos inyectables liofilizados, por clase de medicamento, 2019-2028 (millones de USD)
TABLA 234 ESPAÑA Mercado de antivirales en medicamentos inyectables liofilizados, por clase de medicamento, 2019-2028 (millones de USD)
TABLA 235 ESPAÑA Mercado de antineoplásicos en fármacos inyectables liofilizados, por clase de fármaco, 2019-2028 (millones de USD)
TABLA 236 ESPAÑA Mercado de diuréticos en medicamentos inyectables liofilizados, por clase de medicamento, 2019-2028 (millones de USD)
TABLA 237 ESPAÑA Mercado de inhibidores de la bomba de protones en medicamentos inyectables liofilizados, por clase de medicamento, 2019-2028 (millones de USD)
TABLA 238 ESPAÑA Mercado de anestésicos en medicamentos inyectables liofilizados, por clase de medicamento, 2019-2028 (millones de USD)
TABLA 239 ESPAÑA Mercado de anticoagulantes en medicamentos inyectables liofilizados, por clase de medicamento, 2019-2028 (millones de USD)
TABLA 240 ESPAÑA Mercado de AINE en medicamentos inyectables liofilizados, por clase de medicamento, 2019-2028 (millones de USD)
TABLA 241 ESPAÑA Mercado de corticosteroides en medicamentos inyectables liofilizados, por clase de medicamento, 2019-2028 (millones de USD)
TABLA 242 ESPAÑA Mercado de medicamentos inyectables liofilizados, por formato, 2019-2028 (millones de USD)
TABLA 243 ESPAÑA Mercado de medicamentos inyectables liofilizados, por indicación, 2019-2028 (millones de USD)
TABLA 244 ESPAÑA Mercado de medicamentos inyectables liofilizados, por vía de administración, 2019-2028 (millones de USD)
TABLA 245 ESPAÑA Mercado de medicamentos inyectables liofilizados, por usuario final, 2019-2028 (millones de USD)
TABLA 246 ESPAÑA Mercado de medicamentos inyectables liofilizados, por canal de distribución, 2019-2028 (millones de USD)
TABLA 247 PAÍSES BAJOS Mercado de medicamentos inyectables liofilizados, por envase, 2019-2028 (millones de USD)
TABLA 248 PAÍSES BAJOS Mercado de medicamentos inyectables liofilizados, por clase de medicamento, 2019-2028 (millones de USD)
TABLA 249 PAÍSES BAJOS Mercado de medicamentos inyectables liofilizados, por clase de medicamento, 2019-2028 (Unidades)
TABLA 250 PAÍSES BAJOS Mercado de antiinfecciosos en medicamentos inyectables liofilizados, por clase de medicamento, 2019-2028 (millones de USD)
TABLA 251 PAÍSES BAJOS Mercado de antibióticos en medicamentos inyectables liofilizados, por clase de medicamento, 2019-2028 (millones de USD)
TABLA 252 PAÍSES BAJOS Mercado de medicamentos antifúngicos inyectables liofilizados, por clase de medicamento, 2019-2028 (millones de USD)
TABLA 253 PAÍSES BAJOS Mercado de medicamentos antivirales inyectables liofilizados, por clase de medicamento, 2019-2028 (millones de USD)
TABLA 254 PAÍSES BAJOS Mercado de medicamentos antineoplásicos inyectables liofilizados, por clase de medicamento, 2019-2028 (millones de USD)
TABLA 255 PAÍSES BAJOS Mercado de diuréticos en medicamentos inyectables liofilizados, por clase de medicamento, 2019-2028 (millones de USD)
TABLA 256 PAÍSES BAJOS Mercado de inhibidores de la bomba de protones en medicamentos inyectables liofilizados, por clase de medicamento, 2019-2028 (millones de USD)
TABLA 257 PAÍSES BAJOS Mercado de anestésicos inyectables liofilizados, por clase de fármaco, 2019-2028 (millones de USD)
TABLA 258 PAÍSES BAJOS Mercado de anticoagulantes en medicamentos inyectables liofilizados, por clase de medicamento, 2019-2028 (millones de USD)
TABLA 259 PAÍSES BAJOS: AINE en el mercado de medicamentos inyectables liofilizados, por clase de medicamento, 2019-2028 (millones de USD)
TABLA 260 PAÍSES BAJOS Mercado de corticosteroides en medicamentos inyectables liofilizados, por clase de medicamento, 2019-2028 (millones de USD)
TABLA 261 PAÍSES BAJOS Mercado de medicamentos inyectables liofilizados, por formato, 2019-2028 (millones de USD)
TABLA 262 PAÍSES BAJOS Mercado de medicamentos inyectables liofilizados, por indicación, 2019-2028 (millones de USD)
TABLA 263 PAÍSES BAJOS Mercado de medicamentos inyectables liofilizados, por vía de administración, 2019-2028 (millones de USD)
TABLA 264 PAÍSES BAJOS Mercado de medicamentos inyectables liofilizados, por usuario final, 2019-2028 (millones de USD)
TABLA 265 PAÍSES BAJOS Mercado de medicamentos inyectables liofilizados, por canal de distribución, 2019-2028 (millones de USD)
TABLA 266 Mercado de medicamentos inyectables liofilizados en Rusia, por envase, 2019-2028 (millones de USD)
TABLA 267 Mercado de medicamentos inyectables liofilizados en RUSIA, por clase de medicamento, 2019-2028 (millones de USD)
TABLA 268 Mercado de medicamentos inyectables liofilizados en Rusia, por clase de medicamento, 2019-2028 (unidades)
TABLA 269 RUSIA Mercado de medicamentos antiinfecciosos inyectables liofilizados, por clase de medicamento, 2019-2028 (millones de USD)
TABLA 270 Mercado de antibióticos inyectables liofilizados en Rusia, por clase de fármaco, 2019-2028 (millones de USD)
TABLA 271 Mercado ruso de antifúngicos en medicamentos inyectables liofilizados, por clase de medicamento, 2019-2028 (millones de USD)
TABLA 272 Mercado ruso de medicamentos antivirales inyectables liofilizados, por clase de medicamento, 2019-2028 (millones de USD)
TABLA 273 RUSIA Mercado de medicamentos antineoplásicos inyectables liofilizados, por clase de medicamento, 2019-2028 (millones de USD)
TABLA 274 RUSIA Mercado de diuréticos en medicamentos inyectables liofilizados, por clase de medicamento, 2019-2028 (millones de USD)
TABLA 275 RUSIA Mercado de inhibidores de la bomba de protones en medicamentos inyectables liofilizados, por clase de medicamento, 2019-2028 (millones de USD)
TABLA 276 RUSIA Mercado de anestésicos inyectables liofilizados, por clase de fármaco, 2019-2028 (millones de USD)
TABLA 277 RUSIA Mercado de anticoagulantes en medicamentos inyectables liofilizados, por clase de medicamento, 2019-2028 (millones de USD)
TABLA 278 RUSIA Mercado de AINE en medicamentos inyectables liofilizados, por clase de medicamento, 2019-2028 (millones de USD)
TABLA 279 RUSIA Mercado de corticosteroides en medicamentos inyectables liofilizados, por clase de medicamento, 2019-2028 (millones de USD)
TABLA 280 Mercado de medicamentos inyectables liofilizados en Rusia, por formato, 2019-2028 (millones de USD)
TABLA 281 Mercado de medicamentos inyectables liofilizados de Rusia, por indicación, 2019-2028 (millones de USD)
TABLA 282 Mercado de medicamentos inyectables liofilizados de RUSIA, por vía de administración, 2019-2028 (millones de USD)
TABLA 283 Mercado de medicamentos inyectables liofilizados en RUSIA, por usuario final, 2019-2028 (millones de USD)
TABLA 284 Mercado de medicamentos inyectables liofilizados en RUSIA, por canal de distribución, 2019-2028 (millones de USD)
TABLA 285 SUIZA Mercado de medicamentos inyectables liofilizados, por envase, 2019-2028 (millones de USD)
TABLA 286 SUIZA Mercado de medicamentos inyectables liofilizados, por clase de medicamento, 2019-2028 (millones de USD)
TABLA 287 SUIZA Mercado de medicamentos inyectables liofilizados, por clase de medicamento, 2019-2028 (Unidades)
TABLA 288 SUIZA Mercado de antiinfecciosos en medicamentos inyectables liofilizados, por clase de medicamento, 2019-2028 (millones de USD)
TABLA 289 SUIZA Mercado de antibióticos en medicamentos inyectables liofilizados, por clase de medicamento, 2019-2028 (millones de USD)
TABLA 290 SUIZA Mercado de antifúngicos en medicamentos inyectables liofilizados, por clase de medicamento, 2019-2028 (millones de USD)
TABLA 291 SUIZA Mercado de medicamentos antivirales inyectables liofilizados, por clase de medicamento, 2019-2028 (millones de USD)
TABLA 292 SUIZA Mercado de medicamentos antineoplásicos inyectables liofilizados, por clase de medicamento, 2019-2028 (millones de USD)
TABLA 293 SUIZA Mercado de diuréticos en medicamentos inyectables liofilizados, por clase de medicamento, 2019-2028 (millones de USD)
TABLA 294 SUIZA Mercado de inhibidores de la bomba de protones en medicamentos inyectables liofilizados, por clase de medicamento, 2019-2028 (millones de USD)
TABLA 295 SUIZA Mercado de anestésicos en medicamentos inyectables liofilizados, por clase de medicamento, 2019-2028 (millones de USD)
TABLA 296 SUIZA Mercado de anticoagulantes en medicamentos inyectables liofilizados, por clase de medicamento, 2019-2028 (millones de USD)
TABLA 297 SUIZA Mercado de AINE en medicamentos inyectables liofilizados, por clase de medicamento, 2019-2028 (millones de USD)
TABLA 298 SUIZA Mercado de corticosteroides en medicamentos inyectables liofilizados, por clase de medicamento, 2019-2028 (millones de USD)
TABLA 299 SUIZA Mercado de medicamentos inyectables liofilizados, por formato, 2019-2028 (millones de USD)
TABLA 300 Mercado de medicamentos inyectables liofilizados de Suiza, por indicación, 2019-2028 (millones de USD)
TABLA 301 SUIZA Mercado de medicamentos inyectables liofilizados, por vía de administración, 2019-2028 (millones de USD)
TABLA 302 SUIZA Mercado de medicamentos inyectables liofilizados, por usuario final, 2019-2028 (millones de USD)
TABLA 303 SUIZA Mercado de medicamentos inyectables liofilizados, por canal de distribución, 2019-2028 (millones de USD)
TABLA 304 Mercado de medicamentos inyectables liofilizados de Turquía, por envase, 2019-2028 (millones de USD)
TABLA 305 Mercado de medicamentos inyectables liofilizados de Turquía, por clase de medicamento, 2019-2028 (millones de USD)
TABLA 306 Mercado de medicamentos inyectables liofilizados de Turquía, por clase de medicamento, 2019-2028 (Unidades)
TABLA 307 Mercado de medicamentos antiinfecciosos inyectables liofilizados de Turquía, por clase de medicamento, 2019-2028 (millones de USD)
TABLA 308 Mercado de antibióticos inyectables liofilizados en Turquía, por clase de fármaco, 2019-2028 (millones de USD)
TABLA 309 Mercado de medicamentos antifúngicos inyectables liofilizados en Turquía, por clase de medicamento, 2019-2028 (millones de USD)
TABLA 310 Mercado de medicamentos antivirales inyectables liofilizados en Turquía, por clase de medicamento, 2019-2028 (millones de USD)
TABLA 311 Mercado de medicamentos antineoplásicos inyectables liofilizados en Turquía, por clase de medicamento, 2019-2028 (millones de USD)
TABLA 312 Mercado de diuréticos en medicamentos inyectables liofilizados de Turquía, por clase de medicamento, 2019-2028 (millones de USD)
TABLA 313 Mercado de inhibidores de la bomba de protones en medicamentos inyectables liofilizados de Turquía, por clase de medicamento, 2019-2028 (millones de USD)
TABLA 314 Mercado de anestésicos en medicamentos inyectables liofilizados de Turquía, por clase de medicamento, 2019-2028 (millones de USD)
TABLA 315 Mercado de anticoagulantes en medicamentos inyectables liofilizados de Turquía, por clase de medicamento, 2019-2028 (millones de USD)
TABLA 316 TURQUÍA: AINE en el mercado de medicamentos inyectables liofilizados, por clase de medicamento, 2019-2028 (millones de USD)
TABLA 317 TURQUÍA Mercado de corticosteroides en medicamentos inyectables liofilizados, por clase de medicamento, 2019-2028 (millones de USD)
TABLA 318 Mercado de medicamentos inyectables liofilizados de Turquía, por formato, 2019-2028 (millones de USD)
TABLA 319 Mercado de medicamentos inyectables liofilizados de Turquía, por indicación, 2019-2028 (millones de USD)
TABLA 320 Mercado de medicamentos inyectables liofilizados de Turquía, por vía de administración, 2019-2028 (millones de USD)
TABLA 321 Mercado de medicamentos inyectables liofilizados de Turquía, por usuario final, 2019-2028 (millones de USD)
TABLA 322 Mercado de medicamentos inyectables liofilizados de Turquía, por canal de distribución, 2019-2028 (millones de USD)
TABLA 323 Mercado de medicamentos inyectables liofilizados en Austria, por envase, 2019-2028 (millones de USD)
TABLA 324 Mercado de medicamentos inyectables liofilizados en Austria, por clase de medicamento, 2019-2028 (millones de USD)
TABLA 325 Mercado de medicamentos inyectables liofilizados de Austria, por clase de medicamento, 2019-2028 (unidades)
TABLA 326 AUSTRIA Mercado de medicamentos antiinfecciosos inyectables liofilizados, por clase de medicamento, 2019-2028 (millones de USD)
TABLA 327 Mercado de antibióticos inyectables liofilizados en Austria, por clase de fármaco, 2019-2028 (millones de USD)
TABLA 328 Mercado de medicamentos antifúngicos inyectables liofilizados en Austria, por clase de medicamento, 2019-2028 (millones de USD)
TABLA 329 AUSTRIA Mercado de medicamentos antivirales inyectables liofilizados, por clase de medicamento, 2019-2028 (millones de USD)
TABLA 330 Mercado de medicamentos antineoplásicos inyectables liofilizados en Austria, por clase de medicamento, 2019-2028 (millones de USD)
TABLA 331 AUSTRIA Mercado de diuréticos en medicamentos inyectables liofilizados, por clase de medicamento, 2019-2028 (millones de USD)
TABLA 332 Mercado de inhibidores de la bomba de protones en medicamentos inyectables liofilizados de Austria, por clase de medicamento, 2019-2028 (millones de USD)
TABLA 333 Mercado de anestésicos inyectables liofilizados en Austria, por clase de fármaco, 2019-2028 (millones de USD)
TABLA 334 AUSTRIA Mercado de anticoagulantes en medicamentos inyectables liofilizados, por clase de medicamento, 2019-2028 (millones de USD)
TABLA 335 AINE en el mercado de medicamentos inyectables liofilizados de Austria, por clase de medicamento, 2019-2028 (millones de USD)
TABLA 336 AUSTRIA Mercado de corticosteroides en medicamentos inyectables liofilizados, por clase de medicamento, 2019-2028 (millones de USD)
TABLA 337 Mercado de medicamentos inyectables liofilizados de Austria, por formato, 2019-2028 (millones de USD)
TABLA 338 Mercado de medicamentos inyectables liofilizados de Austria, por indicación, 2019-2028 (millones de USD)
TABLA 339 Mercado de medicamentos inyectables liofilizados de Austria, por vía de administración, 2019-2028 (millones de USD)
TABLA 340 Mercado de medicamentos inyectables liofilizados de Austria, por usuario final, 2019-2028 (millones de USD)
TABLA 341 Mercado de medicamentos inyectables liofilizados de Austria, por canal de distribución, 2019-2028 (millones de USD)
TABLA 342 NORUEGA Mercado de medicamentos inyectables liofilizados, por envase, 2019-2028 (millones de USD)
TABLA 343 Mercado de medicamentos inyectables liofilizados de Noruega, por clase de medicamento, 2019-2028 (millones de USD)
TABLA 344 Mercado de medicamentos inyectables liofilizados de Noruega, por clase de medicamento, 2019-2028 (unidades)
TABLA 345 NORUEGA Mercado de antiinfecciosos en medicamentos inyectables liofilizados, por clase de medicamento, 2019-2028 (millones de USD)
TABLA 346 NORUEGA Mercado de antibióticos en medicamentos inyectables liofilizados, por clase de medicamento, 2019-2028 (millones de USD)
TABLA 347 NORUEGA Mercado de medicamentos antifúngicos inyectables liofilizados, por clase de medicamento, 2019-2028 (millones de USD)
TABLA 348 NORUEGA Mercado de medicamentos antivirales inyectables liofilizados, por clase de medicamento, 2019-2028 (millones de USD)
TABLA 349 NORUEGA Mercado de medicamentos antineoplásicos inyectables liofilizados, por clase de medicamento, 2019-2028 (millones de USD)
TABLA 350 NORUEGA Mercado de diuréticos en medicamentos inyectables liofilizados, por clase de medicamento, 2019-2028 (millones de USD)
TABLA 351 NORUEGA Mercado de inhibidores de la bomba de protones en medicamentos inyectables liofilizados, por clase de medicamento, 2019-2028 (millones de USD)
TABLA 352 NORUEGA Mercado de anestésicos inyectables liofilizados, por clase de fármaco, 2019-2028 (millones de USD)
TABLA 353 NORUEGA Mercado de anticoagulantes en medicamentos inyectables liofilizados, por clase de medicamento, 2019-2028 (millones de USD)
TABLA 354 NORUEGA: AINE en el mercado de medicamentos inyectables liofilizados, por clase de medicamento, 2019-2028 (millones de USD)
TABLA 355 NORUEGA Mercado de corticosteroides en medicamentos inyectables liofilizados, por clase de medicamento, 2019-2028 (millones de USD)
TABLA 356 Mercado de medicamentos inyectables liofilizados de Noruega, por formato, 2019-2028 (millones de USD)
TABLA 357 NORUEGA Mercado de medicamentos inyectables liofilizados, por indicación, 2019-2028 (millones de USD)
TABLA 358 Mercado de medicamentos inyectables liofilizados de Noruega, por vía de administración, 2019-2028 (millones de USD)
TABLA 359 NORUEGA Mercado de medicamentos inyectables liofilizados, por usuario final, 2019-2028 (millones de USD)
TABLA 360 Mercado de medicamentos inyectables liofilizados de Noruega, por canal de distribución, 2019-2028 (millones de USD)
TABLA 361 HUNGRÍA Mercado de medicamentos inyectables liofilizados, por envase, 2019-2028 (millones de USD)
TABLA 362 HUNGRÍA Mercado de medicamentos inyectables liofilizados, por clase de medicamento, 2019-2028 (millones de USD)
TABLA 363 Mercado de medicamentos inyectables liofilizados de Hungría, por clase de medicamento, 2019-2028 (unidades)
TABLA 364 HUNGRÍA Mercado de antiinfecciosos en medicamentos inyectables liofilizados, por clase de medicamento, 2019-2028 (millones de USD)
TABLA 365 HUNGRÍA Mercado de antibióticos en medicamentos inyectables liofilizados, por clase de medicamento, 2019-2028 (millones de USD)
TABLA 366 HUNGRÍA Mercado de antifúngicos en medicamentos inyectables liofilizados, por clase de medicamento, 2019-2028 (millones de USD)
TABLA 367 HUNGRÍA Mercado de medicamentos antivirales inyectables liofilizados, por clase de medicamento, 2019-2028 (millones de USD)
TABLA 368 HUNGRÍA Mercado de medicamentos antineoplásicos inyectables liofilizados, por clase de medicamento, 2019-2028 (millones de USD)
TABLA 369 HUNGRÍA Mercado de diuréticos en medicamentos inyectables liofilizados, por clase de medicamento, 2019-2028 (millones de USD)
TABLA 370 HUNGRÍA Mercado de inhibidores de la bomba de protones en medicamentos inyectables liofilizados, por clase de medicamento, 2019-2028 (millones de USD)
TABLA 371 HUNGRÍA Mercado de anestésicos en medicamentos inyectables liofilizados, por clase de medicamento, 2019-2028 (millones de USD)
TABLA 372 HUNGRÍA Mercado de anticoagulantes en medicamentos inyectables liofilizados, por clase de medicamento, 2019-2028 (millones de USD)
TABLA 373 HUNGRÍA Mercado de AINE en medicamentos inyectables liofilizados, por clase de medicamento, 2019-2028 (millones de USD)
TABLA 374 HUNGRÍA Mercado de corticosteroides en medicamentos inyectables liofilizados, por clase de medicamento, 2019-2028 (millones de USD)
TABLA 375 HUNGRÍA Mercado de medicamentos inyectables liofilizados, por formato, 2019-2028 (millones de USD)
TABLA 376 HUNGRÍA Mercado de medicamentos inyectables liofilizados, por indicación, 2019-2028 (millones de USD)
TABLA 377 HUNGRÍA Mercado de medicamentos inyectables liofilizados, por vía de administración, 2019-2028 (millones de USD)
TABLA 378 HUNGRÍA Mercado de medicamentos inyectables liofilizados, por usuario final, 2019-2028 (millones de USD)
TABLA 379 HUNGRÍA Mercado de medicamentos inyectables liofilizados, por canal de distribución, 2019-2028 (millones de USD)
TABLA 380 LITUANIA Mercado de medicamentos inyectables liofilizados, por envase, 2019-2028 (millones de USD)
TABLA 381 LITUANIA Mercado de medicamentos inyectables liofilizados, por clase de medicamento, 2019-2028 (millones de USD)
TABLA 382 Mercado de medicamentos inyectables liofilizados de Lituania, por clase de medicamento, 2019-2028 (Unidades)
TABLA 383 LITUANIA Mercado de medicamentos antiinfecciosos inyectables liofilizados, por clase de medicamento, 2019-2028 (millones de USD)
TABLA 384 LITUANIA Mercado de antibióticos en medicamentos inyectables liofilizados, por clase de medicamento, 2019-2028 (millones de USD)
TABLA 385 LITUANIA Mercado de medicamentos antifúngicos inyectables liofilizados, por clase de medicamento, 2019-2028 (millones de USD)
TABLA 386 LITUANIA Mercado de medicamentos antivirales inyectables liofilizados, por clase de medicamento, 2019-2028 (millones de USD)
TABLA 387 LITUANIA Mercado de medicamentos antineoplásicos inyectables liofilizados, por clase de medicamento, 2019-2028 (millones de USD)
TABLA 388 LITUANIA Mercado de diuréticos en medicamentos inyectables liofilizados, por clase de medicamento, 2019-2028 (millones de USD)
TABLA 389 LITUANIA Mercado de inhibidores de la bomba de protones en medicamentos inyectables liofilizados, por clase de medicamento, 2019-2028 (millones de USD)
TABLA 390 LITUANIA Mercado de anestésicos en medicamentos inyectables liofilizados, por clase de medicamento, 2019-2028 (millones de USD)
TABLA 391 LITUANIA Mercado de anticoagulantes en medicamentos inyectables liofilizados, por clase de medicamento, 2019-2028 (millones de USD)
TABLA 392 LITUANIA AINE en el mercado de medicamentos inyectables liofilizados, por clase de medicamento, 2019-2028 (millones de USD)
TABLA 393 LITUANIA Mercado de corticosteroides en medicamentos inyectables liofilizados, por clase de medicamento, 2019-2028 (millones de USD)
TABLA 394 LITUANIA Mercado de medicamentos inyectables liofilizados, por formato, 2019-2028 (millones de USD)
TABLA 395 LITUANIA Mercado de medicamentos inyectables liofilizados, por indicación, 2019-2028 (millones de USD)
TABLA 396 LITUANIA Mercado de medicamentos inyectables liofilizados, por vía de administración, 2019-2028 (millones de USD)
TABLA 397 LITUANIA Mercado de medicamentos inyectables liofilizados, por usuario final, 2019-2028 (millones de USD)
TABLA 398 LITUANIA Mercado de medicamentos inyectables liofilizados, por canal de distribución, 2019-2028 (millones de USD)
TABLA 399 IRLANDA Mercado de medicamentos inyectables liofilizados, por envase, 2019-2028 (millones de USD)
TABLA 400 Mercado de medicamentos inyectables liofilizados de Irlanda, por clase de medicamento, 2019-2028 (millones de USD)
TABLA 401 Mercado de medicamentos inyectables liofilizados de Irlanda, por clase de medicamento, 2019-2028 (unidades)
TABLA 402 IRLANDA Mercado de antiinfecciosos en medicamentos inyectables liofilizados, por clase de medicamento, 2019-2028 (millones de USD)
TABLA 403 IRLANDA Mercado de antibióticos en medicamentos inyectables liofilizados, por clase de medicamento, 2019-2028 (millones de USD)
TABLA 404 IRLANDA Mercado de antifúngicos en medicamentos inyectables liofilizados, por clase de medicamento, 2019-2028 (millones de USD)
TABLA 405 IRLANDA Mercado de medicamentos antivirales inyectables liofilizados, por clase de medicamento, 2019-2028 (millones de USD)
TABLA 406 IRLANDA Mercado de antineoplásicos en medicamentos inyectables liofilizados, por clase de medicamento, 2019-2028 (millones de USD)
TABLA 407 IRLANDA Mercado de diuréticos en medicamentos inyectables liofilizados, por clase de medicamento, 2019-2028 (millones de USD)
TABLA 408 IRLANDA Mercado de inhibidores de la bomba de protones en medicamentos inyectables liofilizados, por clase de medicamento, 2019-2028 (millones de USD)
TABLA 409 IRLANDA Mercado de anestésicos en medicamentos inyectables liofilizados, por clase de medicamento, 2019-2028 (millones de USD)
TABLA 410 IRLANDA Mercado de anticoagulantes en medicamentos inyectables liofilizados, por clase de medicamento, 2019-2028 (millones de USD)
TABLA 411 IRLANDA: AINE en el mercado de medicamentos inyectables liofilizados, por clase de medicamento, 2019-2028 (millones de USD)
TABLA 412 IRLANDA Mercado de corticosteroides en medicamentos inyectables liofilizados, por clase de medicamento, 2019-2028 (millones de USD)
TABLA 413 IRLANDA Mercado de medicamentos inyectables liofilizados, por formato, 2019-2028 (millones de USD)
TABLA 414 IRLANDA Mercado de medicamentos inyectables liofilizados, por indicación, 2019-2028 (millones de USD)
TABLA 415 IRLANDA Mercado de medicamentos inyectables liofilizados, por vía de administración, 2019-2028 (millones de USD)
TABLA 416 IRLANDA Mercado de medicamentos inyectables liofilizados, por usuario final, 2019-2028 (millones de USD)
TABLA 417 IRLANDA Mercado de medicamentos inyectables liofilizados, por canal de distribución, 2019-2028 (millones de USD)
TABLA 418 POLONIA Mercado de medicamentos inyectables liofilizados, por envase, 2019-2028 (millones de USD)
TABLA 419 Mercado de medicamentos inyectables liofilizados de Polonia, por clase de medicamento, 2019-2028 (millones de USD)
TABLA 420 Mercado de medicamentos inyectables liofilizados de Polonia, por clase de medicamento, 2019-2028 (Unidades)
TABLA 421 POLONIA Mercado de antiinfecciosos en medicamentos inyectables liofilizados, por clase de medicamento, 2019-2028 (millones de USD)
TABLA 422 POLONIA Mercado de antibióticos inyectables liofilizados, por clase de fármaco, 2019-2028 (millones de USD)
TABLA 423 POLONIA Mercado de medicamentos antifúngicos inyectables liofilizados, por clase de medicamento, 2019-2028 (millones de USD)
TABLA 424 POLONIA Mercado de medicamentos antivirales inyectables liofilizados, por clase de medicamento, 2019-2028 (millones de USD)
TABLA 425 POLONIA Mercado de medicamentos antineoplásicos inyectables liofilizados, por clase de medicamento, 2019-2028 (millones de USD)
TABLA 426 POLONIA Mercado de diuréticos en medicamentos inyectables liofilizados, por clase de medicamento, 2019-2028 (millones de USD)
TABLA 427 POLONIA Mercado de inhibidores de la bomba de protones en medicamentos inyectables liofilizados, por clase de medicamento, 2019-2028 (millones de USD)
TABLA 428 POLONIA Mercado de anestésicos en medicamentos inyectables liofilizados, por clase de medicamento, 2019-2028 (millones de USD)
TABLA 429 POLONIA Mercado de anticoagulantes en medicamentos inyectables liofilizados, por clase de medicamento, 2019-2028 (millones de USD)
TABLA 430 POLONIA: AINE en el mercado de medicamentos inyectables liofilizados, por clase de medicamento, 2019-2028 (millones de USD)
TABLA 431 POLONIA Mercado de corticosteroides en medicamentos inyectables liofilizados, por clase de medicamento, 2019-2028 (millones de USD)
TABLA 432 POLONIA Mercado de medicamentos inyectables liofilizados, por formato, 2019-2028 (millones de USD)
TABLA 433 Mercado de medicamentos inyectables liofilizados de Polonia, por indicación, 2019-2028 (millones de USD)
TABLA 434 POLONIA Mercado de medicamentos inyectables liofilizados, por vía de administración, 2019-2028 (millones de USD)
TABLA 435 POLONIA Mercado de medicamentos inyectables liofilizados, por usuario final, 2019-2028 (millones de USD)
TABLA 436 POLONIA Mercado de medicamentos inyectables liofilizados, por canal de distribución, 2019-2028 (millones de USD)
TABLA 437 RESTO DE EUROPA Mercado de medicamentos inyectables liofilizados, por envase, 2019-2028 (millones de USD)
TABLA 438 Mercado de medicamentos inyectables liofilizados de Asia-Pacífico, por PAÍS, 2019-2028 (millones de USD)
TABLA 439 Mercado de medicamentos inyectables liofilizados de Asia-Pacífico, por envase, 2019-2028 (millones de USD)
TABLA 440 Mercado de medicamentos inyectables liofilizados de Asia-Pacífico, por clase de medicamento, 2019-2028 (millones de USD)
TABLA 441 Mercado de medicamentos inyectables liofilizados de Asia-Pacífico, por clase de medicamento, 2019-2028 (unidades)
TABLA 442 Mercado de antiinfecciosos en medicamentos inyectables liofilizados de Asia-Pacífico, por clase de medicamento, 2019-2028 (millones de USD)
TABLA 443 Mercado de antibióticos inyectables liofilizados de Asia-Pacífico, por clase de fármaco, 2019-2028 (millones de USD)
TABLA 444 Mercado de medicamentos antimicóticos inyectables liofilizados en Asia-Pacífico, por clase de medicamento, 2019-2028 (millones de USD)
TABLA 445 Mercado de medicamentos antivirales inyectables liofilizados de Asia-Pacífico, por clase de medicamento, 2019-2028 (millones de USD)
TABLA 446 Mercado de fármacos antineoplásicos inyectables liofilizados de Asia-Pacífico, por clase de fármaco, 2019-2028 (millones de USD)
TABLA 447 Mercado de diuréticos en medicamentos inyectables liofilizados de Asia-Pacífico, por clase de medicamento, 2019-2028 (millones de USD)
TABLA 448 Mercado de inhibidores de la bomba de protones en medicamentos inyectables liofilizados de Asia-Pacífico, por clase de medicamento, 2019-2028 (millones de USD)
TABLA 449 Mercado de anestésicos inyectables liofilizados de Asia-Pacífico, por clase de fármaco, 2019-2028 (millones de USD)
TABLA 450 Mercado de anticoagulantes inyectables liofilizados en Asia-Pacífico, por clase de fármaco, 2019-2028 (millones de USD)
TABLA 451 Mercado de AINE en medicamentos inyectables liofilizados de Asia-Pacífico, por clase de medicamento, 2019-2028 (millones de USD)
TABLA 452 Mercado de corticosteroides en medicamentos inyectables liofilizados de Asia-Pacífico, por clase de medicamento, 2019-2028 (millones de USD)
TABLA 453 Mercado de medicamentos inyectables liofilizados de Asia-Pacífico, por formato, 2019-2028 (millones de USD)
TABLA 454 Mercado de medicamentos inyectables liofilizados de Asia-Pacífico, por indicación, 2019-2028 (millones de USD)
TABLA 455 Mercado de medicamentos inyectables liofilizados de Asia-Pacífico, por vía de administración, 2019-2028 (millones de USD)
TABLA 456 Mercado de medicamentos inyectables liofilizados de Asia-Pacífico, por usuario final, 2019-2028 (millones de USD)
TABLA 457 Mercado de medicamentos inyectables liofilizados de Asia-Pacífico, por canal de distribución, 2019-2028 (millones de USD)
TABLA 458 Mercado japonés de medicamentos inyectables liofilizados, por envase, 2019-2028 (millones de USD)
TABLA 459 Mercado de medicamentos inyectables liofilizados en Japón, por clase de medicamento, 2019-2028 (millones de USD)
TABLA 460 Mercado de medicamentos inyectables liofilizados en Japón, por clase de medicamento, 2019-2028 (unidades)
TABLA 461 Mercado de antiinfecciosos en medicamentos inyectables liofilizados en Japón, por clase de medicamento, 2019-2028 (millones de USD)
TABLA 462 Mercado de antibióticos inyectables liofilizados en Japón, por clase de fármaco, 2019-2028 (millones de USD)
TABLA 463 Mercado de medicamentos antimicóticos inyectables liofilizados en Japón, por clase de medicamento, 2019-2028 (millones de USD)
TABLA 464 Mercado de medicamentos antivirales inyectables liofilizados en Japón, por clase de medicamento, 2019-2028 (millones de USD)
TABLA 465 Mercado de medicamentos antineoplásicos inyectables liofilizados en Japón, por clase de medicamento, 2019-2028 (millones de USD)
TABLA 466 Mercado de diuréticos en medicamentos inyectables liofilizados en Japón, por clase de medicamento, 2019-2028 (millones de USD)
TABLA 467 Mercado de inhibidores de la bomba de protones en medicamentos inyectables liofilizados de Japón, por clase de medicamento, 2019-2028 (millones de USD)
TABLA 468 Mercado de anestésicos inyectables liofilizados en Japón, por clase de fármaco, 2019-2028 (millones de USD)
TABLA 469 Mercado de anticoagulantes en medicamentos inyectables liofilizados en Japón, por clase de medicamento, 2019-2028 (millones de USD)
TABLA 470 AINE en el mercado de medicamentos inyectables liofilizados de Japón, por clase de medicamento, 2019-2028 (millones de USD)
TABLA 471 Mercado de corticosteroides en medicamentos inyectables liofilizados en Japón, por clase de medicamento, 2019-2028 (millones de USD)
TABLA 472 Mercado de medicamentos inyectables liofilizados en Japón, por formato, 2019-2028 (millones de USD)
TABLA 473 Mercado de medicamentos inyectables liofilizados en Japón, por indicación, 2019-2028 (millones de USD)
TABLA 474 Mercado de medicamentos inyectables liofilizados en Japón, por vía de administración, 2019-2028 (millones de USD)
TABLA 475 Mercado de medicamentos inyectables liofilizados en Japón, por usuario final, 2019-2028 (millones de USD)
TABLA 476 Mercado de medicamentos inyectables liofilizados en Japón, por canal de distribución, 2019-2028 (millones de USD)
TABLA 477 Mercado de medicamentos inyectables liofilizados en China, por envase, 2019-2028 (millones de USD)
TABLA 478 Mercado de medicamentos inyectables liofilizados de China, por clase de medicamento, 2019-2028 (millones de USD)
TABLA 479 Mercado de medicamentos inyectables liofilizados de China, por clase de medicamento, 2019-2028 (unidades)
TABLA 480 Mercado de medicamentos antiinfecciosos inyectables liofilizados de China, por clase de medicamento, 2019-2028 (millones de USD)
TABLA 481 Mercado de antibióticos inyectables liofilizados en China, por clase de fármaco, 2019-2028 (millones de USD)
TABLA 482 Mercado de medicamentos antimicóticos inyectables liofilizados en China, por clase de medicamento, 2019-2028 (millones de USD)
TABLA 483 Mercado de medicamentos antivirales inyectables liofilizados en China, por clase de medicamento, 2019-2028 (millones de USD)
TABLA 484 Mercado de medicamentos antineoplásicos inyectables liofilizados en China, por clase de medicamento, 2019-2028 (millones de USD)
TABLA 485 Mercado de diuréticos en medicamentos inyectables liofilizados de China, por clase de medicamento, 2019-2028 (millones de USD)
TABLA 486 Mercado de inhibidores de la bomba de protones en medicamentos inyectables liofilizados de China, por clase de medicamento, 2019-2028 (millones de USD)
TABLA 487 Mercado de anestésicos inyectables liofilizados en China, por clase de fármaco, 2019-2028 (millones de USD)
TABLA 488 Mercado de anticoagulantes inyectables liofilizados en China, por clase de fármaco, 2019-2028 (millones de USD)
TABLA 489 AINE en el mercado de medicamentos inyectables liofilizados de China, por clase de medicamento, 2019-2028 (millones de USD)
TABLA 490 Mercado de corticosteroides en medicamentos inyectables liofilizados de China, por clase de medicamento, 2019-2028 (millones de USD)
TABLA 491 Mercado de medicamentos inyectables liofilizados de China, por formato, 2019-2028 (millones de USD)
TABLA 492 Mercado de medicamentos inyectables liofilizados de China, por indicación, 2019-2028 (millones de USD)
TABLA 493 Mercado de medicamentos inyectables liofilizados de China, por vía de administración, 2019-2028 (millones de USD)
TABLA 494 Mercado de medicamentos inyectables liofilizados de China, por usuario final, 2019-2028 (millones de USD)
TABLA 495 Mercado de medicamentos inyectables liofilizados de China, por canal de distribución, 2019-2028 (millones de USD)
TABLA 496 Mercado de medicamentos inyectables liofilizados de Corea del Sur, por envase, 2019-2028 (millones de USD)
TABLA 497 Mercado de medicamentos inyectables liofilizados de COREA DEL SUR, por clase de medicamento, 2019-2028 (millones de USD)
TABLA 498 Mercado de medicamentos inyectables liofilizados de COREA DEL SUR, por clase de medicamento, 2019-2028 (Unidades)
TABLA 499 COREA DEL SUR Mercado de antiinfecciosos en medicamentos inyectables liofilizados, por clase de medicamento, 2019-2028 (millones de USD)
TABLA 500 COREA DEL SUR: Mercado de antibióticos inyectables liofilizados, por clase de fármaco, 2019-2028 (millones de USD)
TABLA 501 COREA DEL SUR Mercado de medicamentos antimicóticos inyectables liofilizados, por clase de medicamento, 2019-2028 (millones de USD)
TABLA 502 COREA DEL SUR Mercado de medicamentos antivirales inyectables liofilizados, por clase de medicamento, 2019-2028 (millones de USD)
TABLA 503 COREA DEL SUR Mercado de medicamentos antineoplásicos inyectables liofilizados, por clase de medicamento, 2019-2028 (millones de USD)
TABLA 504 COREA DEL SUR Mercado de diuréticos en medicamentos inyectables liofilizados, por clase de medicamento, 2019-2028 (millones de USD)
TABLA 505 COREA DEL SUR Mercado de inhibidores de la bomba de protones en medicamentos inyectables liofilizados, por clase de medicamento, 2019-2028 (millones de USD)
TABLA 506 COREA DEL SUR Mercado de anestésicos inyectables liofilizados, por clase de fármaco, 2019-2028 (millones de USD)
TABLA 507 COREA DEL SUR Mercado de anticoagulantes en medicamentos inyectables liofilizados, por clase de medicamento, 2019-2028 (millones de USD)
TABLA 508 COREA DEL SUR: AINE en el mercado de medicamentos inyectables liofilizados, por clase de medicamento, 2019-2028 (millones de USD)
TABLA 509 COREA DEL SUR Mercado de corticosteroides en medicamentos inyectables liofilizados, por clase de medicamento, 2019-2028 (millones de USD)
TABLA 510 Mercado de medicamentos inyectables liofilizados de COREA DEL SUR, por formato, 2019-2028 (millones de USD)
TABLA 511 Mercado de medicamentos inyectables liofilizados de COREA DEL SUR, por indicación, 2019-2028 (millones de USD)
TABLA 512 Mercado de medicamentos inyectables liofilizados de COREA DEL SUR, por vía de administración, 2019-2028 (millones de USD)
TABLA 513 Mercado de medicamentos inyectables liofilizados de COREA DEL SUR, por usuario final, 2019-2028 (millones de USD)
TABLA 514 Mercado de medicamentos inyectables liofilizados de COREA DEL SUR, por canal de distribución, 2019-2028 (millones de USD)
TABLA 515 Mercado de medicamentos inyectables liofilizados en India, por envase, 2019-2028 (millones de USD)
TABLA 516 Mercado de medicamentos inyectables liofilizados de la INDIA, por clase de medicamento, 2019-2028 (millones de USD)
TABLA 517 Mercado de medicamentos inyectables liofilizados de la INDIA, por clase de medicamento, 2019-2028 (unidades)
TABLA 518 INDIA Mercado de medicamentos antiinfecciosos inyectables liofilizados, por clase de medicamento, 2019-2028 (millones de USD)
TABLA 519 INDIA Mercado de antibióticos en medicamentos inyectables liofilizados, por clase de medicamento, 2019-2028 (millones de USD)
TABLA 520 INDIA Mercado de medicamentos antifúngicos inyectables liofilizados, por clase de medicamento, 2019-2028 (millones de USD)
TABLA 521 INDIA Mercado de medicamentos antivirales inyectables liofilizados, por clase de medicamento, 2019-2028 (millones de USD)
TABLA 522 INDIA Mercado de medicamentos antineoplásicos inyectables liofilizados, por clase de medicamento, 2019-2028 (millones de USD)
TABLA 523 INDIA Mercado de diuréticos en medicamentos inyectables liofilizados, por clase de medicamento, 2019-2028 (millones de USD)
TABLA 524 INDIA: Mercado de inhibidores de la bomba de protones en medicamentos inyectables liofilizados, por clase de medicamento, 2019-2028 (millones de USD)
TABLA 525 INDIA Mercado de anestésicos en medicamentos inyectables liofilizados, por clase de medicamento, 2019-2028 (millones de USD)
TABLA 526 INDIA Mercado de anticoagulantes en medicamentos inyectables liofilizados, por clase de medicamento, 2019-2028 (millones de USD)
TABLA 527 INDIA: AINE en el mercado de medicamentos inyectables liofilizados, por clase de medicamento, 2019-2028 (millones de USD)
TABLA 528 INDIA Mercado de corticosteroides en medicamentos inyectables liofilizados, por clase de medicamento, 2019-2028 (millones de USD)
TABLA 529 Mercado de medicamentos inyectables liofilizados de la INDIA, por formato, 2019-2028 (millones de USD)
TABLA 530 Mercado de medicamentos inyectables liofilizados de INDIA, por indicación, 2019-2028 (millones de USD)
TABLA 531 Mercado de medicamentos inyectables liofilizados de la INDIA, por vía de administración, 2019-2028 (millones de USD)
TABLA 532 Mercado de medicamentos inyectables liofilizados en INDIA, por usuario final, 2019-2028 (millones de USD)
TABLA 533 Mercado de medicamentos inyectables liofilizados de la INDIA, por canal de distribución, 2019-2028 (millones de USD)
TABLA 534 Mercado australiano de medicamentos inyectables liofilizados, por envase, 2019-2028 (millones de USD)
TABLA 535 Mercado de medicamentos inyectables liofilizados de Australia, por clase de medicamento, 2019-2028 (millones de USD)
TABLA 536 Mercado de medicamentos inyectables liofilizados de Australia, por clase de medicamento, 2019-2028 (unidades)
TABLA 537 AUSTRALIA Mercado de antiinfecciosos en medicamentos inyectables liofilizados, por clase de medicamento, 2019-2028 (millones de USD)
TABLA 538 AUSTRALIA Mercado de antibióticos en medicamentos inyectables liofilizados, por clase de medicamento, 2019-2028 (millones de USD)
TABLA 539 AUSTRALIA Mercado de medicamentos antimicóticos inyectables liofilizados, por clase de medicamento, 2019-2028 (millones de USD)
TABLA 540 AUSTRALIA Mercado de medicamentos antivirales inyectables liofilizados, por clase de medicamento, 2019-2028 (millones de USD)
TABLA 541 AUSTRALIA Mercado de medicamentos antineoplásicos inyectables liofilizados, por clase de medicamento, 2019-2028 (millones de USD)
TABLA 542 AUSTRALIA Mercado de diuréticos en medicamentos inyectables liofilizados, por clase de medicamento, 2019-2028 (millones de USD)
TABLA 543 AUSTRALIA Mercado de inhibidores de la bomba de protones en medicamentos inyectables liofilizados, por clase de medicamento, 2019-2028 (millones de USD)
TABLA 544 AUSTRALIA Mercado de anestésicos inyectables liofilizados, por clase de fármaco, 2019-2028 (millones de USD)
TABLA 545 AUSTRALIA Mercado de anticoagulantes en medicamentos inyectables liofilizados, por clase de medicamento, 2019-2028 (millones de USD)
TABLA 546 AUSTRALIA AINE en el mercado de medicamentos inyectables liofilizados, por clase de medicamento, 2019-2028 (millones de USD)
TABLA 547 AUSTRALIA Mercado de corticosteroides en medicamentos inyectables liofilizados, por clase de medicamento, 2019-2028 (millones de USD)
TABLA 548 AUSTRALIA Mercado de medicamentos inyectables liofilizados, por formato, 2019-2028 (millones de USD)
TABLA 549 AUSTRALIA Mercado de medicamentos inyectables liofilizados, por indicación, 2019-2028 (millones de USD)
TABLA 550 Mercado de medicamentos inyectables liofilizados de Australia, por vía de administración, 2019-2028 (millones de USD)
TABLA 551 AUSTRALIA Mercado de medicamentos inyectables liofilizados, por usuario final, 2019-2028 (millones de USD)
TABLA 552 AUSTRALIA Mercado de medicamentos inyectables liofilizados, por canal de distribución, 2019-2028 (millones de USD)
TABLA 553 Mercado de medicamentos inyectables liofilizados de Singapur, por envase, 2019-2028 (millones de USD)
TABLA 554 Mercado de medicamentos inyectables liofilizados de Singapur, por clase de medicamento, 2019-2028 (millones de USD)
TABLA 555 Mercado de medicamentos inyectables liofilizados de Singapur, por clase de medicamento, 2019-2028 (unidades)
TABLA 556 SINGAPUR Mercado de antiinfecciosos en medicamentos inyectables liofilizados, por clase de medicamento, 2019-2028 (millones de USD)
TABLA 557 Mercado de antibióticos inyectables liofilizados en Singapur, por clase de fármaco, 2019-2028 (millones de USD)
TABLA 558 SINGAPUR Mercado de antifúngicos en medicamentos inyectables liofilizados, por clase de medicamento, 2019-2028 (millones de USD)
TABLA 559 SINGAPUR Mercado de medicamentos antivirales inyectables liofilizados, por clase de medicamento, 2019-2028 (millones de USD)
TABLA 560 Mercado de antineoplásicos en fármacos inyectables liofilizados de Singapur, por clase de fármaco, 2019-2028 (millones de USD)
TABLA 561 SINGAPUR Mercado de diuréticos en medicamentos inyectables liofilizados, por clase de medicamento, 2019-2028 (millones de USD)
TABLA 562 SINGAPUR Mercado de inhibidores de la bomba de protones en medicamentos inyectables liofilizados, por clase de medicamento, 2019-2028 (millones de USD)
TABLA 563 Mercado de anestésicos inyectables liofilizados de Singapur, por clase de fármaco, 2019-2028 (millones de USD)
TABLA 564 SINGAPUR Mercado de anticoagulantes en medicamentos inyectables liofilizados, por clase de medicamento, 2019-2028 (millones de USD)
TABLA 565 SINGAPUR: AINE en el mercado de medicamentos inyectables liofilizados, por clase de medicamento, 2019-2028 (millones de USD)
TABLA 566 SINGAPUR Mercado de corticosteroides en medicamentos inyectables liofilizados, por clase de medicamento, 2019-2028 (millones de USD)
TABLA 567 Mercado de medicamentos inyectables liofilizados de Singapur, por formato, 2019-2028 (millones de USD)
TABLA 568 Mercado de medicamentos inyectables liofilizados de Singapur, por indicación, 2019-2028 (millones de USD)
TABLA 569 Mercado de medicamentos inyectables liofilizados de Singapur, por vía de administración, 2019-2028 (millones de USD)
TABLA 570 Mercado de medicamentos inyectables liofilizados de Singapur, por usuario final, 2019-2028 (millones de USD)
TABLA 571 Mercado de medicamentos inyectables liofilizados de Singapur, por canal de distribución, 2019-2028 (millones de USD)
TABLA 572 Mercado de medicamentos inyectables liofilizados de Tailandia, por envase, 2019-2028 (millones de USD)
TABLA 573 Mercado de medicamentos inyectables liofilizados de Tailandia, por clase de medicamento, 2019-2028 (millones de USD)
TABLA 574 Mercado de medicamentos inyectables liofilizados de Tailandia, por clase de medicamento, 2019-2028 (unidades)
TABLA 575 Mercado de medicamentos antiinfecciosos inyectables liofilizados de Tailandia, por clase de medicamento, 2019-2028 (millones de USD)
TABLA 576 Mercado de antibióticos inyectables liofilizados de Tailandia, por clase de fármaco, 2019-2028 (millones de USD)
TABLA 577 Mercado de medicamentos antimicóticos inyectables liofilizados en Tailandia, por clase de medicamento, 2019-2028 (millones de USD)
TABLA 578 Mercado de medicamentos antivirales inyectables liofilizados de Tailandia, por clase de medicamento, 2019-2028 (millones de USD)
TABLA 579 Mercado de medicamentos antineoplásicos inyectables liofilizados de Tailandia, por clase de medicamento, 2019-2028 (millones de USD)
TABLA 580 Mercado de diuréticos en medicamentos inyectables liofilizados de Tailandia, por clase de medicamento, 2019-2028 (millones de USD)
TABLA 581 Mercado de inhibidores de la bomba de protones en medicamentos inyectables liofilizados de Tailandia, por clase de medicamento, 2019-2028 (millones de USD)
TABLA 582 Mercado de anestésicos inyectables liofilizados de Tailandia, por clase de fármaco, 2019-2028 (millones de USD)
TABLA 583 Mercado de anticoagulantes en medicamentos inyectables liofilizados de Tailandia, por clase de medicamento, 2019-2028 (millones de USD)
TABLA 584 TAILANDIA: AINE en el mercado de medicamentos inyectables liofilizados, por clase de medicamento, 2019-2028 (millones de USD)
TABLA 585 Mercado de corticosteroides en medicamentos inyectables liofilizados de Tailandia, por clase de medicamento, 2019-2028 (millones de USD)
TABLA 586 Mercado de medicamentos inyectables liofilizados de Tailandia, por formato, 2019-2028 (millones de USD)
TABLA 587 Mercado de medicamentos inyectables liofilizados de Tailandia, por indicación, 2019-2028 (millones de USD)
TABLA 588 Mercado de medicamentos inyectables liofilizados de Tailandia, por vía de administración, 2019-2028 (millones de USD)
TABLA 589 Mercado de medicamentos inyectables liofilizados de Tailandia, por usuario final, 2019-2028 (millones de USD)
TABLA 590 Mercado de medicamentos inyectables liofilizados de Tailandia, por canal de distribución, 2019-2028 (millones de USD)
TABLA 591 Mercado de medicamentos inyectables liofilizados de Malasia, por envase, 2019-2028 (millones de USD)
TABLA 592 Mercado de medicamentos inyectables liofilizados de Malasia, por clase de medicamento, 2019-2028 (millones de USD)
TABLA 593 Mercado de medicamentos inyectables liofilizados de Malasia, por clase de medicamento, 2019-2028 (unidades)
TABLA 594 MALASIA Mercado de antiinfecciosos en medicamentos inyectables liofilizados, por clase de medicamento, 2019-2028 (millones de USD)
TABLA 595 MALASIA Mercado de antibióticos inyectables liofilizados, por clase de fármaco, 2019-2028 (millones de USD)
TABLA 596 Mercado de medicamentos antimicóticos inyectables liofilizados en Malasia, por clase de medicamento, 2019-2028 (millones de USD)
TABLA 597 Mercado de medicamentos antivirales inyectables liofilizados de Malasia, por clase de medicamento, 2019-2028 (millones de USD)
TABLA 598 Mercado de medicamentos antineoplásicos inyectables liofilizados en Malasia, por clase de medicamento, 2019-2028 (millones de USD)
TABLA 599 Mercado de diuréticos en medicamentos inyectables liofilizados de Malasia, por clase de medicamento, 2019-2028 (millones de USD)
TABLA 600 Mercado de inhibidores de la bomba de protones en medicamentos inyectables liofilizados de Malasia, por clase de medicamento, 2019-2028 (millones de USD)
TABLA 601 Mercado de anestésicos inyectables liofilizados en Malasia, por clase de fármaco, 2019-2028 (millones de USD)
TABLA 602 MALASIA Mercado de anticoagulantes en medicamentos inyectables liofilizados, por clase de medicamento, 2019-2028 (millones de USD)
TABLA 603 MALASIA: AINE en el mercado de medicamentos inyectables liofilizados, por clase de medicamento, 2019-2028 (millones de USD)
TABLA 604 MALASIA Mercado de corticosteroides en medicamentos inyectables liofilizados, por clase de medicamento, 2019-2028 (millones de USD)
TABLA 605 Mercado de medicamentos inyectables liofilizados de Malasia, por formato, 2019-2028 (millones de USD)
TABLA 606 Mercado de medicamentos inyectables liofilizados de Malasia, por indicación, 2019-2028 (millones de USD)
TABLA 607 Mercado de medicamentos inyectables liofilizados de Malasia, por vía de administración, 2019-2028 (millones de USD)
TABLA 608 Mercado de medicamentos inyectables liofilizados de Malasia, por usuario final, 2019-2028 (millones de USD)
TABLA 609 Mercado de medicamentos inyectables liofilizados de Malasia, por canal de distribución, 2019-2028 (millones de USD)
TABLA 610 Mercado de medicamentos inyectables liofilizados en Indonesia, por envase, 2019-2028 (millones de USD)
TABLA 611 Mercado de medicamentos inyectables liofilizados de Indonesia, por clase de medicamento, 2019-2028 (millones de USD)
TABLA 612 Mercado de medicamentos inyectables liofilizados de Indonesia, por clase de medicamento, 2019-2028 (Unidades)
TABLA 613 INDONESIA Mercado de antiinfecciosos en medicamentos inyectables liofilizados, por clase de medicamento, 2019-2028 (millones de USD)
TABLA 614 INDONESIA Mercado de antibióticos en medicamentos inyectables liofilizados, por clase de medicamento, 2019-2028 (millones de USD)
TABLA 615 INDONESIA Mercado de medicamentos antimicóticos inyectables liofilizados, por clase de medicamento, 2019-2028 (millones de USD)
TABLA 616 INDONESIA Mercado de medicamentos antivirales inyectables liofilizados, por clase de medicamento, 2019-2028 (millones de USD)
TABLA 617 INDONESIA Mercado de medicamentos antineoplásicos inyectables liofilizados, por clase de medicamento, 2019-2028 (millones de USD)
TABLA 618 INDONESIA Mercado de diuréticos en medicamentos inyectables liofilizados, por clase de medicamento, 2019-2028 (millones de USD)
TABLA 619 INDONESIA Mercado de inhibidores de la bomba de protones en medicamentos inyectables liofilizados, por clase de medicamento, 2019-2028 (millones de USD)
TABLA 620 INDONESIA Mercado de anestésicos inyectables liofilizados, por clase de fármaco, 2019-2028 (millones de USD)
TABLA 621 INDONESIA Mercado de anticoagulantes en medicamentos inyectables liofilizados, por clase de medicamento, 2019-2028 (millones de USD)
TABLA 622 INDONESIA Mercado de AINE en medicamentos inyectables liofilizados, por clase de medicamento, 2019-2028 (millones de USD)
TABLA 623 INDONESIA Mercado de corticosteroides en medicamentos inyectables liofilizados, por clase de medicamento, 2019-2028 (millones de USD)
TABLA 624 Mercado de medicamentos inyectables liofilizados de INDONESIA, por formato, 2019-2028 (millones de USD)
TABLA 625 Mercado de medicamentos inyectables liofilizados de INDONESIA, por indicación, 2019-2028 (millones de USD)
TABLA 626 Mercado de medicamentos inyectables liofilizados de INDONESIA, por vía de administración, 2019-2028 (millones de USD)
TABLA 627 Mercado de medicamentos inyectables liofilizados de INDONESIA, por usuario final, 2019-2028 (millones de USD)
TABLA 628 Mercado de medicamentos inyectables liofilizados de Indonesia, por canal de distribución, 2019-2028 (millones de USD)
TABLA 629 Mercado de medicamentos inyectables liofilizados de Filipinas, por envase, 2019-2028 (millones de USD)
TABLA 630 Mercado de medicamentos inyectables liofilizados de Filipinas, por clase de medicamento, 2019-2028 (millones de USD)
TABLA 631 Mercado de medicamentos inyectables liofilizados de Filipinas, por clase de medicamento, 2019-2028 (Unidades)
TABLA 632 FILIPINAS Mercado de antiinfecciosos en medicamentos inyectables liofilizados, por clase de medicamento, 2019-2028 (millones de USD)
TABLA 633 FILIPINAS Mercado de antibióticos inyectables liofilizados, por clase de fármaco, 2019-2028 (millones de USD)
TABLA 634 FILIPINAS Mercado de medicamentos antifúngicos inyectables liofilizados, por clase de medicamento, 2019-2028 (millones de USD)
TABLA 635 FILIPINAS Mercado de medicamentos antivirales inyectables liofilizados, por clase de medicamento, 2019-2028 (millones de USD)
TABLA 636 FILIPINAS Mercado de medicamentos antineoplásicos inyectables liofilizados, por clase de medicamento, 2019-2028 (millones de USD)
TABLA 637 FILIPINAS Mercado de diuréticos en medicamentos inyectables liofilizados, por clase de medicamento, 2019-2028 (millones de USD)
TABLA 638 FILIPINAS Mercado de inhibidores de la bomba de protones en medicamentos inyectables liofilizados, por clase de medicamento, 2019-2028 (millones de USD)
TABLA 639 FILIPINAS Mercado de anestésicos inyectables liofilizados, por clase de fármaco, 2019-2028 (millones de USD)
TABLA 640 FILIPINAS Mercado de anticoagulantes en medicamentos inyectables liofilizados, por clase de medicamento, 2019-2028 (millones de USD)
TABLA 641 FILIPINAS: AINE en el mercado de medicamentos inyectables liofilizados, por clase de medicamento, 2019-2028 (millones de USD)
TABLA 642 FILIPINAS Mercado de corticosteroides en medicamentos inyectables liofilizados, por clase de medicamento, 2019-2028 (millones de USD)
TABLA 643 FILIPINAS Mercado de medicamentos inyectables liofilizados, por formato, 2019-2028 (millones de USD)
TABLA 644 Mercado de medicamentos inyectables liofilizados de Filipinas, por indicación, 2019-2028 (millones de USD)
TABLA 645 Mercado de medicamentos inyectables liofilizados de Filipinas, por vía de administración, 2019-2028 (millones de USD)
TABLA 646 FILIPINAS Mercado de medicamentos inyectables liofilizados, por usuario final, 2019-2028 (millones de USD)
TABLA 647 FILIPINAS Mercado de medicamentos inyectables liofilizados, por canal de distribución, 2019-2028 (millones de USD)
TABLA 648 Mercado de medicamentos inyectables liofilizados de Vietnam, por envase, 2019-2028 (millones de USD)
TABLA 649 Mercado de medicamentos inyectables liofilizados de Vietnam, por clase de medicamento, 2019-2028 (millones de USD)
TABLA 650 Mercado de medicamentos inyectables liofilizados de Vietnam, por clase de medicamento, 2019-2028 (unidades)
TABLA 651 Mercado de antiinfecciosos en medicamentos inyectables liofilizados de VIETNAM, por clase de medicamento, 2019-2028 (millones de USD)
TABLA 652 Mercado de antibióticos inyectables liofilizados en Vietnam, por clase de fármaco, 2019-2028 (millones de USD)
TABLA 653 VIETNAM Mercado de medicamentos antimicóticos inyectables liofilizados, por clase de medicamento, 2019-2028 (millones de USD)
TABLA 654 Mercado de medicamentos antivirales inyectables liofilizados de Vietnam, por clase de medicamento, 2019-2028 (millones de USD)
TABLA 655 VIETNAM Mercado de medicamentos antineoplásicos inyectables liofilizados, por clase de medicamento, 2019-2028 (millones de USD)
TABLA 656 VIETNAM Mercado de diuréticos en medicamentos inyectables liofilizados, por clase de medicamento, 2019-2028 (millones de USD)
TABLA 657 VIETNAM Mercado de inhibidores de la bomba de protones en medicamentos inyectables liofilizados, por clase de medicamento, 2019-2028 (millones de USD)
TABLA 658 VIETNAM Mercado de anestésicos en medicamentos inyectables liofilizados, por clase de medicamento, 2019-2028 (millones de USD)
TABLA 659 VIETNAM Mercado de anticoagulantes en medicamentos inyectables liofilizados, por clase de medicamento, 2019-2028 (millones de USD)
TABLA 660 AINE en el mercado de medicamentos inyectables liofilizados de Vietnam, por clase de medicamento, 2019-2028 (millones de USD)
TABLA 661 VIETNAM Mercado de corticosteroides en medicamentos inyectables liofilizados, por clase de medicamento, 2019-2028 (millones de USD)
TABLA 662 Mercado de medicamentos inyectables liofilizados de Vietnam, por formato, 2019-2028 (millones de USD)
TABLA 663 Mercado de medicamentos inyectables liofilizados de VIETNAM, por indicación, 2019-2028 (millones de USD)
TABLA 664 Mercado de medicamentos inyectables liofilizados de VIETNAM, por vía de administración, 2019-2028 (millones de USD)
TABLA 665 Mercado de medicamentos inyectables liofilizados de Vietnam, por usuario final, 2019-2028 (millones de USD)
TABLA 666 Mercado de medicamentos inyectables liofilizados de Vietnam, por canal de distribución, 2019-2028 (millones de USD)
TABLA 667 Resto del mercado de medicamentos inyectables liofilizados de Asia-Pacífico, por envase, 2019-2028 (millones de USD)
TABLA 668 Mercado de medicamentos inyectables liofilizados de América del Sur, por PAÍS, 2019-2028 (millones de USD)
TABLA 669 Mercado de medicamentos inyectables liofilizados en América del Sur, por envase, 2019-2028 (millones de USD)
TABLA 670 Mercado de medicamentos inyectables liofilizados en América del Sur, por clase de medicamento, 2019-2028 (millones de USD)
TABLA 671 Mercado de medicamentos inyectables liofilizados de América del Sur, por clase de medicamento, 2019-2028 (Unidades)
TABLA 672 Mercado de antiinfecciosos en medicamentos inyectables liofilizados en América del Sur, por clase de medicamento, 2019-2028 (millones de USD)
TABLA 673 Mercado de antibióticos en medicamentos inyectables liofilizados en Sudamérica, por clase de medicamento, 2019-2028 (millones de USD)
TABLA 674 Mercado de medicamentos antimicóticos inyectables liofilizados en Sudamérica, por clase de medicamento, 2019-2028 (millones de USD)
TABLA 675 Mercado de medicamentos antivirales inyectables liofilizados en Sudamérica, por clase de medicamento, 2019-2028 (millones de USD)
TABLA 676 Mercado de medicamentos antineoplásicos inyectables liofilizados en Sudamérica, por clase de medicamento, 2019-2028 (millones de USD)
TABLA 677 Mercado de diuréticos en medicamentos inyectables liofilizados de Sudamérica, por clase de medicamento, 2019-2028 (millones de USD)
TABLA 678 Mercado de inhibidores de la bomba de protones en medicamentos inyectables liofilizados en Sudamérica, por clase de medicamento, 2019-2028 (millones de USD)
TABLA 679 Mercado de anestésicos inyectables liofilizados en Sudamérica, por clase de fármaco, 2019-2028 (millones de USD)
TABLA 680 Mercado de anticoagulantes en medicamentos inyectables liofilizados en Sudamérica, por clase de medicamento, 2019-2028 (millones de USD)
TABLA 681 Mercado de AINE en Sudamérica en medicamentos inyectables liofilizados, por clase de medicamento, 2019-2028 (millones de USD)
TABLA 682 Mercado de corticosteroides en medicamentos inyectables liofilizados de América del Sur, por clase de medicamento, 2019-2028 (millones de USD)
TABLA 683 Mercado de medicamentos inyectables liofilizados de América del Sur, por formato, 2019-2028 (millones de USD)
TABLA 684 Mercado de medicamentos inyectables liofilizados de América del Sur, por indicación, 2019-2028 (millones de USD)
TABLA 685 Mercado de medicamentos inyectables liofilizados de América del Sur, por vía de administración, 2019-2028 (millones de USD)
TABLA 686 Mercado de medicamentos inyectables liofilizados en América del Sur, por usuario final, 2019-2028 (millones de USD)
TABLA 687 Mercado de medicamentos inyectables liofilizados en América del Sur, por canal de distribución, 2019-2028 (millones de USD)
TABLA 688 Mercado brasileño de medicamentos inyectables liofilizados, por envase, 2019-2028 (millones de USD)
TABLA 689 BRASIL Mercado de medicamentos inyectables liofilizados, por clase de medicamento, 2019-2028 (USD millones)
TABLA 690 Mercado de medicamentos inyectables liofilizados en Brasil, por clase de medicamento, 2019-2028 (Unidades)
TABLA 691 BRASIL Mercado de antiinfecciosos en medicamentos inyectables liofilizados, por clase de medicamento, 2019-2028 (USD millones)
TABLA 692 BRASIL Mercado de antibióticos en medicamentos inyectables liofilizados, por clase de medicamento, 2019-2028 (USD millones)
TABLA 693 BRASIL Mercado de medicamentos antifúngicos inyectables liofilizados, por clase de medicamento, 2019-2028 (USD millones)
TABLA 694 BRASIL Mercado de medicamentos antivirales inyectables liofilizados, por clase de medicamento, 2019-2028 (USD millones)
TABLA 695 BRASIL Mercado de medicamentos antineoplásicos inyectables liofilizados, por clase de medicamento, 2019-2028 (USD millones)
TABLA 696 BRASIL Mercado de diuréticos en medicamentos inyectables liofilizados, por clase de medicamento, 2019-2028 (USD millones)
TABLA 697 BRASIL Mercado de inhibidores de la bomba de protones en medicamentos inyectables liofilizados, por clase de medicamento, 2019-2028 (millones de USD)
TABLA 698 BRASIL Mercado de anestésicos en medicamentos inyectables liofilizados, por clase de medicamento, 2019-2028 (USD millones)
TABLA 699 BRASIL Mercado de anticoagulantes en medicamentos inyectables liofilizados, por clase de medicamento, 2019-2028 (USD millones)
TABLA 700 BRASIL AINE en el mercado de medicamentos inyectables liofilizados, por clase de medicamento, 2019-2028 (USD millones)
TABLA 701 BRASIL Mercado de corticosteroides en medicamentos inyectables liofilizados, por clase de medicamento, 2019-2028 (USD millones)
TABLA 702 BRASIL Mercado de medicamentos inyectables liofilizados, por formato, 2019-2028 (USD millones)
TABLA 703 BRASIL Mercado de medicamentos inyectables liofilizados, por indicación, 2019-2028 (USD millones)
TABLA 704 BRASIL Mercado de medicamentos inyectables liofilizados, por vía de administración, 2019-2028 (USD millones)
TABLA 705 BRASIL Mercado de medicamentos inyectables liofilizados, por usuario final, 2019-2028 (USD millones)
TABLA 706 BRASIL Mercado de medicamentos inyectables liofilizados, por canal de distribución, 2019-2028 (USD millones)
TABLA 707 Mercado Argentino de Medicamentos Inyectables Liofilizados, por Envase, 2019-2028 (Millones de USD)
TABLA 708 Mercado de medicamentos inyectables liofilizados de Argentina, por clase de medicamento, 2019-2028 (millones de USD)
TABLA 709 Mercado de Medicamentos Inyectables Liofilizados de Argentina, por Clase de Medicamento, 2019-2028 (Unidades)
TABLA 710 ARGENTINA Mercado de antiinfecciosos en medicamentos inyectables liofilizados, por clase de medicamento, 2019-2028 (USD millones)
TABLA 711 ARGENTINA Mercado de antibióticos en medicamentos inyectables liofilizados, por clase de medicamento, 2019-2028 (USD millones)
TABLA 712 Mercado de medicamentos antifúngicos inyectables liofilizados en Argentina, por clase de medicamento, 2019-2028 (USD millones)
TABLA 713 ARGENTINA Mercado de medicamentos antivirales inyectables liofilizados, por clase de medicamento, 2019-2028 (USD millones)
TABLA 714 ARGENTINA Mercado de medicamentos antineoplásicos inyectables liofilizados, por clase de medicamento, 2019-2028 (USD millones)
TABLA 715 ARGENTINA Mercado de diuréticos en medicamentos inyectables liofilizados, por clase de medicamento, 2019-2028 (USD millones)
TABLA 716 ARGENTINA Mercado de inhibidores de la bomba de protones en medicamentos inyectables liofilizados, por clase de medicamento, 2019-2028 (millones de USD)
TABLA 717 ARGENTINA Mercado de anestésicos en medicamentos inyectables liofilizados, por clase de medicamento, 2019-2028 (millones de USD)
TABLA 718 ARGENTINA Mercado de anticoagulantes en medicamentos inyectables liofilizados, por clase de medicamento, 2019-2028 (USD millones)
TABLA 719 ARGENTINA Mercado de AINE en Medicamentos Inyectables Liofilizados, por Clase de Medicamento, 2019-2028 (Millones de USD)
TABLA 720 ARGENTINA Mercado de corticosteroides en medicamentos inyectables liofilizados, por clase de medicamento, 2019-2028 (USD millones)
TABLA 721 Mercado de medicamentos inyectables liofilizados de Argentina, por formato, 2019-2028 (USD millones)
TABLA 722 Mercado de Medicamentos Inyectables Liofilizados de Argentina, por Indicación, 2019-2028 (Millones de USD)
TABLA 723 Mercado de Medicamentos Inyectables Liofilizados de Argentina, por Vía de Administración, 2019-2028 (Millones de USD)
TABLA 724 Mercado de medicamentos inyectables liofilizados de Argentina, por usuario final, 2019-2028 (millones de USD)
TABLA 725 Mercado de medicamentos inyectables liofilizados de Argentina, por canal de distribución, 2019-2028 (USD millones)
TABLA 726 Mercado de medicamentos inyectables liofilizados en Perú, por presentación, 2019-2028 (USD millones)
TABLA 727 Mercado de medicamentos inyectables liofilizados en Perú, por clase de medicamento, 2019-2028 (USD millones)
TABLA 728 Mercado de Medicamentos Inyectables Liofilizados en Perú, por Clase de Medicamento, 2019-2028 (Unidades)
TABLA 729 Mercado de Antiinfecciosos en Medicamentos Inyectables Liofilizados en Perú, por Clase de Medicamento, 2019-2028 (Millones de USD)
TABLA 730 Mercado de antibióticos inyectables liofilizados en Perú, por clase de fármaco, 2019-2028 (USD millones)
TABLA 731 Mercado de antifúngicos en medicamentos inyectables liofilizados en Perú, por clase de medicamento, 2019-2028 (USD millones)
TABLA 732 Mercado de medicamentos antivirales inyectables liofilizados en Perú, por clase de medicamento, 2019-2028 (USD millones)
TABLA 733 Mercado de medicamentos antineoplásicos inyectables liofilizados en Perú, por clase de medicamento, 2019-2028 (USD millones)
TABLA 734 Mercado de diuréticos en medicamentos inyectables liofilizados en Perú, por clase de medicamento, 2019-2028 (USD millones)
TABLA 735 Mercado de inhibidores de la bomba de protones en medicamentos inyectables liofilizados de Perú, por clase de medicamento, 2019-2028 (USD millones)
TABLA 736 Mercado de anestésicos inyectables liofilizados en Perú, por clase de fármaco, 2019-2028 (USD millones)
TABLA 737 Mercado de anticoagulantes en medicamentos inyectables liofilizados en Perú, por clase de medicamento, 2019-2028 (USD millones)
TABLA 738 AINE en el mercado de medicamentos inyectables liofilizados de PERÚ, por clase de medicamento, 2019-2028 (USD millones)
TABLA 739 Mercado de corticosteroides en medicamentos inyectables liofilizados en Perú, por clase de medicamento, 2019-2028 (USD millones)
TABLA 740 Mercado de medicamentos inyectables liofilizados en Perú, por formato, 2019-2028 (USD millones)
TABLA 741 Mercado de Medicamentos Inyectables Liofilizados en Perú, por Indicación, 2019-2028 (USD Millones)
TABLA 742 Mercado de Medicamentos Inyectables Liofilizados en Perú, por Vía de Administración, 2019-2028 (USD Millones)
TABLA 743 Mercado de medicamentos inyectables liofilizados en Perú, por usuario final, 2019-2028 (USD millones)
TABLA 744 Mercado de medicamentos inyectables liofilizados en Perú, por canal de distribución, 2019-2028 (USD millones)
TABLA 745 Resto de Sudamérica Mercado de Medicamentos Inyectables Liofilizados, Por Envase, 2019-2028 (Millones de USD)
TABLA 746 MERCADO DE MEDICAMENTOS INYECTABLES LIOFILIZADOS DE Oriente Medio y África, POR PAÍS, 2019-2028 (MILLONES DE USD)
TABLA 747 Mercado de medicamentos inyectables liofilizados en Oriente Medio y África, por envase, 2019-2028 (millones de USD)
TABLA 748 Mercado de medicamentos inyectables liofilizados en Oriente Medio y África, por clase de medicamento, 2019-2028 (millones de USD)
TABLA 749 Mercado de medicamentos inyectables liofilizados en Oriente Medio y África, por clase de medicamento, 2019-2028 (unidades)
TABLA 750 Mercado de antiinfecciosos en medicamentos inyectables liofilizados de Oriente Medio y África, por clase de medicamento, 2019-2028 (millones de USD)
TABLA 751 Mercado de antibióticos inyectables liofilizados en Oriente Medio y África, por clase de fármaco, 2019-2028 (millones de USD)
TABLA 752 Mercado de medicamentos antimicóticos inyectables liofilizados en Oriente Medio y África, por clase de medicamento, 2019-2028 (millones de USD)
TABLA 753 Mercado de medicamentos antivirales inyectables liofilizados en Oriente Medio y África, por clase de medicamento, 2019-2028 (millones de USD)
TABLA 754 Mercado de medicamentos antineoplásicos inyectables liofilizados en Oriente Medio y África, por clase de medicamento, 2019-2028 (millones de USD)
TABLA 755 Mercado de diuréticos en medicamentos inyectables liofilizados de Oriente Medio y África, por clase de medicamento, 2019-2028 (millones de USD)
TABLA 756 Mercado de inhibidores de la bomba de protones en medicamentos inyectables liofilizados en Oriente Medio y África, por clase de medicamento, 2019-2028 (millones de USD)
TABLA 757 Mercado de anestésicos inyectables liofilizados en Oriente Medio y África, por clase de fármaco, 2019-2028 (millones de USD)
TABLA 758 Mercado de anticoagulantes en medicamentos inyectables liofilizados de Oriente Medio y África, por clase de medicamento, 2019-2028 (millones de USD)
TABLA 759 Mercado de AINE en medicamentos inyectables liofilizados de Oriente Medio y África, por clase de medicamento, 2019-2028 (millones de USD)
TABLA 760 Mercado de corticosteroides en medicamentos inyectables liofilizados en Oriente Medio y África, por clase de medicamento, 2019-2028 (millones de USD)
TABLA 761 Mercado de medicamentos inyectables liofilizados en Oriente Medio y África, por formato, 2019-2028 (millones de USD)
TABLA 762 Mercado de medicamentos inyectables liofilizados en Oriente Medio y África, por indicación, 2019-2028 (millones de USD)
TABLA 763 Mercado de medicamentos inyectables liofilizados de Oriente Medio y África, por vía de administración, 2019-2028 (millones de USD)
TABLA 764 Mercado de medicamentos inyectables liofilizados en Oriente Medio y África, por usuario final, 2019-2028 (millones de USD)
TABLA 765 Mercado de medicamentos inyectables liofilizados en Oriente Medio y África, por canal de distribución, 2019-2028 (millones de USD)
TABLA 766 Mercado de medicamentos inyectables liofilizados de Sudáfrica, por envase, 2019-2028 (millones de USD)
TABLA 767 Mercado de medicamentos inyectables liofilizados de Sudáfrica, por clase de medicamento, 2019-2028 (millones de USD)
TABLA 768 Mercado de medicamentos inyectables liofilizados de Sudáfrica, por clase de medicamento, 2019-2028 (unidades)
TABLA 769 Mercado de antiinfecciosos en medicamentos inyectables liofilizados de Sudáfrica, por clase de medicamento, 2019-2028 (millones de USD)
TABLA 770 Mercado de antibióticos inyectables liofilizados en Sudáfrica, por clase de fármaco, 2019-2028 (millones de USD)
TABLA 771 Mercado sudafricano de antifúngicos inyectables liofilizados, por clase de fármaco, 2019-2028 (millones de USD)
TABLA 772 Mercado de medicamentos antivirales inyectables liofilizados en Sudáfrica, por clase de medicamento, 2019-2028 (millones de USD)
TABLA 773 Mercado sudafricano de fármacos antineoplásicos inyectables liofilizados, por clase de fármaco, 2019-2028 (millones de USD)
TABLA 774 Mercado de diuréticos inyectables liofilizados en Sudáfrica, por clase de fármaco, 2019-2028 (millones de USD)
TABLA 775 Mercado de inhibidores de la bomba de protones en medicamentos inyectables liofilizados de Sudáfrica, por clase de medicamento, 2019-2028 (millones de USD)
TABLA 776 Mercado de anestésicos inyectables liofilizados de Sudáfrica, por clase de fármaco, 2019-2028 (millones de USD)
TABLA 777 Mercado sudafricano de anticoagulantes en medicamentos inyectables liofilizados, por clase de medicamento, 2019-2028 (millones de USD)
TABLA 778 Mercado de AINE en Sudáfrica en medicamentos inyectables liofilizados, por clase de medicamento, 2019-2028 (millones de USD)
TABLA 779 Mercado de corticosteroides en medicamentos inyectables liofilizados de Sudáfrica, por clase de medicamento, 2019-2028 (millones de USD)
TABLA 780 Mercado de medicamentos inyectables liofilizados de Sudáfrica, por formato, 2019-2028 (millones de USD)
TABLA 781 Mercado de medicamentos inyectables liofilizados de Sudáfrica, por indicación, 2019-2028 (millones de USD)
TABLA 782 Mercado de medicamentos inyectables liofilizados de Sudáfrica, por vía de administración, 2019-2028 (millones de USD)
TABLA 783 Mercado de medicamentos inyectables liofilizados de Sudáfrica, por usuario final, 2019-2028 (millones de USD)
TABLA 784 Mercado de medicamentos inyectables liofilizados de Sudáfrica, por canal de distribución, 2019-2028 (millones de USD)
TABLA 785 Mercado de medicamentos inyectables liofilizados de Arabia Saudita, por envase, 2019-2028 (millones de USD)
TABLA 786 Mercado de medicamentos inyectables liofilizados de Arabia Saudita, por clase de medicamento, 2019-2028 (millones de USD)
TABLA 787 Mercado de medicamentos inyectables liofilizados de Arabia Saudita, por clase de medicamento, 2019-2028 (unidades)
TABLA 788 Mercado de antiinfecciosos en medicamentos inyectables liofilizados de Arabia Saudita, por clase de medicamento, 2019-2028 (millones de USD)
TABLA 789 Mercado de antibióticos inyectables liofilizados en Arabia Saudita, por clase de fármaco, 2019-2028 (millones de USD)
TABLA 790 Mercado de medicamentos antimicóticos inyectables liofilizados en Arabia Saudita, por clase de medicamento, 2019-2028 (millones de USD)
TABLA 791 Mercado de medicamentos antivirales inyectables liofilizados de Arabia Saudita, por clase de medicamento, 2019-2028 (millones de USD)
TABLA 792 Mercado de medicamentos antineoplásicos inyectables liofilizados de Arabia Saudita, por clase de medicamento, 2019-2028 (millones de USD)
TABLA 793 Mercado de diuréticos inyectables liofilizados en Arabia Saudita, por clase de fármaco, 2019-2028 (millones de USD)
TABLA 794 Mercado de inhibidores de la bomba de protones en medicamentos inyectables liofilizados de Arabia Saudita, por clase de medicamento, 2019-2028 (millones de USD)
TABLA 795 Mercado de anestésicos inyectables liofilizados de Arabia Saudita, por clase de fármaco, 2019-2028 (millones de USD)
TABLA 796 Mercado de anticoagulantes inyectables liofilizados de Arabia Saudita, por clase de fármaco, 2019-2028 (millones de USD)
TABLA 797 AINE en el mercado de medicamentos inyectables liofilizados de Arabia Saudita, por clase de medicamento, 2019-2028 (millones de USD)
TABLA 798 Mercado de corticosteroides en medicamentos inyectables liofilizados de Arabia Saudita, por clase de medicamento, 2019-2028 (millones de USD)
TABLA 799 Mercado de medicamentos inyectables liofilizados de Arabia Saudita, por formato, 2019-2028 (millones de USD)
TABLA 800 Mercado de medicamentos inyectables liofilizados de Arabia Saudita, por indicación, 2019-2028 (millones de USD)
TABLA 801 Mercado de medicamentos inyectables liofilizados de Arabia Saudita, por vía de administración, 2019-2028 (millones de USD)
TABLA 802 Mercado de medicamentos inyectables liofilizados de Arabia Saudita, por usuario final, 2019-2028 (millones de USD)
TABLA 803 Mercado de medicamentos inyectables liofilizados de Arabia Saudita, por canal de distribución, 2019-2028 (millones de USD)
TABLA 804 Mercado de medicamentos inyectables liofilizados en los EAU, por envase, 2019-2028 (millones de USD)
TABLA 805 Mercado de medicamentos inyectables liofilizados de los EAU, por clase de medicamento, 2019-2028 (millones de USD)
TABLA 806 Mercado de medicamentos inyectables liofilizados de los EAU, por clase de medicamento, 2019-2028 (unidades)
TABLA 807 Mercado de medicamentos antiinfecciosos inyectables liofilizados en los EAU, por clase de medicamento, 2019-2028 (millones de USD)
TABLA 808 Mercado de antibióticos inyectables liofilizados en los EAU, por clase de fármaco, 2019-2028 (millones de USD)
TABLA 809 Mercado de medicamentos antimicóticos inyectables liofilizados en los EAU, por clase de medicamento, 2019-2028 (millones de USD)
TABLA 810 Mercado de medicamentos antivirales inyectables liofilizados en los EAU, por clase de medicamento, 2019-2028 (millones de USD)
TABLA 811 Mercado de medicamentos antineoplásicos inyectables liofilizados en los EAU, por clase de medicamento, 2019-2028 (millones de USD)
TABLA 812 Mercado de diuréticos en medicamentos inyectables liofilizados de los EAU, por clase de medicamento, 2019-2028 (millones de USD)
TABLA 813 Mercado de inhibidores de la bomba de protones en medicamentos inyectables liofilizados de los EAU, por clase de medicamento, 2019-2028 (millones de USD)
TABLA 814 Mercado de anestésicos inyectables liofilizados de los EAU, por clase de fármaco, 2019-2028 (millones de USD)
TABLA 815 Mercado de anticoagulantes en medicamentos inyectables liofilizados de los EAU, por clase de medicamento, 2019-2028 (millones de USD)
TABLA 816 AINE en el mercado de medicamentos inyectables liofilizados de los EAU, por clase de medicamento, 2019-2028 (millones de USD)
TABLA 817 Mercado de corticosteroides en medicamentos inyectables liofilizados de los EAU, por clase de medicamento, 2019-2028 (millones de USD)
TABLA 818 Mercado de medicamentos inyectables liofilizados de los EAU, por formato, 2019-2028 (millones de USD)
TABLA 819 Mercado de medicamentos inyectables liofilizados de los EAU, por indicación, 2019-2028 (millones de USD)
TABLA 820 Mercado de medicamentos inyectables liofilizados de los EAU, por vía de administración, 2019-2028 (millones de USD)
TABLA 821 Mercado de medicamentos inyectables liofilizados en los EAU, por usuario final, 2019-2028 (millones de USD)
TABLA 822 Mercado de medicamentos inyectables liofilizados de los EAU, por canal de distribución, 2019-2028 (millones de USD)
TABLA 823 EGIPTO Mercado de medicamentos inyectables liofilizados, por envase, 2019-2028 (millones de USD)
TABLA 824 EGIPTO Mercado de medicamentos inyectables liofilizados, por clase de medicamento, 2019-2028 (millones de USD)
TABLA 825 Mercado de medicamentos inyectables liofilizados en Egipto, por clase de medicamento, 2019-2028 (unidades)
TABLA 826 EGIPTO Mercado de antiinfecciosos en medicamentos inyectables liofilizados, por clase de medicamento, 2019-2028 (millones de USD)
TABLA 827 EGIPTO Mercado de antibióticos en medicamentos inyectables liofilizados, por clase de medicamento, 2019-2028 (millones de USD)
TABLA 828 EGIPTO Mercado de medicamentos antifúngicos inyectables liofilizados, por clase de medicamento, 2019-2028 (millones de USD)
TABLA 829 EGIPTO Mercado de medicamentos antivirales inyectables liofilizados, por clase de medicamento, 2019-2028 (millones de USD)
TABLA 830 EGIPTO Mercado de medicamentos antineoplásicos inyectables liofilizados, por clase de medicamento, 2019-2028 (millones de USD)
TABLA 831 EGIPTO Mercado de diuréticos en medicamentos inyectables liofilizados, por clase de medicamento, 2019-2028 (millones de USD)
TABLA 832 EGIPTO Mercado de inhibidores de la bomba de protones en medicamentos inyectables liofilizados, por clase de medicamento, 2019-2028 (millones de USD)
TABLA 833 EGIPTO Mercado de anestésicos en medicamentos inyectables liofilizados, por clase de medicamento, 2019-2028 (millones de USD)
TABLA 834 EGIPTO Mercado de anticoagulantes en medicamentos inyectables liofilizados, por clase de medicamento, 2019-2028 (millones de USD)
TABLA 835 EGIPTO: AINE en el mercado de medicamentos inyectables liofilizados, por clase de medicamento, 2019-2028 (millones de USD)
TABLA 836 EGIPTO Mercado de corticosteroides en medicamentos inyectables liofilizados, por clase de medicamento, 2019-2028 (millones de USD)
TABLA 837 EGIPTO Mercado de medicamentos inyectables liofilizados, por formato, 2019-2028 (millones de USD)
TABLA 838 EGIPTO Mercado de medicamentos inyectables liofilizados, por indicación, 2019-2028 (millones de USD)
TABLA 839 EGIPTO Mercado de medicamentos inyectables liofilizados, por vía de administración, 2019-2028 (millones de USD)
TABLA 840 EGIPTO Mercado de medicamentos inyectables liofilizados, por usuario final, 2019-2028 (millones de USD)
TABLA 841 EGIPTO Mercado de medicamentos inyectables liofilizados, por canal de distribución, 2019-2028 (millones de USD)
TABLA 842 Mercado de medicamentos inyectables liofilizados de Kuwait, por envase, 2019-2028 (millones de USD)
TABLA 843 Mercado de medicamentos inyectables liofilizados de Kuwait, por clase de medicamento, 2019-2028 (millones de USD)
TABLA 844 Mercado de medicamentos inyectables liofilizados de Kuwait, por clase de medicamento, 2019-2028 (unidades)
TABLA 845 Mercado de antiinfecciosos en medicamentos inyectables liofilizados de Kuwait, por clase de medicamento, 2019-2028 (millones de USD)
TABLA 846 Mercado de antibióticos inyectables liofilizados de Kuwait, por clase de fármaco, 2019-2028 (millones de USD)
TABLA 847 Mercado de medicamentos antimicóticos inyectables liofilizados de Kuwait, por clase de medicamento, 2019-2028 (millones de USD)
TABLA 848 Mercado de medicamentos antivirales inyectables liofilizados de Kuwait, por clase de medicamento, 2019-2028 (millones de USD)
TABLA 849 Mercado de medicamentos antineoplásicos inyectables liofilizados de Kuwait, por clase de medicamento, 2019-2028 (millones de USD)
TABLA 850 Mercado de diuréticos en KUWAIT en medicamentos inyectables liofilizados, por clase de medicamento, 2019-2028 (millones de USD)
TABLA 851 Mercado de inhibidores de la bomba de protones en medicamentos inyectables liofilizados de Kuwait, por clase de medicamento, 2019-2028 (millones de USD)
TABLA 852 Mercado de anestésicos inyectables liofilizados de Kuwait, por clase de fármaco, 2019-2028 (millones de USD)
TABLA 853 Mercado de anticoagulantes en medicamentos inyectables liofilizados de Kuwait, por clase de medicamento, 2019-2028 (millones de USD)
TABLA 854 AINE en el mercado de medicamentos inyectables liofilizados de Kuwait, por clase de medicamento, 2019-2028 (millones de USD)
TABLA 855 Mercado de corticosteroides en medicamentos inyectables liofilizados de Kuwait, por clase de medicamento, 2019-2028 (millones de USD)
TABLA 856 Mercado de medicamentos inyectables liofilizados de Kuwait, por formato, 2019-2028 (millones de USD)
TABLA 857 Mercado de medicamentos inyectables liofilizados de Kuwait, por indicación, 2019-2028 (millones de USD)
TABLA 858 Mercado de medicamentos inyectables liofilizados de Kuwait, por vía de administración, 2019-2028 (millones de USD)
TABLA 859 Mercado de medicamentos inyectables liofilizados de Kuwait, por usuario final, 2019-2028 (millones de USD)
TABLA 860 Mercado de medicamentos inyectables liofilizados de Kuwait, por canal de distribución, 2019-2028 (millones de USD)
TABLA 861 Mercado de medicamentos inyectables liofilizados de Israel, por envase, 2019-2028 (millones de USD)
TABLA 862 Mercado de medicamentos inyectables liofilizados de Israel, por clase de medicamento, 2019-2028 (millones de USD)
TABLA 863 Mercado de medicamentos inyectables liofilizados de Israel, por clase de medicamento, 2019-2028 (unidades)
TABLA 864 Mercado de antiinfecciosos en medicamentos inyectables liofilizados de Israel, por clase de medicamento, 2019-2028 (millones de USD)
TABLA 865 Mercado de antibióticos inyectables liofilizados en Israel, por clase de fármaco, 2019-2028 (millones de USD)
TABLA 866 Mercado de medicamentos antimicóticos inyectables liofilizados de Israel, por clase de medicamento, 2019-2028 (millones de USD)
TABLA 867 Mercado de medicamentos antivirales inyectables liofilizados de Israel, por clase de medicamento, 2019-2028 (millones de USD)
TABLA 868 Mercado de medicamentos antineoplásicos inyectables liofilizados de Israel, por clase de medicamento, 2019-2028 (millones de USD)
TABLA 869 Mercado de diuréticos en medicamentos inyectables liofilizados de Israel, por clase de medicamento, 2019-2028 (millones de USD)
TABLA 870 Mercado de inhibidores de la bomba de protones en medicamentos inyectables liofilizados de Israel, por clase de medicamento, 2019-2028 (millones de USD)
TABLA 871 Mercado de anestésicos inyectables liofilizados de Israel, por clase de fármaco, 2019-2028 (millones de USD)
TABLA 872 Mercado de anticoagulantes inyectables liofilizados de Israel, por clase de fármaco, 2019-2028 (millones de USD)
TABLA 873 ISRAEL: AINE en el mercado de medicamentos inyectables liofilizados, por clase de medicamento, 2019-2028 (millones de USD)
TABLA 874 Mercado de corticosteroides en medicamentos inyectables liofilizados de Israel, por clase de medicamento, 2019-2028 (millones de USD)
TABLA 875 Mercado de medicamentos inyectables liofilizados de Israel, por formato, 2019-2028 (millones de USD)
TABLA 876 Mercado de medicamentos inyectables liofilizados de Israel, por indicación, 2019-2028 (millones de USD)
TABLA 877 Mercado de medicamentos inyectables liofilizados de Israel, por vía de administración, 2019-2028 (millones de USD)
TABLA 878 Mercado de medicamentos inyectables liofilizados de Israel, por usuario final, 2019-2028 (millones de USD)
TABLA 879 Mercado de medicamentos inyectables liofilizados de Israel, por canal de distribución, 2019-2028 (millones de USD)
TABLA 880 RESTO DE ORIENTE MEDIO Y ÁFRICA Mercado de medicamentos inyectables liofilizados, por envase, 2019-2028 (millones de USD)
Lista de figuras
FIGURA 1 MERCADO MUNDIAL DE MEDICAMENTOS INYECTABLES LIOFILIZADOS: SEGMENTACIÓN
FIGURA 2 MERCADO MUNDIAL DE MEDICAMENTOS INYECTABLES LIOFILIZADOS: TRIANGULACIÓN DE DATOS
FIGURA 3 Mercado mundial de medicamentos inyectables liofilizados: ANÁLISIS DROC
FIGURA 4 Mercado mundial de medicamentos inyectables liofilizados: ANÁLISIS DEL MERCADO GLOBAL VS. REGIONAL
FIGURA 5 Mercado mundial de medicamentos inyectables liofilizados: ANÁLISIS DE INVESTIGACIÓN DE LA EMPRESA
FIGURA 6 Mercado mundial de medicamentos inyectables liofilizados: MODELADO MULTIVARIADO
FIGURA 7 Mercado mundial de medicamentos inyectables liofilizados: DATOS DEMOGRÁFICOS DE LAS ENTREVISTAS
FIGURA 8 MERCADO MUNDIAL DE FÁRMACOS INYECTABLES LIOFILIZADOS: CUADRÍCULA DE POSICIÓN DE MERCADO DE DBMR
FIGURA 9 MERCADO MUNDIAL DE MEDICAMENTOS INYECTABLES LIOFILIZADOS: ANÁLISIS DE LA PARTICIPACIÓN DE LOS PROVEEDORES
FIGURA 10 Mercado mundial de medicamentos inyectables liofilizados: CUADRÍCULA DE COBERTURA del usuario final del MERCADO
FIGURA 11 Mercado mundial de medicamentos inyectables liofilizados: SEGMENTACIÓN
FIGURA 12 Se espera que AMÉRICA DEL NORTE DOMINE EL MERCADO MUNDIAL de medicamentos inyectables liofilizados Y SE ESPERA QUE ASIA-PACÍFICO CREZCA CON LA CAGR MÁS ALTA EN EL PERÍODO PRONOSTICADO DE 2021 A 2028
FIGURA 13 Se espera que el aumento de las enfermedades crónicas impulse el mercado mundial de medicamentos inyectables liofilizados EN EL PERÍODO DE PRONÓSTICO DE 2021 A 2028
FIGURA 14 Se espera que el segmento de viales represente la mayor parte del mercado mundial de medicamentos inyectables liofilizados en 2021 y 2028.
FIGURE 15 ASIA-PACIFIC is the fastest growing market FOR the Lyophilized injectable drugs MANUFACTURERS IN THE FORECAST PERIOD OF 2021 TO 2028
FIGURE 16 DRIVERS, RESTRAINTS, OPPORTUNITIES, AND CHALLENGES OF Global LYOPHILIZED INJECTABLE DRUGS Market
FIGURE 17 Global lyophilized injectable drugs market: By packaging, 2020
FIGURE 18 Global lyophilized injectable drugs market: By packaging, 2021-2028 (USD Million)
FIGURE 19 Global lyophilized injectable drugs market: By packaging, CAGR (2021-2028)
FIGURE 20 Global lyophilized injectable drugs market: By packaging, LIFELINE CURVE
FIGURE 21 global lyophilized injectable drugs market: By drug class, 2020
FIGURE 22 global lyophilized injectable drugs market: By drug class, 2021-2028 (USD Million)
FIGURE 23 global lyophilized injectable drugs market: By drug class, CAGR (2021-2028)
FIGURE 24 global lyophilized injectable drugs market: By drug class, LIFELINE CURVE
FIGURE 25 global lyophilized injectable drugs market: By form, 2020
FIGURE 26 global lyophilized injectable drugs market: By form, 2021-2028 (USD Million)
FIGURE 27 global lyophilized injectable drugs market: By form, CAGR (2021-2028)
FIGURE 28 global lyophilized injectable drugs market: By form, LIFELINE CURVE
FIGURE 29 Global lyophilized injectable drugs market: By indication, 2020
FIGURE 30 Global lyophilized injectable drugs market: By indication, 2021-2028 (USD Million)
FIGURE 31 Global lyophilized injectable drugs market: By indication, CAGR (2021-2028)
FIGURE 32 Global lyophilized injectable drugs market: By indication, LIFELINE CURVE
FIGURE 33 Global lyophilized injectable drugs market: By Route of administration, 2020
FIGURE 34 Global lyophilized injectable drugs market: By Route of administration, 2021-2028 (USD Million)
FIGURE 35 Global lyophilized injectable drugs market: By Route of administration, CAGR (2021-2028)
FIGURE 36 Global lyophilized injectable drugs market: By Route of administration, LIFELINE CURVE
FIGURE 37 Global lyophilized injectable drugs market: By end user, 2020
FIGURE 38 Global lyophilized injectable drugs market: By end user, 2021-2028 (USD Million)
FIGURE 39 Global lyophilized injectable drugs market: By end user, CAGR (2021-2028)
FIGURE 40 Global lyophilized injectable drugs market: By end user, LIFELINE CURVE
FIGURE 41 global lyophilized injectable drugs market: By distribution channel, 2020
FIGURE 42 global lyophilized injectable drugs market: By distribution channel, 2021-2028 (USD Million)
FIGURE 43 global lyophilized injectable drugs market: By distribution channel, CAGR (2021-2028)
FIGURE 44 global lyophilized injectable drugs market: By distribution channel, LIFELINE CURVE
FIGURE 45 global lyophilized injectable drugs MARKET: SNAPSHOT (2020)
FIGURE 46 global lyophilized injectable drugs MARKET: BY REGION (2020)
FIGURE 47 global lyophilized injectable drugs MARKET: BY REGION (2021 & 2028)
FIGURE 48 global lyophilized injectable drugs MARKET: BY REGION (2020 & 2028)
FIGURE 49 global lyophilized injectable drugs MARKET: BY Packaging (2021-2028)
FIGURE 50 North America lyophilized injectable drugs MARKET: SNAPSHOT (2020)
FIGURE 51 North America lyophilized injectable drugs MARKET: BY COUNTRY (2020)
FIGURE 52 North America lyophilized injectable drugs MARKET: BY COUNTRY (2021 & 2028)
FIGURE 53 North America lyophilized injectable drugs MARKET: BY COUNTRY (2020 & 2028)
FIGURE 54 North America lyophilized injectable drugs MARKET: BY packaging (2021-2028)
FIGURE 55 EUROPE LYOPHILIZED INJECTABLE DRUGS MARKET: SNAPSHOT (2020)
FIGURE 56 EUROPE LYOPHILIZED INJECTABLE DRUGS MARKET: BY COUNTRY (2020)
FIGURE 57 EUROPE LYOPHILIZED INJECTABLE DRUGS MARKET: BY COUNTRY (2021 & 2028)
FIGURE 58 EUROPE LYOPHILIZED INJECTABLE DRUGS MARKET: BY COUNTRY (2020 & 2028)
FIGURE 59 EUROPE LYOPHILIZED INJECTABLE DRUGS MARKET: BY TYPE (2021-2028)
FIGURE 60 Asia-Pacific lyophilized injectable drugs MARKET: SNAPSHOT (2020)
FIGURE 61 Asia-Pacific lyophilized injectable drugs MARKET: BY COUNTRY (2020)
FIGURE 62 Asia-Pacific lyophilized injectable drugs MARKET: BY COUNTRY (2021 & 2028)
FIGURE 63 Asia-Pacific lyophilized injectable drugs MARKET: BY COUNTRY (2020 & 2028)
FIGURE 64 Asia-Pacific lyophilized injectable drugs MARKET: BY packaging (2021-2028)
FIGURE 65 South America lyophilized injectable drugs MARKET: SNAPSHOT (2020)
FIGURE 66 South America lyophilized injectable drugs MARKET: BY COUNTRY (2020)
FIGURE 67 South America lyophilized injectable drugs MARKET: BY COUNTRY (2021 & 2028)
FIGURE 68 South America lyophilized injectable drugs MARKET: BY COUNTRY (2020 & 2028)
FIGURE 69 South America lyophilized injectable drugs MARKET: BY packaging (2021-2028)
FIGURE 70 MIDDLE EAST & AFRICA Lyophilized injectable drugs market: SNAPSHOT (2020)
FIGURE 71 MIDDLE EAST & AFRICA Lyophilized injectable drugs market: BY COUNTRY (2020)
FIGURE 72 MIDDLE EAST & AFRICA Lyophilized injectable drugs market: BY COUNTRY (2021 & 2028)
FIGURE 73 MIDDLE EAST & AFRICA Lyophilized injectable drugs market: BY COUNTRY (2020 & 2028)
FIGURE 74 MIDDLE EAST & AFRICA Lyophilized injectable drugs market: BY Packaging (2021-2028)
FIGURE 75 Global Lyophilized Injectable Drugs Market: company share 2020 (%)
FIGURE 76 North America Lyophilized Injectable Drugs Market: company share 2020 (%)
FIGURE 77 Europe Lyophilized Injectable Drugs Market: company share 2020 (%)
FIGURE 78 Asia-Pacific Lyophilized Injectable Drugs Market: company share 2020 (%)
Metodología de investigación
La recopilación de datos y el análisis del año base se realizan utilizando módulos de recopilación de datos con muestras de gran tamaño. La etapa incluye la obtención de información de mercado o datos relacionados a través de varias fuentes y estrategias. Incluye el examen y la planificación de todos los datos adquiridos del pasado con antelación. Asimismo, abarca el examen de las inconsistencias de información observadas en diferentes fuentes de información. Los datos de mercado se analizan y estiman utilizando modelos estadísticos y coherentes de mercado. Además, el análisis de la participación de mercado y el análisis de tendencias clave son los principales factores de éxito en el informe de mercado. Para obtener más información, solicite una llamada de un analista o envíe su consulta.
La metodología de investigación clave utilizada por el equipo de investigación de DBMR es la triangulación de datos, que implica la extracción de datos, el análisis del impacto de las variables de datos en el mercado y la validación primaria (experto en la industria). Los modelos de datos incluyen cuadrícula de posicionamiento de proveedores, análisis de línea de tiempo de mercado, descripción general y guía del mercado, cuadrícula de posicionamiento de la empresa, análisis de patentes, análisis de precios, análisis de participación de mercado de la empresa, estándares de medición, análisis global versus regional y de participación de proveedores. Para obtener más información sobre la metodología de investigación, envíe una consulta para hablar con nuestros expertos de la industria.
Personalización disponible
Data Bridge Market Research es líder en investigación formativa avanzada. Nos enorgullecemos de brindar servicios a nuestros clientes existentes y nuevos con datos y análisis que coinciden y se adaptan a sus objetivos. El informe se puede personalizar para incluir análisis de tendencias de precios de marcas objetivo, comprensión del mercado de países adicionales (solicite la lista de países), datos de resultados de ensayos clínicos, revisión de literatura, análisis de mercado renovado y base de productos. El análisis de mercado de competidores objetivo se puede analizar desde análisis basados en tecnología hasta estrategias de cartera de mercado. Podemos agregar tantos competidores sobre los que necesite datos en el formato y estilo de datos que esté buscando. Nuestro equipo de analistas también puede proporcionarle datos en archivos de Excel sin procesar, tablas dinámicas (libro de datos) o puede ayudarlo a crear presentaciones a partir de los conjuntos de datos disponibles en el informe.

