Global Ocular Pain Market
Tamaño del mercado en miles de millones de dólares
Tasa de crecimiento anual compuesta (CAGR) :
% 
 USD
1.20 Billion
USD
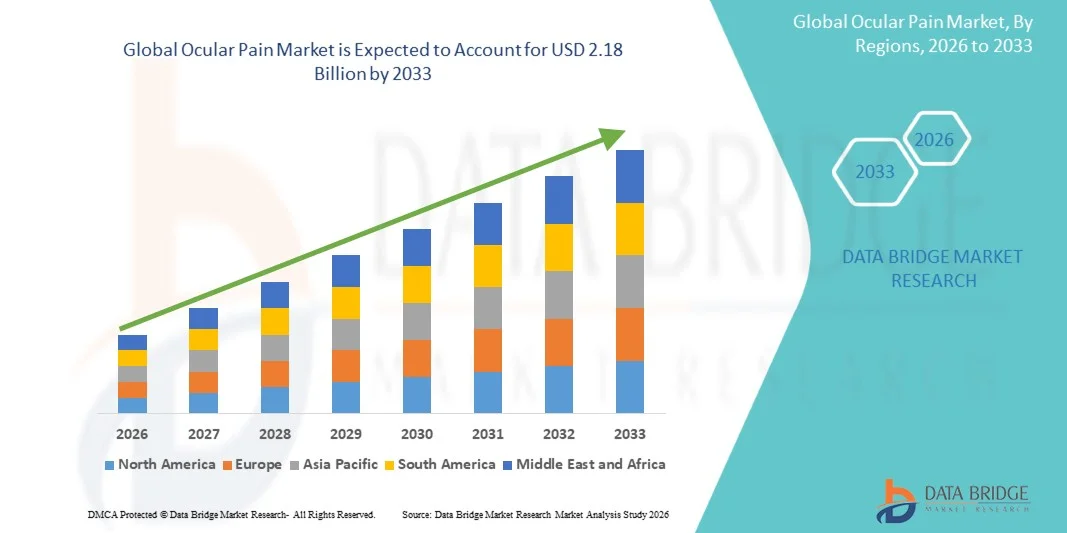
2.18 Billion
2025
2033
USD
1.20 Billion
USD
2.18 Billion
2025
2033
| 2026 –2033 | |
| USD 1.20 Billion | |
| USD 2.18 Billion | |
| % | |
|
Reforzamiento del Mercado Ocular Global, por Tipo de Enfermedad (Industria Ocular con Enfermedades Oculares y Dolor Ocular sin Enfermedades Oculares Primarias), Tipo (Diagnóstico y Tratamiento), Aplicación (Conjuntivitis, Abrasión Corneal, Blefaritis, Sty, Iritis, Sinusitis, Migrañas, Glaucoma y Otros), Dirección de Administración
Ocular Pain MarketSinopsis
El mercado del dolor Ocular fue valorado enUSD 1.20 billion in 2025y se prevé que alcanceUSD 2,18 mil millones en 2033, creciendo en unCAGR of 7.80% from 2026 to 2033. El Mercado del Dolor Ocular está experimentando un crecimiento constante impulsado por la creciente prevalencia de trastornos superficiales oculares, aumentando los casos de enfermedad ocular seca, infecciones, glaucoma y complicaciones oculares post-quirúrgicas, todo lo cual contribuye significativamente al dolor ocular y la incomodidad. La creciente exposición de tiempo de pantalla debido al uso de dispositivos digitales, el envejecimiento de las poblaciones y el aumento de la contaminación ambiental están intensificando aún más la incidencia de irritación ocular y dolor crónico de ojos a nivel mundial.
El mercado también está presenciando una fuerte expansión debido a los avances en diagnósticos oftálmicos y la disponibilidad de terapias de manejo del dolor más eficaces, incluyendo gotas de ojos lubricantes, medicamentos antiinflamatorios, agentes anestésicos y formulaciones oftálmicas combinadas. Aumentar la conciencia sobre el diagnóstico precoz y el tratamiento de los trastornos oculares es alentar a los pacientes a buscar una intervención médica oportuna, apoyando así el crecimiento del mercado.
Principales tendencias del mercado "
- América del Norte dominaba el mercado del dolor Ocular con la mayor proporción de ingresos del 33% en 2025, con el apoyo de infraestructuras avanzadas de atención oftalmológica, alta prevalencia de trastornos superficiales oculares, fuerte adopción de terapias oculares basadas en recetas, y redes hospitalarias y clínicas especializadas bien establecidas.
- El segmento tópico dominaba el mercado con 78,3% de participación en 2025, debido al uso generalizado de gotas oculares como terapia de primera línea para el manejo del dolor ocular.
- Asia-Pacífico es la región de más rápido crecimiento en el mercado del dolor ocular, proyectada para expandirse en una CAGR del 7,5% entre 2026 y 2033, alimentada por una creciente prevalencia de trastornos oculares, un aumento del gasto sanitario, una rápida expansión de la infraestructura de oftalmología y una creciente conciencia de la salud ocular en países como China, India, Japón y Corea del Sur.
- El segmento de dolor Ocular con Enfermedades Oculares llevó al mercado con 58% de participación en 2025, impulsado por alta incidencia de condiciones como conjuntivitis, abrasiones corneales, blefaritis y malestar ocular asociado a glaucoma.
- El segmento de hospitales dominaba la categoría de Usuario final con casi 38% de participación en 2025, debido a la fuerte entrada de pacientes para condiciones oculares agudas, atención quirúrgica y tratamientos oftálmicos de emergencia.
Tamaño del mercado
- Valor mundial del mercado (2025): 1.20 millones de dólares
- Valor de mercado esperado (2033): USD 2.18 millones
- CAGR prefabricado (2026–2033): 7,80%
- Región líder en 2025: América del Norte
- Región de crecimiento más rápida: Asia-Pacífico
Report Scope and Ocular Pain MarketSegmentation
|
Atributos |
Clave de Dolor OcularMarket Insights |
|
Segmentos cubiertos |
|
|
Países cubiertos |
América del Norte · Estados Unidos. · Canadá · México Europa · Alemania · Francia · U.K. · Países Bajos Suiza · Bélgica · Rusia · Italia · España · Turquía · El resto de Europa Asia y el Pacífico China · Japón · India · Corea del Sur · Singapur Malasia · Australia · Tailandia · Indonesia · Filipinas · El resto de Asia-Pacífico Oriente Medio y África Arabia Saudita · EAU. · Sudáfrica Egipto Israel · El resto del Oriente Medio y África América del Sur Brasil · Argentina · El resto de Sudamérica |
|
Principales jugadores del mercado |
• Bausch + Lomb (Estados Unidos) |
|
Oportunidades de mercado |
· Ampliación de las terapias de nómina no opioides y de dolor blanco · Crecimiento en sistemas avanzados de entrega de drogas y tecnologías de liberación sostenible · Demanda creciente de atención de ojos digitales y soluciones de oftalmología integrada |
|
Valor añadido Data Infosets |
Además de las ideas sobre escenarios de mercado, como el valor de mercado, la tasa de crecimiento, la segmentación, la cobertura geográfica y los principales actores, los informes de mercado comisariados por el Data Bridge Market Research también incluyen análisis profundos de expertos, producción y capacidad geográficamente representados por empresas, diseños de redes de distribuidores y socios, análisis detallados y actualizados de tendencias de precios y análisis del déficit de la cadena de suministro y la demanda. |
Tendencias del mercado del dolor ocular
Tendencia: Carga creciente de trastornos superficiales oculares " Estreno de ojos digitales
El Mercado del Dolor Ocular es testigo de un fuerte crecimiento debido a la creciente prevalencia deenfermedad ocular seca, conjuntivitis, blefaritis y abrasiones corneales, que son las causas más comunes de la incomodidad ocular. Según elInforme TFOS DEWS II (2021 actualización de consenso clínico), la enfermedad del ojo seco afecta5% a 50% de la población mundial según criterios de geografía y diagnóstico, lo que lo convierte en un importante contribuyente al dolor ocular crónico. Aumentar la exposición a la pantalla y el uso de dispositivos digitales han aumentado significativamentecepa del ojo digital (síndrome de visión de ordenador), en particular entre adultos y profesionales del trabajo. Estudios oftalmológicos indican quemás del 60% de los usuarios de pantalla reportan síntomas como irritación ocular, sensación de quema y dolor, alimentando directamente la demanda de gotas de ojos lubricantes y terapias antiinflamatorias.
Dinámica del mercado del dolor ocular
Conductor del mercado clave: Aumento de la prevalencia de enfermedades oculares y el envejecimiento de la población
El aumento global de los trastornos oculares relacionados con la edad, como glaucoma, catarata y síndrome del ojo seco, es un factor importante de la demanda del tratamiento del dolor ocular. La OMS estima que más de 2.200 millones de personas sufren a nivel mundial de deterioro de la visión o ceguera, con una parte significativa vinculada a condiciones oculares prevenibles o tratables. Las poblaciones envejecidas en regiones como Norteamérica, Europa y Japón aumentan aún más la carga de la incomodidad crónica ocular que requiere terapia a largo plazo. Además, aumentar la prevalencia de conjuntivitis alérgica y enfermedades infecciosas del ojo está expandiendo el uso de gotas tópicas antiinflamatorias y antihistamínicas.
Restricción clave / desafío: efectos secundarios y opciones limitadas de tratamiento a largo plazo
Una restricción significativa en el mercado del dolor ocular es las limitaciones de seguridad a largo plazo asociadas con las clases terapéuticas de uso común, en particular los corticosteroides y ciertos agentes antiinflamatorios tópicos. El uso prolongado de gotas de los ojos corticosteroides se ha asociado clínicamente con la presión intraocular elevada, el riesgo de glaucoma secundaria y la formación de cataratas, restringiendo su uso en la gestión crónica del dolor ocular y requiriendo un control oftalmológico cuidadoso. Además, el uso generalizado de formulaciones oftálmicas conservadas, especialmente las que contienen cloruro de benzalkonium (BAK), contribuye a la toxicidad superficial ocular, la inestabilidad de las películas lacrimógenos y los daños epiteliales, especialmente en pacientes con enfermedad crónica de los ojos secos. Esto ha provocado una reducción de la adherencia al tratamiento y un aumento de las tasas de deserción. Los estudios clínicos en la gestión de las enfermedades oculares secas indican que el 30-40% de los pacientes suspenden la terapia tópica en un plazo de 6 meses, principalmente debido a la irritación, el alivio sintomático limitado y las preocupaciones de tolerancia a largo plazo. Este desafío de adhesión sigue limitando la expansión sostenida del mercado a pesar de la creciente prevalencia de enfermedades a nivel mundial.
Oportunidad del Mercado Clave: Crecimiento de Terapias Oftálmicas Libres y Regenerativas
El mercado del dolor Ocular es testigo de fuertes oportunidades de crecimiento impulsadas por elcambio hacia formulaciones sin conservantes, biológicas orientadas y terapias oftálmicas regenerativasdiseñado para mejorar la seguridad, la tolerancia y los resultados a largo plazo. Por ejemplo,CiclASol de Novaliq (ciclosporina Una solución oftálmica)representa una terapia sin conservantes de próxima generación para la enfermedad del ojo seco, ofreciendo una mejor compatibilidad de la superficie ocular en comparación con las formulaciones convencionales basadas en la emulsión. Análogamente,Restasis de AbbVie (emulsión oftalmológica de ciclosporina)continúa demostrando una fuerte adopción mundial, reforzando la demanda de tratamientos inmunomoduladores en la inflamación crónica de la superficie ocular. En paralelo, empresas comoRegenxbio están avanzando plataformas de terapia génica orientadas a la regeneración superficial ocular y trastornos inflamatorios de los ojos, mientras que investigación en cursocélulas madre – reparación corneal basada y tratamientos oftalmológicos neuro-regenerativosestá abriendo nuevas vías para las condiciones refractarias del dolor ocular. Además, la ampliación posterior a 2021servicios de tele-oftalmología y canales de distribución en línea de farmaciaha mejorado considerablemente la accesibilidad al tratamiento, especialmente en los mercados emergentes. Aumento de la adopción de plataformas de consulta digital en regiones comoAsia y el Pacífico y América Latinaestá ayudando a superar la brecha en la prestación de cuidados oftalmológicos, apoyando el diagnóstico anterior y una mayor penetración de terapias de dolor en los ojos recetados.
Alcance del mercado del dolor ocular
El mercado del dolor ocular se segmenta sobre la base del tipo de enfermedad, tipo, aplicación, ruta de administración, tipo de fármaco, tipo de población, usuario final y canal de distribución.
- Por tipo de enfermedad
Sobre la base del tipo de enfermedad, el mercado del dolor ocular se segmenta en dolor ocular con enfermedades oculares y dolor ocular sin enfermedades oculares primarias. El segmento de dolor ocular con enfermedades oculares dominaba el mercado con 62,4% de participación en 2025, debido a la alta prevalencia mundial de condiciones oftalmológicas subyacentes como conjuntivitis, glaucoma, keratitis, enfermedad ocular seca y abrasiones corneales. Aumentar la incidencia de complicaciones oculares relacionadas con la diabetes y trastornos oculares relacionados con la edad está impulsando significativamente la demanda. El creciente número de consultas de oftalmología en hospitales y clínicas especializadas está apoyando el dominio del segmento. La adopción fuerte de terapias antiinflamatorias, antibióticas y lubricantes del ojo está aumentando aún más la cuota de mercado. La creciente población geriátrica en todo el mundo es un importante contribuyente. El aumento de los procedimientos oftálmicos quirúrgicos está generando casos de dolor postoperatorio que requieren tratamiento. La ampliación del acceso a la atención oftalmológica en las economías emergentes está fortaleciendo el crecimiento. La conciencia acerca del diagnóstico temprano de las enfermedades oculares está aumentando a nivel mundial. La innovación farmacéutica continua en terapéutica ocular está apoyando la expansión.
Se espera que el dolor ocular sin enfermedades oculares primarias registre la CAGR más rápida de 8,9% de 2026 a 2033, impulsada por casos crecientes de dolor ocular asociado a la migraña, malestar ocular relacionado con la sinusitis, cepa ocular digital e irritación ambiental. Aumentar la exposición de pantalla de teléfonos inteligentes, computadoras y dispositivos digitales es un factor clave. La contaminación urbana y los alérgenos están contribuyendo significativamente al dolor ocular no disuaso. Aumentar la conciencia de las causas funcionales y neurológicas del dolor ocular está mejorando las tasas de diagnóstico. Ampliar la disponibilidad de productos OTC es apoyar las tendencias de automedicación. La adopción teleoftalmológica está mejorando el acceso a la atención en las regiones rurales y semiurbanas. Aumentar los niveles de estrés y los trastornos del estilo de vida están aumentando la incidencia. El crecimiento de la población en edad de trabajar está acelerando aún más la demanda. Las herramientas de control de síntomas basadas en la IA están mejorando la detección temprana.
- Por tipo
Sobre la base del tipo, el mercado se segmenta en el diagnóstico y tratamiento. El segmento de tratamiento dominaba el mercado con 71,8% de participación en 2025, impulsado por el uso generalizado de gotas de ojos analgésicos, NSAIDs, corticosteroides, antihistamínicos y formulaciones lubricantes para el manejo de síntomas del dolor ocular. La alta prevalencia de enfermedades oculares crónicas que requieren tratamiento a largo plazo apoya la dominación. Los sólidos patrones de prescripción en hospitales y clínicas especializadas refuerzan aún más la demanda. La disponibilidad de medicamentos oftálmicos de marca y genéricos mejora la accesibilidad. Aumentar los casos de inflamación postquirúrgica están contribuyendo al uso. Los médicos siguen prefiriendo los primeros enfoques para la gestión del dolor ocular. Los oleoductos farmacéuticos fuertes están introduciendo formulaciones avanzadas. Aumentar los volúmenes de tratamiento ambulatorio apoya la expansión del mercado. La cobertura de seguros para medicamentos oftálmicos fortalece la adopción.
Se espera que el segmento de diagnóstico crezca en la CAGR más rápida de 9,4% de 2026 a 2033, impulsada por la adopción creciente de herramientas avanzadas de diagnóstico oftalmológico, como la imagen de la lámpara de ranuras, tomografía de coherencia óptica (OCT), y sistemas de detección de ojos basados en IA. Sensibilizar la detección temprana de enfermedades es impulsar la toma de diagnóstico. Ampliar los programas de detección de ojos de rutina aumenta el flujo de pacientes. El crecimiento de las plataformas teleoftalmológicas está mejorando la accesibilidad. El aumento de la población geriátrica está impulsando la demanda de detección preventiva. La integración de herramientas de diagnóstico basadas en la IA está mejorando la precisión. El aumento de la infraestructura sanitaria en las economías emergentes apoya el crecimiento. La detección temprana de glaucoma y enfermedades corneales está expandiendo los volúmenes de pruebas. Las plataformas de salud digital permiten un diagnóstico más rápido.
- By Application
Sobre la base de la aplicación, el mercado incluye conjuntivitis, abrasión corneal, blefaritis, estilitis, iritis, sinusitis, migrañas, glaucoma y otros. El segmento conjuntivitis dominaba el mercado con un 24,6% de participación en 2025, debido a su alta incidencia global y a la recurrencia frecuente causada por infecciones bacterianas, virales y alérgicas. Los brotes estacionales y las malas prácticas de higiene en las regiones en desarrollo contribuyen significativamente a los casos. La alta prevalencia pediátrica y adulta apoya el dominio. La fuerte disponibilidad de OTC de gotas de ojos antibióticos y antihistamínicos aumenta las tasas de tratamiento. El aumento de la contaminación ambiental y la exposición al alérgeno son factores importantes. Hospitales y farmacias minoristas reportan altos volúmenes de pacientes. Las campañas de sensibilización pública están mejorando las tasas de diagnóstico. La disponibilidad fácil de medicamentos tópicos fortalece la adopción. El aumento del uso de lentes de contacto también contribuye.
Se espera que el segmento de dolor ocular asociado a la migraña crezca en el CAGR más rápido del 10,2% entre 2026 y 2033, impulsado por el aumento de los trastornos neurológicos y las condiciones de estrés relacionadas con el estilo de vida. La exposición a pantalla digital es un factor importante. Los casos crecientes de fotofobia y dolor relacionado con el aura visual están aumentando la demanda. Aumentar la conciencia de los trastornos neurooftálmicos está mejorando el diagnóstico. Ampliar el uso de trítanes y terapias combinadas es compatible con la adopción del tratamiento. Las plataformas de teleneurología y telemedicina están aumentando la accesibilidad. El estrés urbano y los trastornos del sueño son desencadenantes importantes. El aumento de la prevalencia de la población femenina contribuye al crecimiento. El aumento de las visitas de neurología ambulatoria están contribuyendo a la demanda.
- Por Ruta de Administración
Sobre la base de la vía de administración, el mercado se segmenta en tópico, periocular, intraocular y oral. El segmento tópico dominaba el mercado con 78,3% de participación en 2025, debido al uso generalizado de gotas oculares como terapia de primera línea para el manejo del dolor ocular. Alto cumplimiento del paciente y facilidad de apoyo administrativo dominan. Una fuerte disponibilidad de lubricantes, NSAIDs y gotas antibióticas impulsa la adopción. El alivio rápido de los síntomas hace que la terapia tópica prefiera mundialmente. Los hospitales y farmacias dependen en gran medida de las formulaciones tópicas. Aumentar los ojos secos y los casos conjuntivitis soportan el uso. La disponibilidad de OTC mejora la accesibilidad. Efectos secundarios sistémicos inferiores favorecen la adopción. Las empresas farmacéuticas se centran en la innovación tópica de drogas.
Se espera que el segmento intraocular crezca en la CAGR más rápida de 9,1% de 2026 a 2033, impulsada por el aumento del uso en enfermedades oculares severas y la gestión del dolor post-quirúrgica. Los avances en los implantes de liberación sostenida están apoyando el crecimiento. Los tratamientos de glaucoma creciente y enfermedad retina están aumentando la demanda. Ampliar los procedimientos quirúrgicos oftalmológicos a nivel mundial es impulsar el uso. Las tecnologías mejoradas para la producción de drogas están mejorando la eficacia. Los procedimientos hospitalarios están aumentando las tasas de adopción. Se está expandiendo la investigación clínica en terapéutica ocular. El envejecimiento de la población aumenta las necesidades quirúrgicas. Los sistemas de suministro de drogas centrados en la precisión están mejorando los resultados.
- Por tipo de drogas
Sobre la base del tipo de droga, el mercado se segmenta en prescripción y venta libre (OTC). El segmento de prescripción dominaba el mercado con 66,9% de participación en 2025, debido a la fuerte dependencia de medicamentos prescritos por oftalmólogos para el dolor ocular moderado a severo. El uso amplio de antibióticos, corticosteroides y medicamentos antiinflamatorios soporta la dominación. Las recetas de hospitales y clínicas especiales impulsan la demanda. Los sistemas de reembolso de seguros favorecen los medicamentos recetados. Los protocolos clínicos fuertes refuerzan el uso. Aumentar la carga de la enfermedad ocular crónica es compatible con el uso de medicamentos a largo plazo. La innovación farmacéutica está expandiendo los oleoductos recetados. La preferencia física por la terapia controlada mejora la adopción. La atención postoperatoria contribuye significativamente a la demanda.
Se espera que el segmento OTC crezca en la CAGR más rápida de 9,7% de 2026 a 2033, impulsada por el aumento de las tendencias de automedicación y el aumento de la disponibilidad de gotas de ojos lubricantes y calmantes. Ampliar las redes minoristas y farmacias en línea están mejorando el acceso. Aumentar la conciencia de la gestión de la irritación ocular leve apoya la adopción. Aumentar la tensión ocular relacionada con la pantalla es un conductor importante. Las plataformas de farmacia digital están acelerando las ventas. La preferencia del consumidor por conveniencia y alivio rápido apoya el crecimiento. Se están ampliando las aprobaciones reglamentarias para medicamentos oftálmicos OTC. La penetración en el comercio electrónico está mejorando la disponibilidad a nivel mundial. El acceso rural a los productos oculares está aumentando.
- Por tipo de población
Sobre la base del tipo de población, el mercado se segmenta en adultos y geriátricos. El segmento adulto dominaba el mercado con 58,7% de participación en 2025, impulsado por una alta exposición a dispositivos digitales, cepa ocular ocupacional y contaminación ambiental. Aumentar la prevalencia de conjuntivitis y dolor de ojos relacionados con la migraña apoya la demanda. El estrés del estilo de vida urbano es un importante contribuyente. Las altas tasas de tratamiento ambulatorio refuerzan el dominio. Una fuerte conciencia de la salud ocular está aumentando las consultas. El uso de medicamentos OTC es generalizado entre adultos. La adopción preventiva del cuidado de los ojos está aumentando a nivel mundial. La fatiga ocular relacionada con el lugar de trabajo está aumentando los casos.
Se espera que el segmento geriátrico crezca en el CAGR más rápido del 9,2% de 2026 a 2033, impulsado por trastornos oculares relacionados con la edad como glaucoma, cataratas y síndrome de ojo seco. Aumentar la población envejecida mundial es un factor clave. Una mayor susceptibilidad al dolor crónico del ojo apoya la demanda. Ampliar la infraestructura de atención de la salud oftalmológica para los ancianos aumenta el crecimiento. El aumento de los procedimientos quirúrgicos en adultos mayores contribuye significativamente. El mejor acceso a la atención médica en las regiones en desarrollo apoya la adopción. Aumentar las comorbilidades crónicas de enfermedades aumenta aún más la demanda.
- Por Usuario final
Sobre la base del usuario final, el mercado se segmenta en hospitales, clínicas especializadas, entornos de salud en el hogar, centros de oftalmología, centros quirúrgicos ambulatorios y otros. El segmento de hospitales dominaba el mercado con 42,8% de participación en 2025, debido a la infraestructura de diagnóstico avanzada y la disponibilidad de oftalmólogos especializados. La alta entrada de pacientes para condiciones agudas y crónicas oculares soporta la dominación. Una fuerte demanda de servicios de atención ocular de emergencia. Aumentar los procedimientos quirúrgicos aumenta el uso hospitalario. Los sistemas de reembolso de seguros favorecen la atención hospitalaria. Las vías de tratamiento integradas refuerzan la adopción. El apoyo sanitario gubernamental aumenta la capacidad. Las necesidades de atención postoperatoria aumentan la dependencia hospitalaria.
Se espera que el segmento de salud en el hogar crezca en la CAGR más rápida del 10,5% entre 2026 y 2033, impulsada por la adopción creciente de soluciones de teleoftalmología y control remoto. El aumento de la preferencia por el tratamiento en casa soporta la demanda. La creciente población geriátrica es un factor clave. La expansión de las plataformas de salud digital está impulsando la accesibilidad. El uso de medicamentos OTC es compatible con la atención en casa. Continúa el cambio pospandémico hacia la atención remota. Las aplicaciones de cuidado ocular basadas en la inteligencia artificial están mejorando el monitoreo. La penetración de Smartphone está acelerando la adopción.
- Por canal de distribución
Sobre la base del canal de distribución, el mercado se segmenta en licitación directa, farmacia hospitalaria, farmacia minorista y farmacia en línea. El segmento de farmacia hospitalaria dominó el mercado con 46,1% de participación en 2025, debido a los altos volúmenes de prescripción y los sistemas regulados de dispensación de drogas. Las fuertes redes de compras hospitalarias apoyan el dominio. La prescripción dirigida por el médico garantiza el cumplimiento. La atención de emergencia y post-quirúrgica impulsa el uso. La distribución vinculada al seguro fortalece el papel de la farmacia hospitalaria. Los sistemas de adquisiciones a granel apoyan la estabilidad. La supervisión reglamentaria estricta garantiza la dispensación controlada.
Se espera que el segmento de farmacia en línea crezca en el CAGR más rápido de 11,3% de 2026 a 2033, impulsado por el aumento de la adopción de la salud digital y la integración de la telemedicina. Aumentar la demanda de comodidad y privacidad apoya el crecimiento. La penetración de Smartphone está ampliando el acceso. E-prescriptions están impulsando las ventas en línea. La accesibilidad de la salud rural está mejorando significativamente. Los modelos de entrega basados en la suscripción están ganando tracción. Las startups de farmacia digital se están expandiendo rápidamente. Los sistemas de prescripción habilitados para la IA mejoran la eficiencia.
Análisis regional del mercado del dolor ocular
América del Norte dominaba el mercado del dolor ocular y representaba la mayor proporción de ingresos del 33% en 2025, apoyada por una infraestructura de atención oftalmológica altamente avanzada, una fuerte presencia de las principales empresas farmacéuticas, y una alta prevalencia de trastornos superficiales oculares como la enfermedad del ojo seco, la conjuntivitis, la blefaritis y el dolor relacionado con el glaucoma. La región se beneficia de la adopción generalizada de terapias oculares basadas en recetas, incluyendo gotas de ojo NSAID, corticosteroides y agentes inmunomoduladores. Además, la presencia de redes hospitalarias bien establecidas, clínicas especializadas de oftalmología y centros quirúrgicos ambulatorios soporta altas tasas de diagnóstico y tratamiento. La fuerte supervisión regulatoria de la FDA estadounidense, junto con las continuas aprobaciones de productos e innovación en formulaciones sin conservantes, refuerza aún más el crecimiento del mercado. El aumento de la exposición a la pantalla, el envejecimiento de la población y el aumento de los casos de tensión visual digital siguen impulsando la demanda sostenida de terapias de manejo del dolor ocular.
U.S. Ocular Pain Market Insight
El mercado del dolor Ocular de Estados Unidos está experimentando un fuerte crecimiento debido a la creciente carga de la enfermedad ocular seca y la conjuntivitis alérgica, junto con la creciente utilización de medicamentos oftalmológicos recetados. Según estimaciones clínicas, la enfermedad ocular seca afecta a decenas de millones de adultos en Estados Unidos, lo que lo convierte en una de las causas más comunes de la incomodidad ocular. La adopción fuerte de terapias avanzadas como fármacos basados en ciclosporina (Restasis), lifitegrast (Xiidra) y formulaciones antiinflamatorias más nuevas impulsa la expansión del mercado. Además, el sistema sanitario bien desarrollado del país, las altas tasas de consulta de oftalmología y la fuerte cobertura de seguros apoyan la accesibilidad al tratamiento. El aumento del uso de dispositivos digitales y la creciente demanda de terapias oculares mínimamente invasivas contribuyen aún más al crecimiento del mercado.
Europe Ocular Pain Market Insight
Europa sigue siendo un importante contribuyente al Mercado del Dolor Ocular, apoyado por sistemas sanitarios sólidos, una alta conciencia de la salud ocular y una mayor prevalencia de trastornos oculares relacionados con la edad. Países como Alemania, Francia y el Reino Unido muestran una alta adopción de gotas de los ojos recetados y tratamientos oftalmológicos avanzados. La región se beneficia de marcos regulatorios sólidos bajo la Agencia Europea de Medicamentos (EMA), garantizando una rápida disponibilidad de terapias innovadoras. El aumento de los casos de enfermedades oculares secas vinculadas con el envejecimiento de la población y la contaminación ambiental están impulsando aún más la demanda de soluciones de gestión del dolor ocular a largo plazo.
U.K. Ocular Pain Market Insight
El mercado de Dolor Ocular de los Estados Unidos está creciendo constantemente debido a la creciente incidencia del síndrome de ojo seco y las condiciones de los ojos alérgicas, junto con una fuerte adopción de soluciones oftálmicas de prescripción y venta libre. La presencia de infraestructuras sanitarias avanzadas bajo el sistema NHS garantiza un amplio acceso de los pacientes a la atención oftalmológica. Aumentar la conciencia de la salud ocular, junto con el creciente uso de gotas lubricantes y terapias antiinflamatorias, está apoyando la expansión del mercado. Además, las colaboraciones de investigación en curso entre instituciones académicas y empresas farmacéuticas están fortaleciendo la innovación en enfoques de tratamiento del dolor ocular.
Alemania Ocular mercado de dolor
Alemania representa uno de los mayores mercados de oftalmología en Europa, impulsado por un fuerte sistema de salud y una alta prevalencia de trastornos oculares crónicos. El país muestra una adopción significativa de terapias de prescripción avanzadas y tratamientos oftálmicos hospitalarios. Aumentar los casos de degeneración macular relacionada con la edad, enfermedad de los ojos secos y dolor ocular postquirúrgico están impulsando la demanda. Alemania también se beneficia de una fuerte actividad farmacéutica RículoD, con empresas centradas en formulaciones sin conservantes y nuevos medicamentos antiinflamatorios, apoyando el crecimiento del mercado a largo plazo.
Asia-Pacific Ocular Pain Market Insight
La región de Asia y el Pacífico es el mercado de mayor crecimiento, proyectado para expandirse en una CAGR del 7,5% entre 2026 y 2033, impulsada por la creciente prevalencia de trastornos oculares, el aumento del gasto sanitario y la rápida expansión de la infraestructura de oftalmología en las economías emergentes. Los casos crecientes de enfermedad ocular seca, conjuntivitis y cepa ocular digital contribuyen significativamente a la demanda del mercado. La ampliación del acceso a la atención oftalmológica en países como China, la India, el Japón y Corea del Sur, junto con el aumento de la conciencia sobre la salud ocular, está acelerando la adopción del tratamiento. Además, el aumento de la disponibilidad de gotas oculares OTC asequibles y terapias de prescripción está mejorando la penetración del mercado.
Japan Ocular Pain Market Insight
El mercado del dolor ocular de Japón está creciendo constantemente debido a su rápido envejecimiento de la población y la alta prevalencia de enfermedades oculares secas e inflamación de la superficie ocular. El país cuenta con una de las tasas más altas de consultas de oftalmología a nivel mundial, lo que contribuye a una fuerte adopción de productos de prescripción y atención ocular de OTC. Aumentar el uso de terapias avanzadas como gotas de ojos inmunomoduladores y formulaciones sin conservantes es impulsar la expansión del mercado. El fuerte ecosistema de innovación farmacéutica de Japón y centrarse en la medicina de precisión apoyan aún más el desarrollo de tratamientos de dolor ocular de próxima generación.
China Ocular Pain Market Insight
China está surgiendo como uno de los mercados de mayor crecimiento para el tratamiento del dolor ocular debido a la rápida urbanización, el aumento de la exposición a la pantalla y el aumento de la conciencia de la salud ocular. La creciente prevalencia de la enfermedad ocular seca y la conjuntivitis alérgica aumenta significativamente la demanda de terapias del dolor ocular. La expansión de la infraestructura sanitaria, el aumento de la disponibilidad de medicamentos oftálmicos y el aumento de la adopción de gotas avanzadas de los ojos recetados y lubricantes OTC están apoyando el crecimiento del mercado. Las iniciativas gubernamentales para mejorar el acceso a la salud y aumentar la inversión en servicios de oftalmología están fortaleciendo aún más la posición de China en el mercado mundial.
Mercado de dolor ocular Compartir
La industria del Dolor Ocular está dirigida principalmente por empresas bien establecidas, incluyendo:
- Bausch + Lomb (Estados Unidos)
- Alcon Inc. (Suiza)
- Johnson & Johnson Vision Care, Inc. (Estados Unidos)
- Novartis AG (Suiza)
- Santen Pharmaceutical Co., Ltd. (Japón)
- Allergan (AbbVie Inc.) (Estados Unidos)
- Bayer AG (Alemania)
- Pfizer Inc. (U.S.)
- Sun Pharmaceutical Industries Ltd. (India)
- AstraZeneca plc (Reino Unido)
- Regeneron Pharmaceuticals, Inc. (U.S.)
- Ocuphire Pharma, Inc. (U.S.)
- Kala Pharmaceuticals, Inc. (U.S.)
- Graybug Vision, Inc. (U.S.)
- Ocular Therapeutix, Inc. (U.S.)
- Aerie Pharmaceuticals (Alcon) (Estados Unidos)
- Nicox S.A. (Francia)
- Thea Pharma (Francia)
- Sentiss Pharma Pvt. Ltd. (India)
- Entod Pharmaceuticals (India)
- Cipla Ltd. (India)
- Dr. Reddy’s Laboratories Ltd. (India)
- Abbott Laboratories (U.S.)
- Harrow Health, Inc. (U.S.)
- SIFI S.p.A. (Italia)
- Viatris Inc. (U.S.)
- Lupin Limited (India)
- F. Hoffmann-La Roche Ltd. (Suiza)
- GlaxoSmithKline plc (U.K.)
- Oftalmics de Nicox (Francia)
- Terapéutica Vistagen, Inc. (U.S.)
Últimas novedades en el mercado del dolor ocular
- En octubre de 2021, Ocular Therapeutix anunció la aprobación de la FDA de DEXTENZA (inserción oftalmológica de dexamethasona) para el tratamiento de la picazón ocular asociada con con conjuntivitis alérgica, ampliando su indicación anterior para el dolor ocular postoperatorio e inflamación. El inserto intracanalicular proporciona una liberación sostenida de drogas por hasta 30 días y representa un cambio hacia terapias administradas por oficinas y de acción prolongada que mejoran el cumplimiento y reducen la carga del tratamiento en la gestión del dolor ocular
- En febrero de 2022, la FDA de EE.UU. aprobó la primera versión genérica de Restasis (emulsión oftalmológica de ciclosporina) para pacientes con keratoconjunctivitis sicca (enfermedad de los ojos secos), una afección fuertemente asociada con malestar ocular y dolor crónico de los ojos. La aprobación amplió el acceso del paciente a terapia oftalmológica antiinflamatoria de menor costo, mejorando la gestión a largo plazo del dolor de la superficie ocular y la inflamación
- En septiembre de 2022, Santen Pharmaceutical y UBE Corporation recibieron la aprobación de la FDA para OMLONTI (solución oftalmológica de isopropil isopropil) para reducir la presión intraocular elevada en pacientes de glaucoma y hipertensión ocular. Aunque se indicó principalmente para la reducción de los COP, la terapia desempeña un papel clave en la prevención de complicaciones asociadas al dolor de glaucoma, un importante contribuyente a la incomodidad ocular crónica en todo el mundo
- En septiembre de 2023, Ocuphire Pharma y Viatris recibieron aprobación de la FDA para RYZUMVI (solución Oftalmológica de Oftalmología 0.75%) para la midriasis inducida farmacológicamente. La terapia mejora la recuperación de la función del alumno después de los procedimientos diagnósticos de los ojos, reduciendo el malestar post-procedimiento y los síntomas de dolor ocular transitorio en los ajustes de oftalmología clínica
- En marzo de 2024, Formosa Pharmaceuticals y Eyenovia recibieron la aprobación de la FDA para APP13007 (clobetasol propionate ophthalmic suspension 0.05%) para el tratamiento del dolor ocular postoperatorio e inflamación. Los ensayos clínicos demostraron una reducción significativa en el dolor y la inflamación de la cirugía postcataracta, marcando uno de los lanzamientos recientes más importantes en la terapia del dolor ocular basada en esteroides en más de 15 años
- En febrero de 2024, OKYO Pharma recibió la autorización de la FDA de su aplicación Investigación Nuevo Medicamento (IND) para el OK-101 para el dolor neuropático de la corneal (NCP), permitiendo ensayos clínicos en una de las condiciones de dolor ocular más severas y subservidas. Este hito destaca el aumento de la innovación dirigida a los síndromes de dolor ocular relacionados con los nervios sin terapias curativas aprobadas
- En marzo de 2024, la aprobación de la FDA de APP13007 se destacó además como un avance para la gestión del dolor ocular postoperatoria, demostrando un alivio significativo del dolor y la reducción de la inflamación en los ensayos de Fase III. Se espera que el lanzamiento amplíe las opciones de tratamiento para pacientes de cirugía catarata y refractiva con dolor agudo ocular
- En mayo de 2025, Alcon recibió la aprobación de la FDA para TRYPTYR (tratamiento de enfermedades del ojo seco), una nueva gota del ojo que estimula la producción de lagrimas naturales y mejora rápidamente la incomodidad de la superficie ocular. La terapia representa una nueva clase de manejo del dolor superficial ocular basado en neuroestimulación, abordando una gran necesidad insatisfecha en dolor ocular relacionado con los ojos secos que afecta a decenas de millones de pacientes a nivel mundial
SKU-
Obtenga acceso en línea al informe sobre la primera nube de inteligencia de mercado del mundo

- Panel de análisis de datos interactivo
- Panel de análisis de empresas para oportunidades con alto potencial de crecimiento
- Acceso de analista de investigación para personalización y consultas
- Análisis de la competencia con panel interactivo
- Últimas noticias, actualizaciones y análisis de tendencias
- Aproveche el poder del análisis de referencia para un seguimiento integral de la competencia
Tabla de contenido
1 INTRODUCCIÓN
1.1 OBJETIVOS DEL ESTUDIO
1.2 DEFINICIÓN DE MERCADO
1.3 DESCRIPCIÓN GENERAL DEL MERCADO MUNDIAL DEL DOLOR OCULAR
1.4 LIMITACIONES
1.5 MERCADOS CUBIERTOS
2 MERCADO GLOBAL DEL DOLOR OCULAR: SEGMENTACIÓN
2.1 MERCADOS CUBIERTOS
2.2 ÁMBITO GEOGRÁFICO
2,3 AÑOS CONSIDERADOS PARA EL ESTUDIO
2.4 MONEDA Y PRECIOS
2.5 MODELO DE VALIDACIÓN DE DATOS TRÍPODE DBMR
2.6 ENTREVISTAS PRINCIPALES CON LÍDERES DE OPINIÓN CLAVE
2.7 MODELADO MULTIVARIADO
2.8 CUADRÍCULA DE POSICIÓN DE MERCADO DBMR
2.9 ANÁLISIS DE LA PARTICIPACIÓN DE LOS PROVEEDORES
2.1 CUADRÍCULA DE COBERTURA DE USUARIOS FINALES DEL MERCADO
2.11 FUENTES SECUNDARIAS
2.12 SUPUESTOS
3 RESUMEN EJECUTIVO
4 INFORMACIÓN PREMIUM
4.1 ANÁLISIS PESTAL
4.2 ANÁLISIS DE LAS CINCO FUERZAS DE PORTERS
4.3 SEGUIMIENTO DE INNOVACIÓN Y ANÁLISIS ESTRATÉGICO
4.4 ANÁLISIS DE PATENTES-
4.5 CADENA DE SUMINISTRO
4.6 CADENA DE VALOR
5 ANÁLISIS DEL IMPACTO ARANCELARIO – MERCADO GLOBAL DEL DOLOR OCULAR
5.1 IMPACTO EN LAS IMPORTACIONES DE MATERIAS PRIMAS Y API
5.2 ARANCELES DE PRODUCTOS TERMINADOS Y ACCESO AL MERCADO
5.3 TARIFAS DE COMPONENTES DE DISPOSITIVOS MÉDICOS
5.4 ACUERDOS COMERCIALES Y BENEFICIOS DE LA ARMONIZACIÓN
5.5 CAMBIOS ESTRATÉGICOS Y LOCALIZACIÓN
6 MERCADO MUNDIAL DEL DOLOR OCULAR: REGULACIONES
7 DESCRIPCIÓN GENERAL DEL MERCADO
7.1 CONTROLADORES
7.1.1 AUMENTO DEL ESTILO DE VIDA ANTHIGIÉNICO Y SEDENTARIO
7.1.2 AUMENTO DE LA PREVALENCIA DE TRASTORNOS OFTÁLMICOS Y DOLORES OCULARES
7.1.3 AUMENTAR LA CONCIENCIACIÓN DE LAS PERSONAS SOBRE LAS ENFERMEDADES RELACIONADAS CON LOS OJOS
7.1.4 CASOS CRECIENTES DE MIGRAÑA OCULAR
7.2 RESTRICCIONES
7.2.1 EFECTOS SECUNDARIOS DE LOS MEDICAMENTOS PARA EL TRATAMIENTO OCULAR
7.2.2 ALTO COSTO DEL TRATAMIENTO Y LA MEDICACIÓN OCULAR
7.3 OPORTUNIDADES
7.3.1 AUMENTO DEL GASTO EN SALUD Y DE LA RENTA DISPONIBLE
7.3.2 AUMENTO DE LAS ACTIVIDADES DE INVESTIGACIÓN Y DESARROLLO
7.3.3 AVANCES TECNOLÓGICOS EN DIAGNÓSTICO Y TRATAMIENTO
7.4 DESAFÍOS
7.4.1 NORMAS Y REGLAMENTOS ESTRICTOS
7.4.2 FALTA DE INSTALACIONES DE SALUD PARA EL TRATAMIENTO OCULAR
8 MERCADO MUNDIAL DEL DOLOR OCULAR, POR TIPO DE ENFERMEDAD
8.1 DESCRIPCIÓN GENERAL
8.2 DOLOR OCULAR CON ENFERMEDADES OCULARES
8.3 DOLOR OCULAR SIN ENFERMEDADES OCULARES PRIMARIAS
9 MERCADO MUNDIAL DEL DOLOR OCULAR, POR TIPO
9.1 INFORMACIÓN GENERAL
9.2 DIAGNÓSTICO
9.3 TRATAMIENTO
10 MERCADO MUNDIAL DEL DOLOR OCULAR, POR APLICACIÓN
10.1 INFORMACIÓN GENERAL
10.2 GLAUCOMA
10.3 BLEFARITIS
10.4 CONJUNTIVITIS
10.5 ABRASIÓN CORNEAL
10.6 ESTILO
10.7 IRITIS
10.8 SINUSITIS
10.9 MIGRAÑAS
10.1 OTROS
11 MERCADO MUNDIAL DEL DOLOR OCULAR, POR VÍA DE ADMINISTRACIÓN
11.1 INFORMACIÓN GENERAL
11.2 TÓPICO
11.3 INTRAOCULAR
11.4 PERIOCULAR
11.5 ORAL
11.6 OTROS
12 MERCADO MUNDIAL DEL DOLOR OCULAR, POR TIPO DE POBLACIÓN
12.1 INFORMACIÓN GENERAL
12.2 ADULT
12.3 GERIÁTRICO
13 MERCADO MUNDIAL DEL DOLOR OCULAR, POR TIPO DE FÁRMACO
13.1 INFORMACIÓN GENERAL
13.2 PRESCRIPCIÓN
13.3 SIN MÉDICO
14 MERCADO MUNDIAL DEL DOLOR OCULAR, POR USUARIO FINAL
14.1 INFORMACIÓN GENERAL
14.2 HOSPITALES
14.3 CLÍNICAS ESPECIALIZADAS
14.4 ATENCIÓN MÉDICA DOMICILIARIA
14.5 CENTROS DE DOLOR OCULAR
14.6 CENTROS DE CIRUGÍA AMBULATORIA
14.7 OTROS
15 MERCADO MUNDIAL DEL DOLOR OCULAR, POR CANAL DE DISTRIBUCIÓN
15.1 INFORMACIÓN GENERAL
15.2 LICITACIÓN DIRECTA
15.3 FARMACIA HOSPITALARIA
15.4 FARMACIA MINORISTA
15.5 FARMACIA EN LÍNEA
15.6 OTROS
16 MERCADO MUNDIAL DEL DOLOR OCULAR, POR REGIÓN
16.1 DESCRIPCIÓN GENERAL
16.2 AMÉRICA DEL NORTE
16.2.1 EE. UU.
16.2.2 CANADÁ
16.2.3 MÉXICO
16.3 EUROPA
16.3.1 ALEMANIA
16.3.2 ITALIA
16.3.3 FRANCIA
16.3.4 Reino Unido
16.3.5 ESPAÑA
16.3.6 PAÍSES BAJOS
16.3.7 RUSIA
16.3.8 SUIZA
16.3.9 TURQUÍA
16.3.10 AUSTRIA
16.3.11 NORUEGA
16.3.12 HUNGRÍA
16.3.13 LITUANIA
16.3.14 IRLANDA
16.3.15 POLONIA
16.3.16 RESTO DE EUROPA
16.4 ASIA PACÍFICO
16.4.1 JAPÓN
16.4.2 CHINA
16.4.3 INDIA
16.4.4 COREA DEL SUR
16.4.5 AUSTRALIA
16.4.6 SINGAPUR
16.4.7 TAILANDIA
16.4.8 MALASIA
16.4.9 INDONESIA
16.4.10 FILIPINAS
16.4.11 VIETNAM
16.4.12 RESTO DE ASIA-PACÍFICO
16.5 SUDAMÉRICA
16.5.1 BRASIL
16.5.2 ARGENTINA
16.5.3 PERÚ
16.5.4 RESTO DE SUDAMÉRICA
16.6 ORIENTE MEDIO Y ÁFRICA
16.6.1 SUDÁFRICA
16.6.2 ARABIA SAUDITA
16.6.3 Emiratos Árabes Unidos
16.6.4 EGIPTO
16.6.5 KUWAIT
16.6.6 ISRAEL
16.6.7 RESTO DE ORIENTE MEDIO Y ÁFRICA
17 MERCADO GLOBAL DEL DOLOR OCULAR: PANORAMA EMPRESARIAL
17.1 ANÁLISIS DE ACCIONES DE LA EMPRESA: GLOBAL
17.2 ANÁLISIS DE ACCIONES DE LA EMPRESA: AMÉRICA DEL NORTE
17.3 ANÁLISIS DE ACCIONES DE EMPRESAS: EUROPA
17.4 ANÁLISIS DE ACCIONES DE LA EMPRESA: ASIA-PACÍFICO
18 ANÁLISIS FODA
19 PERFILES DE EMPRESAS
19.1 ALCON INC
19.1.1 INSTANTÁNEA DE LA EMPRESA
19.1.2 ANÁLISIS DE INGRESOS
19.1.3 ANÁLISIS DE LAS ACCIONES DE LA EMPRESA
19.1.4 PORTAFOLIO DE PRODUCTOS
19.1.5 DESARROLLOS RECIENTES
19.2 ALLERGAN (UNA EMPRESA DE ABBVIE)
19.2.1 INSTANTÁNEA DE LA EMPRESA
19.2.2 ANÁLISIS DE INGRESOS
19.2.3 ANÁLISIS DE LAS ACCIONES DE LA EMPRESA
19.2.4 PORTAFOLIO DE PRODUCTOS
19.2.5 DESARROLLOS RECIENTES
19.3 BAUSCH + LOMB
19.3.1 INSTANTÁNEA DE LA EMPRESA
19.3.2 ANÁLISIS DE INGRESOS
19.3.3 ANÁLISIS DE LAS ACCIONES DE LA EMPRESA
19.3.4 PORTAFOLIO DE PRODUCTOS
19.3.5 DESARROLLOS RECIENTES
19.4 KENVUE
19.4.1 INSTANTÁNEA DE LA EMPRESA
19.4.2 ANÁLISIS DE INGRESOS
19.4.3 ANÁLISIS DE LAS ACCIONES DE LA EMPRESA
19.4.4 PORTAFOLIO DE PRODUCTOS
19.4.5 DESARROLLO RECIENTE
19.5 PFIZER INC.
19.5.1 INSTANTÁNEA DE LA EMPRESA
19.5.2 ANÁLISIS DE INGRESOS
19.5.3 ANÁLISIS DE LAS ACCIONES DE LA EMPRESA
19.5.4 PORTAFOLIO DE PRODUCTOS
19.5.5 DESARROLLO RECIENTE
19.6 ALDEYRA TERAPÉUTICA, INC.
19.6.1 INSTANTÁNEA DE LA EMPRESA
19.6.2 ANÁLISIS DE INGRESOS
19.6.3 PORTAFOLIO DE PRODUCTOS
19.6.4 DESARROLLO RECIENTE/NOTICIAS
19.7 LABORATORIOS DE COROIDES
19.7.1 INSTANTÁNEA DE LA EMPRESA
19.7.2 PORTAFOLIO DE PRODUCTOS
19.7.3 DESARROLLO RECIENTE
19.8 EYEPOINT PHARMACEUTICALS, INC.
19.8.1 INSTANTÁNEA DE LA EMPRESA
19.8.2 ANÁLISIS DE INGRESOS
19.8.3 PORTAFOLIO DE PRODUCTOS
19.8.4 DESARROLLOS RECIENTES
19.9 FERA PHARMACEUTICALS
19.9.1 INSTANTÁNEA DE LA EMPRESA
19.9.2 PORTAFOLIO DE PRODUCTOS
19.9.3 DESARROLLO RECIENTE
19.1 FORMOSAPHARMA FARMACÉUTICA INC.
19.10.1 INSTANTÁNEA DE LA EMPRESA
19.10.2 ANÁLISIS DE INGRESOS
19.10.3 PORTAFOLIO DE PRODUCTOS
19.10.4 NOTICIAS RECIENTES
19.11 PRODUCTOS FARMACÉUTICOS DE LA IACTA
19.11.1 INSTANTÁNEA DE LA EMPRESA
19.11.2 PORTAFOLIO DE PRODUCTOS
19.11.3 DESARROLLO RECIENTE
19.12 IVIEW TERAPÉUTICA, INC.
19.12.1 INSTANTÁNEA DE LA EMPRESA
19.12.2 PORTAFOLIO DE PRODUCTOS
19.12.3 DESARROLLO RECIENTE
19.13 MERCK & CO., INC., UNA SUBSIDIARIA DE MERCK
19.13.1 INSTANTÁNEA DE LA EMPRESA
19.13.2 ANÁLISIS DE INGRESOS
19.13.3 PORTAFOLIO DE PRODUCTOS
19.13.4 DESARROLLOS RECIENTES
19.14 NOVALIQ GMBH
19.14.1 INSTANTÁNEA DE LA EMPRESA
19.14.2 PORTAFOLIO DE PRODUCTOS
19.14.3 DESARROLLOS RECIENTES
19.15 OCULAR THERAPEUTIX, INC.
19.15.1 INSTANTÁNEA DE LA EMPRESA
19.15.2 ANÁLISIS DE INGRESOS
19.15.3 PORTAFOLIO DE PRODUCTOS
19.15.4 DESARROLLOS/NOTICIAS RECIENTES
19.16 OKYO PHARMA, LIMITADA
19.16.1 INSTANTÁNEA DE LA EMPRESA
19.16.2 1.1.4 ANÁLISIS DE INGRESOS
19.16.3 PORTAFOLIO DE PRODUCTOS
19.16.4 DESARROLLOS/NOTICIAS RECIENTES
19.17 OPDENAS CIENCIAS DE LA VIDA.
19.17.1 INSTANTÁNEA DE LA EMPRESA
19.17.2 PORTAFOLIO DE PRODUCTOS
19.17.3 DESARROLLO RECIENTE
19.18 OPTICARMA INDIA SMC PRIVATE LIMITED
19.18.1 INSTANTÁNEA DE LA EMPRESA
19.18.2 PORTAFOLIO DE PRODUCTOS
19.18.3 DESARROLLOS/NOTICIAS RECIENTES
19.19 OSCAR REMEDIES PVT. LTD.
19.19.1 INSTANTÁNEA DE LA EMPRESA
19.19.2 PORTAFOLIO DE PRODUCTOS
19.19.3 DESARROLLOS/NOTICIAS RECIENTES
19.2 INDUSTRIAS PHARMACEUTICAL SUN LTD.
19.20.1 INSTANTÁNEA DE LA EMPRESA
19.20.2 ANÁLISIS DE INGRESOS
19.20.3 PORTAFOLIO DE PRODUCTOS
19.20.4 DESARROLLO RECIENTE
19.21 SYLENTIS
19.21.1 INSTANTÁNEA DE LA EMPRESA
19.21.2 PORTAFOLIO DE PRODUCTOS
19.21.3 DESARROLLO RECIENTE
19.22 TARSIER PHARMA LTD.
19.22.1 INSTANTÁNEA DE LA EMPRESA
19.22.2 PORTAFOLIO DE PRODUCTOS
19.22.3 DESARROLLO RECIENTE
19.23 THERALIFE, INC.
19.23.1 INSTANTÁNEA DE LA EMPRESA
19.23.2 PORTAFOLIO DE PRODUCTOS
19.23.3 DESARROLLO RECIENTE
19.24 VYLUMA
19.24.1 INSTANTÁNEA DE LA EMPRESA
19.24.2 CARTERA DE OLEODUCTO
19.24.3 DESARROLLO RECIENTE
19.25 WELLONA PHARMA
19.25.1 INSTANTÁNEA DE LA EMPRESA
19.25.2 PORTAFOLIO DE PRODUCTOS
19.25.3 DESARROLLOS/NOTICIAS RECIENTES
20 CUESTIONARIO
21 INFORMES RELACIONADOS
Lista de Tablas
TABLA 1 MERCADO MUNDIAL DEL DOLOR OCULAR, POR TIPO DE ENFERMEDAD, 2018-2032 (MILES DE USD)
TABLA 2 MERCADO GLOBAL DE DOLOR OCULAR CON ENFERMEDADES OCULARES EN EL DOLOR OCULAR, POR REGIÓN, 2018-2032 (MILES DE USD)
TABLA 3 MERCADO GLOBAL DE DOLOR OCULAR CON ENFERMEDADES OCULARES EN EL DOLOR OCULAR, POR TIPO DE ENFERMEDAD, 2018-2032 (MILES DE USD)
TABLA 4 DOLOR OCULAR GLOBAL SIN ENFERMEDADES OCULARES PRIMARIAS EN EL MERCADO DEL DOLOR OCULAR, POR REGIÓN, 2018-2032 (MILES DE USD)
TABLA 5 DOLOR OCULAR GLOBAL SIN ENFERMEDADES OCULARES PRIMARIAS EN EL MERCADO DEL DOLOR OCULAR, POR TIPO DE ENFERMEDAD, 2018-2032 (MILES DE USD)
TABLA 6 MERCADO MUNDIAL DEL DOLOR OCULAR, POR TIPO, 2018-2032 (MILES DE USD)
TABLA 7 MERCADO GLOBAL DE DIAGNÓSTICO DEL DOLOR OCULAR, POR REGIÓN, 2018-2032 (MILES DE USD)
TABLA 8 MERCADO GLOBAL DE DIAGNÓSTICO DEL DOLOR OCULAR, POR TIPO, 2018-2032 (MILES DE USD)
TABLA 9 PRUEBAS SENSORIALES GLOBALES PARA EL DOLOR OCULAR EN EL MERCADO DEL DOLOR OCULAR, POR TIPO, 2018-2032 (MILES DE USD)
TABLA 10 PRUEBAS DE IMAGENOLOGÍA GLOBALES PARA EL DOLOR OCULAR EN EL MERCADO DEL DOLOR OCULAR, POR TIPO, 2018-2032 (MILES DE USD)
TABLA 11 MERCADO GLOBAL DE TRATAMIENTO DEL DOLOR OCULAR, POR REGIÓN, 2018-2032 (MILES DE USD)
TABLA 12 MERCADO GLOBAL DE TRATAMIENTO DEL DOLOR OCULAR, POR TIPO, 2018-2032 (MILES DE USD)
TABLA 13 MERCADO GLOBAL DE TRATAMIENTO LOCAL DEL DOLOR OCULAR, POR TIPO, 2018-2032 (MILES DE USD)
TABLA 14 MERCADO MUNDIAL DE ESTEROIDES TÓPICOS PARA EL DOLOR OCULAR, POR TIPO, 2018-2032 (MILES DE USD)
TABLA 15 MERCADO GLOBAL DE ANTIINFLAMATORIOS NO ESTEROIDES (AINE) PARA EL DOLOR OCULAR, POR TIPO, 2018-2032 (MILES DE USD)
TABLA 16 MERCADO GLOBAL DE TERAPIAS DE ESTIMULACIÓN PARA EL DOLOR OCULAR, POR TIPO, 2018-2032 (MILES DE USD)
TABLA 17 MERCADO MUNDIAL DEL DOLOR OCULAR, POR APLICACIÓN, 2018-2032 (MILES DE USD)
TABLA 18 MERCADO GLOBAL DE GLAUCOMA EN EL DOLOR OCULAR, POR REGIÓN, 2018-2032 (MILES DE USD)
TABLA 19 MERCADO GLOBAL DE BLEFARITIS EN EL DOLOR OCULAR, POR REGIÓN, 2018-2032 (MILES DE USD)
TABLA 20 MERCADO MUNDIAL DE CONJUNTIVITIS EN EL DOLOR OCULAR, POR REGIÓN, 2018-2032 (MILES DE USD)
TABLA 21 MERCADO GLOBAL DE ABRASIÓN CORNEAL EN EL DOLOR OCULAR, POR REGIÓN, 2018-2032 (MILES DE USD)
TABLA 22 MERCADO GLOBAL DE DOLOR OCULAR, POR REGIÓN, 2018-2032 (MILES DE USD)
TABLA 23 MERCADO GLOBAL DE IRITIS EN EL DOLOR OCULAR, POR REGIÓN, 2018-2032 (MILES DE USD)
TABLA 24 MERCADO GLOBAL DE SINUSITIS EN EL DOLOR OCULAR, POR REGIÓN, 2018-2032 (MILES DE USD)
TABLA 25 MERCADO MUNDIAL DE MIGRAÑAS EN EL DOLOR OCULAR, POR REGIÓN, 2018-2032 (MILES DE USD)
TABLA 26 MERCADO GLOBAL DE OTROS EN EL DOLOR OCULAR, POR REGIÓN, 2018-2032 (MILES DE USD)
TABLA 27 MERCADO MUNDIAL DEL DOLOR OCULAR, POR VÍA DE ADMINISTRACIÓN, 2018-2032 (MILES DE USD)
TABLA 28 MERCADO MUNDIAL DE PRODUCTOS TÓPICOS PARA EL DOLOR OCULAR, POR REGIÓN, 2018-2032 (MILES DE USD)
TABLA 29 MERCADO MUNDIAL DE FÁRMACOS TÓPICOS PARA EL DOLOR OCULAR, POR VÍA DE ADMINISTRACIÓN, 2018-2032 (MILES DE USD)
TABLA 30 MERCADO MUNDIAL DE INTRAOCULARES PARA EL DOLOR OCULAR, POR REGIÓN, 2018-2032 (MILES DE USD)
TABLA 31 MERCADO MUNDIAL DE INTRAOCULARES PARA EL DOLOR OCULAR, POR VÍA DE ADMINISTRACIÓN, 2018-2032 (MILES DE USD)
TABLA 32 MERCADO MUNDIAL DE VENTILACIÓN PERIOCULAR PARA EL DOLOR OCULAR, POR REGIÓN, 2018-2032 (MILES DE USD)
TABLA 33 MERCADO MUNDIAL DE PERIOCULARES PARA EL DOLOR OCULAR, POR VÍA DE ADMINISTRACIÓN, 2018-2032 (MILES DE USD)
TABLA 34 MERCADO MUNDIAL DE PRODUCTOS ORALES PARA EL DOLOR OCULAR, POR REGIÓN, 2018-2032 (MILES DE USD)
TABLA 35 MERCADO MUNDIAL DE MEDICAMENTOS ORALES PARA EL DOLOR OCULAR, POR VÍA DE ADMINISTRACIÓN, 2018-2032 (MILES DE USD)
TABLA 36 MERCADO GLOBAL DE OTROS EN EL DOLOR OCULAR, POR REGIÓN, 2018-2032 (MILES DE USD)
TABLA 37 MERCADO MUNDIAL DEL DOLOR OCULAR, POR TIPO DE POBLACIÓN, 2018-2032 (MILES DE USD)
TABLA 38 MERCADO MUNDIAL DE ADULTOS CON DOLOR OCULAR, POR REGIÓN, 2018-2032 (MILES DE USD)
TABLA 39 MERCADO GLOBAL DE GERIÁTRICOS PARA EL DOLOR OCULAR, POR REGIÓN, 2018-2032 (MILES DE USD)
TABLA 40 MERCADO MUNDIAL DEL DOLOR OCULAR, POR TIPO DE MEDICAMENTO, 2018-2032 (MILES DE USD)
TABLA 41 MERCADO GLOBAL DE PRESCRIPCIÓN PARA EL DOLOR OCULAR, POR REGIÓN, 2018-2032 (MILES DE USD)
TABLA 42 MERCADO MUNDIAL DE MEDICAMENTOS DE VENTA LIBRE (OTC) PARA EL DOLOR OCULAR, POR REGIÓN, 2018-2032 (MILES DE USD)
TABLA 43 MERCADO MUNDIAL DEL DOLOR OCULAR, POR USUARIO FINAL, 2018-2032 (MILES DE USD)
TABLA 44 HOSPITALES GLOBALES EN EL MERCADO DEL DOLOR OCULAR, POR REGIÓN, 2018-2032 (MILES DE USD)
TABLA 45 MERCADO GLOBAL DE CLÍNICAS ESPECIALIZADAS EN DOLOR OCULAR, POR REGIÓN, 2018-2032 (MILES DE USD)
TABLA 46 MERCADO MUNDIAL DE ATENCIÓN MÉDICA DOMICILIARIA PARA EL DOLOR OCULAR, POR REGIÓN, 2018-2032 (MILES DE USD)
TABLA 47 CENTROS GLOBALES DE DOLOR OCULAR EN EL MERCADO DEL DOLOR OCULAR, POR REGIÓN, 2018-2032 (MILES DE USD)
TABLA 48 CENTROS DE CIRUGÍA AMBULATORIA GLOBAL EN EL MERCADO DEL DOLOR OCULAR, POR REGIÓN, 2018-2032 (MILES DE USD)
TABLA 49 MERCADO GLOBAL DE OTROS EN EL DOLOR OCULAR, POR REGIÓN, 2018-2032 (MILES DE USD)
TABLA 50 MERCADO MUNDIAL DEL DOLOR OCULAR, POR CANAL DE DISTRIBUCIÓN, 2018-2032 (MILES DE USD)
TABLA 51 LICITACIÓN DIRECTA GLOBAL EN EL MERCADO DEL DOLOR OCULAR, POR REGIÓN, 2018-2032 (MILES DE USD)
TABLA 52 MERCADO GLOBAL DE FARMACIA HOSPITALARIA PARA EL DOLOR OCULAR, POR REGIÓN, 2018-2032 (MILES DE USD)
TABLA 53 MERCADO MUNDIAL DE FARMACIA MINORISTA PARA EL DOLOR OCULAR, POR REGIÓN, 2018-2032 (MILES DE USD)
TABLA 54 MERCADO GLOBAL DE FARMACIA EN LÍNEA PARA EL DOLOR OCULAR, POR REGIÓN, 2018-2032 (MILES DE USD)
TABLA 55 MERCADO GLOBAL DE OTROS EN EL DOLOR OCULAR, POR REGIÓN, 2018-2032 (MILES DE USD)
TABLA 56 MERCADO MUNDIAL DEL DOLOR OCULAR, POR REGIÓN, 2018-2032 (MILES DE USD)
TABLA 57 MERCADO DEL DOLOR OCULAR EN AMÉRICA DEL NORTE, POR PAÍS, 2018-2032 (MILES DE USD)
TABLA 58 MERCADO DE DOLOR OCULAR EN AMÉRICA DEL NORTE, POR TIPO DE ENFERMEDAD, 2018-2032 (MILES DE USD)
TABLA 59 DOLOR OCULAR EN AMÉRICA DEL NORTE CON ENFERMEDADES OCULARES EN EL MERCADO DEL DOLOR OCULAR, POR TIPO DE ENFERMEDAD, 2018-2032 (MILES DE USD)
TABLA 60 DOLOR OCULAR SIN ENFERMEDADES OCULARES PRIMARIAS EN EL MERCADO DE DOLOR OCULAR EN AMÉRICA DEL NORTE, POR TIPO DE ENFERMEDAD, 2018-2032 (MILES DE USD)
TABLA 61 MERCADO DEL DOLOR OCULAR EN AMÉRICA DEL NORTE, POR TIPO, 2018-2032 (MILES DE USD)
TABLA 62 MERCADO DE DIAGNÓSTICO DEL DOLOR OCULAR EN AMÉRICA DEL NORTE, POR TIPO, 2018-2032 (MILES DE USD)
TABLA 63 MERCADO DE PRUEBAS SENSORIALES PARA EL DOLOR OCULAR EN AMÉRICA DEL NORTE, POR TIPO, 2018-2032 (MILES DE USD)
TABLA 64 MERCADO DE PRUEBAS DE IMAGEN PARA EL DOLOR OCULAR EN AMÉRICA DEL NORTE, POR TIPO, 2018-2032 (MILES DE USD)
TABLA 65 MERCADO DE TRATAMIENTO DEL DOLOR OCULAR EN AMÉRICA DEL NORTE, POR TIPO, 2018-2032 (MILES DE USD)
TABLA 66 MERCADO DE TRATAMIENTO LOCAL DEL DOLOR OCULAR EN AMÉRICA DEL NORTE, POR TIPO, 2018-2032 (MILES DE USD)
TABLA 67 MERCADO DE ESTEROIDES TÓPICOS PARA EL DOLOR OCULAR EN AMÉRICA DEL NORTE, POR TIPO, 2018-2032 (MILES DE USD)
TABLA 68 MERCADO DE ANTIINFLAMATORIOS NO ESTEROIDES (AINE) PARA EL DOLOR OCULAR EN AMÉRICA DEL NORTE, POR TIPO, 2018-2032 (MILES DE USD)
TABLA 69 MERCADO DE TERAPIAS DE ESTIMULACIÓN PARA EL DOLOR OCULAR EN AMÉRICA DEL NORTE, POR TIPO, 2018-2032 (MILES DE USD)
TABLA 70 MERCADO DEL DOLOR OCULAR EN AMÉRICA DEL NORTE, POR APLICACIÓN, 2018-2032 (MILES DE USD)
TABLA 71 MERCADO DEL DOLOR OCULAR EN AMÉRICA DEL NORTE, POR VÍA DE ADMINISTRACIÓN, 2018-2032 (MILES DE USD)
TABLA 72 MERCADO DE MEDICAMENTOS TÓPICOS PARA EL DOLOR OCULAR EN AMÉRICA DEL NORTE, POR VÍA DE ADMINISTRACIÓN, 2018-2032 (MILES DE USD)
TABLA 73 MERCADO DE MEDICAMENTOS INTRAOCULARES PARA EL DOLOR OCULAR EN AMÉRICA DEL NORTE, POR VÍA DE ADMINISTRACIÓN, 2018-2032 (MILES DE USD)
TABLA 74 MERCADO DE MEDICAMENTOS PERIOCULARES PARA EL DOLOR OCULAR EN AMÉRICA DEL NORTE, POR VÍA DE ADMINISTRACIÓN 2018-2032 (MILES DE USD)
TABLA 75 MERCADO DE MEDICAMENTOS ORALES PARA EL DOLOR OCULAR EN AMÉRICA DEL NORTE, POR VÍA DE ADMINISTRACIÓN, 2018-2032 (MILES DE USD)
TABLA 76 MERCADO DEL DOLOR OCULAR EN AMÉRICA DEL NORTE, POR TIPO DE MEDICAMENTO, 2018-2032 (MILES DE USD)
TABLA 77 MERCADO DEL DOLOR OCULAR EN AMÉRICA DEL NORTE, POR TIPO DE POBLACIÓN, 2018-2032 (MILES DE USD)
TABLA 78 MERCADO DE DOLOR OCULAR EN AMÉRICA DEL NORTE, POR USUARIO FINAL, 2018-2032 (MILES DE USD)
TABLA 79 MERCADO DEL DOLOR OCULAR EN AMÉRICA DEL NORTE, POR CANAL DE DISTRIBUCIÓN, 2018-2032 (MILES DE USD)
TABLA 80 MERCADO DEL DOLOR OCULAR EN EE. UU., POR TIPO DE ENFERMEDAD, 2018-2032 (MILES DE USD)
TABLA 81 DOLOR OCULAR CON ENFERMEDADES OCULARES EN EL MERCADO DE DOLOR OCULAR EN EE. UU., POR TIPO DE ENFERMEDAD, 2018-2032 (MILES DE USD)
TABLA 82 DOLOR OCULAR EN EE. UU. SIN ENFERMEDADES OCULARES PRIMARIAS EN EL MERCADO DEL DOLOR OCULAR, POR TIPO DE ENFERMEDAD, 2018-2032 (MILES DE USD)
TABLA 83 MERCADO DEL DOLOR OCULAR EN EE. UU., POR TIPO, 2018-2032 (MILES DE USD)
TABLA 84 MERCADO DE DIAGNÓSTICO DEL DOLOR OCULAR EN EE. UU., POR TIPO, 2018-2032 (MILES DE USD)
TABLA 85 MERCADO DE PRUEBAS SENSORIALES PARA EL DOLOR OCULAR EN EE. UU., POR TIPO, 2018-2032 (MILES DE USD)
TABLA 86 MERCADO DE PRUEBAS DE IMAGEN PARA EL DOLOR OCULAR EN EE. UU., POR TIPO, 2018-2032 (MILES DE USD)
TABLA 87 MERCADO DE TRATAMIENTO DEL DOLOR OCULAR EN EE. UU., POR TIPO, 2018-2032 (MILES DE USD)
TABLA 88 MERCADO DE TRATAMIENTO LOCAL DEL DOLOR OCULAR EN EE. UU., POR TIPO, 2018-2032 (MILES DE USD)
TABLA 89 MERCADO DE ESTEROIDES TÓPICOS PARA EL DOLOR OCULAR EN EE. UU., POR TIPO, 2018-2032 (MILES DE USD)
TABLA 90 MERCADO DE ANTIINFLAMATORIOS NO ESTEROIDES (AINE) PARA EL DOLOR OCULAR EN EE. UU., POR TIPO, 2018-2032 (MILES DE USD)
TABLA 91 MERCADO DE TERAPIAS DE ESTIMULACIÓN PARA EL DOLOR OCULAR EN EE. UU., POR TIPO, 2018-2032 (MILES DE USD)
TABLA 92 MERCADO ESTADOUNIDENSE DE DOLOR OCULAR, POR APLICACIÓN, 2018-2032 (MILES DE USD)
TABLA 93 MERCADO DEL DOLOR OCULAR EN EE. UU., POR VÍA DE ADMINISTRACIÓN, 2018-2032 (MILES DE USD)
TABLA 94 MERCADO DE FÁRMACOS TÓPICOS PARA EL DOLOR OCULAR EN EE. UU., POR VÍA DE ADMINISTRACIÓN, 2018-2032 (MILES DE USD)
TABLA 95 MERCADO ESTADOUNIDENSE DE MEDICAMENTOS INTRAOCULARES PARA EL DOLOR OCULAR, POR VÍA DE ADMINISTRACIÓN, 2018-2032 (MILES DE USD)
TABLA 96 MERCADO ESTADOUNIDENSE DE MEDICAMENTOS PERIOCULARES PARA EL DOLOR OCULAR, POR VÍA DE ADMINISTRACIÓN 2018-2032 (MILES DE USD)
TABLA 97 MERCADO ESTADOUNIDENSE DE MEDICAMENTOS ORALES PARA EL DOLOR OCULAR, POR VÍA DE ADMINISTRACIÓN, 2018-2032 (MILES DE USD)
TABLA 98 MERCADO ESTADOUNIDENSE DEL DOLOR OCULAR, POR TIPO DE MEDICAMENTO, 2018-2032 (MILES DE USD)
TABLA 99 MERCADO DE DOLOR OCULAR EN EE. UU., POR TIPO DE POBLACIÓN, 2018-2032 (MILES DE USD)
TABLA 100 MERCADO DE DOLOR OCULAR EN EE. UU., POR USUARIO FINAL, 2018-2032 (MILES DE USD)
TABLA 101 MERCADO DEL DOLOR OCULAR EN EE. UU., POR CANAL DE DISTRIBUCIÓN, 2018-2032 (MILES DE USD)
TABLA 102 MERCADO CANADIENSE DE DOLOR OCULAR, POR TIPO DE ENFERMEDAD, 2018-2032 (MILES DE USD)
TABLA 103 DOLOR OCULAR EN CANADÁ CON ENFERMEDADES OCULARES EN EL MERCADO DEL DOLOR OCULAR, POR TIPO DE ENFERMEDAD, 2018-2032 (MILES DE USD)
TABLA 104 DOLOR OCULAR EN CANADÁ SIN ENFERMEDADES OCULARES PRIMARIAS EN EL MERCADO DEL DOLOR OCULAR, POR TIPO DE ENFERMEDAD, 2018-2032 (MILES DE USD)
TABLA 105 MERCADO CANADIENSE DEL DOLOR OCULAR, POR TIPO, 2018-2032 (MILES DE USD)
TABLA 106 MERCADO DE DIAGNÓSTICO DEL DOLOR OCULAR EN CANADÁ, POR TIPO, 2018-2032 (MILES DE USD)
TABLA 107 MERCADO DE PRUEBAS SENSORIALES PARA EL DOLOR OCULAR EN CANADÁ, POR TIPO, 2018-2032 (MILES DE USD)
TABLA 108 MERCADO DE PRUEBAS DE IMAGEN PARA EL DOLOR OCULAR EN CANADÁ, POR TIPO, 2018-2032 (MILES DE USD)
TABLA 109 MERCADO DE TRATAMIENTO DEL DOLOR OCULAR EN CANADÁ, POR TIPO, 2018-2032 (MILES DE USD)
TABLA 110 MERCADO CANADIENSE DE TRATAMIENTO DEL DOLOR OCULAR, POR TIPO, 2018-2032 (MILES DE USD)
TABLA 111 MERCADO DE ESTEROIDES TÓPICOS PARA EL DOLOR OCULAR EN CANADÁ, POR TIPO, 2018-2032 (MILES DE USD)
TABLA 112 MERCADO CANADIENSE DE ANTIINFLAMATORIOS NO ESTEROIDES (AINE) PARA EL DOLOR OCULAR, POR TIPO, 2018-2032 (MILES DE USD)
TABLA 113 MERCADO DE TERAPIAS DE ESTIMULACIÓN PARA EL DOLOR OCULAR EN CANADÁ, POR TIPO, 2018-2032 (MILES DE USD)
TABLA 114 MERCADO CANADIENSE DE DOLOR OCULAR, POR APLICACIÓN, 2018-2032 (MILES DE USD)
TABLA 115 MERCADO CANADIENSE DE DOLOR OCULAR, POR VÍA DE ADMINISTRACIÓN, 2018-2032 (MILES DE USD)
TABLA 116 MERCADO DE FÁRMACOS TÓPICOS PARA EL DOLOR OCULAR EN CANADÁ, POR VÍA DE ADMINISTRACIÓN, 2018-2032 (MILES DE USD)
TABLA 117 MERCADO CANADIENSE DE MEDICAMENTOS INTRAOCULARES PARA EL DOLOR OCULAR, POR VÍA DE ADMINISTRACIÓN, 2018-2032 (MILES DE USD)
TABLA 118 MERCADO DE MEDICAMENTOS PERIOCULARES PARA EL DOLOR OCULAR EN CANADÁ, POR VÍA DE ADMINISTRACIÓN 2018-2032 (MILES DE USD)
TABLA 119 MERCADO CANADIENSE DE MEDICAMENTOS ORALES PARA EL DOLOR OCULAR, POR VÍA DE ADMINISTRACIÓN, 2018-2032 (MILES DE USD)
TABLA 120 MERCADO CANADIENSE DEL DOLOR OCULAR, POR TIPO DE MEDICAMENTO, 2018-2032 (MILES DE USD)
TABLA 121 MERCADO CANADIENSE DE DOLOR OCULAR, POR TIPO DE POBLACIÓN, 2018-2032 (MILES DE USD)
TABLA 122 MERCADO CANADIENSE DE DOLOR OCULAR, POR USUARIO FINAL, 2018-2032 (MILES DE USD)
TABLA 123 MERCADO CANADIENSE DEL DOLOR OCULAR, POR CANAL DE DISTRIBUCIÓN, 2018-2032 (MILES DE USD)
TABLA 124 MERCADO DEL DOLOR OCULAR EN MÉXICO, POR TIPO DE ENFERMEDAD, 2018-2032 (MILES DE USD)
TABLA 125 MÉXICO DOLOR OCULAR CON ENFERMEDADES OCULARES EN EL MERCADO DEL DOLOR OCULAR, POR TIPO DE ENFERMEDAD, 2018-2032 (MILES DE USD)
TABLA 126 DOLOR OCULAR EN MÉXICO SIN ENFERMEDADES OCULARES PRIMARIAS EN EL MERCADO DE DOLOR OCULAR, POR TIPO DE ENFERMEDAD, 2018-2032 (MILES DE USD)
TABLA 127 MERCADO DEL DOLOR OCULAR EN MÉXICO, POR TIPO, 2018-2032 (MILES DE USD)
TABLA 128 MERCADO DE DIAGNÓSTICO DEL DOLOR OCULAR EN MÉXICO, POR TIPO, 2018-2032 (MILES DE USD)
TABLA 129 MERCADO DE PRUEBAS SENSORIALES PARA EL DOLOR OCULAR EN MÉXICO, POR TIPO, 2018-2032 (MILES DE USD)
TABLA 130 MERCADO DE PRUEBAS DE IMAGENOLOGÍA PARA EL DOLOR OCULAR EN MÉXICO, POR TIPO, 2018-2032 (MILES DE USD)
TABLA 131 MERCADO DE TRATAMIENTO DEL DOLOR OCULAR EN MÉXICO, POR TIPO, 2018-2032 (MILES DE USD)
TABLA 132 MERCADO DE TRATAMIENTO LOCAL DEL DOLOR OCULAR EN MÉXICO, POR TIPO, 2018-2032 (MILES DE USD)
TABLA 133 MERCADO DE ESTEROIDES TÓPICOS PARA EL DOLOR OCULAR EN MÉXICO, POR TIPO, 2018-2032 (MILES DE USD)
TABLA 134 MERCADO DE ANTIINFLAMATORIOS NO ESTEROIDES (AINE) PARA EL DOLOR OCULAR EN MÉXICO, POR TIPO, 2018-2032 (MILES DE USD)
TABLA 135 MERCADO DE TERAPIAS DE ESTIMULACIÓN PARA EL DOLOR OCULAR EN MÉXICO, POR TIPO, 2018-2032 (MILES DE USD)
TABLA 136 MERCADO DEL DOLOR OCULAR EN MÉXICO, POR APLICACIÓN, 2018-2032 (MILES DE USD)
TABLA 137 MERCADO DEL DOLOR OCULAR EN MÉXICO, POR VÍA DE ADMINISTRACIÓN, 2018-2032 (MILES DE USD)
TABLA 138 MERCADO MÉXICO DE MEDICAMENTOS TÓPICOS PARA EL DOLOR OCULAR, POR VÍA DE ADMINISTRACIÓN, 2018-2032 (MILES DE USD)
TABLA 139 MERCADO MÉXICO DE INTRAOCULARES PARA EL DOLOR OCULAR, POR VÍA DE ADMINISTRACIÓN, 2018-2032 (MILES DE USD)
TABLA 140 MERCADO DE MEDICAMENTOS PERIOCULARES PARA EL DOLOR OCULAR EN MÉXICO, POR VÍA DE ADMINISTRACIÓN 2018-2032 (MILES DE USD)
TABLA 141 MERCADO MÉXICO DE MEDICAMENTOS ORALES PARA EL DOLOR OCULAR, POR VÍA DE ADMINISTRACIÓN, 2018-2032 (MILES DE USD)
TABLA 142 MERCADO DEL DOLOR OCULAR EN MÉXICO, POR TIPO DE MEDICAMENTO, 2018-2032 (MILES DE USD)
TABLA 143 MERCADO DEL DOLOR OCULAR EN MÉXICO, POR TIPO DE POBLACIÓN, 2018-2032 (MILES DE USD)
TABLA 144 MERCADO DEL DOLOR OCULAR EN MÉXICO, POR USUARIO FINAL, 2018-2032 (MILES DE USD)
TABLA 145 MERCADO DEL DOLOR OCULAR EN MÉXICO, POR CANAL DE DISTRIBUCIÓN, 2018-2032 (MILES DE USD)
TABLA 146 MERCADO EUROPEO DEL DOLOR OCULAR, POR PAÍS, 2018-2032 (MILES DE USD)
TABLA 147 MERCADO EUROPEO DEL DOLOR OCULAR, POR TIPO DE ENFERMEDAD, 2018-2032 (MILES DE USD)
TABLA 148 DOLOR OCULAR EN EUROPA CON ENFERMEDADES OCULARES EN EL MERCADO DEL DOLOR OCULAR, POR TIPO DE ENFERMEDAD, 2018-2032 (MILES DE USD)
TABLA 149 DOLOR OCULAR EN EUROPA SIN ENFERMEDADES OCULARES PRIMARIAS EN EL MERCADO DEL DOLOR OCULAR, POR TIPO DE ENFERMEDAD, 2018-2032 (MILES DE USD)
TABLA 150 MERCADO EUROPEO DEL DOLOR OCULAR, POR TIPO, 2018-2032 (MILES DE USD)
TABLA 151 MERCADO EUROPEO DE DIAGNÓSTICO DEL DOLOR OCULAR, POR TIPO, 2018-2032 (MILES DE USD)
TABLA 152 MERCADO EUROPEO DE PRUEBAS SENSORIALES PARA EL DOLOR OCULAR, POR TIPO, 2018-2032 (MILES DE USD)
TABLA 153 MERCADO EUROPEO DE PRUEBAS DE IMAGEN PARA EL DOLOR OCULAR, POR TIPO, 2018-2032 (MILES DE USD)
TABLA 154 MERCADO EUROPEO DE TRATAMIENTO DEL DOLOR OCULAR, POR TIPO, 2018-2032 (MILES DE USD)
TABLA 155 MERCADO EUROPEO DE TRATAMIENTO LOCAL DEL DOLOR OCULAR, POR TIPO, 2018-2032 (MILES DE USD)
TABLA 156 MERCADO EUROPEO DE ESTEROIDES TÓPICOS PARA EL DOLOR OCULAR, POR TIPO, 2018-2032 (MILES DE USD)
TABLA 157 MERCADO EUROPEO DE ANTIINFLAMATORIOS NO ESTEROIDES (AINE) PARA EL DOLOR OCULAR, POR TIPO, 2018-2032 (MILES DE USD)
TABLA 158 MERCADO EUROPEO DE TERAPIAS DE ESTIMULACIÓN PARA EL DOLOR OCULAR, POR TIPO, 2018-2032 (MILES DE USD)
TABLA 159 MERCADO EUROPEO DEL DOLOR OCULAR, POR APLICACIÓN, 2018-2032 (MILES DE USD)
TABLA 160 MERCADO EUROPEO DEL DOLOR OCULAR, POR VÍA DE ADMINISTRACIÓN, 2018-2032 (MILES DE USD)
TABLA 161 MERCADO EUROPEO DE FÁRMACOS TÓPICOS PARA EL DOLOR OCULAR, POR VÍA DE ADMINISTRACIÓN, 2018-2032 (MILES DE USD)
TABLA 162 MERCADO EUROPEO DE INTRAOCULARES PARA EL DOLOR OCULAR, POR VÍA DE ADMINISTRACIÓN, 2018-2032 (MILES DE USD)
TABLA 163 MERCADO EUROPEO DE MEDICAMENTOS PERIOCULARES PARA EL DOLOR OCULAR, POR VÍA DE ADMINISTRACIÓN 2018-2032 (MILES DE USD)
TABLA 164 MERCADO EUROPEO DE MEDICAMENTOS ORALES PARA EL DOLOR OCULAR, POR VÍA DE ADMINISTRACIÓN, 2018-2032 (MILES DE USD)
TABLA 165 MERCADO EUROPEO DEL DOLOR OCULAR, POR TIPO DE FÁRMACO, 2018-2032 (MILES DE USD)
TABLA 166 MERCADO EUROPEO DEL DOLOR OCULAR, POR TIPO DE POBLACIÓN, 2018-2032 (MILES DE USD)
TABLA 167 MERCADO EUROPEO DEL DOLOR OCULAR, POR USUARIO FINAL, 2018-2032 (MILES DE USD)
TABLA 168 MERCADO EUROPEO DEL DOLOR OCULAR, POR CANAL DE DISTRIBUCIÓN, 2018-2032 (MILES DE USD)
TABLA 169 MERCADO DEL DOLOR OCULAR EN ALEMANIA, POR TIPO DE ENFERMEDAD, 2018-2032 (MILES DE USD)
TABLA 170 ALEMANIA DOLOR OCULAR CON ENFERMEDADES OCULARES EN EL MERCADO DEL DOLOR OCULAR, POR TIPO DE ENFERMEDAD, 2018-2032 (MILES DE USD)
TABLA 171 ALEMANIA DOLOR OCULAR SIN ENFERMEDADES OCULARES PRIMARIAS EN EL MERCADO DE DOLOR OCULAR, POR TIPO DE ENFERMEDAD, 2018-2032 (MILES DE USD)
TABLA 172 MERCADO DEL DOLOR OCULAR EN ALEMANIA, POR TIPO, 2018-2032 (MILES DE USD)
TABLA 173 DIAGNÓSTICO DEL DOLOR OCULAR EN ALEMANIA, POR TIPO, 2018-2032 (MILES DE USD)
TABLA 174 MERCADO DE PRUEBAS SENSORIALES PARA EL DOLOR OCULAR EN ALEMANIA, POR TIPO, 2018-2032 (MILES DE USD)
TABLA 175 MERCADO DE PRUEBAS DE IMAGEN PARA EL DOLOR OCULAR EN ALEMANIA, POR TIPO, 2018-2032 (MILES DE USD)
TABLA 176 MERCADO DE TRATAMIENTO DEL DOLOR OCULAR EN ALEMANIA, POR TIPO, 2018-2032 (MILES DE USD)
TABLA 177 MERCADO DE TRATAMIENTO LOCAL DEL DOLOR OCULAR EN ALEMANIA, POR TIPO, 2018-2032 (MILES DE USD)
TABLA 178 MERCADO ALEMÁN DE ESTEROIDES TÓPICOS PARA EL DOLOR OCULAR, POR TIPO, 2018-2032 (MILES DE USD)
TABLA 179 MERCADO DE ANTIINFLAMATORIOS NO ESTEROIDES (AINE) PARA EL DOLOR OCULAR EN ALEMANIA, POR TIPO, 2018-2032 (MILES DE USD)
TABLA 180 MERCADO DE TERAPIAS DE ESTIMULACIÓN PARA EL DOLOR OCULAR EN ALEMANIA, POR TIPO, 2018-2032 (MILES DE USD)
TABLA 181 MERCADO DEL DOLOR OCULAR EN ALEMANIA, POR APLICACIÓN, 2018-2032 (MILES DE USD)
TABLA 182 MERCADO DEL DOLOR OCULAR EN ALEMANIA, POR VÍA DE ADMINISTRACIÓN, 2018-2032 (MILES DE USD)
TABLA 183 MERCADO ALEMANO DE FÁRMACOS TÓPICOS PARA EL DOLOR OCULAR, POR VÍA DE ADMINISTRACIÓN, 2018-2032 (MILES DE USD)
TABLA 184 MERCADO ALEMANO DE FARMACÉUTICOS INTRAOCULARES PARA EL DOLOR OCULAR, POR VÍA DE ADMINISTRACIÓN, 2018-2032 (MILES DE USD)
TABLA 185 MERCADO ALEMANO DE MEDICAMENTOS PERIOCULARES PARA EL DOLOR OCULAR, POR VÍA DE ADMINISTRACIÓN 2018-2032 (MILES DE USD)
TABLA 186 MERCADO ALEMANO DE MEDICAMENTOS ORALES PARA EL DOLOR OCULAR, POR VÍA DE ADMINISTRACIÓN, 2018-2032 (MILES DE USD)
TABLA 187 MERCADO DEL DOLOR OCULAR EN ALEMANIA, POR TIPO DE MEDICAMENTO, 2018-2032 (MILES DE USD)
TABLA 188 MERCADO DEL DOLOR OCULAR EN ALEMANIA, POR TIPO DE POBLACIÓN, 2018-2032 (MILES DE USD)
TABLA 189 MERCADO DEL DOLOR OCULAR EN ALEMANIA, POR USUARIO FINAL, 2018-2032 (MILES DE USD)
TABLA 190 MERCADO DEL DOLOR OCULAR EN ALEMANIA, POR CANAL DE DISTRIBUCIÓN, 2018-2032 (MILES DE USD)
TABLA 191 MERCADO ITALIANO DEL DOLOR OCULAR, POR TIPO DE ENFERMEDAD, 2018-2032 (MILES DE USD)
TABLA 192 ITALIA DOLOR OCULAR CON ENFERMEDADES OCULARES EN EL MERCADO DEL DOLOR OCULAR, POR TIPO DE ENFERMEDAD, 2018-2032 (MILES DE USD)
TABLA 193 ITALIA DOLOR OCULAR SIN ENFERMEDADES OCULARES PRIMARIAS EN EL MERCADO DEL DOLOR OCULAR, POR TIPO DE ENFERMEDAD, 2018-2032 (MILES DE USD)
TABLA 194 MERCADO ITALIANO DEL DOLOR OCULAR, POR TIPO, 2018-2032 (MILES DE USD)
TABLA 195 DIAGNÓSTICO DEL DOLOR OCULAR EN ITALIA, POR TIPO, 2018-2032 (MILES DE USD)
TABLA 196 MERCADO DE PRUEBAS SENSORIALES PARA EL DOLOR OCULAR EN ITALIA, POR TIPO, 2018-2032 (MILES DE USD)
TABLA 197 MERCADO DE PRUEBAS DE IMAGEN PARA EL DOLOR OCULAR EN ITALIA, POR TIPO, 2018-2032 (MILES DE USD)
TABLA 198 TRATAMIENTO DEL DOLOR OCULAR EN ITALIA, POR TIPO, 2018-2032 (MILES DE USD)
TABLA 199 TRATAMIENTO LOCAL DEL DOLOR OCULAR EN ITALIA, POR TIPO, 2018-2032 (MILES DE USD)
TABLA 200 MERCADO DE ESTEROIDES TÓPICOS PARA EL DOLOR OCULAR EN ITALIA, POR TIPO, 2018-2032 (MILES DE USD)
TABLA 201 MERCADO DE ANTIINFLAMATORIOS NO ESTEROIDES (AINE) PARA EL DOLOR OCULAR EN ITALIA, POR TIPO, 2018-2032 (MILES DE USD)
TABLA 202 ITALIA MERCADO DE TERAPIAS DE ESTIMULACIÓN PARA EL DOLOR OCULAR, POR TIPO, 2018-2032 (MILES DE USD)
TABLA 203 MERCADO ITALIANO DEL DOLOR OCULAR, POR APLICACIÓN, 2018-2032 (MILES DE USD)
TABLA 204 MERCADO ITALIANO DEL DOLOR OCULAR, POR VÍA DE ADMINISTRACIÓN, 2018-2032 (MILES DE USD)
TABLA 205 MERCADO DE ITALIA DE MEDICAMENTOS TÓPICOS PARA EL DOLOR OCULAR, POR VÍA DE ADMINISTRACIÓN, 2018-2032 (MILES DE USD)
TABLA 206 MERCADO DE ITALIA DE MEDICAMENTOS INTRAOCULARES PARA EL DOLOR OCULAR, POR VÍA DE ADMINISTRACIÓN, 2018-2032 (MILES DE USD)
TABLA 207 MERCADO DE ITALIA PARA EL DOLOR OCULAR, POR VÍA DE ADMINISTRACIÓN 2018-2032 (MILES DE USD)
TABLA 208 MERCADO DE ITALIA DE MEDICAMENTOS ORALES PARA EL DOLOR OCULAR, POR VÍA DE ADMINISTRACIÓN, 2018-2032 (MILES DE USD)
TABLA 209 MERCADO ITALIANO DEL DOLOR OCULAR, POR TIPO DE MEDICAMENTO, 2018-2032 (MILES DE USD)
TABLA 210 MERCADO DEL DOLOR OCULAR EN ITALIA, POR TIPO DE POBLACIÓN, 2018-2032 (MILES DE USD)
TABLA 211 MERCADO ITALIANO DEL DOLOR OCULAR, POR USUARIO FINAL, 2018-2032 (MILES DE USD)
TABLA 212 MERCADO ITALIANO DEL DOLOR OCULAR, POR CANAL DE DISTRIBUCIÓN, 2018-2032 (MILES DE USD)
TABLA 213 MERCADO FRANCESO DEL DOLOR OCULAR, POR TIPO DE ENFERMEDAD, 2018-2032 (MILES DE USD)
TABLA 214 FRANCIA DOLOR OCULAR CON ENFERMEDADES OCULARES EN EL MERCADO DEL DOLOR OCULAR, POR TIPO DE ENFERMEDAD, 2018-2032 (MILES DE USD)
TABLA 215 FRANCIA DOLOR OCULAR SIN ENFERMEDADES OCULARES PRIMARIAS EN EL MERCADO DEL DOLOR OCULAR, POR TIPO DE ENFERMEDAD, 2018-2032 (MILES DE USD)
TABLA 216 MERCADO FRANCESO DEL DOLOR OCULAR, POR TIPO, 2018-2032 (MILES DE USD)
TABLA 217 DIAGNÓSTICO EN EL MERCADO DEL DOLOR OCULAR EN FRANCIA, POR TIPO, 2018-2032 (MILES DE USD)
TABLA 218 MERCADO DE PRUEBAS SENSORIALES PARA EL DOLOR OCULAR EN FRANCIA, POR TIPO, 2018-2032 (MILES DE USD)
TABLA 219 MERCADO DE PRUEBAS DE IMAGEN PARA EL DOLOR OCULAR EN FRANCIA, POR TIPO, 2018-2032 (MILES DE USD)
TABLA 220 TRATAMIENTO DEL DOLOR OCULAR EN FRANCIA, POR TIPO, 2018-2032 (MILES DE USD)
TABLA 221 TRATAMIENTO LOCAL DEL DOLOR OCULAR EN FRANCIA, POR TIPO, 2018-2032 (MILES DE USD)
TABLA 222 MERCADO FRANCESO DE ESTEROIDES TÓPICOS PARA EL DOLOR OCULAR, POR TIPO, 2018-2032 (MILES DE USD)
TABLA 223 MERCADO FRANCESO DE ANTIINFLAMATORIOS NO ESTEROIDES (AINE) PARA EL DOLOR OCULAR, POR TIPO, 2018-2032 (MILES DE USD)
TABLA 224 MERCADO DE TERAPIAS DE ESTIMULACIÓN PARA EL DOLOR OCULAR EN FRANCIA, POR TIPO, 2018-2032 (MILES DE USD)
TABLA 225 MERCADO FRANCESO DEL DOLOR OCULAR, POR APLICACIÓN, 2018-2032 (MILES DE USD)
TABLA 226 MERCADO FRANCESO DEL DOLOR OCULAR, POR VÍA DE ADMINISTRACIÓN, 2018-2032 (MILES DE USD)
TABLA 227 MERCADO DE MEDICAMENTOS TÓPICOS PARA EL DOLOR OCULAR EN FRANCIA, POR VÍA DE ADMINISTRACIÓN, 2018-2032 (MILES DE USD)
TABLA 228 MERCADO FRANCESO DE FARMACIA INTRAOCULAR PARA EL DOLOR OCULAR, POR VÍA DE ADMINISTRACIÓN, 2018-2032 (MILES DE USD)
TABLA 229 FRANCIA MERCADO DE MEDICAMENTOS PERIOCULARES PARA EL DOLOR OCULAR, POR VÍA DE ADMINISTRACIÓN 2018-2032 (MILES DE USD)
TABLA 230 MERCADO FRANCESO DE MEDICAMENTOS ORALES PARA EL DOLOR OCULAR, POR VÍA DE ADMINISTRACIÓN, 2018-2032 (MILES DE USD)
TABLA 231 MERCADO FRANCESO DEL DOLOR OCULAR, POR TIPO DE MEDICAMENTO, 2018-2032 (MILES DE USD)
TABLA 232 MERCADO FRANCESO DEL DOLOR OCULAR, POR TIPO DE POBLACIÓN, 2018-2032 (MILES DE USD)
TABLA 233 MERCADO FRANCESO DEL DOLOR OCULAR, POR USUARIO FINAL, 2018-2032 (MILES DE USD)
TABLA 234 MERCADO FRANCESO DEL DOLOR OCULAR, POR CANAL DE DISTRIBUCIÓN, 2018-2032 (MILES DE USD)
TABLA 235 MERCADO DEL DOLOR OCULAR EN EL REINO UNIDO, POR TIPO DE ENFERMEDAD, 2018-2032 (MILES DE USD)
TABLA 236 DOLOR OCULAR CON ENFERMEDADES OCULARES EN EL MERCADO DEL DOLOR OCULAR EN EL REINO UNIDO, POR TIPO DE ENFERMEDAD, 2018-2032 (MILES DE USD)
TABLA 237 DOLOR OCULAR SIN ENFERMEDADES OCULARES PRIMARIAS EN EL MERCADO DEL DOLOR OCULAR EN EL REINO UNIDO, POR TIPO DE ENFERMEDAD, 2018-2032 (MILES DE USD)
TABLA 238 MERCADO DEL DOLOR OCULAR EN EL REINO UNIDO, POR TIPO, 2018-2032 (MILES DE USD)
TABLA 239 MERCADO DE DIAGNÓSTICO DEL DOLOR OCULAR EN EL REINO UNIDO, POR TIPO, 2018-2032 (MILES DE USD)
TABLA 240 MERCADO DE PRUEBAS SENSORIALES PARA EL DOLOR OCULAR EN EL REINO UNIDO, POR TIPO, 2018-2032 (MILES DE USD)
TABLA 241 MERCADO DE PRUEBAS DE IMAGEN PARA EL DOLOR OCULAR EN EL REINO UNIDO, POR TIPO, 2018-2032 (MILES DE USD)
TABLA 242 MERCADO DE TRATAMIENTO DEL DOLOR OCULAR EN EL REINO UNIDO, POR TIPO, 2018-2032 (MILES DE USD)
TABLA 243 MERCADO DE TRATAMIENTO LOCAL DEL DOLOR OCULAR EN EL REINO UNIDO, POR TIPO, 2018-2032 (MILES DE USD)
TABLA 244 MERCADO DE ESTEROIDES TÓPICOS PARA EL DOLOR OCULAR EN EL REINO UNIDO, POR TIPO, 2018-2032 (MILES DE USD)
TABLA 245 MERCADO DE ANTIINFLAMATORIOS NO ESTEROIDES (AINE) PARA EL DOLOR OCULAR EN EL REINO UNIDO, POR TIPO, 2018-2032 (MILES DE USD)
TABLA 246 MERCADO DE TERAPIAS DE ESTIMULACIÓN PARA EL DOLOR OCULAR EN EL REINO UNIDO, POR TIPO, 2018-2032 (MILES DE USD)
TABLA 247 MERCADO DEL DOLOR OCULAR EN EL REINO UNIDO, POR APLICACIÓN, 2018-2032 (MILES DE USD)
TABLA 248 MERCADO DEL DOLOR OCULAR EN EL REINO UNIDO, POR VÍA DE ADMINISTRACIÓN, 2018-2032 (MILES DE USD)
TABLA 249 MERCADO DE FÁRMACOS TÓPICOS PARA EL DOLOR OCULAR EN EL REINO UNIDO, POR VÍA DE ADMINISTRACIÓN, 2018-2032 (MILES DE USD)
TABLA 250 MERCADO DE FARMACÉUTICOS INTRAOCULARES PARA EL DOLOR OCULAR EN EL REINO UNIDO, POR VÍA DE ADMINISTRACIÓN, 2018-2032 (MILES DE USD)
TABLA 251 MERCADO DE FÁRMACOS PERIOCULARES PARA EL DOLOR OCULAR EN EL REINO UNIDO, POR VÍA DE ADMINISTRACIÓN 2018-2032 (MILES DE USD)
TABLA 252 MERCADO DE FARMACÉUTICOS ORALES PARA EL DOLOR OCULAR EN EL REINO UNIDO, POR VÍA DE ADMINISTRACIÓN, 2018-2032 (MILES DE USD)
TABLA 253 MERCADO DEL DOLOR OCULAR EN EL REINO UNIDO, POR TIPO DE FÁRMACO, 2018-2032 (MILES DE USD)
TABLA 254 MERCADO DEL DOLOR OCULAR EN EL REINO UNIDO, POR TIPO DE POBLACIÓN, 2018-2032 (MILES DE USD)
TABLA 255 MERCADO DEL DOLOR OCULAR EN EL REINO UNIDO, POR USUARIO FINAL, 2018-2032 (MILES DE USD)
TABLA 256 MERCADO DEL DOLOR OCULAR EN EL REINO UNIDO, POR CANAL DE DISTRIBUCIÓN, 2018-2032 (MILES DE USD)
TABLA 257 MERCADO ESPAÑOL DEL DOLOR OCULAR, POR TIPO DE ENFERMEDAD, 2018-2032 (MILES DE USD)
TABLA 258 ESPAÑA DOLOR OCULAR CON ENFERMEDADES OCULARES EN EL MERCADO DEL DOLOR OCULAR, POR TIPO DE ENFERMEDAD, 2018-2032 (MILES DE USD)
TABLA 259 ESPAÑA DOLOR OCULAR SIN ENFERMEDADES OCULARES PRIMARIAS EN EL MERCADO DEL DOLOR OCULAR, POR TIPO DE ENFERMEDAD, 2018-2032 (MILES DE USD)
TABLA 260 MERCADO ESPAÑOL DEL DOLOR OCULAR, POR TIPO, 2018-2032 (MILES DE USD)
TABLA 261 MERCADO DE DIAGNÓSTICO DEL DOLOR OCULAR EN ESPAÑA, POR TIPO, 2018-2032 (MILES DE USD)
TABLA 262 MERCADO ESPAÑOL DE PRUEBAS SENSORIALES PARA EL DOLOR OCULAR, POR TIPO, 2018-2032 (MILES DE USD)
TABLA 263 MERCADO DE PRUEBAS DE IMAGEN PARA EL DOLOR OCULAR EN ESPAÑA, POR TIPO, 2018-2032 (MILES DE USD)
TABLA 264 TRATAMIENTO DEL DOLOR OCULAR EN ESPAÑA, POR TIPO, 2018-2032 (MILES DE USD)
TABLA 265 MERCADO ESPAÑOL DE TRATAMIENTO LOCAL DEL DOLOR OCULAR, POR TIPO, 2018-2032 (MILES DE USD)
TABLA 266 MERCADO ESPAÑOL DE ESTEROIDES TÓPICOS PARA EL DOLOR OCULAR, POR TIPO, 2018-2032 (MILES DE USD)
TABLA 267 MERCADO ESPAÑOL DE ANTIINFLAMATORIOS NO ESTEROIDES (AINE) PARA EL DOLOR OCULAR, POR TIPO, 2018-2032 (MILES DE USD)
TABLA 268 MERCADO ESPAÑOL DE TERAPIAS DE ESTIMULACIÓN PARA EL DOLOR OCULAR, POR TIPO, 2018-2032 (MILES DE USD)
TABLA 269 MERCADO ESPAÑOL DEL DOLOR OCULAR, POR APLICACIÓN, 2018-2032 (MILES DE USD)
TABLA 270 MERCADO ESPAÑOL DEL DOLOR OCULAR, POR VÍA DE ADMINISTRACIÓN, 2018-2032 (MILES DE USD)
TABLA 271 MERCADO ESPAÑOL DE FÁRMACOS TÓPICOS PARA EL DOLOR OCULAR, POR VÍA DE ADMINISTRACIÓN, 2018-2032 (MILES DE USD)
TABLA 272 MERCADO ESPAÑOL DE INTRAOCULARES PARA EL DOLOR OCULAR, POR VÍA DE ADMINISTRACIÓN, 2018-2032 (MILES DE USD)
TABLA 273 MERCADO ESPAÑOL DE FARMACÉUTICA PERIOCULAR PARA EL DOLOR OCULAR, POR VÍA DE ADMINISTRACIÓN 2018-2032 (MILES DE USD)
TABLA 274 MERCADO ESPAÑOL DE FARMACÉUTICA ORAL PARA EL DOLOR OCULAR, POR VÍA DE ADMINISTRACIÓN, 2018-2032 (MILES DE USD)
TABLA 275 MERCADO ESPAÑOL DEL DOLOR OCULAR, POR TIPO DE FÁRMACO, 2018-2032 (MILES DE USD)
TABLA 276 MERCADO DEL DOLOR OCULAR EN ESPAÑA, POR TIPO DE POBLACIÓN, 2018-2032 (MILES DE USD)
TABLA 277 MERCADO ESPAÑOL DEL DOLOR OCULAR, POR USUARIO FINAL, 2018-2032 (MILES DE USD)
TABLA 278 MERCADO ESPAÑOL DEL DOLOR OCULAR, POR CANAL DE DISTRIBUCIÓN, 2018-2032 (MILES DE USD)
TABLA 279 MERCADO DEL DOLOR OCULAR EN LOS PAÍSES BAJOS, POR TIPO DE ENFERMEDAD, 2018-2032 (MILES DE USD)
TABLA 280 PAÍSES BAJOS DOLOR OCULAR CON ENFERMEDADES OCULARES EN EL MERCADO DEL DOLOR OCULAR, POR TIPO DE ENFERMEDAD, 2018-2032 (MILES DE USD)
TABLA 281 PAÍSES BAJOS DOLOR OCULAR SIN ENFERMEDADES OCULARES PRIMARIAS EN EL MERCADO DEL DOLOR OCULAR, POR TIPO DE ENFERMEDAD, 2018-2032 (MILES DE USD)
TABLA 282 MERCADO DEL DOLOR OCULAR EN LOS PAÍSES BAJOS, POR TIPO, 2018-2032 (MILES DE USD)
TABLA 283 MERCADO DE DIAGNÓSTICO DEL DOLOR OCULAR EN LOS PAÍSES BAJOS, POR TIPO, 2018-2032 (MILES DE USD)
TABLA 284 MERCADO DE PRUEBAS SENSORIALES PARA EL DOLOR OCULAR EN LOS PAÍSES BAJOS, POR TIPO, 2018-2032 (MILES DE USD)
TABLA 285 MERCADO DE PRUEBAS DE IMAGEN PARA EL DOLOR OCULAR EN LOS PAÍSES BAJOS, POR TIPO, 2018-2032 (MILES DE USD)
TABLA 286 MERCADO DE TRATAMIENTO DEL DOLOR OCULAR EN LOS PAÍSES BAJOS, POR TIPO, 2018-2032 (MILES DE USD)
TABLA 287 MERCADO DE TRATAMIENTO LOCAL DEL DOLOR OCULAR EN LOS PAÍSES BAJOS, POR TIPO, 2018-2032 (MILES DE USD)
TABLA 288 MERCADO DE ESTEROIDES TÓPICOS PARA EL DOLOR OCULAR EN LOS PAÍSES BAJOS, POR TIPO, 2018-2032 (MILES DE USD)
TABLA 289 MERCADO DE ANTIINFLAMATORIOS NO ESTEROIDES (AINE) PARA EL DOLOR OCULAR EN LOS PAÍSES BAJOS, POR TIPO, 2018-2032 (MILES DE USD)
TABLA 290 MERCADO DE TERAPIAS DE ESTIMULACIÓN PARA EL DOLOR OCULAR EN LOS PAÍSES BAJOS, POR TIPO, 2018-2032 (MILES DE USD)
TABLA 291 MERCADO DEL DOLOR OCULAR EN LOS PAÍSES BAJOS, POR APLICACIÓN, 2018-2032 (MILES DE USD)
TABLA 292 MERCADO DEL DOLOR OCULAR EN LOS PAÍSES BAJOS, POR VÍA DE ADMINISTRACIÓN, 2018-2032 (MILES DE USD)
TABLA 293 MERCADO DE PRODUCTOS TÓPICOS PARA EL DOLOR OCULAR EN LOS PAÍSES BAJOS, POR VÍA DE ADMINISTRACIÓN, 2018-2032 (MILES DE USD)
TABLA 294 MERCADO DE INTRAOCULARES PARA EL DOLOR OCULAR EN LOS PAÍSES BAJOS, POR VÍA DE ADMINISTRACIÓN, 2018-2032 (MILES DE USD)
TABLA 295 MERCADO DE PAÍSES BAJOS DE PERIOCULAR PARA EL DOLOR OCULAR, POR VÍA DE ADMINISTRACIÓN 2018-2032 (MILES DE USD)
TABLA 296 MERCADO DE FÁRMACOS ORALES PARA EL DOLOR OCULAR EN LOS PAÍSES BAJOS, POR VÍA DE ADMINISTRACIÓN, 2018-2032 (MILES DE USD)
TABLA 297 MERCADO DEL DOLOR OCULAR EN LOS PAÍSES BAJOS, POR TIPO DE MEDICAMENTO, 2018-2032 (MILES DE USD)
TABLA 298 MERCADO DEL DOLOR OCULAR EN LOS PAÍSES BAJOS, POR TIPO DE POBLACIÓN, 2018-2032 (MILES DE USD)
TABLA 299 MERCADO DEL DOLOR OCULAR EN LOS PAÍSES BAJOS, POR USUARIO FINAL, 2018-2032 (MILES DE USD)
TABLA 300 MERCADO DEL DOLOR OCULAR EN LOS PAÍSES BAJOS, POR CANAL DE DISTRIBUCIÓN, 2018-2032 (MILES DE USD)
TABLA 301 MERCADO RUSO DEL DOLOR OCULAR, POR TIPO DE ENFERMEDAD, 2018-2032 (MILES DE USD)
TABLA 302 RUSIA DOLOR OCULAR CON ENFERMEDADES OCULARES EN EL MERCADO DEL DOLOR OCULAR, POR TIPO DE ENFERMEDAD, 2018-2032 (MILES DE USD)
TABLA 303 DOLOR OCULAR EN RUSIA SIN ENFERMEDADES OCULARES PRIMARIAS EN EL MERCADO DE DOLOR OCULAR, POR TIPO DE ENFERMEDAD, 2018-2032 (MILES DE USD)
TABLA 304 MERCADO RUSO DEL DOLOR OCULAR, POR TIPO, 2018-2032 (MILES DE USD)
TABLA 305 DIAGNÓSTICO EN EL MERCADO DEL DOLOR OCULAR EN RUSIA, POR TIPO, 2018-2032 (MILES DE USD)
TABLA 306 MERCADO DE PRUEBAS SENSORIALES PARA EL DOLOR OCULAR EN RUSIA, POR TIPO, 2018-2032 (MILES DE USD)
TABLA 307 MERCADO DE PRUEBAS DE IMAGEN PARA EL DOLOR OCULAR EN RUSIA, POR TIPO, 2018-2032 (MILES DE USD)
TABLA 308 TRATAMIENTO DEL DOLOR OCULAR EN RUSIA, POR TIPO, 2018-2032 (MILES DE USD)
TABLA 309 TRATAMIENTO LOCAL DEL DOLOR OCULAR EN RUSIA, POR TIPO, 2018-2032 (MILES DE USD)
TABLA 310 MERCADO RUSO DE ESTEROIDES TÓPICOS PARA EL DOLOR OCULAR, POR TIPO, 2018-2032 (MILES DE USD)
TABLA 311 MERCADO RUSO DE ANTIINFLAMATORIOS NO ESTEROIDES (AINE) PARA EL DOLOR OCULAR, POR TIPO, 2018-2032 (MILES DE USD)
TABLA 312 MERCADO DE TERAPIAS DE ESTIMULACIÓN PARA EL DOLOR OCULAR EN RUSIA, POR TIPO, 2018-2032 (MILES DE USD)
TABLA 313 MERCADO RUSO DEL DOLOR OCULAR, POR APLICACIÓN, 2018-2032 (MILES DE USD)
TABLA 314 MERCADO RUSO DEL DOLOR OCULAR, POR VÍA DE ADMINISTRACIÓN, 2018-2032 (MILES DE USD)
TABLA 315 MERCADO RUSO DE MEDICAMENTOS TÓPICOS PARA EL DOLOR OCULAR, POR VÍA DE ADMINISTRACIÓN, 2018-2032 (MILES DE USD)
TABLA 316 MERCADO RUSO DE MEDICAMENTOS INTRAOCULARES PARA EL DOLOR OCULAR, POR VÍA DE ADMINISTRACIÓN, 2018-2032 (MILES DE USD)
TABLA 317 MERCADO RUSO DE MEDICAMENTOS PERIOCULARES PARA EL DOLOR OCULAR, POR VÍA DE ADMINISTRACIÓN 2018-2032 (MILES DE USD)
TABLA 318 MERCADO RUSO DE MEDICAMENTOS ORALES PARA EL DOLOR OCULAR, POR VÍA DE ADMINISTRACIÓN, 2018-2032 (MILES DE USD)
TABLA 319 MERCADO RUSO DEL DOLOR OCULAR, POR TIPO DE MEDICAMENTO, 2018-2032 (MILES DE USD)
TABLA 320 MERCADO RUSO DEL DOLOR OCULAR, POR TIPO DE POBLACIÓN, 2018-2032 (MILES DE USD)
TABLA 321 MERCADO RUSO DEL DOLOR OCULAR, POR USUARIO FINAL, 2018-2032 (MILES DE USD)
TABLA 322 MERCADO RUSO DEL DOLOR OCULAR, POR CANAL DE DISTRIBUCIÓN, 2018-2032 (MILES DE USD)
TABLA 323 MERCADO SUIZO DEL DOLOR OCULAR, POR TIPO DE ENFERMEDAD, 2018-2032 (MILES DE USD)
TABLA 324 DOLOR OCULAR EN SUIZA CON ENFERMEDADES OCULARES EN EL MERCADO DEL DOLOR OCULAR, POR TIPO DE ENFERMEDAD, 2018-2032 (MILES DE USD)
TABLA 325 DOLOR OCULAR EN SUIZA SIN ENFERMEDADES OCULARES PRIMARIAS EN EL MERCADO DEL DOLOR OCULAR, POR TIPO DE ENFERMEDAD, 2018-2032 (MILES DE USD)
TABLA 326 MERCADO SUIZO DEL DOLOR OCULAR, POR TIPO, 2018-2032 (MILES DE USD)
TABLA 327 MERCADO SUIZO DE DIAGNÓSTICO DEL DOLOR OCULAR, POR TIPO, 2018-2032 (MILES DE USD)
TABLA 328 MERCADO SUIZO DE PRUEBAS SENSORIALES PARA EL DOLOR OCULAR, POR TIPO, 2018-2032 (MILES DE USD)
TABLA 329 MERCADO SUIZO DE PRUEBAS DE IMAGEN PARA EL DOLOR OCULAR, POR TIPO, 2018-2032 (MILES DE USD)
TABLA 330 MERCADO SUIZO DE TRATAMIENTO DEL DOLOR OCULAR, POR TIPO, 2018-2032 (MILES DE USD)
TABLA 331 MERCADO SUIZO DE TRATAMIENTO LOCAL DEL DOLOR OCULAR, POR TIPO, 2018-2032 (MILES DE USD)
TABLA 332 MERCADO SUIZO DE ESTEROIDES TÓPICOS PARA EL DOLOR OCULAR, POR TIPO, 2018-2032 (MILES DE USD)
TABLA 333 MERCADO SUIZO DE ANTIINFLAMATORIOS NO ESTEROIDES (AINE) PARA EL DOLOR OCULAR, POR TIPO, 2018-2032 (MILES DE USD)
TABLA 334 MERCADO SUIZO DE TERAPIAS DE ESTIMULACIÓN PARA EL DOLOR OCULAR, POR TIPO, 2018-2032 (MILES DE USD)
TABLA 335 MERCADO SUIZO DEL DOLOR OCULAR, POR APLICACIÓN, 2018-2032 (MILES DE USD)
TABLA 336 MERCADO SUIZO DEL DOLOR OCULAR, POR VÍA DE ADMINISTRACIÓN, 2018-2032 (MILES DE USD)
TABLA 337 MERCADO SUIZO DE MEDICAMENTOS TÓPICOS PARA EL DOLOR OCULAR, POR VÍA DE ADMINISTRACIÓN, 2018-2032 (MILES DE USD)
TABLA 338 MERCADO SUIZO DE MEDICAMENTOS INTRAOCULARES PARA EL DOLOR OCULAR, POR VÍA DE ADMINISTRACIÓN, 2018-2032 (MILES DE USD)
TABLA 339 MERCADO SUIZO DE MEDICAMENTOS PERIOCULARES PARA EL DOLOR OCULAR, POR VÍA DE ADMINISTRACIÓN 2018-2032 (MILES DE USD)
TABLA 340 MERCADO SUIZO DE MEDICAMENTOS ORALES PARA EL DOLOR OCULAR, POR VÍA DE ADMINISTRACIÓN, 2018-2032 (MILES DE USD)
TABLA 341 MERCADO SUIZO DEL DOLOR OCULAR, POR TIPO DE MEDICAMENTO, 2018-2032 (MILES DE USD)
TABLA 342 MERCADO DEL DOLOR OCULAR EN SUIZA, POR TIPO DE POBLACIÓN, 2018-2032 (MILES DE USD)
TABLA 343 MERCADO SUIZO DEL DOLOR OCULAR, POR USUARIO FINAL, 2018-2032 (MILES DE USD)
TABLA 344 MERCADO SUIZO DEL DOLOR OCULAR, POR CANAL DE DISTRIBUCIÓN, 2018-2032 (MILES DE USD)
TABLA 345 MERCADO DE DOLOR OCULAR EN TURQUÍA, POR TIPO DE ENFERMEDAD, 2018-2032 (MILES DE USD)
TABLA 346 TURQUÍA DOLOR OCULAR CON ENFERMEDADES OCULARES EN EL MERCADO DEL DOLOR OCULAR, POR TIPO DE ENFERMEDAD, 2018-2032 (MILES DE USD)
TABLA 347 DOLOR OCULAR EN TURQUÍA SIN ENFERMEDADES OCULARES PRIMARIAS EN EL MERCADO DE DOLOR OCULAR, POR TIPO DE ENFERMEDAD, 2018-2032 (MILES DE USD)
TABLA 348 MERCADO DE DOLOR OCULAR EN TURQUÍA, POR TIPO, 2018-2032 (MILES DE USD)
TABLA 349 DIAGNÓSTICO DEL DOLOR OCULAR EN EL MERCADO DE TURQUÍA, POR TIPO, 2018-2032 (MILES DE USD)
TABLA 350 MERCADO DE PRUEBAS SENSORIALES PARA EL DOLOR OCULAR EN TURQUÍA, POR TIPO, 2018-2032 (MILES DE USD)
TABLA 351 MERCADO DE PRUEBAS DE IMAGEN EN TURQUÍA PARA EL DOLOR OCULAR, POR TIPO, 2018-2032 (MILES DE USD)
TABLA 352 MERCADO DE TRATAMIENTO DEL DOLOR OCULAR EN TURQUÍA, POR TIPO, 2018-2032 (MILES DE USD)
TABLA 353 MERCADO DE TRATAMIENTO LOCAL DEL DOLOR OCULAR EN TURQUÍA, POR TIPO, 2018-2032 (MILES DE USD)
TABLA 354 MERCADO DE ESTEROIDES TÓPICOS DE TURQUÍA PARA EL DOLOR OCULAR, POR TIPO, 2018-2032 (MILES DE USD)
TABLA 355 MERCADO DE ANTIINFLAMATORIOS NO ESTEROIDES (AINE) PARA EL DOLOR OCULAR, POR TIPO, 2018-2032 (MILES DE USD)
TABLA 356 MERCADO DE TERAPIAS DE ESTIMULACIÓN PARA EL DOLOR OCULAR EN TURQUÍA, POR TIPO, 2018-2032 (MILES DE USD)
TABLA 357 MERCADO DE DOLOR OCULAR DE TURQUÍA, POR APLICACIÓN, 2018-2032 (MILES DE USD)
TABLA 358 MERCADO DE DOLOR OCULAR EN TURQUÍA, POR VÍA DE ADMINISTRACIÓN, 2018-2032 (MILES DE USD)
TABLA 359 MERCADO DE TURQUÍA TÓPICA PARA EL DOLOR OCULAR, POR VÍA DE ADMINISTRACIÓN, 2018-2032 (MILES DE USD)
TABLA 360 MERCADO DE FARMACÉUTICOS INTRAOCULARES PARA EL DOLOR OCULAR, POR VÍA DE ADMINISTRACIÓN, 2018-2032 (MILES DE USD)
TABLA 361 MERCADO DE TURQUÍA PARA EL DOLOR OCULAR, POR VÍA DE ADMINISTRACIÓN 2018-2032 (MILES DE USD)
TABLA 362 MERCADO DE TURQUÍA ORAL PARA EL DOLOR OCULAR, POR VÍA DE ADMINISTRACIÓN, 2018-2032 (MILES DE USD)
TABLA 363 MERCADO DE DOLOR OCULAR EN TURQUÍA, POR TIPO DE MEDICAMENTO, 2018-2032 (MILES DE USD)
TABLA 364 MERCADO DE DOLOR OCULAR EN TURQUÍA, POR TIPO DE POBLACIÓN, 2018-2032 (MILES DE USD)
TABLA 365 MERCADO DE DOLOR OCULAR EN TURQUÍA, POR USUARIO FINAL, 2018-2032 (MILES DE USD)
TABLA 366 MERCADO DE DOLOR OCULAR EN TURQUÍA, POR CANAL DE DISTRIBUCIÓN, 2018-2032 (MILES DE USD)
TABLA 367 MERCADO DEL DOLOR OCULAR EN AUSTRIA, POR TIPO DE ENFERMEDAD, 2018-2032 (MILES DE USD)
TABLA 368 AUSTRIA DOLOR OCULAR CON ENFERMEDADES OCULARES EN EL MERCADO DEL DOLOR OCULAR, POR TIPO DE ENFERMEDAD, 2018-2032 (MILES DE USD)
TABLA 369 DOLOR OCULAR EN AUSTRIA SIN ENFERMEDADES OCULARES PRIMARIAS EN EL MERCADO DEL DOLOR OCULAR, POR TIPO DE ENFERMEDAD, 2018-2032 (MILES DE USD)
TABLA 370 MERCADO DEL DOLOR OCULAR EN AUSTRIA, POR TIPO, 2018-2032 (MILES DE USD)
TABLA 371 MERCADO DE DIAGNÓSTICO DEL DOLOR OCULAR EN AUSTRIA, POR TIPO, 2018-2032 (MILES DE USD)
TABLA 372 MERCADO DE PRUEBAS SENSORIALES PARA EL DOLOR OCULAR EN AUSTRIA, POR TIPO, 2018-2032 (MILES DE USD)
TABLA 373 MERCADO DE PRUEBAS DE IMAGEN PARA EL DOLOR OCULAR EN AUSTRIA, POR TIPO, 2018-2032 (MILES DE USD)
TABLA 374 TRATAMIENTO DEL DOLOR OCULAR EN AUSTRIA, POR TIPO, 2018-2032 (MILES DE USD)
TABLA 375 MERCADO DE TRATAMIENTO LOCAL DEL DOLOR OCULAR EN AUSTRIA, POR TIPO, 2018-2032 (MILES DE USD)
TABLA 376 MERCADO DE ESTEROIDES TÓPICOS PARA EL DOLOR OCULAR EN AUSTRIA, POR TIPO, 2018-2032 (MILES DE USD)
TABLA 377 MERCADO DE ANTIINFLAMATORIOS NO ESTEROIDES (AINE) PARA EL DOLOR OCULAR EN AUSTRIA, POR TIPO, 2018-2032 (MILES DE USD)
TABLA 378 MERCADO DE TERAPIAS DE ESTIMULACIÓN PARA EL DOLOR OCULAR EN AUSTRIA, POR TIPO, 2018-2032 (MILES DE USD)
TABLA 379 MERCADO DEL DOLOR OCULAR EN AUSTRIA, POR APLICACIÓN, 2018-2032 (MILES DE USD)
TABLA 380 MERCADO DEL DOLOR OCULAR EN AUSTRIA, POR VÍA DE ADMINISTRACIÓN, 2018-2032 (MILES DE USD)
TABLA 381 MERCADO DE AUSTRIA DE FÁRMACOS TÓPICOS PARA EL DOLOR OCULAR, POR VÍA DE ADMINISTRACIÓN, 2018-2032 (MILES DE USD)
TABLA 382 MERCADO DE AUSTRIA DE INTRAOCULARES PARA EL DOLOR OCULAR, POR VÍA DE ADMINISTRACIÓN, 2018-2032 (MILES DE USD)
TABLA 383 MERCADO DE DOLOR OCULAR PERIOCULAR EN AUSTRIA, POR VÍA DE ADMINISTRACIÓN 2018-2032 (MILES DE USD)
TABLA 384 MERCADO DE AUSTRIA DE MEDICAMENTOS ORALES PARA EL DOLOR OCULAR, POR VÍA DE ADMINISTRACIÓN, 2018-2032 (MILES DE USD)
TABLA 385 MERCADO DEL DOLOR OCULAR EN AUSTRIA, POR TIPO DE MEDICAMENTO, 2018-2032 (MILES DE USD)
TABLA 386 MERCADO DEL DOLOR OCULAR EN AUSTRIA, POR TIPO DE POBLACIÓN, 2018-2032 (MILES DE USD)
TABLA 387 MERCADO DEL DOLOR OCULAR EN AUSTRIA, POR USUARIO FINAL, 2018-2032 (MILES DE USD)
TABLA 388 MERCADO DEL DOLOR OCULAR EN AUSTRIA, POR CANAL DE DISTRIBUCIÓN, 2018-2032 (MILES DE USD)
TABLA 389 MERCADO NORUEGO DEL DOLOR OCULAR, POR TIPO DE ENFERMEDAD, 2018-2032 (MILES DE USD)
TABLA 390 DOLOR OCULAR EN NORUEGA CON ENFERMEDADES OCULARES EN EL MERCADO DEL DOLOR OCULAR, POR TIPO DE ENFERMEDAD, 2018-2032 (MILES DE USD)
TABLA 391 DOLOR OCULAR EN NORUEGA SIN ENFERMEDADES OCULARES PRIMARIAS EN EL MERCADO DEL DOLOR OCULAR, POR TIPO DE ENFERMEDAD, 2018-2032 (MILES DE USD)
TABLA 392 MERCADO NORUEGO DEL DOLOR OCULAR, POR TIPO, 2018-2032 (MILES DE USD)
TABLA 393 MERCADO NORUEGO DE DIAGNÓSTICO DEL DOLOR OCULAR, POR TIPO, 2018-2032 (MILES DE USD)
TABLA 394 MERCADO NORUEGO DE PRUEBAS SENSORIALES PARA EL DOLOR OCULAR, POR TIPO, 2018-2032 (MILES DE USD)
TABLA 395 MERCADO NORUEGO DE PRUEBAS DE IMAGEN PARA EL DOLOR OCULAR, POR TIPO, 2018-2032 (MILES DE USD)
TABLA 396 MERCADO NORUEGO DE TRATAMIENTO DEL DOLOR OCULAR, POR TIPO, 2018-2032 (MILES DE USD)
TABLA 397 MERCADO NORUEGO DE TRATAMIENTO LOCAL DEL DOLOR OCULAR, POR TIPO, 2018-2032 (MILES DE USD)
TABLA 398 MERCADO NORUEGO DE ESTEROIDES TÓPICOS PARA EL DOLOR OCULAR, POR TIPO, 2018-2032 (MILES DE USD)
TABLA 399 MERCADO NORUEGO DE ANTIINFLAMATORIOS NO ESTEROIDES (AINE) PARA EL DOLOR OCULAR, POR TIPO, 2018-2032 (MILES DE USD)
TABLA 400 MERCADO NORUEGO DE TERAPIAS DE ESTIMULACIÓN PARA EL DOLOR OCULAR, POR TIPO, 2018-2032 (MILES DE USD)
TABLA 401 MERCADO NORUEGO DEL DOLOR OCULAR, POR APLICACIÓN, 2018-2032 (MILES DE USD)
TABLA 402 MERCADO NORUEGO DEL DOLOR OCULAR, POR VÍA DE ADMINISTRACIÓN, 2018-2032 (MILES DE USD)
TABLA 403 MERCADO NORUEGO DE MEDICAMENTOS TÓPICOS PARA EL DOLOR OCULAR, POR VÍA DE ADMINISTRACIÓN, 2018-2032 (MILES DE USD)
TABLA 404 MERCADO NORUEGO DE MEDICAMENTOS INTRAOCULARES PARA EL DOLOR OCULAR, POR VÍA DE ADMINISTRACIÓN, 2018-2032 (MILES DE USD)
TABLA 405 MERCADO NORUEGO DE MEDICAMENTOS PERIOCULARES PARA EL DOLOR OCULAR, POR VÍA DE ADMINISTRACIÓN 2018-2032 (MILES DE USD)
TABLA 406 MERCADO NORUEGO DE MEDICAMENTOS ORALES PARA EL DOLOR OCULAR, POR VÍA DE ADMINISTRACIÓN, 2018-2032 (MILES DE USD)
TABLA 407 MERCADO NORUEGO DEL DOLOR OCULAR, POR TIPO DE MEDICAMENTO, 2018-2032 (MILES DE USD)
TABLA 408 MERCADO NORUEGO DEL DOLOR OCULAR, POR TIPO DE POBLACIÓN, 2018-2032 (MILES DE USD)
TABLA 409 MERCADO NORUEGO DEL DOLOR OCULAR, POR USUARIO FINAL, 2018-2032 (MILES DE USD)
TABLA 410 MERCADO NORUEGO DEL DOLOR OCULAR, POR CANAL DE DISTRIBUCIÓN, 2018-2032 (MILES DE USD)
TABLA 411 MERCADO DEL DOLOR OCULAR EN HUNGRÍA, POR TIPO DE ENFERMEDAD, 2018-2032 (MILES DE USD)
TABLA 412 DOLOR OCULAR EN HUNGRÍA CON ENFERMEDADES OCULARES EN EL MERCADO DEL DOLOR OCULAR, POR TIPO DE ENFERMEDAD, 2018-2032 (MILES DE USD)
TABLA 413 DOLOR OCULAR EN HUNGRÍA SIN ENFERMEDADES OCULARES PRIMARIAS EN EL MERCADO DEL DOLOR OCULAR, POR TIPO DE ENFERMEDAD, 2018-2032 (MILES DE USD)
TABLA 414 MERCADO DEL DOLOR OCULAR EN HUNGRÍA, POR TIPO, 2018-2032 (MILES DE USD)
TABLA 415 MERCADO DE DIAGNÓSTICO DEL DOLOR OCULAR EN HUNGRÍA, POR TIPO, 2018-2032 (MILES DE USD)
TABLA 416 MERCADO DE PRUEBAS SENSORIALES PARA EL DOLOR OCULAR EN HUNGRÍA, POR TIPO, 2018-2032 (MILES DE USD)
TABLA 417 MERCADO DE PRUEBAS DE IMAGEN PARA EL DOLOR OCULAR EN HUNGRÍA, POR TIPO, 2018-2032 (MILES DE USD)
TABLA 418 MERCADO DE TRATAMIENTO DEL DOLOR OCULAR EN HUNGRÍA, POR TIPO, 2018-2032 (MILES DE USD)
TABLA 419 MERCADO DE TRATAMIENTO LOCAL DEL DOLOR OCULAR EN HUNGRÍA, POR TIPO, 2018-2032 (MILES DE USD)
TABLA 420 MERCADO DE ESTEROIDES TÓPICOS PARA EL DOLOR OCULAR EN HUNGRÍA, POR TIPO, 2018-2032 (MILES DE USD)
TABLA 421 MERCADO DE ANTIINFLAMATORIOS NO ESTEROIDES (AINE) PARA EL DOLOR OCULAR EN HUNGRÍA, POR TIPO, 2018-2032 (MILES DE USD)
TABLA 422 MERCADO DE TERAPIAS DE ESTIMULACIÓN PARA EL DOLOR OCULAR EN HUNGRÍA, POR TIPO, 2018-2032 (MILES DE USD)
TABLA 423 MERCADO DEL DOLOR OCULAR EN HUNGRÍA, POR APLICACIÓN, 2018-2032 (MILES DE USD)
TABLA 424 MERCADO DEL DOLOR OCULAR EN HUNGRÍA, POR VÍA DE ADMINISTRACIÓN, 2018-2032 (MILES DE USD)
TABLA 425 MERCADO DE FÁRMACOS TÓPICOS PARA EL DOLOR OCULAR EN HUNGRÍA, POR VÍA DE ADMINISTRACIÓN, 2018-2032 (MILES DE USD)
TABLA 426 MERCADO DE INTRAOCULARES PARA EL DOLOR OCULAR EN HUNGRÍA, POR VÍA DE ADMINISTRACIÓN, 2018-2032 (MILES DE USD)
TABLA 427 MERCADO DE MEDICAMENTOS PERIOCULARES PARA EL DOLOR OCULAR EN HUNGRÍA, POR VÍA DE ADMINISTRACIÓN 2018-2032 (MILES DE USD)
TABLA 428 MERCADO DE FÁRMACOS ORALES PARA EL DOLOR OCULAR EN HUNGRÍA, POR VÍA DE ADMINISTRACIÓN, 2018-2032 (MILES DE USD)
TABLA 429 MERCADO HUNGRÍA PARA EL DOLOR OCULAR, POR TIPO DE MEDICAMENTO, 2018-2032 (MILES DE USD)
TABLA 430 MERCADO DEL DOLOR OCULAR EN HUNGRÍA, POR TIPO DE POBLACIÓN, 2018-2032 (MILES DE USD)
TABLA 431 MERCADO DEL DOLOR OCULAR EN HUNGRÍA, POR USUARIO FINAL, 2018-2032 (MILES DE USD)
TABLA 432 MERCADO DEL DOLOR OCULAR EN HUNGRÍA, POR CANAL DE DISTRIBUCIÓN, 2018-2032 (MILES DE USD)
TABLA 433 MERCADO DEL DOLOR OCULAR EN LITUANIA, POR TIPO DE ENFERMEDAD, 2018-2032 (MILES DE USD)
TABLA 434 LITUANIA DOLOR OCULAR CON ENFERMEDADES OCULARES EN EL MERCADO DEL DOLOR OCULAR, POR TIPO DE ENFERMEDAD, 2018-2032 (MILES DE USD)
TABLA 435 LITUANIA DOLOR OCULAR SIN ENFERMEDADES OCULARES PRIMARIAS EN EL MERCADO DE DOLOR OCULAR, POR TIPO DE ENFERMEDAD, 2018-2032 (MILES DE USD)
TABLA 436 MERCADO DEL DOLOR OCULAR EN LITUANIA, POR TIPO, 2018-2032 (MILES DE USD)
TABLA 437 MERCADO DE DIAGNÓSTICO DEL DOLOR OCULAR EN LITUANIA, POR TIPO, 2018-2032 (MILES DE USD)
TABLA 438 MERCADO DE PRUEBAS SENSORIALES PARA EL DOLOR OCULAR EN LITUANIA, POR TIPO, 2018-2032 (MILES DE USD)
TABLA 439 MERCADO DE PRUEBAS DE IMAGEN PARA EL DOLOR OCULAR EN LITUANIA, POR TIPO, 2018-2032 (MILES DE USD)
TABLA 440 MERCADO DE TRATAMIENTO DEL DOLOR OCULAR EN LITUANIA, POR TIPO, 2018-2032 (MILES DE USD)
TABLA 441 MERCADO DE TRATAMIENTO LOCAL DEL DOLOR OCULAR EN LITUANIA, POR TIPO, 2018-2032 (MILES DE USD)
TABLA 442 MERCADO DE ESTEROIDES TÓPICOS PARA EL DOLOR OCULAR EN LITUANIA, POR TIPO, 2018-2032 (MILES DE USD)
TABLA 443 MERCADO DE ANTIINFLAMATORIOS NO ESTEROIDES (AINE) PARA EL DOLOR OCULAR EN LITUANIA, POR TIPO, 2018-2032 (MILES DE USD)
TABLA 444 MERCADO DE TERAPIAS DE ESTIMULACIÓN PARA EL DOLOR OCULAR EN LITUANIA, POR TIPO, 2018-2032 (MILES DE USD)
TABLA 445 MERCADO DEL DOLOR OCULAR EN LITUANIA, POR APLICACIÓN, 2018-2032 (MILES DE USD)
TABLA 446 MERCADO DEL DOLOR OCULAR EN LITUANIA, POR VÍA DE ADMINISTRACIÓN, 2018-2032 (MILES DE USD)
TABLA 447 MERCADO DE FÁRMACOS TÓPICOS PARA EL DOLOR OCULAR EN LITUANIA, POR VÍA DE ADMINISTRACIÓN, 2018-2032 (MILES DE USD)
TABLA 448 MERCADO DE LITUANIA DE MEDICAMENTOS INTRAOCULARES PARA EL DOLOR OCULAR, POR VÍA DE ADMINISTRACIÓN, 2018-2032 (MILES DE USD)
TABLA 449 MERCADO DE PERIOCULARES PARA EL DOLOR OCULAR EN LITUANIA, POR VÍA DE ADMINISTRACIÓN 2018-2032 (MILES DE USD)
TABLA 450 MERCADO DE LITUANIA DE MEDICAMENTOS ORALES PARA EL DOLOR OCULAR, POR VÍA DE ADMINISTRACIÓN, 2018-2032 (MILES DE USD)
TABLA 451 MERCADO DEL DOLOR OCULAR EN LITUANIA, POR TIPO DE MEDICAMENTO, 2018-2032 (MILES DE USD)
TABLA 452 MERCADO DEL DOLOR OCULAR EN LITUANIA, POR TIPO DE POBLACIÓN, 2018-2032 (MILES DE USD)
TABLA 453 MERCADO DEL DOLOR OCULAR EN LITUANIA, POR USUARIO FINAL, 2018-2032 (MILES DE USD)
TABLA 454 MERCADO DEL DOLOR OCULAR EN LITUANIA, POR CANAL DE DISTRIBUCIÓN, 2018-2032 (MILES DE USD)
TABLA 455 MERCADO IRLANDÉS DEL DOLOR OCULAR, POR TIPO DE ENFERMEDAD, 2018-2032 (MILES DE USD)
TABLA 456 ENFERMEDADES OCULARES EN IRLANDA, MERCADO DE DOLOR OCULAR, POR TIPO DE ENFERMEDAD, 2018-2032 (MILES DE USD)
TABLA 457 IRLANDA DOLOR OCULAR SIN ENFERMEDADES OCULARES PRIMARIAS EN EL MERCADO DEL DOLOR OCULAR, POR TIPO DE ENFERMEDAD, 2018-2032 (MILES DE USD)
TABLA 458 MERCADO IRLANDÉS DEL DOLOR OCULAR, POR TIPO, 2018-2032 (MILES DE USD)
TABLA 459 MERCADO DE DIAGNÓSTICO DEL DOLOR OCULAR EN IRLANDA, POR TIPO, 2018-2032 (MILES DE USD)
TABLA 460 MERCADO IRLANDÉS DE PRUEBAS SENSORIALES PARA EL DOLOR OCULAR, POR TIPO, 2018-2032 (MILES DE USD)
TABLA 461 MERCADO IRLANDÉS DE PRUEBAS DE IMAGEN PARA EL DOLOR OCULAR, POR TIPO, 2018-2032 (MILES DE USD)
TABLA 462 TRATAMIENTO DEL DOLOR OCULAR EN IRLANDA, POR TIPO, 2018-2032 (MILES DE USD)
TABLA 463 MERCADO DE TRATAMIENTO LOCAL DEL DOLOR OCULAR EN IRLANDA, POR TIPO, 2018-2032 (MILES DE USD)
TABLA 464 MERCADO IRLANDÉS DE ESTEROIDES TÓPICOS PARA EL DOLOR OCULAR, POR TIPO, 2018-2032 (MILES DE USD)
TABLA 465 MERCADO IRLANDÉS DE ANTIINFLAMATORIOS NO ESTEROIDES (AINE) PARA EL DOLOR OCULAR, POR TIPO, 2018-2032 (MILES DE USD)
TABLA 466 MERCADO IRLANDÉS DE TERAPIAS DE ESTIMULACIÓN PARA EL DOLOR OCULAR, POR TIPO, 2018-2032 (MILES DE USD)
TABLA 467 MERCADO IRLANDÉS DEL DOLOR OCULAR, POR APLICACIÓN, 2018-2032 (MILES DE USD)
TABLA 468 MERCADO IRLANDÉS DEL DOLOR OCULAR, POR VÍA DE ADMINISTRACIÓN, 2018-2032 (MILES DE USD)
TABLA 469 MERCADO IRLANDÉS DE PRODUCTOS TÓPICOS PARA EL DOLOR OCULAR, POR VÍA DE ADMINISTRACIÓN, 2018-2032 (MILES DE USD)
TABLA 470 MERCADO IRLANDÉS DE FARMACIA INTRAOCULAR PARA EL DOLOR OCULAR, POR VÍA DE ADMINISTRACIÓN, 2018-2032 (MILES DE USD)
TABLA 471 MERCADO IRLANDÉS DE MEDICAMENTOS PERIOCULARES PARA EL DOLOR OCULAR, POR VÍA DE ADMINISTRACIÓN 2018-2032 (MILES DE USD)
TABLA 472 MERCADO IRLANDÉS DE MEDICAMENTOS ORALES PARA EL DOLOR OCULAR, POR VÍA DE ADMINISTRACIÓN, 2018-2032 (MILES DE USD)
TABLA 473 MERCADO IRLANDÉS DEL DOLOR OCULAR, POR TIPO DE MEDICAMENTO, 2018-2032 (MILES DE USD)
TABLA 474 MERCADO IRLANDÉS DEL DOLOR OCULAR, POR TIPO DE POBLACIÓN, 2018-2032 (MILES DE USD)
TABLA 475 MERCADO IRLANDÉS DEL DOLOR OCULAR, POR USUARIO FINAL, 2018-2032 (MILES DE USD)
TABLA 476 MERCADO IRLANDÉS DEL DOLOR OCULAR, POR CANAL DE DISTRIBUCIÓN, 2018-2032 (MILES DE USD)
TABLA 477 MERCADO POLONIANO DEL DOLOR OCULAR, POR TIPO DE ENFERMEDAD, 2018-2032 (MILES DE USD)
TABLA 478 POLONIA DOLOR OCULAR CON ENFERMEDADES OCULARES EN EL MERCADO DEL DOLOR OCULAR, POR TIPO DE ENFERMEDAD, 2018-2032 (MILES DE USD)
TABLA 479 POLONIA DOLOR OCULAR SIN ENFERMEDADES OCULARES PRIMARIAS EN EL MERCADO DE DOLOR OCULAR, POR TIPO DE ENFERMEDAD, 2018-2032 (MILES DE USD)
TABLA 480 MERCADO POLONIANO DEL DOLOR OCULAR, POR TIPO, 2018-2032 (MILES DE USD)
TABLA 481 POLONIA DIAGNÓSTICO EN EL MERCADO DEL DOLOR OCULAR, POR TIPO, 2018-2032 (MILES DE USD)
TABLA 482 MERCADO DE PRUEBAS SENSORIALES PARA EL DOLOR OCULAR EN POLONIA, POR TIPO, 2018-2032 (MILES DE USD)
TABLA 483 MERCADO DE PRUEBAS DE IMAGEN PARA EL DOLOR OCULAR EN POLONIA, POR TIPO, 2018-2032 (MILES DE USD)
TABLA 484 MERCADO DE TRATAMIENTO DEL DOLOR OCULAR EN POLONIA, POR TIPO, 2018-2032 (MILES DE USD)
TABLA 485 MERCADO DE TRATAMIENTO LOCAL DEL DOLOR OCULAR EN POLONIA, POR TIPO, 2018-2032 (MILES DE USD)
TABLA 486 MERCADO DE ESTEROIDES TÓPICOS PARA EL DOLOR OCULAR EN POLONIA, POR TIPO, 2018-2032 (MILES DE USD)
TABLA 487 MERCADO DE ANTIINFLAMATORIOS NO ESTEROIDES (AINE) PARA EL DOLOR OCULAR EN POLONIA, POR TIPO, 2018-2032 (MILES DE USD)
TABLA 488 MERCADO DE TERAPIAS DE ESTIMULACIÓN PARA EL DOLOR OCULAR EN POLONIA, POR TIPO, 2018-2032 (MILES DE USD)
TABLA 489 MERCADO POLONIANO DEL DOLOR OCULAR, POR APLICACIÓN, 2018-2032 (MILES DE USD)
TABLA 490 MERCADO POLONIANO DEL DOLOR OCULAR, POR VÍA DE ADMINISTRACIÓN, 2018-2032 (MILES DE USD)
TABLA 491 MERCADO DE POLONIA DE MEDICAMENTOS TÓPICOS PARA EL DOLOR OCULAR, POR VÍA DE ADMINISTRACIÓN, 2018-2032 (MILES DE USD)
TABLA 492 MERCADO POLONIANO DE FARMACÉUTICA INTRAOCULAR PARA EL DOLOR OCULAR, POR VÍA DE ADMINISTRACIÓN, 2018-2032 (MILES DE USD)
TABLA 493 MERCADO DE POLONIA DE MEDICAMENTOS PERIOCULARES PARA EL DOLOR OCULAR, POR VÍA DE ADMINISTRACIÓN 2018-2032 (MILES DE USD)
TABLA 494 MERCADO DE POLONIA DE MEDICAMENTOS ORALES PARA EL DOLOR OCULAR, POR VÍA DE ADMINISTRACIÓN, 2018-2032 (MILES DE USD)
TABLA 495 MERCADO POLONIANO DEL DOLOR OCULAR, POR TIPO DE MEDICAMENTO, 2018-2032 (MILES DE USD)
TABLA 496 MERCADO DE DOLOR OCULAR EN POLONIA, POR TIPO DE POBLACIÓN, 2018-2032 (MILES DE USD)
TABLA 497 MERCADO POLONIANO DEL DOLOR OCULAR, POR USUARIO FINAL, 2018-2032 (MILES DE USD)
TABLA 498 MERCADO POLONIANO DEL DOLOR OCULAR, POR CANAL DE DISTRIBUCIÓN, 2018-2032 (MILES DE USD)
TABLA 499 RESTO DE EUROPA MERCADO DEL DOLOR OCULAR, POR TIPO DE ENFERMEDAD, 2018-2032 (MILES DE USD)
TABLA 500 MERCADO DEL DOLOR OCULAR EN ASIA-PACÍFICO, POR PAÍS, 2018-2032 (MILES DE USD)
TABLA 501 MERCADO DEL DOLOR OCULAR EN ASIA-PACÍFICO, POR TIPO DE ENFERMEDAD, 2018-2032 (MILES DE USD)
TABLA 502 DOLOR OCULAR EN ASIA-PACÍFICO CON ENFERMEDADES OCULARES EN EL MERCADO DEL DOLOR OCULAR, POR TIPO DE ENFERMEDAD, 2018-2032 (MILES DE USD)
TABLA 503 DOLOR OCULAR EN ASIA-PACÍFICO SIN ENFERMEDADES OCULARES PRIMARIAS EN EL MERCADO DEL DOLOR OCULAR, POR TIPO DE ENFERMEDAD, 2018-2032 (MILES DE USD)
TABLA 504 MERCADO DEL DOLOR OCULAR EN ASIA-PACÍFICO, POR TIPO, 2018-2032 (MILES DE USD)
TABLA 505 MERCADO DE DIAGNÓSTICO DEL DOLOR OCULAR EN ASIA-PACÍFICO, POR TIPO, 2018-2032 (MILES DE USD)
TABLA 506 MERCADO DE PRUEBAS SENSORIALES PARA EL DOLOR OCULAR EN ASIA-PACÍFICO, POR TIPO, 2018-2032 (MILES DE USD)
TABLA 507 MERCADO DE PRUEBAS DE IMAGEN PARA EL DOLOR OCULAR EN ASIA-PACÍFICO, POR TIPO, 2018-2032 (MILES DE USD)
TABLA 508 MERCADO DE TRATAMIENTO DEL DOLOR OCULAR EN ASIA-PACÍFICO, POR TIPO, 2018-2032 (MILES DE USD)
TABLA 509 MERCADO DE TRATAMIENTO LOCAL DEL DOLOR OCULAR EN ASIA-PACÍFICO, POR TIPO, 2018-2032 (MILES DE USD)
TABLA 510 MERCADO DE ESTEROIDES TÓPICOS PARA EL DOLOR OCULAR EN ASIA-PACÍFICO, POR TIPO, 2018-2032 (MILES DE USD)
TABLA 511 MERCADO DE ANTIINFLAMATORIOS NO ESTEROIDES (AINE) PARA EL DOLOR OCULAR EN ASIA-PACÍFICO, POR TIPO, 2018-2032 (MILES DE USD)
TABLA 512 MERCADO DE TERAPIAS DE ESTIMULACIÓN PARA EL DOLOR OCULAR EN ASIA-PACÍFICO, POR TIPO, 2018-2032 (MILES DE USD)
TABLA 513 MERCADO DEL DOLOR OCULAR EN ASIA-PACÍFICO, POR APLICACIÓN, 2018-2032 (MILES DE USD)
TABLA 514 MERCADO DEL DOLOR OCULAR EN ASIA-PACÍFICO, POR VÍA DE ADMINISTRACIÓN, 2018-2032 (MILES DE USD)
TABLA 515 MERCADO DE FÁRMACOS TÓPICOS PARA EL DOLOR OCULAR EN ASIA-PACÍFICO, POR VÍA DE ADMINISTRACIÓN, 2018-2032 (MILES DE USD)
TABLA 516 MERCADO DE INTRAOCULARES PARA EL DOLOR OCULAR EN ASIA-PACÍFICO, POR VÍA DE ADMINISTRACIÓN, 2018-2032 (MILES DE USD)
TABLA 517 MERCADO DE ANTIDOLOR OCULAR PERIOCULAR DE ASIA-PACÍFICO, POR VÍA DE ADMINISTRACIÓN 2018-2032 (MILES DE USD)
TABLA 518 MERCADO DE ASIA-PACÍFICO DE MEDICAMENTOS ORALES PARA EL DOLOR OCULAR, POR VÍA DE ADMINISTRACIÓN, 2018-2032 (MILES DE USD)
TABLA 519 MERCADO DEL DOLOR OCULAR EN ASIA-PACÍFICO, POR TIPO DE MEDICAMENTO, 2018-2032 (MILES DE USD)
TABLA 520 MERCADO DEL DOLOR OCULAR EN ASIA-PACÍFICO, POR TIPO DE POBLACIÓN, 2018-2032 (MILES DE USD)
TABLA 521 MERCADO DEL DOLOR OCULAR EN ASIA-PACÍFICO, POR USUARIO FINAL, 2018-2032 (MILES DE USD)
TABLA 522 MERCADO DEL DOLOR OCULAR EN ASIA-PACÍFICO, POR CANAL DE DISTRIBUCIÓN, 2018-2032 (MILES DE USD)
TABLA 523 MERCADO DEL DOLOR OCULAR EN JAPÓN, POR TIPO DE ENFERMEDAD, 2018-2032 (MILES DE USD)
TABLA 524 DOLOR OCULAR EN JAPÓN CON ENFERMEDADES OCULARES EN EL MERCADO DEL DOLOR OCULAR, POR TIPO DE ENFERMEDAD, 2018-2032 (MILES DE USD)
TABLA 525 DOLOR OCULAR EN JAPÓN SIN ENFERMEDADES OCULARES PRIMARIAS EN EL MERCADO DEL DOLOR OCULAR, POR TIPO DE ENFERMEDAD, 2018-2032 (MILES DE USD)
TABLA 526 MERCADO DEL DOLOR OCULAR EN JAPÓN, POR TIPO, 2018-2032 (MILES DE USD)
TABLA 527 MERCADO DE DIAGNÓSTICO DEL DOLOR OCULAR EN JAPÓN, POR TIPO, 2018-2032 (MILES DE USD)
TABLA 528 MERCADO DE PRUEBAS SENSORIALES PARA EL DOLOR OCULAR EN JAPÓN, POR TIPO, 2018-2032 (MILES DE USD)
TABLA 529 MERCADO DE PRUEBAS DE IMAGEN EN JAPÓN PARA EL DOLOR OCULAR, POR TIPO, 2018-2032 (MILES DE USD)
TABLA 530 MERCADO DE TRATAMIENTO DEL DOLOR OCULAR EN JAPÓN, POR TIPO, 2018-2032 (MILES DE USD)
TABLA 531 MERCADO DE TRATAMIENTO LOCAL DEL DOLOR OCULAR EN JAPÓN, POR TIPO, 2018-2032 (MILES DE USD)
TABLA 532 MERCADO DE ESTEROIDES TÓPICOS PARA EL DOLOR OCULAR EN JAPÓN, POR TIPO, 2018-2032 (MILES DE USD)
TABLA 533 MERCADO DE ANTIINFLAMATORIOS NO ESTEROIDES (AINE) PARA EL DOLOR OCULAR EN JAPÓN, POR TIPO, 2018-2032 (MILES DE USD)
TABLA 534 MERCADO DE TERAPIAS DE ESTIMULACIÓN PARA EL DOLOR OCULAR EN JAPÓN, POR TIPO, 2018-2032 (MILES DE USD)
TABLA 535 MERCADO DEL DOLOR OCULAR EN JAPÓN, POR APLICACIÓN, 2018-2032 (MILES DE USD)
TABLA 536 MERCADO DEL DOLOR OCULAR EN JAPÓN, POR VÍA DE ADMINISTRACIÓN, 2018-2032 (MILES DE USD)
TABLA 537 MERCADO DE PRODUCTOS TÓPICOS PARA EL DOLOR OCULAR EN JAPÓN, POR VÍA DE ADMINISTRACIÓN, 2018-2032 (MILES DE USD)
TABLA 538 MERCADO DE INTRAOCULARES PARA EL DOLOR OCULAR EN JAPÓN, POR VÍA DE ADMINISTRACIÓN, 2018-2032 (MILES DE USD)
TABLA 539 MERCADO DE MEDICAMENTOS PERIOCULARES PARA EL DOLOR OCULAR EN JAPÓN, POR VÍA DE ADMINISTRACIÓN 2018-2032 (MILES DE USD)
TABLA 540 MERCADO JAPONÉS DE MEDICAMENTOS ORALES PARA EL DOLOR OCULAR, POR VÍA DE ADMINISTRACIÓN, 2018-2032 (MILES DE USD)
TABLA 541 MERCADO DEL DOLOR OCULAR EN JAPÓN, POR TIPO DE MEDICAMENTO, 2018-2032 (MILES DE USD)
TABLA 542 MERCADO DEL DOLOR OCULAR EN JAPÓN, POR TIPO DE POBLACIÓN, 2018-2032 (MILES DE USD)
TABLA 543 MERCADO DEL DOLOR OCULAR EN JAPÓN, POR USUARIO FINAL, 2018-2032 (MILES DE USD)
TABLA 544 MERCADO DEL DOLOR OCULAR EN JAPÓN, POR CANAL DE DISTRIBUCIÓN, 2018-2032 (MILES DE USD)
TABLA 545 MERCADO DE DOLOR OCULAR EN CHINA, POR TIPO DE ENFERMEDAD, 2018-2032 (MILES DE USD)
TABLA 546 DOLOR OCULAR EN CHINA CON ENFERMEDADES OCULARES EN EL MERCADO DEL DOLOR OCULAR, POR TIPO DE ENFERMEDAD, 2018-2032 (MILES DE USD)
TABLA 547 DOLOR OCULAR EN CHINA SIN ENFERMEDADES OCULARES PRIMARIAS EN EL MERCADO DEL DOLOR OCULAR, POR TIPO DE ENFERMEDAD, 2018-2032 (MILES DE USD)
TABLA 548 MERCADO DEL DOLOR OCULAR EN CHINA, POR TIPO, 2018-2032 (MILES DE USD)
TABLA 549 DIAGNÓSTICO DEL DOLOR OCULAR EN CHINA, POR TIPO, 2018-2032 (MILES DE USD)
TABLA 550 MERCADO DE PRUEBAS SENSORIALES PARA EL DOLOR OCULAR EN CHINA, POR TIPO, 2018-2032 (MILES DE USD)
TABLA 551 MERCADO DE PRUEBAS DE IMAGEN PARA EL DOLOR OCULAR EN CHINA, POR TIPO, 2018-2032 (MILES DE USD)
TABLA 552 MERCADO DE TRATAMIENTO DEL DOLOR OCULAR EN CHINA, POR TIPO, 2018-2032 (MILES DE USD)
TABLA 553 MERCADO DE TRATAMIENTO LOCAL DEL DOLOR OCULAR EN CHINA, POR TIPO, 2018-2032 (MILES DE USD)
TABLA 554 MERCADO DE ESTEROIDES TÓPICOS PARA EL DOLOR OCULAR EN CHINA, POR TIPO, 2018-2032 (MILES DE USD)
TABLA 555 MERCADO DE ANTIINFLAMATORIOS NO ESTEROIDES (AINE) PARA EL DOLOR OCULAR EN CHINA, POR TIPO, 2018-2032 (MILES DE USD)
TABLA 556 MERCADO DE TERAPIAS DE ESTIMULACIÓN PARA EL DOLOR OCULAR EN CHINA, POR TIPO, 2018-2032 (MILES DE USD)
TABLA 557 MERCADO DE DOLOR OCULAR EN CHINA, POR APLICACIÓN, 2018-2032 (MILES DE USD)
TABLA 558 MERCADO DEL DOLOR OCULAR EN CHINA, POR VÍA DE ADMINISTRACIÓN, 2018-2032 (MILES DE USD)
TABLA 559 MERCADO DE PRODUCTOS TÓPICOS PARA EL DOLOR OCULAR EN CHINA, POR VÍA DE ADMINISTRACIÓN, 2018-2032 (MILES DE USD)
TABLA 560 MERCADO DE INTRAOCULARES PARA EL DOLOR OCULAR EN CHINA, POR VÍA DE ADMINISTRACIÓN, 2018-2032 (MILES DE USD)
TABLA 561 MERCADO DE ANTIDOLOR OCULAR PERIOCULAR EN CHINA, POR VÍA DE ADMINISTRACIÓN 2018-2032 (MILES DE USD)
TABLA 562 MERCADO DE USO ORAL PARA EL DOLOR OCULAR EN CHINA, POR VÍA DE ADMINISTRACIÓN, 2018-2032 (MILES DE USD)
TABLA 563 MERCADO DEL DOLOR OCULAR EN CHINA, POR TIPO DE MEDICAMENTO, 2018-2032 (MILES DE USD)
TABLA 564 MERCADO DEL DOLOR OCULAR EN CHINA, POR TIPO DE POBLACIÓN, 2018-2032 (MILES DE USD)
TABLA 565 MERCADO DE DOLOR OCULAR EN CHINA, POR USUARIO FINAL, 2018-2032 (MILES DE USD)
TABLA 566 MERCADO DEL DOLOR OCULAR EN CHINA, POR CANAL DE DISTRIBUCIÓN, 2018-2032 (MILES DE USD)
TABLA 567 MERCADO DEL DOLOR OCULAR EN LA INDIA, POR TIPO DE ENFERMEDAD, 2018-2032 (MILES DE USD)
TABLA 568 INDIA DOLOR OCULAR CON ENFERMEDADES OCULARES EN EL MERCADO DEL DOLOR OCULAR, POR TIPO DE ENFERMEDAD, 2018-2032 (MILES DE USD)
TABLA 569 DOLOR OCULAR SIN ENFERMEDADES OCULARES PRIMARIAS EN EL MERCADO DE DOLOR OCULAR EN INDIA, POR TIPO DE ENFERMEDAD, 2018-2032 (MILES DE USD)
TABLA 570 MERCADO DEL DOLOR OCULAR EN LA INDIA, POR TIPO, 2018-2032 (MILES DE USD)
TABLA 571 DIAGNÓSTICO DEL DOLOR OCULAR EN EL MERCADO DE INDIA, POR TIPO, 2018-2032 (MILES DE USD)
TABLA 572 MERCADO DE PRUEBAS SENSORIALES PARA EL DOLOR OCULAR EN INDIA, POR TIPO, 2018-2032 (MILES DE USD)
TABLA 573 MERCADO DE PRUEBAS DE IMAGEN PARA EL DOLOR OCULAR EN INDIA, POR TIPO, 2018-2032 (MILES DE USD)
TABLA 574 TRATAMIENTO DEL DOLOR OCULAR EN INDIA, POR TIPO, 2018-2032 (MILES DE USD)
TABLA 575 TRATAMIENTO LOCAL DEL DOLOR OCULAR EN INDIA, POR TIPO, 2018-2032 (MILES DE USD)
TABLA 576 MERCADO DE ESTEROIDES TÓPICOS PARA EL DOLOR OCULAR EN INDIA, POR TIPO, 2018-2032 (MILES DE USD)
TABLA 577 MERCADO DE ANTIINFLAMATORIOS NO ESTEROIDES (AINE) PARA EL DOLOR OCULAR EN INDIA, POR TIPO, 2018-2032 (MILES DE USD)
TABLA 578 MERCADO DE TERAPIAS DE ESTIMULACIÓN PARA EL DOLOR OCULAR EN INDIA, POR TIPO, 2018-2032 (MILES DE USD)
TABLA 579 MERCADO DEL DOLOR OCULAR EN LA INDIA, POR APLICACIÓN, 2018-2032 (MILES DE USD)
TABLA 580 MERCADO DEL DOLOR OCULAR EN LA INDIA, POR VÍA DE ADMINISTRACIÓN, 2018-2032 (MILES DE USD)
TABLA 581 MERCADO DE FÁRMACOS TÓPICOS PARA EL DOLOR OCULAR EN INDIA, POR VÍA DE ADMINISTRACIÓN, 2018-2032 (MILES DE USD)
TABLA 582 MERCADO DE INDIA PARA EL DOLOR OCULAR INTRAOCULAR, POR VÍA DE ADMINISTRACIÓN, 2018-2032 (MILES DE USD)
TABLA 583 MERCADO DE MEDICAMENTOS PERIOCULARES PARA EL DOLOR OCULAR EN INDIA, POR VÍA DE ADMINISTRACIÓN 2018-2032 (MILES DE USD)
TABLA 584 MERCADO DE MEDICAMENTOS ORALES PARA EL DOLOR OCULAR EN INDIA, POR VÍA DE ADMINISTRACIÓN, 2018-2032 (MILES DE USD)
TABLA 585 MERCADO DEL DOLOR OCULAR EN LA INDIA, POR TIPO DE MEDICAMENTO, 2018-2032 (MILES DE USD)
TABLA 586 MERCADO DEL DOLOR OCULAR EN LA INDIA, POR TIPO DE POBLACIÓN, 2018-2032 (MILES DE USD)
TABLA 587 MERCADO DEL DOLOR OCULAR EN LA INDIA, POR USUARIO FINAL, 2018-2032 (MILES DE USD)
TABLA 588 MERCADO DEL DOLOR OCULAR EN LA INDIA, POR CANAL DE DISTRIBUCIÓN, 2018-2032 (MILES DE USD)
TABLA 589 MERCADO DE DOLOR OCULAR DE COREA DEL SUR, POR TIPO DE ENFERMEDAD, 2018-2032 (MILES DE USD)
TABLA 590 COREA DEL SUR DOLOR OCULAR CON ENFERMEDADES OCULARES EN EL MERCADO DEL DOLOR OCULAR, POR TIPO DE ENFERMEDAD, 2018-2032 (MILES DE USD)
TABLA 591 COREA DEL SUR DOLOR OCULAR SIN ENFERMEDADES OCULARES PRIMARIAS EN EL MERCADO DE DOLOR OCULAR, POR TIPO DE ENFERMEDAD, 2018-2032 (MILES DE USD)
TABLA 592 MERCADO DEL DOLOR OCULAR EN COREA DEL SUR, POR TIPO, 2018-2032 (MILES DE USD)
TABLA 593 MERCADO DE DIAGNÓSTICO DEL DOLOR OCULAR EN COREA DEL SUR, POR TIPO, 2018-2032 (MILES DE USD)
TABLA 594 MERCADO DE PRUEBAS SENSORIALES PARA EL DOLOR OCULAR EN COREA DEL SUR, POR TIPO, 2018-2032 (MILES DE USD)
TABLA 595 MERCADO DE PRUEBAS DE IMAGEN PARA EL DOLOR OCULAR EN COREA DEL SUR, POR TIPO, 2018-2032 (MILES DE USD)
TABLA 596 MERCADO DE TRATAMIENTO DEL DOLOR OCULAR EN COREA DEL SUR, POR TIPO, 2018-2032 (MILES DE USD)
TABLA 597 MERCADO DE TRATAMIENTO LOCAL DEL DOLOR OCULAR EN COREA DEL SUR, POR TIPO, 2018-2032 (MILES DE USD)
TABLA 598 MERCADO DE ESTEROIDES TÓPICOS PARA EL DOLOR OCULAR EN COREA DEL SUR, POR TIPO, 2018-2032 (MILES DE USD)
TABLA 599 MERCADO DE ANTIINFLAMATORIOS NO ESTEROIDES (AINE) PARA EL DOLOR OCULAR EN COREA DEL SUR, POR TIPO, 2018-2032 (MILES DE USD)
TABLA 600 MERCADO DE TERAPIAS DE ESTIMULACIÓN PARA EL DOLOR OCULAR EN COREA DEL SUR, POR TIPO, 2018-2032 (MILES DE USD)
TABLA 601 MERCADO DE DOLOR OCULAR DE COREA DEL SUR, POR APLICACIÓN, 2018-2032 (MILES DE USD)
TABLA 602 MERCADO DEL DOLOR OCULAR EN COREA DEL SUR, POR VÍA DE ADMINISTRACIÓN, 2018-2032 (MILES DE USD)
TABLA 603 MERCADO DE PRODUCTOS TÓPICOS PARA EL DOLOR OCULAR EN COREA DEL SUR, POR VÍA DE ADMINISTRACIÓN, 2018-2032 (MILES DE USD)
TABLA 604 MERCADO DE INTRAOCULARES PARA EL DOLOR OCULAR EN COREA DEL SUR, POR VÍA DE ADMINISTRACIÓN, 2018-2032 (MILES DE USD)
TABLA 605 MERCADO DE MEDICAMENTOS PERIOCULARES PARA EL DOLOR OCULAR EN COREA DEL SUR, POR VÍA DE ADMINISTRACIÓN 2018-2032 (MILES DE USD)
TABLA 606 MERCADO DE COREA DEL SUR DE MEDICAMENTOS ORALES PARA EL DOLOR OCULAR, POR VÍA DE ADMINISTRACIÓN, 2018-2032 (MILES DE USD)
TABLA 607 MERCADO DEL DOLOR OCULAR EN COREA DEL SUR, POR TIPO DE MEDICAMENTO, 2018-2032 (MILES DE USD)
TABLA 608 MERCADO DEL DOLOR OCULAR EN COREA DEL SUR, POR TIPO DE POBLACIÓN, 2018-2032 (MILES DE USD)
TABLA 609 MERCADO DE DOLOR OCULAR DE COREA DEL SUR, POR USUARIO FINAL, 2018-2032 (MILES DE USD)
TABLA 610 MERCADO DEL DOLOR OCULAR EN COREA DEL SUR, POR CANAL DE DISTRIBUCIÓN, 2018-2032 (MILES DE USD)
TABLA 611 MERCADO DE DOLOR OCULAR EN AUSTRALIA, POR TIPO DE ENFERMEDAD, 2018-2032 (MILES DE USD)
TABLA 612 AUSTRALIA DOLOR OCULAR CON ENFERMEDADES OCULARES EN EL MERCADO DEL DOLOR OCULAR, POR TIPO DE ENFERMEDAD, 2018-2032 (MILES DE USD)
TABLA 613 AUSTRALIA DOLOR OCULAR SIN ENFERMEDADES OCULARES PRIMARIAS EN EL MERCADO DEL DOLOR OCULAR, POR TIPO DE ENFERMEDAD, 2018-2032 (MILES DE USD)
TABLA 614 MERCADO AUSTRALIANO DEL DOLOR OCULAR, POR TIPO, 2018-2032 (MILES DE USD)
TABLA 615 MERCADO DE DIAGNÓSTICO DEL DOLOR OCULAR EN AUSTRALIA, POR TIPO, 2018-2032 (MILES DE USD)
TABLA 616 MERCADO DE PRUEBAS SENSORIALES PARA EL DOLOR OCULAR EN AUSTRALIA, POR TIPO, 2018-2032 (MILES DE USD)
TABLA 617 MERCADO DE PRUEBAS DE IMAGEN PARA EL DOLOR OCULAR EN AUSTRALIA, POR TIPO, 2018-2032 (MILES DE USD)
TABLA 618 MERCADO DE TRATAMIENTO DEL DOLOR OCULAR EN AUSTRALIA, POR TIPO, 2018-2032 (MILES DE USD)
TABLA 619 MERCADO AUSTRALIANO DE TRATAMIENTO LOCAL DEL DOLOR OCULAR, POR TIPO, 2018-2032 (MILES DE USD)
TABLA 620 MERCADO DE ESTEROIDES TÓPICOS PARA EL DOLOR OCULAR EN AUSTRALIA, POR TIPO, 2018-2032 (MILES DE USD)
TABLA 621 MERCADO DE ANTIINFLAMATORIOS NO ESTEROIDES (AINE) PARA EL DOLOR OCULAR EN AUSTRALIA, POR TIPO, 2018-2032 (MILES DE USD)
TABLA 622 MERCADO DE TERAPIAS DE ESTIMULACIÓN PARA EL DOLOR OCULAR EN AUSTRALIA, POR TIPO, 2018-2032 (MILES DE USD)
TABLA 623 MERCADO AUSTRALIANO DEL DOLOR OCULAR, POR APLICACIÓN, 2018-2032 (MILES DE USD)
TABLA 624 MERCADO AUSTRALIANO DEL DOLOR OCULAR, POR VÍA DE ADMINISTRACIÓN, 2018-2032 (MILES DE USD)
TABLA 625 MERCADO DE AUSTRALIA DE FÁRMACOS TÓPICOS PARA EL DOLOR OCULAR, POR VÍA DE ADMINISTRACIÓN, 2018-2032 (MILES DE USD)
TABLA 626 MERCADO DE AUSTRALIA DE MEDICAMENTOS INTRAOCULARES PARA EL DOLOR OCULAR, POR VÍA DE ADMINISTRACIÓN, 2018-2032 (MILES DE USD)
TABLA 627 MERCADO DE AUSTRALIA DE MEDICAMENTOS PERIOCULARES PARA EL DOLOR OCULAR, POR VÍA DE ADMINISTRACIÓN 2018-2032 (MILES DE USD)
TABLA 628 MERCADO DE AUSTRALIA DE MEDICAMENTOS ORALES PARA EL DOLOR OCULAR, POR VÍA DE ADMINISTRACIÓN, 2018-2032 (MILES DE USD)
TABLA 629 MERCADO AUSTRALIANO DEL DOLOR OCULAR, POR TIPO DE MEDICAMENTO, 2018-2032 (MILES DE USD)
TABLA 630 MERCADO DE DOLOR OCULAR EN AUSTRALIA, POR TIPO DE POBLACIÓN, 2018-2032 (MILES DE USD)
TABLA 631 MERCADO AUSTRALIANO DEL DOLOR OCULAR, POR USUARIO FINAL, 2018-2032 (MILES DE USD)
TABLA 632 MERCADO AUSTRALIANO DEL DOLOR OCULAR, POR CANAL DE DISTRIBUCIÓN, 2018-2032 (MILES DE USD)
TABLA 633 MERCADO DEL DOLOR OCULAR EN SINGAPUR, POR TIPO DE ENFERMEDAD, 2018-2032 (MILES DE USD)
TABLA 634 DOLOR OCULAR EN SINGAPUR CON ENFERMEDADES OCULARES EN EL MERCADO DEL DOLOR OCULAR, POR TIPO DE ENFERMEDAD, 2018-2032 (MILES DE USD)
TABLA 635 DOLOR OCULAR SIN ENFERMEDADES OCULARES PRIMARIAS EN EL MERCADO DE DOLOR OCULAR EN SINGAPUR, POR TIPO DE ENFERMEDAD, 2018-2032 (MILES DE USD)
TABLA 636 MERCADO DEL DOLOR OCULAR EN SINGAPUR, POR TIPO, 2018-2032 (MILES DE USD)
TABLA 637 MERCADO DE DIAGNÓSTICO DEL DOLOR OCULAR EN SINGAPUR, POR TIPO, 2018-2032 (MILES DE USD)
TABLA 638 MERCADO DE PRUEBAS SENSORIALES PARA EL DOLOR OCULAR EN SINGAPUR, POR TIPO, 2018-2032 (MILES DE USD)
TABLA 639 MERCADO DE PRUEBAS DE IMAGEN PARA EL DOLOR OCULAR EN SINGAPUR, POR TIPO, 2018-2032 (MILES DE USD)
TABLA 640 MERCADO DE TRATAMIENTO DEL DOLOR OCULAR EN SINGAPUR, POR TIPO, 2018-2032 (MILES DE USD)
TABLA 641 MERCADO DE TRATAMIENTO LOCAL DEL DOLOR OCULAR EN SINGAPUR, POR TIPO, 2018-2032 (MILES DE USD)
TABLA 642 MERCADO DE ESTEROIDES TÓPICOS PARA EL DOLOR OCULAR EN SINGAPUR, POR TIPO, 2018-2032 (MILES DE USD)
TABLA 643 MERCADO DE ANTIINFLAMATORIOS NO ESTEROIDES (AINE) PARA EL DOLOR OCULAR EN SINGAPUR, POR TIPO, 2018-2032 (MILES DE USD)
TABLA 644 MERCADO DE TERAPIAS DE ESTIMULACIÓN PARA EL DOLOR OCULAR EN SINGAPUR, POR TIPO, 2018-2032 (MILES DE USD)
TABLA 645 MERCADO DEL DOLOR OCULAR EN SINGAPUR, POR APLICACIÓN, 2018-2032 (MILES DE USD)
TABLA 646 MERCADO DEL DOLOR OCULAR EN SINGAPUR, POR VÍA DE ADMINISTRACIÓN, 2018-2032 (MILES DE USD)
TABLA 647 MERCADO DE SINGAPUR DE FÁRMACOS TÓPICOS PARA EL DOLOR OCULAR, POR VÍA DE ADMINISTRACIÓN, 2018-2032 (MILES DE USD)
TABLA 648 MERCADO DE SINGAPUR DE MEDICAMENTOS INTRAOCULARES PARA EL DOLOR OCULAR, POR VÍA DE ADMINISTRACIÓN, 2018-2032 (MILES DE USD)
TABLA 649 MERCADO DE SINGAPUR DE MEDICAMENTOS PERIOCULARES PARA EL DOLOR OCULAR, POR VÍA DE ADMINISTRACIÓN 2018-2032 (MILES DE USD)
TABLA 650 MERCADO DE SINGAPUR DE MEDICAMENTOS ORALES PARA EL DOLOR OCULAR, POR VÍA DE ADMINISTRACIÓN, 2018-2032 (MILES DE USD)
TABLA 651 MERCADO DEL DOLOR OCULAR EN SINGAPUR, POR TIPO DE MEDICAMENTO, 2018-2032 (MILES DE USD)
TABLA 652 MERCADO DEL DOLOR OCULAR EN SINGAPUR, POR TIPO DE POBLACIÓN, 2018-2032 (MILES DE USD)
TABLA 653 MERCADO DEL DOLOR OCULAR EN SINGAPUR, POR USUARIO FINAL, 2018-2032 (MILES DE USD)
TABLA 654 MERCADO DEL DOLOR OCULAR EN SINGAPUR, POR CANAL DE DISTRIBUCIÓN, 2018-2032 (MILES DE USD)
TABLA 655 MERCADO DE DOLOR OCULAR EN TAILANDIA, POR TIPO DE ENFERMEDAD, 2018-2032 (MILES DE USD)
TABLA 656 DOLOR OCULAR EN TAILANDIA CON ENFERMEDADES OCULARES EN EL MERCADO DEL DOLOR OCULAR, POR TIPO DE ENFERMEDAD, 2018-2032 (MILES DE USD)
TABLA 657 DOLOR OCULAR EN TAILANDIA SIN ENFERMEDADES OCULARES PRIMARIAS EN EL MERCADO DEL DOLOR OCULAR, POR TIPO DE ENFERMEDAD, 2018-2032 (MILES DE USD)
TABLA 658 MERCADO DEL DOLOR OCULAR EN TAILANDIA, POR TIPO, 2018-2032 (MILES DE USD)
TABLA 659 DIAGNÓSTICO DEL DOLOR OCULAR EN EL MERCADO DE TAILANDIA, POR TIPO, 2018-2032 (MILES DE USD)
TABLA 660 MERCADO DE PRUEBAS SENSORIALES PARA EL DOLOR OCULAR EN TAILANDIA, POR TIPO, 2018-2032 (MILES DE USD)
TABLA 661 MERCADO DE PRUEBAS DE IMAGEN PARA EL DOLOR OCULAR EN TAILANDIA, POR TIPO, 2018-2032 (MILES DE USD)
TABLA 662 MERCADO DE TRATAMIENTO DEL DOLOR OCULAR EN TAILANDIA, POR TIPO, 2018-2032 (MILES DE USD)
TABLA 663 MERCADO DE TRATAMIENTO LOCAL DEL DOLOR OCULAR EN TAILANDIA, POR TIPO, 2018-2032 (MILES DE USD)
TABLA 664 MERCADO DE ESTEROIDES TÓPICOS PARA EL DOLOR OCULAR EN TAILANDIA, POR TIPO, 2018-2032 (MILES DE USD)
TABLA 665 MERCADO DE ANTIINFLAMATORIOS NO ESTEROIDES (AINE) PARA EL DOLOR OCULAR EN TAILANDIA, POR TIPO, 2018-2032 (MILES DE USD)
TABLA 666 MERCADO DE TERAPIAS DE ESTIMULACIÓN PARA EL DOLOR OCULAR EN TAILANDIA, POR TIPO, 2018-2032 (MILES DE USD)
TABLA 667 MERCADO DEL DOLOR OCULAR EN TAILANDIA, POR APLICACIÓN, 2018-2032 (MILES DE USD)
TABLA 668 MERCADO DEL DOLOR OCULAR EN TAILANDIA, POR VÍA DE ADMINISTRACIÓN, 2018-2032 (MILES DE USD)
TABLA 669 MERCADO DE PRODUCTOS TÓPICOS PARA EL DOLOR OCULAR EN TAILANDIA, POR VÍA DE ADMINISTRACIÓN, 2018-2032 (MILES DE USD)
TABLA 670 MERCADO DE FARMACÉUTICOS INTRAOCULARES PARA EL DOLOR OCULAR EN TAILANDIA, POR VÍA DE ADMINISTRACIÓN, 2018-2032 (MILES DE USD)
TABLA 671 MERCADO DE MEDICAMENTOS PERIOCULARES PARA EL DOLOR OCULAR EN TAILANDIA, POR VÍA DE ADMINISTRACIÓN 2018-2032 (MILES DE USD)
TABLA 672 MERCADO DE FARMACÉUTICOS ORALES PARA EL DOLOR OCULAR EN TAILANDIA, POR VÍA DE ADMINISTRACIÓN, 2018-2032 (MILES DE USD)
TABLA 673 MERCADO DEL DOLOR OCULAR EN TAILANDIA, POR TIPO DE MEDICAMENTO, 2018-2032 (MILES DE USD)
TABLA 674 MERCADO DEL DOLOR OCULAR EN TAILANDIA, POR TIPO DE POBLACIÓN, 2018-2032 (MILES DE USD)
TABLA 675 MERCADO DE DOLOR OCULAR DE TAILANDIA, POR USUARIO FINAL, 2018-2032 (MILES DE USD)
TABLA 676 MERCADO DEL DOLOR OCULAR EN TAILANDIA, POR CANAL DE DISTRIBUCIÓN, 2018-2032 (MILES DE USD)
TABLA 677 MERCADO DE DOLOR OCULAR DE MALASIA, POR TIPO DE ENFERMEDAD, 2018-2032 (MILES DE USD)
TABLA 678 DOLOR OCULAR EN MALASIA CON ENFERMEDADES OCULARES EN EL MERCADO DEL DOLOR OCULAR, POR TIPO DE ENFERMEDAD, 2018-2032 (MILES DE USD)
TABLA 679 DOLOR OCULAR SIN ENFERMEDADES OCULARES PRIMARIAS EN EL MERCADO DE DOLOR OCULAR EN MALASIA, POR TIPO DE ENFERMEDAD, 2018-2032 (MILES DE USD)
TABLA 680 MERCADO DEL DOLOR OCULAR EN MALASIA, POR TIPO, 2018-2032 (MILES DE USD)
TABLA 681 MERCADO DE DIAGNÓSTICO DEL DOLOR OCULAR EN MALASIA, POR TIPO, 2018-2032 (MILES DE USD)
TABLA 682 MERCADO DE PRUEBAS SENSORIALES PARA EL DOLOR OCULAR EN MALASIA, POR TIPO, 2018-2032 (MILES DE USD)
TABLA 683 MERCADO DE PRUEBAS DE IMAGEN PARA EL DOLOR OCULAR EN MALASIA, POR TIPO, 2018-2032 (MILES DE USD)
TABLA 684 MERCADO DE TRATAMIENTO DEL DOLOR OCULAR EN MALASIA, POR TIPO, 2018-2032 (MILES DE USD)
TABLA 685 MERCADO DE TRATAMIENTO LOCAL DEL DOLOR OCULAR EN MALASIA, POR TIPO, 2018-2032 (MILES DE USD)
TABLA 686 MERCADO DE ESTEROIDES TÓPICOS PARA EL DOLOR OCULAR EN MALASIA, POR TIPO, 2018-2032 (MILES DE USD)
TABLA 687 MERCADO DE ANTIINFLAMATORIOS NO ESTEROIDES (AINE) PARA EL DOLOR OCULAR EN MALASIA, POR TIPO, 2018-2032 (MILES DE USD)
TABLA 688 MERCADO DE TERAPIAS DE ESTIMULACIÓN PARA EL DOLOR OCULAR EN MALASIA, POR TIPO, 2018-2032 (MILES DE USD)
TABLA 689 MERCADO DE DOLOR OCULAR DE MALASIA, POR APLICACIÓN, 2018-2032 (MILES DE USD)
TABLA 690 MERCADO DE DOLOR OCULAR DE MALASIA, POR VÍA DE ADMINISTRACIÓN, 2018-2032 (MILES DE USD)
TABLA 691 MERCADO DE MALASIA DE PRODUCTOS TÓPICOS PARA EL DOLOR OCULAR, POR VÍA DE ADMINISTRACIÓN, 2018-2032 (MILES DE USD)
TABLA 692 MERCADO DE MALASIA DE MEDICAMENTOS INTRAOCULARES PARA EL DOLOR OCULAR, POR VÍA DE ADMINISTRACIÓN, 2018-2032 (MILES DE USD)
TABLA 693 MERCADO DE MALASIA DE MEDICAMENTOS PERIOCULARES PARA EL DOLOR OCULAR, POR VÍA DE ADMINISTRACIÓN 2018-2032 (MILES DE USD)
TABLA 694 MERCADO DE MALASIA DE MEDICAMENTOS ORALES PARA EL DOLOR OCULAR, POR VÍA DE ADMINISTRACIÓN, 2018-2032 (MILES DE USD)
TABLA 695 MERCADO DE DOLOR OCULAR DE MALASIA, POR TIPO DE MEDICAMENTO, 2018-2032 (MILES DE USD)
TABLA 696 MERCADO DEL DOLOR OCULAR EN MALASIA, POR TIPO DE POBLACIÓN, 2018-2032 (MILES DE USD)
TABLA 697 MERCADO DE DOLOR OCULAR DE MALASIA, POR USUARIO FINAL, 2018-2032 (MILES DE USD)
TABLA 698 MERCADO DEL DOLOR OCULAR EN MALASIA, POR CANAL DE DISTRIBUCIÓN, 2018-2032 (MILES DE USD)
TABLA 699 MERCADO DEL DOLOR OCULAR EN INDONESIA, POR TIPO DE ENFERMEDAD, 2018-2032 (MILES DE USD)
TABLA 700 DOLOR OCULAR EN INDONESIA CON ENFERMEDADES OCULARES EN EL MERCADO DEL DOLOR OCULAR, POR TIPO DE ENFERMEDAD, 2018-2032 (MILES DE USD)
TABLA 701 DOLOR OCULAR SIN ENFERMEDADES OCULARES PRIMARIAS EN EL MERCADO DE DOLOR OCULAR EN INDONESIA, POR TIPO DE ENFERMEDAD, 2018-2032 (MILES DE USD)
TABLA 702 MERCADO DEL DOLOR OCULAR EN INDONESIA, POR TIPO, 2018-2032 (MILES DE USD)
TABLA 703 MERCADO DE DIAGNÓSTICO DEL DOLOR OCULAR EN INDONESIA, POR TIPO, 2018-2032 (MILES DE USD)
TABLA 704 MERCADO DE PRUEBAS SENSORIALES PARA EL DOLOR OCULAR EN INDONESIA, POR TIPO, 2018-2032 (MILES DE USD)
TABLA 705 MERCADO DE PRUEBAS DE IMAGEN PARA EL DOLOR OCULAR EN INDONESIA, POR TIPO, 2018-2032 (MILES DE USD)
TABLA 706 MERCADO DE TRATAMIENTO DEL DOLOR OCULAR EN INDONESIA, POR TIPO, 2018-2032 (MILES DE USD)
TABLA 707 MERCADO DE TRATAMIENTO LOCAL DEL DOLOR OCULAR EN INDONESIA, POR TIPO, 2018-2032 (MILES DE USD)
TABLA 708 MERCADO DE ESTEROIDES TÓPICOS PARA EL DOLOR OCULAR EN INDONESIA, POR TIPO, 2018-2032 (MILES DE USD)
TABLA 709 MERCADO DE ANTIINFLAMATORIOS NO ESTEROIDES (AINE) PARA EL DOLOR OCULAR EN INDONESIA, POR TIPO, 2018-2032 (MILES DE USD)
TABLA 710 MERCADO DE TERAPIAS DE ESTIMULACIÓN PARA EL DOLOR OCULAR EN INDONESIA, POR TIPO, 2018-2032 (MILES DE USD)
TABLA 711 MERCADO DEL DOLOR OCULAR EN INDONESIA, POR APLICACIÓN, 2018-2032 (MILES DE USD)
TABLA 712 MERCADO DEL DOLOR OCULAR EN INDONESIA, POR VÍA DE ADMINISTRACIÓN, 2018-2032 (MILES DE USD)
TABLA 713 MERCADO DE PRODUCTOS TÓPICOS PARA EL DOLOR OCULAR EN INDONESIA, POR VÍA DE ADMINISTRACIÓN, 2018-2032 (MILES DE USD)
TABLA 714 MERCADO DE INDONESIA DE MEDICAMENTOS INTRAOCULARES PARA EL DOLOR OCULAR, POR VÍA DE ADMINISTRACIÓN, 2018-2032 (MILES DE USD)
TABLA 715 MERCADO DE PERIOCULARES PARA EL DOLOR OCULAR EN INDONESIA, POR VÍA DE ADMINISTRACIÓN 2018-2032 (MILES DE USD)
TABLA 716 MERCADO DE INDONESIA DE MEDICAMENTOS ORALES PARA EL DOLOR OCULAR, POR VÍA DE ADMINISTRACIÓN, 2018-2032 (MILES DE USD)
TABLA 717 MERCADO DEL DOLOR OCULAR EN INDONESIA, POR TIPO DE MEDICAMENTO, 2018-2032 (MILES DE USD)
TABLA 718 MERCADO DEL DOLOR OCULAR EN INDONESIA, POR TIPO DE POBLACIÓN, 2018-2032 (MILES DE USD)
TABLA 719 MERCADO DEL DOLOR OCULAR EN INDONESIA, POR USUARIO FINAL, 2018-2032 (MILES DE USD)
TABLA 720 MERCADO DEL DOLOR OCULAR EN INDONESIA, POR CANAL DE DISTRIBUCIÓN, 2018-2032 (MILES DE USD)
TABLA 721 MERCADO DEL DOLOR OCULAR EN FILIPINAS, POR TIPO DE ENFERMEDAD, 2018-2032 (MILES DE USD)
TABLA 722 DOLOR OCULAR EN FILIPINAS CON ENFERMEDADES OCULARES EN EL MERCADO DEL DOLOR OCULAR, POR TIPO DE ENFERMEDAD, 2018-2032 (MILES DE USD)
TABLA 723 DOLOR OCULAR SIN ENFERMEDADES OCULARES PRIMARIAS EN EL MERCADO DE DOLOR OCULAR EN FILIPINAS, POR TIPO DE ENFERMEDAD, 2018-2032 (MILES DE USD)
TABLA 724 MERCADO DEL DOLOR OCULAR EN FILIPINAS, POR TIPO, 2018-2032 (MILES DE USD)
TABLA 725 MERCADO DE DIAGNÓSTICO DEL DOLOR OCULAR EN FILIPINAS, POR TIPO, 2018-2032 (MILES DE USD)
TABLA 726 MERCADO DE PRUEBAS SENSORIALES PARA EL DOLOR OCULAR EN FILIPINAS, POR TIPO, 2018-2032 (MILES DE USD)
TABLA 727 MERCADO DE PRUEBAS DE IMAGEN PARA EL DOLOR OCULAR EN FILIPINAS, POR TIPO, 2018-2032 (MILES DE USD)
TABLA 728 MERCADO DE TRATAMIENTO DEL DOLOR OCULAR EN FILIPINAS, POR TIPO, 2018-2032 (MILES DE USD)
TABLA 729 MERCADO DE TRATAMIENTO LOCAL DEL DOLOR OCULAR EN FILIPINAS, POR TIPO, 2018-2032 (MILES DE USD)
TABLA 730 MERCADO DE ESTEROIDES TÓPICOS PARA EL DOLOR OCULAR EN FILIPINAS, POR TIPO, 2018-2032 (MILES DE USD)
TABLA 731 MERCADO DE ANTIINFLAMATORIOS NO ESTEROIDES (AINE) PARA EL DOLOR OCULAR EN FILIPINAS, POR TIPO, 2018-2032 (MILES DE USD)
TABLA 732 MERCADO DE TERAPIAS DE ESTIMULACIÓN PARA EL DOLOR OCULAR EN FILIPINAS, POR TIPO, 2018-2032 (MILES DE USD)
TABLA 733 MERCADO DEL DOLOR OCULAR EN FILIPINAS, POR APLICACIÓN, 2018-2032 (MILES DE USD)
TABLA 734 MERCADO DEL DOLOR OCULAR EN FILIPINAS, POR VÍA DE ADMINISTRACIÓN, 2018-2032 (MILES DE USD)
TABLA 735 MERCADO DE FILIPINAS DE PRODUCTOS TÓPICOS PARA EL DOLOR OCULAR, POR VÍA DE ADMINISTRACIÓN, 2018-2032 (MILES DE USD)
TABLA 736 MERCADO DE FILIPINAS DE INTRAOCULAR PARA EL DOLOR OCULAR, POR VÍA DE ADMINISTRACIÓN, 2018-2032 (MILES DE USD)
TABLA 737 MERCADO DE FILIPINAS DE PERIOCULAR PARA EL DOLOR OCULAR, POR VÍA DE ADMINISTRACIÓN 2018-2032 (MILES DE USD)
TABLA 738 MERCADO DE FILIPINAS DE MEDICAMENTOS ORALES PARA EL DOLOR OCULAR, POR VÍA DE ADMINISTRACIÓN, 2018-2032 (MILES DE USD)
TABLA 739 MERCADO DEL DOLOR OCULAR EN FILIPINAS, POR TIPO DE MEDICAMENTO, 2018-2032 (MILES DE USD)
TABLA 740 MERCADO DEL DOLOR OCULAR EN FILIPINAS, POR TIPO DE POBLACIÓN, 2018-2032 (MILES DE USD)
TABLA 741 MERCADO DEL DOLOR OCULAR EN FILIPINAS, POR USUARIO FINAL, 2018-2032 (MILES DE USD)
TABLA 742 MERCADO DEL DOLOR OCULAR EN FILIPINAS, POR CANAL DE DISTRIBUCIÓN, 2018-2032 (MILES DE USD)
TABLA 743 MERCADO DE DOLOR OCULAR DE VIETNAM, POR TIPO DE ENFERMEDAD, 2018-2032 (MILES DE USD)
TABLA 744 VIETNAM DOLOR OCULAR CON ENFERMEDADES OCULARES EN EL MERCADO DEL DOLOR OCULAR, POR TIPO DE ENFERMEDAD, 2018-2032 (MILES DE USD)
TABLA 745 VIETNAM DOLOR OCULAR SIN ENFERMEDADES OCULARES PRIMARIAS EN EL MERCADO DE DOLOR OCULAR, POR TIPO DE ENFERMEDAD, 2018-2032 (MILES DE USD)
TABLA 746 MERCADO DEL DOLOR OCULAR EN VIETNAM, POR TIPO, 2018-2032 (MILES DE USD)
TABLA 747 MERCADO DE DIAGNÓSTICO DEL DOLOR OCULAR EN VIETNAM, POR TIPO, 2018-2032 (MILES DE USD)
TABLA 748 MERCADO DE PRUEBAS SENSORIALES PARA EL DOLOR OCULAR EN VIETNAM, POR TIPO, 2018-2032 (MILES DE USD)
TABLA 749 MERCADO DE PRUEBAS DE IMAGEN PARA EL DOLOR OCULAR EN VIETNAM, POR TIPO, 2018-2032 (MILES DE USD)
TABLA 750 MERCADO DE TRATAMIENTO DEL DOLOR OCULAR EN VIETNAM, POR TIPO, 2018-2032 (MILES DE USD)
TABLA 751 MERCADO DE TRATAMIENTO LOCAL DEL DOLOR OCULAR EN VIETNAM, POR TIPO, 2018-2032 (MILES DE USD)
TABLA 752 MERCADO DE ESTEROIDES TÓPICOS PARA EL DOLOR OCULAR EN VIETNAM, POR TIPO, 2018-2032 (MILES DE USD)
TABLA 753 MERCADO DE ANTIINFLAMATORIOS NO ESTEROIDES (AINE) PARA EL DOLOR OCULAR EN VIETNAM, POR TIPO, 2018-2032 (MILES DE USD)
TABLA 754 MERCADO DE TERAPIAS DE ESTIMULACIÓN PARA EL DOLOR OCULAR EN VIETNAM, POR TIPO, 2018-2032 (MILES DE USD)
TABLA 755 MERCADO DE DOLOR OCULAR DE VIETNAM, POR APLICACIÓN, 2018-2032 (MILES DE USD)
TABLA 756 MERCADO DEL DOLOR OCULAR EN VIETNAM, POR VÍA DE ADMINISTRACIÓN, 2018-2032 (MILES DE USD)
TABLA 757 MERCADO DE VIETNAM DE PRODUCTOS TÓPICOS PARA EL DOLOR OCULAR, POR VÍA DE ADMINISTRACIÓN, 2018-2032 (MILES DE USD)
TABLA 758 MERCADO DE VIETNAM DE INTRAOCULARES PARA EL DOLOR OCULAR, POR VÍA DE ADMINISTRACIÓN, 2018-2032 (MILES DE USD)
TABLA 759 MERCADO DE VIETNAM DE PERIOCULARES PARA EL DOLOR OCULAR, POR VÍA DE ADMINISTRACIÓN 2018-2032 (MILES DE USD)
TABLA 760 MERCADO DE VIETNAM DE MEDICAMENTOS ORALES PARA EL DOLOR OCULAR, POR VÍA DE ADMINISTRACIÓN, 2018-2032 (MILES DE USD)
TABLA 761 MERCADO DEL DOLOR OCULAR EN VIETNAM, POR TIPO DE MEDICAMENTO, 2018-2032 (MILES DE USD)
TABLA 762 MERCADO DE DOLOR OCULAR DE VIETNAM, POR TIPO DE POBLACIÓN, 2018-2032 (MILES DE USD)
TABLA 763 MERCADO DE DOLOR OCULAR DE VIETNAM, POR USUARIO FINAL, 2018-2032 (MILES DE USD)
TABLA 764 MERCADO DEL DOLOR OCULAR EN VIETNAM, POR CANAL DE DISTRIBUCIÓN, 2018-2032 (MILES DE USD)
TABLA 765 RESTO DEL MERCADO DE DOLOR OCULAR DE ASIA-PACÍFICO, POR TIPO DE ENFERMEDAD, 2018-2032 (MILES DE USD)
TABLA 766 MERCADO DEL DOLOR OCULAR EN AMÉRICA DEL SUR, POR PAÍS, 2018-2032 (MILES DE USD)
TABLA 767 MERCADO DEL DOLOR OCULAR EN AMÉRICA DEL SUR, POR TIPO DE ENFERMEDAD, 2018-2032 (MILES DE USD)
TABLA 768 DOLOR OCULAR EN AMÉRICA DEL SUR CON ENFERMEDADES OCULARES EN EL MERCADO DEL DOLOR OCULAR, POR TIPO DE ENFERMEDAD, 2018-2032 (MILES DE USD)
TABLA 769 DOLOR OCULAR SIN ENFERMEDADES OCULARES PRIMARIAS EN EL MERCADO DE DOLOR OCULAR EN AMÉRICA DEL SUR, POR TIPO DE ENFERMEDAD, 2018-2032 (MILES DE USD)
TABLA 770 MERCADO DEL DOLOR OCULAR EN SUDAMÉRICA, POR TIPO, 2018-2032 (MILES DE USD)
TABLA 771 MERCADO DE DIAGNÓSTICO DEL DOLOR OCULAR EN SUDAMÉRICA, POR TIPO, 2018-2032 (MILES DE USD)
TABLA 772 MERCADO DE PRUEBAS SENSORIALES PARA EL DOLOR OCULAR EN AMÉRICA DEL SUR, POR TIPO, 2018-2032 (MILES DE USD)
TABLA 773 MERCADO DE PRUEBAS DE IMAGEN PARA EL DOLOR OCULAR EN SUDAMÉRICA, POR TIPO, 2018-2032 (MILES DE USD)
TABLA 774 MERCADO DE TRATAMIENTO DEL DOLOR OCULAR EN SUDAMÉRICA, POR TIPO, 2018-2032 (MILES DE USD)
TABLA 775 MERCADO DE TRATAMIENTO LOCAL DEL DOLOR OCULAR EN SUDAMÉRICA, POR TIPO, 2018-2032 (MILES DE USD)
TABLA 776 MERCADO DE ESTEROIDES TÓPICOS PARA EL DOLOR OCULAR EN SUDAMÉRICA, POR TIPO, 2018-2032 (MILES DE USD)
TABLA 777 MERCADO DE ANTIINFLAMATORIOS NO ESTEROIDES (AINE) PARA EL DOLOR OCULAR EN AMÉRICA DEL SUR, POR TIPO, 2018-2032 (MILES DE USD)
TABLA 778 MERCADO DE TERAPIAS DE ESTIMULACIÓN PARA EL DOLOR OCULAR EN SUDAMÉRICA, POR TIPO, 2018-2032 (MILES DE USD)
TABLA 779 MERCADO DEL DOLOR OCULAR EN AMÉRICA DEL SUR, POR APLICACIÓN, 2018-2032 (MILES DE USD)
TABLA 780 MERCADO DEL DOLOR OCULAR EN SUDAMÉRICA, POR VÍA DE ADMINISTRACIÓN, 2018-2032 (MILES DE USD)
TABLA 781 MERCADO DE SUDAMÉRICA DE FÁRMACOS TÓPICOS PARA EL DOLOR OCULAR, POR VÍA DE ADMINISTRACIÓN, 2018-2032 (MILES DE USD)
TABLA 782 MERCADO DE SUDAMÉRICA DE INTRAOCULARES PARA EL DOLOR OCULAR, POR VÍA DE ADMINISTRACIÓN, 2018-2032 (MILES DE USD)
TABLA 783 MERCADO DE SUDAMÉRICA DE PERIOCULARES PARA EL DOLOR OCULAR, POR VÍA DE ADMINISTRACIÓN 2018-2032 (MILES DE USD)
TABLA 784 MERCADO DE SUDAMÉRICA DE MEDICAMENTOS ORALES PARA EL DOLOR OCULAR, POR VÍA DE ADMINISTRACIÓN, 2018-2032 (MILES DE USD)
TABLA 785 MERCADO DEL DOLOR OCULAR EN SUDAMÉRICA, POR TIPO DE MEDICAMENTO, 2018-2032 (MILES DE USD)
TABLA 786 MERCADO DEL DOLOR OCULAR EN AMÉRICA DEL SUR, POR TIPO DE POBLACIÓN, 2018-2032 (MILES DE USD)
TABLA 787 MERCADO DEL DOLOR OCULAR EN AMÉRICA DEL SUR, POR USUARIO FINAL, 2018-2032 (MILES DE USD)
TABLA 788 MERCADO DEL DOLOR OCULAR EN SUDAMÉRICA, POR CANAL DE DISTRIBUCIÓN, 2018-2032 (MILES DE USD)
TABLA 789 MERCADO DE DOLOR OCULAR EN BRASIL, POR TIPO DE ENFERMEDAD, 2018-2032 (MILES DE USD)
TABLA 790 BRASIL DOLOR OCULAR CON ENFERMEDADES OCULARES EN EL MERCADO DE DOLOR OCULAR, POR TIPO DE ENFERMEDAD, 2018-2032 (MILES DE USD)
TABLA 791 BRASIL DOLOR OCULAR SIN ENFERMEDADES OCULARES PRIMARIAS EN EL MERCADO DE DOLOR OCULAR, POR TIPO DE ENFERMEDAD, 2018-2032 (MILES DE USD)
TABLA 792 MERCADO DE DOLOR OCULAR EN BRASIL, POR TIPO, 2018-2032 (MILES DE USD)
TABLA 793 MERCADO DE DIAGNÓSTICO DEL DOLOR OCULAR EN BRASIL, POR TIPO, 2018-2032 (MILES DE USD)
TABLA 794 MERCADO DE PRUEBAS SENSORIALES PARA EL DOLOR OCULAR EN BRASIL, POR TIPO, 2018-2032 (MILES DE USD)
TABLA 795 MERCADO DE PRUEBAS DE IMAGEN PARA EL DOLOR OCULAR EN BRASIL, POR TIPO, 2018-2032 (MILES DE USD)
TABLA 796 MERCADO DE TRATAMIENTO DEL DOLOR OCULAR EN BRASIL, POR TIPO, 2018-2032 (MILES DE USD)
TABLA 797 MERCADO DE TRATAMIENTO LOCAL DEL DOLOR OCULAR EN BRASIL, POR TIPO, 2018-2032 (MILES DE USD)
TABLA 798 MERCADO DE ESTEROIDES TÓPICOS PARA EL DOLOR OCULAR EN BRASIL, POR TIPO, 2018-2032 (MILES DE USD)
TABLA 799 MERCADO DE ANTIINFLAMATORIOS NO ESTEROIDES (AINE) PARA EL DOLOR OCULAR EN BRASIL, POR TIPO, 2018-2032 (MILES DE USD)
TABLA 800 MERCADO DE TERAPIAS DE ESTIMULACIÓN PARA EL DOLOR OCULAR EN BRASIL, POR TIPO, 2018-2032 (MILES DE USD)
TABLA 801 MERCADO DE DOLOR OCULAR DE BRASIL, POR APLICACIÓN, 2018-2032 (MILES DE USD)
TABLA 802 MERCADO DE DOLOR OCULAR EN BRASIL, POR VÍA DE ADMINISTRACIÓN, 2018-2032 (MILES DE USD)
TABLA 803 MERCADO DE PRODUCTOS TÓPICOS PARA EL DOLOR OCULAR EN BRASIL, POR VÍA DE ADMINISTRACIÓN, 2018-2032 (MILES DE USD)
TABLA 804 MERCADO DE INTRAOCULARES PARA EL DOLOR OCULAR EN BRASIL, POR VÍA DE ADMINISTRACIÓN, 2018-2032 (MILES DE USD)
TABLA 805 MERCADO DE MEDICAMENTOS PERIOCULARES PARA EL DOLOR OCULAR EN BRASIL, POR VÍA DE ADMINISTRACIÓN 2018-2032 (MILES DE USD)
TABLA 806 MERCADO DE DROGAS ORALES PARA EL DOLOR OCULAR EN BRASIL, POR VÍA DE ADMINISTRACIÓN, 2018-2032 (MILES DE USD)
TABLA 807 MERCADO DE DOLOR OCULAR EN BRASIL, POR TIPO DE MEDICAMENTO, 2018-2032 (MILES DE USD)
TABLA 808 MERCADO DE DOLOR OCULAR EN BRASIL, POR TIPO DE POBLACIÓN, 2018-2032 (MILES DE USD)
TABLA 809 MERCADO DE DOLOR OCULAR EN BRASIL, POR USUARIO FINAL, 2018-2032 (MILES DE USD)
TABLA 810 MERCADO DE DOLOR OCULAR EN BRASIL, POR CANAL DE DISTRIBUCIÓN, 2018-2032 (MILES DE USD)
TABLA 811 MERCADO ARGENTINO DEL DOLOR OCULAR, POR TIPO DE ENFERMEDAD, 2018-2032 (MILES DE USD)
TABLA 812 DOLOR OCULAR EN ARGENTINA CON ENFERMEDADES OCULARES EN EL MERCADO DE DOLOR OCULAR, POR TIPO DE ENFERMEDAD, 2018-2032 (MILES DE USD)
TABLA 813 ARGENTINA DOLOR OCULAR SIN ENFERMEDADES OCULARES PRIMARIAS EN EL MERCADO DE DOLOR OCULAR, POR TIPO DE ENFERMEDAD, 2018-2032 (MILES DE USD)
TABLA 814 MERCADO ARGENTINO DEL DOLOR OCULAR, POR TIPO, 2018-2032 (MILES DE USD)
TABLA 815 MERCADO ARGENTINO DE DIAGNÓSTICO DEL DOLOR OCULAR, POR TIPO, 2018-2032 (MILES DE USD)
TABLA 816 MERCADO ARGENTINO DE PRUEBAS SENSORIALES PARA EL DOLOR OCULAR, POR TIPO, 2018-2032 (MILES DE USD)
TABLA 817 MERCADO ARGENTINO DE PRUEBAS DE IMAGEN PARA EL DOLOR OCULAR, POR TIPO, 2018-2032 (MILES DE USD)
TABLA 818 MERCADO ARGENTINO DE TRATAMIENTO DEL DOLOR OCULAR, POR TIPO, 2018-2032 (MILES DE USD)
TABLA 819 MERCADO ARGENTINO DE TRATAMIENTO LOCAL DEL DOLOR OCULAR, POR TIPO, 2018-2032 (MILES DE USD)
TABLA 820 MERCADO DE ESTEROIDES TÓPICOS PARA EL DOLOR OCULAR EN ARGENTINA, POR TIPO, 2018-2032 (MILES DE USD)
TABLA 821 MERCADO ARGENTINO DE ANTIINFLAMATORIOS NO ESTEROIDES (AINE) PARA EL DOLOR OCULAR, POR TIPO, 2018-2032 (MILES DE USD)
TABLA 822 MERCADO ARGENTINO DE TERAPIAS DE ESTIMULACIÓN PARA EL DOLOR OCULAR, POR TIPO, 2018-2032 (MILES DE USD)
TABLA 823 MERCADO ARGENTINO DEL DOLOR OCULAR, POR APLICACIÓN, 2018-2032 (MILES DE USD)
TABLA 824 MERCADO ARGENTINO DEL DOLOR OCULAR, POR VÍA DE ADMINISTRACIÓN, 2018-2032 (MILES DE USD)
TABLA 825 MERCADO ARGENTINO DE FÁRMACOS TÓPICOS PARA EL DOLOR OCULAR, POR VÍA DE ADMINISTRACIÓN, 2018-2032 (MILES DE USD)
TABLA 826 MERCADO ARGENTINO DE INTRAOCULARES PARA EL DOLOR OCULAR, POR VÍA DE ADMINISTRACIÓN, 2018-2032 (MILES DE USD)
TABLA 827 MERCADO ARGENTINO DE MEDICAMENTOS PERIOCULARES PARA EL DOLOR OCULAR, SEGÚN VÍA DE ADMINISTRACIÓN 2018-2032 (MILES DE USD)
TABLA 828 MERCADO ARGENTINO DE MEDICAMENTOS ORALES PARA EL DOLOR OCULAR, POR VÍA DE ADMINISTRACIÓN, 2018-2032 (MILES DE USD)
TABLA 829 MERCADO ARGENTINO DEL DOLOR OCULAR, POR TIPO DE MEDICAMENTO, 2018-2032 (MILES DE USD)
TABLA 830 MERCADO DEL DOLOR OCULAR EN ARGENTINA, POR TIPO DE POBLACIÓN, 2018-2032 (MILES DE USD)
TABLA 831 MERCADO ARGENTINO DEL DOLOR OCULAR, POR USUARIO FINAL, 2018-2032 (MILES DE USD)
TABLA 832 MERCADO ARGENTINO DEL DOLOR OCULAR, POR CANAL DE DISTRIBUCIÓN, 2018-2032 (MILES DE USD)
TABLA 833 MERCADO DEL DOLOR OCULAR EN PERÚ, POR TIPO DE ENFERMEDAD, 2018-2032 (MILES DE USD)
TABLA 834 PERÚ DOLOR OCULAR CON ENFERMEDADES OCULARES EN EL MERCADO DE DOLOR OCULAR, POR TIPO DE ENFERMEDAD, 2018-2032 (MILES DE USD)
TABLA 835 DOLOR OCULAR EN PERÚ SIN ENFERMEDADES OCULARES PRIMARIAS EN EL MERCADO DE DOLOR OCULAR, POR TIPO DE ENFERMEDAD, 2018-2032 (MILES DE USD)
TABLA 836 MERCADO DEL DOLOR OCULAR EN PERÚ, POR TIPO, 2018-2032 (MILES DE USD)
TABLA 837 MERCADO DE DIAGNÓSTICO DEL DOLOR OCULAR EN PERÚ, POR TIPO, 2018-2032 (USD MILES)
TABLA 838 MERCADO PERUANO DE PRUEBAS SENSORIALES PARA EL DOLOR OCULAR, POR TIPO, 2018-2032 (MILES DE USD)
TABLA 839 MERCADO DE PRUEBAS DE IMAGENOLOGÍA PARA EL DOLOR OCULAR EN PERÚ, POR TIPO, 2018-2032 (MILES DE USD)
TABLA 840 MERCADO DE TRATAMIENTO DEL DOLOR OCULAR EN PERÚ, POR TIPO, 2018-2032 (MILES DE USD)
TABLA 841 MERCADO PERUANO DE TRATAMIENTO LOCAL DEL DOLOR OCULAR, POR TIPO, 2018-2032 (MILES DE USD)
TABLA 842 MERCADO DE ESTEROIDES TÓPICOS PARA EL DOLOR OCULAR EN PERÚ, POR TIPO, 2018-2032 (MILES DE USD)
TABLA 843 MERCADO DE ANTIINFLAMATORIOS NO ESTEROIDES (AINE) PARA EL DOLOR OCULAR EN PERÚ, POR TIPO, 2018-2032 (MILES DE USD)
TABLA 844 MERCADO DE TERAPIAS DE ESTIMULACIÓN PARA EL DOLOR OCULAR EN PERÚ, POR TIPO, 2018-2032 (MILES DE USD)
TABLA 845 MERCADO PERUANO DE DOLOR OCULAR, POR APLICACIÓN, 2018-2032 (MILES DE USD)
TABLA 846 MERCADO DEL DOLOR OCULAR EN PERÚ, SEGÚN VÍA DE ADMINISTRACIÓN, 2018-2032 (MILES DE USD)
TABLA 847 MERCADO DE PRODUCTOS TÓPICOS PARA EL DOLOR OCULAR EN PERÚ, POR VÍA DE ADMINISTRACIÓN, 2018-2032 (MILES DE USD)
TABLA 848 MERCADO PERUANO DE INTRAOCULARES PARA EL DOLOR OCULAR, SEGÚN VÍA DE ADMINISTRACIÓN, 2018-2032 (MILES DE USD)
TABLA 849 MERCADO PERIOCULAR PARA EL DOLOR OCULAR EN PERÚ, SEGÚN VÍA DE ADMINISTRACIÓN 2018-2032 (MILES DE USD)
TABLA 850 MERCADO PERUANO DE MEDICAMENTOS ORALES PARA EL DOLOR OCULAR, SEGÚN VÍA DE ADMINISTRACIÓN, 2018-2032 (MILES DE USD)
TABLA 851 MERCADO PERUANO DEL DOLOR OCULAR, POR TIPO DE MEDICAMENTO, 2018-2032 (MILES DE USD)
TABLA 852 MERCADO DEL DOLOR OCULAR EN PERÚ, POR TIPO DE POBLACIÓN, 2018-2032 (MILES DE USD)
TABLA 853 MERCADO PERUANO DE DOLOR OCULAR, POR USUARIO FINAL, 2018-2032 (MILES DE USD)
TABLA 854 MERCADO DEL DOLOR OCULAR EN PERÚ, POR CANAL DE DISTRIBUCIÓN, 2018-2032 (MILES DE USD)
TABLA 855 RESTO DE SUDAMÉRICA MERCADO DEL DOLOR OCULAR, POR TIPO DE ENFERMEDAD, 2018-2032 (MILES DE USD)
TABLA 856 MERCADO DEL DOLOR OCULAR EN ORIENTE MEDIO Y ÁFRICA, POR PAÍS, 2018-2032 (MILES DE USD)
TABLA 857 MERCADO DEL DOLOR OCULAR EN ORIENTE MEDIO Y ÁFRICA, POR TIPO DE ENFERMEDAD, 2018-2032 (MILES DE USD)
TABLA 858 ORIENTE MEDIO Y ÁFRICA DOLOR OCULAR CON ENFERMEDADES OCULARES EN EL MERCADO DEL DOLOR OCULAR, POR TIPO DE ENFERMEDAD, 2018-2032 (MILES DE USD)
TABLA 859 ORIENTE MEDIO Y ÁFRICA DOLOR OCULAR SIN ENFERMEDADES OCULARES PRIMARIAS EN EL MERCADO DE DOLOR OCULAR, POR TIPO DE ENFERMEDAD, 2018-2032 (MILES DE USD)
TABLA 860 MERCADO DEL DOLOR OCULAR EN ORIENTE MEDIO Y ÁFRICA, POR TIPO, 2018-2032 (MILES DE USD)
TABLA 861 MERCADO DE DIAGNÓSTICO DEL DOLOR OCULAR EN ORIENTE MEDIO Y ÁFRICA, POR TIPO, 2018-2032 (MILES DE USD)
TABLA 862 MERCADO DE PRUEBAS SENSORIALES PARA EL DOLOR OCULAR EN ORIENTE MEDIO Y ÁFRICA, POR TIPO, 2018-2032 (MILES DE USD)
TABLA 863 MERCADO DE PRUEBAS DE IMAGEN PARA EL DOLOR OCULAR EN ORIENTE MEDIO Y ÁFRICA, POR TIPO, 2018-2032 (MILES DE USD)
TABLA 864 MERCADO DE TRATAMIENTO DEL DOLOR OCULAR EN ORIENTE MEDIO Y ÁFRICA, POR TIPO, 2018-2032 (MILES DE USD)
TABLA 865 MERCADO DE TRATAMIENTO LOCAL DEL DOLOR OCULAR EN ORIENTE MEDIO Y ÁFRICA, POR TIPO, 2018-2032 (MILES DE USD)
TABLA 866 MERCADO DE ESTEROIDES TÓPICOS PARA EL DOLOR OCULAR EN ORIENTE MEDIO Y ÁFRICA, POR TIPO, 2018-2032 (MILES DE USD)
TABLA 867 ORIENTE MEDIO Y ÁFRICA MERCADO DE ANTIINFLAMATORIOS NO ESTEROIDES (AINE) PARA EL DOLOR OCULAR, POR TIPO, 2018-2032 (MILES DE USD)
TABLA 868 MERCADO DE TERAPIAS DE ESTIMULACIÓN PARA EL DOLOR OCULAR EN ORIENTE MEDIO Y ÁFRICA, POR TIPO, 2018-2032 (MILES DE USD)
TABLA 869 MERCADO DEL DOLOR OCULAR EN ORIENTE MEDIO Y ÁFRICA, POR APLICACIÓN, 2018-2032 (MILES DE USD)
TABLA 870 MERCADO DEL DOLOR OCULAR EN ORIENTE MEDIO Y ÁFRICA, POR VÍA DE ADMINISTRACIÓN, 2018-2032 (MILES DE USD)
TABLA 871 MERCADO DE MEDICAMENTOS TÓPICOS PARA EL DOLOR OCULAR EN ORIENTE MEDIO Y ÁFRICA, POR VÍA DE ADMINISTRACIÓN, 2018-2032 (MILES DE USD)
TABLA 872 MERCADO DE MEDICAMENTOS INTRAOCULARES PARA EL DOLOR OCULAR EN ORIENTE MEDIO Y ÁFRICA, POR VÍA DE ADMINISTRACIÓN, 2018-2032 (MILES DE USD)
TABLA 873 ORIENTE MEDIO Y ÁFRICA MERCADO DE MEDICAMENTOS PERIOCULARES PARA EL DOLOR OCULAR, POR VÍA DE ADMINISTRACIÓN 2018-2032 (MILES DE USD)
TABLA 874 ORIENTE MEDIO Y ÁFRICA MERCADO DE FARMACÉUTICOS PARA EL DOLOR OCULAR, POR VÍA DE ADMINISTRACIÓN, 2018-2032 (MILES DE USD)
TABLA 875 MERCADO DEL DOLOR OCULAR EN ORIENTE MEDIO Y ÁFRICA, POR TIPO DE MEDICAMENTO, 2018-2032 (MILES DE USD)
TABLA 876 MERCADO DEL DOLOR OCULAR EN ORIENTE MEDIO Y ÁFRICA, POR TIPO DE POBLACIÓN, 2018-2032 (MILES DE USD)
TABLA 877 MERCADO DEL DOLOR OCULAR EN ORIENTE MEDIO Y ÁFRICA, POR USUARIO FINAL, 2018-2032 (MILES DE USD)
TABLA 878 MERCADO DEL DOLOR OCULAR EN ORIENTE MEDIO Y ÁFRICA, POR CANAL DE DISTRIBUCIÓN, 2018-2032 (MILES DE USD)
TABLA 879 MERCADO DEL DOLOR OCULAR EN SUDÁFRICA, POR TIPO DE ENFERMEDAD, 2018-2032 (MILES DE USD)
TABLA 880 ENFERMEDADES OCULARES EN EL MERCADO DE DOLOR OCULAR EN SUDÁFRICA, POR TIPO DE ENFERMEDAD, 2018-2032 (MILES DE USD)
TABLA 881 DOLOR OCULAR EN SUDÁFRICA SIN ENFERMEDADES OCULARES PRIMARIAS EN EL MERCADO DEL DOLOR OCULAR, POR TIPO DE ENFERMEDAD, 2018-2032 (MILES DE USD)
TABLA 882 MERCADO DEL DOLOR OCULAR EN SUDÁFRICA, POR TIPO, 2018-2032 (MILES DE USD)
TABLA 883 MERCADO DE DIAGNÓSTICO DEL DOLOR OCULAR EN SUDÁFRICA, POR TIPO, 2018-2032 (MILES DE USD)
TABLA 884 MERCADO DE PRUEBAS SENSORIALES PARA EL DOLOR OCULAR EN SUDÁFRICA, POR TIPO, 2018-2032 (MILES DE USD)
TABLA 885 MERCADO DE PRUEBAS DE IMAGEN PARA EL DOLOR OCULAR EN SUDÁFRICA, POR TIPO, 2018-2032 (MILES DE USD)
TABLA 886 MERCADO DE TRATAMIENTO DEL DOLOR OCULAR EN SUDÁFRICA, POR TIPO, 2018-2032 (MILES DE USD)
TABLA 887 MERCADO DE TRATAMIENTO LOCAL DEL DOLOR OCULAR EN SUDÁFRICA, POR TIPO, 2018-2032 (MILES DE USD)
TABLA 888 MERCADO DE ESTEROIDES TÓPICOS PARA EL DOLOR OCULAR EN SUDÁFRICA, POR TIPO, 2018-2032 (MILES DE USD)
TABLA 889 MERCADO DE ANTIINFLAMATORIOS NO ESTEROIDES (AINE) PARA EL DOLOR OCULAR EN SUDÁFRICA, POR TIPO, 2018-2032 (MILES DE USD)
TABLA 890 MERCADO DE TERAPIAS DE ESTIMULACIÓN PARA EL DOLOR OCULAR EN SUDÁFRICA, POR TIPO, 2018-2032 (MILES DE USD)
TABLA 891 MERCADO DEL DOLOR OCULAR EN SUDÁFRICA, POR APLICACIÓN, 2018-2032 (MILES DE USD)
TABLA 892 MERCADO DEL DOLOR OCULAR EN SUDÁFRICA, POR VÍA DE ADMINISTRACIÓN, 2018-2032 (MILES DE USD)
TABLA 893 MERCADO DE SUDÁFRICA DE FÁRMACOS TÓPICOS PARA EL DOLOR OCULAR, POR VÍA DE ADMINISTRACIÓN, 2018-2032 (MILES DE USD)
TABLA 894 MERCADO DE SUDÁFRICA DE MEDICAMENTOS INTRAOCULARES PARA EL DOLOR OCULAR, POR VÍA DE ADMINISTRACIÓN, 2018-2032 (MILES DE USD)
TABLA 895 MERCADO DE SUDÁFRICA DE MEDICAMENTOS PERIOCULARES PARA EL DOLOR OCULAR, POR VÍA DE ADMINISTRACIÓN 2018-2032 (MILES DE USD)
TABLA 896 MERCADO DE SUDÁFRICA DE MEDICAMENTOS ORALES PARA EL DOLOR OCULAR, POR VÍA DE ADMINISTRACIÓN, 2018-2032 (MILES DE USD)
TABLA 897 MERCADO DEL DOLOR OCULAR EN SUDÁFRICA, POR TIPO DE MEDICAMENTO, 2018-2032 (MILES DE USD)
TABLA 898 MERCADO DEL DOLOR OCULAR EN SUDÁFRICA, POR TIPO DE POBLACIÓN, 2018-2032 (MILES DE USD)
TABLA 899 MERCADO DEL DOLOR OCULAR EN SUDÁFRICA, POR USUARIO FINAL, 2018-2032 (MILES DE USD)
TABLA 900 MERCADO DEL DOLOR OCULAR EN SUDÁFRICA, POR CANAL DE DISTRIBUCIÓN, 2018-2032 (MILES DE USD)
TABLA 901 MERCADO DEL DOLOR OCULAR EN ARABIA SAUDITA, POR TIPO DE ENFERMEDAD, 2018-2032 (MILES DE USD)
TABLA 902 ARABIA SAUDITA DOLOR OCULAR CON ENFERMEDADES OCULARES EN EL MERCADO DEL DOLOR OCULAR, POR TIPO DE ENFERMEDAD, 2018-2032 (MILES DE USD)
TABLA 903 ARABIA SAUDITA DOLOR OCULAR SIN ENFERMEDADES OCULARES PRIMARIAS EN EL MERCADO DE DOLOR OCULAR, POR TIPO DE ENFERMEDAD, 2018-2032 (MILES DE USD)
TABLA 904 MERCADO DEL DOLOR OCULAR EN ARABIA SAUDITA, POR TIPO, 2018-2032 (MILES DE USD)
TABLA 905 DIAGNÓSTICO DEL DOLOR OCULAR EN ARABIA SAUDITA, POR TIPO, 2018-2032 (MILES DE USD)
TABLA 906 MERCADO DE PRUEBAS SENSORIALES PARA EL DOLOR OCULAR EN ARABIA SAUDITA, POR TIPO, 2018-2032 (MILES DE USD)
TABLA 907 PRUEBAS DE IMAGEN PARA EL DOLOR OCULAR EN ARABIA SAUDITA, POR TIPO, 2018-2032 (MILES DE USD)
TABLA 908 TRATAMIENTO DEL DOLOR OCULAR EN ARABIA SAUDITA, POR TIPO, 2018-2032 (MILES DE USD)
TABLA 909 MERCADO DE TRATAMIENTO LOCAL DEL DOLOR OCULAR EN ARABIA SAUDITA, POR TIPO, 2018-2032 (MILES DE USD)
TABLA 910 MERCADO DE ESTEROIDES TÓPICOS PARA EL DOLOR OCULAR EN ARABIA SAUDITA, POR TIPO, 2018-2032 (MILES DE USD)
TABLA 911 ARABIA SAUDITA MERCADO DE ANTIINFLAMATORIOS NO ESTEROIDES (AINE) PARA EL DOLOR OCULAR, POR TIPO, 2018-2032 (MILES DE USD)
TABLA 912 MERCADO DE TERAPIAS DE ESTIMULACIÓN PARA EL DOLOR OCULAR EN ARABIA SAUDITA, POR TIPO, 2018-2032 (MILES DE USD)
TABLA 913 MERCADO DEL DOLOR OCULAR EN ARABIA SAUDITA, POR APLICACIÓN, 2018-2032 (MILES DE USD)
TABLA 914 MERCADO DEL DOLOR OCULAR EN ARABIA SAUDITA, POR VÍA DE ADMINISTRACIÓN, 2018-2032 (MILES DE USD)
TABLA 915 MERCADO DE PRODUCTOS TÓPICOS PARA EL DOLOR OCULAR EN ARABIA SAUDITA, POR VÍA DE ADMINISTRACIÓN, 2018-2032 (MILES DE USD)
TABLA 916 MERCADO DE FARMACÉUTICOS INTRAOCULARES PARA EL DOLOR OCULAR EN ARABIA SAUDITA, POR VÍA DE ADMINISTRACIÓN, 2018-2032 (MILES DE USD)
TABLA 917 ARABIA SAUDITA MERCADO DE PERIOCULARES PARA EL DOLOR OCULAR, POR VÍA DE ADMINISTRACIÓN 2018-2032 (MILES DE USD)
TABLA 918 MERCADO DE ARABIA SAUDITA DE MEDICAMENTOS ORALES PARA EL DOLOR OCULAR, POR VÍA DE ADMINISTRACIÓN, 2018-2032 (MILES DE USD)
TABLA 919 MERCADO DEL DOLOR OCULAR EN ARABIA SAUDITA, POR TIPO DE MEDICAMENTO, 2018-2032 (MILES DE USD)
TABLA 920 MERCADO DEL DOLOR OCULAR EN ARABIA SAUDITA, POR TIPO DE POBLACIÓN, 2018-2032 (MILES DE USD)
TABLA 921 MERCADO DEL DOLOR OCULAR EN ARABIA SAUDITA, POR USUARIO FINAL, 2018-2032 (MILES DE USD)
TABLA 922 MERCADO DEL DOLOR OCULAR EN ARABIA SAUDITA, POR CANAL DE DISTRIBUCIÓN, 2018-2032 (MILES DE USD)
TABLA 923 MERCADO DEL DOLOR OCULAR EN LOS EAU, POR TIPO DE ENFERMEDAD, 2018-2032 (MILES DE USD)
TABLA 924 DOLOR OCULAR CON ENFERMEDADES OCULARES EN EL MERCADO DEL DOLOR OCULAR EN LOS EAU, POR TIPO DE ENFERMEDAD, 2018-2032 (MILES DE USD)
TABLA 925 DOLOR OCULAR SIN ENFERMEDADES OCULARES PRIMARIAS EN EL MERCADO DEL DOLOR OCULAR EN LOS EAU, POR TIPO DE ENFERMEDAD, 2018-2032 (MILES DE USD)
TABLA 926 MERCADO DEL DOLOR OCULAR EN LOS EAU, POR TIPO, 2018-2032 (MILES DE USD)
TABLA 927 DIAGNÓSTICO DEL DOLOR OCULAR EN EL MERCADO DE LOS EAU, POR TIPO, 2018-2032 (MILES DE USD)
TABLA 928 MERCADO DE PRUEBAS SENSORIALES PARA EL DOLOR OCULAR EN LOS EAU, POR TIPO, 2018-2032 (MILES DE USD)
TABLA 929 PRUEBAS DE IMAGEN EN EL MERCADO DEL DOLOR OCULAR EN LOS EAU, POR TIPO, 2018-2032 (MILES DE USD)
TABLA 930 MERCADO DE TRATAMIENTO DEL DOLOR OCULAR EN LOS EAU, POR TIPO, 2018-2032 (MILES DE USD)
TABLA 931 MERCADO DE TRATAMIENTO LOCAL DEL DOLOR OCULAR EN LOS EAU, POR TIPO, 2018-2032 (MILES DE USD)
TABLA 932 MERCADO DE ESTEROIDES TÓPICOS PARA EL DOLOR OCULAR EN LOS EAU, POR TIPO, 2018-2032 (MILES DE USD)
TABLA 933 MERCADO DE ANTIINFLAMATORIOS NO ESTEROIDES (AINE) PARA EL DOLOR OCULAR EN LOS EAU, POR TIPO, 2018-2032 (MILES DE USD)
TABLA 934 MERCADO DE TERAPIAS DE ESTIMULACIÓN PARA EL DOLOR OCULAR EN LOS EAU, POR TIPO, 2018-2032 (MILES DE USD)
TABLA 935 MERCADO DEL DOLOR OCULAR EN LOS EAU, POR APLICACIÓN, 2018-2032 (MILES DE USD)
TABLA 936 MERCADO DEL DOLOR OCULAR EN LOS EAU, POR VÍA DE ADMINISTRACIÓN, 2018-2032 (MILES DE USD)
TABLA 937 MERCADO DE FÁRMACOS TÓPICOS PARA EL DOLOR OCULAR EN LOS EAU, POR VÍA DE ADMINISTRACIÓN, 2018-2032 (MILES DE USD)
TABLA 938 MERCADO DE FARMACÉUTICA INTRAOCULAR PARA EL DOLOR OCULAR EN LOS EAU, POR VÍA DE ADMINISTRACIÓN, 2018-2032 (MILES DE USD)
TABLA 939 MERCADO DE MEDICAMENTOS PERIOCULARES PARA EL DOLOR OCULAR EN LOS EAU, POR VÍA DE ADMINISTRACIÓN, 2018-2032 (MILES DE USD)
TABLA 940 MERCADO DE MEDICAMENTOS ORALES PARA EL DOLOR OCULAR EN LOS EAU, POR VÍA DE ADMINISTRACIÓN, 2018-2032 (MILES DE USD)
TABLA 941 MERCADO DEL DOLOR OCULAR EN LOS EAU, POR TIPO DE MEDICAMENTO, 2018-2032 (MILES DE USD)
TABLA 942 MERCADO DEL DOLOR OCULAR EN LOS EAU, POR TIPO DE POBLACIÓN, 2018-2032 (MILES DE USD)
TABLA 943 MERCADO DEL DOLOR OCULAR EN LOS EAU, POR USUARIO FINAL, 2018-2032 (MILES DE USD)
TABLA 944 MERCADO DEL DOLOR OCULAR EN LOS EAU, POR CANAL DE DISTRIBUCIÓN, 2018-2032 (MILES DE USD)
TABLA 945 MERCADO DE DOLOR OCULAR EN EGIPTO, POR TIPO DE ENFERMEDAD, 2018-2032 (MILES DE USD)
TABLA 946 EGIPTO DOLOR OCULAR CON ENFERMEDADES OCULARES EN EL MERCADO DEL DOLOR OCULAR, POR TIPO DE ENFERMEDAD, 2018-2032 (MILES DE USD)
TABLA 947 EGIPTO DOLOR OCULAR SIN ENFERMEDADES OCULARES PRIMARIAS EN EL MERCADO DE DOLOR OCULAR, POR TIPO DE ENFERMEDAD, 2018-2032 (MILES DE USD)
TABLA 948 MERCADO DE DOLOR OCULAR EN EGIPTO, POR TIPO, 2018-2032 (MILES DE USD)
TABLA 949 DIAGNÓSTICO DEL DOLOR OCULAR EN EGIPTO, POR TIPO, 2018-2032 (MILES DE USD)
TABLA 950 MERCADO DE PRUEBAS SENSORIALES PARA EL DOLOR OCULAR EN EGIPTO, POR TIPO, 2018-2032 (MILES DE USD)
TABLA 951 PRUEBAS DE IMAGEN EN EGIPTO PARA EL MERCADO DEL DOLOR OCULAR, POR TIPO, 2018-2032 (MILES DE USD)
TABLA 952 MERCADO DE TRATAMIENTO DEL DOLOR OCULAR EN EGIPTO, POR TIPO, 2018-2032 (MILES DE USD)
TABLA 953 MERCADO DE TRATAMIENTO LOCAL DEL DOLOR OCULAR EN EGIPTO, POR TIPO, 2018-2032 (MILES DE USD)
TABLA 954 MERCADO DE ESTEROIDES TÓPICOS PARA EL DOLOR OCULAR EN EGIPTO, POR TIPO, 2018-2032 (MILES DE USD)
TABLA 955 MERCADO DE ANTIINFLAMATORIOS NO ESTEROIDES (AINE) PARA EL DOLOR OCULAR EN EGIPTO, POR TIPO, 2018-2032 (MILES DE USD)
TABLA 956 EGIPTO MERCADO DE TERAPIAS DE ESTIMULACIÓN PARA EL DOLOR OCULAR, POR TIPO, 2018-2032 (MILES DE USD)
TABLA 957 MERCADO DE DOLOR OCULAR EN EGIPTO, POR APLICACIÓN, 2018-2032 (MILES DE USD)
TABLA 958 MERCADO DE DOLOR OCULAR EN EGIPTO, POR VÍA DE ADMINISTRACIÓN, 2018-2032 (MILES DE USD)
TABLA 959 MERCADO DE EGIPTO DE PRODUCTOS TÓPICOS PARA EL DOLOR OCULAR, POR VÍA DE ADMINISTRACIÓN, 2018-2032 (MILES DE USD)
TABLA 960 MERCADO DE EGIPTO DE INTRAOCULARES PARA EL DOLOR OCULAR, POR VÍA DE ADMINISTRACIÓN, 2018-2032 (MILES DE USD)
TABLA 961 MERCADO DE PERIOCULARES PARA EL DOLOR OCULAR EN EGIPTO, POR VÍA DE ADMINISTRACIÓN 2018-2032 (MILES DE USD)
TABLA 962 MERCADO DE EGIPTO DE MEDICAMENTOS ORALES PARA EL DOLOR OCULAR, POR VÍA DE ADMINISTRACIÓN, 2018-2032 (MILES DE USD)
TABLA 963 MERCADO DE DOLOR OCULAR EN EGIPTO, POR TIPO DE MEDICAMENTO, 2018-2032 (MILES DE USD)
TABLA 964 MERCADO DE DOLOR OCULAR EN EGIPTO, POR TIPO DE POBLACIÓN, 2018-2032 (MILES DE USD)
TABLA 965 MERCADO DE DOLOR OCULAR EN EGIPTO, POR USUARIO FINAL, 2018-2032 (MILES DE USD)
TABLA 966 MERCADO DE DOLOR OCULAR EN EGIPTO, POR CANAL DE DISTRIBUCIÓN, 2018-2032 (MILES DE USD)
TABLA 967 MERCADO DEL DOLOR OCULAR EN KUWAIT, POR TIPO DE ENFERMEDAD, 2018-2032 (MILES DE USD)
TABLA 968 DOLOR OCULAR EN KUWAIT CON ENFERMEDADES OCULARES EN EL MERCADO DEL DOLOR OCULAR, POR TIPO DE ENFERMEDAD, 2018-2032 (MILES DE USD)
TABLA 969 DOLOR OCULAR SIN ENFERMEDADES OCULARES PRIMARIAS EN EL MERCADO DE DOLOR OCULAR DE KUWAIT, POR TIPO DE ENFERMEDAD, 2018-2032 (MILES DE USD)
TABLA 970 MERCADO DEL DOLOR OCULAR EN KUWAIT, POR TIPO, 2018-2032 (MILES DE USD)
TABLA 971 MERCADO DE DIAGNÓSTICO DEL DOLOR OCULAR EN KUWAIT, POR TIPO, 2018-2032 (MILES DE USD)
TABLA 972 MERCADO DE PRUEBAS SENSORIALES PARA EL DOLOR OCULAR EN KUWAIT, POR TIPO, 2018-2032 (MILES DE USD)
TABLA 973 MERCADO DE PRUEBAS DE IMAGEN PARA EL DOLOR OCULAR EN KUWAIT, POR TIPO, 2018-2032 (MILES DE USD)
TABLA 974 MERCADO DE TRATAMIENTO DEL DOLOR OCULAR EN KUWAIT, POR TIPO, 2018-2032 (MILES DE USD)
TABLA 975 MERCADO DE TRATAMIENTO LOCAL DEL DOLOR OCULAR EN KUWAIT, POR TIPO, 2018-2032 (MILES DE USD)
TABLA 976 MERCADO DE ESTEROIDES TÓPICOS PARA EL DOLOR OCULAR EN KUWAIT, POR TIPO, 2018-2032 (MILES DE USD)
TABLA 977 MERCADO DE ANTIINFLAMATORIOS NO ESTEROIDES (AINE) PARA EL DOLOR OCULAR EN KUWAIT, POR TIPO, 2018-2032 (MILES DE USD)
TABLA 978 MERCADO DE TERAPIAS DE ESTIMULACIÓN PARA EL DOLOR OCULAR EN KUWAIT, POR TIPO, 2018-2032 (MILES DE USD)
TABLA 979 MERCADO DE DOLOR OCULAR DE KUWAIT, POR APLICACIÓN, 2018-2032 (MILES DE USD)
TABLA 980 MERCADO DEL DOLOR OCULAR EN KUWAIT, POR VÍA DE ADMINISTRACIÓN, 2018-2032 (MILES DE USD)
TABLA 981 MERCADO DE KUWAIT DE PRODUCTOS TÓPICOS PARA EL DOLOR OCULAR, POR VÍA DE ADMINISTRACIÓN, 2018-2032 (MILES DE USD)
TABLA 982 MERCADO DE KUWAIT DE INTRAOCULARES PARA EL DOLOR OCULAR, POR VÍA DE ADMINISTRACIÓN, 2018-2032 (MILES DE USD)
TABLA 983 MERCADO DE KUWAIT DE PERIOCULARES PARA EL DOLOR OCULAR, POR VÍA DE ADMINISTRACIÓN 2018-2032 (MILES DE USD)
TABLA 984 MERCADO DE KUWAIT DE MEDICAMENTOS ORALES PARA EL DOLOR OCULAR, POR VÍA DE ADMINISTRACIÓN, 2018-2032 (MILES DE USD)
TABLA 985 MERCADO DEL DOLOR OCULAR EN KUWAIT, POR TIPO DE MEDICAMENTO, 2018-2032 (MILES DE USD)
TABLA 986 MERCADO DEL DOLOR OCULAR EN KUWAIT, POR TIPO DE POBLACIÓN, 2018-2032 (MILES DE USD)
TABLA 987 MERCADO DE DOLOR OCULAR DE KUWAIT, POR USUARIO FINAL, 2018-2032 (MILES DE USD)
TABLA 988 MERCADO DEL DOLOR OCULAR EN KUWAIT, POR CANAL DE DISTRIBUCIÓN, 2018-2032 (MILES DE USD)
TABLA 989 MERCADO DE DOLOR OCULAR EN ISRAEL, POR TIPO DE ENFERMEDAD, 2018-2032 (MILES DE USD)
TABLA 990 DOLOR OCULAR EN ISRAEL CON ENFERMEDADES OCULARES EN EL MERCADO DEL DOLOR OCULAR, POR TIPO DE ENFERMEDAD, 2018-2032 (MILES DE USD)
TABLA 991 DOLOR OCULAR EN ISRAEL SIN ENFERMEDADES OCULARES PRIMARIAS EN EL MERCADO DE DOLOR OCULAR, POR TIPO DE ENFERMEDAD, 2018-2032 (MILES DE USD)
TABLA 992 MERCADO DE DOLOR OCULAR EN ISRAEL, POR TIPO, 2018-2032 (MILES DE USD)
TABLA 993 DIAGNÓSTICO EN EL MERCADO DE DOLOR OCULAR EN ISRAEL, POR TIPO, 2018-2032 (MILES DE USD)
TABLA 994 MERCADO DE PRUEBAS SENSORIALES PARA EL DOLOR OCULAR EN ISRAEL, POR TIPO, 2018-2032 (MILES DE USD)
TABLA 995 MERCADO DE PRUEBAS DE IMAGEN PARA EL DOLOR OCULAR EN ISRAEL, POR TIPO, 2018-2032 (MILES DE USD)
TABLA 996 TRATAMIENTO DEL DOLOR OCULAR EN ISRAEL, POR TIPO, 2018-2032 (MILES DE USD)
TABLA 997 MERCADO DE TRATAMIENTO LOCAL DEL DOLOR OCULAR EN ISRAEL, POR TIPO, 2018-2032 (MILES DE USD)
TABLA 998 MERCADO DE ESTEROIDES TÓPICOS PARA EL DOLOR OCULAR EN ISRAEL, POR TIPO, 2018-2032 (MILES DE USD)
TABLA 999 MERCADO DE ANTIINFLAMATORIOS NO ESTEROIDES (AINE) PARA EL DOLOR OCULAR EN ISRAEL, POR TIPO, 2018-2032 (MILES DE USD)
TABLA 1000 MERCADO DE TERAPIAS DE ESTIMULACIÓN PARA EL DOLOR OCULAR EN ISRAEL, POR TIPO, 2018-2032 (MILES DE USD)
TABLA 1001 MERCADO DE DOLOR OCULAR EN ISRAEL, POR APLICACIÓN, 2018-2032 (MILES DE USD)
TABLA 1002 MERCADO DE DOLOR OCULAR EN ISRAEL, POR VÍA DE ADMINISTRACIÓN, 2018-2032 (MILES DE USD)
TABLA 1003 MERCADO DE PRODUCTOS TÓPICOS PARA EL DOLOR OCULAR EN ISRAEL, POR VÍA DE ADMINISTRACIÓN, 2018-2032 (MILES DE USD)
TABLA 1004 MERCADO DE INTRAOCULARES PARA EL DOLOR OCULAR EN ISRAEL, POR VÍA DE ADMINISTRACIÓN, 2018-2032 (MILES DE USD)
TABLA 1005 MERCADO DE PERIOCULARES EN ISRAEL PARA EL DOLOR OCULAR, POR VÍA DE ADMINISTRACIÓN 2018-2032 (MILES DE USD)
TABLA 1006 MERCADO DE FARMACÉUTICOS ORALES PARA EL DOLOR OCULAR EN ISRAEL, POR VÍA DE ADMINISTRACIÓN, 2018-2032 (MILES DE USD)
TABLA 1007 MERCADO DE DOLOR OCULAR EN ISRAEL, POR TIPO DE MEDICAMENTO, 2018-2032 (MILES DE USD)
TABLA 1008 MERCADO DE DOLOR OCULAR EN ISRAEL, POR TIPO DE POBLACIÓN, 2018-2032 (MILES DE USD)
TABLA 1009 MERCADO DE DOLOR OCULAR EN ISRAEL, POR USUARIO FINAL, 2018-2032 (MILES DE USD)
TABLA 1010 MERCADO DE DOLOR OCULAR EN ISRAEL, POR CANAL DE DISTRIBUCIÓN, 2018-2032 (MILES DE USD)
TABLA 1011 RESTO DEL MERCADO DEL DOLOR OCULAR EN ORIENTE MEDIO Y ÁFRICA, POR TIPO DE ENFERMEDAD, 2018-2032 (MILES DE USD)
Lista de figuras
FIGURA 1 MERCADO MUNDIAL DEL DOLOR OCULAR: SEGMENTACIÓN
FIGURA 2 MERCADO MUNDIAL DEL DOLOR OCULAR: TRIANGULACIÓN DE DATOS
FIGURA 3 MERCADO MUNDIAL DEL DOLOR OCULAR: ANÁLISIS DROC
FIGURA 4 MERCADO MUNDIAL DEL DOLOR OCULAR: ANÁLISIS GLOBAL VS. REGIONAL
FIGURA 5 MERCADO GLOBAL DEL DOLOR OCULAR: ANÁLISIS DE INVESTIGACIÓN DE LA EMPRESA
FIGURA 6 MERCADO MUNDIAL DEL DOLOR OCULAR: DATOS DEMOGRÁFICOS DE LAS ENTREVISTAS
FIGURA 7 MERCADO GLOBAL DEL DOLOR OCULAR: CUADRÍCULA DE POSICIÓN EN EL MERCADO DE DBMR
FIGURA 8 MERCADO MUNDIAL DEL DOLOR OCULAR: ANÁLISIS DE LA PARTICIPACIÓN DE LOS PROVEEDORES
FIGURA 9 MERCADO MUNDIAL DEL DOLOR OCULAR: CUADRÍCULA DE COBERTURA DE USUARIOS FINALES DEL MERCADO
FIGURA 10 MERCADO MUNDIAL DEL DOLOR OCULAR: SEGMENTACIÓN
FIGURA 11 MERCADO MUNDIAL DEL DOLOR OCULAR: RESUMEN EJECUTIVO
FIGURA 12 DECISIONES ESTRATÉGICAS
FIGURA 13 SE ESPERA QUE AMÉRICA DEL NORTE DOMINE EL MERCADO MUNDIAL DEL DOLOR OCULAR Y SE PROYECTA QUE CRECERÁ CON LA CAGR MÁS ALTA EN EL PERÍODO PRONOSTICADO DE 2025 A 2032
FIGURA 14 SE ESPERA QUE EL AUMENTO DEL ESTILO DE VIDA ANTHIGIÉNICO Y SEDENTARIO IMPULSARA EL MERCADO MUNDIAL DEL DOLOR OCULAR EN EL PERÍODO PRONOSTICADO DE 2025 A 2032
FIGURA 15 SE ESPERA QUE EL SEGMENTO DE DOLOR OCULAR CON ENFERMEDADES OCULARES REPRESENTE LA MAYOR PARTICIPACIÓN DEL MERCADO MUNDIAL DE DOLOR OCULAR EN 2025 Y 2032
FIGURA 16 AMÉRICA DEL NORTE ES EL MERCADO DE MAYOR CRECIMIENTO PARA FABRICANTES DE PRODUCTOS PARA EL DOLOR OCULAR EN EL PERÍODO PRONOSTICADO DE 2025 A 2032
FIGURA 17 PAÍS V/S NÚMERO DE PATENTES
FIGURA 18 SOLICITANTES CLAVE V/S NÚMERO DE PATENTES.
FIGURA 19 CLASIFICACIÓN INTERNACIONAL DE PATENTES VS NÚMERO DE PATENTES
FIGURA 20 NÚMERO DE PUBLICACIONES DE PATENTES POR AÑO.
FIGURA 21 IMPULSORES, RESTRICCIONES, OPORTUNIDADES Y DESAFÍOS DEL MERCADO MUNDIAL DEL DOLOR OCULAR
FIGURA 22 MERCADO MUNDIAL DEL DOLOR OCULAR: POR TIPO DE ENFERMEDAD, 2024
FIGURA 23 MERCADO MUNDIAL DEL DOLOR OCULAR: POR TIPO DE ENFERMEDAD, 2025 A 2032 (MILES DE USD)
FIGURA 24 MERCADO GLOBAL DEL DOLOR OCULAR: POR TIPO DE ENFERMEDAD, CAGR (2025-2032)
FIGURA 25 MERCADO MUNDIAL DEL DOLOR OCULAR: POR TIPO DE ENFERMEDAD, CURVA DE LÍNEA DE VIDA
FIGURA 26 MERCADO MUNDIAL DEL DOLOR OCULAR: POR TIPO, 2024
FIGURA 27 MERCADO MUNDIAL DEL DOLOR OCULAR: POR TIPO, 2025 A 2032 (MILES DE USD)
FIGURA 28 MERCADO GLOBAL DEL DOLOR OCULAR: POR TIPO, CAGR (2025-2032)
FIGURA 29 MERCADO MUNDIAL DEL DOLOR OCULAR: POR TIPO, CURVA DE LÍNEA DE VIDA
FIGURA 30 MERCADO MUNDIAL DEL DOLOR OCULAR: POR APLICACIÓN, 2024
FIGURA 31 MERCADO MUNDIAL DEL DOLOR OCULAR: POR APLICACIÓN, 2025 A 2032 (MILES DE USD)
FIGURA 32 MERCADO GLOBAL DEL DOLOR OCULAR: POR APLICACIÓN, CAGR (2025-2032)
FIGURA 33 MERCADO MUNDIAL DEL DOLOR OCULAR: POR APLICACIÓN, CURVA DE LÍNEA DE VIDA
FIGURA 34 MERCADO MUNDIAL DEL DOLOR OCULAR: POR VÍA DE ADMINISTRACIÓN, 2024
FIGURA 35 MERCADO MUNDIAL DEL DOLOR OCULAR: POR VÍA DE ADMINISTRACIÓN, 2025 A 2032 (MILES DE USD)
FIGURA 36 MERCADO GLOBAL DEL DOLOR OCULAR: POR VÍA DE ADMINISTRACIÓN, CAGR (2025-2032)
FIGURA 37 MERCADO MUNDIAL DEL DOLOR OCULAR: POR VÍA DE ADMINISTRACIÓN, CURVA DE LÍNEA DE VIDA
FIGURA 38 MERCADO MUNDIAL DEL DOLOR OCULAR: POR TIPO DE POBLACIÓN, 2024
FIGURA 39 MERCADO MUNDIAL DEL DOLOR OCULAR: POR TIPO DE POBLACIÓN, 2025 A 2032 (MILES DE USD)
FIGURA 40 MERCADO MUNDIAL DEL DOLOR OCULAR: POR TIPO DE POBLACIÓN, CAGR (2025-2032)
FIGURA 41 MERCADO MUNDIAL DEL DOLOR OCULAR: POR TIPO DE POBLACIÓN, CURVA DE LÍNEA DE VIDA
FIGURA 42 MERCADO MUNDIAL DEL DOLOR OCULAR: POR TIPO DE MEDICAMENTO, 2024
FIGURA 43 MERCADO MUNDIAL DEL DOLOR OCULAR: POR TIPO DE MEDICAMENTO, 2025 A 2032 (MILES DE USD)
FIGURA 44 MERCADO MUNDIAL DEL DOLOR OCULAR: POR TIPO DE FÁRMACO, CAGR (2025-2032)
FIGURA 45 MERCADO MUNDIAL DEL DOLOR OCULAR: POR TIPO DE FÁRMACO, CURVA DE LÍNEA DE VIDA
FIGURA 46 MERCADO MUNDIAL DEL DOLOR OCULAR: POR USUARIO FINAL, 2024
FIGURA 47 MERCADO MUNDIAL DEL DOLOR OCULAR: POR USUARIO FINAL, 2025 A 2032 (MILES DE USD)
FIGURA 48 MERCADO GLOBAL DEL DOLOR OCULAR: POR USUARIO FINAL, CAGR (2025-2032)
FIGURA 49 MERCADO MUNDIAL DEL DOLOR OCULAR: POR USUARIO FINAL, CURVA LIFELINE
FIGURA 50 MERCADO MUNDIAL DEL DOLOR OCULAR: POR CANAL DE DISTRIBUCIÓN, 2024
FIGURA 51 MERCADO MUNDIAL DEL DOLOR OCULAR: POR CANAL DE DISTRIBUCIÓN, 2025 A 2032 (MILES DE USD)
FIGURA 52 MERCADO GLOBAL DEL DOLOR OCULAR: POR CANAL DE DISTRIBUCIÓN, CAGR (2025-2032)
FIGURA 53 MERCADO MUNDIAL DEL DOLOR OCULAR: POR CANAL DE DISTRIBUCIÓN, CURVA LIFELINE
FIGURA 54 MERCADO MUNDIAL DEL DOLOR OCULAR: INSTANTÁNEA (2024)
FIGURA 55 MERCADO MUNDIAL DEL DOLOR OCULAR: PARTICIPACIÓN DE LA EMPRESA 2024 (%)
FIGURA 56 MERCADO DE DOLOR OCULAR EN AMÉRICA DEL NORTE: PARTICIPACIÓN DE LA EMPRESA 2024 (%)
FIGURA 57 MERCADO EUROPEO DEL DOLOR OCULAR: CUOTA DE LA EMPRESA 2024 (%)
FIGURA 58 MERCADO DEL DOLOR OCULAR EN ASIA-PACÍFICO: PARTICIPACIÓN DE LA EMPRESA 2024 (%)
Metodología de investigación
La recopilación de datos y el análisis del año base se realizan utilizando módulos de recopilación de datos con muestras de gran tamaño. La etapa incluye la obtención de información de mercado o datos relacionados a través de varias fuentes y estrategias. Incluye el examen y la planificación de todos los datos adquiridos del pasado con antelación. Asimismo, abarca el examen de las inconsistencias de información observadas en diferentes fuentes de información. Los datos de mercado se analizan y estiman utilizando modelos estadísticos y coherentes de mercado. Además, el análisis de la participación de mercado y el análisis de tendencias clave son los principales factores de éxito en el informe de mercado. Para obtener más información, solicite una llamada de un analista o envíe su consulta.
La metodología de investigación clave utilizada por el equipo de investigación de DBMR es la triangulación de datos, que implica la extracción de datos, el análisis del impacto de las variables de datos en el mercado y la validación primaria (experto en la industria). Los modelos de datos incluyen cuadrícula de posicionamiento de proveedores, análisis de línea de tiempo de mercado, descripción general y guía del mercado, cuadrícula de posicionamiento de la empresa, análisis de patentes, análisis de precios, análisis de participación de mercado de la empresa, estándares de medición, análisis global versus regional y de participación de proveedores. Para obtener más información sobre la metodología de investigación, envíe una consulta para hablar con nuestros expertos de la industria.
Personalización disponible
Data Bridge Market Research es líder en investigación formativa avanzada. Nos enorgullecemos de brindar servicios a nuestros clientes existentes y nuevos con datos y análisis que coinciden y se adaptan a sus objetivos. El informe se puede personalizar para incluir análisis de tendencias de precios de marcas objetivo, comprensión del mercado de países adicionales (solicite la lista de países), datos de resultados de ensayos clínicos, revisión de literatura, análisis de mercado renovado y base de productos. El análisis de mercado de competidores objetivo se puede analizar desde análisis basados en tecnología hasta estrategias de cartera de mercado. Podemos agregar tantos competidores sobre los que necesite datos en el formato y estilo de datos que esté buscando. Nuestro equipo de analistas también puede proporcionarle datos en archivos de Excel sin procesar, tablas dinámicas (libro de datos) o puede ayudarlo a crear presentaciones a partir de los conjuntos de datos disponibles en el informe.

