Global Plastic Compounding Market
Tamaño del mercado en miles de millones de dólares
Tasa de crecimiento anual compuesta (CAGR) :
% 
 USD
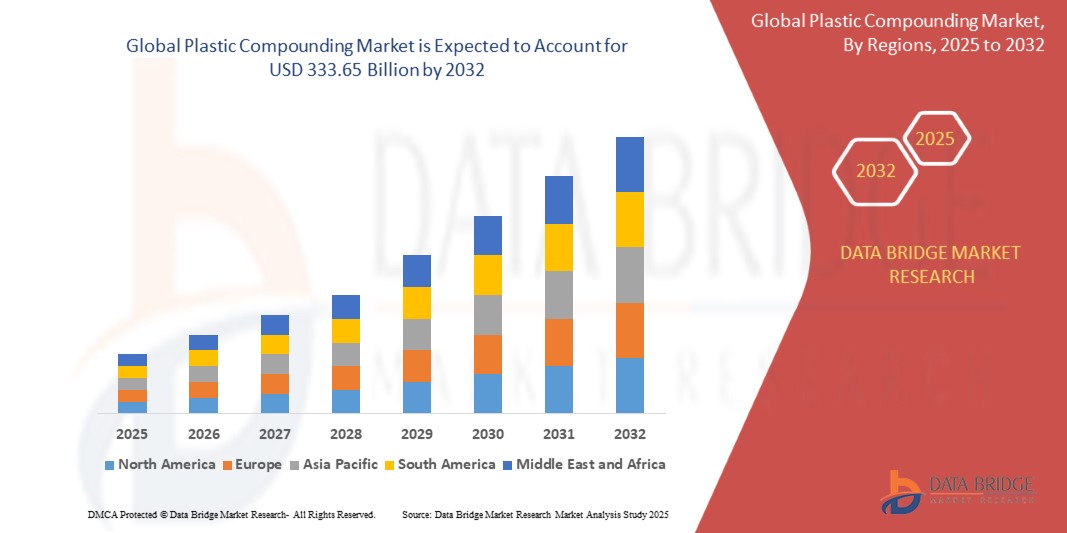
226.24 Billion
USD
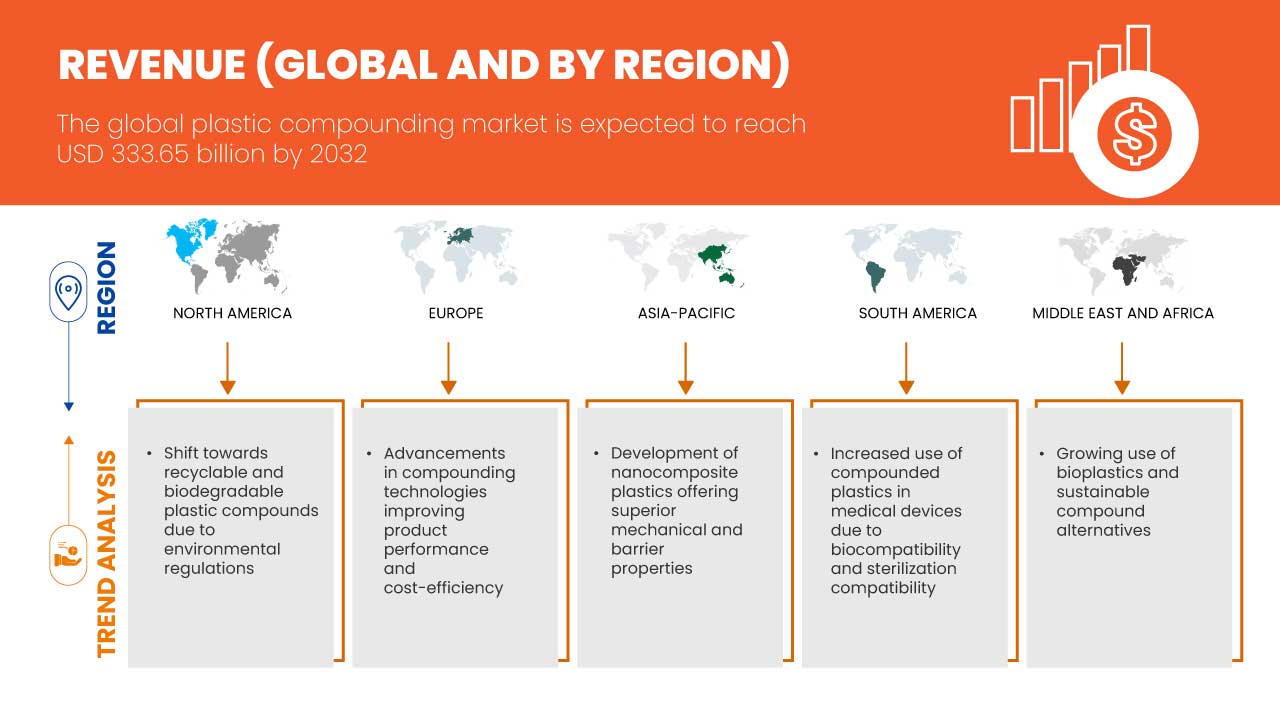
333.65 Billion
2024
2032
USD
226.24 Billion
USD
333.65 Billion
2024
2032
| 2025 –2032 | |
| USD 226.24 Billion | |
| USD 333.65 Billion | |
| % | |
|
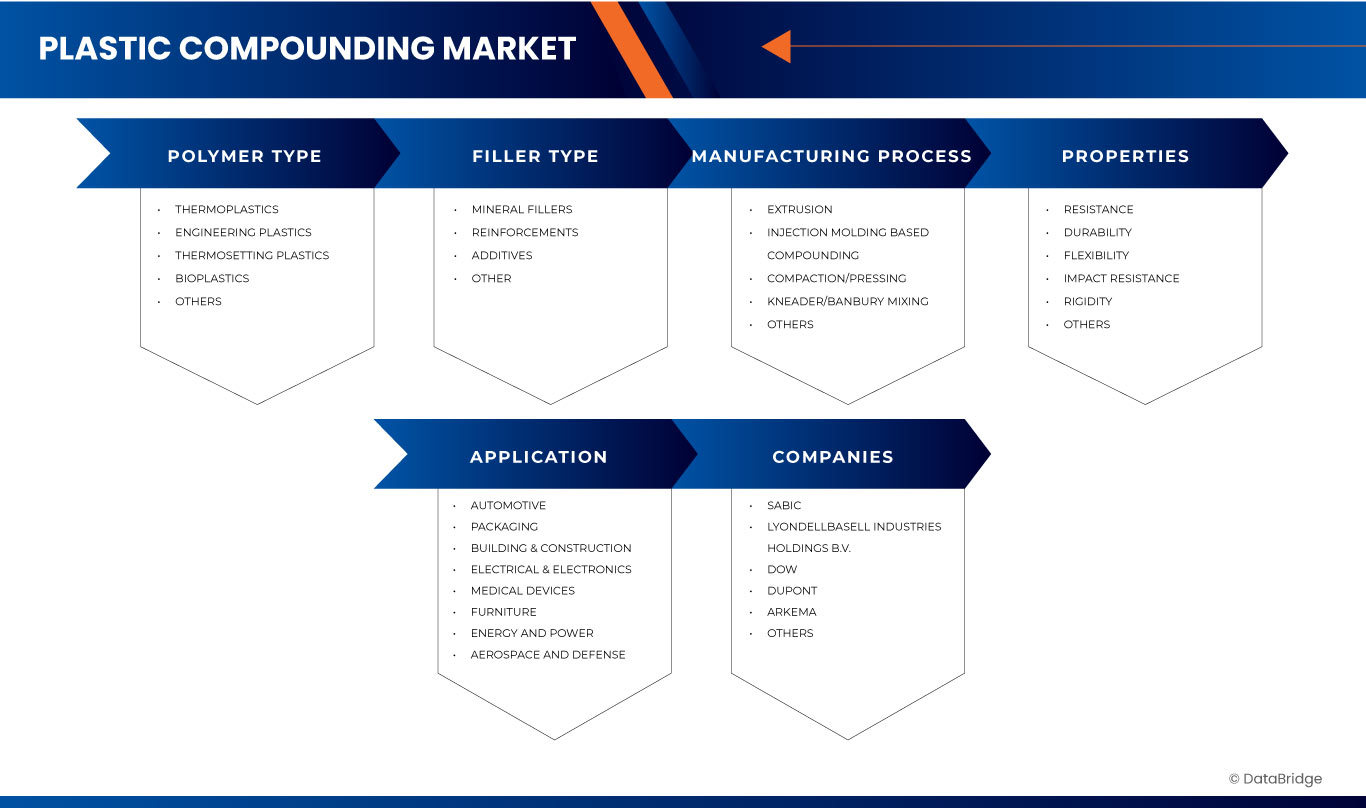
Segmentación del mercado global de compuestos plásticos por tipo de polímero (termoplásticos, termoestables, plásticos de ingeniería, bioplásticos, etc.), tipo de relleno (rellenos minerales, refuerzos, aditivos, etc.), proceso de fabricación (extrusión, compactación/prensado, amasadora/mezcla Banbury, compuestos por moldeo por inyección, etc.), propiedades (resistencia, durabilidad, flexibilidad, resistencia al impacto, rigidez, etc.), aplicación (aeroespacial y defensa, embalaje, electricidad y electrónica, energía, construcción, automoción, dispositivos médicos, mobiliario, etc.): tendencias y pronóstico del sector hasta 2032.
Tamaño del mercado de compuestos plásticos
- El tamaño del mercado mundial de compuestos plásticos se valoró en USD 226,24 mil millones en 2024 y se espera que alcance los USD 333,65 mil millones para 2032 , con una CAGR de 5,02% durante el período de pronóstico por el cambio hacia compuestos plásticos reciclables y biodegradables debido a las regulaciones ambientales, los avances en las tecnologías de compuestos que mejoran el rendimiento del producto y la rentabilidad y las políticas e iniciativas gubernamentales de apoyo que promueven el uso de plásticos en diversas industrias.
- Además, se espera que el mercado aumente el uso de bioplásticos y alternativas de compuestos sostenibles, el aumento en la adopción de vehículos eléctricos que requieren polímeros avanzados y la creciente demanda de soluciones plásticas reciclables y circulares.
Análisis del mercado de compuestos plásticos
- El aumento global en el cambio hacia compuestos plásticos reciclables y biodegradables debido a las regulaciones ambientales, los avances en las tecnologías de compuestos que mejoran el rendimiento del producto y la rentabilidad.
- Los factores clave incluyen el aumento global en el cambio hacia compuestos plásticos reciclables y biodegradables debido a las regulaciones ambientales, los avances en tecnologías de compuestos que mejoran el rendimiento y la rentabilidad de los productos, la creciente demanda de los sectores de transmisión de energía y el aumento de las inversiones en la modernización de la red y la infraestructura transfronteriza.
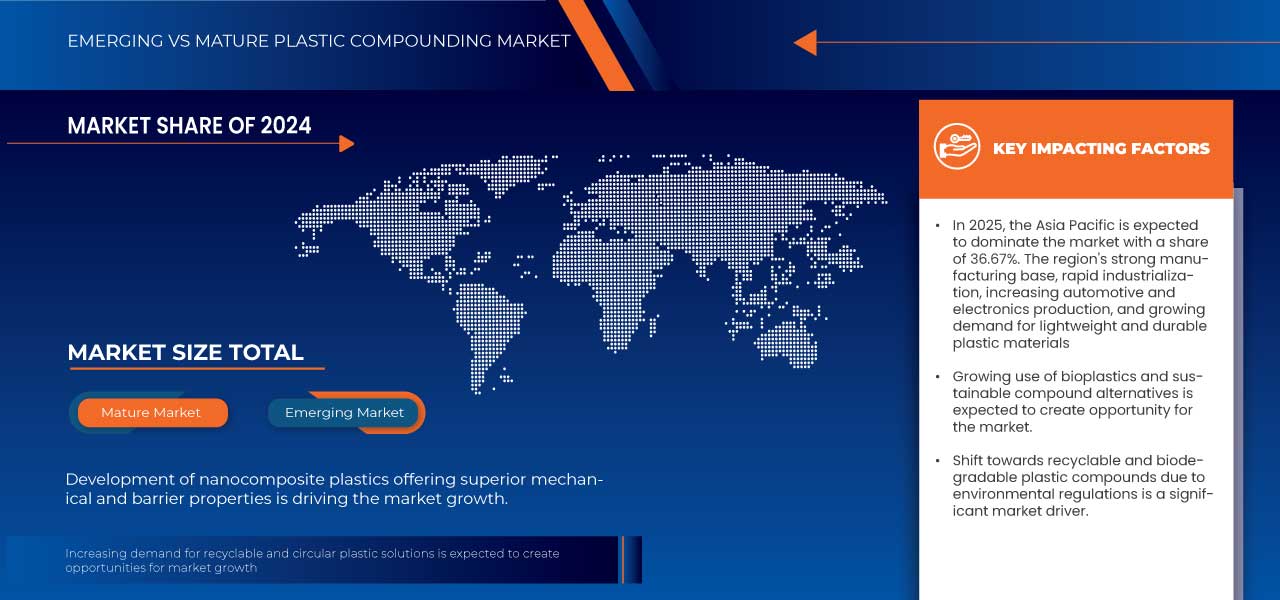
- Asia-Pacífico domina el mercado mundial de compuestos plásticos con una participación del 36,53 % en 2024, impulsada por la rápida industrialización, la expansión de los sectores automotriz y de la construcción y políticas gubernamentales de apoyo que promueven el crecimiento de la manufactura.
- Asia-Pacífico es la región de más rápido crecimiento en el mercado mundial de compuestos plásticos, impulsada por la creciente demanda de los consumidores, los avances tecnológicos en el procesamiento de materiales y una mayor inversión extranjera en industrias clave de uso final.
- El segmento de termoplásticos domina el mercado con una participación del 63,17%, creciendo a una CAGR del 4,6% entre 2025 y 2032, debido a su superior resistencia mecánica, resistencia al calor y creciente uso en la fabricación de automóviles, electrónica y equipos industriales.
Alcance del informe y segmentación del mercado de compuestos plásticos
|
Atributos |
Perspectivas clave del mercado de compuestos plásticos |
|
Segmentos cubiertos |
|
|
Países cubiertos |
América del norte
Europa
Asia-Pacífico
Sudamerica
Oriente Medio y África
|
|
Actores clave del mercado |
|
|
Oportunidades de mercado |
|
|
Conjuntos de información de datos de valor añadido |
Además de los conocimientos sobre escenarios de mercado como valor de mercado, tasa de crecimiento, segmentación, cobertura geográfica y actores principales, los informes de mercado seleccionados por Data Bridge Market Research también incluyen análisis de importación y exportación, descripción general de la capacidad de producción, análisis del consumo de producción, análisis de tendencias de precios, escenario de cambio climático, análisis de la cadena de suministro, análisis de la cadena de valor, descripción general de materias primas/consumibles, criterios de selección de proveedores, análisis PESTLE, análisis de Porter y marco regulatorio. |
Tendencias del mercado de compuestos plásticos
Creciente demanda de plásticos de alto rendimiento
- La demanda de compuestos plásticos de alto rendimiento está creciendo rápidamente, impulsada por la creciente urbanización, la actividad industrial y el creciente uso de vehículos eléctricos e infraestructuras inteligentes. Los compuestos plásticos avanzados abordan estos desafíos ofreciendo mayor durabilidad, eficiencia energética y un rendimiento superior del producto.
- A medida que los países se centran en reducir las emisiones de carbono y mejorar la estabilidad de la red eléctrica, se observa una tendencia creciente hacia la modernización de la infraestructura eléctrica mediante el uso de compuestos plásticos innovadores. Esta transición es crucial para satisfacer la creciente demanda de electricidad, a la vez que se promueven sistemas de transmisión más limpios y eficientes.
- Los principales actores de la industria, como Covestro, LyondellBasell y BASF, están aumentando significativamente sus esfuerzos de I+D para desarrollar compuestos plásticos de próxima generación que sean más sostenibles, flexibles y de alto rendimiento, impulsando aún más la innovación y el crecimiento del mercado.
- Los avances en la tecnología de compuestos plásticos, caracterizados por una mejor estabilidad térmica, aislamiento eléctrico y resistencia mecánica, impulsan el crecimiento del mercado. Los principales fabricantes desarrollan activamente compuestos especializados para apoyar la integración de energías renovables a gran escala y mejorar la infraestructura energética interregional, impulsando la expansión del mercado global de compuestos plásticos.
Dinámica del mercado de compuestos plásticos
Conductor
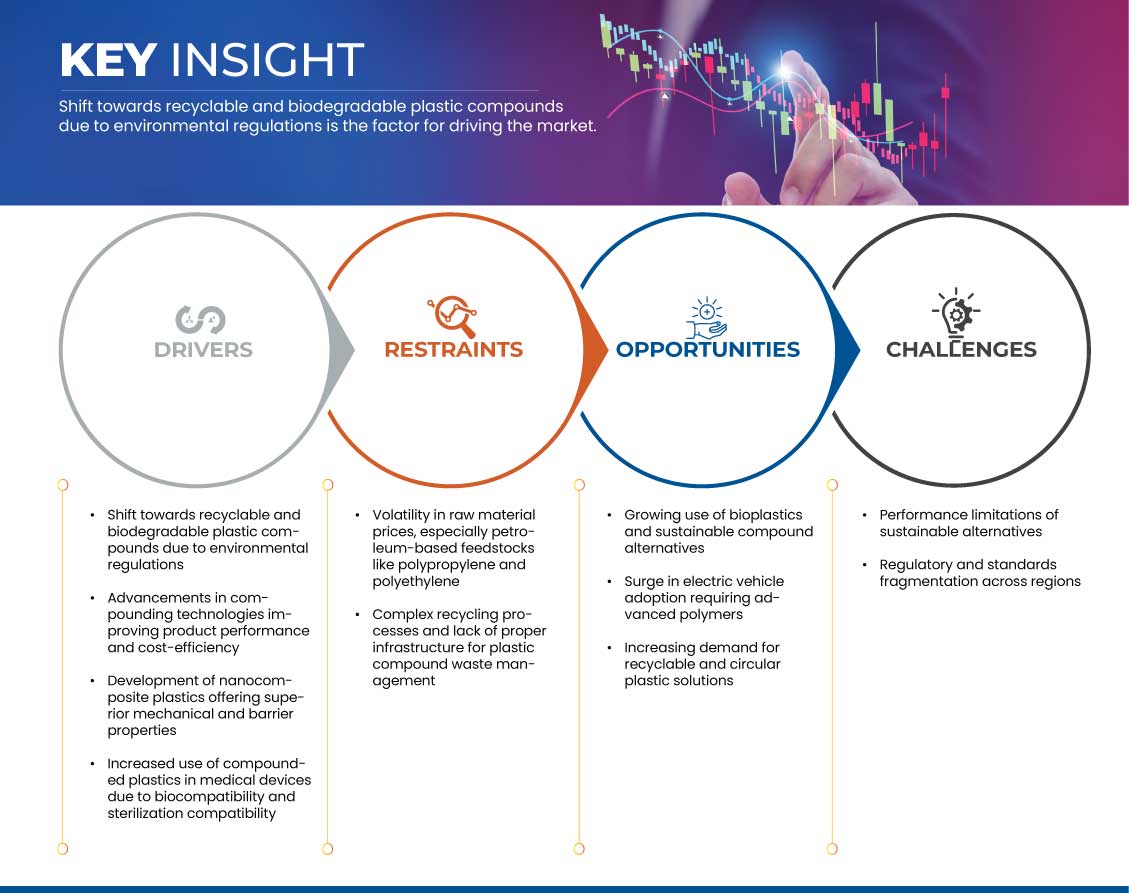
Cambio hacia compuestos plásticos reciclables y biodegradables debido a las regulaciones ambientales
- La creciente demanda mundial de materiales sostenibles, impulsada por estrictas regulaciones ambientales, la creciente concienciación de los consumidores y los objetivos de sostenibilidad de las empresas, está ejerciendo una enorme presión sobre los métodos tradicionales de producción de plástico. Para afrontar este desafío, muchos fabricantes están acelerando las inversiones en compuestos plásticos reciclables y biodegradables para reducir el impacto ambiental y apoyar iniciativas de economía circular. Estos avances están creando soluciones de materiales más ecológicas, eficientes y preparadas para el futuro, de forma similar a cómo las tecnologías de eficiencia energética optimizan el uso de recursos.
- Por ejemplo, en 2024, varias importantes empresas químicas anunciaron proyectos a gran escala centrados en ampliar la capacidad de fabricación de compuestos de plásticos biodegradables, con el objetivo de satisfacer la creciente demanda de los sectores del embalaje, la automoción y los bienes de consumo. Estas iniciativas se centran en reducir los residuos plásticos, mejorar la reciclabilidad y cumplir con los marcos regulatorios globales, como el Plan de Acción para la Economía Circular de la UE.
- Estas inversiones no solo están transformando las formulaciones de materiales, sino que también permiten una mayor adopción de plásticos sostenibles en todas las industrias. Empresas líderes como BASF, Covestro y LyondellBasell están invirtiendo fuertemente en I+D para desarrollar compuestos plásticos de origen biológico y reciclables de nueva generación, garantizando un mejor rendimiento y cumplimiento ambiental.
- Además, el compromiso continuo de gobiernos, empresas privadas y organismos reguladores desempeña un papel fundamental en la promoción de los plásticos reciclables y biodegradables como componente esencial de las iniciativas globales de sostenibilidad. Estas iniciativas están consolidando los compuestos plásticos ecológicos como un factor clave de la economía circular y un importante motor de crecimiento en el mercado global de compuestos plásticos.
Restricción/Desafío
Volatilidad en los precios de las materias primas, especialmente las derivadas del petróleo, como el polipropileno y el polietileno
- La volatilidad de los precios de las materias primas, en particular las derivadas del petróleo, como el polipropileno y el polietileno, sigue siendo un obstáculo importante para el mercado de compuestos plásticos. La fluctuación de los precios afecta los costos de producción y la rentabilidad, lo que genera incertidumbre tanto para los fabricantes como para los usuarios finales.
- Además, la dependencia de los mercados de petróleo crudo expone a la industria de compuestos a tensiones geopolíticas, interrupciones en la cadena de suministro y políticas comerciales cambiantes, que pueden conducir a picos repentinos de precios o escasez.
- Por ejemplo, a principios de 2025, las fluctuaciones del precio mundial del petróleo crudo provocaron que los precios del polipropileno variaran más de un 20% en cuestión de meses, lo que afectó directamente los costos de insumos de los fabricantes de compuestos plásticos y obligó a realizar ajustes en las estrategias de precios.
- Además, las materias primas alternativas, como las materias primas de origen biológico, si bien son prometedoras, actualmente están limitadas por los mayores costos y los desafíos de escalabilidad, lo que impide mitigar por completo la volatilidad de los precios del petróleo.
- Esta inestabilidad de precios plantea desafíos para la planificación y la inversión a largo plazo en el sector de compuestos plásticos, especialmente para los pequeños fabricantes y las regiones con menor resiliencia financiera. A pesar de los esfuerzos por diversificar las fuentes de materias primas y mejorar la flexibilidad de la cadena de suministro, la volatilidad de los precios de las materias primas sigue siendo un obstáculo clave para un crecimiento estable.
Alcance del mercado de compuestos plásticos
El mercado está segmentado según el tipo de polímero, tipo de relleno, proceso de fabricación, propiedades y aplicación.
- Tipo de polímero
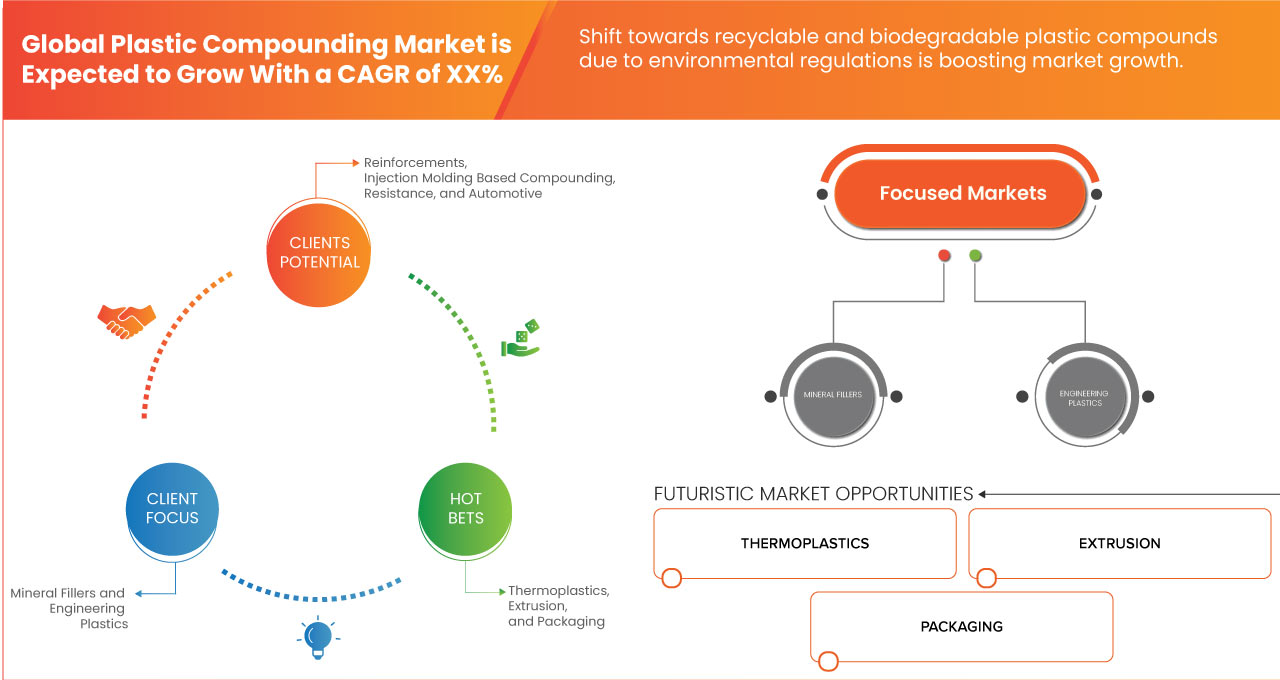
Según el tipo de polímero, el mercado se segmenta en termoplásticos, plásticos termoestables, plásticos de ingeniería, bioplásticos y otros. En 2025, se prevé que el segmento de termoplásticos domine el mercado con una cuota de mercado del 62,93 %, con una tasa de crecimiento anual compuesta (TCAC) del 4,62 % entre 2025 y 2032, impulsada por la creciente demanda de materiales ligeros y duraderos en todas las industrias y un mayor enfoque en compuestos plásticos reciclables y sostenibles.
- Tipo de relleno
Según el tipo de relleno, el mercado se segmenta en rellenos minerales, refuerzos, aditivos y otros. En 2025, se prevé que el segmento de rellenos minerales domine el mercado con una cuota de mercado del 49,89 %, con una tasa de crecimiento anual compuesta (TCAC) del 5,70 % entre 2025 y 2032, impulsada por la creciente demanda de mejores propiedades de los materiales, la rentabilidad y su creciente adopción en diversas aplicaciones industriales.
- Proceso de fabricación
Según el proceso de fabricación, el mercado se segmenta en extrusión, compactación/prensado, amasadora/mezcla Banbury, compuestos basados en moldeo por inyección, entre otros. En 2025, se prevé que el segmento de extrusión domine el mercado con una cuota de mercado del 46,26 %, con una tasa de crecimiento anual compuesta (TCAC) del 5,34 % entre 2025 y 2032, impulsada por su adopción generalizada para un compuesto eficiente y continuo, y la creciente demanda de compuestos plásticos de alta calidad en diversas industrias.
- Propiedades
Según sus propiedades, el mercado se segmenta en resistencia, durabilidad, flexibilidad, resistencia al impacto, rigidez, entre otras. En 2025, se prevé que el segmento de resistencia domine el mercado con una cuota de mercado del 30,83 %, con una tasa de crecimiento anual compuesta (TCAC) del 5,57 % entre 2025 y 2032, impulsada por la creciente demanda de compuestos plásticos duraderos y de alto rendimiento en las industrias automotriz, de construcción y de bienes de consumo.
- Solicitud
Según la aplicación, el mercado se segmenta en aeroespacial y defensa, embalaje, electricidad y electrónica, energía y electricidad, construcción, automoción, dispositivos médicos, mobiliario, entre otros. En 2025, se prevé que el segmento automotriz domine el mercado con una cuota de mercado del 29,60 %, con una tasa de crecimiento anual compuesta (TCAC) del 4,03 % entre 2025 y 2032, impulsada por la creciente demanda de compuestos plásticos ligeros, duraderos y reciclables para mejorar la eficiencia del combustible y cumplir con las estrictas normativas ambientales.
Análisis regional del mercado de compuestos plásticos
- Se espera que el mercado de compuestos plásticos de Asia-Pacífico alcance los 125.540 millones de dólares en 2032, desde los 82.650 millones de dólares en 2024, con un crecimiento anual compuesto (CAGR) del 5,41 % en el período de pronóstico de 2025 a 2032.
- Asia-Pacífico destina una parte significativa de su PIB a la manufactura y el desarrollo industrial, lo que garantiza una sólida financiación para materiales avanzados y tecnologías innovadoras de compuestos plásticos. En cambio, los mercados emergentes están incrementando sus inversiones en compuestos plásticos, impulsados por la creciente industrialización, la urbanización y la creciente demanda de materiales sostenibles y de alto rendimiento. La disponibilidad de financiación, tanto del sector público como del privado, desempeña un papel crucial en la expansión de la capacidad de producción y la adopción de compuestos plásticos avanzados a nivel mundial.
- En Asia-Pacífico, las tecnologías avanzadas de compuestos plásticos se adoptan e integran ampliamente en diversas aplicaciones industriales, impulsando sectores como la automoción, la aeroespacial y la electrónica. Por el contrario, los mercados emergentes con infraestructura de fabricación en desarrollo están experimentando un rápido crecimiento de la demanda de compuestos plásticos especializados, impulsado por la expansión de las bases industriales y el aumento de las necesidades en los sectores de la salud, la automoción y el embalaje. A medida que estos sistemas sanitarios e industriales se centralizan o privatizan, a menudo se produce un aumento de la inversión en tecnologías de vanguardia para compuestos plásticos, lo que promueve el crecimiento del mercado y la accesibilidad.
Perspectiva del mercado europeo de compuestos plásticos
Se espera que Europa registre una CAGR del 4,90 % entre 2025 y 2032, impulsada por estrictas regulaciones ambientales, avances en plásticos sostenibles y una creciente demanda en los sectores automotriz y de construcción.
Análisis del mercado alemán de compuestos plásticos
Se espera que Alemania registre una CAGR del 5,55% entre 2025 y 2032, respaldada por una fuerte innovación industrial, una alta demanda en las industrias automotriz y eléctrica y un énfasis en materiales ecológicos.
Análisis del mercado italiano de compuestos plásticos
Se espera que Italia registre una CAGR del 5,32% entre 2025 y 2032, impulsada por el crecimiento en los sectores de envases y bienes de consumo, un mayor uso de plásticos biodegradables e inversiones en infraestructura de reciclaje.
Perspectiva del mercado de compuestos plásticos de América del Norte
Se espera que América del Norte registre una CAGR del 4,75 % entre 2025 y 2032, impulsada por los avances tecnológicos en la ciencia de los polímeros, la creciente producción de vehículos eléctricos y los incentivos gubernamentales para materiales sostenibles.
Perspectiva del mercado canadiense de compuestos plásticos
Se espera que Canadá registre una CAGR del 4,44 % entre 2025 y 2032, impulsada por la creciente demanda en las industrias de la atención médica y la construcción, el enfoque en la reducción de residuos plásticos y el desarrollo de compuestos plásticos de alto rendimiento.
Perspectiva del mercado de compuestos plásticos en Oriente Medio y África
Se espera que Oriente Medio y África registren una CAGR del 4,61 % entre 2025 y 2032, impulsada por el desarrollo de infraestructura, la creciente fabricación de productos electrónicos y la creciente demanda de soluciones plásticas innovadoras.
Análisis del mercado de compuestos plásticos de Arabia Saudita
Se espera que Arabia Saudita registre una CAGR del 5,86% entre 2025 y 2032, impulsada por inversiones en industrias petroquímicas, iniciativas gubernamentales para la diversificación industrial y la creciente adopción de plásticos avanzados.
Análisis del mercado egipcio de compuestos plásticos
Se espera que Egipto registre una CAGR del 4,51% entre 2025 y 2032, respaldado por la creciente demanda de envases, la expansión de las actividades de construcción y un enfoque cada vez mayor en alternativas plásticas ecológicas.
Cuota de mercado de compuestos plásticos
El mercado mundial de compuestos plásticos está liderado principalmente por empresas bien establecidas, entre las que se incluyen:
- LyondellBasell Industries Holdings BV (EE. UU.)
- BASF (Alemania)
- LG Chem (Corea del Sur)
- Dow (EE.UU.)
- SABIC (Arabia Saudita)
- Covestro AG (Alemania)
- Teknor Apex (EE. UU.)
- LANXESS (Alemania)
- Corporación Celanese (EE. UU.)
- Borealis GmbH (Austria)
- Asahi Kasei Corp. (Japón)
- Mitsubishi Chemical Group Corporation (Japón)
- DuPont (EE. UU.)
- Corporación Avient (EE. UU.)
- CHIMEI (Taiwán)
- INEOS (Reino Unido)
- Ciencia Kingfa. Y tecnología. Co., Ltd (China)
- Washington Penn (EE. UU.)
- Compañía RTP (EE. UU.)
- Syensqo (Bélgica)
- Envalior (Alemania)
- Arkema (Francia)
- Trinseo (Estados Unidos)
- Daicel Corporation (Japón)
- KANEKA CORPORATION (Japón)
- TORAY INDUSTRIES, INC. (Japón)
- Mitsui Chemicals, Inc. (Japón)
- Ensinger (Alemania)
- SCG (Tailandia)
- CLARIANT (Suiza)
Últimos avances en el mercado de compuestos plásticos
- En junio de 2025, Envalior, en colaboración con SENTImotion y Frencken Group, anunció una innovación de producto que consiste en un nuevo concepto de caja de engranajes para brazos robóticos, fabricado con plástico de ingeniería Stanyl PA46. Este desarrollo permite cajas de engranajes un 50 % más ligeras y rentables que las alternativas metálicas, lo que facilita la producción a gran escala de robots ligeros y energéticamente eficientes. Esta innovación beneficia significativamente a Envalior, ya que amplía su presencia en los sectores de la robótica y la movilidad, abriendo nuevas oportunidades de crecimiento en la automatización industrial y de consumo.
- En mayo de 2024, Envalior anunció su participación en la conferencia SKZ "Plásticos en aplicaciones de ingeniería eléctrica y eléctrica", donde presentó innovaciones de producto, como compuestos sostenibles de poliamida 6 y un nuevo PBT ignífugo sin halógenos (p. ej., Pocan BFN4221Z). Este desarrollo se centra en ampliar la cartera de plásticos de ingeniería de Envalior con una mayor proporción de materias primas sostenibles, lo que permite a los clientes reducir su huella de carbono y su dependencia de insumos fósiles. Los materiales destacados ofrecen un rendimiento mecánico mejorado y una mayor resistencia al fuego, lo que posiciona a Envalior para satisfacer mejor la creciente demanda en sectores como la electromovilidad, el 5G y los sistemas autónomos, a la vez que refuerza su liderazgo en termoplásticos sostenibles.
- En julio de 2025, Arkema lanzó Zenimid, una nueva marca para su gama de poliimidas de ultraalto rendimiento, lo que marca un desarrollo estratégico de producto. Esta innovación enriquece la cartera de materiales especiales de Arkema, satisfaciendo sectores de alta demanda como el aeroespacial, la electrónica y la automoción. Con una excepcional resistencia térmica, mecánica y química, Zenimid impulsa el crecimiento de la empresa en aplicaciones avanzadas. Este lanzamiento refuerza la posición de Arkema en el mercado de polímeros de alto rendimiento.
- En junio de 2025, Trinseo presentó LIGOS A9615, un nuevo adhesivo acrílico diseñado para el segmento de etiquetas de uso general (GPL), lanzado el 9 de junio de 2025, dirigido a etiquetas de película en el mercado del sudeste asiático. Este desarrollo representa un lanzamiento estratégico que refuerza la fortaleza de Trinseo en innovación adhesiva. Entre sus principales ventajas se incluyen una excelente resistencia al envejecimiento, una removibilidad limpia con capacidad de reposicionamiento y resistencia a los plastificantes, lo que permite una adhesión fiable incluso en superficies curvas de PVC, comunes en bienes de consumo y aplicaciones de embalaje.
- En febrero de 2025, Trinseo anunció el lanzamiento del primer producto de resina de poliestireno (rPS) transparente y reciclado por disolución en Europa, específicamente aprobado para el contacto directo con alimentos y que cumple oficialmente con el Reglamento (UE) 2022/1616. Este hito regulatorio se produjo tras extensas pruebas, incluyendo una "Prueba de Desafío" realizada con el Instituto Fraunhofer para validar la eficacia de la descontaminación y el cumplimiento de la seguridad alimentaria de la resina final. Producida en las instalaciones de Trinseo en Schkopau y con aproximadamente un 30 % de contenido reciclado, la nueva resina rPS ofrece una reducción de la huella de carbono de aproximadamente el 18 % en comparación con el poliestireno virgen. Para Trinseo, este desarrollo representa un avance estratégico en sostenibilidad, que permite a la empresa satisfacer la creciente demanda de soluciones de materiales circulares y respaldar los objetivos de contenido reciclado de sus clientes.
SKU-
Obtenga acceso en línea al informe sobre la primera nube de inteligencia de mercado del mundo

- Panel de análisis de datos interactivo
- Panel de análisis de empresas para oportunidades con alto potencial de crecimiento
- Acceso de analista de investigación para personalización y consultas
- Análisis de la competencia con panel interactivo
- Últimas noticias, actualizaciones y análisis de tendencias
- Aproveche el poder del análisis de referencia para un seguimiento integral de la competencia
Tabla de contenido
1 INTRODUCCIÓN
1.1 OBJETIVOS DEL ESTUDIO
1.2 DEFINICIÓN DE MERCADO
1.3 INFORMACIÓN GENERAL
1.4 LIMITACIONES
1.5 MERCADOS CUBIERTOS
2 SEGMENTACIÓN DEL MERCADO
2.1 MERCADOS CUBIERTOS
2.2 ÁMBITO GEOGRÁFICO
2,3 AÑOS CONSIDERADOS PARA EL ESTUDIO
2.4 MONEDA Y PRECIOS
2.5 MODELO DE VALIDACIÓN DE DATOS TRÍPODE DBMR
2.6 MODELADO MULTIVARIADO
2.7 ENTREVISTAS PRINCIPALES CON LÍDERES DE OPINIÓN CLAVE
2.8 CUADRÍCULA DE POSICIÓN DE MERCADO DBMR
2.9 CUADRÍCULA DE COBERTURA DE APLICACIONES DEL MERCADO
2.1 FUENTES SECUNDARIAS
2.11 SUPUESTOS
3 RESUMEN EJECUTIVO
4 INFORMACIÓN PREMIUM
4.1 ANÁLISIS DE LAS CINCO FUERZAS DE PORTER
4.1.1 AMENAZA DE NUEVOS ENTRANTES
4.1.2 PODER DE NEGOCIACIÓN DE LOS PROVEEDORES
4.1.3 PODER DE NEGOCIACIÓN DE LOS COMPRADORES
4.1.4 AMENAZA DE SUSTITUTOS
4.1.5 COMPETENCIA INTERNA
4.2 SEGUIMIENTO DE INNOVACIÓN Y ANÁLISIS ESTRATÉGICO
4.2.1 ANÁLISIS DE GRANDES ACUERDOS Y ALIANZAS ESTRATÉGICAS
4.2.1.1 EMPRESAS CONJUNTAS
4.2.1.2 FUSIONES Y ADQUISICIONES
4.2.1.3 LICENCIAS Y ASOCIACIONES
4.2.1.4 COLABORACIONES TECNOLÓGICAS
4.2.1.5 DESINVERSIONES ESTRATÉGICAS
4.2.2 NÚMERO DE PRODUCTOS EN DESARROLLO
4.2.3 ETAPA DE DESARROLLO
4.2.4 CRONOGRAMAS E HITOS
4.2.5 ESTRATEGIAS Y METODOLOGÍAS DE INNOVACIÓN
4.2.6 EVALUACIÓN Y MITIGACIÓN DE RIESGOS
4.2.7 PERSPECTIVAS FUTURAS
4.3 ANÁLISIS DE LA CADENA DE VALOR
4.4 ESCENARIO DE IMPORTACIÓN Y EXPORTACIÓN
4.5 CAPACIDAD DE PRODUCCIÓN PARA LOS MEJORES FABRICANTES
4.6 PERSPECTIVA DE LA MARCA
4.7 COMPORTAMIENTO DE COMPRA DEL CONSUMIDOR
4.8 BASE DE DATOS DE LAS FABRICANTES DE MEZCLAS Y LOS EQUIPOS QUE UTILIZAN
4.9 ANÁLISIS DE PATENTES
4.9.1 CALIDAD Y RESISTENCIA DE LA PATENTE
4.9.2 FAMILIAS DE PATENTES
4.9.3 LICENCIAS Y COLABORACIONES
4.9.4 PANORAMA DE PATENTES DE LA REGIÓN
4.9.5 ESTRATEGIA Y GESTIÓN DE LA PROPIEDAD INTELECTUAL
4.1 COBERTURA DE MATERIA PRIMA
4.11 ANÁLISIS DE LA CADENA DE SUMINISTRO DEL MERCADO MUNDIAL DE COMPUESTOS DE PLÁSTICO
4.11.1 DESCRIPCIÓN GENERAL
4.11.2 ESCENARIOS DE COSTOS LOGÍSTICOS
4.11.3 IMPORTANCIA DE LOS PROVEEDORES DE SERVICIOS LOGÍSTICOS (PSL)
4.12 AVANCES TECNOLÓGICOS EN EL MERCADO MUNDIAL DE COMPUESTOS PLÁSTICOS
4.12.1 IA Y OPTIMIZACIÓN DE PROCESOS DIGITALES
4.12.2 TECNOLOGÍAS AVANZADAS DE EXTRUSIÓN Y MANEJO DE MATERIALES
4.12.3 COMPUESTOS POLIMÉRICOS FUNCIONALIZADOS Y DE BASE BIOLÓGICA
4.12.4 SOLUCIONES DE COMPUESTOS INTELIGENTES Y CON EFICACIA
4.12.5 AUTOMATIZACIÓN E INDUSTRIA 4.0 EN OPERACIONES DE COMPUESTO
4.12.6 INNOVACIONES EN SOSTENIBILIDAD Y ECONOMÍA CIRCULAR
4.12.7 PLATAFORMAS DE FORMULACIÓN Y PARTICIPACIÓN DEL CLIENTE DIGITAL
4.13 CRITERIOS DE SELECCIÓN DE PROVEEDORES
4.14 CUADRANTE DE EVALUACIÓN DE LA EMPRESA
4.15 ANÁLISIS DE PRECIOS
5. EL PAPEL DE LOS ARANCELES EN EL MERCADO MUNDIAL DE COMPUESTOS DE PLÁSTICO
5.1 PANORAMA ARANCELARIO: ARANCELES SOBRE POLÍMEROS, ADITIVOS Y MAQUINARIA
5.2 IMPACTO DE LOS ARANCELES EN LAS ESTRUCTURAS DE COSTOS Y LA DINÁMICA DE LA CADENA DE SUMINISTRO
5.3 INFLUENCIA DE LOS ACUERDOS COMERCIALES Y LAS POLÍTICAS REGULADORAS
5.4 TENDENCIAS DEL MERCADO QUE AMPLIFICAN LOS IMPACTOS ARANCELARIOS
5.5 IMPLICACIONES COMPETITIVAS PARA LOS PARTICIPANTES DE LA INDUSTRIA
5.6 RETOS Y OPORTUNIDADES DERIVADOS DE LOS ARANCELES
5.7 EMPRESAS CLAVE Y RESUMEN DE LA ESTRATEGIA TARIFARIA
6 COBERTURA REGLAMENTARIA: MERCADO MUNDIAL DE COMPUESTOS DE PLÁSTICO
7 DESCRIPCIÓN GENERAL DEL MERCADO
7.1 CONTROLADORES
7.1.1 CAMBIO HACIA COMPUESTOS PLÁSTICOS RECICLABLES Y BIODEGRADABLES DEBIDO A LAS REGULACIONES AMBIENTALES
7.1.2 AVANCES EN TECNOLOGÍAS DE COMPUESTOS QUE MEJORAN EL RENDIMIENTO DEL PRODUCTO Y LA RENTABLE EFICIENCIA
7.1.3 DESARROLLO DE PLÁSTICOS NANOCOMPUESTOS QUE OFRECEN PROPIEDADES MECÁNICAS Y DE BARRERA SUPERIORES
7.1.4 AUMENTO DEL USO DE PLÁSTICOS COMPUESTOS EN DISPOSITIVOS MÉDICOS DEBIDO A LA BIOCOPATIBILIDAD Y LA COMPATIBILIDAD DE ESTERILIZACIÓN
7.2 RESTRICCIONES
7.2.1 VOLATILIDAD EN LOS PRECIOS DE LAS MATERIAS PRIMAS, ESPECIALMENTE LAS MATERIAS PRIMAS A BASE DE PETRÓLEO, COMO EL POLIPROPILENO Y EL POLIETILENO
7.2.2 PROCESOS DE RECICLAJE COMPLEJOS Y FALTA DE INFRAESTRUCTURA ADECUADA PARA LA GESTIÓN DE RESIDUOS COMPUESTOS DE PLÁSTICO
7.3 OPORTUNIDADES
7.3.1 USO CRECIENTE DE BIOPLÁSTICOS Y ALTERNATIVAS DE COMPUESTOS SOSTENIBLES
7.3.2 AUMENTO EN LA ADOPCIÓN DE VEHÍCULOS ELÉCTRICOS QUE REQUIEREN POLÍMEROS AVANZADOS
7.3.3 AUMENTO DE LA DEMANDA DE SOLUCIONES DE PLÁSTICO RECICLABLES Y CIRCULARES
7.4 DESAFÍOS
7.4.1 LIMITACIONES DE RENDIMIENTO DE LAS ALTERNATIVAS SOSTENIBLES
7.4.2 FRAGMENTACIÓN REGLAMENTARIA Y DE NORMAS ENTRE REGIONES
8 MERCADO MUNDIAL DE COMPUESTOS PLÁSTICOS, POR TIPO DE POLÍMERO
8.1 INFORMACIÓN GENERAL
8.2 TERMOPLÁSTICOS
8.2.1 TERMOPLÁSTICOS, POR TIPO
8.2.2 POLIETILENO (PE), POR TIPO
8.3 PLÁSTICOS DE INGENIERÍA
8.3.1 PLÁSTICOS DE INGENIERÍA, POR TIPO
8.4 PLÁSTICOS TERMOESTABLECIDOS
8.4.1 PLÁSTICOS TERMOESTABLECIDOS, POR TIPO
8.5 BIOPLÁSTICOS
8.5.1 BIOPLÁSTICOS, POR TIPO
8.6 OTROS
9 MERCADO MUNDIAL DE COMPUESTOS DE PLÁSTICO, POR TIPO DE RELLENO
9.1 INFORMACIÓN GENERAL
9.2 RELLENOS MINERALES
9.2.1 RELLENOS MINERALES, POR TIPO
9.3 REFUERZOS
9.3.1 REFUERZOS, POR TIPO
9.4 ADITIVOS
9.4.1 ADITIVOS, POR TIPO
9.5 OTROS
10 MERCADO MUNDIAL DE COMPUESTOS DE PLÁSTICO, POR PROCESO DE FABRICACIÓN
10.1 INFORMACIÓN GENERAL
10.2 EXTRUSIÓN
10.2.1 EXTRUSIÓN, POR TIPO
10.2.2 EXTRUSIÓN, POR SISTEMA DE PELETIZACIÓN
10.3 COMPUESTOS BASADOS EN MOLDEO POR INYECCIÓN
10.3.1 COMPUESTO BASADO EN MOLDEO POR INYECCIÓN, MEDIANTE SISTEMA DE PELETIZACIÓN
10.4 COMPACTACIÓN/PRESIONADO
10.4.1 COMPACTACIÓN/PRESIONADO, MEDIANTE SISTEMA DE PELETIZACIÓN
10.5 AMASADORA/MEZCLA BANBURY
10.5.1 MEZCLA AMASADORA/BANBURY, MEDIANTE SISTEMA DE PELETIZACIÓN
10.6 OTROS
11 MERCADO MUNDIAL DE COMPUESTOS DE PLÁSTICO, POR PROPIEDADES
11.1 INFORMACIÓN GENERAL
11.2 RESISTENCIA
11.3 DURABILIDAD
11.4 FLEXIBILIDAD
11.5 RESISTENCIA AL IMPACTO
11.6 RIGIDEZ
11.7 OTROS
12 MERCADO MUNDIAL DE COMPUESTOS DE PLÁSTICO, POR APLICACIÓN
12.1 INFORMACIÓN GENERAL
12.2 AUTOMOTRIZ
12.2.1 AUTOMOTRIZ, POR CATEGORÍA
12.2.1.1 COMPONENTES INTERIORES, POR TIPO
12.2.1.2 PARTES EXTERIORES DE LA CARROCERÍA, POR TIPO
12.2.1.3 APLICACIONES BAJO EL CAPÓ, POR TIPO
12.3 EMBALAJE
12.3.1 EMBALAJE, POR CATEGORÍA
12.3.1.1 ENVASES DE ALIMENTOS Y BEBIDAS, POR TIPO
12.3.1.2 ENVASES INDUSTRIALES, POR TIPO
12.3.1.3 EMBALAJE DE BIENES DE CONSUMO, POR TIPO
12.4 EDIFICACIÓN Y CONSTRUCCIÓN
12.4.1 EDIFICACIÓN Y CONSTRUCCIÓN, POR CATEGORÍA
12.5 ELECTRICIDAD Y ELECTRÓNICA
12.5.1 ELECTRICIDAD Y ELECTRÓNICA, POR CATEGORÍA
12.6 DISPOSITIVOS MÉDICOS
12.6.1 DISPOSITIVOS MÉDICOS, POR CATEGORÍA
12.7 MUEBLES
12.7.1 MUEBLES, POR CATEGORÍA
12.8 ENERGÍA Y POTENCIA
12.8.1 ENERGÍA Y POTENCIA, POR CATEGORÍA
12.9 AEROESPACIAL Y DEFENSA
12.9.1 AEROESPACIAL Y DEFENSA, POR CATEGORÍA
12.1 OTROS
13 MERCADO MUNDIAL DE COMPUESTOS DE PLÁSTICO POR PAÍSES
13.1 INFORMACIÓN GENERAL
13.2 AMÉRICA DEL NORTE
13.2.1 EE. UU.
13.2.2 CANADÁ
13.2.3 MÉXICO
13.3 EUROPA
13.3.1 ALEMANIA
13.3.2 ITALIA
13.3.3 FRANCIA
13.3.4 Reino Unido
13.3.5 ESPAÑA
13.3.6 RUSIA
13.3.7 SUIZA
13.3.8 TURQUÍA
13.3.9 BÉLGICA
13.3.10 PAÍSES BAJOS
13.3.11 NORUEGA
13.3.12 FINLAND
13.3.13 DINAMARCA
13.3.14 SUECIA
13.3.15 RESTO DE EUROPA
13.4 ASIA-PACÍFICO
13.4.1 CHINA
13.4.2 INDIA
13.4.3 JAPÓN
13.4.4 COREA DEL SUR
13.4.5 TAILANDIA
13.4.6 SINGAPUR
13.4.7 INDONESIA
13.4.8 AUSTRALIA
13.4.9 NUEVA ZELANDA
13.4.10 FILIPINAS
13.4.11 MALASIA
13.4.12 TAIWÁN
13.4.13 HONG KONG
13.4.14 RESTO DE ASIA-PACÍFICO
13.5 ORIENTE MEDIO Y ÁFRICA
13.5.1 ARABIA SAUDITA
13.5.2 EGIPTO
13.5.3 Emiratos Árabes Unidos
13.5.4 SUDÁFRICA
13.5.5 ISRAEL
13.5.6 KUWAIT
13.5.7 OMÁN
13.5.8 CATAR
13.5.9 BAHREIN
13.5.10 RESTO DE ORIENTE MEDIO Y ÁFRICA
13.6 SUDAMÉRICA
13.6.1 BRASIL
13.6.2 ARGENTINA
13.6.3 COLOMBIA
13.6.4 CHILE
13.6.5 PERÚ
13.6.6 ECUADOR
13.6.7 VENEZUELA
13.6.8 BOLIVIA
13.6.9 PARAGUAY
13.6.10 URUGUAY
13.6.11 RESTO DE SUDAMÉRICA
14 MERCADO MUNDIAL DE COMPUESTOS DE PLÁSTICO: PANORAMA EMPRESARIAL
14.1 ANÁLISIS DE ACCIONES DE LA EMPRESA: GLOBAL
14.2 ANÁLISIS DE ACCIONES DE EMPRESAS: AMÉRICA DEL NORTE
14.3 ANÁLISIS DE ACCIONES DE EMPRESAS: EUROPA
14.4 ANÁLISIS DE ACCIONES DE LA EMPRESA: ASIA-PACÍFICO
15 ANÁLISIS FODA
16 PERFILES DE EMPRESAS
16.1 SABIC
16.1.1 INSTANTÁNEA DE LA EMPRESA
16.1.2 ANÁLISIS DE INGRESOS
16.1.3 ANÁLISIS DE LAS ACCIONES DE LA EMPRESA
16.1.4 PORTAFOLIO DE PRODUCTOS
16.1.5 DESARROLLO RECIENTE
16.2 LYONDELLBASELL INDUSTRIES HOLDINGS BV
16.2.1 INSTANTÁNEA DE LA EMPRESA
16.2.2 ANÁLISIS DE INGRESOS
16.2.3 ANÁLISIS DE LAS ACCIONES DE LA EMPRESA
16.2.4 PORTAFOLIO DE PRODUCTOS
16.2.5 DESARROLLOS/NOTICIAS RECIENTES
16.3 DOW
16.3.1 INSTANTÁNEA DE LA EMPRESA
16.3.2 ANÁLISIS DE INGRESOS
16.3.3 ANÁLISIS DE LAS ACCIONES DE LA EMPRESA
16.3.4 PORTAFOLIO DE PRODUCTOS
16.3.5 DESARROLLO RECIENTE
16.4 DUPONT
16.4.1 INSTANTÁNEA DE LA EMPRESA
16.4.2 ANÁLISIS DE INGRESOS
16.4.3 ANÁLISIS DE LAS ACCIONES DE LA EMPRESA
16.4.4 PORTAFOLIO DE PRODUCTOS
16.4.5 DESARROLLO RECIENTE
16.5 ARKEMA
16.5.1 INSTANTÁNEA DE LA EMPRESA
16.5.2 ANÁLISIS DE INGRESOS
16.5.3 ANÁLISIS DE LAS ACCIONES DE LA EMPRESA
16.5.4 PORTAFOLIO DE PRODUCTOS
16.5.5 DESARROLLOS RECIENTES
16.6 ASAHI KASEI CORP.
16.6.1 INSTANTÁNEA DE LA EMPRESA
16.6.2 ANÁLISIS DE INGRESOS
16.6.3 PORTAFOLIO DE PRODUCTOS
16.6.4 DESARROLLO RECIENTE
16.7 CORPORACIÓN AVIENT
16.7.1 INSTANTÁNEA DE LA EMPRESA
16.7.2 ANÁLISIS DE INGRESOS
16.7.3 PORTAFOLIO DE PRODUCTOS
16.7.4 DESARROLLO RECIENTE
16.8 BOREALIS GMBH
16.8.1 INSTANTÁNEA DE LA EMPRESA
16.8.2 PORTAFOLIO DE PRODUCTOS
16.8.3 DESARROLLO RECIENTE
16.9 BASF
16.9.1 INSTANTÁNEA DE LA EMPRESA
16.9.2 ANÁLISIS DE INGRESOS
16.9.3 PORTAFOLIO DE PRODUCTOS
16.9.4 DESARROLLO RECIENTE
16.1 CORPORACIÓN CLEANESE
16.10.1 INSTANTÁNEA DE LA EMPRESA
16.10.2 ANÁLISIS DE INGRESOS
16.10.3 PORTAFOLIO DE PRODUCTOS
16.10.4 DESARROLLO RECIENTE
16.11 CHIMEI
16.11.1 INSTANTÁNEA DE LA EMPRESA
16.11.2 ANÁLISIS DE INGRESOS
16.11.3 PORTAFOLIO DE PRODUCTOS
16.11.4 DESARROLLO RECIENTE
16.12 CLARIANTE
16.12.1 INSTANTÁNEA DE LA EMPRESA
16.12.2 ANÁLISIS DE INGRESOS
16.12.3 PORTAFOLIO DE PRODUCTOS
16.12.4 DESARROLLO RECIENTE
16.13 COVESTRO AG
16.13.1 INSTANTÁNEA DE LA EMPRESA
16.13.2 ANÁLISIS DE INGRESOS
16.13.3 PORTAFOLIO DE PRODUCTOS
16.13.4 DESARROLLO RECIENTE
16.14 CORPORACIÓN DAICEL
16.14.1 INSTANTÁNEA DE LA EMPRESA
16.14.2 ANÁLISIS DE INGRESOS
16.14.3 PORTAFOLIO DE PRODUCTOS
16.14.4 DESARROLLOS RECIENTES
16.15 ENSINGER GMBH
16.15.1 INSTANTÁNEA DE LA EMPRESA
16.15.2 PORTAFOLIO DE PRODUCTOS
16.15.3 DESARROLLO RECIENTE
16.16 ENVALIOR
16.16.1 INSTANTÁNEA DE LA EMPRESA
16.16.2 PORTAFOLIO DE PRODUCTOS
16.16.3 DESARROLLOS RECIENTES
16.17 INEOS
16.17.1 INSTANTÁNEA DE LA EMPRESA
16.17.2 PORTAFOLIO DE PRODUCTOS
16.17.3 DESARROLLO RECIENTE
16.18 CORPORACIÓN KANEKA
16.18.1 INSTANTÁNEA DE LA EMPRESA
16.18.2 ANÁLISIS DE INGRESOS
16.18.3 PORTAFOLIO DE PRODUCTOS
16.18.4 DESARROLLO RECIENTE
16.19 KINGFA CIENCIA Y TECNOLOGÍA. CO., LTD.
16.19.1 INSTANTÁNEA DE LA EMPRESA
16.19.2 ANÁLISIS DE INGRESOS
16.19.3 PORTAFOLIO DE PRODUCTOS
16.19.4 DESARROLLO RECIENTE
16.2 LANXESS
16.20.1 INSTANTÁNEA DE LA EMPRESA
16.20.2 ANÁLISIS DE INGRESOS
16.20.3 BUSINESS PORTFOLIO
16.20.4 RECENT DEVELOPMENT
16.21 LG CHEM
16.21.1 COMPANY SNAPSHOT
16.21.2 REVENUE ANALYSIS
16.21.3 PRODUCT PORTFOLIO
16.21.4 RECENT DEVELOPMENT
16.22 MITSUBISHI CHEMICAL GROUP CORPORATION.
16.22.1 COMPANY SNAPSHOT
16.22.2 REVENUE ANALYSIS
16.22.3 PRODUCT PORTFOLIO
16.22.4 RECENT DEVELOPMENT
16.23 MITSUI CHEMICALS, INC
16.23.1 COMPANY SNAPSHOT
16.23.2 REVENUE ANALYSIS
16.23.3 PRODUCT PORTFOLIO
16.23.4 RECENT DEVELOPMENT
16.24 RTP COMPANY
16.24.1 COMPANY SNAPSHOT
16.24.2 PRODUCT PORTFOLIO
16.24.3 RECENT DEVELOPMENT
16.25 SCG
16.25.1 COMPANY SNAPSHOT
16.25.2 REVENUE ANALYSIS
16.25.3 PRODUCT PORTFOLIO
16.25.4 RECENT DEVELOPMENT
16.26 SYENSQO
16.26.1 COMPANY SNAPSHOT
16.26.2 REVENUE ANALYSIS
16.26.3 PRODUCT PORTFOLIO
16.26.4 RECENT DEVELOPMENTS
16.27 TEKNOR APEX
16.27.1 COMPANY SNAPSHOT
16.27.2 PRODUCT PORTFOLIO
16.27.3 RECENT DEVELOPMENT
16.28 TORAY INDUSTRIES, INC.
16.28.1 COMPANY SNAPSHOT
16.28.2 REVENUE ANALYSIS
16.28.3 PRODUCT PORTFOLIO
16.28.4 RECENT DEVELOPMENT
16.29 TRINSEO
16.29.1 COMPANY SNAPSHOT
16.29.2 REVENUE ANALYSIS
16.29.3 SOLUTION PORTFOLIO
16.29.4 RECENT DEVELOPMENTS
16.3 WASHINGTON PENN
16.30.1 COMPANY SNAPSHOT
16.30.2 PRODUCT PORTFOLIO
16.30.3 RECENT DEVELOPMENT
17 QUESTIONNAIRE
18 RELATED REPORTS
Lista de Tablas
TABLA 1 ETAPAS DE LA CADENA DE VALOR
TABLA 2 PERSPECTIVA DE LA MARCA: MERCADO GLOBAL DE COMPUESTOS DE PLÁSTICO
TABLA 3 COMPORTAMIENTO DE COMPRA DEL CONSUMIDOR
CUADRO 4 ACTORES MUNDIALES EN LA FABRICACIÓN DE COMPUESTOS DE PLÁSTICO
TABLA 5 NÚMERO DE PATENTES POR AÑO
CUADRO 6 NÚMERO DE PATENTES POR REGIÓN/PAÍS
TABLA 7 PRINCIPALES SOLICITANTES DE PATENTES
CUADRO 8 EXPOSICIÓN ARANCELARIA Y RESPUESTA ESTRATÉGICA POR TIPO DE EMPRESA
CUADRO 9 EXPOSICIÓN ARANCELARIA Y RESPUESTA ESTRATÉGICA DE LOS ACTORES CLAVE
TABLA 10 MERCADO MUNDIAL DE COMPUESTOS PLÁSTICOS, POR TIPO DE POLÍMERO, 2018-2032 (MILES DE USD)
TABLA 11 MERCADO MUNDIAL DE COMPUESTOS DE PLÁSTICO, POR TIPO DE POLÍMERO, 2018-2032 (KILOTONELADAS)
TABLA 12 MERCADO MUNDIAL DE TERMOPLÁSTICOS EN COMPUESTOS PLÁSTICOS, POR REGIÓN, 2018-2032 (MILES DE USD)
TABLA 13 MERCADO MUNDIAL DE TERMOPLÁSTICOS EN COMPUESTOS PLÁSTICOS, POR REGIÓN, 2018-2032 (KILOTONELADAS)
TABLA 14 MERCADO MUNDIAL DE TERMOPLÁSTICOS EN COMPUESTOS PLÁSTICOS, POR TIPO, 2018-2032 (MILES DE USD)
TABLA 15 MERCADO MUNDIAL DE POLIETILENO (PE) EN COMPUESTOS PLÁSTICOS, POR TIPO, 2018-2032 (MILES DE USD)
TABLA 16 MERCADO MUNDIAL DE PLÁSTICOS DE INGENIERÍA EN COMPUESTOS DE PLÁSTICO, POR REGIÓN, 2018-2032 (MILES DE USD)
TABLA 17 MERCADO MUNDIAL DE PLÁSTICOS DE INGENIERÍA EN COMPUESTOS DE PLÁSTICO, POR REGIÓN, 2018-2032 (KILOTONELADAS)
TABLA 18 MERCADO GLOBAL DE PLÁSTICOS DE INGENIERÍA EN COMPUESTOS DE PLÁSTICO, POR TIPO, 2018-2032 (MILES DE USD)
TABLA 19 MERCADO MUNDIAL DE PLÁSTICOS TERMOESTABLECIDOS EN COMPUESTOS DE PLÁSTICO, POR REGIÓN, 2018-2032 (MILES DE USD)
TABLA 20 MERCADO MUNDIAL DE PLÁSTICOS TERMOESTABLECIDOS EN COMPUESTOS DE PLÁSTICO, POR REGIÓN, 2018-2032 (KILOTONELADAS)
TABLA 21 MERCADO MUNDIAL DE PLÁSTICOS TERMOESTABLECIDOS EN COMPUESTOS DE PLÁSTICO, POR TIPO, 2018-2032 (MILES DE USD)
TABLA 22 MERCADO MUNDIAL DE BIOPLÁSTICOS EN COMPUESTOS PLÁSTICOS, POR REGIÓN, 2018-2032 (MILES DE USD)
TABLA 23 MERCADO MUNDIAL DE BIOPLÁSTICOS EN COMPUESTOS PLÁSTICOS, POR REGIÓN, 2018-2032 (KILOTONELADAS)
TABLA 24 MERCADO MUNDIAL DE BIOPLÁSTICOS EN COMPUESTOS PLÁSTICOS, POR TIPO, 2018-2032 (MILES DE USD)
TABLA 25 OTROS MERCADOS MUNDIALES DE COMPUESTOS DE PLÁSTICO, POR REGIÓN, 2018-2032 (MILES DE USD)
TABLA 26 OTROS MERCADOS MUNDIALES DE COMPUESTOS DE PLÁSTICO, POR REGIÓN, 2018-2032 (KILOTONELADAS)
TABLA 27 MERCADO MUNDIAL DE COMPUESTOS DE PLÁSTICO, POR TIPO DE FILTRO, 2018-2032 (MILES DE USD)
TABLA 28 MERCADO MUNDIAL DE RELLENOS MINERALES EN COMPUESTOS PLÁSTICOS, POR REGIÓN, 2018-2032 (MILES DE USD)
TABLA 29 MERCADO MUNDIAL DE RELLENOS MINERALES EN COMPUESTOS PLÁSTICOS, POR TIPO, 2018-2032 (MILES DE USD)
TABLA 30 MERCADO GLOBAL DE REFUERZOS EN COMPUESTOS PLÁSTICOS, POR REGIÓN, 2018-2032 (MILES DE USD)
TABLA 31 MERCADO GLOBAL DE REFUERZOS EN COMPUESTOS PLÁSTICOS, POR TIPO, 2018-2032 (MILES DE USD)
TABLA 32 MERCADO MUNDIAL DE ADITIVOS EN COMPUESTOS PLÁSTICOS, POR REGIÓN, 2018-2032 (MILES DE USD)
TABLA 33 MERCADO MUNDIAL DE ADITIVOS EN COMPUESTOS DE PLÁSTICO, POR TIPO, 2018-2032 (MILES DE USD)
TABLA 34 OTROS MERCADOS MUNDIALES DE COMPUESTOS DE PLÁSTICO, POR REGIÓN, 2018-2032 (MILES DE USD)
TABLA 35 MERCADO MUNDIAL DE COMPUESTOS DE PLÁSTICO, POR PROCESO DE FABRICACIÓN, 2018-2032 (MILES DE USD)
TABLA 36 MERCADO MUNDIAL DE COMPUESTOS DE PLÁSTICO, POR PROCESO DE FABRICACIÓN, 2018-2032 (KILOTONELADAS)
TABLA 37 MERCADO MUNDIAL DE EXTRUSIÓN EN COMPUESTOS DE PLÁSTICO, POR REGIÓN, 2018-2032 (MILES DE USD)
TABLA 38 MERCADO MUNDIAL DE EXTRUSIÓN EN COMPUESTOS DE PLÁSTICO, POR REGIÓN, 2018-2032 (KILOTONELADAS)
TABLA 39 MERCADO MUNDIAL DE EXTRUSIÓN EN COMPUESTOS DE PLÁSTICO, POR TIPO, 2018-2032 (MILES DE USD)
TABLA 40 MERCADO GLOBAL DE EXTRUSIÓN EN COMPUESTOS DE PLÁSTICO, POR SISTEMA DE PELETIZACIÓN, 2018-2032 (MILES DE USD)
TABLA 41 MERCADO MUNDIAL DE COMPUESTOS DE PLÁSTICO BASADOS EN MOLDEO POR INYECCIÓN, POR REGIÓN, 2018-2032 (MILES DE USD)
TABLA 42 MERCADO MUNDIAL DE COMPUESTOS DE PLÁSTICO BASADOS EN MOLDEO POR INYECCIÓN, POR REGIÓN, 2018-2032 (KILOTONELADAS)
TABLA 43 MERCADO GLOBAL DE COMPUESTOS DE PLÁSTICO BASADOS EN MOLDEO POR INYECCIÓN, POR SISTEMA DE PELETIZACIÓN, 2018-2032 (MILES DE USD)
TABLA 44 MERCADO GLOBAL DE COMPACTACIÓN/PRESIONADO EN COMPUESTOS DE PLÁSTICO, POR REGIÓN, 2018-2032 (MILES DE USD)
TABLA 45 MERCADO MUNDIAL DE COMPACTACIÓN/PRESIONADO EN COMPUESTOS DE PLÁSTICO, POR REGIÓN, 2018-2032 (KILOTONELADAS)
TABLA 46 MERCADO GLOBAL DE COMPACTACIÓN/PRESIONADO EN COMPUESTOS DE PLÁSTICO, POR SISTEMA DE PELETIZACIÓN, 2018-2032 (MILES DE USD)
TABLA 47 MERCADO MUNDIAL DE MEZCLAS DE AMASADORAS/BANBURY EN COMPUESTOS DE PLÁSTICO, POR REGIÓN, 2018-2032 (MILES DE USD)
TABLA 48 MERCADO MUNDIAL DE AMASADORAS/MEZCLAS BANBURY PARA COMPUESTOS DE PLÁSTICO, POR REGIÓN, 2018-2032 (KILOTONELADAS)
TABLA 49 MERCADO MUNDIAL DE MEZCLAS DE AMASADORAS/BANBURY EN COMPUESTOS DE PLÁSTICO, POR SISTEMA DE PELETIZACIÓN, 2018-2032 (MILES DE USD)
TABLA 50 OTROS MERCADOS MUNDIALES DE COMPUESTOS DE PLÁSTICO, POR REGIÓN, 2018-2032 (MILES DE USD)
TABLA 51 OTROS MERCADOS MUNDIALES DE COMPUESTOS DE PLÁSTICO, POR REGIÓN, 2018-2032 (KILOTONELADAS)
TABLA 52 MERCADO MUNDIAL DE COMPUESTOS DE PLÁSTICO, POR PROPIEDADES, 2018-2032 (MILES DE USD)
TABLA 53 RESISTENCIA GLOBAL EN EL MERCADO DE COMPUESTOS PLÁSTICOS, POR REGIÓN, 2018-2032 (MILES DE USD)
TABLA 54 DURABILIDAD GLOBAL EN EL MERCADO DE COMPUESTOS DE PLÁSTICO, POR REGIÓN, 2018-2032 (MILES DE USD)
TABLA 55 FLEXIBILIDAD GLOBAL EN EL MERCADO DE COMPUESTOS PLÁSTICOS, POR REGIÓN, 2018-2032 (MILES DE USD)
TABLA 56 RESISTENCIA AL IMPACTO GLOBAL EN EL MERCADO DE COMPUESTOS PLÁSTICOS, POR REGIÓN, 2018-2032 (MILES DE USD)
TABLA 57 RIGIDEZ GLOBAL EN EL MERCADO DE COMPUESTOS PLÁSTICOS, POR REGIÓN, 2018-2032 (MILES DE USD)
TABLA 58 OTROS MERCADOS MUNDIALES DE COMPUESTOS DE PLÁSTICO, POR REGIÓN, 2018-2032 (MILES DE USD)
TABLA 59 MERCADO MUNDIAL DE COMPUESTOS DE PLÁSTICO, POR APLICACIÓN, 2018-2032 (MILES DE USD)
TABLA 60 MERCADO MUNDIAL DE COMPUESTOS DE PLÁSTICO, POR APLICACIÓN, 2018-2032 (KILOTONELADAS)
TABLA 61 MERCADO MUNDIAL DE COMPUESTOS DE PLÁSTICO EN AUTOMÓVILES, POR REGIÓN, 2018-2032 (MILES DE USD)
TABLA 62 MERCADO MUNDIAL DE COMPUESTOS DE PLÁSTICO EN AUTOMOCIÓN, POR REGIÓN, 2018-2032 (KILOTONELADAS)
TABLA 63 MERCADO MUNDIAL DE COMPUESTOS DE PLÁSTICO EN AUTOMÓVILES, POR CATEGORÍA, 2018-2032 (MILES DE USD)
TABLA 64 MERCADO GLOBAL DE COMPONENTES INTERIORES EN COMPUESTOS PLÁSTICOS, POR TIPO, 2018-2032 (MILES DE USD)
TABLA 65 MERCADO MUNDIAL DE PIEZAS DE CARROCERÍA EXTERIOR EN COMPUESTOS DE PLÁSTICO, POR TIPO, 2018-2032 (MILES DE USD)
TABLA 66 APLICACIONES GLOBALES DEBAJO DEL CAPÓ EN EL MERCADO DE COMPUESTOS DE PLÁSTICO, POR TIPO, 2018-2032 (MILES DE USD)
TABLA 67 MERCADO MUNDIAL DE ENVASES DE PLÁSTICO COMPUESTO, POR REGIÓN, 2018-2032 (MILES DE USD)
TABLA 68 MERCADO MUNDIAL DE ENVASES DE PLÁSTICO COMPUESTO, POR REGIÓN, 2018-2032 (KILOTONELADAS)
TABLA 69 MERCADO MUNDIAL DE ENVASES DE PLÁSTICO COMPUESTO, POR CATEGORÍA, 2018-2032 (MILES DE USD)
TABLA 70 MERCADO MUNDIAL DE ENVASES DE ALIMENTOS Y BEBIDAS EN COMPUESTOS DE PLÁSTICO, POR TIPO, 2018-2032 (MILES DE USD)
TABLA 71 MERCADO MUNDIAL DE ENVASES INDUSTRIALES EN COMPUESTOS DE PLÁSTICO, POR TIPO, 2018-2032 (MILES DE USD)
TABLA 72 MERCADO MUNDIAL DE ENVASES DE BIENES DE CONSUMO EN COMPUESTOS DE PLÁSTICO, POR TIPO, 2018-2032 (MILES DE USD)
TABLA 73 MERCADO MUNDIAL DE CONSTRUCCIÓN Y EDIFICACIÓN DE COMPUESTOS DE PLÁSTICO, POR REGIÓN, 2018-2032 (MILES DE USD)
TABLA 74 MERCADO MUNDIAL DE CONSTRUCCIÓN Y EDIFICACIÓN DE COMPUESTOS DE PLÁSTICO, POR REGIÓN, 2018-2032 (KILOTONELADAS)
TABLA 75 MERCADO MUNDIAL DE CONSTRUCCIÓN Y EDIFICACIÓN DE COMPUESTOS DE PLÁSTICO, POR CATEGORÍA, 2018-2032 (MILES DE USD)
TABLA 76 MERCADO MUNDIAL DE PRODUCTOS ELÉCTRICOS Y ELECTRÓNICOS EN COMPUESTOS DE PLÁSTICO, POR REGIÓN, 2018-2032 (MILES DE USD)
TABLA 77 MERCADO MUNDIAL DE PRODUCTOS ELÉCTRICOS Y ELECTRÓNICOS EN COMPUESTOS DE PLÁSTICO, POR REGIÓN, 2018-2032 (KILOTONELADAS)
TABLA 78 MERCADO MUNDIAL DE PRODUCTOS ELÉCTRICOS Y ELECTRÓNICOS EN COMPUESTOS DE PLÁSTICO, POR CATEGORÍA, 2018-2032 (MILES DE USD)
TABLA 79 MERCADO MUNDIAL DE DISPOSITIVOS MÉDICOS EN COMPUESTOS DE PLÁSTICO, POR REGIÓN, 2018-2032 (MILES DE USD)
TABLA 80 MERCADO MUNDIAL DE DISPOSITIVOS MÉDICOS EN COMPUESTOS DE PLÁSTICO, POR REGIÓN, 2018-2032 (KILOTONELADAS)
TABLA 81 MERCADO MUNDIAL DE DISPOSITIVOS MÉDICOS EN COMPUESTOS DE PLÁSTICO, POR CATEGORÍA, 2018-2032 (MILES DE USD)
TABLA 82 MERCADO MUNDIAL DE MUEBLES EN COMPUESTOS DE PLÁSTICO, POR REGIÓN, 2018-2032 (MILES DE USD)
TABLA 83 MERCADO MUNDIAL DE MUEBLES EN COMPUESTOS DE PLÁSTICO, POR REGIÓN, 2018-2032 (KILOTONELADAS)
TABLA 84 MERCADO MUNDIAL DE MUEBLES EN COMPUESTOS DE PLÁSTICO, POR CATEGORÍA, 2018-2032 (MILES DE USD)
TABLA 85 MERCADO MUNDIAL DE ENERGÍA Y PODER EN COMPUESTOS DE PLÁSTICO, POR REGIÓN, 2018-2032 (MILES DE USD)
TABLA 86 MERCADO MUNDIAL DE ENERGÍA Y PODER EN COMPUESTOS DE PLÁSTICO, POR REGIÓN, 2018-2032 (KILOTONELADAS)
TABLA 87 MERCADO MUNDIAL DE ENERGÍA Y PODER EN COMPUESTOS DE PLÁSTICO, POR CATEGORÍA, 2018-2032 (MILES DE USD)
TABLA 88 MERCADO MUNDIAL DE COMPUESTOS PLÁSTICOS EN LA AEROESPACIAL Y DE DEFENSA, POR REGIÓN, 2018-2032 (MILES DE USD)
TABLA 89 MERCADO MUNDIAL DE COMPUESTOS PLÁSTICOS EN LA AEROESPACIAL Y DE DEFENSA, POR REGIÓN, 2018-2032 (KILOTONELADAS)
TABLA 90 MERCADO MUNDIAL DE COMPUESTOS PLÁSTICOS EN LA AEROESPACIAL Y DE DEFENSA, POR CATEGORÍA, 2018-2032 (MILES DE USD)
TABLA 91 OTROS MERCADOS MUNDIALES DE COMPUESTOS DE PLÁSTICO, POR REGIÓN, 2018-2032 (MILES DE USD)
TABLA 92 OTROS MERCADOS MUNDIALES DE COMPUESTOS DE PLÁSTICO, POR REGIÓN, 2018-2032 (KILOTONELADAS)
TABLA 93 MERCADO MUNDIAL DE COMPUESTOS DE PLÁSTICO, POR REGIÓN, 2018-2032 (MILES DE USD)
TABLA 94 MERCADO MUNDIAL DE COMPUESTOS DE PLÁSTICO, POR REGIÓN, 2018-2032 (KILOTONELADAS)
TABLA 95 MERCADO DE COMPUESTOS PLÁSTICOS DE AMÉRICA DEL NORTE, POR PAÍS, 2018-2032 (MILES DE USD)
TABLA 96 MERCADO DE COMPUESTOS PLÁSTICOS DE AMÉRICA DEL NORTE, POR PAÍS, 2018-2032 (KILOTONELADAS)
TABLA 97 MERCADO DE COMPUESTOS PLÁSTICOS DE AMÉRICA DEL NORTE, POR TIPO DE POLÍMERO, 2018-2032 (MILES DE USD)
TABLA 98 MERCADO DE COMPUESTOS PLÁSTICOS DE AMÉRICA DEL NORTE, POR TIPO DE POLÍMERO, 2018-2032 (KILOTONELADAS)
TABLA 99 MERCADO DE TERMOPLÁSTICOS EN COMPUESTOS PLÁSTICOS DE AMÉRICA DEL NORTE, POR TIPO, 2018-2032 (MILES DE USD)
TABLA 100 MERCADO DE POLIETILENO (PE) EN COMPUESTOS PLÁSTICOS DE AMÉRICA DEL NORTE, POR TIPO, 2018-2032 (MILES DE USD)
TABLA 101 PLÁSTICOS DE INGENIERÍA EN EL MERCADO DE COMPUESTOS PLÁSTICOS DE AMÉRICA DEL NORTE, POR TIPO, 2018-2032 (MILES DE USD)
TABLA 102 PLÁSTICOS TERMOESTABLECIDOS EN EL MERCADO DE COMPUESTOS DE PLÁSTICO DE AMÉRICA DEL NORTE, POR TIPO, 2018-2032 (MILES DE USD)
TABLA 103 MERCADO DE BIOPLÁSTICOS EN COMPUESTOS PLÁSTICOS DE AMÉRICA DEL NORTE, POR TIPO, 2018-2032 (MILES DE USD)
TABLA 104 MERCADO DE COMPUESTOS PLÁSTICOS DE AMÉRICA DEL NORTE, POR TIPO DE RELLENO, 2018-2032 (MILES DE USD)
TABLA 105 RELLENOS MINERALES EN EL MERCADO DE COMPUESTOS PLÁSTICOS DE AMÉRICA DEL NORTE, POR TIPO, 2018-2032 (MILES DE USD)
TABLA 106 MERCADO DE REFUERZOS DE COMPUESTOS PLÁSTICOS EN AMÉRICA DEL NORTE, POR TIPO, 2018-2032 (MILES DE USD)
TABLA 107 ADITIVOS EN EL MERCADO DE COMPUESTOS PLÁSTICOS DE AMÉRICA DEL NORTE, POR TIPO, 2018-2032 (MILES DE USD)
TABLA 108 MERCADO DE COMPUESTOS PLÁSTICOS DE AMÉRICA DEL NORTE, POR PROCESO DE FABRICACIÓN, 2018-2032 (MILES DE USD)
TABLA 109 MERCADO DE COMPUESTOS PLÁSTICOS DE AMÉRICA DEL NORTE, POR PROCESO DE FABRICACIÓN, 2018-2032 (KILOTONELADAS)
TABLA 110 MERCADO DE EXTRUSIÓN DE COMPUESTOS PLÁSTICOS EN AMÉRICA DEL NORTE, POR TIPO, 2018-2032 (MILES DE USD)
TABLA 111 MERCADO DE EXTRUSIÓN DE COMPUESTOS DE PLÁSTICO EN AMÉRICA DEL NORTE, POR SISTEMA DE PELETIZACIÓN, 2018-2032 (MILES DE USD)
TABLA 112 MERCADO DE COMPUESTOS DE PLÁSTICO BASADOS EN MOLDEO POR INYECCIÓN EN AMÉRICA DEL NORTE, POR SISTEMA DE PELETIZACIÓN, 2018-2032 (MILES DE USD)
TABLA 113 COMPACTACIÓN/PRESIONADO EN EL MERCADO DE COMPUESTOS DE PLÁSTICO EN AMÉRICA DEL NORTE, POR SISTEMA DE PELETIZACIÓN, 2018-2032 (MILES DE USD)
TABLA 114 MERCADO DE MEZCLA DE AMASADORAS/BANBURY EN COMPUESTOS DE PLÁSTICO DE AMÉRICA DEL NORTE, POR SISTEMA DE PELETIZACIÓN, 2018-2032 (MILES DE USD)
TABLA 115 MERCADO DE COMPUESTOS PLÁSTICOS DE AMÉRICA DEL NORTE, POR PROPIEDADES, 2018-2032 (MILES DE USD)
TABLA 116 MERCADO DE COMPUESTOS PLÁSTICOS DE AMÉRICA DEL NORTE, POR APLICACIÓN, 2018-2032 (MILES DE USD)
TABLA 117 MERCADO DE COMPUESTOS PLÁSTICOS DE AMÉRICA DEL NORTE, POR APLICACIÓN, 2018-2032 (KILOTONELADAS)
TABLA 118 MERCADO DE COMPUESTOS PLÁSTICOS AUTOMOTRICES EN AMÉRICA DEL NORTE, POR CATEGORÍA, 2018-2032 (MILES DE USD)
TABLA 119 COMPONENTES INTERIORES DE AMÉRICA DEL NORTE EN EL MERCADO DE COMPUESTOS PLÁSTICOS, POR TIPO, 2018-2032 (MILES DE USD)
TABLA 120 PARTES EXTERIORES DE CARROCERÍA EN EL MERCADO DE COMPUESTOS PLÁSTICOS DE AMÉRICA DEL NORTE, POR TIPO, 2018-2032 (MILES DE USD)
TABLA 121 APLICACIONES INTERNAS EN AMÉRICA DEL NORTE EN EL MERCADO DE COMPUESTOS PLÁSTICOS, POR TIPO, 2018-2032 (MILES DE USD)
TABLA 122 MERCADO DE ENVASES DE PLÁSTICO EN AMÉRICA DEL NORTE, POR CATEGORÍA, 2018-2032 (MILES DE USD)
TABLA 123 MERCADO DE ENVASES DE ALIMENTOS Y BEBIDAS EN COMPUESTOS DE PLÁSTICO DE AMÉRICA DEL NORTE, POR TIPO, 2018-2032 (MILES DE USD)
TABLA 124 MERCADO DE ENVASES INDUSTRIALES DE AMÉRICA DEL NORTE EN COMPUESTOS DE PLÁSTICO, POR TIPO, 2018-2032 (MILES DE USD)
TABLA 125 MERCADO DE ENVASES DE BIENES DE CONSUMO EN COMPUESTOS DE PLÁSTICO DE AMÉRICA DEL NORTE, POR TIPO, 2018-2032 (MILES DE USD)
TABLA 126 MERCADO DE CONSTRUCCIÓN Y EDIFICACIÓN DE COMPUESTOS PLÁSTICOS EN AMÉRICA DEL NORTE, POR CATEGORÍA, 2018-2032 (MILES DE USD)
TABLA 127 MERCADO DE PRODUCTOS ELÉCTRICOS Y ELECTRÓNICOS EN COMPUESTOS DE PLÁSTICO DE AMÉRICA DEL NORTE, POR CATEGORÍA, 2018-2032 (MILES DE USD)
TABLA 128 MERCADO DE DISPOSITIVOS MÉDICOS EN COMPUESTOS DE PLÁSTICO DE AMÉRICA DEL NORTE, POR CATEGORÍA, 2018-2032 (MILES DE USD)
TABLA 129 MERCADO DE MUEBLES DE AMÉRICA DEL NORTE EN COMPUESTOS DE PLÁSTICO, POR CATEGORÍA, 2018-2032 (MILES DE USD)
TABLA 130 MERCADO DE ENERGÍA Y ELECTRICIDAD EN COMPUESTOS DE PLÁSTICO EN AMÉRICA DEL NORTE, POR CATEGORÍA, 2018-2032 (MILES DE USD)
TABLA 131 MERCADO DE COMPUESTOS PLÁSTICOS DE LA INDUSTRIA AEROESPACIAL Y DE DEFENSA DE AMÉRICA DEL NORTE, POR CATEGORÍA, 2018-2032 (MILES DE USD)
TABLA 132 MERCADO DE COMPUESTOS PLÁSTICOS DE EE. UU., POR TIPO DE POLÍMERO, 2018-2032 (MILES DE USD)
TABLA 133 MERCADO DE COMPUESTOS PLÁSTICOS DE EE. UU., POR TIPO DE POLÍMERO, 2018-2032 (KILOTONELADAS)
TABLA 134 MERCADO DE TERMOPLÁSTICOS EN COMPUESTOS PLÁSTICOS DE EE. UU., POR TIPO, 2018-2032 (MILES DE USD)
TABLA 135 MERCADO DE POLIETILENO (PE) EN COMPUESTOS PLÁSTICOS DE EE. UU., POR TIPO, 2018-2032 (MILES DE USD)
TABLA 136 PLÁSTICOS DE INGENIERÍA EN EL MERCADO DE COMPUESTOS PLÁSTICOS DE EE. UU., POR TIPO, 2018-2032 (MILES DE USD)
TABLA 137 PLÁSTICOS TERMOESTABLECIDOS DE EE. UU. EN EL MERCADO DE COMPUESTOS DE PLÁSTICO, POR TIPO, 2018-2032 (MILES DE USD)
TABLA 138 BIOPLÁSTICOS EN EL MERCADO DE COMPUESTOS PLÁSTICOS DE EE. UU., POR TIPO, 2018-2032 (MILES DE USD)
TABLA 139 MERCADO DE COMPUESTOS DE PLÁSTICO DE EE. UU., POR TIPO DE RELLENO, 2018-2032 (MILES DE USD)
TABLA 140 RELLENOS MINERALES EN EL MERCADO DE COMPUESTOS PLÁSTICOS DE EE. UU., POR TIPO, 2018-2032 (MILES DE USD)
TABLA 141 MERCADO DE REFUERZOS EN COMPUESTOS PLÁSTICOS DE EE. UU., POR TIPO, 2018-2032 (MILES DE USD)
TABLA 142 ADITIVOS EN EL MERCADO DE COMPUESTOS PLÁSTICOS DE EE. UU., POR TIPO, 2018-2032 (MILES DE USD)
TABLA 143 MERCADO DE COMPUESTOS DE PLÁSTICO DE EE. UU., POR PROCESO DE FABRICACIÓN, 2018-2032 (MILES DE USD)
TABLA 144 MERCADO DE COMPUESTOS DE PLÁSTICO DE EE. UU., POR PROCESO DE FABRICACIÓN, 2018-2032 (KILOTONELADAS)
TABLA 145 MERCADO DE EXTRUSIÓN EN COMPUESTOS DE PLÁSTICO EN EE. UU., POR TIPO, 2018-2032 (MILES DE USD)
TABLA 146 MERCADO DE EXTRUSIÓN EN COMPUESTOS DE PLÁSTICO EN EE. UU., POR SISTEMA DE PELETIZACIÓN, 2018-2032 (MILES DE USD)
TABLA 147 MERCADO DE COMPUESTOS DE PLÁSTICO BASADOS EN MOLDEO POR INYECCIÓN EN EE. UU., POR SISTEMA DE PELETIZACIÓN, 2018-2032 (MILES DE USD)
TABLA 148 MERCADO DE COMPACTACIÓN/PRESIONADO DE PLÁSTICOS EN EE. UU., POR SISTEMA DE PELETIZACIÓN, 2018-2032 (MILES DE USD)
TABLA 149 MERCADO DE MEZCLA DE AMASADORAS/BANBURY EN COMPUESTOS DE PLÁSTICO, POR SISTEMA DE PELETIZACIÓN, 2018-2032 (MILES DE USD)
TABLA 150 MERCADO DE COMPUESTOS PLÁSTICOS DE EE. UU., POR PROPIEDADES, 2018-2032 (MILES DE USD)
TABLA 151 MERCADO DE COMPUESTOS PLÁSTICOS DE EE. UU., POR APLICACIÓN, 2018-2032 (MILES DE USD)
TABLA 152 MERCADO DE COMPUESTOS PLÁSTICOS DE EE. UU., POR APLICACIÓN, 2018-2032 (KILOTONELADAS)
TABLA 153 MERCADO DE COMPUESTOS DE PLÁSTICO EN AUTOMÓVILES DE EE. UU., POR CATEGORÍA, 2018-2032 (MILES DE USD)
TABLA 154 COMPONENTES INTERIORES DE EE. UU. EN EL MERCADO DE COMPUESTOS PLÁSTICOS, POR TIPO, 2018-2032 (MILES DE USD)
TABLA 155 PARTES DE CARROCERÍA EXTERIOR EN EL MERCADO DE COMPUESTOS DE PLÁSTICO DE EE. UU., POR TIPO, 2018-2032 (MILES DE USD)
TABLA 156 APLICACIONES INTERNAS EN EL MERCADO DE COMPUESTOS PLÁSTICOS DE EE. UU., POR TIPO, 2018-2032 (MILES DE USD)
TABLA 157 MERCADO DE ENVASES DE PLÁSTICO EN ESTADOS UNIDOS, POR CATEGORÍA, 2018-2032 (MILES DE USD)
TABLA 158 MERCADO DE ENVASES DE ALIMENTOS Y BEBIDAS EN COMPUESTOS DE PLÁSTICO DE EE. UU., POR TIPO, 2018-2032 (MILES DE USD)
TABLA 159 MERCADO DE ENVASES INDUSTRIALES DE ESTADOS UNIDOS EN COMPUESTOS DE PLÁSTICO, POR TIPO, 2018-2032 (MILES DE USD)
TABLA 160 MERCADO DE ENVASES DE BIENES DE CONSUMO EN ESTADOS UNIDOS PARA COMPUESTOS DE PLÁSTICO, POR TIPO, 2018-2032 (MILES DE USD)
TABLA 161 MERCADO DE CONSTRUCCIÓN Y EDIFICACIÓN DE COMPUESTOS DE PLÁSTICO EN EE. UU., POR CATEGORÍA, 2018-2032 (MILES DE USD)
TABLA 162 MERCADO DE PRODUCTOS ELÉCTRICOS Y ELECTRÓNICOS EN COMPUESTOS DE PLÁSTICO DE EE. UU., POR CATEGORÍA, 2018-2032 (MILES DE USD)
TABLA 163 MERCADO DE DISPOSITIVOS MÉDICOS DE ESTADOS UNIDOS EN EL MERCADO DE COMPUESTOS DE PLÁSTICO, POR CATEGORÍA, 2018-2032 (MILES DE USD)
TABLA 164 MERCADO DE MUEBLES EN COMPUESTOS DE PLÁSTICO DE EE. UU., POR CATEGORÍA, 2018-2032 (MILES DE USD)
TABLA 165 MERCADO DE ENERGÍA Y PODER EN COMPUESTOS DE PLÁSTICO EN EE. UU., POR CATEGORÍA, 2018-2032 (MILES DE USD)
TABLA 166 MERCADO DE COMPUESTOS PLÁSTICOS DE LA INDUSTRIA AEROESPACIAL Y DE DEFENSA DE EE. UU., POR CATEGORÍA, 2018-2032 (MILES DE USD)
TABLA 167 MERCADO DE COMPUESTOS PLÁSTICOS DE CANADÁ, POR TIPO DE POLÍMERO, 2018-2032 (MILES DE USD)
TABLA 168 MERCADO DE COMPUESTOS PLÁSTICOS DE CANADÁ, POR TIPO DE POLÍMERO, 2018-2032 (KILOTONELADAS)
TABLA 169 MERCADO DE TERMOPLÁSTICOS EN COMPUESTOS PLÁSTICOS DE CANADÁ, POR TIPO, 2018-2032 (MILES DE USD)
TABLA 170 MERCADO DE POLIETILENO (PE) EN COMPUESTOS PLÁSTICOS DE CANADÁ, POR TIPO, 2018-2032 (MILES DE USD)
TABLA 171 MERCADO DE PLÁSTICOS DE INGENIERÍA EN CANADÁ, POR TIPO, 2018-2032 (MILES DE USD)
TABLA 172 PLÁSTICOS TERMOENDURECIBLES EN EL MERCADO DE COMPUESTOS DE PLÁSTICO DE CANADÁ, POR TIPO, 2018-2032 (MILES DE USD)
TABLA 173 MERCADO DE BIOPLÁSTICOS EN COMPUESTOS PLÁSTICOS DE CANADÁ, POR TIPO, 2018-2032 (MILES DE USD)
TABLA 174 MERCADO DE COMPUESTOS PLÁSTICOS DE CANADÁ, POR TIPO DE RELLENO, 2018-2032 (MILES DE USD)
TABLA 175 RELLENOS MINERALES EN EL MERCADO DE COMPUESTOS PLÁSTICOS DE CANADÁ, POR TIPO, 2018-2032 (MILES DE USD)
TABLA 176 MERCADO DE REFUERZOS DE COMPUESTOS PLÁSTICOS DE CANADÁ, POR TIPO, 2018-2032 (MILES DE USD)
TABLA 177 ADITIVOS EN EL MERCADO DE COMPUESTOS PLÁSTICOS DE CANADÁ, POR TIPO, 2018-2032 (MILES DE USD)
TABLA 178 MERCADO DE COMPUESTOS DE PLÁSTICO DE CANADÁ, POR PROCESO DE FABRICACIÓN, 2018-2032 (MILES DE USD)
TABLA 179 MERCADO DE COMPUESTOS DE PLÁSTICO DE CANADÁ, POR PROCESO DE FABRICACIÓN, 2018-2032 (KILOTONELADAS)
TABLA 180 MERCADO DE EXTRUSIÓN DE COMPUESTOS DE PLÁSTICO EN CANADÁ, POR TIPO, 2018-2032 (MILES DE USD)
TABLA 181 MERCADO DE EXTRUSIÓN DE PLÁSTICOS EN CANADÁ, POR SISTEMA DE PELETIZACIÓN, 2018-2032 (MILES DE USD)
TABLA 182 MERCADO DE COMPUESTOS DE PLÁSTICO BASADOS EN MOLDEO POR INYECCIÓN DE CANADÁ, POR SISTEMA DE PELETIZACIÓN, 2018-2032 (MILES DE USD)
TABLA 183 COMPACTACIÓN/PRESIONADO EN EL MERCADO DE COMPUESTOS DE PLÁSTICO DE CANADÁ, POR SISTEMA DE PELETIZACIÓN, 2018-2032 (MILES DE USD)
TABLA 184 MERCADO DE MEZCLA DE AMASADORAS/BANBURY EN LA FABRICACIÓN DE COMPUESTOS DE PLÁSTICO DE CANADÁ, POR SISTEMA DE PELETIZACIÓN, 2018-2032 (MILES DE USD)
TABLA 185 MERCADO DE COMPUESTOS PLÁSTICOS DE CANADÁ, POR PROPIEDADES, 2018-2032 (MILES DE USD)
TABLA 186 MERCADO DE COMPUESTOS PLÁSTICOS DE CANADÁ, POR APLICACIÓN, 2018-2032 (MILES DE USD)
TABLA 187 MERCADO DE COMPUESTOS PLÁSTICOS DE CANADÁ, POR APLICACIÓN, 2018-2032 (KILOTONELADAS)
TABLA 188 MERCADO DE COMPUESTOS DE PLÁSTICO EN AUTOMÓVILES DE CANADÁ, POR CATEGORÍA, 2018-2032 (MILES DE USD)
TABLA 189 COMPONENTES INTERIORES DE CANADÁ EN EL MERCADO DE COMPUESTOS PLÁSTICOS, POR TIPO, 2018-2032 (MILES DE USD)
TABLA 190 PIEZAS DE CARROCERÍA EXTERIOR EN EL MERCADO DE COMPUESTOS DE PLÁSTICO DE CANADÁ, POR TIPO, 2018-2032 (MILES DE USD)
TABLA 191 APLICACIONES INTERNAS EN CANADÁ EN EL MERCADO DE COMPUESTOS PLÁSTICOS, POR TIPO, 2018-2032 (MILES DE USD)
TABLA 192 MERCADO DE ENVASES DE PLÁSTICO EN CANADÁ, POR CATEGORÍA, 2018-2032 (MILES DE USD)
TABLA 193 MERCADO DE ENVASES DE ALIMENTOS Y BEBIDAS EN CANADÁ, POR TIPO, 2018-2032 (MILES DE USD)
TABLA 194 MERCADO DE ENVASES INDUSTRIALES DE CANADÁ EN COMPUESTOS DE PLÁSTICO, POR TIPO, 2018-2032 (MILES DE USD)
TABLA 195 MERCADO DE ENVASES DE BIENES DE CONSUMO EN CANADÁ, POR TIPO, 2018-2032 (MILES DE USD)
TABLA 196 MERCADO DE CONSTRUCCIÓN Y EDIFICACIÓN DE PLÁSTICOS EN CANADÁ, POR CATEGORÍA, 2018-2032 (MILES DE USD)
TABLA 197 MERCADO DE PRODUCTOS ELÉCTRICOS Y ELECTRÓNICOS EN COMPUESTOS DE PLÁSTICO DE CANADÁ, POR CATEGORÍA, 2018-2032 (MILES DE USD)
TABLA 198 MERCADO DE DISPOSITIVOS MÉDICOS DE CANADÁ EN EL MERCADO DE COMPUESTOS DE PLÁSTICO, POR CATEGORÍA, 2018-2032 (MILES DE USD)
TABLA 199 MERCADO DE MUEBLES DE CANADÁ EN COMPUESTOS DE PLÁSTICO, POR CATEGORÍA, 2018-2032 (MILES DE USD)
TABLA 200 MERCADO DE ENERGÍA Y ELECTRICIDAD EN COMPUESTOS DE PLÁSTICO EN CANADÁ, POR CATEGORÍA, 2018-2032 (MILES DE USD)
TABLA 201 MERCADO DE COMPUESTOS PLÁSTICOS DE LA INDUSTRIA AEROESPACIAL Y DE DEFENSA DE CANADÁ, POR CATEGORÍA, 2018-2032 (MILES DE USD)
TABLA 202 MERCADO DE COMPUESTOS PLÁSTICOS DE MÉXICO, POR TIPO DE POLÍMERO, 2018-2032 (MILES DE USD)
TABLA 203 MERCADO DE COMPUESTOS PLÁSTICOS DE MÉXICO, POR TIPO DE POLÍMERO, 2018-2032 (KILOTONELADAS)
TABLA 204 MERCADO DE TERMOPLÁSTICOS EN COMPUESTOS PLÁSTICOS DE MÉXICO, POR TIPO, 2018-2032 (MILES DE USD)
TABLA 205 MERCADO DE POLIETILENO (PE) EN COMPUESTOS PLÁSTICOS DE MÉXICO, POR TIPO, 2018-2032 (MILES DE USD)
TABLA 206 PLÁSTICOS DE INGENIERÍA EN EL MERCADO DE COMPUESTOS PLÁSTICOS DE MÉXICO, POR TIPO, 2018-2032 (MILES DE USD)
TABLA 207 PLÁSTICOS TERMOESTABLECIDOS EN EL MERCADO DE COMPUESTOS PLÁSTICOS DE MÉXICO, POR TIPO, 2018-2032 (MILES DE USD)
TABLA 208 BIOPLÁSTICOS EN EL MERCADO DE COMPUESTOS PLÁSTICOS DE MÉXICO, POR TIPO, 2018-2032 (MILES DE USD)
TABLA 209 MERCADO DE COMPUESTOS PLÁSTICOS DE MÉXICO, POR TIPO DE RELLENO, 2018-2032 (MILES DE USD)
TABLA 210 RELLENOS MINERALES EN EL MERCADO DE COMPUESTOS PLÁSTICOS DE MÉXICO, POR TIPO, 2018-2032 (MILES DE USD)
TABLA 211 MERCADO DE REFUERZOS DE COMPUESTOS PLÁSTICOS EN MÉXICO, POR TIPO, 2018-2032 (MILES DE USD)
TABLA 212 ADITIVOS EN EL MERCADO DE COMPUESTOS PLÁSTICOS DE MÉXICO, POR TIPO, 2018-2032 (MILES DE USD)
TABLA 213 MERCADO DE COMPUESTOS PLÁSTICOS EN MÉXICO, POR PROCESO DE FABRICACIÓN, 2018-2032 (MILES DE USD)
TABLA 214 MERCADO DE COMPUESTOS PLÁSTICOS EN MÉXICO, POR PROCESO DE FABRICACIÓN, 2018-2032 (KILOTONELADAS)
TABLA 215 MERCADO DE EXTRUSIÓN EN COMPUESTOS PLÁSTICOS EN MÉXICO, POR TIPO, 2018-2032 (MILES DE USD)
TABLA 216 MERCADO DE EXTRUSIÓN EN COMPUESTOS PLÁSTICOS EN MÉXICO, POR SISTEMA DE PELETIZACIÓN, 2018-2032 (MILES DE USD)
TABLA 217 MERCADO DE COMPUESTOS DE PLÁSTICO BASADOS EN MOLDEO POR INYECCIÓN EN MÉXICO, POR SISTEMA DE PELETIZACIÓN, 2018-2032 (MILES DE USD)
TABLA 218 COMPACTACIÓN/PRESIONADO EN EL MERCADO DE COMPUESTOS PLÁSTICOS DE MÉXICO, POR SISTEMA DE PELETIZACIÓN, 2018-2032 (MILES DE USD)
TABLA 219 MERCADO DE MÉXICO DE AMASADORAS/MEZCLAS BANBURY EN COMPUESTOS DE PLÁSTICO, POR SISTEMA DE PELETIZACIÓN, 2018-2032 (MILES DE USD)
TABLA 220 MERCADO DE COMPUESTOS PLÁSTICOS DE MÉXICO, POR PROPIEDADES, 2018-2032 (MILES DE USD)
TABLA 221 MERCADO DE COMPUESTOS PLÁSTICOS DE MÉXICO, POR APLICACIÓN, 2018-2032 (MILES DE USD)
TABLA 222 MERCADO DE COMPUESTOS PLÁSTICOS DE MÉXICO, POR APLICACIÓN, 2018-2032 (KILOTONELADAS)
TABLA 223 MERCADO AUTOMOTRIZ DE COMPUESTOS PLÁSTICOS EN MÉXICO, POR CATEGORÍA, 2018-2032 (MILES DE USD)
TABLA 224 COMPONENTES INTERIORES DE MÉXICO EN EL MERCADO DE COMPUESTOS PLÁSTICOS, POR TIPO, 2018-2032 (MILES DE USD)
TABLA 225 PARTES EXTERIORES DE CARROCERÍA EN EL MERCADO DE COMPUESTOS PLÁSTICOS DE MÉXICO, POR TIPO, 2018-2032 (MILES DE USD)
TABLA 226 APLICACIONES INTERNAS EN MÉXICO EN EL MERCADO DE COMPUESTOS PLÁSTICOS, POR TIPO, 2018-2032 (MILES DE USD)
TABLA 227 MERCADO DE ENVASES DE PLÁSTICO EN MÉXICO, POR CATEGORÍA, 2018-2032 (MILES DE USD)
TABLA 228 MERCADO DE ENVASES DE ALIMENTOS Y BEBIDAS EN MÉXICO, POR TIPO, 2018-2032 (MILES DE USD)
TABLA 229 MERCADO DE EMPAQUES INDUSTRIALES EN COMPUESTOS PLÁSTICOS DE MÉXICO, POR TIPO, 2018-2032 (MILES DE USD)
TABLA 230 MERCADO DE ENVASES DE BIENES DE CONSUMO EN MÉXICO, POR TIPO, 2018-2032 (MILES DE USD)
TABLA 231 MERCADO DE CONSTRUCCIÓN Y EDIFICACIÓN DE COMPUESTOS PLÁSTICOS EN MÉXICO, POR CATEGORÍA, 2018-2032 (MILES DE USD)
TABLA 232 MERCADO DE PRODUCTOS ELÉCTRICOS Y ELECTRÓNICOS EN COMPUESTOS PLÁSTICOS DE MÉXICO, POR CATEGORÍA, 2018-2032 (MILES DE USD)
TABLA 233 MERCADO DE DISPOSITIVOS MÉDICOS EN COMPUESTOS PLÁSTICOS DE MÉXICO, POR CATEGORÍA, 2018-2032 (MILES DE USD)
TABLA 234 MERCADO DE MUEBLES EN MÉXICO EN COMPUESTOS DE PLÁSTICO, POR CATEGORÍA, 2018-2032 (MILES DE USD)
TABLA 235 MERCADO DE ENERGÍA Y ELECTRICIDAD EN MÉXICO, POR CATEGORÍA, 2018-2032 (MILES DE USD)
TABLA 236 MERCADO DE COMPUESTOS PLÁSTICOS DE LA INDUSTRIA AEROESPACIAL Y DE DEFENSA DE MÉXICO, POR CATEGORÍA, 2018-2032 (MILES DE USD)
TABLA 237 MERCADO EUROPEO DE COMPUESTOS DE PLÁSTICO, POR PAÍS, 2018-2032 (MILES DE USD)
TABLA 238 MERCADO EUROPEO DE COMPUESTOS DE PLÁSTICO, POR PAÍS, 2018-2032 (KILOTONELADAS)
TABLA 239 MERCADO EUROPEO DE COMPUESTOS PLÁSTICOS, POR TIPO DE POLÍMERO, 2018-2032 (MILES DE USD)
TABLA 240 MERCADO EUROPEO DE COMPUESTOS PLÁSTICOS, POR TIPO DE POLÍMERO, 2018-2032 (KILOTONELADAS)
TABLA 241 MERCADO EUROPEO DE TERMOPLÁSTICOS EN COMPUESTOS DE PLÁSTICO, POR TIPO, 2018-2032 (MILES DE USD)
TABLA 242 MERCADO EUROPEO DE POLIETILENO (PE) EN COMPUESTOS PLÁSTICOS, POR TIPO, 2018-2032 (MILES DE USD)
TABLA 243 MERCADO EUROPEO DE PLÁSTICOS DE INGENIERÍA EN COMPUESTOS DE PLÁSTICO, POR TIPO, 2018-2032 (MILES DE USD)
TABLA 244 MERCADO EUROPEO DE PLÁSTICOS TERMOENDURECIBLES EN COMPUESTOS DE PLÁSTICO, POR TIPO, 2018-2032 (MILES DE USD)
TABLA 245 MERCADO EUROPEO DE BIOPLÁSTICOS EN COMPUESTOS PLÁSTICOS, POR TIPO, 2018-2032 (MILES DE USD)
TABLA 246 MERCADO EUROPEO DE COMPUESTOS DE PLÁSTICO, POR TIPO DE RELLENO, 2018-2032 (MILES DE USD)
TABLA 247 MERCADO EUROPEO DE CARGAS MINERALES EN COMPUESTOS PLÁSTICOS, POR TIPO, 2018-2032 (MILES DE USD)
TABLA 248 MERCADO EUROPEO DE REFUERZOS EN COMPUESTOS DE PLÁSTICO, POR TIPO, 2018-2032 (MILES DE USD)
TABLA 249 ADITIVOS EN EL MERCADO EUROPEO DE COMPUESTOS DE PLÁSTICO, POR TIPO, 2018-2032 (MILES DE USD)
TABLA 250 MERCADO EUROPEO DE COMPUESTOS DE PLÁSTICO, POR PROCESO DE FABRICACIÓN, 2018-2032 (MILES DE USD)
TABLA 251 MERCADO EUROPEO DE COMPUESTOS DE PLÁSTICO, POR PROCESO DE FABRICACIÓN, 2018-2032 (KILOTONELADAS)
TABLA 252 MERCADO EUROPEO DE EXTRUSIÓN EN COMPUESTOS DE PLÁSTICO, POR TIPO, 2018-2032 (MILES DE USD)
TABLA 253 MERCADO EUROPEO DE EXTRUSIÓN DE COMPUESTOS DE PLÁSTICO, POR SISTEMA DE PELETIZACIÓN, 2018-2032 (MILES DE USD)
TABLA 254 MERCADO EUROPEO DE COMPUESTOS DE PLÁSTICO BASADOS EN MOLDEO POR INYECCIÓN, POR SISTEMA DE PELETIZACIÓN, 2018-2032 (MILES DE USD)
TABLA 255 MERCADO EUROPEO DE COMPACTACIÓN/PRESIONADO EN COMPUESTOS DE PLÁSTICO, POR SISTEMA DE PELETIZACIÓN, 2018-2032 (MILES DE USD)
TABLA 256 MERCADO EUROPEO DE MEZCLAS DE AMASADORAS/BANBURY EN LA FABRICACIÓN DE COMPUESTOS DE PLÁSTICO, POR SISTEMA DE PELETIZACIÓN, 2018-2032 (MILES DE USD)
TABLA 257 MERCADO EUROPEO DE COMPUESTOS DE PLÁSTICO, POR PROPIEDADES, 2018-2032 (MILES DE USD)
TABLA 258 MERCADO EUROPEO DE COMPUESTOS DE PLÁSTICO, POR APLICACIÓN, 2018-2032 (MILES DE USD)
TABLA 259 MERCADO EUROPEO DE COMPUESTOS DE PLÁSTICO, POR APLICACIÓN, 2018-2032 (KILOTONELADAS)
TABLA 260 MERCADO EUROPEO DE COMPUESTOS DE PLÁSTICO EN AUTOMOCIÓN, POR CATEGORÍA, 2018-2032 (MILES DE USD)
TABLA 261 COMPONENTES INTERIORES EN EL MERCADO EUROPEO DE COMPUESTOS DE PLÁSTICO, POR TIPO, 2018-2032 (MILES DE USD)
TABLA 262 PIEZAS DE CARROCERÍA EXTERIOR EN EL MERCADO EUROPEO DE COMPUESTOS DE PLÁSTICO, POR TIPO, 2018-2032 (MILES DE USD)
TABLA 263 APLICACIONES INTERNAS EN EUROPA EN EL MERCADO DE COMPUESTOS DE PLÁSTICO, POR TIPO, 2018-2032 (MILES DE USD)
TABLA 264 MERCADO EUROPEO DE ENVASES DE COMPUESTOS DE PLÁSTICO, POR CATEGORÍA, 2018-2032 (MILES DE USD)
TABLA 265 MERCADO EUROPEO DE ENVASES DE ALIMENTOS Y BEBIDAS EN COMPUESTOS DE PLÁSTICO, POR TIPO, 2018-2032 (MILES DE USD)
TABLA 266 MERCADO EUROPEO DE ENVASES INDUSTRIALES EN COMPUESTOS DE PLÁSTICO, POR TIPO, 2018-2032 (MILES DE USD)
TABLA 267 MERCADO EUROPEO DE ENVASES DE BIENES DE CONSUMO EN COMPUESTOS DE PLÁSTICO, POR TIPO, 2018-2032 (MILES DE USD)
TABLA 268 MERCADO EUROPEO DE CONSTRUCCIÓN Y EDIFICACIÓN DE COMPUESTOS DE PLÁSTICO, POR CATEGORÍA, 2018-2032 (MILES DE USD)
TABLA 269 MERCADO EUROPEO DE PRODUCTOS ELÉCTRICOS Y ELECTRÓNICOS EN COMPUESTOS DE PLÁSTICO, POR CATEGORÍA, 2018-2032 (MILES DE USD)
TABLA 270 MERCADO EUROPEO DE DISPOSITIVOS MÉDICOS EN COMPUESTOS DE PLÁSTICO, POR CATEGORÍA, 2018-2032 (MILES DE USD)
TABLA 271 MERCADO EUROPEO DE MUEBLES EN COMPUESTOS DE PLÁSTICO, POR CATEGORÍA, 2018-2032 (MILES DE USD)
TABLA 272 MERCADO EUROPEO DE ENERGÍA Y ELECTRICIDAD EN COMPUESTOS DE PLÁSTICO, POR CATEGORÍA, 2018-2032 (MILES DE USD)
TABLA 273 MERCADO EUROPEO DE COMPUESTOS DE PLÁSTICO EN LA AEROESPACIAL Y DEFENSA, POR CATEGORÍA, 2018-2032 (MILES DE USD)
TABLA 274 MERCADO DE COMPUESTOS PLÁSTICOS DE ALEMANIA, POR TIPO DE POLÍMERO, 2018-2032 (MILES DE USD)
TABLA 275 MERCADO DE COMPUESTOS PLÁSTICOS DE ALEMANIA, POR TIPO DE POLÍMERO, 2018-2032 (KILOTONELADAS)
TABLA 276 MERCADO DE TERMOPLÁSTICOS EN COMPUESTOS PLÁSTICOS DE ALEMANIA, POR TIPO, 2018-2032 (MILES DE USD)
TABLA 277 ALEMANIA: POLIETILENO (PE) EN EL MERCADO DE COMPUESTOS PLÁSTICOS, POR TIPO, 2018-2032 (MILES DE USD)
TABLA 278 PLÁSTICOS DE INGENIERÍA EN EL MERCADO DE COMPUESTOS DE PLÁSTICO DE ALEMANIA, POR TIPO, 2018-2032 (MILES DE USD)
TABLA 279 PLÁSTICOS TERMOESTABLECIDOS DE ALEMANIA EN EL MERCADO DE COMPUESTOS DE PLÁSTICO, POR TIPO, 2018-2032 (MILES DE USD)
TABLA 280 BIOPLÁSTICOS EN EL MERCADO DE COMPUESTOS PLÁSTICOS DE ALEMANIA, POR TIPO, 2018-2032 (MILES DE USD)
TABLA 281 MERCADO DE COMPUESTOS DE PLÁSTICO DE ALEMANIA, POR TIPO DE RELLENO, 2018-2032 (MILES DE USD)
TABLA 282 RELLENOS MINERALES EN EL MERCADO DE COMPUESTOS PLÁSTICOS DE ALEMANIA, POR TIPO, 2018-2032 (MILES DE USD)
TABLA 283 REFUERZOS EN EL MERCADO DE COMPUESTOS PLÁSTICOS DE ALEMANIA, POR TIPO, 2018-2032 (MILES DE USD)
TABLA 284 ADITIVOS EN EL MERCADO DE COMPUESTOS PLÁSTICOS DE ALEMANIA, POR TIPO, 2018-2032 (MILES DE USD)
TABLA 285 MERCADO DE COMPUESTOS DE PLÁSTICO DE ALEMANIA, POR PROCESO DE FABRICACIÓN, 2018-2032 (MILES DE USD)
TABLA 286 MERCADO DE COMPUESTOS DE PLÁSTICO DE ALEMANIA, POR PROCESO DE FABRICACIÓN, 2018-2032 (KILOTONELADAS)
TABLA 287 MERCADO DE EXTRUSIÓN DE COMPUESTOS DE PLÁSTICO EN ALEMANIA, POR TIPO, 2018-2032 (MILES DE USD)
TABLA 288 MERCADO DE EXTRUSIÓN DE PLÁSTICOS EN ALEMANIA, POR SISTEMA DE PELETIZACIÓN, 2018-2032 (MILES DE USD)
TABLA 289 ALEMANIA: MERCADO DE COMPUESTOS DE PLÁSTICO BASADOS EN MOLDEO POR INYECCIÓN, POR SISTEMA DE PELETIZACIÓN, 2018-2032 (MILES DE USD)
TABLA 290 COMPACTACIÓN/PRESIONADO EN EL MERCADO DE COMPUESTOS DE PLÁSTICO EN ALEMANIA, POR SISTEMA DE PELETIZACIÓN, 2018-2032 (MILES DE USD)
TABLA 291 MERCADO DE MEZCLA DE AMASADORAS/BANBURY EN LA FABRICACIÓN DE COMPUESTOS DE PLÁSTICO, POR SISTEMA DE PELETIZACIÓN, ALEMANIA, 2018-2032 (MILES DE USD)
TABLA 292 MERCADO DE COMPUESTOS PLÁSTICOS DE ALEMANIA, POR PROPIEDADES, 2018-2032 (MILES DE USD)
TABLA 293 MERCADO DE COMPUESTOS PLÁSTICOS DE ALEMANIA, POR APLICACIÓN, 2018-2032 (MILES DE USD)
TABLA 294 MERCADO DE COMPUESTOS PLÁSTICOS DE ALEMANIA, POR APLICACIÓN, 2018-2032 (KILOTONELADAS)
TABLA 295 MERCADO DE COMPUESTOS DE PLÁSTICO EN AUTOMÓVILES DE ALEMANIA, POR CATEGORÍA, 2018-2032 (MILES DE USD)
TABLA 296 COMPONENTES DE INTERIOR EN EL MERCADO DE COMPUESTOS DE PLÁSTICO DE ALEMANIA, POR TIPO, 2018-2032 (MILES DE USD)
TABLA 297 PIEZAS DE CARROCERÍA EXTERIOR EN EL MERCADO DE COMPUESTOS DE PLÁSTICO DE ALEMANIA, POR TIPO, 2018-2032 (MILES DE USD)
TABLA 298 APLICACIONES INTERNAS EN ALEMANIA EN EL MERCADO DE COMPUESTOS DE PLÁSTICO, POR TIPO, 2018-2032 (MILES DE USD)
TABLA 299 MERCADO DE ENVASES DE PLÁSTICO EN ALEMANIA, POR CATEGORÍA, 2018-2032 (MILES DE USD)
TABLA 300 ENVASES DE ALIMENTOS Y BEBIDAS EN EL MERCADO DE COMPUESTOS DE PLÁSTICO DE ALEMANIA, POR TIPO, 2018-2032 (MILES DE USD)
TABLA 301 MERCADO DE ENVASES INDUSTRIALES DE ALEMANIA EN COMPUESTOS DE PLÁSTICO, POR TIPO, 2018-2032 (MILES DE USD)
TABLA 302 ENVASES DE BIENES DE CONSUMO EN EL MERCADO DE COMPUESTOS DE PLÁSTICO DE ALEMANIA, POR TIPO, 2018-2032 (MILES DE USD)
TABLA 303 ALEMANIA: MERCADO DE CONSTRUCCIÓN Y EDIFICACIÓN DE COMPUESTOS DE PLÁSTICO, POR CATEGORÍA, 2018-2032 (MILES DE USD)
TABLA 304 MERCADO DE ELECTRICIDAD Y ELECTRÓNICA EN COMPUESTOS DE PLÁSTICO DE ALEMANIA, POR CATEGORÍA, 2018-2032 (MILES DE USD)
TABLA 305 DISPOSITIVOS MÉDICOS EN EL MERCADO DE COMPUESTOS DE PLÁSTICO DE ALEMANIA, POR CATEGORÍA, 2018-2032 (MILES DE USD)
TABLA 306 MERCADO DE MUEBLES DE ALEMANIA EN COMPUESTOS DE PLÁSTICO, POR CATEGORÍA, 2018-2032 (MILES DE USD)
TABLA 307 ENERGÍA Y ELECTRICIDAD EN EL MERCADO DE COMPUESTOS DE PLÁSTICO EN ALEMANIA, POR CATEGORÍA, 2018-2032 (MILES DE USD)
TABLA 308 ALEMANIA: MERCADO DE COMPUESTOS PLÁSTICOS EN LA INDUSTRIA AEROESPACIAL Y DE DEFENSA, POR CATEGORÍA, 2018-2032 (MILES DE USD)
TABLA 309 MERCADO DE COMPUESTOS PLÁSTICOS DE ITALIA, POR TIPO DE POLÍMERO, 2018-2032 (MILES DE USD)
TABLA 310 MERCADO DE COMPUESTOS PLÁSTICOS DE ITALIA, POR TIPO DE POLÍMERO, 2018-2032 (KILOTONELADAS)
TABLA 311 ITALIA TERMOPLÁSTICOS EN EL MERCADO DE COMPUESTOS PLÁSTICOS, POR TIPO, 2018-2032 (MILES DE USD)
TABLA 312 ITALIA POLIETILENO (PE) EN EL MERCADO DE COMPUESTOS PLÁSTICOS, POR TIPO, 2018-2032 (MILES DE USD)
TABLA 313 ITALIA PLÁSTICOS DE INGENIERÍA EN EL MERCADO DE COMPUESTOS PLÁSTICOS, POR TIPO, 2018-2032 (MILES DE USD)
TABLA 314 ITALIA PLÁSTICOS TERMOENDURECIBLES EN EL MERCADO DE COMPUESTOS DE PLÁSTICO, POR TIPO, 2018-2032 (MILES DE USD)
TABLA 315 BIOPLÁSTICOS EN EL MERCADO DE COMPUESTOS PLÁSTICOS DE ITALIA, POR TIPO, 2018-2032 (MILES DE USD)
TABLA 316 MERCADO DE COMPUESTOS PLÁSTICOS DE ITALIA, POR TIPO DE RELLENO, 2018-2032 (MILES DE USD)
TABLA 317 RELLENOS MINERALES EN EL MERCADO DE COMPUESTOS PLÁSTICOS DE ITALIA, POR TIPO, 2018-2032 (MILES DE USD)
TABLA 318 ITALIA REFUERZOS EN EL MERCADO DE COMPUESTOS PLÁSTICOS, POR TIPO, 2018-2032 (MILES DE USD)
TABLA 319 ADITIVOS EN EL MERCADO DE COMPUESTOS PLÁSTICOS DE ITALIA, POR TIPO, 2018-2032 (MILES DE USD)
TABLA 320 MERCADO DE COMPUESTOS DE PLÁSTICO EN ITALIA, POR PROCESO DE FABRICACIÓN, 2018-2032 (MILES DE USD)
TABLA 321 MERCADO DE COMPUESTOS DE PLÁSTICO EN ITALIA, POR PROCESO DE FABRICACIÓN, 2018-2032 (KILOTONELADAS)
TABLA 322 ITALIA MERCADO DE EXTRUSIÓN EN COMPUESTOS DE PLÁSTICO, POR TIPO, 2018-2032 (MILES DE USD)
TABLA 323 ITALIA MERCADO DE EXTRUSIÓN EN COMPUESTOS DE PLÁSTICO, POR SISTEMA DE PELETIZACIÓN, 2018-2032 (MILES DE USD)
TABLA 324 ITALIA MERCADO DE COMPUESTOS DE PLÁSTICO BASADOS EN MOLDEO POR INYECCIÓN, POR SISTEMA DE PELETIZACIÓN, 2018-2032 (MILES DE USD)
TABLA 325 COMPACTACIÓN/PRESIONADO EN EL MERCADO DE COMPUESTOS DE PLÁSTICO EN ITALIA, POR SISTEMA DE PELETIZACIÓN, 2018-2032 (MILES DE USD)
TABLA 326 ITALIA MERCADO DE MEZCLA DE AMASADORAS/BANBURY EN LA FABRICACIÓN DE COMPUESTOS DE PLÁSTICO, POR SISTEMA DE PELETIZACIÓN, 2018-2032 (MILES DE USD)
TABLA 327 MERCADO DE COMPUESTOS PLÁSTICOS DE ITALIA, POR PROPIEDADES, 2018-2032 (MILES DE USD)
TABLA 328 MERCADO DE COMPUESTOS PLÁSTICOS DE ITALIA, POR APLICACIÓN, 2018-2032 (MILES DE USD)
TABLA 329 MERCADO DE COMPUESTOS PLÁSTICOS DE ITALIA, POR APLICACIÓN, 2018-2032 (KILOTONELADAS)
TABLA 330 MERCADO DE COMPUESTOS DE PLÁSTICO EN AUTOMOCIÓN DE ITALIA, POR CATEGORÍA, 2018-2032 (MILES DE USD)
TABLA 331 COMPONENTES DE INTERIOR DE ITALIA EN EL MERCADO DE COMPUESTOS DE PLÁSTICO, POR TIPO, 2018-2032 (MILES DE USD)
TABLA 332 PIEZAS DE CARROCERÍA EXTERIOR EN EL MERCADO DE COMPUESTOS DE PLÁSTICO DE ITALIA, POR TIPO, 2018-2032 (MILES DE USD)
TABLA 333 ITALIA: APLICACIONES INTERNAS EN EL MERCADO DE COMPUESTOS PLÁSTICOS, POR TIPO, 2018-2032 (MILES DE USD)
TABLA 334 ITALIA MERCADO DE ENVASES DE COMPUESTOS PLÁSTICOS, POR CATEGORÍA, 2018-2032 (MILES DE USD)
TABLA 335 ENVASES DE ALIMENTOS Y BEBIDAS EN EL MERCADO DE COMPUESTOS DE PLÁSTICO DE ITALIA, POR TIPO, 2018-2032 (MILES DE USD)
TABLA 336 ITALIA MERCADO DE ENVASES INDUSTRIALES EN COMPUESTOS DE PLÁSTICO, POR TIPO, 2018-2032 (MILES DE USD)
TABLA 337 ITALIA MERCADO DE ENVASES DE BIENES DE CONSUMO EN COMPUESTOS DE PLÁSTICO, POR TIPO, 2018-2032 (MILES DE USD)
TABLA 338 ITALIA EDIFICACIÓN Y CONSTRUCCIÓN EN EL MERCADO DE COMPUESTOS DE PLÁSTICO, POR CATEGORÍA, 2018-2032 (MILES DE USD)
TABLA 339 MERCADO DE PRODUCTOS ELÉCTRICOS Y ELECTRÓNICOS EN COMPUESTOS DE PLÁSTICO DE ITALIA, POR CATEGORÍA, 2018-2032 (MILES DE USD)
TABLA 340 ITALIA MERCADO DE DISPOSITIVOS MÉDICOS EN COMPUESTOS DE PLÁSTICO, POR CATEGORÍA, 2018-2032 (MILES DE USD)
TABLA 341 MERCADO DE MUEBLES DE ITALIA EN COMPUESTOS DE PLÁSTICO, POR CATEGORÍA, 2018-2032 (MILES DE USD)
TABLA 342 ITALIA ENERGÍA Y ELECTRICIDAD EN EL MERCADO DE COMPUESTOS DE PLÁSTICO, POR CATEGORÍA, 2018-2032 (MILES DE USD)
TABLA 343 ITALIA AEROESPACIAL Y DEFENSA EN EL MERCADO DE COMPUESTOS PLÁSTICOS, POR CATEGORÍA, 2018-2032 (MILES DE USD)
TABLA 344 MERCADO DE COMPUESTOS PLÁSTICOS DE FRANCIA, POR TIPO DE POLÍMERO, 2018-2032 (MILES DE USD)
TABLA 345 MERCADO DE COMPUESTOS PLÁSTICOS DE FRANCIA, POR TIPO DE POLÍMERO, 2018-2032 (KILOTONELADAS)
TABLA 346 MERCADO DE TERMOPLÁSTICOS EN COMPUESTOS PLÁSTICOS DE FRANCIA, POR TIPO, 2018-2032 (MILES DE USD)
TABLA 347 POLIETILENO (PE) EN EL MERCADO DE COMPUESTOS PLÁSTICOS DE FRANCIA, POR TIPO, 2018-2032 (MILES DE USD)
TABLA 348 PLÁSTICOS DE INGENIERÍA EN EL MERCADO DE COMPUESTOS DE PLÁSTICO EN FRANCIA, POR TIPO, 2018-2032 (MILES DE USD)
TABLA 349 PLÁSTICOS TERMOENDURECIBLES EN EL MERCADO DE COMPUESTOS DE PLÁSTICO, POR TIPO, 2018-2032 (MILES DE USD)
TABLA 350 BIOPLÁSTICOS EN EL MERCADO DE COMPUESTOS PLÁSTICOS DE FRANCIA, POR TIPO, 2018-2032 (MILES DE USD)
TABLA 351 MERCADO DE COMPUESTOS DE PLÁSTICO EN FRANCIA, POR TIPO DE RELLENO, 2018-2032 (MILES DE USD)
TABLA 352 FRANCIA: MERCADO DE CARGAS MINERALES EN COMPUESTOS PLÁSTICOS, POR TIPO, 2018-2032 (MILES DE USD)
TABLA 353 REFUERZOS EN EL MERCADO DE COMPUESTOS PLÁSTICOS DE FRANCIA, POR TIPO, 2018-2032 (MILES DE USD)
TABLA 354 ADITIVOS EN EL MERCADO DE COMPUESTOS PLÁSTICOS DE FRANCIA, POR TIPO, 2018-2032 (MILES DE USD)
TABLA 355 MERCADO DE COMPUESTOS DE PLÁSTICO EN FRANCIA, POR PROCESO DE FABRICACIÓN, 2018-2032 (MILES DE USD)
TABLA 356 MERCADO DE COMPUESTOS DE PLÁSTICO EN FRANCIA, POR PROCESO DE FABRICACIÓN, 2018-2032 (KILOTONELADAS)
TABLA 357 MERCADO DE EXTRUSIÓN DE COMPUESTOS PLÁSTICOS EN FRANCIA, POR TIPO, 2018-2032 (MILES DE USD)
TABLA 358 MERCADO DE EXTRUSIÓN EN COMPUESTOS DE PLÁSTICO EN FRANCIA, POR SISTEMA DE PELETIZACIÓN, 2018-2032 (MILES DE USD)
TABLA 359 MERCADO DE COMPUESTOS DE PLÁSTICO BASADOS EN MOLDEO POR INYECCIÓN EN FRANCIA, POR SISTEMA DE PELETIZACIÓN, 2018-2032 (MILES DE USD)
TABLA 360 COMPACTACIÓN/PRESIONADO EN EL MERCADO DE COMPUESTOS DE PLÁSTICO EN FRANCIA, POR SISTEMA DE PELETIZACIÓN, 2018-2032 (MILES DE USD)
TABLA 361 MERCADO DE MEZCLA DE AMASADORAS/BANBURY EN LA FABRICACIÓN DE COMPUESTOS DE PLÁSTICO, POR SISTEMA DE PELETIZACIÓN, 2018-2032 (MILES DE USD)
TABLA 362 MERCADO DE COMPUESTOS PLÁSTICOS DE FRANCIA, POR PROPIEDADES, 2018-2032 (MILES DE USD)
TABLA 363 MERCADO DE COMPUESTOS PLÁSTICOS DE FRANCIA, POR APLICACIÓN, 2018-2032 (MILES DE USD)
TABLA 364 MERCADO DE COMPUESTOS DE PLÁSTICO EN FRANCIA, POR APLICACIÓN, 2018-2032 (KILOTONELADAS)
TABLA 365 MERCADO DE COMPUESTOS DE PLÁSTICO EN EL SECTOR AUTOMOTRIZ DE FRANCIA, POR CATEGORÍA, 2018-2032 (MILES DE USD)
TABLA 366 COMPONENTES DE INTERIOR EN EL MERCADO DE COMPUESTOS PLÁSTICOS DE FRANCIA, POR TIPO, 2018-2032 (MILES DE USD)
TABLA 367 PIEZAS DE CARROCERÍA EXTERIOR EN EL MERCADO DE COMPUESTOS DE PLÁSTICO, POR TIPO, 2018-2032 (MILES DE USD)
TABLA 368 APLICACIONES INTERNAS EN FRANCIA EN EL MERCADO DE COMPUESTOS PLÁSTICOS, POR TIPO, 2018-2032 (MILES DE USD)
TABLA 369 MERCADO DE ENVASES DE PLÁSTICO EN FRANCIA, POR CATEGORÍA, 2018-2032 (MILES DE USD)
TABLA 370 FRANCIA MERCADO DE ENVASES DE ALIMENTOS Y BEBIDAS EN COMPUESTOS DE PLÁSTICO, POR TIPO, 2018-2032 (MILES DE USD)
TABLA 371 MERCADO DE ENVASES INDUSTRIALES DE COMPUESTOS PLÁSTICOS EN FRANCIA, POR TIPO, 2018-2032 (MILES DE USD)
TABLA 372 FRANCIA MERCADO DE ENVASES DE BIENES DE CONSUMO EN COMPUESTOS DE PLÁSTICO, POR TIPO, 2018-2032 (MILES DE USD)
TABLA 373 CONSTRUCCIÓN EN FRANCIA EN EL MERCADO DE COMPUESTOS DE PLÁSTICO, POR CATEGORÍA, 2018-2032 (MILES DE USD)
TABLA 374 MERCADO DE PRODUCTOS ELÉCTRICOS Y ELECTRÓNICOS EN COMPUESTOS DE PLÁSTICO EN FRANCIA, POR CATEGORÍA, 2018-2032 (MILES DE USD)
TABLA 375 MERCADO DE DISPOSITIVOS MÉDICOS EN FRANCIA PARA LA FABRICACIÓN DE COMPUESTOS DE PLÁSTICO, POR CATEGORÍA, 2018-2032 (MILES DE USD)
TABLA 376 MERCADO DE MUEBLES EN FRANCIA, POR CATEGORÍA, 2018-2032 (MILES DE USD)
TABLA 377 MERCADO DE ENERGÍA Y ELECTRICIDAD EN FRANCIA, POR CATEGORÍA, 2018-2032 (MILES DE USD)
TABLA 378 FRANCIA AEROESPACIAL Y DEFENSA EN EL MERCADO DE COMPUESTOS PLÁSTICOS, POR CATEGORÍA, 2018-2032 (MILES DE USD)
TABLA 379 MERCADO DE COMPUESTOS PLÁSTICOS DEL REINO UNIDO, POR TIPO DE POLÍMERO, 2018-2032 (MILES DE USD)
TABLA 380 MERCADO DE COMPUESTOS PLÁSTICOS DEL REINO UNIDO, POR TIPO DE POLÍMERO, 2018-2032 (KILOTONELADAS)
TABLA 381 MERCADO DE TERMOPLÁSTICOS EN COMPUESTOS DE PLÁSTICO DEL REINO UNIDO, POR TIPO, 2018-2032 (MILES DE USD)
TABLA 382 MERCADO DE POLIETILENO (PE) EN COMPUESTOS PLÁSTICOS DEL REINO UNIDO, POR TIPO, 2018-2032 (MILES DE USD)
TABLA 383 PLÁSTICOS DE INGENIERÍA EN EL MERCADO DE COMPUESTOS DE PLÁSTICO DEL REINO UNIDO, POR TIPO, 2018-2032 (MILES DE USD)
TABLA 384 PLÁSTICOS TERMOENDURECIBLES EN EL MERCADO DE COMPUESTOS DE PLÁSTICO DEL REINO UNIDO, POR TIPO, 2018-2032 (MILES DE USD)
TABLA 385 MERCADO DE BIOPLÁSTICOS EN COMPUESTOS DE PLÁSTICO DEL REINO UNIDO, POR TIPO, 2018-2032 (MILES DE USD)
TABLA 386 MERCADO DE COMPUESTOS DE PLÁSTICO DEL REINO UNIDO, POR TIPO DE RELLENO, 2018-2032 (MILES DE USD)
TABLA 387 RELLENOS MINERALES EN EL MERCADO DE COMPUESTOS PLÁSTICOS DEL REINO UNIDO, POR TIPO, 2018-2032 (MILES DE USD)
TABLA 388 MERCADO DE REFUERZOS EN EL REINO UNIDO PARA COMPUESTOS DE PLÁSTICO, POR TIPO, 2018-2032 (MILES DE USD)
TABLA 389 ADITIVOS EN EL MERCADO DE COMPUESTOS PLÁSTICOS DEL REINO UNIDO, POR TIPO, 2018-2032 (MILES DE USD)
TABLA 390 MERCADO DE COMPUESTOS DE PLÁSTICO DEL REINO UNIDO, POR PROCESO DE FABRICACIÓN, 2018-2032 (MILES DE USD)
TABLA 391 MERCADO DE COMPUESTOS DE PLÁSTICO DEL REINO UNIDO, POR PROCESO DE FABRICACIÓN, 2018-2032 (KILOTONELADAS)
TABLA 392 MERCADO DE EXTRUSIÓN EN COMPUESTOS DE PLÁSTICO EN EL REINO UNIDO, POR TIPO, 2018-2032 (MILES DE USD)
TABLA 393 MERCADO DE EXTRUSIÓN DE PLÁSTICOS EN EL REINO UNIDO, POR SISTEMA DE PELETIZACIÓN, 2018-2032 (MILES DE USD)
TABLA 394 MERCADO DE COMPUESTOS DE PLÁSTICO BASADOS EN MOLDEO POR INYECCIÓN EN EL REINO UNIDO, POR SISTEMA DE PELETIZACIÓN, 2018-2032 (MILES DE USD)
TABLA 395 COMPACTACIÓN/PRESIONADO EN EL MERCADO DE COMPUESTOS DE PLÁSTICO DEL REINO UNIDO, POR SISTEMA DE PELETIZACIÓN, 2018-2032 (MILES DE USD)
TABLA 396 MERCADO DE MEZCLA DE AMASADORAS/BANBURY EN EL REINO UNIDO PARA LA FABRICACIÓN DE COMPUESTOS DE PLÁSTICO, POR SISTEMA DE PELETIZACIÓN, 2018-2032 (MILES DE USD)
TABLA 397 MERCADO DE COMPUESTOS DE PLÁSTICO DEL REINO UNIDO, POR PROPIEDADES, 2018-2032 (MILES DE USD)
TABLA 398 MERCADO DE COMPUESTOS DE PLÁSTICO DEL REINO UNIDO, POR APLICACIÓN, 2018-2032 (MILES DE USD)
TABLA 399 MERCADO DE COMPUESTOS DE PLÁSTICO DEL REINO UNIDO, POR APLICACIÓN, 2018-2032 (KILOTONELADAS)
TABLA 400 MERCADO DE COMPUESTOS DE PLÁSTICO EN AUTOMÓVILES DEL REINO UNIDO, POR CATEGORÍA, 2018-2032 (MILES DE USD)
TABLA 401 COMPONENTES DE INTERIOR EN EL MERCADO DE COMPUESTOS DE PLÁSTICO DEL REINO UNIDO, POR TIPO, 2018-2032 (MILES DE USD)
TABLA 402 PIEZAS DE CARROCERÍA EXTERIOR EN EL MERCADO DE COMPUESTOS DE PLÁSTICO DEL REINO UNIDO, POR TIPO, 2018-2032 (MILES DE USD)
TABLA 403 APLICACIONES INTERNAS EN EL MERCADO DE COMPUESTOS PLÁSTICOS DEL REINO UNIDO, POR TIPO, 2018-2032 (MILES DE USD)
TABLA 404 MERCADO DE ENVASES DE PLÁSTICO EN EL REINO UNIDO, POR CATEGORÍA, 2018-2032 (MILES DE USD)
TABLA 405 MERCADO DE ENVASES DE ALIMENTOS Y BEBIDAS EN EL REINO UNIDO, POR TIPO, 2018-2032 (MILES DE USD)
TABLA 406 MERCADO DE ENVASES INDUSTRIALES EN EL REINO UNIDO PARA LA FABRICACIÓN DE COMPUESTOS DE PLÁSTICO, POR TIPO, 2018-2032 (MILES DE USD)
TABLA 407 MERCADO DE ENVASES DE BIENES DE CONSUMO EN EL REINO UNIDO, POR TIPO, 2018-2032 (MILES DE USD)
TABLA 408 MERCADO DE CONSTRUCCIÓN Y EDIFICACIÓN DE COMPUESTOS DE PLÁSTICO EN EL REINO UNIDO, POR CATEGORÍA, 2018-2032 (MILES DE USD)
TABLA 409 MERCADO DE PRODUCTOS ELÉCTRICOS Y ELECTRÓNICOS EN COMPUESTOS DE PLÁSTICO DEL REINO UNIDO, POR CATEGORÍA, 2018-2032 (MILES DE USD)
TABLA 410 DISPOSITIVOS MÉDICOS EN EL MERCADO DE COMPUESTOS DE PLÁSTICO DEL REINO UNIDO, POR CATEGORÍA, 2018-2032 (MILES DE USD)
TABLA 411 MERCADO DE MUEBLES EN EL REINO UNIDO, POR CATEGORÍA, 2018-2032 (MILES DE USD)
TABLA 412 MERCADO DE ENERGÍA Y ELECTRICIDAD EN EL REINO UNIDO PARA COMPUESTOS DE PLÁSTICO, POR CATEGORÍA, 2018-2032 (MILES DE USD)
TABLA 413 MERCADO DE COMPUESTOS PLÁSTICOS DE LA INDUSTRIA AEROESPACIAL Y DE DEFENSA DEL REINO UNIDO, POR CATEGORÍA, 2018-2032 (MILES DE USD)
TABLA 414 MERCADO ESPAÑOL DE COMPUESTOS PLÁSTICOS, POR TIPO DE POLÍMERO, 2018-2032 (MILES DE USD)
TABLA 415 MERCADO ESPAÑOL DE COMPUESTOS PLÁSTICOS, POR TIPO DE POLÍMERO, 2018-2032 (KILOTONELADAS)
TABLA 416 MERCADO ESPAÑOL DE TERMOPLÁSTICOS EN COMPUESTOS PLÁSTICOS, POR TIPO, 2018-2032 (MILES DE USD)
TABLA 417 MERCADO ESPAÑOL DE POLIETILENO (PE) EN COMPUESTOS PLÁSTICOS, POR TIPO, 2018-2032 (MILES DE USD)
TABLA 418 MERCADO ESPAÑOL DE PLÁSTICOS DE INGENIERÍA EN COMPUESTOS DE PLÁSTICO, POR TIPO, 2018-2032 (MILES DE USD)
TABLA 419 MERCADO DE PLÁSTICOS TERMOESTABLECIDOS EN ESPAÑA, POR TIPO, 2018-2032 (MILES DE USD)
TABLA 420 MERCADO ESPAÑOL DE BIOPLÁSTICOS EN COMPUESTOS PLÁSTICOS, POR TIPO, 2018-2032 (MILES DE USD)
TABLA 421 MERCADO ESPAÑOL DE COMPUESTOS DE PLÁSTICO, POR TIPO DE RELLENO, 2018-2032 (MILES DE USD)
TABLA 422 MERCADO ESPAÑOL DE CARGAS MINERALES EN COMPUESTOS PLÁSTICOS, POR TIPO, 2018-2032 (MILES DE USD)
TABLA 423 MERCADO DE REFUERZOS EN COMPUESTOS PLÁSTICOS DE ESPAÑA, POR TIPO, 2018-2032 (MILES DE USD)
TABLA 424 ADITIVOS EN EL MERCADO DE COMPUESTOS PLÁSTICOS EN ESPAÑA, POR TIPO, 2018-2032 (MILES DE USD)
TABLA 425 MERCADO ESPAÑOL DE COMPUESTOS DE PLÁSTICO, POR PROCESO DE FABRICACIÓN, 2018-2032 (MILES DE USD)
TABLA 426 MERCADO ESPAÑOL DE COMPUESTOS DE PLÁSTICO, POR PROCESO DE FABRICACIÓN, 2018-2032 (KILOTONELADAS)
TABLA 427 MERCADO DE EXTRUSIÓN EN COMPUESTOS DE PLÁSTICO EN ESPAÑA, POR TIPO, 2018-2032 (MILES DE USD)
TABLA 428 MERCADO ESPAÑOL DE EXTRUSIÓN EN COMPUESTOS DE PLÁSTICO, POR SISTEMA DE PELETIZACIÓN, 2018-2032 (MILES DE USD)
TABLA 429 MERCADO ESPAÑOL DE COMPUESTOS DE PLÁSTICO BASADOS EN MOLDEO POR INYECCIÓN, POR SISTEMA DE PELETIZACIÓN, 2018-2032 (MILES DE USD)
TABLA 430 COMPACTACIÓN/PRESIONADO EN EL MERCADO DE COMPUESTOS DE PLÁSTICO EN ESPAÑA, POR SISTEMA DE PELETIZACIÓN, 2018-2032 (MILES DE USD)
TABLA 431 MERCADO ESPAÑOL DE MEZCLAS DE AMASADORAS/BANBURY EN LA FABRICACIÓN DE COMPUESTOS DE PLÁSTICO, POR SISTEMA DE PELETIZACIÓN, 2018-2032 (MILES DE USD)
TABLA 432 MERCADO ESPAÑOL DE COMPUESTOS DE PLÁSTICO, POR PROPIEDADES, 2018-2032 (MILES DE USD)
TABLA 433 MERCADO ESPAÑOL DE COMPUESTOS DE PLÁSTICO, POR APLICACIÓN, 2018-2032 (MILES DE USD)
TABLA 434 MERCADO ESPAÑOL DE COMPUESTOS DE PLÁSTICO, POR APLICACIÓN, 2018-2032 (KILOTONELADAS)
TABLA 435 MERCADO DE AUTOMOCIÓN EN ESPAÑA, POR CATEGORÍA, 2018-2032 (MILES DE USD)
TABLA 436 COMPONENTES DE INTERIOR EN EL MERCADO DE COMPUESTOS DE PLÁSTICO EN ESPAÑA, POR TIPO, 2018-2032 (MILES DE USD)
TABLA 437 PIEZAS DE CARROCERÍA EXTERIOR EN EL MERCADO DE COMPUESTOS DE PLÁSTICO EN ESPAÑA, POR TIPO, 2018-2032 (MILES DE USD)
TABLA 438 APLICACIONES INTERNAS EN ESPAÑA EN EL MERCADO DE COMPUESTOS DE PLÁSTICO, POR TIPO, 2018-2032 (MILES DE USD)
TABLA 439 MERCADO ESPAÑOL DE ENVASES DE COMPUESTOS DE PLÁSTICO, POR CATEGORÍA, 2018-2032 (MILES DE USD)
TABLA 440 MERCADO ESPAÑOL DE ENVASES DE ALIMENTOS Y BEBIDAS EN COMPUESTOS DE PLÁSTICO, POR TIPO, 2018-2032 (MILES DE USD)
TABLA 441 MERCADO ESPAÑOL DE ENVASES INDUSTRIALES EN COMPUESTOS DE PLÁSTICO, POR TIPO, 2018-2032 (MILES DE USD)
TABLA 442 MERCADO ESPAÑOL DE ENVASES DE BIENES DE CONSUMO EN COMPUESTOS DE PLÁSTICO, POR TIPO, 2018-2032 (MILES DE USD)
TABLA 443 MERCADO DE CONSTRUCCIÓN Y EDIFICACIÓN DE COMPUESTOS DE PLÁSTICO EN ESPAÑA, POR CATEGORÍA, 2018-2032 (MILES DE USD)
TABLA 444 MERCADO ESPAÑOL DE PRODUCTOS ELÉCTRICOS Y ELECTRÓNICOS EN COMPUESTOS DE PLÁSTICO, POR CATEGORÍA, 2018-2032 (MILES DE USD)
TABLA 445 MERCADO ESPAÑOL DE PRODUCTOS SANITARIOS EN COMPUESTOS DE PLÁSTICO, POR CATEGORÍA, 2018-2032 (MILES DE USD)
TABLA 446 MERCADO ESPAÑOL DE MUEBLES EN COMPUESTOS DE PLÁSTICO, POR CATEGORÍA, 2018-2032 (MILES DE USD)
TABLA 447 MERCADO DE ENERGÍA Y ELECTRICIDAD EN ESPAÑA, POR CATEGORÍA, 2018-2032 (MILES DE USD)
TABLA 448 MERCADO DE COMPUESTOS PLÁSTICOS EN ESPAÑA, POR CATEGORÍA, 2018-2032 (MILES USD)
TABLA 449 MERCADO DE COMPUESTOS PLÁSTICOS DE RUSIA, POR TIPO DE POLÍMERO, 2018-2032 (MILES DE USD)
TABLA 450 MERCADO DE COMPUESTOS PLÁSTICOS DE RUSIA, POR TIPO DE POLÍMERO, 2018-2032 (KILOTONELADAS)
TABLA 451 TERMOPLÁSTICOS EN EL MERCADO DE COMPUESTOS PLÁSTICOS DE RUSIA, POR TIPO, 2018-2032 (MILES DE USD)
TABLA 452 POLIETILENO (PE) EN EL MERCADO DE COMPUESTOS PLÁSTICOS DE RUSIA, POR TIPO, 2018-2032 (MILES DE USD)
TABLA 453 PLÁSTICOS DE INGENIERÍA EN EL MERCADO DE COMPUESTOS DE PLÁSTICO DE RUSIA, POR TIPO, 2018-2032 (MILES DE USD)
TABLA 454 PLÁSTICOS TERMOENDURECIBLES DE RUSIA EN EL MERCADO DE COMPUESTOS DE PLÁSTICO, POR TIPO, 2018-2032 (MILES DE USD)
TABLA 455 BIOPLÁSTICOS EN EL MERCADO DE COMPUESTOS PLÁSTICOS DE RUSIA, POR TIPO, 2018-2032 (MILES DE USD)
TABLA 456 MERCADO DE COMPUESTOS PLÁSTICOS DE RUSIA, POR TIPO DE RELLENO, 2018-2032 (MILES DE USD)
TABLA 457 RELLENOS MINERALES EN EL MERCADO DE COMPUESTOS PLÁSTICOS DE RUSIA, POR TIPO, 2018-2032 (MILES DE USD)
TABLA 458 REFUERZOS DE RUSIA EN EL MERCADO DE COMPUESTOS PLÁSTICOS, POR TIPO, 2018-2032 (MILES DE USD)
TABLA 459 ADITIVOS DE RUSIA EN EL MERCADO DE COMPUESTOS PLÁSTICOS, POR TIPO, 2018-2032 (MILES DE USD)
TABLA 460 MERCADO DE COMPUESTOS DE PLÁSTICO EN RUSIA, POR PROCESO DE FABRICACIÓN, 2018-2032 (MILES DE USD)
TABLA 461 MERCADO DE COMPUESTOS PLÁSTICOS DE RUSIA, POR PROCESO DE FABRICACIÓN, 2018-2032 (KILOTONELADAS)
TABLA 462 RUSIA EXTRUSIÓN EN EL MERCADO DE COMPUESTOS DE PLÁSTICO, POR TIPO, 2018-2032 (MILES DE USD)
TABLA 463 RUSIA EXTRUSIÓN EN EL MERCADO DE COMPUESTOS DE PLÁSTICO, POR SISTEMA DE PELETIZACIÓN, 2018-2032 (MILES DE USD)
TABLA 464 MERCADO DE COMPUESTOS DE PLÁSTICO BASADOS EN MOLDEO POR INYECCIÓN EN RUSIA, POR SISTEMA DE PELETIZACIÓN, 2018-2032 (MILES DE USD)
TABLA 465 COMPACTACIÓN/PRESIONADO EN EL MERCADO DE COMPUESTOS DE PLÁSTICO EN RUSIA, POR SISTEMA DE PELETIZACIÓN, 2018-2032 (MILES DE USD)
TABLA 466 RUSIA AMASADAS/MEZCLA BANBURY EN EL MERCADO DE COMPUESTOS DE PLÁSTICO, POR SISTEMA DE PELETIZACIÓN, 2018-2032 (MILES DE USD)
TABLA 467 MERCADO DE COMPUESTOS PLÁSTICOS DE RUSIA, POR PROPIEDADES, 2018-2032 (MILES DE USD)
TABLA 468 MERCADO DE COMPUESTOS PLÁSTICOS DE RUSIA, POR APLICACIÓN, 2018-2032 (MILES DE USD)
TABLA 469 MERCADO DE COMPUESTOS PLÁSTICOS DE RUSIA, POR APLICACIÓN, 2018-2032 (KILOTONELADAS).
TABLA 470 MERCADO DE COMPUESTOS DE PLÁSTICO EN AUTOMÓVILES DE RUSIA, POR CATEGORÍA, 2018-2032 (MILES DE USD)
TABLA 471 COMPONENTES DE INTERIOR DE RUSIA EN EL MERCADO DE COMPUESTOS DE PLÁSTICO, POR TIPO, 2018-2032 (MILES DE USD)
TABLA 472 PARTES DE CARROCERÍA EXTERIOR DE RUSIA EN EL MERCADO DE COMPUESTOS DE PLÁSTICO, POR TIPO, 2018-2032 (MILES DE USD)
TABLA 473 APLICACIONES INTERNAS EN RUSIA EN EL MERCADO DE COMPUESTOS PLÁSTICOS, POR TIPO, 2018-2032 (MILES DE USD)
TABLA 474 RUSIA MERCADO DE ENVASES DE COMPUESTOS PLÁSTICOS, POR CATEGORÍA, 2018-2032 (MILES DE USD)
TABLA 475 ENVASES DE ALIMENTOS Y BEBIDAS EN EL MERCADO DE COMPUESTOS DE PLÁSTICO DE RUSIA, POR TIPO, 2018-2032 (MILES DE USD)
TABLA 476 ENVASES INDUSTRIALES EN EL MERCADO DE COMPUESTOS DE PLÁSTICO DE RUSIA, POR TIPO, 2018-2032 (MILES DE USD)
TABLA 477 ENVASES DE BIENES DE CONSUMO EN EL MERCADO DE COMPUESTOS DE PLÁSTICO DE RUSIA, POR TIPO, 2018-2032 (MILES DE USD)
TABLA 478 RUSIA: MERCADO DE CONSTRUCCIÓN Y EDIFICACIÓN DE COMPUESTOS PLÁSTICOS, POR CATEGORÍA, 2018-2032 (MILES DE USD)
TABLA 479 MERCADO RUSO DE PRODUCTOS ELÉCTRICOS Y ELECTRÓNICOS EN COMPUESTOS DE PLÁSTICO, POR CATEGORÍA, 2018-2032 (MILES DE USD)
TABLA 480 DISPOSITIVOS MÉDICOS EN EL MERCADO DE COMPUESTOS PLÁSTICOS DE RUSIA, POR CATEGORÍA, 2018-2032 (MILES DE USD)
TABLA 481 MERCADO DE MUEBLES DE RUSIA EN COMPUESTOS DE PLÁSTICO, POR CATEGORÍA, 2018-2032 (MILES DE USD)
TABLA 482 ENERGÍA Y ELECTRICIDAD EN EL MERCADO DE COMPUESTOS DE PLÁSTICO EN RUSIA, POR CATEGORÍA, 2018-2032 (MILES DE USD)
TABLA 483 RUSIA AEROESPACIAL Y DEFENSA EN EL MERCADO DE COMPUESTOS PLÁSTICOS, POR CATEGORÍA, 2018-2032 (MILES DE USD)
TABLA 484 MERCADO DE COMPUESTOS PLÁSTICOS DE SUIZA, POR TIPO DE POLÍMERO, 2018-2032 (MILES DE USD)
TABLA 485 MERCADO DE COMPUESTOS PLÁSTICOS DE SUIZA, POR TIPO DE POLÍMERO, 2018-2032 (KILOTONELADAS)
TABLA 486 MERCADO DE TERMOPLÁSTICOS EN COMPUESTOS PLÁSTICOS DE SUIZA, POR TIPO, 2018-2032 (MILES DE USD)
TABLA 487 POLIETILENO (PE) EN EL MERCADO DE COMPUESTOS PLÁSTICOS DE SUIZA, POR TIPO, 2018-2032 (MILES DE USD)
TABLA 488 PLÁSTICOS DE INGENIERÍA EN EL MERCADO DE COMPUESTOS PLÁSTICOS DE SUIZA, POR TIPO, 2018-2032 (MILES DE USD)
TABLA 489 PLÁSTICOS TERMOENDURECIBLES EN EL MERCADO DE COMPUESTOS DE PLÁSTICO DE SUIZA, POR TIPO, 2018-2032 (MILES DE USD)
TABLA 490 BIOPLÁSTICOS EN EL MERCADO DE COMPUESTOS PLÁSTICOS DE SUIZA, POR TIPO, 2018-2032 (MILES DE USD)
TABLA 491 MERCADO DE COMPUESTOS PLÁSTICOS DE SUIZA, POR TIPO DE RELLENO, 2018-2032 (MILES DE USD)
TABLA 492 SUIZA: RELLENOS MINERALES EN EL MERCADO DE COMPUESTOS PLÁSTICOS, POR TIPO, 2018-2032 (MILES DE USD)
TABLA 493 REFUERZOS EN EL MERCADO DE COMPUESTOS PLÁSTICOS DE SUIZA, POR TIPO, 2018-2032 (MILES DE USD)
TABLA 494 ADITIVOS EN EL MERCADO DE COMPUESTOS PLÁSTICOS DE SUIZA, POR TIPO, 2018-2032 (MILES DE USD)
TABLA 495 MERCADO DE COMPUESTOS PLÁSTICOS DE SUIZA, POR PROCESO DE FABRICACIÓN, 2018-2032 (MILES DE USD)
TABLA 496 MERCADO DE COMPUESTOS DE PLÁSTICO EN SUIZA, POR PROCESO DE FABRICACIÓN, 2018-2032 (KILOTONELADAS)
TABLA 497 MERCADO DE EXTRUSIÓN EN COMPUESTOS DE PLÁSTICO EN SUIZA, POR TIPO, 2018-2032 (MILES DE USD)
TABLA 498 MERCADO DE EXTRUSIÓN EN COMPUESTOS DE PLÁSTICO EN SUIZA, POR SISTEMA DE PELETIZACIÓN, 2018-2032 (MILES DE USD)
TABLA 499 SUIZA - MERCADO DE COMPUESTOS DE PLÁSTICO BASADOS EN MOLDEO POR INYECCIÓN, POR SISTEMA DE PELETIZACIÓN, 2018-2032 (MILES DE USD)
TABLA 500 COMPACTACIÓN/PRESIONADO EN EL MERCADO DE COMPUESTOS DE PLÁSTICO EN SUIZA, POR SISTEMA DE PELETIZACIÓN, 2018-2032 (MILES DE USD)
TABLA 501 SUIZA MERCADO DE MEZCLA DE AMASADORAS/BANBURY EN COMPUESTOS DE PLÁSTICO, POR SISTEMA DE PELETIZACIÓN, 2018-2032 (MILES DE USD)
TABLA 502 MERCADO DE COMPUESTOS PLÁSTICOS DE SUIZA, POR PROPIEDADES, 2018-2032 (MILES DE USD)
TABLA 503 MERCADO DE COMPUESTOS PLÁSTICOS DE SUIZA, POR APLICACIÓN, 2018-2032 (MILES DE USD)
TABLA 504 MERCADO DE COMPUESTOS PLÁSTICOS DE SUIZA, POR APLICACIÓN, 2018-2032 (KILOTONELADAS)
TABLA 505 MERCADO DE COMPUESTOS DE PLÁSTICO EN AUTOMOCIÓN DE SUIZA, POR CATEGORÍA, 2018-2032 (MILES DE USD)
TABLA 506 COMPONENTES DE INTERIOR EN EL MERCADO DE COMPUESTOS PLÁSTICOS DE SUIZA, POR TIPO, 2018-2032 (MILES DE USD)
TABLA 507 SUIZA: PIEZAS DE CARROCERÍA EXTERIOR EN EL MERCADO DE COMPUESTOS DE PLÁSTICO, POR TIPO, 2018-2032 (MILES DE USD)
TABLA 508 APLICACIONES INTERNAS EN SUIZA EN EL MERCADO DE COMPUESTOS PLÁSTICOS, POR TIPO, 2018-2032 (MILES DE USD)
TABLA 509 MERCADO DE ENVASES DE PLÁSTICO EN SUIZA, POR CATEGORÍA, 2018-2032 (MILES DE USD)
TABLA 510 SUIZA: ENVASES DE ALIMENTOS Y BEBIDAS EN EL MERCADO DE COMPUESTOS DE PLÁSTICO, POR TIPO, 2018-2032 (MILES DE USD)
TABLA 511 MERCADO SUIZO DE ENVASES INDUSTRIALES EN COMPUESTOS DE PLÁSTICO, POR TIPO, 2018-2032 (MILES DE USD)
TABLA 512 SUIZA MERCADO DE ENVASES DE BIENES DE CONSUMO EN COMPUESTOS DE PLÁSTICO, POR TIPO, 2018-2032 (MILES DE USD)
TABLA 513 SUIZA: MERCADO DE CONSTRUCCIÓN Y EDIFICACIÓN DE COMPUESTOS PLÁSTICOS, POR CATEGORÍA, 2018-2032 (MILES DE USD)
TABLA 514 MERCADO SUIZO DE PRODUCTOS ELÉCTRICOS Y ELECTRÓNICOS EN COMPUESTOS DE PLÁSTICO, POR CATEGORÍA, 2018-2032 (MILES DE USD)
TABLA 515 SUIZA: MERCADO DE DISPOSITIVOS MÉDICOS EN COMPUESTOS DE PLÁSTICO, POR CATEGORÍA, 2018-2032 (MILES DE USD)
TABLA 516 MERCADO DE MUEBLES EN SUIZA EN COMPUESTOS DE PLÁSTICO, POR CATEGORÍA, 2018-2032 (MILES DE USD)
TABLA 517 SUIZA ENERGÍA Y ELECTRICIDAD EN EL MERCADO DE COMPUESTOS DE PLÁSTICO, POR CATEGORÍA, 2018-2032 (MILES DE USD)
TABLA 518 SUIZA AEROESPACIAL Y DEFENSA EN EL MERCADO DE COMPUESTOS PLÁSTICOS, POR CATEGORÍA, 2018-2032 (MILES DE USD)
TABLA 519 MERCADO DE COMPUESTOS PLÁSTICOS DE TURQUÍA, POR TIPO DE POLÍMERO, 2018-2032 (MILES DE USD)
TABLA 520 MERCADO DE COMPUESTOS PLÁSTICOS DE TURQUÍA, POR TIPO DE POLÍMERO, 2018-2032 (KILOTONELADAS)
TABLA 521 MERCADO DE TERMOPLÁSTICOS EN COMPUESTOS PLÁSTICOS DE TURQUÍA, POR TIPO, 2018-2032 (MILES DE USD)
TABLA 522 MERCADO DE POLIETILENO (PE) EN COMPUESTOS PLÁSTICOS DE TURQUÍA, POR TIPO, 2018-2032 (MILES DE USD)
TABLA 523 PLÁSTICOS DE INGENIERÍA EN EL MERCADO DE COMPUESTOS PLÁSTICOS DE TURQUÍA, POR TIPO, 2018-2032 (MILES DE USD)
TABLA 524 PLÁSTICOS TERMOENDURECIBLES DE TURQUÍA EN EL MERCADO DE COMPUESTOS DE PLÁSTICO, POR TIPO, 2018-2032 (MILES DE USD)
TABLA 525 BIOPLÁSTICOS DE TURQUÍA EN EL MERCADO DE COMPUESTOS PLÁSTICOS, POR TIPO, 2018-2032 (MILES DE USD)
TABLA 526 MERCADO DE COMPUESTOS PLÁSTICOS DE TURQUÍA, POR TIPO DE RELLENO, 2018-2032 (MILES DE USD)
TABLA 527 RELLENOS MINERALES DE TURQUÍA EN EL MERCADO DE COMPUESTOS PLÁSTICOS, POR TIPO, 2018-2032 (MILES DE USD)
TABLA 528 REFUERZOS DE TURQUÍA EN EL MERCADO DE COMPUESTOS PLÁSTICOS, POR TIPO, 2018-2032 (MILES DE USD)
TABLA 529 ADITIVOS DE TURQUÍA EN EL MERCADO DE COMPUESTOS PLÁSTICOS, POR TIPO, 2018-2032 (MILES DE USD)
TABLA 530 MERCADO DE COMPUESTOS DE PLÁSTICO DE TURQUÍA, POR PROCESO DE FABRICACIÓN, 2018-2032 (MILES DE USD)
TABLA 531 MERCADO DE COMPUESTOS DE PLÁSTICO DE TURQUÍA, POR PROCESO DE FABRICACIÓN, 2018-2032 (KILOTONELADAS)
TABLA 532 MERCADO DE EXTRUSIÓN DE PAVO EN COMPUESTOS PLÁSTICOS, POR TIPO, 2018-2032 (MILES DE USD)
TABLA 533 EXTRUSIÓN DE PAVO EN EL MERCADO DE COMPUESTOS DE PLÁSTICO, POR SISTEMA DE PELETIZACIÓN, 2018-2032 (MILES DE USD)
TABLA 534 MERCADO DE COMPUESTOS DE PLÁSTICO BASADOS EN MOLDEO POR INYECCIÓN DE TURQUÍA, POR SISTEMA DE PELETIZACIÓN, 2018-2032 (MILES DE USD)
TABLA 535 COMPACTACIÓN/PRESIONADO DE TURQUÍA EN EL MERCADO DE COMPUESTOS DE PLÁSTICO, POR SISTEMA DE PELETIZACIÓN, 2018-2032 (MILES DE USD)
TABLA 536 AMASADAS DE PAVO/MEZCLA BANBURY EN EL MERCADO DE COMPUESTOS DE PLÁSTICO, POR SISTEMA DE PELETIZACIÓN, 2018-2032 (MILES DE USD)
TABLA 537 MERCADO DE COMPUESTOS PLÁSTICOS DE TURQUÍA, POR PROPIEDADES, 2018-2032 (MILES DE USD)
TABLA 538 MERCADO DE COMPUESTOS PLÁSTICOS DE TURQUÍA, POR APLICACIÓN, 2018-2032 (MILES DE USD)
TABLA 539 MERCADO DE COMPUESTOS PLÁSTICOS DE TURQUÍA, POR APLICACIÓN, 2018-2032 (KILOTONELADAS)
TABLA 540 MERCADO DE COMPUESTOS DE PLÁSTICO EN EL SECTOR AUTOMOTRIZ DE TURQUÍA, POR CATEGORÍA, 2018-2032 (MILES DE USD)
TABLA 541 COMPONENTES INTERIORES DE TURQUÍA EN EL MERCADO DE COMPUESTOS PLÁSTICOS, POR TIPO, 2018-2032 (MILES DE USD)
TABLA 542 PARTES DE CARROCERÍA EXTERIOR DE TURQUÍA EN EL MERCADO DE COMPUESTOS DE PLÁSTICO, POR TIPO, 2018-2032 (MILES DE USD)
TABLA 543 APLICACIONES DE PAVO BAJO EL CAPÓ EN EL MERCADO DE COMPUESTOS PLÁSTICOS, POR TIPO, 2018-2032 (MILES DE USD)
TABLA 544 ENVASES DE PAVO EN EL MERCADO DE COMPUESTOS PLÁSTICOS, POR CATEGORÍA, 2018-2032 (MILES DE USD)
TABLA 545 ENVASES DE ALIMENTOS Y BEBIDAS DE TURQUÍA EN EL MERCADO DE COMPUESTOS DE PLÁSTICO, POR TIPO, 2018-2032 (MILES DE USD)
TABLA 546 MERCADO DE ENVASES INDUSTRIALES DE TURQUÍA EN COMPUESTOS DE PLÁSTICO, POR TIPO, 2018-2032 (MILES DE USD)
TABLA 547 MERCADO DE ENVASES DE BIENES DE CONSUMO EN COMPUESTOS DE PLÁSTICO DE TURQUÍA, POR TIPO, 2018-2032 (MILES DE USD)
TABLA 548 MERCADO DE CONSTRUCCIÓN Y EDIFICACIÓN DE COMPUESTOS PLÁSTICOS EN TURQUÍA, POR CATEGORÍA, 2018-2032 (MILES DE USD)
TABLA 549 MERCADO DE PRODUCTOS ELÉCTRICOS Y ELECTRÓNICOS EN COMPUESTOS DE PLÁSTICO DE TURQUÍA, POR CATEGORÍA, 2018-2032 (MILES DE USD)
TABLA 550 DISPOSITIVOS MÉDICOS EN EL MERCADO DE COMPUESTOS PLÁSTICOS DE TURQUÍA, POR CATEGORÍA, 2018-2032 (MILES DE USD)
TABLA 551 MUEBLES DE TURQUÍA EN EL MERCADO DE COMPUESTOS DE PLÁSTICO, POR CATEGORÍA, 2018-2032 (MILES DE USD)
TABLA 552 ENERGÍA Y ELECTRICIDAD EN EL MERCADO DE COMPUESTOS DE PLÁSTICO DE TURQUÍA, POR CATEGORÍA, 2018-2032 (MILES DE USD)
TABLA 553 TURQUÍA: MERCADO DE COMPUESTOS PLÁSTICOS EN LA INDUSTRIA AEROESPACIAL Y DE DEFENSA, POR CATEGORÍA, 2018-2032 (MILES DE USD)
TABLA 554 MERCADO DE COMPUESTOS PLÁSTICOS DE BÉLGICA, POR TIPO DE POLÍMERO, 2018-2032 (MILES DE USD)
TABLA 555 MERCADO DE COMPUESTOS PLÁSTICOS DE BÉLGICA, POR TIPO DE POLÍMERO, 2018-2032 (KILOTONELADAS)
TABLA 556 MERCADO DE TERMOPLÁSTICOS EN COMPUESTOS PLÁSTICOS DE BÉLGICA, POR TIPO, 2018-2032 (MILES DE USD)
TABLA 557 MERCADO DE POLIETILENO (PE) EN COMPUESTOS PLÁSTICOS DE BÉLGICA, POR TIPO, 2018-2032 (MILES DE USD)
TABLA 558 PLÁSTICOS DE INGENIERÍA DE BÉLGICA EN EL MERCADO DE COMPUESTOS DE PLÁSTICO, POR TIPO, 2018-2032 (MILES DE USD)
TABLA 559 PLÁSTICOS TERMOENDURECIBLES DE BÉLGICA EN EL MERCADO DE COMPUESTOS DE PLÁSTICO, POR TIPO, 2018-2032 (MILES DE USD)
TABLA 560 BIOPLÁSTICOS BÉLGICA EN EL MERCADO DE COMPUESTOS PLÁSTICOS, POR TIPO, 2018-2032 (MILES DE USD)
TABLA 561 MERCADO DE COMPUESTOS DE PLÁSTICO DE BÉLGICA, POR TIPO DE RELLENO, 2018-2032 (MILES DE USD)
TABLA 562 RELLENOS MINERALES EN EL MERCADO DE COMPUESTOS PLÁSTICOS DE BÉLGICA, POR TIPO, 2018-2032 (MILES DE USD)
TABLA 563 REFUERZOS EN EL MERCADO DE COMPUESTOS PLÁSTICOS DE BÉLGICA, POR TIPO, 2018-2032 (MILES DE USD)
TABLA 564 ADITIVOS DE BÉLGICA EN EL MERCADO DE COMPUESTOS PLÁSTICOS, POR TIPO, 2018-2032 (MILES DE USD)
TABLA 565 MERCADO DE COMPUESTOS DE PLÁSTICO DE BÉLGICA, POR PROCESO DE FABRICACIÓN, 2018-2032 (MILES DE USD)
TABLA 566 MERCADO DE COMPUESTOS DE PLÁSTICO DE BÉLGICA, POR PROCESO DE FABRICACIÓN, 2018-2032 (KILOTONELADAS)
TABLA 567 MERCADO DE EXTRUSIÓN DE PLÁSTICOS EN BÉLGICA, POR TIPO, 2018-2032 (MILES DE USD)
TABLA 568 MERCADO DE EXTRUSIÓN DE PLÁSTICOS EN BÉLGICA, POR SISTEMA DE PELETIZACIÓN, 2018-2032 (MILES DE USD)
TABLA 569 MERCADO DE COMPUESTOS DE PLÁSTICO BASADOS EN MOLDEO POR INYECCIÓN EN BÉLGICA, POR SISTEMA DE PELETIZACIÓN, 2018-2032 (MILES DE USD)
TABLA 570 COMPACTACIÓN/PRESIONADO EN EL MERCADO DE COMPUESTOS DE PLÁSTICO EN BÉLGICA, POR SISTEMA DE PELETIZACIÓN, 2018-2032 (MILES DE USD)
TABLA 571 MERCADO DE MEZCLA DE AMASADORAS/BANBURY EN LA FABRICACIÓN DE COMPUESTOS DE PLÁSTICO EN BÉLGICA, POR SISTEMA DE PELETIZACIÓN, 2018-2032 (MILES DE USD)
TABLA 572 MERCADO DE COMPUESTOS PLÁSTICOS DE BÉLGICA, POR PROPIEDADES, 2018-2032 (MILES DE USD)
TABLA 573 MERCADO DE COMPUESTOS PLÁSTICOS DE BÉLGICA, POR APLICACIÓN, 2018-2032 (MILES DE USD)
TABLA 574 MERCADO DE COMPUESTOS PLÁSTICOS DE BÉLGICA, POR APLICACIÓN, 2018-2032 (KILOTONELADAS)
TABLA 575 MERCADO DE COMPUESTOS DE PLÁSTICO EN EL SECTOR AUTOMOTRIZ DE BÉLGICA, POR CATEGORÍA, 2018-2032 (MILES DE USD)
TABLA 576 COMPONENTES DE INTERIOR DE BÉLGICA EN EL MERCADO DE COMPUESTOS DE PLÁSTICO, POR TIPO, 2018-2032 (MILES DE USD)
TABLA 577 PARTES DE CARROCERÍA EXTERIOR DE BÉLGICA EN EL MERCADO DE COMPUESTOS DE PLÁSTICO, POR TIPO, 2018-2032 (MILES DE USD)
TABLA 578 APLICACIONES INTERNAS EN BÉLGICA EN EL MERCADO DE COMPUESTOS PLÁSTICOS, POR TIPO, 2018-2032 (MILES DE USD)
TABLA 579 MERCADO DE ENVASES DE PLÁSTICO EN BÉLGICA, POR CATEGORÍA, 2018-2032 (MILES DE USD)
TABLA 580 MERCADO BÉLGICO DE ENVASES DE ALIMENTOS Y BEBIDAS EN COMPUESTOS DE PLÁSTICO, POR TIPO, 2018-2032 (MILES DE USD)
TABLA 581 MERCADO DE ENVASES INDUSTRIALES DE BÉLGICA EN COMPUESTOS DE PLÁSTICO, POR TIPO, 2018-2032 (MILES DE USD)
TABLA 582 MERCADO DE ENVASES DE BIENES DE CONSUMO EN COMPUESTOS DE PLÁSTICO DE BÉLGICA, POR TIPO, 2018-2032 (MILES DE USD)
TABLA 583 MERCADO DE CONSTRUCCIÓN Y EDIFICACIÓN DE PLÁSTICOS EN BÉLGICA, POR CATEGORÍA, 2018-2032 (MILES DE USD)
TABLA 584 MERCADO BÉLGICO DE PRODUCTOS ELÉCTRICOS Y ELECTRÓNICOS EN COMPUESTOS DE PLÁSTICO, POR CATEGORÍA, 2018-2032 (MILES DE USD)
TABLA 585 MERCADO DE DISPOSITIVOS MÉDICOS DE BÉLGICA EN COMPUESTOS DE PLÁSTICO, POR CATEGORÍA, 2018-2032 (MILES DE USD)
TABLA 586 MERCADO DE MUEBLES DE BÉLGICA EN COMPUESTOS DE PLÁSTICO, POR CATEGORÍA, 2018-2032 (MILES DE USD)
TABLA 587 ENERGÍA Y ELECTRICIDAD EN EL MERCADO DE COMPUESTOS DE PLÁSTICO EN BÉLGICA, POR CATEGORÍA, 2018-2032 (MILES DE USD)
TABLA 588 MERCADO DE COMPUESTOS PLÁSTICOS DE LA INDUSTRIA AEROESPACIAL Y DE DEFENSA DE BÉLGICA, POR CATEGORÍA, 2018-2032 (MILES DE USD)
TABLA 589 MERCADO DE COMPUESTOS PLÁSTICOS DE LOS PAÍSES BAJOS, POR TIPO DE POLÍMERO, 2018-2032 (MILES DE USD)
TABLA 590 MERCADO DE COMPUESTOS PLÁSTICOS DE LOS PAÍSES BAJOS, POR TIPO DE POLÍMERO, 2018-2032 (KILOTONELADAS)
TABLA 591 MERCADO DE TERMOPLÁSTICOS EN COMPUESTOS PLÁSTICOS DE LOS PAÍSES BAJOS, POR TIPO, 2018-2032 (MILES DE USD)
TABLA 592 MERCADO DE POLIETILENO (PE) EN COMPUESTOS PLÁSTICOS DE LOS PAÍSES BAJOS, POR TIPO, 2018-2032 (MILES DE USD)
TABLA 593 MERCADO DE PLÁSTICOS DE INGENIERÍA EN LOS PAÍSES BAJOS, POR TIPO, 2018-2032 (MILES DE USD)
TABLA 594 PLÁSTICOS TERMOENDURECIBLES DE LOS PAÍSES BAJOS EN EL MERCADO DE COMPUESTOS DE PLÁSTICO, POR TIPO, 2018-2032 (MILES DE USD)
TABLA 595 MERCADO DE BIOPLÁSTICOS EN COMPUESTOS PLÁSTICOS DE LOS PAÍSES BAJOS, POR TIPO, 2018-2032 (MILES DE USD)
TABLA 596 MERCADO DE COMPUESTOS PLÁSTICOS DE LOS PAÍSES BAJOS, POR TIPO DE RELLENO, 2018-2032 (MILES DE USD)
TABLA 597 MERCADO DE RELLENOS MINERALES EN COMPUESTOS PLÁSTICOS DE LOS PAÍSES BAJOS, POR TIPO, 2018-2032 (MILES DE USD)
TABLA 598 MERCADO DE REFUERZOS DE COMPUESTOS PLÁSTICOS DE LOS PAÍSES BAJOS, POR TIPO, 2018-2032 (MILES DE USD)
TABLA 599 ADITIVOS EN EL MERCADO DE COMPUESTOS PLÁSTICOS DE LOS PAÍSES BAJOS, POR TIPO, 2018-2032 (MILES DE USD)
TABLA 600 MERCADO DE COMPUESTOS DE PLÁSTICO DE LOS PAÍSES BAJOS, POR PROCESO DE FABRICACIÓN, 2018-2032 (MILES DE USD)
TABLA 601 MERCADO DE COMPUESTOS DE PLÁSTICO DE LOS PAÍSES BAJOS, POR PROCESO DE FABRICACIÓN, 2018-2032 (KILOTONELADAS)
TABLA 602 MERCADO DE EXTRUSIÓN EN COMPUESTOS DE PLÁSTICO EN LOS PAÍSES BAJOS, POR TIPO, 2018-2032 (MILES DE USD)
TABLA 603 MERCADO DE EXTRUSIÓN DE PLÁSTICOS EN LOS PAÍSES BAJOS, POR SISTEMA DE PELETIZACIÓN, 2018-2032 (MILES DE USD)
TABLA 604 MERCADO DE COMPUESTOS DE PLÁSTICO BASADOS EN MOLDEO POR INYECCIÓN EN LOS PAÍSES BAJOS, POR SISTEMA DE PELETIZACIÓN, 2018-2032 (MILES DE USD)
TABLA 605 MERCADO DE COMPACTACIÓN/PRESIONADO DE PLÁSTICOS EN PAÍSES BAJOS, POR SISTEMA DE PELETIZACIÓN, 2018-2032 (MILES DE USD)
TABLA 606 MERCADO DE MEZCLA DE AMASADORAS/BANBURY EN LA FABRICACIÓN DE COMPUESTOS DE PLÁSTICO EN LOS PAÍSES BAJOS, POR SISTEMA DE PELETIZACIÓN, 2018-2032 (MILES DE USD)
TABLA 607 MERCADO DE COMPUESTOS PLÁSTICOS DE LOS PAÍSES BAJOS, POR PROPIEDADES, 2018-2032 (MILES DE USD)
TABLA 608 MERCADO DE COMPUESTOS PLÁSTICOS DE LOS PAÍSES BAJOS, POR APLICACIÓN, 2018-2032 (MILES DE USD)
TABLA 609 MERCADO DE COMPUESTOS PLÁSTICOS DE LOS PAÍSES BAJOS, POR APLICACIÓN, 2018-2032 (KILOTONELADAS)
TABLA 610 MERCADO DE COMPUESTOS DE PLÁSTICO EN LA INDUSTRIA AUTOMOTRIZ DE LOS PAÍSES BAJOS, POR CATEGORÍA, 2018-2032 (MILES DE USD)
TABLA 611 COMPONENTES DE INTERIOR DE PAÍSES BAJOS EN EL MERCADO DE COMPUESTOS DE PLÁSTICO, POR TIPO, 2018-2032 (MILES DE USD)
TABLA 612 PARTES DE CARROCERÍA EXTERIOR DE LOS PAÍSES BAJOS EN EL MERCADO DE COMPUESTOS DE PLÁSTICO, POR TIPO, 2018-2032 (MILES DE USD)
TABLA 613 APLICACIONES INTERNAS EN EL MERCADO DE COMPUESTOS PLÁSTICOS DE LOS PAÍSES BAJOS, POR TIPO, 2018-2032 (MILES DE USD)
TABLA 614 MERCADO DE ENVASES DE PLÁSTICO EN LOS PAÍSES BAJOS, POR CATEGORÍA, 2018-2032 (MILES DE USD)
TABLA 615 MERCADO DE ENVASES DE ALIMENTOS Y BEBIDAS EN COMPUESTOS DE PLÁSTICO DE LOS PAÍSES BAJOS, POR TIPO, 2018-2032 (MILES DE USD)
TABLA 616 MERCADO DE ENVASES INDUSTRIALES DE COMPUESTOS DE PLÁSTICO DE LOS PAÍSES BAJOS, POR TIPO, 2018-2032 (MILES DE USD)
TABLA 617 MERCADO DE ENVASES DE BIENES DE CONSUMO EN COMPUESTOS DE PLÁSTICO DE LOS PAÍSES BAJOS, POR TIPO, 2018-2032 (MILES DE USD)
TABLA 618 MERCADO DE CONSTRUCCIÓN Y EDIFICACIÓN DE COMPUESTOS PLÁSTICOS EN LOS PAÍSES BAJOS, POR CATEGORÍA, 2018-2032 (MILES DE USD)
TABLA 619 MERCADO DE PRODUCTOS ELÉCTRICOS Y ELECTRÓNICOS EN COMPUESTOS DE PLÁSTICO DE LOS PAÍSES BAJOS, POR CATEGORÍA, 2018-2032 (MILES DE USD)
TABLA 620 MERCADO DE DISPOSITIVOS MÉDICOS DE LOS PAÍSES BAJOS EN LA FABRICACIÓN DE COMPUESTOS DE PLÁSTICO, POR CATEGORÍA, 2018-2032 (MILES DE USD)
TABLA 621 MERCADO DE MUEBLES DE PAÍSES BAJOS EN COMPUESTOS DE PLÁSTICO, POR CATEGORÍA, 2018-2032 (MILES DE USD)
TABLA 622 MERCADO DE ENERGÍA Y ELECTRICIDAD EN COMPUESTOS DE PLÁSTICO DE LOS PAÍSES BAJOS, POR CATEGORÍA, 2018-2032 (MILES DE USD)
TABLA 623 MERCADO DE COMPUESTOS PLÁSTICOS DE LA INDUSTRIA AEROESPACIAL Y DE DEFENSA DE LOS PAÍSES BAJOS, POR CATEGORÍA, 2018-2032 (MILES DE USD)
TABLA 624 MERCADO DE COMPUESTOS PLÁSTICOS DE NORUEGA, POR TIPO DE POLÍMERO, 2018-2032 (MILES DE USD)
TABLA 625 MERCADO DE COMPUESTOS PLÁSTICOS DE NORUEGA, POR TIPO DE POLÍMERO, 2018-2032 (KILOTONELADAS)
TABLA 626 MERCADO NORUEGO DE TERMOPLÁSTICOS EN COMPUESTOS PLÁSTICOS, POR TIPO, 2018-2032 (MILES DE USD)
TABLA 627 MERCADO NORUEGO DE POLIETILENO (PE) EN COMPUESTOS PLÁSTICOS, POR TIPO, 2018-2032 (MILES DE USD)
TABLA 628 PLÁSTICOS DE INGENIERÍA EN EL MERCADO DE COMPUESTOS DE PLÁSTICO DE NORUEGA, POR TIPO, 2018-2032 (MILES DE USD)
TABLA 629 PLÁSTICOS TERMOENDURECIBLES DE NORUEGA EN EL MERCADO DE COMPUESTOS DE PLÁSTICO, POR TIPO, 2018-2032 (MILES DE USD)
TABLA 630 BIOPLÁSTICOS EN EL MERCADO DE COMPUESTOS PLÁSTICOS DE NORUEGA, POR TIPO, 2018-2032 (MILES DE USD)
TABLA 631 MERCADO DE COMPUESTOS DE PLÁSTICO DE NORUEGA, POR TIPO DE RELLENO, 2018-2032 (MILES DE USD)
TABLA 632 RELLENOS MINERALES EN EL MERCADO DE COMPUESTOS PLÁSTICOS DE NORUEGA, POR TIPO, 2018-2032 (MILES DE USD)
TABLA 633 REFUERZOS EN EL MERCADO DE COMPUESTOS PLÁSTICOS DE NORUEGA, POR TIPO, 2018-2032 (MILES DE USD)
TABLA 634 ADITIVOS EN EL MERCADO DE COMPUESTOS PLÁSTICOS DE NORUEGA, POR TIPO, 2018-2032 (MILES DE USD)
TABLA 635 MERCADO DE COMPUESTOS DE PLÁSTICO DE NORUEGA, POR PROCESO DE FABRICACIÓN, 2018-2032 (MILES DE USD)
TABLA 636 MERCADO DE COMPUESTOS DE PLÁSTICO DE NORUEGA, POR PROCESO DE FABRICACIÓN, 2018-2032 (KILOTONELADAS)
TABLA 637 MERCADO NORUEGO DE EXTRUSIÓN EN COMPUESTOS DE PLÁSTICO, POR TIPO, 2018-2032 (MILES DE USD)
TABLA 638 MERCADO DE EXTRUSIÓN DE PLÁSTICOS EN NORUEGA, POR SISTEMA DE PELETIZACIÓN, 2018-2032 (MILES DE USD)
TABLA 639 MERCADO NORUEGO DE COMPUESTOS DE PLÁSTICO BASADOS EN MOLDEO POR INYECCIÓN, POR SISTEMA DE PELETIZACIÓN, 2018-2032 (MILES DE USD)
TABLA 640 COMPACTACIÓN/PRESIONADO EN EL MERCADO DE COMPUESTOS DE PLÁSTICO EN NORUEGA, POR SISTEMA DE PELETIZACIÓN, 2018-2032 (MILES DE USD)
TABLA 641 MERCADO NORUEGO DE MEZCLAS DE AMASADORAS/BANBURY EN LA FABRICACIÓN DE COMPUESTOS DE PLÁSTICO, POR SISTEMA DE PELETIZACIÓN, 2018-2032 (MILES DE USD)
TABLA 642 MERCADO DE COMPUESTOS PLÁSTICOS DE NORUEGA, POR PROPIEDADES, 2018-2032 (MILES DE USD)
TABLA 643 MERCADO DE COMPUESTOS PLÁSTICOS DE NORUEGA, POR APLICACIÓN, 2018-2032 (MILES DE USD)
TABLA 644 MERCADO DE COMPUESTOS DE PLÁSTICO DE NORUEGA, POR APLICACIÓN, 2018-2032 (KILOTONELADAS)
TABLA 645 MERCADO DE COMPUESTOS DE PLÁSTICO EN AUTOMÓVILES DE NORUEGA, POR CATEGORÍA, 2018-2032 (MILES DE USD)
TABLA 646 COMPONENTES DE INTERIOR DE NORUEGA EN EL MERCADO DE COMPUESTOS DE PLÁSTICO, POR TIPO, 2018-2032 (MILES DE USD)
TABLA 647 PIEZAS DE CARROCERÍA EXTERIOR EN EL MERCADO DE COMPUESTOS DE PLÁSTICO DE NORUEGA, POR TIPO, 2018-2032 (MILES DE USD)
TABLA 648 APLICACIONES INTERNAS EN NORUEGA EN EL MERCADO DE COMPUESTOS PLÁSTICOS, POR TIPO, 2018-2032 (MILES DE USD)
TABLA 649 MERCADO NORUEGO DE ENVASES DE PLÁSTICO, POR CATEGORÍA, 2018-2032 (MILES DE USD)
TABLA 650 MERCADO NORUEGO DE ENVASES DE ALIMENTOS Y BEBIDAS EN COMPUESTOS DE PLÁSTICO, POR TIPO, 2018-2032 (MILES DE USD)
TABLA 651 MERCADO NORUEGO DE ENVASES INDUSTRIALES EN COMPUESTOS DE PLÁSTICO, POR TIPO, 2018-2032 (MILES DE USD)
TABLA 652 MERCADO NORUEGO DE ENVASES DE BIENES DE CONSUMO EN COMPUESTOS DE PLÁSTICO, POR TIPO, 2018-2032 (MILES DE USD)
TABLA 653 MERCADO DE CONSTRUCCIÓN Y EDIFICACIÓN DE COMPUESTOS DE PLÁSTICO EN NORUEGA, POR CATEGORÍA, 2018-2032 (MILES DE USD)
TABLA 654 MERCADO NORUEGO DE PRODUCTOS ELÉCTRICOS Y ELECTRÓNICOS EN COMPUESTOS DE PLÁSTICO, POR CATEGORÍA, 2018-2032 (MILES DE USD)
TABLA 655 MERCADO DE DISPOSITIVOS MÉDICOS DE NORUEGA EN COMPUESTOS DE PLÁSTICO, POR CATEGORÍA, 2018-2032 (MILES DE USD)
TABLA 656 MERCADO DE MUEBLES DE NORUEGA EN COMPUESTOS DE PLÁSTICO, POR CATEGORÍA, 2018-2032 (MILES DE USD)
TABLA 657 MERCADO DE ENERGÍA Y ELECTRICIDAD EN COMPUESTOS DE PLÁSTICO DE NORUEGA, POR CATEGORÍA, 2018-2032 (MILES DE USD)
TABLA 658 MERCADO DE COMPUESTOS PLÁSTICOS DE LA INDUSTRIA AEROESPACIAL Y DE DEFENSA DE NORUEGA, POR CATEGORÍA, 2018-2032 (MILES DE USD)
TABLA 659 MERCADO DE COMPUESTOS PLÁSTICOS DE FINLANDIA, POR TIPO DE POLÍMERO, 2018-2032 (MILES DE USD)
TABLA 660 MERCADO DE COMPUESTOS PLÁSTICOS DE FINLANDIA, POR TIPO DE POLÍMERO, 2018-2032 (KILOTONELADAS)
TABLA 661 MERCADO DE TERMOPLÁSTICOS EN COMPUESTOS PLÁSTICOS DE FINLANDIA, POR TIPO, 2018-2032 (MILES DE USD)
TABLA 662 MERCADO DE POLIETILENO (PE) EN COMPUESTOS PLÁSTICOS DE FINLANDIA, POR TIPO, 2018-2032 (MILES DE USD)
TABLA 663 PLÁSTICOS DE INGENIERÍA EN EL MERCADO DE COMPUESTOS PLÁSTICOS DE FINLANDIA, POR TIPO, 2018-2032 (MILES DE USD)
TABLA 664 PLÁSTICOS TERMOESTABLECIDOS DE FINLANDIA EN EL MERCADO DE COMPUESTOS DE PLÁSTICO, POR TIPO, 2018-2032 (MILES DE USD)
TABLA 665 FINLANDIA BIOPLÁSTICOS EN EL MERCADO DE COMPUESTOS PLÁSTICOS, POR TIPO, 2018-2032 (MILES DE USD)
TABLA 666 MERCADO DE COMPUESTOS DE PLÁSTICO DE FINLANDIA, POR TIPO DE RELLENO, 2018-2032 (MILES DE USD)
TABLA 667 RELLENOS MINERALES EN EL MERCADO DE COMPUESTOS PLÁSTICOS DE FINLANDIA, POR TIPO, 2018-2032 (MILES DE USD)
TABLA 668 FINLANDIA REFUERZOS EN EL MERCADO DE COMPUESTOS PLÁSTICOS, POR TIPO, 2018-2032 (MILES DE USD)
TABLA 669 ADITIVOS EN EL MERCADO DE COMPUESTOS PLÁSTICOS DE FINLANDIA, POR TIPO, 2018-2032 (MILES DE USD)
TABLA 670 MERCADO DE COMPUESTOS DE PLÁSTICO DE FINLANDIA, POR PROCESO DE FABRICACIÓN, 2018-2032 (MILES DE USD)
TABLA 671 MERCADO DE COMPUESTOS DE PLÁSTICO DE FINLANDIA, POR PROCESO DE FABRICACIÓN, 2018-2032 (KILOTONELADAS)
TABLA 672 MERCADO DE EXTRUSIÓN DE COMPUESTOS DE PLÁSTICO EN FINLANDIA, POR TIPO, 2018-2032 (MILES DE USD)
TABLA 673 MERCADO DE EXTRUSIÓN DE PLÁSTICOS EN FINLANDIA, POR SISTEMA DE PELETIZACIÓN, 2018-2032 (MILES DE USD)
TABLA 674 MERCADO DE COMPUESTOS DE PLÁSTICO BASADOS EN MOLDEO POR INYECCIÓN DE FINLANDIA, POR SISTEMA DE PELETIZACIÓN, 2018-2032 (MILES DE USD)
TABLA 675 COMPACTACIÓN/PRESIONADO EN EL MERCADO DE COMPUESTOS DE PLÁSTICO DE FINLANDIA, POR SISTEMA DE PELETIZACIÓN, 2018-2032 (MILES DE USD)
TABLA 676 FINLANDIA MERCADO DE MEZCLA DE AMASADORAS/BANBURY EN COMPUESTOS DE PLÁSTICO, POR SISTEMA DE PELETIZACIÓN, 2018-2032 (MILES DE USD)
TABLA 677 MERCADO DE COMPUESTOS PLÁSTICOS DE FINLANDIA, POR PROPIEDADES, 2018-2032 (MILES DE USD)
TABLA 678 MERCADO DE COMPUESTOS PLÁSTICOS DE FINLANDIA, POR APLICACIÓN, 2018-2032 (MILES DE USD)
TABLA 679 MERCADO DE COMPUESTOS PLÁSTICOS DE FINLANDIA, POR APLICACIÓN, 2018-2032 (KILOTONELADAS)
TABLA 680 MERCADO DE COMPUESTOS DE PLÁSTICO EN AUTOMÓVILES DE FINLANDIA, POR CATEGORÍA, 2018-2032 (MILES DE USD)
TABLA 681 COMPONENTES DE INTERIOR DE FINLANDIA EN EL MERCADO DE COMPUESTOS DE PLÁSTICO, POR TIPO, 2018-2032 (MILES DE USD)
TABLA 682 PIEZAS DE CARROCERÍA EXTERIOR EN EL MERCADO DE COMPUESTOS DE PLÁSTICO DE FINLANDIA, POR TIPO, 2018-2032 (MILES DE USD)
TABLA 683 APLICACIONES INTERNAS EN EL MERCADO DE COMPUESTOS PLÁSTICOS DE FINLANDIA, POR TIPO, 2018-2032 (MILES DE USD)
TABLA 684 MERCADO DE ENVASES DE PLÁSTICO EN FINLANDIA, POR CATEGORÍA, 2018-2032 (MILES DE USD)
TABLA 685 MERCADO DE ENVASES DE ALIMENTOS Y BEBIDAS EN COMPUESTOS DE PLÁSTICO DE FINLANDIA, POR TIPO, 2018-2032 (MILES DE USD)
TABLA 686 MERCADO DE ENVASES INDUSTRIALES DE COMPUESTOS PLÁSTICOS DE FINLANDIA, POR TIPO, 2018-2032 (MILES DE USD)
TABLA 687 MERCADO DE ENVASES DE BIENES DE CONSUMO EN COMPUESTOS DE PLÁSTICO DE FINLANDIA, POR TIPO, 2018-2032 (MILES DE USD)
TABLA 688 MERCADO DE CONSTRUCCIÓN Y EDIFICACIÓN DE COMPUESTOS DE PLÁSTICO EN FINLANDIA, POR CATEGORÍA, 2018-2032 (MILES DE USD)
TABLA 689 MERCADO DE PRODUCTOS ELÉCTRICOS Y ELECTRÓNICOS EN COMPUESTOS DE PLÁSTICO DE FINLANDIA, POR CATEGORÍA, 2018-2032 (MILES DE USD)
TABLA 690 MERCADO DE DISPOSITIVOS MÉDICOS DE COMPUESTOS PLÁSTICOS DE FINLANDIA, POR CATEGORÍA, 2018-2032 (MILES DE USD)
TABLA 691 MERCADO DE MUEBLES DE FINLANDIA EN COMPUESTOS DE PLÁSTICO, POR CATEGORÍA, 2018-2032 (MILES DE USD)
TABLA 692 FINLANDIA ENERGÍA Y ELECTRICIDAD EN EL MERCADO DE COMPUESTOS DE PLÁSTICO, POR CATEGORÍA, 2018-2032 (MILES DE USD)
TABLA 693 FINLANDIA AEROESPACIAL Y DEFENSA EN EL MERCADO DE COMPUESTOS PLÁSTICOS, POR CATEGORÍA, 2018-2032 (MILES DE USD)
TABLA 694 MERCADO DE COMPUESTOS PLÁSTICOS DE DINAMARCA, POR TIPO DE POLÍMERO, 2018-2032 (MILES DE USD)
TABLA 695 MERCADO DE COMPUESTOS PLÁSTICOS DE DINAMARCA, POR TIPO DE POLÍMERO, 2018-2032 (KILOTONELADAS)
TABLA 696 DINAMARCA MERCADO DE TERMOPLÁSTICOS EN COMPUESTOS PLÁSTICOS, POR TIPO, 2018-2032 (MILES DE USD)
TABLA 697 MERCADO DE POLIETILENO (PE) EN COMPUESTOS PLÁSTICOS DE DINAMARCA, POR TIPO, 2018-2032 (MILES DE USD)
TABLA 698 PLÁSTICOS DE INGENIERÍA EN EL MERCADO DE COMPUESTOS DE PLÁSTICO DE DINAMARCA, POR TIPO, 2018-2032 (MILES DE USD)
TABLA 699 PLÁSTICOS TERMOENDURECIBLES DE DINAMARCA EN EL MERCADO DE COMPUESTOS DE PLÁSTICO, POR TIPO, 2018-2032 (MILES DE USD)
TABLA 700 BIOPLÁSTICOS EN EL MERCADO DE COMPUESTOS PLÁSTICOS DE DINAMARCA, POR TIPO, 2018-2032 (MILES DE USD)
TABLA 701 MERCADO DE COMPUESTOS PLÁSTICOS DE DINAMARCA, POR TIPO DE RELLENO, 2018-2032 (MILES DE USD)
TABLA 702 DINAMARCA: RELLENOS MINERALES EN EL MERCADO DE COMPUESTOS PLÁSTICOS, POR TIPO, 2018-2032 (MILES DE USD)
TABLA 703 REFUERZOS EN EL MERCADO DE COMPUESTOS PLÁSTICOS DE DINAMARCA, POR TIPO, 2018-2032 (MILES DE USD)
TABLA 704 ADITIVOS DE DINAMARCA EN EL MERCADO DE COMPUESTOS PLÁSTICOS, POR TIPO, 2018-2032 (MILES DE USD)
TABLA 705 MERCADO DE COMPUESTOS DE PLÁSTICO DE DINAMARCA, POR PROCESO DE FABRICACIÓN, 2018-2032 (MILES DE USD)
TABLA 706 MERCADO DE COMPUESTOS DE PLÁSTICO DE DINAMARCA, POR PROCESO DE FABRICACIÓN, 2018-2032 (KILOTONELADAS)
TABLA 707 MERCADO DE EXTRUSIÓN DE COMPUESTOS PLÁSTICOS DE DINAMARCA, POR TIPO, 2018-2032 (MILES DE USD)
TABLA 708 MERCADO DE EXTRUSIÓN DE PLÁSTICOS EN DINAMARCA, POR SISTEMA DE PELETIZACIÓN, 2018-2032 (MILES DE USD)
TABLA 709 DINAMARCA: MERCADO DE COMPUESTOS DE PLÁSTICO BASADOS EN MOLDEO POR INYECCIÓN, POR SISTEMA DE PELETIZACIÓN, 2018-2032 (MILES DE USD)
TABLA 710 COMPACTACIÓN/PRESIONADO EN EL MERCADO DE COMPUESTOS DE PLÁSTICO DE DINAMARCA, POR SISTEMA DE PELETIZACIÓN, 2018-2032 (MILES DE USD)
TABLA 711 MERCADO DE DINAMARCA DE AMASADORAS/MEZCLAS BANBURY EN LA FABRICACIÓN DE COMPUESTOS DE PLÁSTICO, POR SISTEMA DE PELETIZACIÓN, 2018-2032 (MILES DE USD)
TABLA 712 MERCADO DE COMPUESTOS PLÁSTICOS DE DINAMARCA, POR PROPIEDADES, 2018-2032 (MILES DE USD)
TABLA 713 MERCADO DE COMPUESTOS PLÁSTICOS DE DINAMARCA, POR APLICACIÓN, 2018-2032 (MILES DE USD)
TABLA 714 MERCADO DE COMPUESTOS PLÁSTICOS DE DINAMARCA, POR APLICACIÓN, 2018-2032 (KILOTONELADAS)
TABLA 715 MERCADO DE COMPUESTOS DE PLÁSTICO EN AUTOMOCIÓN DE DINAMARCA, POR CATEGORÍA, 2018-2032 (MILES DE USD)
TABLA 716 COMPONENTES DE INTERIOR DE DINAMARCA EN EL MERCADO DE COMPUESTOS DE PLÁSTICO, POR TIPO, 2018-2032 (MILES DE USD)
TABLA 717 PIEZAS DE CARROCERÍA EXTERIOR DE DINAMARCA EN EL MERCADO DE COMPUESTOS DE PLÁSTICO, POR TIPO, 2018-2032 (MILES DE USD)
TABLA 718 APLICACIONES INTERNAS EN DINAMARCA EN EL MERCADO DE COMPUESTOS PLÁSTICOS, POR TIPO, 2018-2032 (MILES DE USD)
TABLA 719 DINAMARCA MERCADO DE ENVASES DE PLÁSTICO, POR CATEGORÍA, 2018-2032 (MILES DE USD)
TABLA 720 DINAMARCA: ENVASES DE ALIMENTOS Y BEBIDAS EN EL MERCADO DE COMPUESTOS DE PLÁSTICO, POR TIPO, 2018-2032 (MILES DE USD)
TABLA 721 DINAMARCA MERCADO DE ENVASES INDUSTRIALES EN COMPUESTOS DE PLÁSTICO, POR TIPO, 2018-2032 (MILES DE USD)
TABLA 722 DINAMARCA MERCADO DE ENVASES DE BIENES DE CONSUMO EN COMPUESTOS DE PLÁSTICO, POR TIPO, 2018-2032 (MILES DE USD)
TABLA 723 MERCADO DE CONSTRUCCIÓN Y EDIFICACIÓN DE COMPUESTOS DE PLÁSTICO EN DINAMARCA, POR CATEGORÍA, 2018-2032 (MILES DE USD)
TABLA 724 MERCADO DE DINAMARCA DE PRODUCTOS ELÉCTRICOS Y ELECTRÓNICOS EN COMPUESTOS DE PLÁSTICO, POR CATEGORÍA, 2018-2032 (MILES DE USD)
TABLA 725 DISPOSITIVOS MÉDICOS EN EL MERCADO DE COMPUESTOS DE PLÁSTICO DE DINAMARCA, POR CATEGORÍA, 2018-2032 (MILES DE USD)
TABLA 726 MERCADO DE MUEBLES DE DINAMARCA EN COMPUESTOS DE PLÁSTICO, POR CATEGORÍA, 2018-2032 (MILES DE USD)
TABLA 727 DINAMARCA ENERGÍA Y ELECTRICIDAD EN EL MERCADO DE COMPUESTOS DE PLÁSTICO, POR CATEGORÍA, 2018-2032 (MILES DE USD)
TABLA 728 DINAMARCA, MERCADO DE COMPUESTOS PLÁSTICOS EN LA INDUSTRIA AEROESPACIAL Y DE DEFENSA, POR CATEGORÍA, 2018-2032 (MILES DE USD)
TABLA 729 MERCADO DE COMPUESTOS PLÁSTICOS DE SUECIA, POR TIPO DE POLÍMERO, 2018-2032 (MILES DE USD)
TABLA 730 MERCADO DE COMPUESTOS PLÁSTICOS DE SUECIA, POR TIPO DE POLÍMERO, 2018-2032 (KILOTONELADAS)
TABLA 731 SUECIA: MERCADO DE TERMOPLÁSTICOS EN COMPUESTOS PLÁSTICOS, POR TIPO, 2018-2032 (MILES DE USD)
TABLA 732 SUECIA: POLIETILENO (PE) EN EL MERCADO DE COMPUESTOS PLÁSTICOS, POR TIPO, 2018-2032 (MILES DE USD)
TABLA 733 PLÁSTICOS DE INGENIERÍA EN EL MERCADO DE COMPUESTOS DE PLÁSTICO DE SUECIA, POR TIPO, 2018-2032 (MILES DE USD)
TABLA 734 SUECIA PLÁSTICOS TERMOENDURECIBLES EN EL MERCADO DE COMPUESTOS DE PLÁSTICO, POR TIPO, 2018-2032 (MILES DE USD)
TABLA 735 BIOPLÁSTICOS EN EL MERCADO DE COMPUESTOS PLÁSTICOS DE SUECIA, POR TIPO, 2018-2032 (MILES DE USD)
TABLA 736 MERCADO DE COMPUESTOS DE PLÁSTICO DE SUECIA, POR TIPO DE RELLENO, 2018-2032 (MILES DE USD)
TABLA 737 SUECIA: RELLENOS MINERALES EN EL MERCADO DE COMPUESTOS PLÁSTICOS, POR TIPO, 2018-2032 (MILES DE USD)
TABLA 738 SUECIA REFUERZOS EN EL MERCADO DE COMPUESTOS PLÁSTICOS, POR TIPO, 2018-2032 (MILES DE USD)
TABLA 739 ADITIVOS EN EL MERCADO DE COMPUESTOS PLÁSTICOS DE SUECIA, POR TIPO, 2018-2032 (MILES DE USD)
TABLA 740 MERCADO DE COMPUESTOS DE PLÁSTICO DE SUECIA, POR PROCESO DE FABRICACIÓN, 2018-2032 (MILES DE USD)
TABLA 741 MERCADO DE COMPUESTOS DE PLÁSTICO DE SUECIA, POR PROCESO DE FABRICACIÓN, 2018-2032 (KILOTONELADAS)
TABLA 742 SUECIA MERCADO DE EXTRUSIÓN EN COMPUESTOS DE PLÁSTICO, POR TIPO, 2018-2032 (MILES DE USD)
TABLA 743 SUECIA EXTRUSIÓN EN EL MERCADO DE COMPUESTOS DE PLÁSTICO, POR SISTEMA DE PELETIZACIÓN, 2018-2032 (MILES DE USD)
TABLA 744 SUECIA - MERCADO DE COMPUESTOS DE PLÁSTICO BASADOS EN MOLDEO POR INYECCIÓN, POR SISTEMA DE PELETIZACIÓN, 2018-2032 (MILES DE USD)
TABLA 745 COMPACTACIÓN/PRESIONADO EN EL MERCADO DE COMPUESTOS DE PLÁSTICO EN SUECIA, POR SISTEMA DE PELETIZACIÓN, 2018-2032 (MILES DE USD)
TABLA 746 SUECIA AMASADORA/MEZCLA BANBURY EN EL MERCADO DE COMPUESTOS DE PLÁSTICO, POR SISTEMA DE PELETIZACIÓN, 2018-2032 (MILES DE USD)
TABLA 747 MERCADO DE COMPUESTOS PLÁSTICOS DE SUECIA, POR PROPIEDADES, 2018-2032 (MILES DE USD)
TABLA 748 MERCADO DE COMPUESTOS PLÁSTICOS DE SUECIA, POR APLICACIÓN, 2018-2032 (MILES DE USD)
TABLA 749 MERCADO DE COMPUESTOS PLÁSTICOS DE SUECIA, POR APLICACIÓN, 2018-2032 (KILOTONELADAS)
TABLA 750 SUECIA: MERCADO DE COMPUESTOS DE PLÁSTICO EN AUTOMOCIÓN, POR CATEGORÍA, 2018-2032 (MILES DE USD)
TABLA 751 COMPONENTES DE INTERIOR EN EL MERCADO DE COMPUESTOS PLÁSTICOS DE SUECIA, POR TIPO, 2018-2032 (MILES DE USD)
TABLA 752 SUECIA: PIEZAS DE CARROCERÍA EXTERIOR EN EL MERCADO DE COMPUESTOS DE PLÁSTICO, POR TIPO, 2018-2032 (MILES DE USD)
TABLA 753 APLICACIONES INTERNAS EN EL MERCADO DE COMPUESTOS PLÁSTICOS DE SUECIA, POR TIPO, 2018-2032 (MILES DE USD)
TABLA 754 SUECIA MERCADO DE ENVASES DE PLÁSTICO, POR CATEGORÍA, 2018-2032 (MILES DE USD)
TABLA 755 SUECIA: ENVASES DE ALIMENTOS Y BEBIDAS EN EL MERCADO DE COMPUESTOS DE PLÁSTICO, POR TIPO, 2018-2032 (MILES DE USD)
TABLA 756 SUECIA MERCADO DE ENVASES INDUSTRIALES EN COMPUESTOS DE PLÁSTICO, POR TIPO, 2018-2032 (MILES DE USD)
TABLA 757 SUECIA - ENVASES DE BIENES DE CONSUMO EN EL MERCADO DE COMPUESTOS DE PLÁSTICO, POR TIPO, 2018-2032 (MILES DE USD)
TABLA 758 SUECIA: MERCADO DE CONSTRUCCIÓN Y EDIFICACIÓN DE COMPUESTOS DE PLÁSTICO, POR CATEGORÍA, 2018-2032 (MILES DE USD)
TABLA 759 SUECIA MERCADO DE PRODUCTOS ELÉCTRICOS Y ELECTRÓNICOS EN COMPUESTOS DE PLÁSTICO, POR CATEGORÍA, 2018-2032 (MILES DE USD)
TABLA 760 SUECIA: DISPOSITIVOS MÉDICOS EN EL MERCADO DE COMPUESTOS DE PLÁSTICO, POR CATEGORÍA, 2018-2032 (MILES DE USD)
TABLA 761 MERCADO DE MUEBLES DE SUECIA EN COMPUESTOS DE PLÁSTICO, POR CATEGORÍA, 2018-2032 (MILES DE USD)
TABLA 762 SUECIA ENERGÍA Y ELECTRICIDAD EN EL MERCADO DE COMPUESTOS DE PLÁSTICO, POR CATEGORÍA, 2018-2032 (MILES DE USD)
TABLA 763 SUECIA: MERCADO DE COMPUESTOS PLÁSTICOS EN LA INDUSTRIA AEROESPACIAL Y DE DEFENSA, POR CATEGORÍA, 2018-2032 (MILES DE USD)
TABLA 764 RESTO DE EUROPA MERCADO DE COMPUESTOS PLÁSTICOS, POR TIPO DE POLÍMERO, 2018-2032 (MILES DE USD)
TABLA 765 RESTO DE EUROPA MERCADO DE COMPUESTOS PLÁSTICOS, POR TIPO DE POLÍMERO, 2018-2032 (KILOTONELADAS)
TABLA 766 MERCADO DE COMPUESTOS PLÁSTICOS DE ASIA-PACÍFICO, POR PAÍS, 2018-2032 (MILES DE USD)
TABLA 767 MERCADO DE COMPUESTOS PLÁSTICOS DE ASIA-PACÍFICO, POR PAÍS, 2018-2032 (KILOTONELADAS)
TABLA 768 MERCADO DE COMPUESTOS PLÁSTICOS DE ASIA-PACÍFICO, POR TIPO DE POLÍMERO, 2018-2032 (MILES DE USD)
TABLA 769 MERCADO DE COMPUESTOS PLÁSTICOS DE ASIA-PACÍFICO, POR TIPO DE POLÍMERO, 2018-2032 (KILOTONELADAS)
TABLA 770 MERCADO DE TERMOPLÁSTICOS EN COMPUESTOS PLÁSTICOS DE ASIA-PACÍFICO, POR TIPO, 2018-2032 (MILES DE USD)
TABLA 771 MERCADO DE POLIETILENO (PE) EN COMPUESTOS PLÁSTICOS DE ASIA-PACÍFICO, POR TIPO, 2018-2032 (MILES DE USD)
TABLA 772 PLÁSTICOS DE INGENIERÍA EN EL MERCADO DE COMPUESTOS PLÁSTICOS DE ASIA-PACÍFICO, POR TIPO, 2018-2032 (MILES DE USD)
TABLA 773 PLÁSTICOS TERMOENDURECIBLES DE ASIA-PACÍFICO EN EL MERCADO DE COMPUESTOS DE PLÁSTICO, POR TIPO, 2018-2032 (MILES DE USD)
TABLA 774 MERCADO DE BIOPLÁSTICOS EN COMPUESTOS PLÁSTICOS DE ASIA-PACÍFICO, POR TIPO, 2018-2032 (MILES DE USD)
TABLA 775 MERCADO DE COMPUESTOS PLÁSTICOS DE ASIA-PACÍFICO, POR TIPO DE RELLENO, 2018-2032 (MILES DE USD)
TABLA 776 RELLENOS MINERALES EN EL MERCADO DE COMPUESTOS PLÁSTICOS DE ASIA-PACÍFICO, POR TIPO, 2018-2032 (MILES DE USD)
TABLA 777 MERCADO DE REFUERZOS DE COMPUESTOS PLÁSTICOS DE ASIA-PACÍFICO, POR TIPO, 2018-2032 (MILES DE USD)
TABLA 778 ADITIVOS EN EL MERCADO DE COMPUESTOS PLÁSTICOS DE ASIA-PACÍFICO, POR TIPO, 2018-2032 (MILES DE USD)
TABLA 779 MERCADO DE COMPUESTOS PLÁSTICOS DE ASIA-PACÍFICO, POR PROCESO DE FABRICACIÓN, 2018-2032 (MILES DE USD)
TABLA 780 MERCADO DE COMPUESTOS PLÁSTICOS DE ASIA-PACÍFICO, POR PROCESO DE FABRICACIÓN, 2018-2032 (KILOTONELADAS)
TABLA 781 MERCADO DE EXTRUSIÓN DE COMPUESTOS PLÁSTICOS DE ASIA-PACÍFICO, POR TIPO, 2018-2032 (MILES DE USD)
TABLA 782 MERCADO DE EXTRUSIÓN DE PLÁSTICOS EN ASIA-PACÍFICO, POR SISTEMA DE PELETIZACIÓN, 2018-2032 (MILES DE USD)
TABLA 783 MERCADO DE COMPUESTOS DE PLÁSTICO BASADOS EN MOLDEO POR INYECCIÓN EN ASIA-PACÍFICO, POR SISTEMA DE PELETIZACIÓN, 2018-2032 (MILES DE USD)
TABLA 784 COMPACTACIÓN/PRESIONADO EN EL MERCADO DE COMPUESTOS DE PLÁSTICO DE ASIA-PACÍFICO, POR SISTEMA DE PELETIZACIÓN, 2018-2032 (MILES DE USD)
TABLA 785 MERCADO DE AMASADORAS/MEZCLAS BANBURY DE ASIA-PACÍFICO EN LA FABRICACIÓN DE COMPUESTOS DE PLÁSTICO, POR SISTEMA DE PELETIZACIÓN, 2018-2032 (MILES DE USD)
TABLA 786 MERCADO DE COMPUESTOS PLÁSTICOS DE ASIA-PACÍFICO, POR PROPIEDADES, 2018-2032 (MILES DE USD)
TABLA 787 MERCADO DE COMPUESTOS PLÁSTICOS DE ASIA-PACÍFICO, POR APLICACIÓN, 2018-2032 (MILES DE USD)
TABLA 788 MERCADO DE COMPUESTOS PLÁSTICOS DE ASIA-PACÍFICO, POR APLICACIÓN, 2018-2032 (KILOTONELADAS)
TABLA 789 MERCADO DE COMPUESTOS DE PLÁSTICO EN AUTOMOCIÓN DE ASIA-PACÍFICO, POR CATEGORÍA, 2018-2032 (MILES DE USD)
TABLA 790 COMPONENTES INTERIORES DE ASIA-PACÍFICO EN EL MERCADO DE COMPUESTOS PLÁSTICOS, POR TIPO, 2018-2032 (MILES DE USD)
TABLA 791 PIEZAS DE CARROCERÍA EXTERIOR DE ASIA-PACÍFICO EN EL MERCADO DE COMPUESTOS DE PLÁSTICO, POR TIPO, 2018-2032 (MILES DE USD)
TABLA 792 APLICACIONES INTERNAS EN EL MERCADO DE COMPUESTOS PLÁSTICOS DE ASIA-PACÍFICO, POR TIPO, 2018-2032 (MILES DE USD)
TABLA 793 MERCADO DE ENVASES DE PLÁSTICO PARA COMPUESTOS DE ASIA-PACÍFICO, POR CATEGORÍA, 2018-2032 (MILES DE USD)
TABLA 794 MERCADO DE ENVASES DE ALIMENTOS Y BEBIDAS EN COMPUESTOS DE PLÁSTICO DE ASIA-PACÍFICO, POR TIPO, 2018-2032 (MILES DE USD)
TABLA 795 MERCADO DE ENVASES INDUSTRIALES DE ASIA-PACÍFICO EN COMPUESTOS DE PLÁSTICO, POR TIPO, 2018-2032 (MILES DE USD)
TABLA 796 MERCADO DE ENVASES DE BIENES DE CONSUMO EN COMPUESTOS DE PLÁSTICO DE ASIA-PACÍFICO, POR TIPO, 2018-2032 (MILES DE USD)
TABLA 797 MERCADO DE CONSTRUCCIÓN Y EDIFICACIÓN DE COMPUESTOS PLÁSTICOS EN ASIA-PACÍFICO, POR CATEGORÍA, 2018-2032 (MILES DE USD)
TABLA 798 MERCADO DE PRODUCTOS ELÉCTRICOS Y ELECTRÓNICOS EN COMPUESTOS DE PLÁSTICO DE ASIA-PACÍFICO, POR CATEGORÍA, 2018-2032 (MILES DE USD)
TABLA 799 DISPOSITIVOS MÉDICOS EN EL MERCADO DE COMPUESTOS PLÁSTICOS DE ASIA-PACÍFICO, POR CATEGORÍA, 2018-2032 (MILES DE USD)
TABLA 800 MERCADO DE MUEBLES DE ASIA-PACÍFICO EN COMPUESTOS DE PLÁSTICO, POR CATEGORÍA, 2018-2032 (MILES DE USD)
TABLA 801 MERCADO DE ENERGÍA Y ELECTRICIDAD EN COMPUESTOS DE PLÁSTICO DE ASIA-PACÍFICO, POR CATEGORÍA, 2018-2032 (MILES DE USD)
TABLA 802 MERCADO DE COMPUESTOS PLÁSTICOS DE LA INDUSTRIA AEROESPACIAL Y DE DEFENSA DE ASIA-PACÍFICO, POR CATEGORÍA, 2018-2032 (MILES DE USD)
TABLA 803 MERCADO DE COMPUESTOS PLÁSTICOS DE CHINA, POR TIPO DE POLÍMERO, 2018-2032 (MILES DE USD)
TABLA 804 MERCADO DE COMPUESTOS PLÁSTICOS DE CHINA, POR TIPO DE POLÍMERO, 2018-2032 (KILOTONELADAS)
TABLA 805 MERCADO DE TERMOPLÁSTICOS EN COMPUESTOS PLÁSTICOS DE CHINA, POR TIPO, 2018-2032 (MILES DE USD)
TABLA 806 POLIETILENO (PE) EN EL MERCADO DE COMPUESTOS PLÁSTICOS DE CHINA, POR TIPO, 2018-2032 (MILES DE USD)
TABLA 807 PLÁSTICOS DE INGENIERÍA DE CHINA EN EL MERCADO DE COMPUESTOS PLÁSTICOS, POR TIPO, 2018-2032 (MILES DE USD)
TABLA 808 PLÁSTICOS TERMOESTABLECIDOS DE CHINA EN EL MERCADO DE COMPUESTOS DE PLÁSTICO, POR TIPO, 2018-2032 (MILES DE USD)
TABLA 809 BIOPLÁSTICOS EN EL MERCADO DE COMPUESTOS PLÁSTICOS DE CHINA, POR TIPO, 2018-2032 (MILES DE USD)
TABLA 810 MERCADO DE COMPUESTOS PLÁSTICOS DE CHINA, POR TIPO DE RELLENO, 2018-2032 (MILES DE USD)
TABLA 811 RELLENOS MINERALES DE CHINA EN EL MERCADO DE COMPUESTOS PLÁSTICOS, POR TIPO, 2018-2032 (MILES DE USD)
TABLA 812 REFUERZOS DE CHINA EN EL MERCADO DE COMPUESTOS PLÁSTICOS, POR TIPO, 2018-2032 (MILES DE USD)
TABLA 813 ADITIVOS DE CHINA EN EL MERCADO DE COMPUESTOS PLÁSTICOS, POR TIPO, 2018-2032 (MILES DE USD)
TABLA 814 MERCADO DE COMPUESTOS PLÁSTICOS DE CHINA, POR PROCESO DE FABRICACIÓN, 2018-2032 (MILES DE USD)
TABLA 815 MERCADO DE COMPUESTOS PLÁSTICOS DE CHINA, POR PROCESO DE FABRICACIÓN, 2018-2032 (KILOTONELADAS)
TABLA 816 MERCADO DE EXTRUSIÓN DE COMPUESTOS DE PLÁSTICO EN CHINA, POR TIPO, 2018-2032 (MILES DE USD)
TABLA 817 MERCADO DE EXTRUSIÓN DE PLÁSTICOS EN CHINA, POR SISTEMA DE PELETIZACIÓN, 2018-2032 (MILES DE USD)
TABLA 818 MERCADO DE COMPUESTOS DE PLÁSTICO BASADOS EN MOLDEO POR INYECCIÓN EN CHINA, POR SISTEMA DE PELETIZACIÓN, 2018-2032 (MILES DE USD)
TABLA 819 COMPACTACIÓN/PRESIONADO EN EL MERCADO DE COMPUESTOS DE PLÁSTICO EN CHINA, POR SISTEMA DE PELETIZACIÓN, 2018-2032 (MILES DE USD)
TABLA 820 AMASADAS CHINA/MEZCLA BANBURY EN EL MERCADO DE COMPUESTOS DE PLÁSTICO, POR SISTEMA DE PELETIZACIÓN, 2018-2032 (MILES DE USD)
TABLA 821 MERCADO DE COMPUESTOS PLÁSTICOS DE CHINA, POR PROPIEDADES, 2018-2032 (MILES DE USD)
TABLA 822 MERCADO DE COMPUESTOS PLÁSTICOS DE CHINA, POR APLICACIÓN, 2018-2032 (MILES DE USD)
TABLA 823 MERCADO DE COMPUESTOS PLÁSTICOS DE CHINA, POR APLICACIÓN, 2018-2032 (KILOTONELADAS)
TABLA 824 MERCADO DE COMPUESTOS DE PLÁSTICO EN LA INDUSTRIA AUTOMOTRIZ DE CHINA, POR CATEGORÍA, 2018-2032 (MILES DE USD)
TABLA 825 COMPONENTES DE CHINA INTERIOR EN EL MERCADO DE COMPUESTOS PLÁSTICOS, POR TIPO, 2018-2032 (MILES DE USD)
TABLA 826 PIEZAS DE CARROCERÍA EXTERIOR DE CHINA EN EL MERCADO DE COMPUESTOS DE PLÁSTICO, POR TIPO, 2018-2032 (MILES DE USD)
TABLA 827 APLICACIONES INTERNAS EN CHINA EN EL MERCADO DE COMPUESTOS PLÁSTICOS, POR TIPO, 2018-2032 (MILES DE USD)
TABLA 828 MERCADO DE ENVASES DE PLÁSTICO EN CHINA, POR CATEGORÍA, 2018-2032 (MILES DE USD)
TABLA 829 ENVASES DE ALIMENTOS Y BEBIDAS EN EL MERCADO DE COMPUESTOS DE PLÁSTICO DE CHINA, POR TIPO, 2018-2032 (MILES DE USD)
TABLA 830 ENVASES INDUSTRIALES DE CHINA EN EL MERCADO DE COMPUESTOS DE PLÁSTICO, POR TIPO, 2018-2032 (MILES DE USD)
TABLA 831 ENVASES DE BIENES DE CONSUMO EN EL MERCADO DE COMPUESTOS PLÁSTICOS DE CHINA, POR TIPO, 2018-2032 (MILES DE USD)
TABLA 832 MERCADO DE CONSTRUCCIÓN Y EDIFICACIÓN DE COMPUESTOS PLÁSTICOS EN CHINA, POR CATEGORÍA, 2018-2032 (MILES DE USD)
TABLA 833 MERCADO DE PRODUCTOS ELÉCTRICOS Y ELECTRÓNICOS EN COMPUESTOS DE PLÁSTICO DE CHINA, POR CATEGORÍA, 2018-2032 (MILES DE USD)
TABLA 834 DISPOSITIVOS MÉDICOS EN EL MERCADO DE COMPUESTOS PLÁSTICOS DE CHINA, POR CATEGORÍA, 2018-2032 (MILES DE USD)
TABLA 835 MUEBLES DE CHINA EN EL MERCADO DE COMPUESTOS DE PLÁSTICO, POR CATEGORÍA, 2018-2032 (MILES DE USD)
TABLA 836 MERCADO DE ENERGÍA Y ELECTRICIDAD EN COMPUESTOS DE PLÁSTICO DE CHINA, POR CATEGORÍA, 2018-2032 (MILES DE USD)
TABLA 837 MERCADO DE COMPUESTOS PLÁSTICOS DE LA INDUSTRIA AEROESPACIAL Y DE DEFENSA DE CHINA, POR CATEGORÍA, 2018-2032 (MILES DE USD)
TABLA 838 MERCADO DE COMPUESTOS PLÁSTICOS DE LA INDIA, POR TIPO DE POLÍMERO, 2018-2032 (MILES DE USD)
TABLA 839 MERCADO DE COMPUESTOS PLÁSTICOS DE LA INDIA, POR TIPO DE POLÍMERO, 2018-2032 (KILOTONELADAS)
TABLA 840 MERCADO DE TERMOPLÁSTICOS EN COMPUESTOS PLÁSTICOS DE LA INDIA, POR TIPO, 2018-2032 (MILES DE USD)
TABLA 841 MERCADO DE POLIETILENO (PE) EN COMPUESTOS PLÁSTICOS DE LA INDIA, POR TIPO, 2018-2032 (MILES DE USD)
TABLA 842 PLÁSTICOS DE INGENIERÍA EN EL MERCADO DE COMPUESTOS PLÁSTICOS DE INDIA, POR TIPO, 2018-2032 (MILES DE USD)
TABLA 843 PLÁSTICOS TERMOENDURECIBLES EN EL MERCADO DE COMPUESTOS DE PLÁSTICO DE LA INDIA, POR TIPO, 2018-2032 (MILES DE USD)
TABLA 844 BIOPLÁSTICOS EN EL MERCADO DE COMPUESTOS PLÁSTICOS DE LA INDIA, POR TIPO, 2018-2032 (MILES DE USD)
TABLA 845 MERCADO DE COMPUESTOS PLÁSTICOS DE LA INDIA, POR TIPO DE RELLENO, 2018-2032 (MILES DE USD)
TABLA 846 RELLENOS MINERALES EN EL MERCADO DE COMPUESTOS PLÁSTICOS DE LA INDIA, POR TIPO, 2018-2032 (MILES DE USD)
TABLA 847 REFUERZOS EN EL MERCADO DE COMPUESTOS PLÁSTICOS DE INDIA, POR TIPO, 2018-2032 (MILES DE USD)
TABLA 848 ADITIVOS EN EL MERCADO DE COMPUESTOS PLÁSTICOS DE LA INDIA, POR TIPO, 2018-2032 (MILES DE USD)
TABLA 849 MERCADO DE COMPUESTOS DE PLÁSTICO EN LA INDIA, POR PROCESO DE FABRICACIÓN, 2018-2032 (MILES DE USD)
TABLA 850 MERCADO DE COMPUESTOS DE PLÁSTICO EN LA INDIA, POR PROCESO DE FABRICACIÓN, 2018-2032 (KILOTONELADAS)
TABLA 851 MERCADO DE EXTRUSIÓN DE COMPUESTOS PLÁSTICOS EN INDIA, POR TIPO, 2018-2032 (MILES DE USD)
TABLA 852 MERCADO DE EXTRUSIÓN DE PLÁSTICOS EN INDIA, POR SISTEMA DE PELETIZACIÓN, 2018-2032 (MILES DE USD)
TABLA 853 INDIA, MERCADO DE COMPUESTOS DE PLÁSTICO BASADOS EN MOLDEO POR INYECCIÓN, SEGÚN SISTEMA DE PELETIZACIÓN, 2018-2032 (MILES DE USD)
TABLA 854 COMPACTACIÓN/PRESIONADO EN EL MERCADO DE COMPUESTOS DE PLÁSTICO EN INDIA, POR SISTEMA DE PELETIZACIÓN, 2018-2032 (MILES DE USD)
TABLA 855 AMASADORA/MEZCLA BANBURY EN EL MERCADO DE COMPUESTOS DE PLÁSTICO EN INDIA, POR SISTEMA DE PELETIZACIÓN, 2018-2032 (MILES DE USD)
TABLA 856 MERCADO DE COMPUESTOS PLÁSTICOS DE LA INDIA, POR PROPIEDADES, 2018-2032 (MILES DE USD)
TABLA 857 MERCADO DE COMPUESTOS PLÁSTICOS DE LA INDIA, POR APLICACIÓN, 2018-2032 (MILES DE USD)
TABLA 858 MERCADO DE COMPUESTOS PLÁSTICOS DE LA INDIA, POR APLICACIÓN, 2018-2032 (KILOTONELADAS)
TABLA 859 MERCADO DE COMPUESTOS DE PLÁSTICO EN AUTOMÓVILES DE INDIA, POR CATEGORÍA, 2018-2032 (MILES DE USD)
TABLA 860 COMPONENTES INTERIORES EN EL MERCADO DE COMPUESTOS PLÁSTICOS DE LA INDIA, POR TIPO, 2018-2032 (MILES DE USD)
TABLA 861 INDIA: PIEZAS DE CARROCERÍA EXTERIOR EN EL MERCADO DE COMPUESTOS PLÁSTICOS, POR TIPO, 2018-2032 (MILES DE USD)
TABLA 862 APLICACIONES INTERNAS EN EL MERCADO DE COMPUESTOS PLÁSTICOS DE LA INDIA, POR TIPO, 2018-2032 (MILES DE USD)
TABLA 863 MERCADO DE ENVASES DE PLÁSTICO EN INDIA, POR CATEGORÍA, 2018-2032 (MILES DE USD)
TABLA 864 MERCADO DE ENVASES DE ALIMENTOS Y BEBIDAS EN LA INDIA, POR TIPO, 2018-2032 (MILES DE USD)
TABLA 865 MERCADO DE ENVASES INDUSTRIALES DE COMPUESTOS PLÁSTICOS EN INDIA, POR TIPO, 2018-2032 (MILES DE USD)
TABLA 866 ENVASES DE BIENES DE CONSUMO EN EL MERCADO DE COMPUESTOS PLÁSTICOS DE LA INDIA, POR TIPO, 2018-2032 (MILES DE USD)
TABLA 867 INDIA: MERCADO DE CONSTRUCCIÓN Y EDIFICACIÓN DE COMPUESTOS DE PLÁSTICO, POR CATEGORÍA, 2018-2032 (MILES DE USD)
TABLA 868 MERCADO DE PRODUCTOS ELÉCTRICOS Y ELECTRÓNICOS EN COMPUESTOS DE PLÁSTICO EN INDIA, POR CATEGORÍA, 2018-2032 (MILES DE USD)
TABLA 869 DISPOSITIVOS MÉDICOS EN EL MERCADO DE COMPUESTOS DE PLÁSTICO DE LA INDIA, POR CATEGORÍA, 2018-2032 (MILES DE USD)
TABLA 870 MERCADO DE MUEBLES DE INDIA EN COMPUESTOS DE PLÁSTICO, POR CATEGORÍA, 2018-2032 (MILES DE USD)
TABLA 871 MERCADO DE ENERGÍA Y ELECTRICIDAD EN LA INDIA, POR CATEGORÍA, 2018-2032 (MILES DE USD)
TABLA 872 INDIA, MERCADO DE COMPUESTOS PLÁSTICOS EN LA INDUSTRIA AEROESPACIAL Y DE DEFENSA, POR CATEGORÍA, 2018-2032 (MILES DE USD)
TABLA 873 MERCADO DE COMPUESTOS PLÁSTICOS DE JAPÓN, POR TIPO DE POLÍMERO, 2018-2032 (MILES DE USD)
TABLA 874 MERCADO DE COMPUESTOS PLÁSTICOS DE JAPÓN, POR TIPO DE POLÍMERO, 2018-2032 (KILOTONELADAS)
TABLA 875 MERCADO DE TERMOPLÁSTICOS EN COMPUESTOS PLÁSTICOS DE JAPÓN, POR TIPO, 2018-2032 (MILES DE USD)
TABLA 876 MERCADO DE POLIETILENO (PE) EN COMPUESTOS PLÁSTICOS DE JAPÓN, POR TIPO, 2018-2032 (MILES DE USD)
TABLA 877 PLÁSTICOS DE INGENIERÍA EN EL MERCADO DE COMPUESTOS PLÁSTICOS DE JAPÓN, POR TIPO, 2018-2032 (MILES DE USD)
TABLA 878 PLÁSTICOS TERMOENDURECIBLES DE JAPÓN EN EL MERCADO DE COMPUESTOS DE PLÁSTICO, POR TIPO, 2018-2032 (MILES DE USD)
TABLA 879 BIOPLÁSTICOS EN EL MERCADO DE COMPUESTOS PLÁSTICOS DE JAPÓN, POR TIPO, 2018-2032 (MILES DE USD)
TABLA 880 MERCADO DE COMPUESTOS PLÁSTICOS DE JAPÓN, POR TIPO DE RELLENO, 2018-2032 (MILES DE USD)
TABLA 881 CARGAS MINERALES EN EL MERCADO DE COMPUESTOS PLÁSTICOS DE JAPÓN, POR TIPO, 2018-2032 (MILES DE USD)
TABLA 882 REFUERZOS EN EL MERCADO DE COMPUESTOS PLÁSTICOS DE JAPÓN, POR TIPO, 2018-2032 (MILES DE USD)
TABLA 883 ADITIVOS EN EL MERCADO DE COMPUESTOS PLÁSTICOS DE JAPÓN, POR TIPO, 2018-2032 (MILES DE USD)
TABLA 884 MERCADO DE COMPUESTOS DE PLÁSTICO DE JAPÓN, POR PROCESO DE FABRICACIÓN, 2018-2032 (MILES DE USD)
TABLA 885 MERCADO DE COMPUESTOS PLÁSTICOS DE JAPÓN, POR PROCESO DE FABRICACIÓN, 2018-2032 (KILOTONELADAS)
TABLA 886 MERCADO DE EXTRUSIÓN DE COMPUESTOS PLÁSTICOS EN JAPÓN, POR TIPO, 2018-2032 (MILES DE USD)
TABLA 887 MERCADO DE EXTRUSIÓN DE PLÁSTICOS EN JAPÓN, POR SISTEMA DE PELETIZACIÓN, 2018-2032 (MILES DE USD)
TABLA 888 MERCADO DE COMPUESTOS DE PLÁSTICO BASADOS EN MOLDEO POR INYECCIÓN EN JAPÓN, POR SISTEMA DE PELETIZACIÓN, 2018-2032 (MILES DE USD)
TABLA 889 COMPACTACIÓN/PRESIONADO EN EL MERCADO DE COMPUESTOS DE PLÁSTICO EN JAPÓN, POR SISTEMA DE PELETIZACIÓN, 2018-2032 (MILES DE USD)
TABLA 890 AMASADORA JAPÓN/MEZCLA BANBURY EN EL MERCADO DE COMPUESTOS DE PLÁSTICO, POR SISTEMA DE PELETIZACIÓN, 2018-2032 (MILES DE USD)
TABLA 891 MERCADO DE COMPUESTOS PLÁSTICOS DE JAPÓN, POR PROPIEDADES, 2018-2032 (MILES DE USD)
TABLA 892 MERCADO DE COMPUESTOS PLÁSTICOS DE JAPÓN, POR APLICACIÓN, 2018-2032 (MILES DE USD)
TABLA 893 MERCADO DE COMPUESTOS PLÁSTICOS DE JAPÓN, POR APLICACIÓN, 2018-2032 (KILOTONELADAS)
TABLA 894 MERCADO DE COMPUESTOS DE PLÁSTICO EN AUTOMÓVILES DE JAPÓN, POR CATEGORÍA, 2018-2032 (MILES DE USD)
TABLA 895 COMPONENTES INTERIORES DE JAPÓN EN EL MERCADO DE COMPUESTOS PLÁSTICOS, POR TIPO, 2018-2032 (MILES DE USD)
TABLA 896 PIEZAS DE CARROCERÍA EXTERIOR DE JAPÓN EN EL MERCADO DE COMPUESTOS DE PLÁSTICO, POR TIPO, 2018-2032 (MILES DE USD)
TABLA 897 APLICACIONES INTERNAS EN JAPÓN EN EL MERCADO DE COMPUESTOS PLÁSTICOS, POR TIPO, 2018-2032 (MILES DE USD)
TABLA 898 MERCADO DE ENVASES DE PLÁSTICO EN JAPÓN, POR CATEGORÍA, 2018-2032 (MILES DE USD)
TABLA 899 MERCADO DE ENVASES DE ALIMENTOS Y BEBIDAS EN JAPÓN, POR TIPO, 2018-2032 (MILES DE USD)
TABLA 900 MERCADO DE ENVASES INDUSTRIALES DE JAPÓN EN COMPUESTOS DE PLÁSTICO, POR TIPO, 2018-2032 (MILES DE USD)
TABLA 901 MERCADO DE ENVASES DE BIENES DE CONSUMO EN JAPÓN, POR TIPO, 2018-2032 (MILES DE USD)
TABLA 902 MERCADO DE CONSTRUCCIÓN Y EDIFICACIÓN DE PLÁSTICOS EN JAPÓN, POR CATEGORÍA, 2018-2032 (MILES DE USD)
TABLA 903 MERCADO DE PRODUCTOS ELÉCTRICOS Y ELECTRÓNICOS EN COMPUESTOS DE PLÁSTICO EN JAPÓN, POR CATEGORÍA, 2018-2032 (MILES DE USD)
TABLA 904 DISPOSITIVOS MÉDICOS EN EL MERCADO DE COMPUESTOS DE PLÁSTICO DE JAPÓN, POR CATEGORÍA, 2018-2032 (MILES DE USD)
TABLA 905 MERCADO DE MUEBLES DE JAPÓN EN COMPUESTOS DE PLÁSTICO, POR CATEGORÍA, 2018-2032 (MILES DE USD)
TABLA 906 MERCADO DE ENERGÍA Y ELECTRICIDAD EN JAPÓN, POR CATEGORÍA, 2018-2032 (MILES DE USD)
TABLA 907 MERCADO DE COMPUESTOS PLÁSTICOS DE LA INDUSTRIA AEROESPACIAL Y DE DEFENSA DE JAPÓN, POR CATEGORÍA, 2018-2032 (MILES DE USD)
TABLA 908 MERCADO DE COMPUESTOS PLÁSTICOS DE COREA DEL SUR, POR TIPO DE POLÍMERO, 2018-2032 (MILES DE USD)
TABLA 909 MERCADO DE COMPUESTOS PLÁSTICOS DE COREA DEL SUR, POR TIPO DE POLÍMERO, 2018-2032 (KILOTONELADAS)
TABLA 910 MERCADO DE TERMOPLÁSTICOS EN COMPUESTOS PLÁSTICOS DE COREA DEL SUR, POR TIPO, 2018-2032 (MILES DE USD)
TABLA 911 MERCADO DE POLIETILENO (PE) EN COMPUESTOS PLÁSTICOS DE COREA DEL SUR, POR TIPO, 2018-2032 (MILES DE USD)
TABLA 912 PLÁSTICOS DE INGENIERÍA DE COREA DEL SUR EN EL MERCADO DE COMPUESTOS PLÁSTICOS, POR TIPO, 2018-2032 (MILES DE USD)
TABLA 913 PLÁSTICOS TERMOESTABLECIDOS DE COREA DEL SUR EN EL MERCADO DE COMPUESTOS DE PLÁSTICO, POR TIPO, 2018-2032 (MILES DE USD)
TABLA 914 BIOPLÁSTICOS DE COREA DEL SUR EN EL MERCADO DE COMPUESTOS PLÁSTICOS, POR TIPO, 2018-2032 (MILES DE USD)
TABLA 915 MERCADO DE COMPUESTOS PLÁSTICOS DE COREA DEL SUR, POR TIPO DE RELLENO, 2018-2032 (MILES DE USD)
TABLA 916 RELLENOS MINERALES EN EL MERCADO DE COMPUESTOS PLÁSTICOS DE COREA DEL SUR, POR TIPO, 2018-2032 (MILES DE USD)
TABLA 917 MERCADO DE REFUERZOS DE COREA DEL SUR EN COMPUESTOS PLÁSTICOS, POR TIPO, 2018-2032 (MILES DE USD)
TABLA 918 ADITIVOS DE COREA DEL SUR EN EL MERCADO DE COMPUESTOS PLÁSTICOS, POR TIPO, 2018-2032 (MILES DE USD)
TABLA 919 MERCADO DE COMPUESTOS PLÁSTICOS DE COREA DEL SUR, POR PROCESO DE FABRICACIÓN, 2018-2032 (MILES DE USD)
TABLA 920 MERCADO DE COMPUESTOS PLÁSTICOS DE COREA DEL SUR, POR PROCESO DE FABRICACIÓN, 2018-2032 (KILOTONELADAS)
TABLA 921 MERCADO DE EXTRUSIÓN DE COMPUESTOS PLÁSTICOS DE COREA DEL SUR, POR TIPO, 2018-2032 (MILES DE USD)
TABLA 922 MERCADO DE EXTRUSIÓN DE PLÁSTICOS EN COREA DEL SUR, POR SISTEMA DE PELETIZACIÓN, 2018-2032 (MILES DE USD)
TABLA 923 MERCADO DE COMPUESTOS DE PLÁSTICO BASADOS EN MOLDEO POR INYECCIÓN DE COREA DEL SUR, POR SISTEMA DE PELETIZACIÓN, 2018-2032 (MILES DE USD)
TABLA 924 COMPACTACIÓN/PRESIONADO EN EL MERCADO DE COMPUESTOS DE PLÁSTICO DE COREA DEL SUR, POR SISTEMA DE PELETIZACIÓN, 2018-2032 (MILES DE USD)
TABLA 925 COREA DEL SUR: MERCADO DE MEZCLA DE AMASADAS/BANBURY EN LA FABRICACIÓN DE COMPUESTOS DE PLÁSTICO, POR SISTEMA DE PELETIZACIÓN, 2018-2032 (MILES DE USD)
TABLA 926 MERCADO DE COMPUESTOS PLÁSTICOS DE COREA DEL SUR, POR PROPIEDADES, 2018-2032 (MILES DE USD)
TABLA 927 MERCADO DE COMPUESTOS PLÁSTICOS DE COREA DEL SUR, POR APLICACIÓN, 2018-2032 (MILES DE USD)
TABLA 928 MERCADO DE COMPUESTOS PLÁSTICOS DE COREA DEL SUR, POR APLICACIÓN, 2018-2032 (KILOTONELADAS)
TABLA 929 MERCADO DE COMPUESTOS DE PLÁSTICO EN AUTOMOCIÓN DE COREA DEL SUR, POR CATEGORÍA, 2018-2032 (MILES DE USD)
TABLA 930 COMPONENTES INTERIORES DE COREA DEL SUR EN EL MERCADO DE COMPUESTOS PLÁSTICOS, POR TIPO, 2018-2032 (MILES DE USD)
TABLA 931 PARTES DE CARROCERÍA EXTERIOR DE COREA DEL SUR EN EL MERCADO DE COMPUESTOS DE PLÁSTICO, POR TIPO, 2018-2032 (MILES DE USD)
TABLA 932 APLICACIONES INTERNAS EN COREA DEL SUR EN EL MERCADO DE COMPUESTOS PLÁSTICOS, POR TIPO, 2018-2032 (MILES DE USD)
TABLA 933 MERCADO DE ENVASES DE PLÁSTICO EN COREA DEL SUR, POR CATEGORÍA, 2018-2032 (MILES DE USD)
TABLA 934 MERCADO DE ENVASES DE ALIMENTOS Y BEBIDAS EN COMPUESTOS DE PLÁSTICO DE COREA DEL SUR, POR TIPO, 2018-2032 (MILES DE USD)
TABLA 935 MERCADO DE ENVASES INDUSTRIALES DE COREA DEL SUR EN COMPUESTOS DE PLÁSTICO, POR TIPO, 2018-2032 (MILES DE USD)
TABLA 936 MERCADO DE ENVASES DE BIENES DE CONSUMO DE COREA DEL SUR EN COMPUESTOS DE PLÁSTICO, POR TIPO, 2018-2032 (MILES DE USD)
TABLA 937 MERCADO DE CONSTRUCCIÓN Y EDIFICACIÓN DE COMPUESTOS PLÁSTICOS DE COREA DEL SUR, POR CATEGORÍA, 2018-2032 (MILES DE USD)
TABLA 938 MERCADO DE PRODUCTOS ELÉCTRICOS Y ELECTRÓNICOS EN COMPUESTOS DE PLÁSTICO DE COREA DEL SUR, POR CATEGORÍA, 2018-2032 (MILES DE USD)
TABLA 939 DISPOSITIVOS MÉDICOS DE COREA DEL SUR EN EL MERCADO DE COMPUESTOS DE PLÁSTICO, POR CATEGORÍA, 2018-2032 (MILES DE USD)
TABLA 940 MERCADO DE MUEBLES DE COREA DEL SUR EN COMPUESTOS DE PLÁSTICO, POR CATEGORÍA, 2018-2032 (MILES DE USD)
TABLA 941 MERCADO DE ENERGÍA Y ELECTRICIDAD DE COREA DEL SUR EN COMPUESTOS DE PLÁSTICO, POR CATEGORÍA, 2018-2032 (MILES DE USD)
TABLA 942 MERCADO DE COMPUESTOS PLÁSTICOS DE LA INDUSTRIA AEROESPACIAL Y DE DEFENSA DE COREA DEL SUR, POR CATEGORÍA, 2018-2032 (MILES DE USD)
TABLA 943 MERCADO DE COMPUESTOS PLÁSTICOS DE TAILANDIA, POR TIPO DE POLÍMERO, 2018-2032 (MILES DE USD)
TABLA 944 MERCADO DE COMPUESTOS PLÁSTICOS DE TAILANDIA, POR TIPO DE POLÍMERO, 2018-2032 (KILOTONELADAS)
TABLA 945 MERCADO DE TERMOPLÁSTICOS EN COMPUESTOS PLÁSTICOS DE TAILANDIA, POR TIPO, 2018-2032 (MILES DE USD)
TABLA 946 MERCADO DE POLIETILENO (PE) EN COMPUESTOS PLÁSTICOS DE TAILANDIA, POR TIPO, 2018-2032 (MILES DE USD)
TABLA 947 PLÁSTICOS DE INGENIERÍA DE TAILANDIA EN EL MERCADO DE COMPUESTOS PLÁSTICOS, POR TIPO, 2018-2032 (MILES DE USD)
TABLA 948 PLÁSTICOS TERMOENDURECIBLES DE TAILANDIA EN EL MERCADO DE COMPUESTOS DE PLÁSTICO, POR TIPO, 2018-2032 (MILES DE USD)
TABLA 949 BIOPLÁSTICOS EN EL MERCADO DE COMPUESTOS PLÁSTICOS DE TAILANDIA, POR TIPO, 2018-2032 (MILES DE USD)
TABLA 950 MERCADO DE COMPUESTOS PLÁSTICOS DE TAILANDIA, POR TIPO DE RELLENO, 2018-2032 (MILES DE USD)
TABLA 951 RELLENOS MINERALES EN EL MERCADO DE COMPUESTOS PLÁSTICOS DE TAILANDIA, POR TIPO, 2018-2032 (MILES DE USD)
TABLA 952 REFUERZOS EN EL MERCADO DE COMPUESTOS PLÁSTICOS DE TAILANDIA, POR TIPO, 2018-2032 (MILES DE USD)
TABLA 953 ADITIVOS DE TAILANDIA EN EL MERCADO DE COMPUESTOS PLÁSTICOS, POR TIPO, 2018-2032 (MILES DE USD)
TABLA 954 MERCADO DE COMPUESTOS PLÁSTICOS DE TAILANDIA, POR PROCESO DE FABRICACIÓN, 2018-2032 (MILES DE USD)
TABLA 955 MERCADO DE COMPUESTOS PLÁSTICOS DE TAILANDIA, POR PROCESO DE FABRICACIÓN, 2018-2032 (KILOTONELADAS)
TABLA 956 MERCADO DE EXTRUSIÓN DE PLÁSTICOS EN TAILANDIA, POR TIPO, 2018-2032 (MILES DE USD)
TABLA 957 MERCADO DE EXTRUSIÓN DE PLÁSTICOS EN TAILANDIA, POR SISTEMA DE PELETIZACIÓN, 2018-2032 (MILES DE USD)
TABLA 958 MERCADO DE COMPUESTOS DE PLÁSTICO BASADOS EN MOLDEO POR INYECCIÓN EN TAILANDIA, POR SISTEMA DE PELETIZACIÓN, 2018-2032 (MILES DE USD)
TABLA 959 COMPACTACIÓN/PRESIONADO EN EL MERCADO DE COMPUESTOS DE PLÁSTICO DE TAILANDIA, POR SISTEMA DE PELETIZACIÓN, 2018-2032 (MILES DE USD)
TABLA 960 TAILANDIA - MERCADO DE MEZCLA DE AMASADORAS/BANBURY EN LA FABRICACIÓN DE COMPUESTOS DE PLÁSTICO, POR SISTEMA DE PELETIZACIÓN, 2018-2032 (MILES DE USD)
TABLA 961 MERCADO DE COMPUESTOS PLÁSTICOS DE TAILANDIA, POR PROPIEDADES, 2018-2032 (MILES DE USD)
TABLA 962 MERCADO DE COMPUESTOS PLÁSTICOS DE TAILANDIA, POR APLICACIÓN, 2018-2032 (MILES DE USD)
TABLA 963 MERCADO DE COMPUESTOS PLÁSTICOS DE TAILANDIA, POR APLICACIÓN, 2018-2032 (KILOTONELADAS)
TABLA 964 MERCADO DE COMPUESTOS DE PLÁSTICO EN AUTOMÓVILES DE TAILANDIA, POR CATEGORÍA, 2018-2032 (MILES DE USD)
TABLA 965 COMPONENTES INTERIORES DE TAILANDIA EN EL MERCADO DE COMPUESTOS PLÁSTICOS, POR TIPO, 2018-2032 (MILES DE USD)
TABLA 966 PIEZAS DE CARROCERÍA EXTERIOR DE TAILANDIA EN EL MERCADO DE COMPUESTOS DE PLÁSTICO, POR TIPO, 2018-2032 (MILES DE USD)
TABLA 967 APLICACIONES INTERNAS EN TAILANDIA EN EL MERCADO DE COMPUESTOS PLÁSTICOS, POR TIPO, 2018-2032 (MILES DE USD)
TABLA 968 MERCADO DE ENVASES DE PLÁSTICO EN TAILANDIA, POR CATEGORÍA, 2018-2032 (MILES DE USD)
TABLA 969 MERCADO DE ENVASES DE ALIMENTOS Y BEBIDAS EN TAILANDIA, POR TIPO, 2018-2032 (MILES DE USD)
TABLA 970 MERCADO DE ENVASES INDUSTRIALES DE TAILANDIA EN COMPUESTOS DE PLÁSTICO, POR TIPO, 2018-2032 (MILES DE USD)
TABLA 971 ENVASES DE BIENES DE CONSUMO EN EL MERCADO DE COMPUESTOS PLÁSTICOS DE TAILANDIA, POR TIPO, 2018-2032 (MILES DE USD)
TABLA 972 MERCADO DE CONSTRUCCIÓN Y EDIFICACIÓN DE PLÁSTICOS EN TAILANDIA, POR CATEGORÍA, 2018-2032 (MILES DE USD)
TABLA 973 MERCADO DE PRODUCTOS ELÉCTRICOS Y ELECTRÓNICOS EN COMPUESTOS DE PLÁSTICO DE TAILANDIA, POR CATEGORÍA, 2018-2032 (MILES DE USD)
TABLA 974 DISPOSITIVOS MÉDICOS EN EL MERCADO DE COMPUESTOS PLÁSTICOS DE TAILANDIA, POR CATEGORÍA, 2018-2032 (MILES DE USD)
TABLA 975 MERCADO DE MUEBLES DE TAILANDIA EN COMPUESTOS DE PLÁSTICO, POR CATEGORÍA, 2018-2032 (MILES DE USD)
TABLA 976 ENERGÍA Y ELECTRICIDAD EN EL MERCADO DE COMPUESTOS DE PLÁSTICO DE TAILANDIA, POR CATEGORÍA, 2018-2032 (MILES DE USD)
TABLA 977 MERCADO DE COMPUESTOS PLÁSTICOS DE LA INDUSTRIA AEROESPACIAL Y DE DEFENSA DE TAILANDIA, POR CATEGORÍA, 2018-2032 (MILES DE USD)
TABLA 978 MERCADO DE COMPUESTOS PLÁSTICOS DE SINGAPUR, POR TIPO DE POLÍMERO, 2018-2032 (MILES DE USD)
TABLA 979 MERCADO DE COMPUESTOS PLÁSTICOS DE SINGAPUR, POR TIPO DE POLÍMERO, 2018-2032 (KILOTONELADAS)
TABLA 980 MERCADO DE TERMOPLÁSTICOS EN COMPUESTOS PLÁSTICOS DE SINGAPUR, POR TIPO, 2018-2032 (MILES DE USD)
TABLA 981 MERCADO DE POLIETILENO (PE) EN COMPUESTOS PLÁSTICOS DE SINGAPUR, POR TIPO, 2018-2032 (MILES DE USD)
TABLA 982 PLÁSTICOS DE INGENIERÍA DE SINGAPUR EN EL MERCADO DE COMPUESTOS PLÁSTICOS, POR TIPO, 2018-2032 (MILES DE USD)
TABLA 983 PLÁSTICOS TERMOESTABLECIDOS DE SINGAPUR EN EL MERCADO DE COMPUESTOS PLÁSTICOS, POR TIPO, 2018-2032 (MILES DE USD)
TABLA 984 BIOPLÁSTICOS DE SINGAPUR EN EL MERCADO DE COMPUESTOS PLÁSTICOS, POR TIPO, 2018-2032 (MILES DE USD)
TABLA 985 MERCADO DE COMPUESTOS PLÁSTICOS DE SINGAPUR, POR TIPO DE RELLENO, 2018-2032 (MILES DE USD)
TABLA 986 RELLENOS MINERALES DE SINGAPUR EN EL MERCADO DE COMPUESTOS PLÁSTICOS, POR TIPO, 2018-2032 (MILES DE USD)
TABLA 987 REFUERZOS EN EL MERCADO DE COMPUESTOS PLÁSTICOS DE SINGAPUR, POR TIPO, 2018-2032 (MILES DE USD)
TABLA 988 ADITIVOS DE SINGAPUR EN EL MERCADO DE COMPUESTOS PLÁSTICOS, POR TIPO, 2018-2032 (MILES DE USD)
TABLA 989 MERCADO DE COMPUESTOS PLÁSTICOS DE SINGAPUR, POR PROCESO DE FABRICACIÓN, 2018-2032 (MILES DE USD)
TABLA 990 MERCADO DE COMPUESTOS PLÁSTICOS DE SINGAPUR, POR PROCESO DE FABRICACIÓN, 2018-2032 (KILOTONELADAS)
TABLA 991 MERCADO DE EXTRUSIÓN DE COMPUESTOS PLÁSTICOS DE SINGAPUR, POR TIPO, 2018-2032 (MILES DE USD)
TABLA 992 MERCADO DE EXTRUSIÓN DE PLÁSTICOS EN SINGAPUR, POR SISTEMA DE PELETIZACIÓN, 2018-2032 (MILES DE USD)
TABLA 993 MERCADO DE COMPUESTOS DE PLÁSTICO BASADOS EN MOLDEO POR INYECCIÓN EN SINGAPUR, POR SISTEMA DE PELETIZACIÓN, 2018-2032 (MILES DE USD)
TABLA 994 COMPACTACIÓN/PRESIONADO EN EL MERCADO DE COMPUESTOS DE PLÁSTICO EN SINGAPUR, POR SISTEMA DE PELETIZACIÓN, 2018-2032 (MILES DE USD)
TABLA 995 AMASADORA DE SINGAPUR/MEZCLA BANBURY EN EL MERCADO DE COMPUESTOS DE PLÁSTICO, POR SISTEMA DE PELETIZACIÓN, 2018-2032 (MILES DE USD)
TABLA 996 MERCADO DE COMPUESTOS PLÁSTICOS DE SINGAPUR, POR PROPIEDADES, 2018-2032 (MILES DE USD)
TABLA 997 MERCADO DE COMPUESTOS PLÁSTICOS DE SINGAPUR, POR APLICACIÓN, 2018-2032 (MILES DE USD)
TABLA 998 MERCADO DE COMPUESTOS PLÁSTICOS DE SINGAPUR, POR APLICACIÓN, 2018-2032 (KILOTONELADAS)
TABLA 999 MERCADO DE COMPUESTOS DE PLÁSTICO EN AUTOMÓVILES DE SINGAPUR, POR CATEGORÍA, 2018-2032 (MILES DE USD)
TABLA 1000 COMPONENTES DE INTERIOR DE SINGAPUR EN EL MERCADO DE COMPUESTOS PLÁSTICOS, POR TIPO, 2018-2032 (MILES DE USD)
TABLA 1001 PIEZAS DE CARROCERÍA EXTERIOR DE SINGAPUR EN EL MERCADO DE COMPUESTOS DE PLÁSTICO, POR TIPO, 2018-2032 (MILES DE USD)
TABLA 1002 APLICACIONES INTERNAS EN EL MERCADO DE COMPUESTOS PLÁSTICOS DE SINGAPUR, POR TIPO, 2018-2032 (MILES DE USD)
TABLA 1003 MERCADO DE ENVASES DE PLÁSTICO EN SINGAPUR, POR CATEGORÍA, 2018-2032 (MILES DE USD)
TABLA 1004 ENVASES DE ALIMENTOS Y BEBIDAS EN EL MERCADO DE COMPUESTOS DE PLÁSTICO DE SINGAPUR, POR TIPO, 2018-2032 (MILES DE USD)
TABLA 1005 MERCADO DE ENVASES INDUSTRIALES DE SINGAPUR EN COMPUESTOS DE PLÁSTICO, POR TIPO, 2018-2032 (MILES DE USD)
TABLA 1006 ENVASES DE BIENES DE CONSUMO EN EL MERCADO DE COMPUESTOS PLÁSTICOS DE SINGAPUR, POR TIPO, 2018-2032 (MILES DE USD)
TABLA 1007 MERCADO DE CONSTRUCCIÓN Y EDIFICACIÓN DE SINGAPUR EN EL MERCADO DE COMPUESTOS DE PLÁSTICO, POR CATEGORÍA, 2018-2032 (MILES DE USD)
TABLA 1008 MERCADO DE PRODUCTOS ELÉCTRICOS Y ELECTRÓNICOS EN COMPUESTOS DE PLÁSTICO DE SINGAPUR, POR CATEGORÍA, 2018-2032 (MILES DE USD)
TABLA 1009 DISPOSITIVOS MÉDICOS DE SINGAPUR EN EL MERCADO DE COMPUESTOS PLÁSTICOS, POR CATEGORÍA, 2018-2032 (MILES DE USD)
TABLA 1010 MERCADO DE MUEBLES DE SINGAPUR EN COMPUESTOS DE PLÁSTICO, POR CATEGORÍA, 2018-2032 (MILES DE USD)
TABLA 1011 MERCADO DE ENERGÍA Y ELECTRICIDAD EN SINGAPUR, POR CATEGORÍA, 2018-2032 (MILES DE USD)
TABLA 1012 SINGAPUR, MERCADO DE COMPUESTOS PLÁSTICOS DE LA INDUSTRIA AEROESPACIAL Y DE DEFENSA, POR CATEGORÍA, 2018-2032 (MILES DE USD)
TABLA 1013 MERCADO DE COMPUESTOS PLÁSTICOS DE INDONESIA, POR TIPO DE POLÍMERO, 2018-2032 (MILES DE USD)
TABLA 1014 MERCADO DE COMPUESTOS PLÁSTICOS DE INDONESIA, POR TIPO DE POLÍMERO, 2018-2032 (KILOTONELADAS)
TABLA 1015 MERCADO DE TERMOPLÁSTICOS EN COMPUESTOS PLÁSTICOS DE INDONESIA, POR TIPO, 2018-2032 (MILES DE USD)
TABLA 1016 MERCADO DE POLIETILENO (PE) EN COMPUESTOS PLÁSTICOS DE INDONESIA, POR TIPO, 2018-2032 (MILES DE USD)
TABLA 1017 PLÁSTICOS DE INGENIERÍA EN EL MERCADO DE COMPUESTOS PLÁSTICOS DE INDONESIA, POR TIPO, 2018-2032 (MILES DE USD)
TABLA 1018 PLÁSTICOS TERMOENDURECIBLES EN EL MERCADO DE COMPUESTOS PLÁSTICOS DE INDONESIA, POR TIPO, 2018-2032 (MILES DE USD)
TABLA 1019 BIOPLÁSTICOS EN EL MERCADO DE COMPUESTOS PLÁSTICOS DE INDONESIA, POR TIPO, 2018-2032 (MILES DE USD)
TABLA 1020 MERCADO DE COMPUESTOS PLÁSTICOS DE INDONESIA, POR TIPO DE RELLENO, 2018-2032 (MILES DE USD)
TABLA 1021 RELLENOS MINERALES EN EL MERCADO DE COMPUESTOS PLÁSTICOS DE INDONESIA, POR TIPO, 2018-2032 (MILES DE USD)
TABLA 1022 REFUERZOS EN EL MERCADO DE COMPUESTOS PLÁSTICOS DE INDONESIA, POR TIPO, 2018-2032 (MILES DE USD)
TABLA 1023 ADITIVOS EN EL MERCADO DE COMPUESTOS PLÁSTICOS DE INDONESIA, POR TIPO, 2018-2032 (MILES DE USD)
TABLA 1024 MERCADO DE COMPUESTOS PLÁSTICOS DE INDONESIA, POR PROCESO DE FABRICACIÓN, 2018-2032 (MILES DE USD)
TABLA 1025 MERCADO DE COMPUESTOS PLÁSTICOS DE INDONESIA, POR PROCESO DE FABRICACIÓN, 2018-2032 (KILOTONELADAS)
TABLA 1026 MERCADO DE EXTRUSIÓN DE COMPUESTOS PLÁSTICOS EN INDONESIA, POR TIPO, 2018-2032 (MILES DE USD)
TABLA 1027 MERCADO DE EXTRUSIÓN DE PLÁSTICOS EN INDONESIA, POR SISTEMA DE PELETIZACIÓN, 2018-2032 (MILES DE USD)
TABLA 1028 INDONESIA - MERCADO DE COMPUESTOS DE PLÁSTICO BASADOS EN MOLDEO POR INYECCIÓN, POR SISTEMA DE PELETIZACIÓN, 2018-2032 (MILES DE USD)
TABLA 1029 COMPACTACIÓN/PRESIONADO EN EL MERCADO DE COMPUESTOS DE PLÁSTICO EN INDONESIA, POR SISTEMA DE PELETIZACIÓN, 2018-2032 (MILES DE USD)
TABLA 1030 MERCADO DE MEZCLA DE AMASADORAS/BANBURY EN LA FABRICACIÓN DE COMPUESTOS DE PLÁSTICO EN INDONESIA, POR SISTEMA DE PELETIZACIÓN, 2018-2032 (MILES DE USD)
TABLA 1031 MERCADO DE COMPUESTOS PLÁSTICOS DE INDONESIA, POR PROPIEDADES, 2018-2032 (MILES DE USD)
TABLA 1032 MERCADO DE COMPUESTOS PLÁSTICOS DE INDONESIA, POR APLICACIÓN, 2018-2032 (MILES DE USD)
TABLA 1033 MERCADO DE COMPUESTOS PLÁSTICOS DE INDONESIA, POR APLICACIÓN, 2018-2032 (KILOTONELADAS)
TABLA 1034 MERCADO DE COMPUESTOS PLÁSTICOS AUTOMOTRICES DE INDONESIA, POR CATEGORÍA, 2018-2032 (MILES DE USD)
TABLA 1035 COMPONENTES INTERIORES EN EL MERCADO DE COMPUESTOS PLÁSTICOS DE INDONESIA, POR TIPO, 2018-2032 (MILES DE USD)
TABLA 1036 INDONESIA: PIEZAS DE CARROCERÍA EXTERIOR EN EL MERCADO DE COMPUESTOS PLÁSTICOS, POR TIPO, 2018-2032 (MILES DE USD)
TABLA 1037 APLICACIONES INTERNAS EN EL MERCADO DE COMPUESTOS PLÁSTICOS DE INDONESIA, POR TIPO, 2018-2032 (MILES DE USD)
TABLA 1038 MERCADO DE ENVASES DE PLÁSTICO EN INDONESIA, POR CATEGORÍA, 2018-2032 (MILES DE USD)
TABLA 1039 MERCADO DE ENVASES DE ALIMENTOS Y BEBIDAS EN COMPUESTOS DE PLÁSTICO DE INDONESIA, POR TIPO, 2018-2032 (MILES DE USD)
TABLA 1040 MERCADO DE ENVASES INDUSTRIALES DE COMPUESTOS PLÁSTICOS DE INDONESIA, POR TIPO, 2018-2032 (MILES DE USD)
TABLA 1041 ENVASES DE BIENES DE CONSUMO EN EL MERCADO DE COMPUESTOS PLÁSTICOS DE INDONESIA, POR TIPO, 2018-2032 (MILES DE USD)
TABLA 1042 INDONESIA: MERCADO DE CONSTRUCCIÓN Y EDIFICACIÓN DE COMPUESTOS PLÁSTICOS, POR CATEGORÍA, 2018-2032 (MILES DE USD)
TABLA 1043 MERCADO DE PRODUCTOS ELÉCTRICOS Y ELECTRÓNICOS EN COMPUESTOS DE PLÁSTICO DE INDONESIA, POR CATEGORÍA, 2018-2032 (MILES DE USD)
TABLA 1044 MERCADO DE DISPOSITIVOS MÉDICOS DE INDONESIA EN COMPUESTOS DE PLÁSTICO, POR CATEGORÍA, 2018-2032 (MILES DE USD)
TABLA 1045 MERCADO DE MUEBLES DE INDONESIA EN COMPUESTOS DE PLÁSTICO, POR CATEGORÍA, 2018-2032 (MILES DE USD)
TABLA 1046 ENERGÍA Y ELECTRICIDAD EN EL MERCADO DE COMPUESTOS DE PLÁSTICO DE INDONESIA, POR CATEGORÍA, 2018-2032 (MILES DE USD)
TABLA 1047 INDONESIA: MERCADO DE COMPUESTOS PLÁSTICOS AEROESPACIALES Y DE DEFENSA, POR CATEGORÍA, 2018-2032 (MILES DE USD)
TABLA 1048 MERCADO DE COMPUESTOS PLÁSTICOS DE AUSTRALIA, POR TIPO DE POLÍMERO, 2018-2032 (MILES DE USD)
TABLA 1049 MERCADO DE COMPUESTOS PLÁSTICOS DE AUSTRALIA, POR TIPO DE POLÍMERO, 2018-2032 (KILOTONELADAS)
TABLA 1050 MERCADO DE TERMOPLÁSTICOS EN COMPUESTOS PLÁSTICOS DE AUSTRALIA, POR TIPO, 2018-2032 (MILES DE USD)
TABLA 1051 MERCADO DE POLIETILENO (PE) EN COMPUESTOS PLÁSTICOS DE AUSTRALIA, POR TIPO, 2018-2032 (MILES DE USD)
TABLA 1052 PLÁSTICOS DE INGENIERÍA DE AUSTRALIA EN EL MERCADO DE COMPUESTOS DE PLÁSTICO, POR TIPO, 2018-2032 (MILES DE USD)
TABLA 1053 PLÁSTICOS TERMOENDURECIBLES DE AUSTRALIA EN EL MERCADO DE COMPUESTOS DE PLÁSTICO, POR TIPO, 2018-2032 (MILES DE USD)
TABLA 1054 BIOPLÁSTICOS EN EL MERCADO DE COMPUESTOS PLÁSTICOS DE AUSTRALIA, POR TIPO, 2018-2032 (MILES DE USD)
TABLA 1055 MERCADO DE COMPUESTOS PLÁSTICOS DE AUSTRALIA, POR TIPO DE RELLENO, 2018-2032 (MILES DE USD)
TABLA 1056 AUSTRALIA: RELLENOS MINERALES EN EL MERCADO DE COMPUESTOS PLÁSTICOS, POR TIPO, 2018-2032 (MILES DE USD)
TABLA 1057 REFUERZOS EN EL MERCADO DE COMPUESTOS PLÁSTICOS DE AUSTRALIA, POR TIPO, 2018-2032 (MILES DE USD)
TABLA 1058 ADITIVOS DE AUSTRALIA EN EL MERCADO DE COMPUESTOS PLÁSTICOS, POR TIPO, 2018-2032 (MILES DE USD)
TABLA 1059 MERCADO DE COMPUESTOS DE PLÁSTICO DE AUSTRALIA, POR PROCESO DE FABRICACIÓN, 2018-2032 (MILES DE USD)
TABLA 1060 MERCADO DE COMPUESTOS DE PLÁSTICO DE AUSTRALIA, POR PROCESO DE FABRICACIÓN, 2018-2032 (KILOTONELADAS)
TABLA 1061 MERCADO DE EXTRUSIÓN DE COMPUESTOS DE PLÁSTICO EN AUSTRALIA, POR TIPO, 2018-2032 (MILES DE USD)
TABLA 1062 MERCADO DE EXTRUSIÓN DE PLÁSTICOS EN AUSTRALIA, POR SISTEMA DE PELETIZACIÓN, 2018-2032 (MILES DE USD)
TABLA 1063 MERCADO DE COMPUESTOS DE PLÁSTICO BASADOS EN MOLDEO POR INYECCIÓN EN AUSTRALIA, POR SISTEMA DE PELETIZACIÓN, 2018-2032 (MILES DE USD)
TABLA 1064 COMPACTACIÓN/PRESIONADO EN EL MERCADO DE COMPUESTOS DE PLÁSTICO DE AUSTRALIA, POR SISTEMA DE PELETIZACIÓN, 2018-2032 (MILES DE USD)
TABLA 1065 MERCADO DE AUSTRALIA DE MEZCLAS DE AMASADORAS/BANBURY EN LA FABRICACIÓN DE COMPUESTOS DE PLÁSTICO, POR SISTEMA DE PELETIZACIÓN, 2018-2032 (MILES DE USD)
TABLA 1066 MERCADO DE COMPUESTOS PLÁSTICOS DE AUSTRALIA, POR PROPIEDADES, 2018-2032 (MILES DE USD)
TABLA 1067 MERCADO DE COMPUESTOS PLÁSTICOS DE AUSTRALIA, POR APLICACIÓN, 2018-2032 (MILES DE USD)
TABLA 1068 MERCADO DE COMPUESTOS PLÁSTICOS DE AUSTRALIA, POR APLICACIÓN, 2018-2032 (KILOTONELADAS)
TABLA 1069 MERCADO DE COMPUESTOS DE PLÁSTICO EN AUTOMÓVILES DE AUSTRALIA, POR CATEGORÍA, 2018-2032 (MILES DE USD)
TABLA 1070 COMPONENTES DE INTERIOR DE AUSTRALIA EN EL MERCADO DE COMPUESTOS DE PLÁSTICO, POR TIPO, 2018-2032 (MILES DE USD)
TABLA 1071 AUSTRALIA: PIEZAS DE CARROCERÍA EXTERIOR EN EL MERCADO DE COMPUESTOS DE PLÁSTICO, POR TIPO, 2018-2032 (MILES DE USD)
TABLA 1072 APLICACIONES INTERNAS EN AUSTRALIA EN EL MERCADO DE COMPUESTOS PLÁSTICOS, POR TIPO, 2018-2032 (MILES DE USD)
TABLA 1073 MERCADO DE ENVASES DE PLÁSTICO EN AUSTRALIA, POR CATEGORÍA, 2018-2032 (MILES DE USD)
TABLA 1074 MERCADO DE ENVASES DE ALIMENTOS Y BEBIDAS EN AUSTRALIA, POR TIPO, 2018-2032 (MILES DE USD)
TABLA 1075 MERCADO DE ENVASES INDUSTRIALES DE AUSTRALIA EN COMPUESTOS DE PLÁSTICO, POR TIPO, 2018-2032 (MILES DE USD)
TABLA 1076 MERCADO DE ENVASES DE BIENES DE CONSUMO EN AUSTRALIA, POR TIPO, 2018-2032 (MILES DE USD)
TABLA 1077 MERCADO DE CONSTRUCCIÓN Y EDIFICACIÓN DE PLÁSTICOS EN AUSTRALIA, POR CATEGORÍA, 2018-2032 (MILES DE USD)
TABLA 1078 MERCADO DE PRODUCTOS ELÉCTRICOS Y ELECTRÓNICOS EN COMPUESTOS DE PLÁSTICO DE AUSTRALIA, POR CATEGORÍA, 2018-2032 (MILES DE USD)
TABLA 1079 MERCADO DE DISPOSITIVOS MÉDICOS DE AUSTRALIA EN COMPUESTOS DE PLÁSTICO, POR CATEGORÍA, 2018-2032 (MILES DE USD)
TABLA 1080 MERCADO DE MUEBLES DE AUSTRALIA EN COMPUESTOS DE PLÁSTICO, POR CATEGORÍA, 2018-2032 (MILES DE USD)
TABLA 1081 AUSTRALIA ENERGÍA Y ELECTRICIDAD EN EL MERCADO DE COMPUESTOS DE PLÁSTICO, POR CATEGORÍA, 2018-2032 (MILES DE USD)
TABLA 1082 MERCADO DE COMPUESTOS PLÁSTICOS DE LA INDUSTRIA AEROESPACIAL Y DE DEFENSA DE AUSTRALIA, POR CATEGORÍA, 2018-2032 (MILES DE USD)
TABLA 1083 MERCADO DE COMPUESTOS PLÁSTICOS DE NUEVA ZELANDA, POR TIPO DE POLÍMERO, 2018-2032 (MILES DE USD)
TABLA 1084 MERCADO DE COMPUESTOS PLÁSTICOS DE NUEVA ZELANDA, POR TIPO DE POLÍMERO, 2018-2032 (KILOTONELADAS)
TABLA 1085 MERCADO DE TERMOPLÁSTICOS EN COMPUESTOS PLÁSTICOS DE NUEVA ZELANDA, POR TIPO, 2018-2032 (MILES DE USD)
TABLA 1086 MERCADO DE POLIETILENO (PE) EN COMPUESTOS PLÁSTICOS DE NUEVA ZELANDA, POR TIPO, 2018-2032 (MILES DE USD)
TABLA 1087 PLÁSTICOS DE INGENIERÍA DE NUEVA ZELANDA EN EL MERCADO DE COMPUESTOS PLÁSTICOS, POR TIPO, 2018-2032 (MILES DE USD)
TABLA 1088 PLÁSTICOS TERMOENDURECIBLES DE NUEVA ZELANDA EN EL MERCADO DE COMPUESTOS DE PLÁSTICO, POR TIPO, 2018-2032 (MILES DE USD)
TABLA 1089 MERCADO DE BIOPLÁSTICOS EN COMPUESTOS PLÁSTICOS DE NUEVA ZELANDA, POR TIPO, 2018-2032 (MILES DE USD)
TABLA 1090 MERCADO DE COMPUESTOS PLÁSTICOS DE NUEVA ZELANDA, POR TIPO DE RELLENO, 2018-2032 (MILES DE USD)
TABLA 1091 RELLENOS MINERALES DE NUEVA ZELANDA EN EL MERCADO DE COMPUESTOS PLÁSTICOS, POR TIPO, 2018-2032 (MILES DE USD)
TABLA 1092 REFUERZOS EN EL MERCADO DE COMPUESTOS PLÁSTICOS DE NUEVA ZELANDA, POR TIPO, 2018-2032 (MILES DE USD)
TABLA 1093 ADITIVOS DE NUEVA ZELANDA EN EL MERCADO DE COMPUESTOS PLÁSTICOS, POR TIPO, 2018-2032 (MILES DE USD)
TABLA 1094 MERCADO DE COMPUESTOS PLÁSTICOS DE NUEVA ZELANDA, POR PROCESO DE FABRICACIÓN, 2018-2032 (MILES DE USD)
TABLA 1095 MERCADO DE COMPUESTOS PLÁSTICOS DE NUEVA ZELANDA, POR PROCESO DE FABRICACIÓN, 2018-2032 (KILOTONELADAS)
TABLA 1096 MERCADO DE EXTRUSIÓN DE COMPUESTOS PLÁSTICOS DE NUEVA ZELANDA, POR TIPO, 2018-2032 (MILES DE USD)
TABLA 1097 MERCADO DE EXTRUSIÓN DE PLÁSTICOS EN NUEVA ZELANDA, POR SISTEMA DE PELETIZACIÓN, 2018-2032 (MILES DE USD)
TABLA 1098 MERCADO DE COMPUESTOS DE PLÁSTICO BASADOS EN MOLDEO POR INYECCIÓN DE NUEVA ZELANDA, POR SISTEMA DE PELETIZACIÓN, 2018-2032 (MILES DE USD)
TABLA 1099 COMPACTACIÓN/PRESIONADO EN EL MERCADO DE COMPUESTOS DE PLÁSTICO DE NUEVA ZELANDA, POR SISTEMA DE PELETIZACIÓN, 2018-2032 (MILES DE USD)
TABLA 1100 MERCADO DE MEZCLAS DE AMASADORAS/BANBURY DE NUEVA ZELANDA EN LA FABRICACIÓN DE COMPUESTOS DE PLÁSTICO, POR SISTEMA DE PELETIZACIÓN, 2018-2032 (MILES DE USD)
TABLA 1101 MERCADO DE COMPUESTOS PLÁSTICOS DE NUEVA ZELANDA, POR PROPIEDADES, 2018-2032 (MILES DE USD)
TABLA 1102 MERCADO DE COMPUESTOS PLÁSTICOS DE NUEVA ZELANDA, POR APLICACIÓN, 2018-2032 (MILES DE USD)
TABLA 1103 MERCADO DE COMPUESTOS PLÁSTICOS DE NUEVA ZELANDA, POR APLICACIÓN, 2018-2032 (KILOTONELADAS)
TABLA 1104 MERCADO DE COMPUESTOS PLÁSTICOS AUTOMOTRICES DE NUEVA ZELANDA, POR CATEGORÍA, 2018-2032 (MILES DE USD)
TABLA 1105 COMPONENTES DE INTERIOR DE NUEVA ZELANDA EN EL MERCADO DE COMPUESTOS PLÁSTICOS, POR TIPO, 2018-2032 (MILES DE USD)
TABLA 1106 PIEZAS DE CARROCERÍA EXTERIOR DE NUEVA ZELANDA EN EL MERCADO DE COMPUESTOS PLÁSTICOS, POR TIPO, 2018-2032 (MILES DE USD)
TABLA 1107 APLICACIONES INTERNAS EN NUEVA ZELANDA EN EL MERCADO DE COMPUESTOS PLÁSTICOS, POR TIPO, 2018-2032 (MILES DE USD)
TABLA 1108 MERCADO DE ENVASES DE PLÁSTICO EN NUEVA ZELANDA, POR CATEGORÍA, 2018-2032 (MILES DE USD)
TABLA 1109 MERCADO DE ENVASES DE ALIMENTOS Y BEBIDAS EN COMPUESTOS DE PLÁSTICO DE NUEVA ZELANDA, POR TIPO, 2018-2032 (MILES DE USD)
TABLA 1110 MERCADO DE ENVASES INDUSTRIALES DE NUEVA ZELANDA EN COMPUESTOS DE PLÁSTICO, POR TIPO, 2018-2032 (MILES DE USD)
TABLA 1111 MERCADO DE ENVASES DE BIENES DE CONSUMO EN COMPUESTOS DE PLÁSTICO DE NUEVA ZELANDA, POR TIPO, 2018-2032 (MILES DE USD)
TABLA 1112 MERCADO DE CONSTRUCCIÓN Y EDIFICACIÓN DE COMPUESTOS PLÁSTICOS DE NUEVA ZELANDA, POR CATEGORÍA, 2018-2032 (MILES DE USD)
TABLA 1113 MERCADO DE PRODUCTOS ELÉCTRICOS Y ELECTRÓNICOS EN COMPUESTOS DE PLÁSTICO DE NUEVA ZELANDA, POR CATEGORÍA, 2018-2032 (MILES DE USD)
TABLA 1114 MERCADO DE DISPOSITIVOS MÉDICOS DE NUEVA ZELANDA EN COMPUESTOS DE PLÁSTICO, POR CATEGORÍA, 2018-2032 (MILES DE USD)
TABLA 1115 MERCADO DE MUEBLES DE NUEVA ZELANDA EN COMPUESTOS DE PLÁSTICO, POR CATEGORÍA, 2018-2032 (MILES DE USD)
TABLA 1116 MERCADO DE ENERGÍA Y ELECTRICIDAD EN COMPUESTOS DE PLÁSTICO DE NUEVA ZELANDA, POR CATEGORÍA, 2018-2032 (MILES DE USD)
TABLA 1117 MERCADO DE COMPUESTOS PLÁSTICOS DE LA INDUSTRIA AEROESPACIAL Y DE DEFENSA DE NUEVA ZELANDA, POR CATEGORÍA, 2018-2032 (MILES DE USD)
TABLA 1118 MERCADO DE COMPUESTOS PLÁSTICOS DE FILIPINAS, POR TIPO DE POLÍMERO, 2018-2032 (MILES DE USD)
TABLA 1119 MERCADO DE COMPUESTOS PLÁSTICOS DE FILIPINAS, POR TIPO DE POLÍMERO, 2018-2032 (KILOTONELADAS)
TABLA 1120 MERCADO DE TERMOPLÁSTICOS EN COMPUESTOS PLÁSTICOS DE FILIPINAS, POR TIPO, 2018-2032 (MILES DE USD)
TABLA 1121 MERCADO DE POLIETILENO (PE) EN COMPUESTOS PLÁSTICOS DE FILIPINAS, POR TIPO, 2018-2032 (MILES DE USD)
TABLA 1122 PLÁSTICOS DE INGENIERÍA EN EL MERCADO DE COMPUESTOS PLÁSTICOS DE FILIPINAS, POR TIPO, 2018-2032 (MILES DE USD)
TABLA 1123 PLÁSTICOS TERMOENDURECIBLES EN EL MERCADO DE COMPUESTOS DE PLÁSTICO DE FILIPINAS, POR TIPO, 2018-2032 (MILES DE USD)
TABLA 1124 BIOPLÁSTICOS EN EL MERCADO DE COMPUESTOS PLÁSTICOS DE FILIPINAS, POR TIPO, 2018-2032 (MILES DE USD)
TABLA 1125 MERCADO DE COMPUESTOS PLÁSTICOS DE FILIPINAS, POR TIPO DE RELLENO, 2018-2032 (MILES DE USD)
TABLA 1126 RELLENOS MINERALES EN EL MERCADO DE COMPUESTOS PLÁSTICOS DE FILIPINAS, POR TIPO, 2018-2032 (MILES DE USD)
TABLA 1127 REFUERZOS EN EL MERCADO DE COMPUESTOS PLÁSTICOS DE FILIPINAS, POR TIPO, 2018-2032 (MILES DE USD)
TABLA 1128 ADITIVOS EN EL MERCADO DE COMPUESTOS PLÁSTICOS DE FILIPINAS, POR TIPO, 2018-2032 (MILES DE USD)
TABLA 1129 MERCADO DE COMPUESTOS PLÁSTICOS DE FILIPINAS, POR PROCESO DE FABRICACIÓN, 2018-2032 (MILES DE USD)
TABLA 1130 MERCADO DE COMPUESTOS PLÁSTICOS DE FILIPINAS, POR PROCESO DE FABRICACIÓN, 2018-2032 (KILOTONELADAS)
TABLA 1131 MERCADO DE EXTRUSIÓN DE COMPUESTOS PLÁSTICOS EN FILIPINAS, POR TIPO, 2018-2032 (MILES DE USD)
TABLA 1132 MERCADO DE EXTRUSIÓN DE PLÁSTICOS EN FILIPINAS, POR SISTEMA DE PELETIZACIÓN, 2018-2032 (MILES DE USD)
TABLA 1133 MERCADO DE COMPUESTOS DE PLÁSTICO BASADOS EN MOLDEO POR INYECCIÓN EN FILIPINAS, POR SISTEMA DE PELETIZACIÓN, 2018-2032 (MILES DE USD)
TABLA 1134 COMPACTACIÓN/PRESIONADO EN EL MERCADO DE COMPUESTOS DE PLÁSTICO EN FILIPINAS, POR SISTEMA DE PELETIZACIÓN, 2018-2032 (MILES DE USD)
TABLA 1135 MERCADO DE MEZCLAS DE AMASADORAS/BANBURY EN FILIPINAS PARA COMPUESTOS DE PLÁSTICO, POR SISTEMA DE PELETIZACIÓN, 2018-2032 (MILES DE USD)
TABLA 1136 MERCADO DE COMPUESTOS PLÁSTICOS DE FILIPINAS, POR PROPIEDADES, 2018-2032 (MILES DE USD)
TABLA 1137 MERCADO DE COMPUESTOS PLÁSTICOS DE FILIPINAS, POR APLICACIÓN, 2018-2032 (MILES DE USD)
TABLA 1138 MERCADO DE COMPUESTOS PLÁSTICOS DE FILIPINAS, POR APLICACIÓN, 2018-2032 (KILOTONELADAS)
TABLA 1139 MERCADO DE COMPUESTOS DE PLÁSTICO EN AUTOMÓVILES DE FILIPINAS, POR CATEGORÍA, 2018-2032 (MILES DE USD)
TABLA 1140 COMPONENTES INTERIORES EN EL MERCADO DE COMPUESTOS PLÁSTICOS DE FILIPINAS, POR TIPO, 2018-2032 (MILES DE USD)
TABLA 1141 PIEZAS DE CARROCERÍA EXTERIOR EN EL MERCADO DE COMPUESTOS DE PLÁSTICO DE FILIPINAS, POR TIPO, 2018-2032 (MILES DE USD)
TABLA 1142 APLICACIONES INTERNAS EN EL MERCADO DE COMPUESTOS PLÁSTICOS DE FILIPINAS, POR TIPO, 2018-2032 (MILES DE USD)
TABLA 1143 MERCADO DE ENVASES DE PLÁSTICO EN FILIPINAS, POR CATEGORÍA, 2018-2032 (MILES DE USD)
TABLA 1144 ENVASES DE ALIMENTOS Y BEBIDAS EN EL MERCADO DE COMPUESTOS DE PLÁSTICO DE FILIPINAS, POR TIPO, 2018-2032 (MILES DE USD)
TABLA 1145 MERCADO DE ENVASES INDUSTRIALES DE FILIPINAS EN COMPUESTOS DE PLÁSTICO, POR TIPO, 2018-2032 (MILES DE USD)
TABLA 1146 ENVASES DE BIENES DE CONSUMO EN EL MERCADO DE COMPUESTOS PLÁSTICOS DE FILIPINAS, POR TIPO, 2018-2032 (MILES DE USD)
TABLA 1147 MERCADO DE CONSTRUCCIÓN Y EDIFICACIÓN DE COMPUESTOS DE PLÁSTICO EN FILIPINAS, POR CATEGORÍA, 2018-2032 (MILES DE USD)
TABLA 1148 MERCADO DE PRODUCTOS ELÉCTRICOS Y ELECTRÓNICOS EN COMPUESTOS DE PLÁSTICO DE FILIPINAS, POR CATEGORÍA, 2018-2032 (MILES DE USD)
TABLA 1149 MERCADO DE DISPOSITIVOS MÉDICOS DE FILIPINAS EN COMPUESTOS DE PLÁSTICO, POR CATEGORÍA, 2018-2032 (MILES DE USD)
TABLA 1150 MERCADO DE MUEBLES DE FILIPINAS EN COMPUESTOS DE PLÁSTICO, POR CATEGORÍA, 2018-2032 (MILES DE USD)
TABLA 1151 ENERGÍA Y PODER EN EL MERCADO DE COMPUESTOS DE PLÁSTICO DE FILIPINAS, POR CATEGORÍA, 2018-2032 (MILES DE USD)
TABLA 1152 MERCADO DE COMPUESTOS PLÁSTICOS DE LA INDUSTRIA AEROESPACIAL Y DE DEFENSA DE FILIPINAS, POR CATEGORÍA, 2018-2032 (MILES DE USD)
TABLA 1153 MERCADO DE COMPUESTOS PLÁSTICOS DE MALASIA, POR TIPO DE POLÍMERO, 2018-2032 (MILES DE USD)
TABLA 1154 MERCADO DE COMPUESTOS PLÁSTICOS DE MALASIA, POR TIPO DE POLÍMERO, 2018-2032 (KILOTONELADAS)
TABLA 1155 MERCADO DE TERMOPLÁSTICOS EN COMPUESTOS PLÁSTICOS DE MALASIA, POR TIPO, 2018-2032 (MILES DE USD)
TABLA 1156 MERCADO DE POLIETILENO (PE) EN COMPUESTOS PLÁSTICOS DE MALASIA, POR TIPO, 2018-2032 (MILES DE USD)
TABLA 1157 PLÁSTICOS DE INGENIERÍA EN EL MERCADO DE COMPUESTOS PLÁSTICOS DE MALASIA, POR TIPO, 2018-2032 (MILES DE USD)
TABLA 1158 PLÁSTICOS TERMOENDURECIBLES DE MALASIA EN EL MERCADO DE COMPUESTOS DE PLÁSTICO, POR TIPO, 2018-2032 (MILES DE USD)
TABLA 1159 BIOPLÁSTICOS EN EL MERCADO DE COMPUESTOS PLÁSTICOS DE MALASIA, POR TIPO, 2018-2032 (MILES DE USD)
TABLA 1160 MERCADO DE COMPUESTOS PLÁSTICOS DE MALASIA, POR TIPO DE RELLENO, 2018-2032 (MILES DE USD)
TABLA 1161 RELLENOS MINERALES EN EL MERCADO DE COMPUESTOS PLÁSTICOS DE MALASIA, POR TIPO, 2018-2032 (MILES DE USD)
TABLA 1162 MERCADO DE REFUERZOS DE MALASIA EN COMPUESTOS PLÁSTICOS, POR TIPO, 2018-2032 (MILES DE USD)
TABLA 1163 ADITIVOS DE MALASIA EN EL MERCADO DE COMPUESTOS PLÁSTICOS, POR TIPO, 2018-2032 (MILES DE USD)
TABLA 1164 MERCADO DE COMPUESTOS PLÁSTICOS DE MALASIA, POR PROCESO DE FABRICACIÓN, 2018-2032 (MILES DE USD)
TABLA 1165 MERCADO DE COMPUESTOS PLÁSTICOS DE MALASIA, POR PROCESO DE FABRICACIÓN, 2018-2032 (KILOTONELADAS)
TABLA 1166 MERCADO DE EXTRUSIÓN DE COMPUESTOS PLÁSTICOS DE MALASIA, POR TIPO, 2018-2032 (MILES DE USD)
TABLA 1167 MERCADO DE EXTRUSIÓN DE PLÁSTICOS EN MALASIA, POR SISTEMA DE PELETIZACIÓN, 2018-2032 (MILES DE USD)
TABLA 1168 MERCADO DE COMPUESTOS DE PLÁSTICO BASADOS EN MOLDEO POR INYECCIÓN EN MALASIA, POR SISTEMA DE PELETIZACIÓN, 2018-2032 (MILES DE USD)
TABLA 1169 COMPACTACIÓN/PRESIONADO EN EL MERCADO DE COMPUESTOS DE PLÁSTICO EN MALASIA, POR SISTEMA DE PELETIZACIÓN, 2018-2032 (MILES DE USD)
TABLA 1170 MERCADO DE MEZCLA DE AMASADORAS/BANBURY EN LA FABRICACIÓN DE COMPUESTOS DE PLÁSTICO, POR SISTEMA DE PELETIZACIÓN, 2018-2032 (MILES DE USD)
TABLA 1171 MERCADO DE COMPUESTOS PLÁSTICOS DE MALASIA, POR PROPIEDADES, 2018-2032 (MILES DE USD)
TABLA 1172 MERCADO DE COMPUESTOS PLÁSTICOS DE MALASIA, POR APLICACIÓN, 2018-2032 (MILES DE USD)
TABLA 1173 MERCADO DE COMPUESTOS PLÁSTICOS DE MALASIA, POR APLICACIÓN, 2018-2032 (KILOTONELADAS)
TABLA 1174 MERCADO DE COMPUESTOS DE PLÁSTICO EN AUTOMÓVILES DE MALASIA, POR CATEGORÍA, 2018-2032 (MILES DE USD)
TABLA 1175 COMPONENTES DE INTERIOR DE MALASIA EN EL MERCADO DE COMPUESTOS PLÁSTICOS, POR TIPO, 2018-2032 (MILES DE USD)
TABLA 1176 PARTES DE CARROCERÍA EXTERIOR EN EL MERCADO DE COMPUESTOS PLÁSTICOS DE MALASIA, POR TIPO, 2018-2032 (MILES DE USD)
TABLA 1177 APLICACIONES INTERNAS EN MALASIA EN EL MERCADO DE COMPUESTOS PLÁSTICOS, POR TIPO, 2018-2032 (MILES DE USD)
TABLA 1178 MERCADO DE ENVASES DE PLÁSTICO EN MALASIA, POR CATEGORÍA, 2018-2032 (MILES DE USD)
TABLA 1179 MERCADO DE ENVASES DE ALIMENTOS Y BEBIDAS EN MALASIA, POR TIPO, 2018-2032 (MILES DE USD)
TABLA 1180 MERCADO DE ENVASES INDUSTRIALES DE MALASIA PARA LA FABRICACIÓN DE COMPUESTOS DE PLÁSTICO, POR TIPO, 2018-2032 (MILES DE USD)
TABLA 1181 MERCADO DE ENVASES DE BIENES DE CONSUMO EN MALASIA, POR TIPO, 2018-2032 (MILES DE USD)
TABLA 1182 MERCADO DE CONSTRUCCIÓN Y EDIFICACIÓN DE MALASIA EN EL MERCADO DE COMPUESTOS DE PLÁSTICO, POR CATEGORÍA, 2018-2032 (MILES DE USD)
TABLA 1183 MERCADO DE PRODUCTOS ELÉCTRICOS Y ELECTRÓNICOS EN COMPUESTOS DE PLÁSTICO DE MALASIA, POR CATEGORÍA, 2018-2032 (MILES DE USD)
TABLA 1184 MERCADO DE DISPOSITIVOS MÉDICOS DE MALASIA EN COMPUESTOS DE PLÁSTICO, POR CATEGORÍA, 2018-2032 (MILES DE USD)
TABLA 1185 MERCADO DE MUEBLES DE MALASIA EN COMPUESTOS DE PLÁSTICO, POR CATEGORÍA, 2018-2032 (MILES DE USD)
TABLA 1186 MERCADO DE ENERGÍA Y ELECTRICIDAD EN COMPUESTOS DE PLÁSTICO DE MALASIA, POR CATEGORÍA, 2018-2032 (MILES DE USD)
TABLA 1187 MERCADO DE COMPUESTOS PLÁSTICOS DE LA INDUSTRIA AEROESPACIAL Y DE DEFENSA DE MALASIA, POR CATEGORÍA, 2018-2032 (MILES DE USD)
TABLA 1188 MERCADO DE COMPUESTOS PLÁSTICOS DE TAIWÁN, POR TIPO DE POLÍMERO, 2018-2032 (MILES DE USD)
TABLA 1189 MERCADO DE COMPUESTOS PLÁSTICOS DE TAIWÁN, POR TIPO DE POLÍMERO, 2018-2032 (KILOTONELADAS)
TABLA 1190 MERCADO DE TERMOPLÁSTICOS EN COMPUESTOS PLÁSTICOS DE TAIWÁN, POR TIPO, 2018-2032 (MILES DE USD)
TABLA 1191 MERCADO DE POLIETILENO (PE) EN COMPUESTOS PLÁSTICOS DE TAIWÁN, POR TIPO, 2018-2032 (MILES DE USD)
TABLA 1192 PLÁSTICOS DE INGENIERÍA DE TAIWÁN EN EL MERCADO DE COMPUESTOS PLÁSTICOS, POR TIPO, 2018-2032 (MILES DE USD)
TABLA 1193 PLÁSTICOS TERMOENDURECIBLES DE TAIWÁN EN EL MERCADO DE COMPUESTOS DE PLÁSTICO, POR TIPO, 2018-2032 (MILES DE USD)
TABLA 1194 BIOPLÁSTICOS DE TAIWÁN EN EL MERCADO DE COMPUESTOS PLÁSTICOS, POR TIPO, 2018-2032 (MILES DE USD)
TABLA 1195 MERCADO DE COMPUESTOS PLÁSTICOS DE TAIWÁN, POR TIPO DE RELLENO, 2018-2032 (MILES DE USD)
TABLA 1196 RELLENOS MINERALES EN EL MERCADO DE COMPUESTOS PLÁSTICOS DE TAIWÁN, POR TIPO, 2018-2032 (MILES DE USD)
TABLA 1197 REFUERZOS EN EL MERCADO DE COMPUESTOS PLÁSTICOS DE TAIWÁN, POR TIPO, 2018-2032 (MILES DE USD)
TABLA 1198 ADITIVOS DE TAIWÁN EN EL MERCADO DE COMPUESTOS PLÁSTICOS, POR TIPO, 2018-2032 (MILES DE USD)
TABLA 1199 MERCADO DE COMPUESTOS PLÁSTICOS DE TAIWÁN, POR PROCESO DE FABRICACIÓN, 2018-2032 (MILES DE USD)
TABLA 1200 MERCADO DE COMPUESTOS PLÁSTICOS DE TAIWÁN, POR PROCESO DE FABRICACIÓN, 2018-2032 (KILOTONELADAS)
TABLA 1201 MERCADO DE EXTRUSIÓN DE COMPUESTOS PLÁSTICOS EN TAIWÁN, POR TIPO, 2018-2032 (MILES DE USD)
TABLA 1202 MERCADO DE EXTRUSIÓN DE PLÁSTICOS EN TAIWÁN, POR SISTEMA DE PELETIZACIÓN, 2018-2032 (MILES DE USD)
TABLA 1203 MERCADO DE COMPUESTOS DE PLÁSTICO BASADOS EN MOLDEO POR INYECCIÓN EN TAIWÁN, SEGÚN EL SISTEMA DE PELETIZACIÓN, 2018-2032 (MILES DE USD)
TABLA 1204 COMPACTACIÓN/PRESIONADO EN EL MERCADO DE COMPUESTOS DE PLÁSTICO EN TAIWÁN, POR SISTEMA DE PELETIZACIÓN, 2018-2032 (MILES DE USD)
TABLA 1205 AMASADAS/MEZCLAS BANBURY EN EL MERCADO DE COMPUESTOS DE PLÁSTICO DE TAIWÁN, POR SISTEMA DE PELETIZACIÓN, 2018-2032 (MILES DE USD)
TABLA 1206 MERCADO DE COMPUESTOS PLÁSTICOS DE TAIWÁN, POR PROPIEDADES, 2018-2032 (MILES DE USD)
TABLA 1207 MERCADO DE COMPUESTOS PLÁSTICOS DE TAIWÁN, POR APLICACIÓN, 2018-2032 (MILES DE USD)
TABLA 1208 MERCADO DE COMPUESTOS PLÁSTICOS DE TAIWÁN, POR APLICACIÓN, 2018-2032 (KILOTONELADAS)
TABLA 1209 MERCADO DE COMPUESTOS DE PLÁSTICO EN AUTOMÓVILES DE TAIWÁN, POR CATEGORÍA, 2018-2032 (MILES DE USD)
TABLA 1210 COMPONENTES DE INTERIOR DE TAIWÁN EN EL MERCADO DE COMPUESTOS PLÁSTICOS, POR TIPO, 2018-2032 (MILES DE USD)
TABLA 1211 PIEZAS DE CARROCERÍA EXTERIOR DE TAIWÁN EN EL MERCADO DE COMPUESTOS DE PLÁSTICO, POR TIPO, 2018-2032 (MILES DE USD)
TABLA 1212 APLICACIONES INTERNAS EN TAIWÁN EN EL MERCADO DE COMPUESTOS PLÁSTICOS, POR TIPO, 2018-2032 (MILES DE USD)
TABLA 1213 MERCADO DE ENVASES DE PLÁSTICO EN TAIWÁN, POR CATEGORÍA, 2018-2032 (MILES DE USD)
TABLA 1214 ENVASES DE ALIMENTOS Y BEBIDAS EN EL MERCADO DE COMPUESTOS DE PLÁSTICO DE TAIWÁN, POR TIPO, 2018-2032 (MILES DE USD)
TABLA 1215 MERCADO DE ENVASES INDUSTRIALES DE TAIWÁN EN LA FABRICACIÓN DE COMPUESTOS DE PLÁSTICO, POR TIPO, 2018-2032 (MILES DE USD)
TABLA 1216 ENVASES DE BIENES DE CONSUMO EN EL MERCADO DE COMPUESTOS PLÁSTICOS DE TAIWÁN, POR TIPO, 2018-2032 (MILES DE USD)
TABLA 1217 MERCADO DE CONSTRUCCIÓN Y EDIFICACIÓN DE PLÁSTICOS EN TAIWÁN, POR CATEGORÍA, 2018-2032 (MILES DE USD)
TABLA 1218 MERCADO DE PRODUCTOS ELÉCTRICOS Y ELECTRÓNICOS EN COMPUESTOS DE PLÁSTICO DE TAIWÁN, POR CATEGORÍA, 2018-2032 (MILES DE USD)
TABLA 1219 DISPOSITIVOS MÉDICOS EN EL MERCADO DE COMPUESTOS PLÁSTICOS DE TAIWÁN, POR CATEGORÍA, 2018-2032 (MILES DE USD)
TABLA 1220 MUEBLES DE TAIWÁN EN EL MERCADO DE COMPUESTOS DE PLÁSTICO, POR CATEGORÍA, 2018-2032 (MILES DE USD)
TABLA 1221 ENERGÍA Y PODER EN EL MERCADO DE COMPUESTOS DE PLÁSTICO DE TAIWÁN, POR CATEGORÍA, 2018-2032 (MILES DE USD)
TABLA 1222 MERCADO DE COMPUESTOS PLÁSTICOS DE LA INDUSTRIA AEROESPACIAL Y DE DEFENSA DE TAIWÁN, POR CATEGORÍA, 2018-2032 (MILES DE USD)
TABLA 1223 MERCADO DE COMPUESTOS PLÁSTICOS DE HONG KONG, POR TIPO DE POLÍMERO, 2018-2032 (MILES DE USD)
TABLA 1224 MERCADO DE COMPUESTOS PLÁSTICOS DE HONG KONG, POR TIPO DE POLÍMERO, 2018-2032 (KILOTONELADAS)
TABLA 1225 MERCADO DE TERMOPLÁSTICOS EN COMPUESTOS PLÁSTICOS DE HONG KONG, POR TIPO, 2018-2032 (MILES DE USD)
TABLA 1226 POLIETILENO (PE) EN EL MERCADO DE COMPUESTOS PLÁSTICOS DE HONG KONG, POR TIPO, 2018-2032 (MILES DE USD)
TABLA 1227 PLÁSTICOS DE INGENIERÍA EN EL MERCADO DE COMPUESTOS PLÁSTICOS DE HONG KONG, POR TIPO, 2018-2032 (MILES DE USD)
TABLA 1228 PLÁSTICOS TERMOENDURECIBLES DE HONG KONG EN EL MERCADO DE COMPUESTOS PLÁSTICOS, POR TIPO, 2018-2032 (MILES DE USD)
TABLA 1229 BIOPLÁSTICOS EN EL MERCADO DE COMPUESTOS PLÁSTICOS DE HONG KONG, POR TIPO, 2018-2032 (MILES DE USD)
TABLA 1230 MERCADO DE COMPUESTOS DE PLÁSTICO DE HONG KONG, POR TIPO DE RELLENO, 2018-2032 (MILES DE USD)
TABLA 1231 RELLENOS MINERALES EN EL MERCADO DE COMPUESTOS PLÁSTICOS DE HONG KONG, POR TIPO, 2018-2032 (MILES DE USD)
TABLA 1232 REFUERZOS EN EL MERCADO DE COMPUESTOS PLÁSTICOS DE HONG KONG, POR TIPO, 2018-2032 (MILES DE USD)
TABLA 1233 ADITIVOS DE HONG KONG EN EL MERCADO DE COMPUESTOS PLÁSTICOS, POR TIPO, 2018-2032 (MILES DE USD)
TABLA 1234 MERCADO DE COMPUESTOS DE PLÁSTICO DE HONG KONG, POR PROCESO DE FABRICACIÓN, 2018-2032 (MILES DE USD)
TABLA 1235 MERCADO DE COMPUESTOS DE PLÁSTICO DE HONG KONG, POR PROCESO DE FABRICACIÓN, 2018-2032 (KILOTONELADAS)
TABLA 1236 MERCADO DE EXTRUSIÓN DE COMPUESTOS PLÁSTICOS EN HONG KONG, POR TIPO, 2018-2032 (MILES DE USD)
TABLA 1237 MERCADO DE EXTRUSIÓN DE PLÁSTICOS EN HONG KONG, POR SISTEMA DE PELETIZACIÓN, 2018-2032 (MILES DE USD)
TABLA 1238 MERCADO DE COMPUESTOS DE PLÁSTICO BASADOS EN MOLDEO POR INYECCIÓN EN HONG KONG, SEGÚN EL SISTEMA DE PELETIZACIÓN, 2018-2032 (MILES DE USD)
TABLA 1239 COMPACTACIÓN/PRESIONADO EN EL MERCADO DE COMPUESTOS DE PLÁSTICO EN HONG KONG, POR SISTEMA DE PELETIZACIÓN, 2018-2032 (MILES DE USD)
TABLA 1240 AMASADORA DE HONG KONG/MEZCLA BANBURY EN EL MERCADO DE COMPUESTOS DE PLÁSTICO, POR SISTEMA DE PELETIZACIÓN, 2018-2032 (MILES DE USD)
TABLA 1241 MERCADO DE COMPUESTOS PLÁSTICOS DE HONG KONG, POR PROPIEDADES, 2018-2032 (MILES DE USD)
TABLA 1242 MERCADO DE COMPUESTOS PLÁSTICOS DE HONG KONG, POR APLICACIÓN, 2018-2032 (MILES DE USD)
TABLA 1243 MERCADO DE COMPUESTOS PLÁSTICOS DE HONG KONG, POR APLICACIÓN, 2018-2032 (KILOTONELADAS)
TABLA 1244 MERCADO DE COMPUESTOS DE PLÁSTICO EN AUTOMÓVILES DE HONG KONG, POR CATEGORÍA, 2018-2032 (MILES DE USD)
TABLA 1245 COMPONENTES DE INTERIOR DE HONG KONG EN EL MERCADO DE COMPUESTOS PLÁSTICOS, POR TIPO, 2018-2032 (MILES DE USD)
TABLA 1246 PIEZAS DE CARROCERÍA EXTERIOR DE HONG KONG EN EL MERCADO DE COMPUESTOS DE PLÁSTICO, POR TIPO, 2018-2032 (MILES DE USD)
TABLA 1247 APLICACIONES INTERNAS EN HONG KONG EN EL MERCADO DE COMPUESTOS PLÁSTICOS, POR TIPO, 2018-2032 (MILES DE USD)
TABLA 1248 MERCADO DE ENVASES DE PLÁSTICO EN HONG KONG, POR CATEGORÍA, 2018-2032 (MILES DE USD)
TABLA 1249 ENVASES DE ALIMENTOS Y BEBIDAS EN EL MERCADO DE COMPUESTOS DE PLÁSTICO DE HONG KONG, POR TIPO, 2018-2032 (MILES DE USD)
TABLA 1250 MERCADO DE ENVASES INDUSTRIALES DE HONG KONG EN COMPUESTOS DE PLÁSTICO, POR TIPO, 2018-2032 (MILES DE USD)
TABLA 1251 ENVASES DE BIENES DE CONSUMO EN EL MERCADO DE COMPUESTOS PLÁSTICOS DE HONG KONG, POR TIPO, 2018-2032 (MILES DE USD)
TABLA 1252 MERCADO DE CONSTRUCCIÓN Y EDIFICACIÓN DE COMPUESTOS PLÁSTICOS EN HONG KONG, POR CATEGORÍA, 2018-2032 (MILES DE USD)
TABLA 1253 MERCADO DE PRODUCTOS ELÉCTRICOS Y ELECTRÓNICOS EN COMPUESTOS DE PLÁSTICO EN HONG KONG, POR CATEGORÍA, 2018-2032 (MILES DE USD)
TABLA 1254 DISPOSITIVOS MÉDICOS EN EL MERCADO DE COMPUESTOS PLÁSTICOS DE HONG KONG, POR CATEGORÍA, 2018-2032 (MILES DE USD)
TABLA 1255 MUEBLES DE HONG KONG EN EL MERCADO DE COMPUESTOS DE PLÁSTICO, POR CATEGORÍA, 2018-2032 (MILES DE USD)
TABLA 1256 MERCADO DE ENERGÍA Y ELECTRICIDAD EN HONG KONG, POR CATEGORÍA, 2018-2032 (MILES DE USD)
TABLA 1257 MERCADO DE COMPUESTOS PLÁSTICOS DE LA INDUSTRIA AEROESPACIAL Y DE DEFENSA DE HONG KONG, POR CATEGORÍA, 2018-2032 (MILES DE USD)
TABLA 1258 RESTO DEL MERCADO DE COMPUESTOS PLÁSTICOS DE ASIA-PACÍFICO, POR TIPO DE POLÍMERO, 2018-2032 (MILES DE USD)
TABLA 1259 RESTO DEL MERCADO DE COMPUESTOS PLÁSTICOS DE ASIA-PACÍFICO, POR TIPO DE POLÍMERO, 2018-2032 (KILOTONELADAS)
TABLA 1260 MERCADO DE COMPUESTOS PLÁSTICOS DE ORIENTE MEDIO Y ÁFRICA, POR PAÍS, 2018-2032 (MILES DE USD)
TABLA 1261 MERCADO DE COMPUESTOS PLÁSTICOS DE ORIENTE MEDIO Y ÁFRICA, POR PAÍS, 2018-2032 (KILOTONELADAS)
TABLA 1262 MERCADO DE COMPUESTOS PLÁSTICOS DE ORIENTE MEDIO Y ÁFRICA, POR TIPO DE POLÍMERO, 2018-2032 (MILES DE USD)
TABLA 1263 MERCADO DE COMPUESTOS PLÁSTICOS DE ORIENTE MEDIO Y ÁFRICA, POR TIPO DE POLÍMERO, 2018-2032 (KILOTONELADAS)
TABLA 1264 MERCADO DE TERMOPLÁSTICOS EN COMPUESTOS PLÁSTICOS DE ORIENTE MEDIO Y ÁFRICA, POR TIPO, 2018-2032 (MILES DE USD)
TABLA 1265 MERCADO DE POLIETILENO (PE) EN COMPUESTOS PLÁSTICOS DE ORIENTE MEDIO Y ÁFRICA, POR TIPO, 2018-2032 (MILES DE USD)
TABLA 1266 ORIENTE MEDIO Y ÁFRICA PLÁSTICOS DE INGENIERÍA EN EL MERCADO DE COMPUESTOS PLÁSTICOS, POR TIPO, 2018-2032 (MILES DE USD)
TABLA 1267 ORIENTE MEDIO Y ÁFRICA PLÁSTICOS TERMOENDURECIBLES EN EL MERCADO DE COMPUESTOS PLÁSTICOS, POR TIPO, 2018-2032 (MILES DE USD)
TABLA 1268 MERCADO DE BIOPLÁSTICOS EN COMPUESTOS PLÁSTICOS DE ORIENTE MEDIO Y ÁFRICA, POR TIPO, 2018-2032 (MILES DE USD)
TABLA 1269 MERCADO DE COMPUESTOS PLÁSTICOS DE ORIENTE MEDIO Y ÁFRICA, POR TIPO DE RELLENO, 2018-2032 (MILES DE USD)
TABLA 1270 ORIENTE MEDIO Y ÁFRICA RELLENOS MINERALES EN EL MERCADO DE COMPUESTOS PLÁSTICOS, POR TIPO, 2018-2032 (MILES DE USD)
TABLA 1271 ORIENTE MEDIO Y ÁFRICA REFUERZOS EN EL MERCADO DE COMPUESTOS PLÁSTICOS, POR TIPO, 2018-2032 (MILES DE USD)
TABLA 1272 ADITIVOS EN EL MERCADO DE COMPUESTOS PLÁSTICOS DE ORIENTE MEDIO Y ÁFRICA, POR TIPO, 2018-2032 (MILES DE USD)
TABLA 1273 MERCADO DE COMPUESTOS PLÁSTICOS DE ORIENTE MEDIO Y ÁFRICA, POR PROCESO DE FABRICACIÓN, 2018-2032 (MILES DE USD)
TABLA 1274 MERCADO DE COMPUESTOS PLÁSTICOS DE ORIENTE MEDIO Y ÁFRICA, POR PROCESO DE FABRICACIÓN, 2018-2032 (KILOTONELADAS)
TABLA 1275 MERCADO DE EXTRUSIÓN DE COMPUESTOS PLÁSTICOS EN ORIENTE MEDIO Y ÁFRICA, POR TIPO, 2018-2032 (MILES DE USD)
TABLA 1276 MERCADO DE EXTRUSIÓN DE COMPUESTOS DE PLÁSTICO EN ORIENTE MEDIO Y ÁFRICA, POR SISTEMA DE PELETIZACIÓN, 2018-2032 (MILES DE USD)
TABLA 1277 ORIENTE MEDIO Y ÁFRICA MERCADO DE COMPUESTOS DE PLÁSTICO BASADOS EN MOLDEO POR INYECCIÓN, POR SISTEMA DE PELETIZACIÓN, 2018-2032 (MILES DE USD)
TABLA 1278 ORIENTE MEDIO Y ÁFRICA COMPACTACIÓN/PRESIONADO EN EL MERCADO DE COMPUESTOS DE PLÁSTICO, POR SISTEMA DE PELETIZACIÓN, 2018-2032 (MILES DE USD)
TABLA 1279 ORIENTE MEDIO Y ÁFRICA MERCADO DE MEZCLA DE AMASADORAS/BANBURY EN COMPUESTOS DE PLÁSTICO, POR SISTEMA DE PELETIZACIÓN, 2018-2032 (MILES DE USD)
TABLA 1280 MERCADO DE COMPUESTOS PLÁSTICOS DE ORIENTE MEDIO Y ÁFRICA, POR PROPIEDADES, 2018-2032 (MILES DE USD)
TABLA 1281 MERCADO DE COMPUESTOS PLÁSTICOS DE ORIENTE MEDIO Y ÁFRICA, POR APLICACIÓN, 2018-2032 (MILES DE USD)
TABLA 1282 MERCADO DE COMPUESTOS PLÁSTICOS DE ORIENTE MEDIO Y ÁFRICA, POR APLICACIÓN, 2018-2032 (KILOTONELADAS)
TABLA 1283 MERCADO DE COMPUESTOS DE PLÁSTICO PARA AUTOMÓVILES EN ORIENTE MEDIO Y ÁFRICA, POR CATEGORÍA, 2018-2032 (MILES DE USD)
TABLA 1284 COMPONENTES INTERIORES DEL MERCADO DE COMPUESTOS PLÁSTICOS DE ORIENTE MEDIO Y ÁFRICA, POR TIPO, 2018-2032 (MILES DE USD)
TABLA 1285 ORIENTE MEDIO Y ÁFRICA: PIEZAS DE CARROCERÍA EXTERIOR EN EL MERCADO DE COMPUESTOS PLÁSTICOS, POR TIPO, 2018-2032 (MILES DE USD)
TABLA 1286 APLICACIONES INTERNAS EN EL MERCADO DE COMPUESTOS PLÁSTICOS DE ORIENTE MEDIO Y ÁFRICA, POR TIPO, 2018-2032 (MILES DE USD)
TABLA 1287 MERCADO DE ENVASES DE PLÁSTICO PARA COMPUESTOS EN ORIENTE MEDIO Y ÁFRICA, POR CATEGORÍA, 2018-2032 (MILES DE USD)
TABLA 1288 MERCADO DE ENVASES DE ALIMENTOS Y BEBIDAS EN COMPUESTOS DE PLÁSTICO DE ORIENTE MEDIO Y ÁFRICA, POR TIPO, 2018-2032 (MILES DE USD)
TABLA 1289 MERCADO DE ENVASES INDUSTRIALES DE COMPUESTOS PLÁSTICOS DE ORIENTE MEDIO Y ÁFRICA, POR TIPO, 2018-2032 (MILES DE USD)
TABLA 1290 MERCADO DE ENVASES DE BIENES DE CONSUMO EN COMPUESTOS DE PLÁSTICO DE ORIENTE MEDIO Y ÁFRICA, POR TIPO, 2018-2032 (MILES DE USD)
TABLA 1291 MERCADO DE CONSTRUCCIÓN Y EDIFICACIÓN DE COMPUESTOS PLÁSTICOS EN ORIENTE MEDIO Y ÁFRICA, POR CATEGORÍA, 2018-2032 (MILES DE USD)
TABLA 1292 MERCADO DE PRODUCTOS ELÉCTRICOS Y ELECTRÓNICOS EN COMPUESTOS DE PLÁSTICO DE ORIENTE MEDIO Y ÁFRICA, POR CATEGORÍA, 2018-2032 (MILES DE USD)
TABLA 1293 ORIENTE MEDIO Y ÁFRICA MERCADO DE DISPOSITIVOS MÉDICOS EN COMPUESTOS DE PLÁSTICO, POR CATEGORÍA, 2018-2032 (MILES DE USD)
TABLA 1294 MERCADO DE MUEBLES DE COMPUESTOS PLÁSTICOS DE ORIENTE MEDIO Y ÁFRICA, POR CATEGORÍA, 2018-2032 (MILES DE USD)
TABLA 1295 ORIENTE MEDIO Y ÁFRICA MERCADO DE ENERGÍA Y ELECTRICIDAD EN COMPUESTOS DE PLÁSTICO, POR CATEGORÍA, 2018-2032 (MILES DE USD)
TABLA 1296 MERCADO DE COMPUESTOS PLÁSTICOS DE LA INDUSTRIA AEROESPACIAL Y DE DEFENSA DE ORIENTE MEDIO Y ÁFRICA, POR CATEGORÍA, 2018-2032 (MILES DE USD)
TABLA 1297 MERCADO DE COMPUESTOS PLÁSTICOS DE ARABIA SAUDITA, POR TIPO DE POLÍMERO, 2018-2032 (MILES DE USD)
TABLA 1298 MERCADO DE COMPUESTOS PLÁSTICOS DE ARABIA SAUDITA, POR TIPO DE POLÍMERO, 2018-2032 (KILOTONELADAS)
TABLA 1299 MERCADO DE TERMOPLÁSTICOS EN COMPUESTOS PLÁSTICOS DE ARABIA SAUDITA, POR TIPO, 2018-2032 (MILES DE USD)
TABLA 1300 MERCADO DE POLIETILENO (PE) EN COMPUESTOS PLÁSTICOS DE ARABIA SAUDITA, POR TIPO, 2018-2032 (MILES DE USD)
TABLA 1301 PLÁSTICOS DE INGENIERÍA EN EL MERCADO DE COMPUESTOS PLÁSTICOS DE ARABIA SAUDITA, POR TIPO, 2018-2032 (MILES DE USD)
TABLA 1302 PLÁSTICOS TERMOENDURECIBLES EN EL MERCADO DE COMPUESTOS DE PLÁSTICO DE ARABIA SAUDITA, POR TIPO, 2018-2032 (MILES DE USD)
TABLA 1303 BIOPLÁSTICOS EN EL MERCADO DE COMPUESTOS PLÁSTICOS DE ARABIA SAUDITA, POR TIPO, 2018-2032 (MILES DE USD)
TABLA 1304 MERCADO DE COMPUESTOS PLÁSTICOS DE ARABIA SAUDITA, POR TIPO DE RELLENO, 2018-2032 (MILES DE USD)
TABLA 1305 ARABIA SAUDITA: RELLENOS MINERALES EN EL MERCADO DE COMPUESTOS PLÁSTICOS, POR TIPO, 2018-2032 (MILES DE USD)
TABLA 1306 ARABIA SAUDITA: MERCADO DE REFUERZOS EN COMPUESTOS PLÁSTICOS, POR TIPO, 2018-2032 (MILES DE USD)
TABLA 1307 ADITIVOS EN EL MERCADO DE COMPUESTOS PLÁSTICOS DE ARABIA SAUDITA, POR TIPO, 2018-2032 (MILES DE USD)
TABLA 1308 MERCADO DE COMPUESTOS PLÁSTICOS DE ARABIA SAUDITA, POR PROCESO DE FABRICACIÓN, 2018-2032 (MILES DE USD)
TABLA 1309 MERCADO DE COMPUESTOS PLÁSTICOS DE ARABIA SAUDITA, POR PROCESO DE FABRICACIÓN, 2018-2032 (KILOTONELADAS)
TABLA 1310 MERCADO DE EXTRUSIÓN DE COMPUESTOS PLÁSTICOS EN ARABIA SAUDITA, POR TIPO, 2018-2032 (MILES DE USD)
TABLA 1311 MERCADO DE EXTRUSIÓN DE PLÁSTICOS COMPUESTOS EN ARABIA SAUDITA, POR SISTEMA DE PELETIZACIÓN, 2018-2032 (MILES DE USD)
TABLA 1312 ARABIA SAUDITA, MERCADO DE COMPUESTOS DE PLÁSTICO BASADOS EN MOLDEO POR INYECCIÓN, POR SISTEMA DE PELETIZACIÓN, 2018-2032 (MILES DE USD)
TABLA 1313 COMPACTACIÓN/PRESIONADO EN EL MERCADO DE COMPUESTOS DE PLÁSTICO EN ARABIA SAUDITA, POR SISTEMA DE PELETIZACIÓN, 2018-2032 (MILES DE USD)
TABLA 1314 ARABIA SAUDITA: MERCADO DE MEZCLA DE AMASADAS/BANBURY EN LA FABRICACIÓN DE COMPUESTOS DE PLÁSTICO, POR SISTEMA DE PELETIZACIÓN, 2018-2032 (MILES DE USD)
TABLA 1315 MERCADO DE COMPUESTOS PLÁSTICOS DE ARABIA SAUDITA, POR PROPIEDADES, 2018-2032 (MILES DE USD)
TABLA 1316 MERCADO DE COMPUESTOS PLÁSTICOS DE ARABIA SAUDITA, POR APLICACIÓN, 2018-2032 (MILES DE USD)
TABLA 1317 MERCADO DE COMPUESTOS PLÁSTICOS DE ARABIA SAUDITA, POR APLICACIÓN, 2018-2032 (KILOTONELADAS)
TABLA 1318 MERCADO DE COMPUESTOS DE PLÁSTICO EN LA INDUSTRIA AUTOMOTRIZ DE ARABIA SAUDITA, POR CATEGORÍA, 2018-2032 (MILES DE USD)
TABLA 1319 COMPONENTES DE INTERIOR EN EL MERCADO DE COMPUESTOS PLÁSTICOS DE ARABIA SAUDITA, POR TIPO, 2018-2032 (MILES DE USD)
TABLA 1320 ARABIA SAUDITA: PIEZAS DE CARROCERÍA EXTERIOR EN EL MERCADO DE COMPUESTOS DE PLÁSTICO, POR TIPO, 2018-2032 (MILES DE USD)
TABLA 1321 APLICACIONES INTERNAS EN ARABIA SAUDITA EN EL MERCADO DE COMPUESTOS PLÁSTICOS, POR TIPO, 2018-2032 (MILES DE USD)
TABLA 1322 MERCADO DE ENVASES DE PLÁSTICO EN ARABIA SAUDITA, POR CATEGORÍA, 2018-2032 (MILES DE USD)
TABLA 1323 ARABIA SAUDITA: MERCADO DE ENVASES DE ALIMENTOS Y BEBIDAS EN COMPUESTOS DE PLÁSTICO, POR TIPO, 2018-2032 (MILES DE USD)
TABLA 1324 MERCADO DE ENVASES INDUSTRIALES DE ARABIA SAUDITA EN COMPUESTOS DE PLÁSTICO, POR TIPO, 2018-2032 (MILES DE USD)
TABLA 1325 ARABIA SAUDITA: MERCADO DE ENVASES DE BIENES DE CONSUMO EN COMPUESTOS DE PLÁSTICO, POR TIPO, 2018-2032 (MILES DE USD)
TABLA 1326 ARABIA SAUDITA: MERCADO DE CONSTRUCCIÓN Y EDIFICACIÓN DE COMPUESTOS DE PLÁSTICO, POR CATEGORÍA, 2018-2032 (MILES DE USD)
TABLA 1327 MERCADO DE PRODUCTOS ELÉCTRICOS Y ELECTRÓNICOS EN COMPUESTOS DE PLÁSTICO DE ARABIA SAUDITA, POR CATEGORÍA, 2018-2032 (MILES DE USD)
TABLA 1328 DISPOSITIVOS MÉDICOS EN EL MERCADO DE COMPUESTOS PLÁSTICOS DE ARABIA SAUDITA, POR CATEGORÍA, 2018-2032 (MILES DE USD)
TABLA 1329 MERCADO DE MUEBLES DE ARABIA SAUDITA EN COMPUESTOS DE PLÁSTICO, POR CATEGORÍA, 2018-2032 (MILES DE USD)
TABLA 1330 ARABIA SAUDITA: MERCADO DE ENERGÍA Y ELECTRICIDAD EN COMPUESTOS DE PLÁSTICO, POR CATEGORÍA, 2018-2032 (MILES DE USD)
TABLA 1331 ARABIA SAUDITA: MERCADO DE COMPUESTOS PLÁSTICOS EN LA AEROESPACIAL Y DEFENSA, POR CATEGORÍA, 2018-2032 (MILES DE USD)
TABLA 1332 MERCADO DE COMPUESTOS PLÁSTICOS DE EGIPTO, POR TIPO DE POLÍMERO, 2018-2032 (MILES DE USD)
TABLA 1333 MERCADO DE COMPUESTOS PLÁSTICOS DE EGIPTO, POR TIPO DE POLÍMERO, 2018-2032 (KILOTONELADAS)
TABLA 1334 EGIPTO TERMOPLÁSTICOS EN EL MERCADO DE COMPUESTOS PLÁSTICOS, POR TIPO, 2018-2032 (MILES DE USD)
TABLA 1335 EGIPTO: MERCADO DE POLIETILENO (PE) EN COMPUESTOS PLÁSTICOS, POR TIPO, 2018-2032 (MILES DE USD)
TABLA 1336 EGIPTO PLÁSTICOS DE INGENIERÍA EN EL MERCADO DE COMPUESTOS PLÁSTICOS, POR TIPO, 2018-2032 (MILES DE USD)
TABLA 1337 EGIPTO PLÁSTICOS TERMOENDURECIBLES EN EL MERCADO DE COMPUESTOS DE PLÁSTICO, POR TIPO, 2018-2032 (MILES DE USD)
TABLA 1338 EGIPTO BIOPLÁSTICOS EN EL MERCADO DE COMPUESTOS PLÁSTICOS, POR TIPO, 2018-2032 (MILES DE USD)
TABLA 1339 MERCADO DE COMPUESTOS PLÁSTICOS DE EGIPTO, POR TIPO DE RELLENO, 2018-2032 (MILES DE USD)
TABLA 1340 RELLENOS MINERALES EN EL MERCADO DE COMPUESTOS PLÁSTICOS DE EGIPTO, POR TIPO, 2018-2032 (MILES DE USD)
TABLA 1341 EGIPTO: REFUERZOS EN EL MERCADO DE COMPUESTOS PLÁSTICOS, POR TIPO, 2018-2032 (MILES DE USD)
TABLA 1342 ADITIVOS EN EL MERCADO DE COMPUESTOS PLÁSTICOS DE EGIPTO, POR TIPO, 2018-2032 (MILES DE USD)
TABLA 1343 MERCADO DE COMPUESTOS DE PLÁSTICO DE EGIPTO, POR PROCESO DE FABRICACIÓN, 2018-2032 (MILES DE USD)
TABLA 1344 MERCADO DE COMPUESTOS PLÁSTICOS DE EGIPTO, POR PROCESO DE FABRICACIÓN, 2018-2032 (KILOTONELADAS)
TABLA 1345 EGIPTO MERCADO DE EXTRUSIÓN DE COMPUESTOS PLÁSTICOS, POR TIPO, 2018-2032 (MILES DE USD)
TABLA 1346 EGIPTO EXTRUSIÓN EN EL MERCADO DE COMPUESTOS DE PLÁSTICO, POR SISTEMA DE PELETIZACIÓN, 2018-2032 (MILES DE USD)
TABLA 1347 EGIPTO, MERCADO DE COMPUESTOS DE PLÁSTICO BASADOS EN MOLDEO POR INYECCIÓN, POR SISTEMA DE PELETIZACIÓN, 2018-2032 (MILES DE USD)
TABLA 1348 COMPACTACIÓN/PRESIONADO EN EGIPTO EN EL MERCADO DE COMPUESTOS DE PLÁSTICO, POR SISTEMA DE PELETIZACIÓN, 2018-2032 (MILES DE USD)
TABLA 1349 AMASADAS/MEZCLAS BANBURY EN EL MERCADO DE COMPUESTOS DE PLÁSTICO, POR SISTEMA DE PELETIZACIÓN, 2018-2032 (MILES DE USD)
TABLA 1350 MERCADO DE COMPUESTOS PLÁSTICOS DE EGIPTO, POR PROPIEDADES, 2018-2032 (MILES DE USD)
TABLA 1351 MERCADO DE COMPUESTOS PLÁSTICOS DE EGIPTO, POR APLICACIÓN, 2018-2032 (MILES DE USD)
TABLA 1352 MERCADO DE COMPUESTOS PLÁSTICOS DE EGIPTO, POR APLICACIÓN, 2018-2032 (KILOTONELADAS)
TABLA 1353 MERCADO DE COMPUESTOS DE PLÁSTICO EN AUTOMÓVILES DE EGIPTO, POR CATEGORÍA, 2018-2032 (MILES DE USD)
TABLA 1354 COMPONENTES DE INTERIOR DE EGIPTO EN EL MERCADO DE COMPUESTOS PLÁSTICOS, POR TIPO, 2018-2032 (MILES DE USD)
TABLA 1355 EGIPTO: PIEZAS DE CARROCERÍA EXTERIOR EN EL MERCADO DE COMPUESTOS PLÁSTICOS, POR TIPO, 2018-2032 (MILES DE USD)
TABLA 1356 APLICACIONES INTERNAS EN EGIPTO EN EL MERCADO DE COMPUESTOS PLÁSTICOS, POR TIPO, 2018-2032 (MILES DE USD)
TABLA 1357 EGIPTO MERCADO DE ENVASES DE PLÁSTICO, POR CATEGORÍA, 2018-2032 (MILES DE USD)
TABLA 1358 EGIPTO: ENVASES DE ALIMENTOS Y BEBIDAS EN EL MERCADO DE COMPUESTOS DE PLÁSTICO, POR TIPO, 2018-2032 (MILES DE USD)
TABLA 1359 EGIPTO MERCADO DE ENVASES INDUSTRIALES EN COMPUESTOS DE PLÁSTICO, POR TIPO, 2018-2032 (MILES DE USD)
TABLA 1360 EGIPTO MERCADO DE ENVASES DE BIENES DE CONSUMO EN COMPUESTOS DE PLÁSTICO, POR TIPO, 2018-2032 (MILES DE USD)
TABLA 1361 EGIPTO: MERCADO DE CONSTRUCCIÓN Y EDIFICACIÓN DE COMPUESTOS PLÁSTICOS, POR CATEGORÍA, 2018-2032 (MILES DE USD)
TABLA 1362 MERCADO DE PRODUCTOS ELÉCTRICOS Y ELECTRÓNICOS EN COMPUESTOS DE PLÁSTICO EN EGIPTO, POR CATEGORÍA, 2018-2032 (MILES DE USD)
TABLA 1363 DISPOSITIVOS MÉDICOS EN EL MERCADO DE COMPUESTOS DE PLÁSTICO EN EGIPTO, POR CATEGORÍA, 2018-2032 (MILES DE USD)
TABLA 1364 MUEBLES DE EGIPTO EN EL MERCADO DE COMPUESTOS DE PLÁSTICO, POR CATEGORÍA, 2018-2032 (MILES DE USD)
TABLA 1365 EGIPTO ENERGÍA Y ELECTRICIDAD EN EL MERCADO DE COMPUESTOS DE PLÁSTICO, POR CATEGORÍA, 2018-2032 (MILES DE USD)
TABLA 1366 EGIPTO AEROESPACIAL Y DEFENSA EN EL MERCADO DE COMPUESTOS PLÁSTICOS, POR CATEGORÍA, 2018-2032 (MILES DE USD)
TABLA 1367 MERCADO DE COMPUESTOS PLÁSTICOS DE LOS EAU, POR TIPO DE POLÍMERO, 2018-2032 (MILES DE USD)
TABLA 1368 MERCADO DE COMPUESTOS PLÁSTICOS DE LOS EAU, POR TIPO DE POLÍMERO, 2018-2032 (KILOTONELADAS)
TABLA 1369 MERCADO DE TERMOPLÁSTICOS EN COMPUESTOS PLÁSTICOS DE LOS EAU, POR TIPO, 2018-2032 (MILES DE USD)
TABLA 1370 MERCADO DE POLIETILENO (PE) EN COMPUESTOS PLÁSTICOS DE LOS EAU, POR TIPO, 2018-2032 (MILES DE USD)
TABLA 1371 PLÁSTICOS DE INGENIERÍA EN EL MERCADO DE COMPUESTOS PLÁSTICOS DE LOS EAU, POR TIPO, 2018-2032 (MILES DE USD)
TABLA 1372 PLÁSTICOS TERMOENDURECIBLES EN EL MERCADO DE COMPUESTOS DE PLÁSTICO DE LOS EAU, POR TIPO, 2018-2032 (MILES DE USD)
TABLA 1373 BIOPLÁSTICOS EN EL MERCADO DE COMPUESTOS PLÁSTICOS DE LOS EAU, POR TIPO, 2018-2032 (MILES DE USD)
TABLA 1374 MERCADO DE COMPUESTOS DE PLÁSTICO DE LOS EAU, POR TIPO DE RELLENO, 2018-2032 (MILES DE USD)
TABLA 1375 RELLENOS MINERALES EN EL MERCADO DE COMPUESTOS PLÁSTICOS DE LOS EAU, POR TIPO, 2018-2032 (MILES DE USD)
TABLA 1376 REFUERZOS EN EL MERCADO DE COMPUESTOS PLÁSTICOS DE LOS EAU, POR TIPO, 2018-2032 (MILES DE USD)
TABLA 1377 ADITIVOS DE LOS EAU EN EL MERCADO DE COMPUESTOS PLÁSTICOS, POR TIPO, 2018-2032 (MILES DE USD)
TABLA 1378 MERCADO DE COMPUESTOS DE PLÁSTICO DE LOS EAU, POR PROCESO DE FABRICACIÓN, 2018-2032 (MILES DE USD)
TABLA 1379 MERCADO DE COMPUESTOS DE PLÁSTICO DE LOS EAU, POR PROCESO DE FABRICACIÓN, 2018-2032 (KILOTONELADAS)
TABLA 1380 MERCADO DE EXTRUSIÓN DE COMPUESTOS PLÁSTICOS EN LOS EAU, POR TIPO, 2018-2032 (MILES DE USD)
TABLA 1381 MERCADO DE EXTRUSIÓN DE PLÁSTICOS COMPUESTOS EN LOS EAU, POR SISTEMA DE PELETIZACIÓN, 2018-2032 (MILES DE USD)
TABLA 1382 MERCADO DE COMPUESTOS DE PLÁSTICO BASADOS EN MOLDEO POR INYECCIÓN EN LOS EAU, POR SISTEMA DE PELETIZACIÓN, 2018-2032 (MILES DE USD)
TABLA 1383 COMPACTACIÓN/PRESIONADO EN EL MERCADO DE COMPUESTOS DE PLÁSTICO EN LOS EAU, POR SISTEMA DE PELETIZACIÓN, 2018-2032 (MILES DE USD)
TABLA 1384 MERCADO DE MEZCLA DE AMASADORAS/BANBURY EN LA FABRICACIÓN DE COMPUESTOS DE PLÁSTICO, POR SISTEMA DE PELETIZACIÓN, 2018-2032 (MILES DE USD)
TABLA 1385 MERCADO DE COMPUESTOS PLÁSTICOS DE LOS EAU, POR PROPIEDADES, 2018-2032 (MILES DE USD)
TABLA 1386 MERCADO DE COMPUESTOS PLÁSTICOS DE LOS EAU, POR APLICACIÓN, 2018-2032 (MILES DE USD)
TABLA 1387 MERCADO DE COMPUESTOS PLÁSTICOS DE LOS EAU, POR APLICACIÓN, 2018-2032 (KILOTONELADAS)
TABLA 1388 MERCADO DE COMPUESTOS DE PLÁSTICO EN AUTOMOCIÓN DE LOS EAU, POR CATEGORÍA, 2018-2032 (MILES DE USD)
TABLA 1389 COMPONENTES DE INTERIOR EN EL MERCADO DE COMPUESTOS PLÁSTICOS DE LOS EAU, POR TIPO, 2018-2032 (MILES DE USD)
TABLA 1390 PIEZAS DE CARROCERÍA EXTERIOR EN EL MERCADO DE COMPUESTOS DE PLÁSTICO DE LOS EAU, POR TIPO, 2018-2032 (MILES DE USD)
TABLA 1391 APLICACIONES INTERNAS EN EL MERCADO DE COMPUESTOS PLÁSTICOS DE LOS EAU, POR TIPO, 2018-2032 (MILES DE USD)
TABLA 1392 MERCADO DE ENVASES DE PLÁSTICO EN LOS EMIRATOS ÁRABES UNIDOS, POR CATEGORÍA, 2018-2032 (MILES DE USD)
TABLA 1393 MERCADO DE ENVASES DE ALIMENTOS Y BEBIDAS EN COMPUESTOS DE PLÁSTICO DE LOS EAU, POR TIPO, 2018-2032 (MILES DE USD)
TABLA 1394 MERCADO DE ENVASES INDUSTRIALES DE COMPUESTOS PLÁSTICOS DE LOS EAU, POR TIPO, 2018-2032 (MILES DE USD)
TABLA 1395 ENVASES DE BIENES DE CONSUMO EN EL MERCADO DE COMPUESTOS PLÁSTICOS DE LOS EAU, POR TIPO, 2018-2032 (MILES DE USD)
TABLA 1396 MERCADO DE CONSTRUCCIÓN Y EDIFICACIÓN DE COMPUESTOS DE PLÁSTICO EN LOS EAU, POR CATEGORÍA, 2018-2032 (MILES DE USD)
TABLA 1397 MERCADO DE PRODUCTOS ELÉCTRICOS Y ELECTRÓNICOS EN COMPUESTOS DE PLÁSTICO DE LOS EAU, POR CATEGORÍA, 2018-2032 (MILES DE USD)
TABLA 1398 DISPOSITIVOS MÉDICOS EN EL MERCADO DE COMPUESTOS DE PLÁSTICO DE LOS EAU, POR CATEGORÍA, 2018-2032 (MILES DE USD)
TABLA 1399 MERCADO DE MUEBLES DE PLÁSTICO EN LOS EMIRATOS ÁRABES UNIDOS, POR CATEGORÍA, 2018-2032 (MILES DE USD)
TABLA 1400 MERCADO DE ENERGÍA Y ELECTRICIDAD EN COMPUESTOS DE PLÁSTICO DE LOS EAU, POR CATEGORÍA, 2018-2032 (MILES DE USD)
TABLA 1401 MERCADO DE COMPUESTOS PLÁSTICOS DE LA INDUSTRIA AEROESPACIAL Y DE DEFENSA DE LOS EAU, POR CATEGORÍA, 2018-2032 (MILES DE USD)
TABLA 1402 MERCADO DE COMPUESTOS PLÁSTICOS DE SUDÁFRICA, POR TIPO DE POLÍMERO, 2018-2032 (MILES DE USD)
TABLA 1403 MERCADO DE COMPUESTOS PLÁSTICOS DE SUDÁFRICA, POR TIPO DE POLÍMERO, 2018-2032 (KILOTONELADAS)
TABLA 1404 MERCADO DE TERMOPLÁSTICOS EN COMPUESTOS PLÁSTICOS DE SUDÁFRICA, POR TIPO, 2018-2032 (MILES DE USD)
TABLA 1405 MERCADO DE POLIETILENO (PE) EN COMPUESTOS PLÁSTICOS DE SUDÁFRICA, POR TIPO, 2018-2032 (MILES DE USD)
TABLA 1406 PLÁSTICOS DE INGENIERÍA EN EL MERCADO DE COMPUESTOS PLÁSTICOS DE SUDÁFRICA, POR TIPO, 2018-2032 (MILES DE USD)
TABLA 1407 PLÁSTICOS TERMOENDURECIBLES EN EL MERCADO DE COMPUESTOS DE PLÁSTICO DE SUDÁFRICA, POR TIPO, 2018-2032 (MILES DE USD)
TABLA 1408 BIOPLÁSTICOS EN EL MERCADO DE COMPUESTOS PLÁSTICOS DE SUDÁFRICA, POR TIPO, 2018-2032 (MILES DE USD)
TABLA 1409 MERCADO DE COMPUESTOS PLÁSTICOS DE SUDÁFRICA, POR TIPO DE RELLENO, 2018-2032 (MILES DE USD)
TABLA 1410 RELLENOS MINERALES EN EL MERCADO DE COMPUESTOS PLÁSTICOS DE SUDÁFRICA, POR TIPO, 2018-2032 (MILES DE USD)
TABLA 1411 MERCADO DE REFUERZOS DE SUDÁFRICA EN COMPUESTOS PLÁSTICOS, POR TIPO, 2018-2032 (MILES DE USD)
TABLA 1412 ADITIVOS EN EL MERCADO DE COMPUESTOS PLÁSTICOS DE SUDÁFRICA, POR TIPO, 2018-2032 (MILES DE USD)
TABLA 1413 MERCADO DE COMPUESTOS PLÁSTICOS DE SUDÁFRICA, POR PROCESO DE FABRICACIÓN, 2018-2032 (MILES DE USD)
TABLA 1414 MERCADO DE COMPUESTOS PLÁSTICOS DE SUDÁFRICA, POR PROCESO DE FABRICACIÓN, 2018-2032 (KILOTONELADAS)
TABLA 1415 MERCADO DE EXTRUSIÓN DE COMPUESTOS PLÁSTICOS EN SUDÁFRICA, POR TIPO, 2018-2032 (MILES DE USD)
TABLA 1416 MERCADO DE EXTRUSIÓN DE PLÁSTICOS EN SUDÁFRICA, POR SISTEMA DE PELETIZACIÓN, 2018-2032 (MILES DE USD)
TABLA 1417 MERCADO DE COMPUESTOS DE PLÁSTICO BASADOS EN MOLDEO POR INYECCIÓN EN SUDÁFRICA, POR SISTEMA DE PELETIZACIÓN, 2018-2032 (MILES DE USD)
TABLA 1418 COMPACTACIÓN/PRESIONADO EN EL MERCADO DE COMPUESTOS DE PLÁSTICO EN SUDÁFRICA, POR SISTEMA DE PELETIZACIÓN, 2018-2032 (MILES DE USD)
TABLA 1419 MERCADO DE MEZCLA DE AMASADORAS/BANBURY EN LA FABRICACIÓN DE COMPUESTOS DE PLÁSTICO EN SUDÁFRICA, POR SISTEMA DE PELETIZACIÓN, 2018-2032 (MILES DE USD)
TABLA 1420 MERCADO DE COMPUESTOS PLÁSTICOS DE SUDÁFRICA, POR PROPIEDADES, 2018-2032 (MILES DE USD)
TABLA 1421 MERCADO DE COMPUESTOS PLÁSTICOS DE SUDÁFRICA, POR APLICACIÓN, 2018-2032 (MILES DE USD)
TABLA 1422 MERCADO DE COMPUESTOS PLÁSTICOS DE SUDÁFRICA, POR APLICACIÓN, 2018-2032 (KILOTONELADAS)
TABLA 1423 MERCADO DE COMPUESTOS DE PLÁSTICO EN AUTOMÓVILES DE SUDÁFRICA, POR CATEGORÍA, 2018-2032 (MILES DE USD)
TABLA 1424 COMPONENTES INTERIORES DE SUDÁFRICA EN EL MERCADO DE COMPUESTOS PLÁSTICOS, POR TIPO, 2018-2032 (MILES DE USD)
TABLA 1425 PARTES EXTERIORES DE LA CARROCERÍA EN EL MERCADO DE COMPUESTOS DE PLÁSTICO DE SUDÁFRICA, POR TIPO, 2018-2032 (MILES DE USD)
TABLA 1426 APLICACIONES INTERNAS EN EL MERCADO DE COMPUESTOS PLÁSTICOS DE SUDÁFRICA, POR TIPO, 2018-2032 (MILES DE USD)
TABLA 1427 MERCADO DE ENVASES DE PLÁSTICO EN SUDÁFRICA, POR CATEGORÍA, 2018-2032 (MILES DE USD)
TABLA 1428 MERCADO DE ENVASES DE ALIMENTOS Y BEBIDAS EN COMPUESTOS DE PLÁSTICO DE SUDÁFRICA, POR TIPO, 2018-2032 (MILES DE USD)
TABLA 1429 MERCADO DE ENVASES INDUSTRIALES DE SUDÁFRICA EN COMPUESTOS DE PLÁSTICO, POR TIPO, 2018-2032 (MILES DE USD)
TABLA 1430 MERCADO DE ENVASES DE BIENES DE CONSUMO EN SUDÁFRICA, POR TIPO, 2018-2032 (MILES DE USD)
TABLA 1431 MERCADO DE CONSTRUCCIÓN Y EDIFICACIÓN DE COMPUESTOS PLÁSTICOS EN SUDÁFRICA, POR CATEGORÍA, 2018-2032 (MILES DE USD)
TABLA 1432 MERCADO DE PRODUCTOS ELÉCTRICOS Y ELECTRÓNICOS EN COMPUESTOS DE PLÁSTICO DE SUDÁFRICA, POR CATEGORÍA, 2018-2032 (MILES DE USD)
TABLA 1433 MERCADO DE DISPOSITIVOS MÉDICOS DE SUDÁFRICA EN COMPUESTOS DE PLÁSTICO, POR CATEGORÍA, 2018-2032 (MILES DE USD)
TABLA 1434 MERCADO DE MUEBLES DE SUDÁFRICA EN COMPUESTOS DE PLÁSTICO, POR CATEGORÍA, 2018-2032 (MILES DE USD)
TABLA 1435 MERCADO DE ENERGÍA Y ELECTRICIDAD EN COMPUESTOS DE PLÁSTICO EN SUDÁFRICA, POR CATEGORÍA, 2018-2032 (MILES DE USD)
TABLA 1436 SUDÁFRICA AEROESPACIAL Y DEFENSA EN EL MERCADO DE COMPUESTOS PLÁSTICOS, POR CATEGORÍA, 2018-2032 (MILES DE USD)
TABLA 1437 MERCADO DE COMPUESTOS PLÁSTICOS DE ISRAEL, POR TIPO DE POLÍMERO, 2018-2032 (MILES DE USD)
TABLA 1438 MERCADO DE COMPUESTOS PLÁSTICOS DE ISRAEL, POR TIPO DE POLÍMERO, 2018-2032 (KILOTONELADAS)
TABLA 1439 MERCADO DE TERMOPLÁSTICOS EN COMPUESTOS PLÁSTICOS DE ISRAEL, POR TIPO, 2018-2032 (MILES DE USD)
TABLA 1440 MERCADO DE POLIETILENO (PE) EN COMPUESTOS PLÁSTICOS DE ISRAEL, POR TIPO, 2018-2032 (MILES DE USD)
TABLA 1441 PLÁSTICOS DE INGENIERÍA DE ISRAEL EN EL MERCADO DE COMPUESTOS PLÁSTICOS, POR TIPO, 2018-2032 (MILES DE USD)
TABLA 1442 PLÁSTICOS TERMOENDURECIBLES DE ISRAEL EN EL MERCADO DE COMPUESTOS DE PLÁSTICO, POR TIPO, 2018-2032 (MILES DE USD)
TABLA 1443 BIOPLÁSTICOS EN EL MERCADO DE COMPUESTOS PLÁSTICOS DE ISRAEL, POR TIPO, 2018-2032 (MILES DE USD)
TABLA 1444 MERCADO DE COMPUESTOS PLÁSTICOS DE ISRAEL, POR TIPO DE RELLENO, 2018-2032 (MILES DE USD)
TABLA 1445 RELLENOS MINERALES EN EL MERCADO DE COMPUESTOS PLÁSTICOS DE ISRAEL, POR TIPO, 2018-2032 (MILES DE USD)
TABLA 1446 REFUERZOS EN EL MERCADO DE COMPUESTOS PLÁSTICOS DE ISRAEL, POR TIPO, 2018-2032 (MILES DE USD)
TABLA 1447 ADITIVOS EN EL MERCADO DE COMPUESTOS PLÁSTICOS DE ISRAEL, POR TIPO, 2018-2032 (MILES DE USD)
TABLA 1448 MERCADO DE COMPUESTOS PLÁSTICOS DE ISRAEL, POR PROCESO DE FABRICACIÓN, 2018-2032 (MILES DE USD)
TABLA 1449 MERCADO DE COMPUESTOS PLÁSTICOS DE ISRAEL, POR PROCESO DE FABRICACIÓN, 2018-2032 (KILOTONELADAS)
TABLA 1450 MERCADO DE EXTRUSIÓN DE COMPUESTOS PLÁSTICOS DE ISRAEL, POR TIPO, 2018-2032 (MILES DE USD)
TABLA 1451 MERCADO DE EXTRUSIÓN DE PLÁSTICOS EN ISRAEL, POR SISTEMA DE PELETIZACIÓN, 2018-2032 (MILES DE USD)
TABLA 1452 MERCADO DE COMPUESTOS DE PLÁSTICO BASADOS EN MOLDEO POR INYECCIÓN DE ISRAEL, POR SISTEMA DE PELETIZACIÓN, 2018-2032 (MILES DE USD)
TABLA 1453 COMPACTACIÓN/PRESIONADO EN EL MERCADO DE COMPUESTOS DE PLÁSTICO EN ISRAEL, POR SISTEMA DE PELETIZACIÓN, 2018-2032 (MILES DE USD)
TABLA 1454 AMASADORA ISRAELÍ/MEZCLA BANBURY EN EL MERCADO DE COMPUESTOS DE PLÁSTICO, POR SISTEMA DE PELETIZACIÓN, 2018-2032 (MILES DE USD)
TABLA 1455 MERCADO DE COMPUESTOS PLÁSTICOS DE ISRAEL, POR PROPIEDADES, 2018-2032 (MILES DE USD)
TABLA 1456 MERCADO DE COMPUESTOS PLÁSTICOS DE ISRAEL, POR APLICACIÓN, 2018-2032 (MILES DE USD)
TABLA 1457 MERCADO DE COMPUESTOS PLÁSTICOS DE ISRAEL, POR APLICACIÓN, 2018-2032 (KILOTONELADAS).
TABLA 1458 MERCADO DE COMPUESTOS DE PLÁSTICO EN LA INDUSTRIA AUTOMOTRIZ DE ISRAEL, POR CATEGORÍA, 2018-2032 (MILES DE USD)
TABLA 1459 COMPONENTES DE INTERIOR DE ISRAEL EN EL MERCADO DE COMPUESTOS PLÁSTICOS, POR TIPO, 2018-2032 (MILES DE USD)
TABLA 1460 PIEZAS DE CARROCERÍA EXTERIOR DE ISRAEL EN EL MERCADO DE COMPUESTOS PLÁSTICOS, POR TIPO, 2018-2032 (MILES DE USD)
TABLA 1461 APLICACIONES INTERNAS EN EL MERCADO DE COMPUESTOS PLÁSTICOS DE ISRAEL, POR TIPO, 2018-2032 (MILES DE USD)
TABLA 1462 MERCADO DE ENVASES DE PLÁSTICO EN ISRAEL, POR CATEGORÍA, 2018-2032 (MILES DE USD)
TABLA 1463 MERCADO DE ENVASES DE ALIMENTOS Y BEBIDAS EN COMPUESTOS DE PLÁSTICO DE ISRAEL, POR TIPO, 2018-2032 (MILES DE USD)
TABLA 1464 MERCADO DE ENVASES INDUSTRIALES DE COMPUESTOS PLÁSTICOS DE ISRAEL, POR TIPO, 2018-2032 (MILES DE USD)
TABLA 1465 MERCADO DE ENVASES DE BIENES DE CONSUMO EN COMPUESTOS DE PLÁSTICO DE ISRAEL, POR TIPO, 2018-2032 (MILES DE USD)
TABLA 1466 MERCADO DE CONSTRUCCIÓN Y EDIFICACIÓN DE COMPUESTOS PLÁSTICOS EN ISRAEL, POR CATEGORÍA, 2018-2032 (MILES DE USD)
TABLA 1467 MERCADO DE PRODUCTOS ELÉCTRICOS Y ELECTRÓNICOS EN COMPUESTOS DE PLÁSTICO DE ISRAEL, POR CATEGORÍA, 2018-2032 (MILES DE USD)
TABLA 1468 DISPOSITIVOS MÉDICOS EN EL MERCADO DE COMPUESTOS PLÁSTICOS DE ISRAEL, POR CATEGORÍA, 2018-2032 (MILES DE USD)
TABLA 1469 MERCADO DE MUEBLES DE ISRAEL EN COMPUESTOS DE PLÁSTICO, POR CATEGORÍA, 2018-2032 (MILES DE USD)
TABLA 1470 ENERGÍA Y ELECTRICIDAD EN EL MERCADO DE COMPUESTOS DE PLÁSTICO DE ISRAEL, POR CATEGORÍA, 2018-2032 (MILES DE USD)
TABLA 1471 MERCADO DE COMPUESTOS PLÁSTICOS DE LA INDUSTRIA AEROESPACIAL Y DE DEFENSA DE ISRAEL, POR CATEGORÍA, 2018-2032 (MILES DE USD)
TABLA 1472 MERCADO DE COMPUESTOS PLÁSTICOS DE KUWAIT, POR TIPO DE POLÍMERO, 2018-2032 (MILES DE USD)
TABLA 1473 MERCADO DE COMPUESTOS PLÁSTICOS DE KUWAIT, POR TIPO DE POLÍMERO, 2018-2032 (KILOTONELADAS)
TABLA 1474 MERCADO DE TERMOPLÁSTICOS EN COMPUESTOS PLÁSTICOS DE KUWAIT, POR TIPO, 2018-2032 (MILES DE USD)
TABLA 1475 MERCADO DE POLIETILENO (PE) EN COMPUESTOS PLÁSTICOS DE KUWAIT, POR TIPO, 2018-2032 (MILES DE USD)
TABLA 1476 PLÁSTICOS DE INGENIERÍA DE KUWAIT EN EL MERCADO DE COMPUESTOS DE PLÁSTICO, POR TIPO, 2018-2032 (MILES DE USD)
TABLA 1477 PLÁSTICOS TERMOENDURECIBLES DE KUWAIT EN EL MERCADO DE COMPUESTOS DE PLÁSTICO, POR TIPO, 2018-2032 (MILES DE USD)
TABLA 1478 BIOPLÁSTICOS DE KUWAIT EN EL MERCADO DE COMPUESTOS PLÁSTICOS, POR TIPO, 2018-2032 (MILES DE USD)
TABLA 1479 MERCADO DE COMPUESTOS PLÁSTICOS DE KUWAIT, POR TIPO DE RELLENO, 2018-2032 (MILES DE USD)
TABLA 1480 RELLENOS MINERALES EN EL MERCADO DE COMPUESTOS PLÁSTICOS DE KUWAIT, POR TIPO, 2018-2032 (MILES DE USD)
TABLA 1481 REFUERZOS DE KUWAIT EN EL MERCADO DE COMPUESTOS PLÁSTICOS, POR TIPO, 2018-2032 (MILES DE USD)
TABLA 1482 ADITIVOS DE KUWAIT EN EL MERCADO DE COMPUESTOS PLÁSTICOS, POR TIPO, 2018-2032 (MILES DE USD)
TABLA 1483 MERCADO DE COMPUESTOS DE PLÁSTICO DE KUWAIT, POR PROCESO DE FABRICACIÓN, 2018-2032 (MILES DE USD)
TABLA 1484 MERCADO DE COMPUESTOS DE PLÁSTICO DE KUWAIT, POR PROCESO DE FABRICACIÓN, 2018-2032 (KILOTONELADAS)
TABLA 1485 MERCADO DE EXTRUSIÓN DE COMPUESTOS PLÁSTICOS DE KUWAIT, POR TIPO, 2018-2032 (MILES DE USD)
TABLA 1486 MERCADO DE EXTRUSIÓN DE PLÁSTICOS COMPUESTOS EN KUWAIT, POR SISTEMA DE PELETIZACIÓN, 2018-2032 (MILES DE USD)
TABLA 1487 MERCADO DE COMPUESTOS DE PLÁSTICO BASADOS EN MOLDEO POR INYECCIÓN EN KUWAIT, POR SISTEMA DE PELETIZACIÓN, 2018-2032 (MILES DE USD)
TABLA 1488 COMPACTACIÓN/PRESIONADO EN EL MERCADO DE COMPUESTOS DE PLÁSTICO DE KUWAIT, POR SISTEMA DE PELETIZACIÓN, 2018-2032 (MILES DE USD)
TABLA 1489 AMASADAS DE KUWAIT/MEZCLA BANBURY EN EL MERCADO DE COMPUESTOS DE PLÁSTICO, POR SISTEMA DE PELETIZACIÓN, 2018-2032 (MILES DE USD)
TABLA 1490 MERCADO DE COMPUESTOS PLÁSTICOS DE KUWAIT, POR PROPIEDADES, 2018-2032 (MILES DE USD)
TABLA 1491 MERCADO DE COMPUESTOS PLÁSTICOS DE KUWAIT, POR APLICACIÓN, 2018-2032 (MILES DE USD)
TABLA 1492 MERCADO DE COMPUESTOS PLÁSTICOS DE KUWAIT, POR APLICACIÓN, 2018-2032 (KILOTONELADAS)
TABLA 1493 MERCADO DE COMPUESTOS DE PLÁSTICO EN LA INDUSTRIA AUTOMOTRIZ DE KUWAIT, POR CATEGORÍA, 2018-2032 (MILES DE USD)
TABLA 1494 COMPONENTES DE INTERIOR DE KUWAIT EN EL MERCADO DE COMPUESTOS DE PLÁSTICO, POR TIPO, 2018-2032 (MILES DE USD)
TABLA 1495 PIEZAS DE CARROCERÍA EXTERIOR EN EL MERCADO DE COMPUESTOS DE PLÁSTICO DE KUWAIT, POR TIPO, 2018-2032 (MILES DE USD)
TABLA 1496 APLICACIONES INTERNAS EN KUWAIT EN EL MERCADO DE COMPUESTOS PLÁSTICOS, POR TIPO, 2018-2032 (MILES DE USD)
TABLA 1497 MERCADO DE ENVASES DE PLÁSTICO EN KUWAIT, POR CATEGORÍA, 2018-2032 (MILES DE USD)
TABLA 1498 MERCADO DE ENVASES DE ALIMENTOS Y BEBIDAS EN COMPUESTOS DE PLÁSTICO DE KUWAIT, POR TIPO, 2018-2032 (MILES DE USD)
TABLA 1499 MERCADO DE ENVASES INDUSTRIALES DE KUWAIT PARA COMPUESTOS DE PLÁSTICO, POR TIPO, 2018-2032 (MILES DE USD)
TABLA 1500 MERCADO DE ENVASES DE BIENES DE CONSUMO EN COMPUESTOS DE PLÁSTICO DE KUWAIT, POR TIPO, 2018-2032 (MILES DE USD)
TABLA 1501 MERCADO DE CONSTRUCCIÓN Y EDIFICACIÓN DE COMPUESTOS PLÁSTICOS DE KUWAIT, POR CATEGORÍA, 2018-2032 (MILES DE USD)
TABLA 1502 MERCADO DE PRODUCTOS ELÉCTRICOS Y ELECTRÓNICOS EN COMPUESTOS DE PLÁSTICO DE KUWAIT, POR CATEGORÍA, 2018-2032 (MILES DE USD)
TABLA 1503 MERCADO DE DISPOSITIVOS MÉDICOS DE KUWAIT EN COMPUESTOS DE PLÁSTICO, POR CATEGORÍA, 2018-2032 (MILES DE USD)
TABLA 1504 MUEBLES DE KUWAIT EN EL MERCADO DE COMPUESTOS DE PLÁSTICO, POR CATEGORÍA, 2018-2032 (MILES DE USD)
TABLA 1505 MERCADO DE ENERGÍA Y ELECTRICIDAD EN COMPUESTOS DE PLÁSTICO DE KUWAIT, POR CATEGORÍA, 2018-2032 (MILES DE USD)
TABLA 1506 MERCADO DE COMPUESTOS PLÁSTICOS DE LA INDUSTRIA AEROESPACIAL Y DE DEFENSA DE KUWAIT, POR CATEGORÍA, 2018-2032 (MILES DE USD)
TABLA 1507 MERCADO DE COMPUESTOS PLÁSTICOS DE OMÁN, POR TIPO DE POLÍMERO, 2018-2032 (MILES DE USD)
TABLA 1508 MERCADO DE COMPUESTOS PLÁSTICOS DE OMÁN, POR TIPO DE POLÍMERO, 2018-2032 (KILOTONELADAS)
TABLA 1509 MERCADO DE TERMOPLÁSTICOS EN COMPUESTOS PLÁSTICOS DE OMÁN, POR TIPO, 2018-2032 (MILES DE USD)
TABLA 1510 MERCADO DE POLIETILENO (PE) EN COMPUESTOS PLÁSTICOS DE OMÁN, POR TIPO, 2018-2032 (MILES DE USD)
TABLA 1511 PLÁSTICOS DE INGENIERÍA DE OMÁN EN EL MERCADO DE COMPUESTOS DE PLÁSTICO, POR TIPO, 2018-2032 (MILES DE USD)
TABLA 1512 OMÁN: PLÁSTICOS TERMOENDURECIBLES EN EL MERCADO DE COMPUESTOS DE PLÁSTICO, POR TIPO, 2018-2032 (MILES DE USD)
TABLA 1513 BIOPLÁSTICOS DE OMÁN EN EL MERCADO DE COMPUESTOS PLÁSTICOS, POR TIPO, 2018-2032 (MILES DE USD)
TABLA 1514 MERCADO DE COMPUESTOS PLÁSTICOS DE OMÁN, POR TIPO DE RELLENO, 2018-2032 (MILES DE USD)
TABLA 1515 RELLENOS MINERALES EN EL MERCADO DE COMPUESTOS PLÁSTICOS DE OMÁN, POR TIPO, 2018-2032 (MILES DE USD)
TABLA 1516 REFUERZOS EN EL MERCADO DE COMPUESTOS PLÁSTICOS DE OMÁN, POR TIPO, 2018-2032 (MILES DE USD)
TABLA 1517 ADITIVOS DE OMÁN EN EL MERCADO DE COMPUESTOS PLÁSTICOS, POR TIPO, 2018-2032 (MILES DE USD)
TABLA 1518 MERCADO DE COMPUESTOS DE PLÁSTICO DE OMÁN, POR PROCESO DE FABRICACIÓN, 2018-2032 (MILES DE USD)
TABLA 1519 MERCADO DE COMPUESTOS DE PLÁSTICO DE OMÁN, POR PROCESO DE FABRICACIÓN, 2018-2032 (KILOTONELADAS)
TABLA 1520 MERCADO DE EXTRUSIÓN DE COMPUESTOS PLÁSTICOS DE OMÁN, POR TIPO, 2018-2032 (MILES DE USD)
TABLA 1521 MERCADO DE EXTRUSIÓN DE PLÁSTICOS EN OMÁN, POR SISTEMA DE PELETIZACIÓN, 2018-2032 (MILES DE USD)
TABLA 1522 MERCADO DE COMPUESTOS DE PLÁSTICO BASADOS EN MOLDEO POR INYECCIÓN EN OMÁN, POR SISTEMA DE PELETIZACIÓN, 2018-2032 (MILES DE USD)
TABLA 1523 COMPACTACIÓN/PRESIONADO EN EL MERCADO DE COMPUESTOS DE PLÁSTICO EN OMÁN, POR SISTEMA DE PELETIZACIÓN, 2018-2032 (MILES DE USD)
TABLA 1524 AMASADAS/MEZCLAS BANBURY EN EL MERCADO DE COMPUESTOS DE PLÁSTICO DE OMÁN, POR SISTEMA DE PELETIZACIÓN, 2018-2032 (MILES DE USD)
TABLA 1525 MERCADO DE COMPUESTOS PLÁSTICOS DE OMÁN, POR PROPIEDADES, 2018-2032 (MILES DE USD)
TABLA 1526 MERCADO DE COMPUESTOS PLÁSTICOS DE OMÁN, POR APLICACIÓN, 2018-2032 (MILES DE USD)
TABLA 1527 MERCADO DE COMPUESTOS PLÁSTICOS DE OMÁN, POR APLICACIÓN, 2018-2032 (KILOTONELADAS)
TABLA 1528 MERCADO DE COMPUESTOS DE PLÁSTICO EN AUTOMÓVILES DE OMÁN, POR CATEGORÍA, 2018-2032 (MILES DE USD)
TABLA 1529 COMPONENTES DE INTERIOR DE OMÁN EN EL MERCADO DE COMPUESTOS DE PLÁSTICO, POR TIPO, 2018-2032 (MILES DE USD)
TABLA 1530 OMÁN: PIEZAS DE CARROCERÍA EXTERIOR EN EL MERCADO DE COMPUESTOS DE PLÁSTICO, POR TIPO, 2018-2032 (MILES DE USD)
TABLA 1531 APLICACIONES INTERNAS EN EL MERCADO DE COMPUESTOS PLÁSTICOS DE OMÁN, POR TIPO, 2018-2032 (MILES DE USD)
TABLA 1532 MERCADO DE ENVASES DE PLÁSTICO EN OMÁN, POR CATEGORÍA, 2018-2032 (MILES DE USD)
TABLA 1533 MERCADO DE ENVASES DE ALIMENTOS Y BEBIDAS EN COMPUESTOS DE PLÁSTICO DE OMÁN, POR TIPO, 2018-2032 (MILES DE USD)
TABLA 1534 MERCADO DE ENVASES INDUSTRIALES DE OMÁN PARA LA FABRICACIÓN DE COMPUESTOS DE PLÁSTICO, POR TIPO, 2018-2032 (MILES DE USD)
TABLA 1535 MERCADO DE ENVASES DE BIENES DE CONSUMO EN COMPUESTOS DE PLÁSTICO DE OMÁN, POR TIPO, 2018-2032 (MILES DE USD)
TABLA 1536 MERCADO DE CONSTRUCCIÓN Y EDIFICACIÓN DE COMPUESTOS DE PLÁSTICO EN OMÁN, POR CATEGORÍA, 2018-2032 (MILES DE USD)
TABLA 1537 MERCADO DE PRODUCTOS ELÉCTRICOS Y ELECTRÓNICOS EN COMPUESTOS DE PLÁSTICO DE OMÁN, POR CATEGORÍA, 2018-2032 (MILES DE USD)
TABLA 1538 MERCADO DE DISPOSITIVOS MÉDICOS DE OMÁN EN EL MERCADO DE COMPUESTOS DE PLÁSTICO, POR CATEGORÍA, 2018-2032 (MILES DE USD)
TABLA 1539 MERCADO DE MUEBLES DE OMÁN EN COMPUESTOS DE PLÁSTICO, POR CATEGORÍA, 2018-2032 (MILES DE USD)
TABLA 1540 ENERGÍA Y ELECTRICIDAD EN EL MERCADO DE COMPUESTOS DE PLÁSTICO DE OMÁN, POR CATEGORÍA, 2018-2032 (MILES DE USD)
TABLA 1541 MERCADO DE COMPUESTOS PLÁSTICOS DE LA INDUSTRIA AEROESPACIAL Y DE DEFENSA DE OMÁN, POR CATEGORÍA, 2018-2032 (MILES DE USD)
TABLA 1542 MERCADO DE COMPUESTOS PLÁSTICOS DE QATAR, POR TIPO DE POLÍMERO, 2018-2032 (MILES DE USD)
TABLA 1543 MERCADO DE COMPUESTOS PLÁSTICOS DE QATAR, POR TIPO DE POLÍMERO, 2018-2032 (KILOTONELADAS)
TABLA 1544 TERMOPLÁSTICOS ATAR EN EL MERCADO DE COMPUESTOS PLÁSTICOS, POR TIPO, 2018-2032 (MILES DE USD)
TABLA 1545 MERCADO DE POLIETILENO (PE) EN COMPUESTOS PLÁSTICOS DE QATAR, POR TIPO, 2018-2032 (MILES DE USD)
TABLA 1546 PLÁSTICOS DE INGENIERÍA DE QATAR EN EL MERCADO DE COMPUESTOS PLÁSTICOS, POR TIPO, 2018-2032 (MILES DE USD)
TABLA 1547 PLÁSTICOS TERMOENDURECIBLES DE QATAR EN EL MERCADO DE COMPUESTOS DE PLÁSTICO, POR TIPO, 2018-2032 (MILES DE USD)
TABLA 1548 BIOPLÁSTICOS EN EL MERCADO DE COMPUESTOS PLÁSTICOS DE QATAR, POR TIPO, 2018-2032 (MILES DE USD)
TABLA 1549 MERCADO DE COMPUESTOS PLÁSTICOS DE QATAR, POR TIPO DE RELLENO, 2018-2032 (MILES DE USD)
TABLA 1550 RELLENOS MINERALES EN EL MERCADO DE COMPUESTOS PLÁSTICOS DE QATAR, POR TIPO, 2018-2032 (MILES DE USD)
TABLA 1551 REFUERZOS EN EL MERCADO DE COMPUESTOS PLÁSTICOS DE QATAR, POR TIPO, 2018-2032 (MILES DE USD)
TABLA 1552 ADITIVOS DE CATAR EN EL MERCADO DE COMPUESTOS PLÁSTICOS, POR TIPO, 2018-2032 (MILES DE USD)
TABLA 1553 MERCADO DE COMPUESTOS PLÁSTICOS DE QATAR, POR PROCESO DE FABRICACIÓN, 2018-2032 (MILES DE USD)
TABLA 1554 MERCADO DE COMPUESTOS PLÁSTICOS DE QATAR, POR PROCESO DE FABRICACIÓN, 2018-2032 (KILOTONELADAS)
TABLA 1555 MERCADO DE EXTRUSIÓN DE COMPUESTOS PLÁSTICOS DE QATAR, POR TIPO, 2018-2032 (MILES DE USD)
TABLA 1556 MERCADO DE EXTRUSIÓN DE PLÁSTICOS EN CATAR, POR SISTEMA DE PELETIZACIÓN, 2018-2032 (MILES DE USD)
TABLA 1557 MERCADO DE COMPUESTOS DE PLÁSTICO BASADOS EN MOLDEO POR INYECCIÓN EN QATAR, POR SISTEMA DE PELETIZACIÓN, 2018-2032 (MILES DE USD)
TABLA 1558 COMPACTACIÓN/PRESIONADO EN EL MERCADO DE COMPUESTOS DE PLÁSTICO DE QATAR, POR SISTEMA DE PELETIZACIÓN, 2018-2032 (MILES DE USD)
TABLA 1559 AMASADORA/MEZCLA BANBURY EN EL MERCADO DE COMPUESTOS DE PLÁSTICO DE QATAR, POR SISTEMA DE PELETIZACIÓN, 2018-2032 (MILES DE USD)
TABLA 1560 MERCADO DE COMPUESTOS PLÁSTICOS DE QATAR, POR PROPIEDADES, 2018-2032 (MILES DE USD)
TABLA 1561 MERCADO DE COMPUESTOS PLÁSTICOS DE QATAR, POR APLICACIÓN, 2018-2032 (MILES DE USD)
TABLA 1562 MERCADO DE COMPUESTOS PLÁSTICOS DE QATAR, POR APLICACIÓN, 2018-2032 (KILOTONELADAS).
TABLA 1563 MERCADO DE COMPUESTOS DE PLÁSTICO EN AUTOMÓVILES DE QATAR, POR CATEGORÍA, 2018-2032 (MILES DE USD)
TABLA 1564 COMPONENTES DE INTERIOR DE QATAR EN EL MERCADO DE COMPUESTOS PLÁSTICOS, POR TIPO, 2018-2032 (MILES DE USD)
TABLA 1565 PIEZAS DE CARROCERÍA EXTERIOR EN EL MERCADO DE COMPUESTOS PLÁSTICOS DE QATAR, POR TIPO, 2018-2032 (MILES DE USD)
TABLA 1566 APLICACIONES INTERNAS EN EL MERCADO DE COMPUESTOS PLÁSTICOS DE QATAR, POR TIPO, 2018-2032 (MILES DE USD)
TABLA 1567 MERCADO DE ENVASES DE PLÁSTICO EN QATAR, POR CATEGORÍA, 2018-2032 (MILES DE USD)
TABLA 1568 ENVASES DE ALIMENTOS Y BEBIDAS EN EL MERCADO DE COMPUESTOS DE PLÁSTICO DE QATAR, POR TIPO, 2018-2032 (MILES DE USD)
TABLA 1569 MERCADO DE ENVASES INDUSTRIALES DE COMPUESTOS PLÁSTICOS DE QATAR, POR TIPO, 2018-2032 (MILES DE USD)
TABLA 1570 MERCADO DE ENVASES DE BIENES DE CONSUMO EN COMPUESTOS DE PLÁSTICO DE QATAR, POR TIPO, 2018-2032 (MILES DE USD)
TABLA 1571 MERCADO DE CONSTRUCCIÓN Y EDIFICACIÓN DE COMPUESTOS PLÁSTICOS DE QATAR, POR CATEGORÍA, 2018-2032 (MILES DE USD)
TABLA 1572 MERCADO DE PRODUCTOS ELÉCTRICOS Y ELECTRÓNICOS EN COMPUESTOS DE PLÁSTICO DE QATAR, POR CATEGORÍA, 2018-2032 (MILES DE USD)
TABLA 1573 DISPOSITIVOS MÉDICOS EN EL MERCADO DE COMPUESTOS PLÁSTICOS DE QATAR, POR CATEGORÍA, 2018-2032 (MILES DE USD)
TABLA 1574 MERCADO DE MUEBLES DE QATAR EN COMPUESTOS DE PLÁSTICO, POR CATEGORÍA, 2018-2032 (MILES DE USD)
TABLA 1575 MERCADO DE ENERGÍA Y ELECTRICIDAD EN COMPUESTOS DE PLÁSTICO DE QATAR, POR CATEGORÍA, 2018-2032 (MILES DE USD)
TABLA 1576 MERCADO DE COMPUESTOS PLÁSTICOS DE LA INDUSTRIA AEROESPACIAL Y DE DEFENSA DE QATAR, POR CATEGORÍA, 2018-2032 (MILES DE USD)
TABLA 1577 MERCADO DE COMPUESTOS PLÁSTICOS DE BAHREIN, POR TIPO DE POLÍMERO, 2018-2032 (MILES DE USD)
TABLA 1578 MERCADO DE COMPUESTOS PLÁSTICOS DE BAHREIN, POR TIPO DE POLÍMERO, 2018-2032 (KILOTONELADAS)
TABLA 1579 MERCADO DE TERMOPLÁSTICOS EN COMPUESTOS PLÁSTICOS DE BAHREIN, POR TIPO, 2018-2032 (MILES DE USD)
TABLA 1580 MERCADO DE POLIETILENO (PE) EN COMPUESTOS PLÁSTICOS DE BAHREIN, POR TIPO, 2018-2032 (MILES DE USD)
TABLA 1581 PLÁSTICOS DE INGENIERÍA DE BAHREIN EN EL MERCADO DE COMPUESTOS DE PLÁSTICO, POR TIPO, 2018-2032 (MILES DE USD)
TABLA 1582 PLÁSTICOS TERMOENDURECIBLES DE BAHREIN EN EL MERCADO DE COMPUESTOS DE PLÁSTICO, POR TIPO, 2018-2032 (MILES DE USD)
TABLA 1583 BIOPLÁSTICOS EN EL MERCADO DE COMPUESTOS PLÁSTICOS DE BAHREIN, POR TIPO, 2018-2032 (MILES DE USD)
TABLA 1584 MERCADO DE COMPUESTOS PLÁSTICOS DE BAHREIN, POR TIPO DE RELLENO, 2018-2032 (MILES DE USD)
TABLA 1585 RELLENOS MINERALES EN EL MERCADO DE COMPUESTOS PLÁSTICOS DE BAHREIN, POR TIPO, 2018-2032 (MILES DE USD)
TABLA 1586 MERCADO DE REFUERZOS DE BAHREIN EN COMPUESTOS PLÁSTICOS, POR TIPO, 2018-2032 (MILES DE USD)
TABLA 1587 ADITIVOS DE BAHREIN EN EL MERCADO DE COMPUESTOS PLÁSTICOS, POR TIPO, 2018-2032 (MILES DE USD)
TABLA 1588 MERCADO DE COMPUESTOS DE PLÁSTICO DE BAHREIN, POR PROCESO DE FABRICACIÓN, 2018-2032 (MILES DE USD)
TABLA 1589 MERCADO DE COMPUESTOS DE PLÁSTICO DE BAHREIN, POR PROCESO DE FABRICACIÓN, 2018-2032 (KILOTONELADAS)
TABLA 1590 MERCADO DE EXTRUSIÓN DE PLÁSTICOS EN BAHREIN, POR TIPO, 2018-2032 (MILES DE USD)
TABLA 1591 MERCADO DE EXTRUSIÓN DE PLÁSTICOS EN BAHREIN, POR SISTEMA DE PELETIZACIÓN, 2018-2032 (MILES DE USD)
TABLA 1592 MERCADO DE COMPUESTOS DE PLÁSTICO BASADOS EN MOLDEO POR INYECCIÓN EN BAHREIN, POR SISTEMA DE PELETIZACIÓN, 2018-2032 (MILES DE USD)
TABLA 1593 COMPACTACIÓN/PRESIONADO EN EL MERCADO DE COMPUESTOS DE PLÁSTICO DE BAHREIN, POR SISTEMA DE PELETIZACIÓN, 2018-2032 (MILES DE USD)
TABLA 1594 MERCADO DE AMASADORAS/MEZCLAS BANBURY DE BAHREIN EN LA FABRICACIÓN DE COMPUESTOS DE PLÁSTICO, POR SISTEMA DE PELETIZACIÓN, 2018-2032 (MILES DE USD)
TABLA 1595 MERCADO DE COMPUESTOS PLÁSTICOS DE BAHREIN, POR PROPIEDADES, 2018-2032 (MILES DE USD)
TABLA 1596 MERCADO DE COMPUESTOS PLÁSTICOS DE BAHREIN, POR APLICACIÓN, 2018-2032 (MILES DE USD)
TABLA 1597 MERCADO DE COMPUESTOS PLÁSTICOS DE BAHREIN, POR APLICACIÓN, 2018-2032 (KILOTONELADAS)
TABLA 1598 MERCADO DE COMPUESTOS DE PLÁSTICO EN AUTOMÓVILES DE BAHREIN, POR CATEGORÍA, 2018-2032 (MILES DE USD)
TABLA 1599 COMPONENTES DE INTERIOR DE BAHREIN EN EL MERCADO DE COMPUESTOS DE PLÁSTICO, POR TIPO, 2018-2032 (MILES DE USD)
TABLA 1600 PIEZAS DE CARROCERÍA EXTERIOR EN EL MERCADO DE COMPUESTOS DE PLÁSTICO DE BAHREIN, POR TIPO, 2018-2032 (MILES DE USD)
TABLA 1601 APLICACIONES INTERNAS EN EL MERCADO DE COMPUESTOS PLÁSTICOS DE BAHREIN, POR TIPO, 2018-2032 (MILES DE USD)
TABLA 1602 MERCADO DE ENVASES DE PLÁSTICO EN BAHREIN, POR CATEGORÍA, 2018-2032 (MILES DE USD)
TABLA 1603 MERCADO DE ENVASES DE ALIMENTOS Y BEBIDAS EN COMPUESTOS DE PLÁSTICO DE BAHREIN, POR TIPO, 2018-2032 (MILES DE USD)
TABLA 1604 MERCADO DE ENVASES INDUSTRIALES DE BAHREIN EN COMPUESTOS DE PLÁSTICO, POR TIPO, 2018-2032 (MILES DE USD)
TABLA 1605 MERCADO DE ENVASES DE BIENES DE CONSUMO EN COMPUESTOS DE PLÁSTICO DE BAHREIN, POR TIPO, 2018-2032 (MILES DE USD)
TABLA 1606 MERCADO DE CONSTRUCCIÓN Y EDIFICACIÓN DE COMPUESTOS DE PLÁSTICO EN BAHREIN, POR CATEGORÍA, 2018-2032 (MILES DE USD)
TABLA 1607 MERCADO DE PRODUCTOS ELÉCTRICOS Y ELECTRÓNICOS EN COMPUESTOS DE PLÁSTICO DE BAHREIN, POR CATEGORÍA, 2018-2032 (MILES DE USD)
TABLA 1608 MERCADO DE DISPOSITIVOS MÉDICOS DE BAHREIN EN LA FABRICACIÓN DE COMPUESTOS DE PLÁSTICO, POR CATEGORÍA, 2018-2032 (MILES DE USD)
TABLA 1609 MERCADO DE MUEBLES DE BAHREIN EN COMPUESTOS DE PLÁSTICO, POR CATEGORÍA, 2018-2032 (MILES DE USD)
TABLA 1610 MERCADO DE ENERGÍA Y ELECTRICIDAD EN COMPUESTOS DE PLÁSTICO DE BAHREIN, POR CATEGORÍA, 2018-2032 (MILES DE USD)
TABLA 1611 MERCADO DE COMPUESTOS PLÁSTICOS DE LA INDUSTRIA AEROESPACIAL Y DE DEFENSA DE BAHREIN, POR CATEGORÍA, 2018-2032 (MILES DE USD)
TABLA 1612 RESTO DEL MERCADO DE COMPUESTOS PLÁSTICOS DE ORIENTE MEDIO Y ÁFRICA, POR TIPO DE POLÍMERO, 2018-2032 (MILES DE USD)
TABLA 1613 RESTO DEL MERCADO DE COMPUESTOS PLÁSTICOS DE ORIENTE MEDIO Y ÁFRICA, POR TIPO DE POLÍMERO, 2018-2032 (KILOTONELADAS)
TABLA 1614 MERCADO DE COMPUESTOS PLÁSTICOS DE AMÉRICA DEL SUR, POR PAÍS, 2018-2032 (MILES DE USD)
TABLA 1615 MERCADO DE COMPUESTOS PLÁSTICOS DE AMÉRICA DEL SUR, POR PAÍS, 2018-2032 (KILOTONELADAS)
TABLA 1616 MERCADO DE COMPUESTOS PLÁSTICOS DE AMÉRICA DEL SUR, POR TIPO DE POLÍMERO, 2018-2032 (MILES DE USD)
TABLA 1617 MERCADO DE COMPUESTOS PLÁSTICOS DE AMÉRICA DEL SUR, POR TIPO DE POLÍMERO, 2018-2032 (KILOTONELADAS)
TABLA 1618 MERCADO DE TERMOPLÁSTICOS EN COMPUESTOS PLÁSTICOS DE AMÉRICA DEL SUR, POR TIPO, 2018-2032 (MILES DE USD)
TABLA 1619 MERCADO DE POLIETILENO (PE) EN COMPUESTOS PLÁSTICOS DE AMÉRICA DEL SUR, POR TIPO, 2018-2032 (MILES DE USD)
TABLA 1620 PLÁSTICOS DE INGENIERÍA EN EL MERCADO DE COMPUESTOS PLÁSTICOS DE AMÉRICA DEL SUR, POR TIPO, 2018-2032 (MILES DE USD)
TABLA 1621 PLÁSTICOS TERMOESTABLECIDOS EN EL MERCADO DE COMPUESTOS PLÁSTICOS DE AMÉRICA DEL SUR, POR TIPO, 2018-2032 (MILES DE USD)
TABLA 1622 MERCADO DE BIOPLÁSTICOS EN COMPUESTOS PLÁSTICOS DE AMÉRICA DEL SUR, POR TIPO, 2018-2032 (MILES DE USD)
TABLA 1623 MERCADO DE COMPUESTOS PLÁSTICOS DE AMÉRICA DEL SUR, POR TIPO DE RELLENO, 2018-2032 (MILES DE USD)
TABLA 1624 RELLENOS MINERALES EN EL MERCADO DE COMPUESTOS PLÁSTICOS DE AMÉRICA DEL SUR, POR TIPO, 2018-2032 (MILES DE USD)
TABLA 1625 MERCADO DE REFUERZOS DE COMPUESTOS PLÁSTICOS EN AMÉRICA DEL SUR, POR TIPO, 2018-2032 (MILES DE USD)
TABLA 1626 ADITIVOS EN EL MERCADO DE COMPUESTOS PLÁSTICOS DE AMÉRICA DEL SUR, POR TIPO, 2018-2032 (MILES DE USD)
TABLA 1627 MERCADO DE COMPUESTOS PLÁSTICOS DE AMÉRICA DEL SUR, POR PROCESO DE FABRICACIÓN, 2018-2032 (MILES DE USD)
TABLA 1628 MERCADO DE COMPUESTOS PLÁSTICOS DE AMÉRICA DEL SUR, POR PROCESO DE FABRICACIÓN, 2018-2032 (KILOTONELADAS)
TABLA 1629 MERCADO DE EXTRUSIÓN EN COMPUESTOS PLÁSTICOS DE AMÉRICA DEL SUR, POR TIPO, 2018-2032 (MILES DE USD)
TABLA 1630 MERCADO DE EXTRUSIÓN EN COMPUESTOS DE PLÁSTICO EN AMÉRICA DEL SUR, POR SISTEMA DE PELETIZACIÓN, 2018-2032 (MILES DE USD)
TABLA 1631 MERCADO DE COMPUESTOS DE PLÁSTICO BASADOS EN MOLDEO POR INYECCIÓN EN AMÉRICA DEL SUR, POR SISTEMA DE PELETIZACIÓN, 2018-2032 (MILES DE USD)
TABLA 1632 COMPACTACIÓN/PRESIONADO EN EL MERCADO DE COMPUESTOS PLÁSTICOS DE AMÉRICA DEL SUR, POR SISTEMA DE PELETIZACIÓN, 2018-2032 (MILES DE USD)
TABLA 1633 MERCADO DE AMASADORAS/MEZCLAS BANBURY EN LA FABRICACIÓN DE COMPUESTOS DE PLÁSTICO EN AMÉRICA DEL SUR, POR SISTEMA DE PELETIZACIÓN, 2018-2032 (MILES DE USD)
TABLA 1634 MERCADO DE COMPUESTOS PLÁSTICOS DE AMÉRICA DEL SUR, POR PROPIEDADES, 2018-2032 (MILES DE USD)
TABLA 1635 MERCADO DE COMPUESTOS PLÁSTICOS DE AMÉRICA DEL SUR, POR APLICACIÓN, 2018-2032 (MILES DE USD)
TABLA 1636 MERCADO DE COMPUESTOS PLÁSTICOS DE AMÉRICA DEL SUR, POR APLICACIÓN, 2018-2032 (KILOTONELADAS)
TABLA 1637 MERCADO DE COMPUESTOS PLÁSTICOS AUTOMOTRICES EN AMÉRICA DEL SUR, POR CATEGORÍA, 2018-2032 (MILES DE USD)
TABLA 1638 COMPONENTES INTERIORES DE AMÉRICA DEL SUR EN EL MERCADO DE COMPUESTOS PLÁSTICOS, POR TIPO, 2018-2032 (MILES DE USD)
TABLA 1639 PARTES EXTERIORES DE CARROCERÍA EN EL MERCADO DE COMPUESTOS PLÁSTICOS DE AMÉRICA DEL SUR, POR TIPO, 2018-2032 (MILES DE USD)
TABLA 1640 APLICACIONES INTERNAS EN AMÉRICA DEL SUR EN EL MERCADO DE COMPUESTOS PLÁSTICOS, POR TIPO, 2018-2032 (MILES DE USD)
TABLA 1641 MERCADO DE ENVASES DE PLÁSTICO EN AMÉRICA DEL SUR, POR CATEGORÍA, 2018-2032 (MILES DE USD)
TABLA 1642 MERCADO DE ENVASES DE ALIMENTOS Y BEBIDAS EN COMPUESTOS DE PLÁSTICO DE AMÉRICA DEL SUR, POR TIPO, 2018-2032 (MILES DE USD)
TABLA 1643 MERCADO DE ENVASES INDUSTRIALES DE AMÉRICA DEL SUR EN COMPUESTOS PLÁSTICOS, POR TIPO, 2018-2032 (MILES DE USD)
TABLA 1644 MERCADO DE ENVASES DE BIENES DE CONSUMO EN COMPUESTOS PLÁSTICOS DE AMÉRICA DEL SUR, POR TIPO, 2018-2032 (MILES DE USD)
TABLA 1645 MERCADO DE CONSTRUCCIÓN Y EDIFICACIÓN DE COMPUESTOS PLÁSTICOS EN AMÉRICA DEL SUR, POR CATEGORÍA, 2018-2032 (MILES DE USD)
TABLA 1646 MERCADO DE PRODUCTOS ELÉCTRICOS Y ELECTRÓNICOS EN COMPUESTOS PLÁSTICOS DE AMÉRICA DEL SUR, POR CATEGORÍA, 2018-2032 (MILES DE USD)
TABLA 1647 MERCADO DE DISPOSITIVOS MÉDICOS EN COMPUESTOS PLÁSTICOS DE AMÉRICA DEL SUR, POR CATEGORÍA, 2018-2032 (MILES DE USD)
TABLA 1648 MERCADO DE MUEBLES EN COMPUESTOS DE PLÁSTICO DE AMÉRICA DEL SUR, POR CATEGORÍA, 2018-2032 (MILES DE USD)
TABLA 1649 MERCADO DE ENERGÍA Y ELECTRICIDAD EN COMPUESTOS DE PLÁSTICO EN AMÉRICA DEL SUR, POR CATEGORÍA, 2018-2032 (MILES DE USD)
TABLA 1650 SUDAMÉRICA AEROESPACIAL Y DEFENSA EN EL MERCADO DE COMPUESTOS PLÁSTICOS, POR CATEGORÍA, 2018-2032 (MILES DE USD)
TABLA 1651 MERCADO DE COMPUESTOS PLÁSTICOS DE BRASIL, POR TIPO DE POLÍMERO, 2018-2032 (MILES DE USD)
TABLA 1652 MERCADO DE COMPUESTOS PLÁSTICOS DE BRASIL, POR TIPO DE POLÍMERO, 2018-2032 (KILOTONELADAS)
TABLA 1653 MERCADO DE TERMOPLÁSTICOS EN COMPUESTOS PLÁSTICOS DE BRASIL, POR TIPO, 2018-2032 (MILES DE USD)
TABLA 1654 MERCADO DE POLIETILENO (PE) EN COMPUESTOS PLÁSTICOS DE BRASIL, POR TIPO, 2018-2032 (MILES DE USD)
TABLA 1655 PLÁSTICOS DE INGENIERÍA DE BRASIL EN EL MERCADO DE COMPUESTOS PLÁSTICOS, POR TIPO, 2018-2032 (MILES DE USD)
TABLA 1656 PLÁSTICOS TERMOESTABLECIDOS DE BRASIL EN EL MERCADO DE COMPUESTOS PLÁSTICOS, POR TIPO, 2018-2032 (MILES DE USD)
TABLA 1657 BIOPLÁSTICOS EN EL MERCADO DE COMPUESTOS PLÁSTICOS DE BRASIL, POR TIPO, 2018-2032 (MILES DE USD)
TABLA 1658 MERCADO DE COMPUESTOS PLÁSTICOS DE BRASIL, POR TIPO DE RELLENO, 2018-2032 (MILES DE USD)
TABLA 1659 RELLENOS MINERALES EN EL MERCADO DE COMPUESTOS PLÁSTICOS DE BRASIL, POR TIPO, 2018-2032 (MILES DE USD)
TABLA 1660 MERCADO DE REFUERZOS DE COMPUESTOS PLÁSTICOS DE BRASIL, POR TIPO, 2018-2032 (MILES DE USD)
TABLA 1661 ADITIVOS DE BRASIL EN EL MERCADO DE COMPUESTOS PLÁSTICOS, POR TIPO, 2018-2032 (MILES DE USD)
TABLA 1662 MERCADO DE COMPUESTOS PLÁSTICOS DE BRASIL, POR PROCESO DE FABRICACIÓN, 2018-2032 (MILES DE USD)
TABLA 1663 MERCADO DE COMPUESTOS PLÁSTICOS DE BRASIL, POR PROCESO DE FABRICACIÓN, 2018-2032 (KILOTONELADAS)
TABLA 1664 MERCADO DE EXTRUSIÓN DE COMPUESTOS PLÁSTICOS EN BRASIL, POR TIPO, 2018-2032 (MILES DE USD)
TABLA 1665 MERCADO DE EXTRUSIÓN DE PLÁSTICOS EN BRASIL, POR SISTEMA DE PELETIZACIÓN, 2018-2032 (MILES DE USD)
TABLA 1666 MERCADO DE COMPUESTOS DE PLÁSTICO BASADOS EN MOLDEO POR INYECCIÓN EN BRASIL, POR SISTEMA DE PELETIZACIÓN, 2018-2032 (MILES DE USD)
TABLA 1667 COMPACTACIÓN/PRESIONADO EN EL MERCADO DE COMPUESTOS PLÁSTICOS DE BRASIL, POR SISTEMA DE PELETIZACIÓN, 2018-2032 (MILES DE USD)
TABLA 1668 MERCADO DE MEZCLA DE AMASADORAS/BANBURY EN BRASIL, POR SISTEMA DE PELETIZACIÓN, 2018-2032 (MILES DE USD)
TABLA 1669 MERCADO DE COMPUESTOS PLÁSTICOS DE BRASIL, POR PROPIEDADES, 2018-2032 (MILES DE USD)
TABLA 1670 MERCADO DE COMPUESTOS PLÁSTICOS DE BRASIL, POR APLICACIÓN, 2018-2032 (MILES DE USD)
TABLA 1671 MERCADO DE COMPUESTOS PLÁSTICOS DE BRASIL, POR APLICACIÓN, 2018-2032 (KILOTONELADAS).
TABLA 1672 MERCADO DE COMPUESTOS PLÁSTICOS AUTOMOTRICES DE BRASIL, POR CATEGORÍA, 2018-2032 (MILES DE USD)
TABLA 1673 COMPONENTES INTERIORES DE BRASIL EN EL MERCADO DE COMPUESTOS PLÁSTICOS, POR TIPO, 2018-2032 (MILES DE USD)
TABLA 1674 PARTES EXTERIORES DE CARROCERÍA EN EL MERCADO DE COMPUESTOS PLÁSTICOS DE BRASIL, POR TIPO, 2018-2032 (MILES DE USD)
TABLA 1675 APLICACIONES INTERNAS EN EL MERCADO DE COMPUESTOS PLÁSTICOS DE BRASIL, POR TIPO, 2018-2032 (MILES DE USD)
TABLA 1676 MERCADO DE ENVASES DE PLÁSTICO EN BRASIL, POR CATEGORÍA, 2018-2032 (MILES DE USD)
TABLA 1677 MERCADO DE ENVASES DE ALIMENTOS Y BEBIDAS EN BRASIL, POR TIPO, 2018-2032 (MILES DE USD)
TABLA 1678 MERCADO DE EMBALAJES INDUSTRIALES DE BRASIL EN COMPUESTOS PLÁSTICOS, POR TIPO, 2018-2032 (MILES DE USD)
TABLA 1679 MERCADO DE ENVASES DE BIENES DE CONSUMO EN BRASIL, POR TIPO, 2018-2032 (MILES DE USD)
TABLA 1680 MERCADO DE CONSTRUCCIÓN Y EDIFICACIÓN DE COMPUESTOS PLÁSTICOS EN BRASIL, POR CATEGORÍA, 2018-2032 (MILES DE USD)
TABLA 1681 MERCADO DE PRODUCTOS ELÉCTRICOS Y ELECTRÓNICOS EN COMPUESTOS PLÁSTICOS DE BRASIL, POR CATEGORÍA, 2018-2032 (MILES DE USD)
TABLA 1682 MERCADO DE DISPOSITIVOS MÉDICOS EN COMPUESTOS PLÁSTICOS DE BRASIL, POR CATEGORÍA, 2018-2032 (MILES DE USD)
TABLA 1683 MERCADO DE MUEBLES DE BRASIL EN COMPUESTOS DE PLÁSTICO, POR CATEGORÍA, 2018-2032 (MILES DE USD)
TABLA 1684 ENERGÍA Y POTENCIA EN EL MERCADO DE COMPUESTOS PLÁSTICOS DE BRASIL, POR CATEGORÍA, 2018-2032 (MILES DE USD)
TABLA 1685 MERCADO DE COMPUESTOS PLÁSTICOS DE LA INDUSTRIA AEROESPACIAL Y DE DEFENSA DE BRASIL, POR CATEGORÍA, 2018-2032 (MILES DE USD)
TABLA 1686 MERCADO ARGENTINO DE COMPUESTOS PLÁSTICOS, POR TIPO DE POLÍMERO, 2018-2032 (MILES DE USD)
TABLA 1687 MERCADO ARGENTINO DE COMPUESTOS PLÁSTICOS, POR TIPO DE POLÍMERO, 2018-2032 (KILOTONELADAS)
TABLA 1688 MERCADO ARGENTINO DE TERMOPLÁSTICOS EN COMPUESTOS PLÁSTICOS, POR TIPO, 2018-2032 (MILES DE USD)
TABLA 1689 MERCADO ARGENTINO DE POLIETILENO (PE) EN COMPUESTOS PLÁSTICOS, POR TIPO, 2018-2032 (MILES DE USD)
TABLA 1690 MERCADO ARGENTINO DE PLÁSTICOS DE INGENIERÍA EN COMPUESTOS PLÁSTICOS, POR TIPO, 2018-2032 (MILES DE USD)
TABLA 1691 MERCADO ARGENTINO DE PLÁSTICOS TERMOESTABLECIDOS EN COMPUESTOS PLÁSTICOS, POR TIPO, 2018-2032 (MILES DE USD)
TABLA 1692 MERCADO ARGENTINO DE BIOPLÁSTICOS EN COMPUESTOS PLÁSTICOS, POR TIPO, 2018-2032 (MILES DE USD)
TABLA 1693 MERCADO ARGENTINO DE COMPUESTOS PLÁSTICOS, POR TIPO DE RELLENO, 2018-2032 (MILES DE USD)
TABLA 1694 MERCADO ARGENTINO DE RELLENOS MINERALES EN COMPUESTOS PLÁSTICOS, POR TIPO, 2018-2032 (MILES DE USD)
TABLA 1695 MERCADO DE REFUERZOS EN COMPUESTOS PLÁSTICOS DE ARGENTINA, POR TIPO, 2018-2032 (MILES DE USD)
TABLA 1696 MERCADO DE ADITIVOS EN COMPUESTOS PLÁSTICOS DE ARGENTINA, POR TIPO, 2018-2032 (MILES DE USD)
TABLA 1697 MERCADO ARGENTINO DE COMPUESTOS PLÁSTICOS, POR PROCESO DE FABRICACIÓN, 2018-2032 (MILES DE USD)
TABLA 1698 MERCADO ARGENTINO DE COMPUESTOS PLÁSTICOS, POR PROCESO DE FABRICACIÓN, 2018-2032 (KILOTONELADAS)
TABLA 1699 MERCADO DE EXTRUSIÓN EN COMPUESTOS PLÁSTICOS DE ARGENTINA, POR TIPO, 2018-2032 (MILES DE USD)
TABLA 1700 MERCADO ARGENTINO DE EXTRUSIÓN EN COMPUESTOS PLÁSTICOS, SEGÚN SISTEMA DE PELETIZACIÓN, 2018-2032 (MILES DE USD)
TABLA 1701 MERCADO ARGENTINO DE COMPUESTOS DE PLÁSTICO BASADOS EN MOLDEO POR INYECCIÓN, SEGÚN SISTEMA DE PELETIZACIÓN, 2018-2032 (MILES DE USD)
TABLA 1702 COMPACTACIÓN/PRESIONADO EN EL MERCADO DE COMPUESTOS PLÁSTICOS DE ARGENTINA, SEGÚN SISTEMA DE PELETIZACIÓN, 2018-2032 (MILES DE USD)
TABLA 1703 MERCADO ARGENTINO DE MEZCLA DE AMASADORAS/BANBURY EN COMPUESTOS DE PLÁSTICO, POR SISTEMA DE PELETIZACIÓN, 2018-2032 (MILES DE USD)
TABLA 1704 MERCADO ARGENTINO DE COMPUESTOS PLÁSTICOS, POR PROPIEDADES, 2018-2032 (MILES DE USD)
TABLA 1705 MERCADO ARGENTINO DE COMPUESTOS PLÁSTICOS, POR APLICACIÓN, 2018-2032 (MILES DE USD)
TABLA 1706 MERCADO ARGENTINO DE COMPUESTOS PLÁSTICOS, POR APLICACIÓN, 2018-2032 (KILOTONELADAS)
TABLA 1707 MERCADO AUTOMOTRIZ ARGENTINO DE COMPUESTOS PLÁSTICOS, POR CATEGORÍA, 2018-2032 (MILES DE USD)
TABLA 1708 COMPONENTES DE INTERIOR EN EL MERCADO DE COMPUESTOS PLÁSTICOS DE ARGENTINA, POR TIPO, 2018-2032 (MILES DE USD)
TABLA 1709 PARTES DE CARROCERÍA EXTERIOR EN EL MERCADO DE COMPUESTOS PLÁSTICOS DE ARGENTINA, POR TIPO, 2018-2032 (MILES DE USD)
TABLA 1710 APLICACIONES INTERNAS EN ARGENTINA EN EL MERCADO DE COMPUESTOS PLÁSTICOS, POR TIPO, 2018-2032 (MILES DE USD)
TABLA 1711 MERCADO ARGENTINO DE ENVASES EN COMPUESTOS PLÁSTICOS, POR CATEGORÍA, 2018-2032 (MILES DE USD)
TABLA 1712 MERCADO ARGENTINO DE ENVASES DE ALIMENTOS Y BEBIDAS EN COMPUESTOS PLÁSTICOS, POR TIPO, 2018-2032 (MILES DE USD)
TABLA 1713 MERCADO ARGENTINO DE ENVASES INDUSTRIALES EN COMPUESTOS PLÁSTICOS, POR TIPO, 2018-2032 (MILES DE USD)
TABLA 1714 MERCADO ARGENTINO DE ENVASES DE BIENES DE CONSUMO EN COMPUESTOS PLÁSTICOS, POR TIPO, 2018-2032 (MILES DE USD)
TABLA 1715 MERCADO DE CONSTRUCCIÓN Y EDIFICACIÓN DE COMPUESTOS PLÁSTICOS EN ARGENTINA, POR CATEGORÍA, 2018-2032 (MILES DE USD)
TABLA 1716 MERCADO ARGENTINO DE PRODUCTOS ELÉCTRICOS Y ELECTRÓNICOS EN COMPUESTOS PLÁSTICOS, POR CATEGORÍA, 2018-2032 (MILES DE USD)
TABLA 1717 MERCADO ARGENTINO DE DISPOSITIVOS MÉDICOS EN COMPUESTOS PLÁSTICOS, POR CATEGORÍA, 2018-2032 (MILES DE USD)
TABLA 1718 MERCADO ARGENTINO DE MUEBLES EN COMPUESTOS PLÁSTICOS, POR CATEGORÍA, 2018-2032 (MILES DE USD)
TABLA 1719 MERCADO DE ENERGÍA Y POTENCIA EN COMPUESTOS PLÁSTICOS DE ARGENTINA, POR CATEGORÍA, 2018-2032 (MILES DE USD)
TABLA 1720 MERCADO ARGENTINO DE COMPUESTOS PLÁSTICOS AEROESPACIALES Y DE DEFENSA, POR CATEGORÍA, 2018-2032 (MILES DE USD)
TABLA 1721 MERCADO DE COMPUESTOS PLÁSTICOS DE COLOMBIA, POR TIPO DE POLÍMERO, 2018-2032 (MILES DE USD)
TABLA 1722 MERCADO DE COMPUESTOS PLÁSTICOS DE COLOMBIA, POR TIPO DE POLÍMERO, 2018-2032 (KILOTONELADAS)
TABLA 1723 MERCADO DE TERMOPLÁSTICOS EN COMPUESTOS PLÁSTICOS DE COLOMBIA, POR TIPO, 2018-2032 (MILES DE USD)
TABLA 1724 MERCADO DE POLIETILENO (PE) EN COMPUESTOS PLÁSTICOS DE COLOMBIA, POR TIPO, 2018-2032 (MILES DE USD)
TABLA 1725 MERCADO DE PLÁSTICOS DE INGENIERÍA EN COLOMBIA, POR TIPO, 2018-2032 (MILES DE USD)
TABLA 1726 MERCADO DE PLÁSTICOS TERMOESTABLECIDOS EN COLOMBIA, POR TIPO, 2018-2032 (MILES DE USD)
TABLA 1727 MERCADO DE BIOPLÁSTICOS EN COMPUESTOS PLÁSTICOS DE COLOMBIA, POR TIPO, 2018-2032 (MILES DE USD)
TABLA 1728 MERCADO DE COMPUESTOS PLÁSTICOS DE COLOMBIA, POR TIPO DE RELLENO, 2018-2032 (MILES DE USD)
TABLA 1729 MERCADO DE RELLENOS MINERALES EN COMPUESTOS PLÁSTICOS DE COLOMBIA, POR TIPO, 2018-2032 (MILES DE USD)
TABLA 1730 MERCADO DE REFUERZOS EN COMPUESTOS PLÁSTICOS DE COLOMBIA, POR TIPO, 2018-2032 (MILES DE USD)
TABLA 1731 ADITIVOS EN EL MERCADO DE COMPUESTOS PLÁSTICOS DE COLOMBIA, POR TIPO, 2018-2032 (MILES DE USD)
TABLA 1732 MERCADO DE COMPUESTOS PLÁSTICOS EN COLOMBIA, SEGÚN PROCESO DE FABRICACIÓN, 2018-2032 (MILES DE USD)
TABLA 1733 MERCADO DE COMPUESTOS PLÁSTICOS DE COLOMBIA, POR PROCESO DE FABRICACIÓN, 2018-2032 (KILOTONELADAS)
TABLA 1734 MERCADO DE EXTRUSIÓN EN COMPUESTOS PLÁSTICOS EN COLOMBIA, POR TIPO, 2018-2032 (MILES DE USD)
TABLA 1735 MERCADO DE EXTRUSIÓN EN COMPUESTOS PLÁSTICOS EN COLOMBIA, SEGÚN SISTEMA DE PELETIZACIÓN, 2018-2032 (MILES DE USD)
TABLA 1736 MERCADO DE COMPUESTOS PLÁSTICOS BASADOS EN MOLDEO POR INYECCIÓN EN COLOMBIA, SEGÚN SISTEMA DE PELETIZACIÓN, 2018-2032 (MILES DE USD)
TABLA 1737 COMPACTACIÓN/PRESIONADO EN EL MERCADO DE COMPUESTOS PLÁSTICOS DE COLOMBIA, SEGÚN SISTEMA DE PELETIZACIÓN, 2018-2032 (MILES DE USD)
TABLA 1738 MERCADO DE MEZCLA DE AMASADORAS/BANBURY EN LA FABRICACIÓN DE COMPUESTOS DE PLÁSTICO, POR SISTEMA DE PELETIZACIÓN, COLOMBIA, 2018-2032 (MILES DE USD)
TABLA 1739 MERCADO DE COMPUESTOS PLÁSTICOS DE COLOMBIA, POR PROPIEDADES, 2018-2032 (MILES DE USD)
TABLA 1740 MERCADO DE COMPUESTOS PLÁSTICOS DE COLOMBIA, POR APLICACIÓN, 2018-2032 (MILES DE USD)
TABLA 1741 MERCADO DE COMPUESTOS PLÁSTICOS DE COLOMBIA, POR APLICACIÓN, 2018-2032 (KILOTONELADAS)
TABLA 1742 MERCADO DE COMPUESTOS PLÁSTICOS AUTOMOTRICES EN COLOMBIA, POR CATEGORÍA, 2018-2032 (MILES DE USD)
TABLA 1743 COMPONENTES INTERIORES EN EL MERCADO DE COMPUESTOS PLÁSTICOS DE COLOMBIA, POR TIPO, 2018-2032 (MILES DE USD)
TABLA 1744 COLOMBIA: PARTES EXTERIORES DE CARROCERÍA EN EL MERCADO DE COMPUESTOS PLÁSTICOS, POR TIPO, 2018-2032 (MILES DE USD)
TABLA 1745 APLICACIONES INTERNAS EN EL MERCADO DE COMPUESTOS PLÁSTICOS DE COLOMBIA, POR TIPO, 2018-2032 (MILES DE USD)
TABLA 1746 MERCADO DE ENVASES DE PLÁSTICO COMPUESTO EN COLOMBIA, POR CATEGORÍA, 2018-2032 (MILES DE USD)
TABLA 1747 MERCADO DE ENVASES DE ALIMENTOS Y BEBIDAS EN COMPUESTOS PLÁSTICOS DE COLOMBIA, POR TIPO, 2018-2032 (MILES DE USD)
TABLA 1748 MERCADO DE ENVASES INDUSTRIALES EN COMPUESTOS PLÁSTICOS DE COLOMBIA, POR TIPO, 2018-2032 (MILES DE USD)
TABLA 1749 MERCADO DE ENVASES DE BIENES DE CONSUMO EN COMPUESTOS PLÁSTICOS DE COLOMBIA, POR TIPO, 2018-2032 (MILES DE USD)
TABLA 1750 MERCADO DE CONSTRUCCIÓN Y EDIFICACIÓN DE COMPUESTOS PLÁSTICOS EN COLOMBIA, POR CATEGORÍA, 2018-2032 (MILES DE USD)
TABLA 1751 MERCADO DE PRODUCTOS ELÉCTRICOS Y ELECTRÓNICOS EN COMPUESTOS PLÁSTICOS DE COLOMBIA, POR CATEGORÍA, 2018-2032 (MILES DE USD)
TABLA 1752 MERCADO DE DISPOSITIVOS MÉDICOS EN COMPUESTOS PLÁSTICOS DE COLOMBIA, POR CATEGORÍA, 2018-2032 (MILES DE USD)
TABLA 1753 MERCADO DE MUEBLES EN COMPUESTOS PLÁSTICOS DE COLOMBIA, POR CATEGORÍA, 2018-2032 (MILES DE USD)
TABLA 1754 MERCADO DE ENERGÍA Y PODER EN COMPUESTOS PLÁSTICOS DE COLOMBIA, POR CATEGORÍA, 2018-2032 (MILES DE USD)
TABLA 1755 MERCADO DE COMPUESTOS PLÁSTICOS DE LA INDUSTRIA AEROESPACIAL Y DE DEFENSA DE COLOMBIA, POR CATEGORÍA, 2018-2032 (MILES DE USD)
TABLA 1756 MERCADO DE COMPUESTOS PLÁSTICOS DE CHILE, POR TIPO DE POLÍMERO, 2018-2032 (MILES DE USD)
TABLA 1757 MERCADO DE COMPUESTOS PLÁSTICOS DE CHILE, POR TIPO DE POLÍMERO, 2018-2032 (KILOTONELADAS)
TABLA 1758 MERCADO DE TERMOPLÁSTICOS EN COMPUESTOS PLÁSTICOS DE CHILE, POR TIPO, 2018-2032 (MILES DE USD)
TABLA 1759 MERCADO DE POLIETILENO (PE) EN COMPUESTOS PLÁSTICOS DE CHILE, POR TIPO, 2018-2032 (MILES DE USD)
TABLA 1760 PLÁSTICOS DE INGENIERÍA EN EL MERCADO DE COMPUESTOS PLÁSTICOS DE CHILE, POR TIPO, 2018-2032 (MILES DE USD)
TABLA 1761 PLÁSTICOS TERMOESTABLECIDOS DE CHILE EN EL MERCADO DE COMPUESTOS PLÁSTICOS, POR TIPO, 2018-2032 (MILES DE USD)
TABLA 1762 BIOPLÁSTICOS EN EL MERCADO DE COMPUESTOS PLÁSTICOS DE CHILE, POR TIPO, 2018-2032 (MILES DE USD)
TABLA 1763 MERCADO DE COMPUESTOS PLÁSTICOS DE CHILE, POR TIPO DE RELLENO, 2018-2032 (MILES DE USD)
TABLA 1764 RELLENOS MINERALES EN EL MERCADO DE COMPUESTOS PLÁSTICOS DE CHILE, POR TIPO, 2018-2032 (MILES DE USD)
TABLA 1765 MERCADO DE REFUERZOS EN COMPUESTOS PLÁSTICOS DE CHILE, POR TIPO, 2018-2032 (MILES DE USD)
TABLA 1766 ADITIVOS EN EL MERCADO DE COMPUESTOS PLÁSTICOS DE CHILE, POR TIPO, 2018-2032 (MILES DE USD)
TABLA 1767 MERCADO DE COMPUESTOS PLÁSTICOS DE CHILE, POR PROCESO DE FABRICACIÓN, 2018-2032 (MILES DE USD)
TABLA 1768 MERCADO DE COMPUESTOS PLÁSTICOS DE CHILE, POR PROCESO DE FABRICACIÓN, 2018-2032 (KILOTONELADAS)
TABLA 1769 MERCADO DE EXTRUSIÓN EN COMPUESTOS PLÁSTICOS DE CHILE, POR TIPO, 2018-2032 (MILES DE USD)
TABLA 1770 MERCADO DE EXTRUSIÓN DE PLÁSTICOS EN CHILE, SEGÚN SISTEMA DE PELETIZACIÓN, 2018-2032 (MILES DE USD)
TABLA 1771 MERCADO DE COMPUESTOS DE PLÁSTICO BASADOS EN MOLDEO POR INYECCIÓN EN CHILE, POR SISTEMA DE PELETIZACIÓN, 2018-2032 (MILES DE USD)
TABLA 1772 COMPACTACIÓN/PRESIONADO EN EL MERCADO DE COMPUESTOS PLÁSTICOS DE CHILE, POR SISTEMA DE PELETIZACIÓN, 2018-2032 (MILES DE USD)
TABLA 1773 AMASADORA DE CHILE/MEZCLA BANBURY EN EL MERCADO DE COMPUESTOS DE PLÁSTICO, POR SISTEMA DE PELETIZACIÓN, 2018-2032 (MILES DE USD)
TABLA 1774 MERCADO DE COMPUESTOS PLÁSTICOS DE CHILE, POR PROPIEDADES, 2018-2032 (MILES DE USD)
TABLA 1775 MERCADO DE COMPUESTOS PLÁSTICOS DE CHILE, POR APLICACIÓN, 2018-2032 (MILES DE USD)
TABLA 1776 MERCADO DE COMPUESTOS PLÁSTICOS DE CHILE, POR APLICACIÓN, 2018-2032 (KILOTONELADAS)
TABLA 1777 MERCADO DE COMPUESTOS PLÁSTICOS AUTOMOTRICES EN CHILE, POR CATEGORÍA, 2018-2032 (MILES DE USD)
TABLA 1778 COMPONENTES INTERIORES DE CHILE EN EL MERCADO DE COMPUESTOS PLÁSTICOS, POR TIPO, 2018-2032 (MILES DE USD)
TABLA 1779 PARTES DE CARROCERÍA EXTERIOR EN EL MERCADO DE COMPUESTOS PLÁSTICOS DE CHILE, POR TIPO, 2018-2032 (MILES DE USD)
TABLA 1780 APLICACIONES INTERNAS EN CHILE EN EL MERCADO DE COMPUESTOS PLÁSTICOS, POR TIPO, 2018-2032 (MILES DE USD)
TABLA 1781 MERCADO DE ENVASES DE COMPUESTOS PLÁSTICOS DE CHILE, POR CATEGORÍA, 2018-2032 (MILES DE USD)
TABLA 1782 MERCADO DE ENVASES DE ALIMENTOS Y BEBIDAS EN CHILE, POR TIPO, 2018-2032 (MILES DE USD)
TABLA 1783 MERCADO DE ENVASES INDUSTRIALES DE CHILE EN COMPUESTOS PLÁSTICOS, POR TIPO, 2018-2032 (MILES DE USD)
TABLA 1784 MERCADO DE ENVASES DE BIENES DE CONSUMO EN CHILE, POR TIPO, 2018-2032 (MILES DE USD)
TABLA 1785 MERCADO DE CONSTRUCCIÓN Y EDIFICACIÓN DE COMPUESTOS PLÁSTICOS EN CHILE, POR CATEGORÍA, 2018-2032 (MILES DE USD)
TABLA 1786 MERCADO DE PRODUCTOS ELÉCTRICOS Y ELECTRÓNICOS EN COMPUESTOS PLÁSTICOS DE CHILE, POR CATEGORÍA, 2018-2032 (MILES DE USD)
TABLA 1787 MERCADO DE DISPOSITIVOS MÉDICOS EN COMPUESTOS PLÁSTICOS DE CHILE, POR CATEGORÍA, 2018-2032 (MILES DE USD)
TABLA 1788 MERCADO DE MUEBLES DE CHILE EN COMPUESTOS PLÁSTICOS, POR CATEGORÍA, 2018-2032 (MILES DE USD)
TABLA 1789 MERCADO DE ENERGÍA Y PODER EN COMPUESTOS PLÁSTICOS DE CHILE, POR CATEGORÍA, 2018-2032 (MILES DE USD)
TABLA 1790 MERCADO DE COMPUESTOS PLÁSTICOS DE LA INDUSTRIA AEROESPACIAL Y DE DEFENSA DE CHILE, POR CATEGORÍA, 2018-2032 (MILES DE USD)
TABLA 1791 MERCADO DE COMPUESTOS PLÁSTICOS EN PERÚ, POR TIPO DE POLÍMERO, 2018-2032 (MILES DE USD)
TABLA 1792 MERCADO DE COMPUESTOS PLÁSTICOS EN PERÚ, SEGÚN TIPO DE POLÍMERO, 2018-2032 (KILOTONELADAS).
TABLA 1793 MERCADO DE TERMOPLÁSTICOS EN COMPUESTOS PLÁSTICOS DEL PERÚ, POR TIPO, 2018-2032 (MILES DE USD)
TABLA 1794 MERCADO DE POLIETILENO (PE) EN COMPUESTOS PLÁSTICOS DEL PERÚ, POR TIPO, 2018-2032 (MILES DE USD)
TABLA 1795 MERCADO DE PLÁSTICOS DE INGENIERÍA EN EL PERÚ, POR TIPO, 2018-2032 (MILES DE USD)
TABLA 1796 PLÁSTICOS TERMOESTABLECIDOS EN EL MERCADO DE COMPUESTOS PLÁSTICOS DEL PERÚ, POR TIPO, 2018-2032 (MILES DE USD)
TABLA 1797 BIOPLÁSTICOS EN EL MERCADO DE COMPUESTOS PLÁSTICOS DEL PERÚ, POR TIPO, 2018-2032 (MILES DE USD)
TABLA 1798 MERCADO DE COMPUESTOS PLÁSTICOS EN PERÚ, POR TIPO DE RELLENO, 2018-2032 (MILES DE USD)
TABLA 1799 MERCADO DE RELLENOS MINERALES EN COMPUESTOS PLÁSTICOS DEL PERÚ, POR TIPO, 2018-2032 (MILES DE USD)
TABLA 1800 MERCADO DE REFUERZOS DE COMPUESTOS PLÁSTICOS EN PERÚ, POR TIPO, 2018-2032 (MILES DE USD)
TABLA 1801 ADITIVOS EN EL MERCADO DE COMPUESTOS PLÁSTICOS EN PERÚ, POR TIPO, 2018-2032 (MILES DE USD)
TABLA 1802 MERCADO DE COMPUESTOS PLÁSTICOS EN PERÚ, SEGÚN PROCESO DE FABRICACIÓN, 2018-2032 (MILES DE USD)
TABLA 1803 MERCADO DE COMPUESTOS PLÁSTICOS EN PERÚ, POR PROCESO DE FABRICACIÓN, 2018-2032 (KILOTONELADAS)
TABLA 1804 MERCADO DE EXTRUSIÓN EN COMPUESTOS PLÁSTICOS EN PERÚ, POR TIPO, 2018-2032 (MILES DE USD)
TABLA 1805 MERCADO DE EXTRUSIÓN EN COMPUESTOS PLÁSTICOS EN PERÚ, SEGÚN SISTEMA DE PELETIZACIÓN, 2018-2032 (MILES DE USD)
TABLA 1806 MERCADO DE COMPUESTOS DE PLÁSTICO BASADOS EN MOLDEO POR INYECCIÓN EN PERÚ, SEGÚN SISTEMA DE PELETIZACIÓN, 2018-2032 (MILES DE USD)
TABLA 1807 COMPACTACIÓN/PRESIONADO EN EL MERCADO DE COMPUESTOS PLÁSTICOS EN PERÚ, SEGÚN SISTEMA DE PELETIZACIÓN, 2018-2032 (MILES DE USD)
TABLA 1808 MERCADO DE MEZCLA DE AMASADORAS/BANBURY EN EL PERÚ, POR SISTEMA DE PELETIZACIÓN, 2018-2032 (MILES DE USD)
TABLA 1809 MERCADO DE COMPUESTOS PLÁSTICOS EN PERÚ, POR PROPIEDADES, 2018-2032 (MILES DE USD)
TABLA 1810 MERCADO DE COMPUESTOS PLÁSTICOS EN PERÚ, POR APLICACIÓN, 2018-2032 (MILES DE USD)
TABLA 1811 MERCADO DE COMPUESTOS PLÁSTICOS EN PERÚ, POR APLICACIÓN, 2018-2032 (KILOTONELADAS)
TABLA 1812 MERCADO AUTOMOTRIZ EN EL PERÚ, POR CATEGORÍA, 2018-2032 (MILES DE USD)
TABLA 1813 COMPONENTES INTERIORES EN EL MERCADO DE COMPUESTOS PLÁSTICOS DEL PERÚ, POR TIPO, 2018-2032 (MILES DE USD)
TABLA 1814 PARTES EXTERIORES DE CARROCERÍA EN EL MERCADO DE COMPUESTOS PLÁSTICOS DEL PERÚ, POR TIPO, 2018-2032 (MILES DE USD)
TABLA 1815 APLICACIONES INTERNAS EN EL MERCADO DE COMPUESTOS PLÁSTICOS DE PERÚ, POR TIPO, 2018-2032 (MILES DE USD)
TABLA 1816 MERCADO DE ENVASES DE PLÁSTICO EN PERÚ, POR CATEGORÍA, 2018-2032 (MILES DE USD)
TABLA 1817 MERCADO DE ENVASES DE ALIMENTOS Y BEBIDAS EN COMPUESTOS PLÁSTICOS DEL PERÚ, POR TIPO, 2018-2032 (MILES DE USD)
TABLA 1818 MERCADO DE ENVASES INDUSTRIALES EN COMPUESTOS PLÁSTICOS DEL PERÚ, POR TIPO, 2018-2032 (MILES DE USD)
TABLA 1819 MERCADO DE ENVASES DE BIENES DE CONSUMO EN COMPUESTOS PLÁSTICOS DEL PERÚ, POR TIPO, 2018-2032 (MILES DE USD)
TABLA 1820 MERCADO DE CONSTRUCCIÓN Y EDIFICACIÓN DE COMPUESTOS PLÁSTICOS EN PERÚ, POR CATEGORÍA, 2018-2032 (MILES DE USD)
TABLA 1821 MERCADO PERUANO DE PRODUCTOS ELÉCTRICOS Y ELECTRÓNICOS EN COMPUESTOS PLÁSTICOS, POR CATEGORÍA, 2018-2032 (MILES DE USD)
TABLA 1822 MERCADO DE DISPOSITIVOS MÉDICOS EN COMPUESTOS PLÁSTICOS DEL PERÚ, POR CATEGORÍA, 2018-2032 (MILES DE USD)
TABLA 1823 MERCADO DE MUEBLES EN EL PERÚ, POR CATEGORÍA, 2018-2032 (MILES DE USD)
TABLA 1824 MERCADO DE ENERGÍA Y PODER EN COMPUESTOS PLÁSTICOS EN PERÚ, POR CATEGORÍA, 2018-2032 (MILES DE USD)
TABLA 1825 MERCADO DE COMPUESTOS PLÁSTICOS DE LA INDUSTRIA AEROESPACIAL Y DE DEFENSA DEL PERÚ, POR CATEGORÍA, 2018-2032 (MILES DE USD)
TABLA 1826 MERCADO DE COMPUESTOS PLÁSTICOS DEL ECUADOR, POR TIPO DE POLÍMERO, 2018-2032 (MILES DE USD)
TABLA 1827 MERCADO DE COMPUESTOS PLÁSTICOS DEL ECUADOR, POR TIPO DE POLÍMERO, 2018-2032 (KILOTONELADAS)
TABLA 1828 MERCADO DE TERMOPLÁSTICOS EN COMPUESTOS PLÁSTICOS DE ECUADOR, POR TIPO, 2018-2032 (MILES DE USD)
TABLA 1829 MERCADO DE POLIETILENO (PE) EN COMPUESTOS PLÁSTICOS DE ECUADOR, POR TIPO, 2018-2032 (MILES DE USD)
TABLA 1830 PLÁSTICOS DE INGENIERÍA EN EL MERCADO DE COMPUESTOS PLÁSTICOS DE ECUADOR, POR TIPO, 2018-2032 (MILES DE USD)
TABLA 1831 ECUADOR PLÁSTICOS TERMOESTABLECIDOS EN EL MERCADO DE COMPUESTOS PLÁSTICOS, POR TIPO, 2018-2032 (MILES DE USD)
TABLA 1832 BIOPLÁSTICOS EN EL MERCADO DE COMPUESTOS PLÁSTICOS DE ECUADOR, POR TIPO, 2018-2032 (MILES DE USD)
TABLA 1833 MERCADO DE COMPUESTOS PLÁSTICOS DEL ECUADOR, POR TIPO DE RELLENO, 2018-2032 (MILES DE USD)
TABLA 1834 RELLENOS MINERALES EN EL MERCADO DE COMPUESTOS PLÁSTICOS DE ECUADOR, POR TIPO, 2018-2032 (MILES DE USD)
TABLA 1835 MERCADO DE REFUERZOS DE COMPUESTOS PLÁSTICOS EN ECUADOR, POR TIPO, 2018-2032 (MILES DE USD)
TABLA 1836 ADITIVOS EN EL MERCADO DE COMPUESTOS PLÁSTICOS DE ECUADOR, POR TIPO, 2018-2032 (MILES DE USD)
TABLA 1837 MERCADO DE COMPUESTOS PLÁSTICOS DEL ECUADOR, POR PROCESO DE FABRICACIÓN, 2018-2032 (MILES DE USD)
TABLA 1838 MERCADO DE COMPUESTOS PLÁSTICOS DEL ECUADOR, POR PROCESO DE FABRICACIÓN, 2018-2032 (KILOTONELADAS)
TABLA 1839 MERCADO DE EXTRUSIÓN EN COMPUESTOS PLÁSTICOS DE ECUADOR, POR TIPO, 2018-2032 (MILES DE USD)
TABLA 1840 MERCADO DE EXTRUSIÓN DE PLÁSTICOS EN ECUADOR, SEGÚN SISTEMA DE PELETIZACIÓN, 2018-2032 (MILES DE USD)
TABLA 1841 MERCADO DE COMPUESTOS DE PLÁSTICO BASADOS EN MOLDEO POR INYECCIÓN EN ECUADOR, SEGÚN SISTEMA DE PELETIZACIÓN, 2018-2032 (MILES DE USD)
TABLA 1842 COMPACTACIÓN/PRESIONADO EN EL MERCADO DE COMPUESTOS PLÁSTICOS DE ECUADOR, POR SISTEMA DE PELETIZACIÓN, 2018-2032 (MILES DE USD)
TABLA 1843 ECUADOR AMASADAS/MEZCLA BANBURY EN EL MERCADO DE COMPUESTOS DE PLÁSTICO, POR SISTEMA DE PELETIZACIÓN, 2018-2032 (MILES DE USD)
TABLA 1844 MERCADO DE COMPUESTOS PLÁSTICOS DEL ECUADOR, POR PROPIEDADES, 2018-2032 (MILES DE USD)
TABLA 1845 MERCADO DE COMPUESTOS PLÁSTICOS DEL ECUADOR, POR APLICACIÓN, 2018-2032 (MILES DE USD)
TABLA 1846 MERCADO DE COMPUESTOS PLÁSTICOS DEL ECUADOR, POR APLICACIÓN, 2018-2032 (KILOTONELADAS)
TABLA 1847 MERCADO DE COMPUESTOS PLÁSTICOS AUTOMOTRICES EN ECUADOR, POR CATEGORÍA, 2018-2032 (MILES DE USD)
TABLA 1848 COMPONENTES INTERIORES DEL MERCADO DE COMPUESTOS PLÁSTICOS DE ECUADOR, POR TIPO, 2018-2032 (MILES DE USD)
TABLA 1849 PARTES DE CARROCERÍA EXTERIOR EN EL MERCADO DE COMPUESTOS PLÁSTICOS DE ECUADOR, POR TIPO, 2018-2032 (MILES DE USD)
TABLA 1850 APLICACIONES INTERNAS EN EL MERCADO DE COMPUESTOS PLÁSTICOS DE ECUADOR, POR TIPO, 2018-2032 (MILES DE USD)
TABLA 1851 MERCADO DE ENVASES DE PLÁSTICO EN ECUADOR, POR CATEGORÍA, 2018-2032 (MILES DE USD)
TABLA 1852 MERCADO DE ENVASES DE ALIMENTOS Y BEBIDAS EN COMPUESTOS PLÁSTICOS DE ECUADOR, POR TIPO, 2018-2032 (MILES DE USD)
TABLA 1853 MERCADO DE ENVASES INDUSTRIALES DE COMPUESTOS PLÁSTICOS EN ECUADOR, POR TIPO, 2018-2032 (MILES DE USD)
TABLA 1854 MERCADO DE ENVASES DE BIENES DE CONSUMO EN COMPUESTOS PLÁSTICOS DE ECUADOR, POR TIPO, 2018-2032 (MILES DE USD)
TABLA 1855 ECUADOR MERCADO DE CONSTRUCCIÓN Y EDIFICACIÓN DE COMPUESTOS PLÁSTICOS, POR CATEGORÍA, 2018-2032 (MILES DE USD)
TABLA 1856 MERCADO DE PRODUCTOS ELÉCTRICOS Y ELECTRÓNICOS EN COMPUESTOS PLÁSTICOS DE ECUADOR, POR CATEGORÍA, 2018-2032 (MILES DE USD)
TABLA 1857 MERCADO DE DISPOSITIVOS MÉDICOS EN COMPUESTOS PLÁSTICOS DE ECUADOR, POR CATEGORÍA, 2018-2032 (MILES DE USD)
TABLA 1858 MERCADO DE MUEBLES DE ECUADOR EN COMPUESTOS PLÁSTICOS, POR CATEGORÍA, 2018-2032 (MILES DE USD)
TABLA 1859 MERCADO DE ENERGÍA Y PODER EN COMPUESTOS PLÁSTICOS DEL ECUADOR, POR CATEGORÍA, 2018-2032 (MILES DE USD)
TABLA 1860 ECUADOR AEROESPACIAL Y DEFENSA EN EL MERCADO DE COMPUESTOS PLÁSTICOS, POR CATEGORÍA, 2018-2032 (MILES DE USD)
TABLA 1861 MERCADO DE COMPUESTOS PLÁSTICOS DE VENEZUELA, POR TIPO DE POLÍMERO, 2018-2032 (MILES DE USD)
TABLA 1862 MERCADO DE COMPUESTOS PLÁSTICOS DE VENEZUELA, POR TIPO DE POLÍMERO, 2018-2032 (KILOTONELADAS)
TABLA 1863 MERCADO DE TERMOPLÁSTICOS EN COMPUESTOS PLÁSTICOS DE VENEZUELA, POR TIPO, 2018-2032 (MILES DE USD)
TABLA 1864 MERCADO DE POLIETILENO (PE) EN COMPUESTOS PLÁSTICOS DE VENEZUELA, POR TIPO, 2018-2032 (MILES DE USD)
TABLA 1865 PLÁSTICOS DE INGENIERÍA EN EL MERCADO DE COMPUESTOS PLÁSTICOS DE VENEZUELA, POR TIPO, 2018-2032 (MILES DE USD)
TABLA 1866 VENEZUELA PLÁSTICOS TERMOESTABLECIDOS EN EL MERCADO DE COMPUESTOS PLÁSTICOS, POR TIPO, 2018-2032 (MILES DE USD)
TABLA 1867 BIOPLÁSTICOS EN EL MERCADO DE COMPUESTOS PLÁSTICOS DE VENEZUELA, POR TIPO, 2018-2032 (MILES DE USD)
TABLA 1868 MERCADO DE COMPUESTOS PLÁSTICOS DE VENEZUELA, POR TIPO DE RELLENO, 2018-2032 (MILES DE USD)
TABLA 1869 RELLENOS MINERALES EN EL MERCADO DE COMPUESTOS PLÁSTICOS DE VENEZUELA, POR TIPO, 2018-2032 (MILES DE USD)
TABLA 1870 MERCADO DE REFUERZOS DE VENEZUELA EN COMPUESTOS PLÁSTICOS, POR TIPO, 2018-2032 (MILES DE USD)
TABLA 1871 ADITIVOS EN EL MERCADO DE COMPUESTOS PLÁSTICOS DE VENEZUELA, POR TIPO, 2018-2032 (MILES DE USD)
TABLA 1872 MERCADO DE COMPUESTOS PLÁSTICOS DE VENEZUELA, POR PROCESO DE FABRICACIÓN, 2018-2032 (MILES DE USD)
TABLA 1873 MERCADO DE COMPUESTOS PLÁSTICOS DE VENEZUELA, POR PROCESO DE FABRICACIÓN, 2018-2032 (KILOTONELADAS)
TABLA 1874 MERCADO DE EXTRUSIÓN EN COMPUESTOS PLÁSTICOS DE VENEZUELA, POR TIPO, 2018-2032 (MILES DE USD)
TABLA 1875 MERCADO DE EXTRUSIÓN EN COMPUESTOS PLÁSTICOS DE VENEZUELA, POR SISTEMA DE PELETIZACIÓN, 2018-2032 (MILES DE USD)
TABLA 1876 MERCADO DE COMPUESTOS DE PLÁSTICO BASADOS EN MOLDEO POR INYECCIÓN EN VENEZUELA, POR SISTEMA DE PELETIZACIÓN, 2018-2032 (MILES DE USD)
TABLA 1877 COMPACTACIÓN/PRESIONADO EN EL MERCADO DE COMPUESTOS PLÁSTICOS DE VENEZUELA, POR SISTEMA DE PELETIZACIÓN, 2018-2032 (MILES DE USD)
TABLA 1878 VENEZUELA MERCADO DE MEZCLA DE AMASADORAS/BANBURY EN LA FABRICACIÓN DE COMPUESTOS DE PLÁSTICO, POR SISTEMA DE PELETIZACIÓN, 2018-2032 (MILES DE USD)
TABLA 1879 MERCADO DE COMPUESTOS PLÁSTICOS DE VENEZUELA, POR PROPIEDADES, 2018-2032 (MILES DE USD)
TABLA 1880 MERCADO DE COMPUESTOS PLÁSTICOS DE VENEZUELA, POR APLICACIÓN, 2018-2032 (MILES DE USD)
TABLA 1881 MERCADO DE COMPUESTOS PLÁSTICOS DE VENEZUELA, POR APLICACIÓN, 2018-2032 (KILOTONELADAS)
TABLA 1882 MERCADO DE COMPUESTOS PLÁSTICOS AUTOMOTRICES DE VENEZUELA, POR CATEGORÍA, 2018-2032 (MILES DE USD)
TABLA 1883 COMPONENTES INTERIORES DE VENEZUELA EN EL MERCADO DE COMPUESTOS PLÁSTICOS, POR TIPO, 2018-2032 (MILES DE USD)
TABLA 1884 VENEZUELA PARTES EXTERIORES DE CARROCERÍA EN EL MERCADO DE COMPUESTOS PLÁSTICOS, POR TIPO, 2018-2032 (MILES DE USD)
TABLA 1885 APLICACIONES INTERNAS EN VENEZUELA EN EL MERCADO DE COMPUESTOS PLÁSTICOS, POR TIPO, 2018-2032 (MILES DE USD)
TABLA 1886 MERCADO DE ENVASES DE VENEZUELA EN COMPUESTOS PLÁSTICOS, POR CATEGORÍA, 2018-2032 (MILES DE USD)
TABLA 1887 MERCADO DE ENVASES DE ALIMENTOS Y BEBIDAS EN COMPUESTOS PLÁSTICOS DE VENEZUELA, POR TIPO, 2018-2032 (MILES DE USD)
TABLA 1888 MERCADO DE ENVASES INDUSTRIALES DE VENEZUELA EN COMPUESTOS PLÁSTICOS, POR TIPO, 2018-2032 (MILES DE USD)
TABLA 1889 MERCADO DE ENVASES DE BIENES DE CONSUMO EN VENEZUELA, POR TIPO, 2018-2032 (MILES DE USD)
TABLA 1890 VENEZUELA MERCADO DE CONSTRUCCIÓN Y EDIFICACIÓN DE COMPUESTOS PLÁSTICOS, POR CATEGORÍA, 2018-2032 (MILES DE USD)
TABLA 1891 MERCADO DE PRODUCTOS ELÉCTRICOS Y ELECTRÓNICOS EN COMPUESTOS PLÁSTICOS DE VENEZUELA, POR CATEGORÍA, 2018-2032 (MILES DE USD)
TABLA 1892 MERCADO DE DISPOSITIVOS MÉDICOS EN COMPUESTOS PLÁSTICOS DE VENEZUELA, POR CATEGORÍA, 2018-2032 (MILES DE USD)
TABLA 1893 MERCADO DE MUEBLES DE VENEZUELA EN COMPUESTOS PLÁSTICOS, POR CATEGORÍA, 2018-2032 (MILES DE USD)
TABLA 1894 VENEZUELA MERCADO DE ENERGÍA Y PODER EN COMPUESTOS PLÁSTICOS, POR CATEGORÍA, 2018-2032 (MILES DE USD)
TABLA 1895 VENEZUELA AEROESPACIAL Y DEFENSA EN EL MERCADO DE COMPUESTOS PLÁSTICOS, POR CATEGORÍA, 2018-2032 (MILES DE USD)
TABLA 1896 MERCADO DE COMPUESTOS PLÁSTICOS DE BOLIVIA, POR TIPO DE POLÍMERO, 2018-2032 (MILES DE USD)
TABLA 1897 MERCADO DE COMPUESTOS PLÁSTICOS DE BOLIVIA, POR TIPO DE POLÍMERO, 2018-2032 (KILOTONELADAS)
TABLA 1898 MERCADO DE TERMOPLÁSTICOS EN COMPUESTOS PLÁSTICOS DE BOLIVIA, POR TIPO, 2018-2032 (MILES DE USD)
TABLA 1899 MERCADO DE POLIETILENO (PE) EN COMPUESTOS PLÁSTICOS DE BOLIVIA, POR TIPO, 2018-2032 (MILES DE USD)
TABLA 1900 PLÁSTICOS DE INGENIERÍA EN EL MERCADO DE COMPUESTOS PLÁSTICOS DE BOLIVIA, POR TIPO, 2018-2032 (MILES DE USD)
TABLA 1901 BOLIVIA PLÁSTICOS TERMOESTABLECIDOS EN EL MERCADO DE COMPUESTOS PLÁSTICOS, POR TIPO, 2018-2032 (MILES DE USD)
TABLA 1902 BOLIVIA BIOPLÁSTICOS EN EL MERCADO DE COMPUESTOS PLÁSTICOS, POR TIPO, 2018-2032 (MILES DE USD)
TABLA 1903 MERCADO DE COMPUESTOS PLÁSTICOS DE BOLIVIA, POR TIPO DE RELLENO, 2018-2032 (MILES DE USD)
TABLA 1904 BOLIVIA MERCADO DE RELLENOS MINERALES EN COMPUESTOS PLÁSTICOS, POR TIPO, 2018-2032 (MILES DE USD)
TABLA 1905 MERCADO DE REFUERZOS EN COMPUESTOS PLÁSTICOS DE BOLIVIA, POR TIPO, 2018-2032 (MILES DE USD)
TABLA 1906 BOLIVIA MERCADO DE ADITIVOS EN COMPUESTOS PLÁSTICOS, POR TIPO, 2018-2032 (MILES DE USD)
TABLA 1907 MERCADO DE COMPUESTOS PLÁSTICOS DE BOLIVIA, POR PROCESO DE FABRICACIÓN, 2018-2032 (MILES DE USD)
TABLA 1908 MERCADO DE COMPUESTOS PLÁSTICOS DE BOLIVIA, POR PROCESO DE FABRICACIÓN, 2018-2032 (KILOTONELADAS)
TABLA 1909 BOLIVIA MERCADO DE EXTRUSIÓN EN COMPUESTOS PLÁSTICOS, POR TIPO, 2018-2032 (MILES DE USD)
TABLA 1910 MERCADO DE EXTRUSIÓN EN COMPUESTOS PLÁSTICOS DE BOLIVIA, SEGÚN SISTEMA DE PELETIZACIÓN, 2018-2032 (MILES DE USD)
TABLA 1911 MERCADO DE COMPUESTOS DE PLÁSTICO BASADOS EN MOLDEO POR INYECCIÓN EN BOLIVIA, POR SISTEMA DE PELETIZACIÓN, 2018-2032 (MILES DE USD)
TABLA 1912 COMPACTACIÓN/PRESIONADO EN EL MERCADO DE COMPUESTOS PLÁSTICOS DE BOLIVIA, POR SISTEMA DE PELETIZACIÓN, 2018-2032 (MILES DE USD)
TABLA 1913 BOLIVIA MERCADO DE MEZCLA DE AMASADORAS/BANBURY EN COMPUESTOS DE PLÁSTICO, POR SISTEMA DE PELETIZACIÓN, 2018-2032 (MILES DE USD)
TABLA 1914 MERCADO DE COMPUESTOS PLÁSTICOS DE BOLIVIA, POR PROPIEDADES, 2018-2032 (MILES DE USD)
TABLA 1915 MERCADO DE COMPUESTOS PLÁSTICOS DE BOLIVIA, POR APLICACIÓN, 2018-2032 (MILES DE USD)
TABLA 1916 MERCADO DE COMPUESTOS PLÁSTICOS DE BOLIVIA, POR APLICACIÓN, 2018-2032 (KILOTONELADAS)
TABLA 1917 MERCADO DE COMPUESTOS PLÁSTICOS AUTOMOTRICES EN BOLIVIA, POR CATEGORÍA, 2018-2032 (MILES DE USD)
TABLA 1918 COMPONENTES INTERIORES DE BOLIVIA EN EL MERCADO DE COMPUESTOS PLÁSTICOS, POR TIPO, 2018-2032 (MILES DE USD)
TABLA 1919 BOLIVIA PARTES EXTERIORES DE CARROCERÍA EN EL MERCADO DE COMPUESTOS PLÁSTICOS, POR TIPO, 2018-2032 (MILES DE USD)
TABLA 1920 APLICACIONES INTERNAS EN BOLIVIA EN EL MERCADO DE COMPUESTOS PLÁSTICOS, POR TIPO, 2018-2032 (MILES DE USD)
TABLA 1921 MERCADO DE ENVASES DE PLÁSTICO EN BOLIVIA, POR CATEGORÍA, 2018-2032 (MILES DE USD)
TABLA 1922 MERCADO DE ENVASES DE ALIMENTOS Y BEBIDAS EN COMPUESTOS PLÁSTICOS DE BOLIVIA, POR TIPO, 2018-2032 (MILES DE USD)
TABLA 1923 MERCADO DE ENVASES INDUSTRIALES DE BOLIVIA EN COMPUESTOS PLÁSTICOS, POR TIPO, 2018-2032 (MILES DE USD)
TABLA 1924 BOLIVIA MERCADO DE ENVASES DE BIENES DE CONSUMO EN COMPUESTOS PLÁSTICOS, POR TIPO, 2018-2032 (MILES DE USD)
TABLA 1925 BOLIVIA EDIFICACIÓN Y CONSTRUCCIÓN EN EL MERCADO DE COMPUESTOS PLÁSTICOS, POR CATEGORÍA, 2018-2032 (MILES DE USD)
TABLA 1926 MERCADO DE PRODUCTOS ELÉCTRICOS Y ELECTRÓNICOS EN COMPUESTOS PLÁSTICOS DE BOLIVIA, POR CATEGORÍA, 2018-2032 (MILES DE USD)
TABLA 1927 MERCADO DE DISPOSITIVOS MÉDICOS EN COMPUESTOS PLÁSTICOS DE BOLIVIA, POR CATEGORÍA, 2018-2032 (MILES DE USD)
TABLA 1928 BOLIVIA MUEBLES EN EL MERCADO DE COMPUESTOS PLÁSTICOS, POR CATEGORÍA, 2018-2032 (MILES DE USD)
TABLA 1929 BOLIVIA MERCADO DE ENERGÍA Y PODER EN COMPUESTOS PLÁSTICOS, POR CATEGORÍA, 2018-2032 (MILES DE USD)
TABLA 1930 BOLIVIA AEROESPACIAL Y DEFENSA EN EL MERCADO DE COMPUESTOS PLÁSTICOS, POR CATEGORÍA, 2018-2032 (MILES DE USD)
TABLA 1931 MERCADO DE COMPUESTOS PLÁSTICOS DE PARAGUAY, POR TIPO DE POLÍMERO, 2018-2032 (MILES DE USD)
TABLA 1932 MERCADO DE COMPUESTOS PLÁSTICOS DE PARAGUAY, POR TIPO DE POLÍMERO, 2018-2032 (KILOTONELADAS)
TABLA 1933 PARAGUAY TERMOPLÁSTICOS EN EL MERCADO DE COMPUESTOS PLÁSTICOS, POR TIPO, 2018-2032 (MILES DE USD)
TABLA 1934 POLIETILENO (PE) EN EL MERCADO DE COMPUESTOS PLÁSTICOS DE PARAGUAY, POR TIPO, 2018-2032 (MILES DE USD)
TABLA 1935 PLÁSTICOS DE INGENIERÍA DE PARAGUAY EN EL MERCADO DE COMPUESTOS PLÁSTICOS, POR TIPO, 2018-2032 (MILES DE USD)
TABLA 1936 PLÁSTICOS TERMOESTABLECIDOS DE PARAGUAY EN EL MERCADO DE COMPUESTOS PLÁSTICOS, POR TIPO, 2018-2032 (MILES DE USD)
TABLA 1937 BIOPLÁSTICOS EN EL MERCADO DE COMPUESTOS PLÁSTICOS DE PARAGUAY, POR TIPO, 2018-2032 (MILES DE USD)
TABLA 1938 MERCADO DE COMPUESTOS PLÁSTICOS DE PARAGUAY, POR TIPO DE RELLENO, 2018-2032 (MILES DE USD)
TABLA 1939 PARAGUAY RELLENOS MINERALES EN EL MERCADO DE COMPUESTOS PLÁSTICOS, POR TIPO, 2018-2032 (MILES DE USD)
TABLA 1940 PARAGUAY REFUERZOS EN EL MERCADO DE COMPUESTOS PLÁSTICOS, POR TIPO, 2018-2032 (MILES DE USD)
TABLA 1941 ADITIVOS EN EL MERCADO DE COMPUESTOS PLÁSTICOS DE PARAGUAY, POR TIPO, 2018-2032 (MILES DE USD)
TABLA 1942 MERCADO DE COMPUESTOS PLÁSTICOS DE PARAGUAY, POR PROCESO DE FABRICACIÓN, 2018-2032 (MILES DE USD)
TABLA 1943 MERCADO DE COMPUESTOS PLÁSTICOS DE PARAGUAY, POR PROCESO DE FABRICACIÓN, 2018-2032 (KILOTONELADAS)
TABLA 1944 PARAGUAY EXTRUSIÓN EN EL MERCADO DE COMPUESTOS PLÁSTICOS, POR TIPO, 2018-2032 (MILES DE USD)
TABLA 1945 PARAGUAY EXTRUSIÓN EN EL MERCADO DE COMPUESTOS PLÁSTICOS, POR SISTEMA DE PELETIZACIÓN, 2018-2032 (MILES DE USD)
TABLA 1946 PARAGUAY MERCADO DE COMPUESTOS DE PLÁSTICO BASADOS EN MOLDEO POR INYECCIÓN, POR SISTEMA DE PELETIZACIÓN, 2018-2032 (MILES DE USD)
TABLA 1947 COMPACTACIÓN/PRESIONADO EN EL MERCADO DE COMPUESTOS DE PLÁSTICO EN PARAGUAY, POR SISTEMA DE PELETIZACIÓN, 2018-2032 (MILES DE USD)
TABLA 1948 PARAGUAY AMASADORA/MEZCLA BANBURY EN EL MERCADO DE COMPUESTOS DE PLÁSTICO, POR SISTEMA DE PELETIZACIÓN, 2018-2032 (MILES DE USD)
TABLA 1949 MERCADO DE COMPUESTOS PLÁSTICOS DE PARAGUAY, POR PROPIEDADES, 2018-2032 (MILES DE USD)
TABLA 1950 MERCADO DE COMPUESTOS PLÁSTICOS DE PARAGUAY, POR APLICACIÓN, 2018-2032 (MILES DE USD)
TABLA 1951 MERCADO DE COMPUESTOS PLÁSTICOS DE PARAGUAY, POR APLICACIÓN, 2018-2032 (KILOTONELADAS)
TABLA 1952 PARAGUAY MERCADO DE COMPUESTOS AUTOMOTRICES EN PLÁSTICO, POR CATEGORÍA, 2018-2032 (MILES DE USD)
TABLA 1953 COMPONENTES DE INTERIOR DE PARAGUAY EN EL MERCADO DE COMPUESTOS PLÁSTICOS, POR TIPO, 2018-2032 (MILES DE USD)
TABLA 1954 PARAGUAY PARTES DE CARROCERÍA EXTERIOR EN EL MERCADO DE COMPUESTOS PLÁSTICOS, POR TIPO, 2018-2032 (MILES DE USD)
TABLA 1955 PARAGUAY APLICACIONES INTERNAS EN EL MERCADO DE COMPUESTOS PLÁSTICOS, POR TIPO, 2018-2032 (MILES DE USD)
TABLA 1956 PARAGUAY MERCADO DE ENVASES EN COMPUESTOS PLÁSTICOS, POR CATEGORÍA, 2018-2032 (MILES DE USD)
TABLA 1957 PARAGUAY MERCADO DE ENVASES DE ALIMENTOS Y BEBIDAS EN COMPUESTOS PLÁSTICOS, POR TIPO, 2018-2032 (MILES DE USD)
TABLA 1958 PARAGUAY MERCADO DE ENVASES INDUSTRIALES EN COMPUESTOS PLÁSTICOS, POR TIPO, 2018-2032 (MILES DE USD)
TABLA 1959 PARAGUAY MERCADO DE ENVASES DE BIENES DE CONSUMO EN COMPUESTOS PLÁSTICOS, POR TIPO, 2018-2032 (MILES DE USD)
TABLA 1960 PARAGUAY EDIFICACIÓN Y CONSTRUCCIÓN EN EL MERCADO DE COMPUESTOS PLÁSTICOS, POR CATEGORÍA, 2018-2032 (MILES DE USD)
TABLA 1961 PARAGUAY MERCADO DE PRODUCTOS ELÉCTRICOS Y ELECTRÓNICOS EN COMPUESTOS PLÁSTICOS, POR CATEGORÍA, 2018-2032 (MILES DE USD)
TABLA 1962 PARAGUAY MERCADO DE DISPOSITIVOS MÉDICOS EN COMPUESTOS PLÁSTICOS, POR CATEGORÍA, 2018-2032 (MILES DE USD)
TABLA 1963 MERCADO DE MUEBLES DE PARAGUAY EN COMPUESTOS PLÁSTICOS, POR CATEGORÍA, 2018-2032 (MILES DE USD)
TABLA 1964 ENERGÍA Y PODER EN EL MERCADO DE COMPUESTOS PLÁSTICOS DE ARAGUAY, POR CATEGORÍA, 2018-2032 (MILES DE USD)
TABLA 1965 PARAGUAY AEROESPACIAL Y DEFENSA EN EL MERCADO DE COMPUESTOS PLÁSTICOS, POR CATEGORÍA, 2018-2032 (MILES DE USD)
TABLA 1966 MERCADO URUGUAYO DE COMPUESTOS PLÁSTICOS, POR TIPO DE POLÍMERO, 2018-2032 (MILES DE USD)
TABLA 1967 MERCADO URUGUAYO DE COMPUESTOS PLÁSTICOS, POR TIPO DE POLÍMERO, 2018-2032 (KILOTONELADAS)
TABLA 1968 MERCADO DE TERMOPLÁSTICOS URUGUAY EN COMPUESTOS PLÁSTICOS, POR TIPO, 2018-2032 (MILES DE USD)
TABLA 1969 MERCADO DE POLIETILENO (PE) EN COMPUESTOS PLÁSTICOS DE URUGUAY, POR TIPO, 2018-2032 (MILES DE USD)
TABLA 1970 PLÁSTICOS DE INGENIERÍA URUGUAY EN EL MERCADO DE COMPUESTOS PLÁSTICOS, POR TIPO, 2018-2032 (MILES DE USD)
TABLA 1971 PLÁSTICOS TERMOESTABLECIDOS EN EL MERCADO DE COMPUESTOS PLÁSTICOS DE URUGUAY, POR TIPO, 2018-2032 (MILES DE USD)
TABLA 1972 BIOPLÁSTICOS URUGUAY EN EL MERCADO DE COMPUESTOS PLÁSTICOS, POR TIPO, 2018-2032 (MILES DE USD)
TABLA 1973 MERCADO URUGUAYO DE COMPUESTOS PLÁSTICOS, POR TIPO DE RELLENO, 2018-2032 (MILES DE USD)
TABLA 1974 RELLENOS MINERALES EN EL MERCADO DE COMPUESTOS PLÁSTICOS DE URUGUAY, POR TIPO, 2018-2032 (MILES DE USD)
TABLA 1975 MERCADO DE REFUERZOS EN COMPUESTOS PLÁSTICOS DE URUGUAY, POR TIPO, 2018-2032 (MILES DE USD)
TABLA 1976 ADITIVOS EN EL MERCADO DE COMPUESTOS PLÁSTICOS DE URUGUAY, POR TIPO, 2018-2032 (MILES DE USD)
TABLA 1977 MERCADO URUGUAYO DE COMPUESTOS PLÁSTICOS, POR PROCESO DE FABRICACIÓN, 2018-2032 (MILES DE USD)
TABLA 1978 MERCADO DE COMPUESTOS PLÁSTICOS DE URUGUAY, POR PROCESO DE FABRICACIÓN, 2018-2032 (KILOTONELADAS)
TABLA 1979 MERCADO DE EXTRUSIÓN EN COMPUESTOS PLÁSTICOS DE URUGUAY, POR TIPO, 2018-2032 (MILES DE USD)
TABLA 1980 EXTRUSIÓN EN EL MERCADO DE COMPUESTOS PLÁSTICOS DE URUGUAY, POR SISTEMA DE PELETIZACIÓN, 2018-2032 (MILES DE USD)
TABLA 1981 MERCADO URUGUAY DE COMPUESTOS DE PLÁSTICO BASADOS EN MOLDEO POR INYECCIÓN, SEGÚN SISTEMA DE PELETIZACIÓN, 2018-2032 (MILES DE USD)
TABLA 1982 COMPACTACIÓN/PRESIONADO EN EL MERCADO DE COMPUESTOS PLÁSTICOS DE URUGUAY, POR SISTEMA DE PELETIZACIÓN, 2018-2032 (MILES DE USD)
TABLA 1983 URUGUAY MERCADO DE MEZCLA DE AMASADORAS/BANBURY EN COMPUESTOS DE PLÁSTICO, POR SISTEMA DE PELETIZACIÓN, 2018-2032 (MILES DE USD)
TABLA 1984 MERCADO URUGUAYO DE COMPUESTOS PLÁSTICOS, POR PROPIEDADES, 2018-2032 (MILES DE USD)
TABLA 1985 MERCADO DE COMPUESTOS PLÁSTICOS DE URUGUAY, POR APLICACIÓN, 2018-2032 (MILES DE USD)
TABLA 1986 MERCADO URUGUAYO DE COMPUESTOS PLÁSTICOS, POR APLICACIÓN, 2018-2032 (KILOTONELADAS)
TABLA 1987 MERCADO URUGUAY DE AUTOMOCIÓN EN COMPUESTOS PLÁSTICOS, POR CATEGORÍA, 2018-2032 (MILES DE USD)
TABLA 1988 COMPONENTES INTERIORES EN EL MERCADO DE COMPUESTOS PLÁSTICOS DE URUGUAY, POR TIPO, 2018-2032 (MILES DE USD)
TABLA 1989 PARTES DE CARROCERÍA EXTERIOR EN EL MERCADO DE COMPUESTOS PLÁSTICOS DE URUGUAY, POR TIPO, 2018-2032 (MILES DE USD)
TABLA 1990 URUGUAY APLICACIONES INTERNAS EN EL MERCADO DE COMPUESTOS PLÁSTICOS, POR TIPO, 2018-2032 (MILES DE USD)
TABLA 1991 MERCADO DE ENVASES DE MEZCLA PLÁSTICA EN URUGUAY, POR CATEGORÍA, 2018-2032 (MILES DE USD)
TABLA 1992 MERCADO URUGUAY DE ENVASES DE ALIMENTOS Y BEBIDAS EN COMPUESTOS PLÁSTICOS, POR TIPO, 2018-2032 (MILES DE USD)
TABLA 1993 MERCADO URUGUAY DE ENVASES INDUSTRIALES EN COMPUESTOS PLÁSTICOS, POR TIPO, 2018-2032 (MILES DE USD)
TABLA 1994 MERCADO DE ENVASES DE BIENES DE CONSUMO EN COMPUESTOS PLÁSTICOS DE URUGUAY, POR TIPO, 2018-2032 (MILES DE USD)
TABLA 1995 URUGUAY EDIFICACIÓN Y CONSTRUCCIÓN EN EL MERCADO DE COMPUESTOS PLÁSTICOS, POR CATEGORÍA, 2018-2032 (MILES DE USD)
TABLA 1996 MERCADO URUGUAY DE PRODUCTOS ELÉCTRICOS Y ELECTRÓNICOS EN COMPUESTOS PLÁSTICOS, POR CATEGORÍA, 2018-2032 (MILES DE USD)
TABLA 1997 MERCADO DE DISPOSITIVOS MÉDICOS EN COMPUESTOS PLÁSTICOS DE URUGUAY, POR CATEGORÍA, 2018-2032 (MILES DE USD)
TABLA 1998 MERCADO DE MUEBLES EN COMPUESTOS PLÁSTICOS DE URUGUAY, POR CATEGORÍA, 2018-2032 (MILES DE USD)
TABLA 1999 MERCADO DE ENERGÍA Y POTENCIA EN COMPUESTOS PLÁSTICOS DE URUGUAY, POR CATEGORÍA, 2018-2032 (MILES DE USD)
TABLA 2000 MERCADO DE COMPUESTOS PLÁSTICOS DE LA INDUSTRIA AEROESPACIAL Y DE DEFENSA DE URUGUAY, POR CATEGORÍA, 2018-2032 (MILES DE USD)
TABLA 2001 RESTO DE SUDAMÉRICA MERCADO DE COMPUESTOS PLÁSTICOS, POR TIPO DE POLÍMERO, 2018-2032 (MILES DE USD)
TABLA 2002 RESTO DE SUDAMÉRICA MERCADO DE COMPUESTOS PLÁSTICOS, POR TIPO DE POLÍMERO, 2018-2032 (KILOTONELADAS)
Lista de figuras
FIGURA 1 MERCADO MUNDIAL DE COMPUESTOS DE PLÁSTICO
FIGURA 2 MERCADO MUNDIAL DE COMPUESTOS DE PLÁSTICO: TRIANGULACIÓN DE DATOS
FIGURA 3 MERCADO MUNDIAL DE COMPUESTOS PLÁSTICOS: ANÁLISIS DROC
FIGURA 4 MERCADO MUNDIAL DE COMPUESTOS PLÁSTICOS: ANÁLISIS DEL MERCADO GLOBAL VS. REGIONAL.
FIGURA 5 MERCADO MUNDIAL DE COMPUESTOS DE PLÁSTICO: ANÁLISIS DE INVESTIGACIÓN DE EMPRESAS
FIGURA 6 MERCADO MUNDIAL DE COMPUESTOS DE PLÁSTICO: MODELADO MULTIVARIADO
FIGURA 7 MERCADO MUNDIAL DE COMPUESTOS DE PLÁSTICO: DATOS DEMOGRÁFICOS DE LAS ENTREVISTAS
FIGURA 8 MERCADO MUNDIAL DE COMPUESTOS DE PLÁSTICO: CUADRÍCULA DE POSICIÓN DE MERCADO DE DBMR
FIGURA 9 MERCADO MUNDIAL DE COMPUESTOS DE PLÁSTICO: CUADRÍCULA DE COBERTURA DE APLICACIONES DEL MERCADO
FIGURA 10 RESUMEN EJECUTIVO
FIGURA 11 MERCADO MUNDIAL DE COMPUESTOS DE PLÁSTICO: SEGMENTACIÓN
FIGURA 12 CINCO SEGMENTOS COMPONEN EL MERCADO MUNDIAL DE COMPUESTOS PLÁSTICOS, POR TIPO DE POLÍMERO
FIGURA 13 DECISIONES ESTRATÉGICAS
FIGURA 14 SE ESPERA QUE ASIA-PACÍFICO DOMINE EL MERCADO MUNDIAL DE COMPUESTOS DE PLÁSTICO Y QUE CREZCA CON LA CAGR MÁS ALTA EN EL PERÍODO DE PRONÓSTICO
FIGURA 15 SE ESPERA QUE EL CAMBIO HACIA COMPUESTOS PLÁSTICOS RECICLABLES Y BIODEGRADABLES DEBIDO A LA REGULACIÓN AMBIENTAL IMPULSE EL MERCADO MUNDIAL DE COMPUESTOS PLÁSTICOS DURANTE EL PERÍODO PRONOSTICADO DE 2025 A 2032
FIGURA 16 SE ESPERA QUE EL SEGMENTO DE TERMOPLÁSTICOS REPRESENTE LA MAYOR PARTICIPACIÓN DEL MERCADO MUNDIAL DE COMPUESTOS DE PLÁSTICO EN 2025 Y 2032
FIGURA 17 ASIA-PACÍFICO ES LA REGIÓN DE MÁS RÁPIDO CRECIMIENTO PARA EL MERCADO MUNDIAL DE COMPUESTOS DE PLÁSTICO EN EL PERÍODO DE PRONÓSTICO
FIGURA 18 ANÁLISIS DE LAS CINCO FUERZAS DE PORTER
FIGURA 19 MERCADO MUNDIAL DE COMPUESTOS DE PLÁSTICO: ANÁLISIS DE LA CADENA DE VALOR
FIGURA 20 ESCENARIO DE IMPORTACIÓN Y EXPORTACIÓN (MILES DE USD)
FIGURA 21 CAPACIDAD DE PRODUCCIÓN DE LOS MEJORES FABRICANTES
FIGURA 22 CÓDIGO IPC V/S NÚMERO DE PATENTES
FIGURA 23 NÚMERO DE PATENTES POR AÑO
FIGURA 24 NÚMERO DE PATENTES POR REGIÓN/PAÍS
FIGURA 25 PRINCIPALES SOLICITANTES DE PATENTES
FIGURA 26 MERCADO MUNDIAL DE COMPUESTOS DE PLÁSTICO, 2024-2032, PRECIO DE VENTA PROMEDIO (USD/KG)
FIGURA 27 IMPULSORES, RESTRICCIONES, OPORTUNIDADES Y DESAFÍOS DEL MERCADO MUNDIAL DE COMPUESTOS DE PLÁSTICO
FIGURA 28 MERCADO MUNDIAL DE COMPUESTOS DE PLÁSTICO: POR TIPO DE POLÍMERO, 2024
FIGURA 29 MERCADO MUNDIAL DE COMPUESTOS DE PLÁSTICO, POR TIPO DE FILTRO, 2024
FIGURA 30 MERCADO MUNDIAL DE COMPUESTOS DE PLÁSTICO, POR PROCESO DE FABRICACIÓN, 2024
FIGURA 31 MERCADO MUNDIAL DE COMPUESTOS DE PLÁSTICO, POR PROPIEDADES, 2024
FIGURA 32 MERCADO MUNDIAL DE COMPUESTOS DE PLÁSTICO, POR APLICACIÓN, 2024
FIGURA 33 MERCADO MUNDIAL DE COMPUESTOS DE PLÁSTICO: INSTANTÁNEA (2024)
FIGURA 34 MERCADO DE COMPUESTOS PLÁSTICOS DE AMÉRICA DEL NORTE: INSTANTÁNEA (2024)
FIGURA 35 MERCADO EUROPEO DE COMPUESTOS DE PLÁSTICO: INSTANTÁNEA (2024)
FIGURA 36 MERCADO DE COMPUESTOS PLÁSTICOS DE ASIA-PACÍFICO: INSTANTÁNEA (2024)
FIGURA 38 MERCADO DE COMPUESTOS PLÁSTICOS DE AMÉRICA DEL SUR: INSTANTÁNEA (2024)
FIGURA 39 MERCADO MUNDIAL DE COMPUESTOS DE PLÁSTICO: PARTICIPACIÓN DE LA EMPRESA 2024 (%)
FIGURA 40 MERCADO DE COMPUESTOS PLÁSTICOS DE AMÉRICA DEL NORTE: PARTICIPACIÓN DE LA EMPRESA 2024 (%)
FIGURA 41 MERCADO EUROPEO DE COMPUESTOS DE PLÁSTICO: PARTICIPACIÓN DE LA EMPRESA 2024 (%)
FIGURA 42 MERCADO DE COMPUESTOS PLÁSTICOS DE ASIA-PACÍFICO: PARTICIPACIÓN DE LA EMPRESA 2024 (%)
Metodología de investigación
La recopilación de datos y el análisis del año base se realizan utilizando módulos de recopilación de datos con muestras de gran tamaño. La etapa incluye la obtención de información de mercado o datos relacionados a través de varias fuentes y estrategias. Incluye el examen y la planificación de todos los datos adquiridos del pasado con antelación. Asimismo, abarca el examen de las inconsistencias de información observadas en diferentes fuentes de información. Los datos de mercado se analizan y estiman utilizando modelos estadísticos y coherentes de mercado. Además, el análisis de la participación de mercado y el análisis de tendencias clave son los principales factores de éxito en el informe de mercado. Para obtener más información, solicite una llamada de un analista o envíe su consulta.
La metodología de investigación clave utilizada por el equipo de investigación de DBMR es la triangulación de datos, que implica la extracción de datos, el análisis del impacto de las variables de datos en el mercado y la validación primaria (experto en la industria). Los modelos de datos incluyen cuadrícula de posicionamiento de proveedores, análisis de línea de tiempo de mercado, descripción general y guía del mercado, cuadrícula de posicionamiento de la empresa, análisis de patentes, análisis de precios, análisis de participación de mercado de la empresa, estándares de medición, análisis global versus regional y de participación de proveedores. Para obtener más información sobre la metodología de investigación, envíe una consulta para hablar con nuestros expertos de la industria.
Personalización disponible
Data Bridge Market Research es líder en investigación formativa avanzada. Nos enorgullecemos de brindar servicios a nuestros clientes existentes y nuevos con datos y análisis que coinciden y se adaptan a sus objetivos. El informe se puede personalizar para incluir análisis de tendencias de precios de marcas objetivo, comprensión del mercado de países adicionales (solicite la lista de países), datos de resultados de ensayos clínicos, revisión de literatura, análisis de mercado renovado y base de productos. El análisis de mercado de competidores objetivo se puede analizar desde análisis basados en tecnología hasta estrategias de cartera de mercado. Podemos agregar tantos competidores sobre los que necesite datos en el formato y estilo de datos que esté buscando. Nuestro equipo de analistas también puede proporcionarle datos en archivos de Excel sin procesar, tablas dinámicas (libro de datos) o puede ayudarlo a crear presentaciones a partir de los conjuntos de datos disponibles en el informe.

