Middle East And Africa Soft Magnetic Materials Market
Tamaño del mercado en miles de millones de dólares
Tasa de crecimiento anual compuesta (CAGR) :
% 
 USD
2.15 Billion
USD
3.46 Billion
2024
2032
USD
2.15 Billion
USD
3.46 Billion
2024
2032
| 2025 –2032 | |
| USD 2.15 Billion | |
| USD 3.46 Billion | |
| % | |
|
Segmentación del mercado de materiales magnéticos blandos en Oriente Medio y África, tipo de producto (láminas y tiras, núcleos y tipos de núcleo, polvo y gránulos, cintas y láminas, componentes ensamblados, lingotes y otros), tipo de material (ferritas blandas, aceros eléctricos (Fe-Si), hierro en polvo y polvos metálicos, aleaciones amorfas y nanocristalinas, aleaciones magnéticas blandas, permalloy, permendur, CIP: polvo de hierro carbonílico (CIP), polvo de hierro de alta pureza, polvo de acero inoxidable de calidad solenoide, polvo Sendust (Fe-Si-Al), polvo de hierro-silicio, películas delgadas y recubrimientos magnéticos, otros), proceso de fabricación (laminado en frío y recocido, hilado en fusión, pulvimetalurgia, otros), aplicación (inducción electromagnética, conversión de energía electromagnética, acondicionamiento y conversión de energía, detección y detección electromagnética, blindaje magnético, sistemas de magnetización y desmagnetización, almacenamiento y transferencia de energía, grabación magnética y almacenamiento de datos, procesamiento de señales y ruido). Supresión, Otros) Usuario final (Industria automotriz, Servicios eléctricos y de energía, Electrónica de consumo, TI y telecomunicaciones, Fabricación industrial, Aeroespacial y defensa, Salud y medicina, Energía renovable, Industria de la construcción, Otros) Canal de distribución (Ventas directas Ventas indirectas) - Tendencias de la industria y pronóstico hasta 2032
Tamaño del mercado de materiales magnéticos blandos en Oriente Medio y África
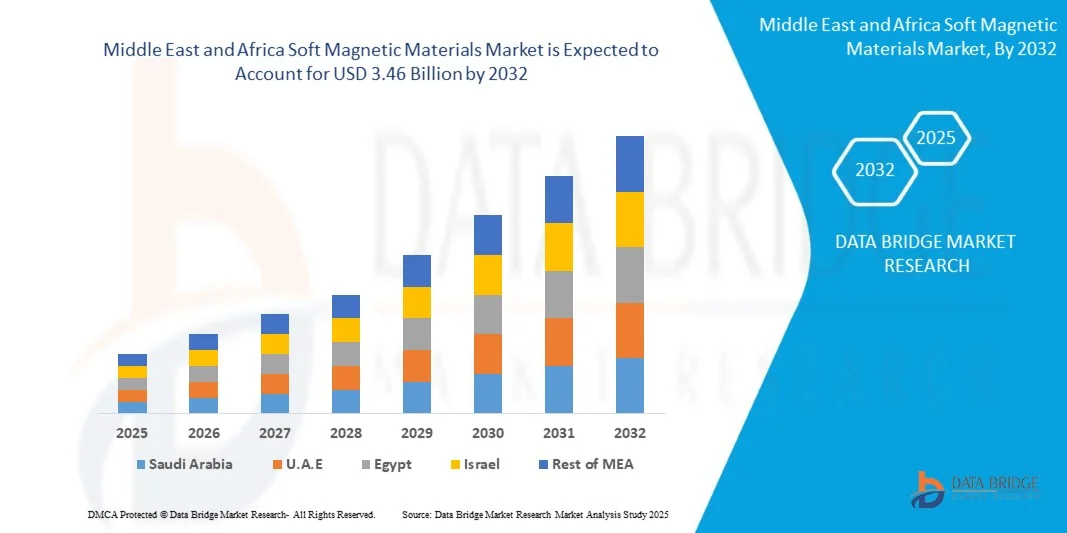
- Se espera que el mercado de materiales magnéticos blandos de Oriente Medio y África alcance los 3,46 mil millones de dólares en 2032, desde los 2,15 mil millones de dólares en 2024, creciendo con una CAGR sustancial del 6,3 % en el período de pronóstico de 2025 a 2032.
- El crecimiento del mercado de materiales magnéticos blandos en Oriente Medio y África se debe en gran medida a la rápida expansión de los sectores de la electrónica, la automoción y las energías renovables, donde estos materiales son esenciales para la fabricación de transformadores, motores eléctricos, inductores y generadores. La creciente adopción de vehículos eléctricos (VE) y tecnologías de energías renovables impulsa aún más la demanda de materiales magnéticos blandos de alto rendimiento.
- La expansión del mercado se ve impulsada por la creciente industrialización, las iniciativas gubernamentales que promueven tecnologías de eficiencia energética y las continuas inversiones en investigación y desarrollo para mejorar las propiedades magnéticas y el rendimiento de los materiales. Además, la creciente presencia de fabricantes locales y las capacidades de producción rentables en países como Estados Unidos y Canadá contribuyen al crecimiento y la competitividad del mercado de la región.
Análisis del mercado de materiales magnéticos blandos en Oriente Medio y África
- La creciente demanda de motores eléctricos, transformadores e inductores de alta eficiencia, impulsada por la automatización industrial, la adopción de energías renovables y el creciente mercado de vehículos eléctricos (VE), es una tendencia importante que impulsa la demanda de materiales magnéticos blandos en la región de Medio Oriente y África.
- Los materiales magnéticos blandos sirven como un componente crítico en los sistemas eléctricos energéticamente eficientes, apoyando la generación y transmisión de energía y las aplicaciones industriales en toda la región, lo que los hace indispensables para el crecimiento tecnológico e industrial.
- Arabia Saudita es el país dominante en el mercado de materiales magnéticos blandos de Medio Oriente y África, representando más del 24,96% de la participación de mercado en 2025, impulsado por su gran base de fabricación, rápido crecimiento industrial y grandes inversiones en energía renovable y vehículos eléctricos.
- Arabia Saudita es el país de más rápido crecimiento en la región, con una CAGR del 6,9%, lo que refleja una mayor modernización industrial, adopción de tecnología y demanda de materiales magnéticos blandos de alto rendimiento.
- El segmento de láminas y tiras es el tipo de producto dominante en el mercado de materiales magnéticos blandos de América del Norte, Medio Oriente y África, con una participación de mercado del 32,72 % en 2025. Esto refleja el sólido crecimiento de los sistemas automatizados, lo que requiere el despliegue continuo y estratégico de cajas de engranajes de precisión para un control de movimiento preciso, posicionando estos sistemas como un componente vital en el futuro industrial de América del Norte.
Alcance del informe y segmentación del mercado de materiales magnéticos blandos en Oriente Medio y África
|
Atributos |
Perspectivas clave del mercado de materiales magnéticos blandos en Oriente Medio y África |
|
Segmentos cubiertos |
|
|
Países cubiertos |
Oriente Medio y África
|
|
Actores clave del mercado |
|
|
Oportunidades de mercado |
|
|
Conjuntos de información de datos de valor añadido |
Además de los conocimientos sobre escenarios de mercado como valor de mercado, tasa de crecimiento, segmentación, cobertura geográfica y actores principales, los informes de mercado seleccionados por Data Bridge Market Research también incluyen análisis de importación y exportación, descripción general de la capacidad de producción, análisis del consumo de producción, análisis de tendencias de precios, escenario de cambio climático, análisis de la cadena de suministro, análisis de la cadena de valor, descripción general de materias primas/consumibles, criterios de selección de proveedores, análisis PESTLE, análisis de Porter y marco regulatorio. |
Tendencias del mercado de materiales magnéticos blandos en Oriente Medio y África
“Expansión de la infraestructura de energía renovable”
- La expansión de la infraestructura de energías renovables, incluyendo turbinas eólicas, inversores solares y redes inteligentes, es una tendencia significativa que impulsa la demanda de materiales magnéticos blandos en la región de Oriente Medio y África. A medida que los países de la región buscan aumentar su capacidad de energía renovable para cumplir con los objetivos de sostenibilidad, aumenta la necesidad de núcleos magnéticos de alto rendimiento en generadores y transformadores.
- Los materiales magnéticos blandos desempeñan un papel fundamental para garantizar la eficiencia, reducir las pérdidas de energía y respaldar la conversión confiable de energía en sistemas de energía renovable, lo que los convierte en componentes esenciales del panorama energético en evolución.
- La creciente adopción de proyectos renovables a gran escala, combinada con iniciativas de modernización de la red, conduce a una mayor demanda de materiales magnéticos blandos avanzados capaces de soportar altos voltajes, corrientes y tensiones operativas.
- Por ejemplo, China, India y Japón están invirtiendo fuertemente en capacidad eólica y solar, requiriendo componentes magnéticos de alta calidad para optimizar la generación de energía y la eficiencia de transmisión.
- El continuo despliegue de tecnologías de energía renovable posiciona a los materiales magnéticos blandos como un facilitador clave de la transición de Medio Oriente y África hacia un ecosistema energético sostenible y resiliente.
Dinámica del mercado de materiales magnéticos blandos en Oriente Medio y África
Conductor
Creciente demanda de productos promocionales y materiales publicitarios
- La creciente demanda de productos promocionales y materiales publicitarios, como tarjetas de presentación magnéticas, imanes de marca para refrigeradores y señalización magnética flexible, está surgiendo como un nuevo impulsor para el mercado de materiales magnéticos blandos de Medio Oriente y África en la región de Asia y el Pacífico.
- A medida que las marcas y los especialistas en marketing adoptan cada vez más medios magnéticos para el marketing experiencial y las exhibiciones en el punto de venta, se requieren tiras y láminas magnéticas flexibles en bruto hechas de materiales magnéticos blandos en volúmenes mayores.
- Estos materiales sirven como base para crear artículos promocionales magnéticos livianos, rentables y reutilizables que satisfacen las necesidades de los mercados de India, China, el Sudeste Asiático y Australia, donde el gasto en marketing y las actividades de activación de marca están aumentando.
- Los proveedores de materiales magnéticos blandos están posicionando aleaciones y láminas magnéticas más delgadas y de forma más flexible para satisfacer los requisitos de los productores de productos promocionales y publicitarios, lo que permite un mayor uso más allá de los motores y transformadores industriales tradicionales.
Por ejemplo
- Según informó Antalis UK en junio de 2021, la compañía amplió su gama de materiales magnéticos para displays y láminas imprimibles para atender a las marcas minoristas que utilizan gráficos magnéticos para promociones de temporada y publicidad en el punto de venta. Los nuevos materiales permiten una rápida instalación y sustitución de elementos visuales, lo que refleja el creciente uso de materiales magnéticos blandos y flexibles en aplicaciones de marketing.
- En febrero de 2022, Visual Magnetics, fabricante estadounidense, presentó su sistema de gráficos magnéticos ActiveWall, diseñado para entornos de marca y señalización en comercios. Esta solución permite a los profesionales del marketing actualizar fácilmente los gráficos de pared mediante películas magnéticas receptivas, lo que promueve la sostenibilidad y la flexibilidad en los materiales de exposición promocionales.
- En diciembre de 2023, Arnold Magnetic Technologies Corporation, la empresa, destacó su papel premagnetizado imprimible ENTICE, diseñado para aplicaciones de marketing que incluyen letreros interiores, calendarios, cupones y tarjetas de presentación.
- La creciente demanda de productos promocionales y materiales publicitarios en la región de Oriente Medio y África se está convirtiendo en un factor clave para el mercado de materiales magnéticos blandos en Oriente Medio y África. El auge de las iniciativas de marketing de marca y las campañas experienciales impulsa a los fabricantes a producir láminas, tiras y artículos magnéticos flexibles y personalizados para tarjetas de visita, imanes para nevera y expositores en el punto de venta. Estos materiales magnéticos blandos permiten crear productos promocionales ligeros, reutilizables y económicos, lo que los hace esenciales para las aplicaciones publicitarias. A medida que las actividades de marketing y activación de marca se expanden en países como China, India y Australia, la demanda de materiales magnéticos blandos en productos promocionales continúa fortaleciéndose, impulsando el crecimiento general del mercado.
Restricción/Desafío
“Volatilidad en los precios de las materias primas”
- La fabricación depende en gran medida de metales como el hierro, el níquel y el cobalto. Las fluctuaciones repentinas de precios de estas materias primas incrementan los costos de producción, lo que dificulta que los fabricantes mantengan precios estables, especialmente en aplicaciones sensibles a los costos, como la electrónica de consumo y los componentes automotrices.
- La volatilidad de los precios de las materias primas puede interrumpir las cadenas de suministro, lo que provoca retrasos en la adquisición y la fabricación. Esta imprevisibilidad dificulta la entrega oportuna de materiales magnéticos blandos a las industrias de uso final, lo que ralentiza los plazos de los proyectos y limita la expansión del mercado en la región de Oriente Medio y África.
- Las fluctuaciones de los precios de las materias primas afectan de forma desproporcionada a las empresas más pequeñas y a los nuevos participantes, ya que a menudo carecen de contratos a largo plazo con proveedores o de reservas financieras. Esto crea barreras de entrada, reduce la competitividad del mercado y ralentiza el crecimiento general del sector de los materiales magnéticos blandos.
Por ejemplo,
- En marzo de 2022, los precios del níquel en la Bolsa de Metales de Londres (LME) se dispararon más de un 250 % en dos días, superando brevemente los 100 000 USD por tonelada, tras las preocupaciones sobre el suministro relacionadas con el conflicto entre Rusia y Ucrania. Este aumento sin precedentes interrumpió las cadenas globales de suministro de aleaciones e incrementó directamente los costes para los fabricantes de materiales magnéticos blandos a base de níquel.
- En octubre de 2024, los precios del cobalto experimentaron una mayor volatilidad debido a las fluctuaciones de la oferta en la República Democrática del Congo y la débil demanda de vehículos eléctricos en China. La inestabilidad de los precios dificultó la planificación de las compras para los productores de aleaciones magnéticas que dependen de materiales magnéticos blandos a base de cobalto.
Alcance del mercado de materiales magnéticos blandos en Oriente Medio y África
El mercado de materiales magnéticos blandos de Oriente Medio y África está segmentado por tipo de producto, tipo de material, proceso de fabricación, aplicación, usuario final y canal de distribución.
• Por tipo de producto
Según el tipo de producto, el mercado de materiales magnéticos blandos se segmenta en láminas y tiras, núcleos y tipos de núcleo, cintas y láminas, polvos y gránulos, componentes ensamblados, lingotes y otros. El segmento de núcleos y tipos de núcleo se clasifica a su vez en núcleos E, núcleos toroidales y núcleos C, mientras que el segmento de cintas y láminas se divide en cintas amorfas y cintas nanocristalinas. Se prevé que el segmento de láminas y tiras domine el mercado debido a su amplio uso en transformadores, motores eléctricos y generadores, componentes clave en aplicaciones automotrices, energéticas e industriales. Su excelente permeabilidad magnética, bajas pérdidas en el núcleo y facilidad de fabricación los hacen ideales para sistemas de conversión y transmisión de energía de alta eficiencia.
Se proyecta que el segmento de láminas y flejes sea el de mayor crecimiento debido a la creciente demanda de dispositivos eléctricos y transformadores energéticamente eficientes en la región de Oriente Medio y África. Estos materiales ofrecen un rendimiento magnético superior, menores pérdidas en el núcleo y una mayor estabilidad térmica, lo que los hace ideales para aplicaciones de alto rendimiento en motores, generadores y sistemas de distribución eléctrica. Este crecimiento se ve impulsado aún más por los avances tecnológicos en los procesos de fabricación, como el acero eléctrico de grano orientado y no orientado, que mejora las propiedades magnéticas y la eficiencia operativa. Además, la creciente adopción de vehículos eléctricos, sistemas de energía renovable y la automatización industrial está impulsando la demanda de materiales magnéticos blandos de láminas y flejes de alta calidad, lo que posiciona a este segmento para una rápida expansión.
• Por tipo de material
Según el tipo de material, el mercado de materiales magnéticos blandos se segmenta en aceros eléctricos (Fe-Si), aleaciones amorfas y nanocristalinas, ferritas blandas, polvos de hierro y metal, aleaciones magnéticas blandas, películas delgadas y recubrimientos magnéticos, entre otros. El segmento de aceros eléctricos (Fe-Si) se divide a su vez en tipos de grano orientado (GO) y no orientado (NO), mientras que el segmento de ferritas blandas se clasifica en ferritas de MnZn y ferritas de NiZn. Se espera que el segmento de aceros eléctricos (Fe-Si) domine el mercado debido a su amplia aplicación en transformadores, motores y generadores, esenciales para la generación, transmisión y movilidad eléctrica. Su alta permeabilidad magnética, baja pérdida por histéresis y excelente eficiencia energética los convierten en la opción preferida en aplicaciones industriales y de servicios públicos.
Se proyecta que los aceros eléctricos (Fe-Si) sean el segmento de mayor crecimiento en el mercado de materiales magnéticos blandos de Oriente Medio y África, impulsado por la creciente demanda de dispositivos eléctricos, transformadores y motores energéticamente eficientes en la región. Los avances tecnológicos en aceros eléctricos de grano orientado y no orientado mejoran el rendimiento magnético, reducen las pérdidas de energía y mejoran la estabilidad térmica, lo que los hace cruciales para los sistemas modernos de generación y distribución de energía. La creciente adopción de vehículos eléctricos, infraestructuras de energía renovable y automatización industrial está acelerando aún más la demanda de aceros Fe-Si de alta calidad. Se espera que las continuas innovaciones en los procesos de fabricación y la optimización del rendimiento mantengan un rápido crecimiento en este segmento durante el período de pronóstico.
• Por proceso de fabricación
Según el proceso de fabricación, el mercado de materiales magnéticos blandos se segmenta en laminado en frío y recocido, hilado por fusión, pulvimetalurgia y otros. Se prevé que este segmento domine el mercado gracias a su capacidad para mejorar la permeabilidad magnética, reducir las pérdidas en el núcleo y mejorar el acabado superficial y la precisión dimensional de los materiales. Este proceso permite un control preciso de la microestructura y la textura, lo que se traduce en un rendimiento magnético superior.
Se proyecta que el segmento de laminación en frío y recocido sea el de mayor crecimiento en el mercado de materiales magnéticos blandos de Oriente Medio y África, impulsado por la creciente demanda de aceros eléctricos de alto rendimiento utilizados en transformadores, motores y aplicaciones de energías renovables. Los procesos avanzados de laminación en frío y recocido mejoran la orientación del grano, reducen las pérdidas en el núcleo y mejoran la permeabilidad magnética, lo que aumenta la eficiencia de los materiales para aplicaciones de ahorro energético. El crecimiento de los vehículos eléctricos, las redes inteligentes y la automatización industrial en Oriente Medio y África está impulsando su adopción, mientras que las continuas innovaciones en la optimización de procesos y el control de calidad refuerzan aún más las perspectivas de expansión del mercado de este segmento durante el período de pronóstico.
• Por aplicación
Según su aplicación, el mercado de materiales magnéticos blandos se segmenta en inducción electromagnética, conversión de energía electromagnética, blindaje magnético, detección y detección electromagnética, acondicionamiento y conversión de potencia, procesamiento de señales y supresión de ruido, almacenamiento y transferencia de energía, registro magnético y almacenamiento de datos, sistemas de magnetización y desmagnetización, entre otros. El segmento de inducción electromagnética se clasifica a su vez en núcleos de transformadores, inductores y reactancias, núcleos de reactores, amplificadores magnéticos y núcleos de balasto, mientras que el segmento de acondicionamiento y conversión de potencia se divide en transformadores SMPS, núcleos de convertidores CC-CC, inductores de inversores, filtros de potencia y reactores de línea. Se prevé que el segmento de inducción electromagnética domine el mercado debido a su amplio uso en transformadores, inductores, reactores y otros dispositivos de conversión de potencia que constituyen la columna vertebral de la infraestructura eléctrica moderna. Este segmento se beneficia de la creciente demanda de sistemas eficientes de transferencia y distribución de energía, especialmente en aplicaciones de energías renovables y redes inteligentes.
Se proyecta que el segmento de inducción electromagnética sea el de mayor crecimiento en el mercado de materiales magnéticos blandos de Oriente Medio y África, impulsado por la creciente demanda de transformadores, motores eléctricos e inductores energéticamente eficientes en aplicaciones industriales y de consumo. Los avances en la tecnología de inducción mejoran el control del flujo magnético, reducen las pérdidas de energía y permiten la miniaturización de dispositivos eléctricos, lo que hace que estos materiales sean cada vez más esenciales en la electrónica moderna y los sistemas de energía renovable. El crecimiento de los vehículos eléctricos, las redes inteligentes y los equipos industriales de alto rendimiento en Oriente Medio y África está acelerando su adopción. La investigación continua en la composición de materiales y las técnicas de procesamiento respalda aún más la rápida expansión del segmento durante el período de pronóstico.
• Por el usuario final
Según el usuario final, el mercado de materiales magnéticos blandos se segmenta en las industrias automotriz, eléctrica y de servicios públicos, electrónica de consumo, informática y telecomunicaciones, fabricación industrial, aeroespacial y defensa, salud y medicina, energías renovables y construcción. Se prevé que el segmento de la industria automotriz domine el mercado debido a la rápida electrificación de los vehículos y la creciente adopción de vehículos eléctricos e híbridos (VE/VEH). Estos materiales desempeñan un papel crucial en motores, sensores, actuadores, transformadores e inductores, mejorando la eficiencia energética y el rendimiento magnético. La transición del sector automotriz hacia componentes ligeros y energéticamente eficientes ha incrementado aún más la demanda de materiales magnéticos blandos, como aceros eléctricos y aleaciones amorfas.
Se proyecta que el segmento de la industria automotriz sea el de mayor crecimiento en el mercado de materiales magnéticos blandos en Oriente Medio y África, impulsado por la rápida adopción de vehículos eléctricos (VE), vehículos híbridos y sistemas avanzados de asistencia al conductor (ADAS). La creciente demanda de motores eléctricos y componentes de tren motriz ligeros y de alta eficiencia está impulsando el uso de materiales magnéticos blandos para reducir las pérdidas de energía y mejorar el rendimiento. Además, las iniciativas gubernamentales que promueven la movilidad sostenible y las regulaciones de emisiones más estrictas están acelerando la transición a los VE, impulsando el crecimiento del mercado. Las continuas innovaciones en ingeniería de materiales y diseño magnético para aplicaciones automotrices impulsan aún más la expansión del segmento en Oriente Medio y África, así como en los mercados globales.
• Por canal de distribución
Canal de Distribución: el mercado se segmenta en Ventas Directas e Indirectas. Se espera que el segmento de Ventas Directas domine el mercado gracias a su capacidad para ofrecer relaciones más sólidas con los clientes, un servicio personalizado y soporte técnico a medida.
Los fabricantes pueden colaborar estrechamente con clientes industriales clave, como empresas de automoción, electrónica y generación de energía, para garantizar el cumplimiento preciso de las especificaciones de los materiales, los estándares de calidad y los plazos de entrega. La venta directa también permite una mejor integración de los servicios posventa, una respuesta más rápida a las demandas del mercado y una retroalimentación directa para la mejora de los productos. Además, los materiales magnéticos blandos personalizados y de alto valor suelen requerir negociación directa, lo que convierte a este canal en el modo de distribución preferido y dominante.
Análisis regional del mercado de materiales magnéticos blandos en Oriente Medio y África
- Creciente industrialización e infraestructura digital: Oriente Medio y África están experimentando un importante crecimiento del mercado de materiales magnéticos blandos, impulsado por la rápida industrialización, la expansión de proyectos de energías renovables y las inversiones a gran escala en infraestructura digital. Estos avances hacen que los materiales magnéticos blandos sean esenciales para respaldar las estrategias de crecimiento industrial y tecnológico de la región.
- Redes inteligentes y centros de datos: la creciente adopción de redes inteligentes, transformadores energéticamente eficientes y centros de datos de alta capacidad en Medio Oriente y África, junto con la creciente penetración de Internet y la creciente automatización industrial, es un catalizador importante para la creciente demanda de materiales magnéticos blandos en la región.
- Expansión de la industria manufacturera, automotriz y de telecomunicaciones: La constante expansión y modernización de la infraestructura de fabricación, automotriz y de telecomunicaciones, especialmente en las economías emergentes de Medio Oriente y África como Sudáfrica, Emiratos Árabes Unidos y Arabia Saudita, junto con la necesidad de una distribución de energía confiable y aplicaciones electrónicas, están acelerando aún más la adopción de materiales magnéticos blandos de alto rendimiento en toda la región.
Análisis del mercado de materiales magnéticos blandos de Arabia Saudita, Oriente Medio y África
El mercado de materiales magnéticos blandos en Arabia Saudita, Oriente Medio y África está impulsado principalmente por las ambiciosas iniciativas Visión 2030 del país, que incluyen una rápida diversificación industrial, importantes inversiones en proyectos de energía renovable (como parques solares y eólicos) y el desarrollo de gigaproyectos que requieren infraestructura avanzada. Estas iniciativas, en conjunto, demandan materiales magnéticos blandos de alto rendimiento para una conversión energética eficiente, aplicaciones de redes inteligentes y sistemas electrónicos robustos. La creciente demanda de transformadores, inductores y motores eléctricos avanzados en los sectores automotriz, industrial y de electrónica de consumo, en expansión, impulsa aún más el crecimiento del mercado. Además, el aumento de las inversiones en investigación y desarrollo nacionales y los esfuerzos de localización están impulsando la innovación de productos, lo que permite a los fabricantes saudíes reducir la dependencia de las importaciones y, al mismo tiempo, satisfacer las crecientes necesidades de infraestructura digital y de eficiencia energética del país.
Perspectiva del mercado de materiales magnéticos blandos en los Emiratos Árabes Unidos, Oriente Medio y África
El mercado de materiales magnéticos blandos en los Emiratos Árabes Unidos (EAU) está impulsado principalmente por la creciente diversificación económica del país, la expansión de la infraestructura de energías renovables (incluidas importantes iniciativas de energía solar) y el rápido crecimiento de los sectores automotriz y electrónico, que requieren materiales magnéticos blandos eficientes y de alto rendimiento para transformadores, motores e inductores. La creciente adopción de vehículos eléctricos, redes inteligentes y electrodomésticos de bajo consumo en desarrollos comerciales y residenciales está impulsando aún más la demanda en todo el país. Además, las iniciativas gubernamentales que apoyan la innovación tecnológica y la fabricación avanzada están fomentando la producción y la innovación locales, reduciendo la dependencia de las importaciones y atendiendo la creciente demanda de materiales magnéticos blandos confiables, de alta capacidad y tecnológicamente avanzados en la creciente infraestructura industrial y digital de los EAU.
Cuota de mercado de materiales magnéticos blandos en Oriente Medio y África
La industria de materiales magnéticos blandos está liderada principalmente por empresas bien establecidas, entre las que se incluyen:
- MMG India Pvt Ltd (India)
- Grupo AMES Sinterización, SA (España)
- MATE CO., LTD (Corea del Sur)
- Arnold Magnetic Technologies (EE. UU.)
- VOESTALPINE AG (Austria)
- FERROXCUBE INTERNATIONAL HOLDING BV (Países Bajos)
- Tecnología avanzada y materiales Co., Ltd. (China)
- GKN METALURGIA DE PULVIDOS (REINO UNIDO)
- Nippon Steel Corporation (Japón)
- POSCO HOLDINGS (Corea del Sur)
- PROTERIAL, Ltd. (Japón)
- VACUUMSCHMELZE GmbH & Co. KG (Alemania)
- DMEGC MAGNETICS CO., LTD. (China)
- Daido Steel Co., Ltd. (Japón)
- Kede Magnetics (China)
- THYSSENKRUPP AG (Alemania)
- TDK CORPORATION (Japón)
- Tata Steel Ltd. (India)
- JFE STEEL CORPORATION (Japón)
Últimos avances en el mercado de materiales magnéticos blandos en Oriente Medio y África
- En enero de 2023, Hitachi Metals anunció una expansión estratégica de sus instalaciones de producción en Canadá para satisfacer la creciente demanda de materiales magnéticos blandos en vehículos eléctricos y aplicaciones de energías renovables. Esta medida fortalece su presencia de fabricación local en Asia-Pacífico, mejorando la capacidad de respuesta de la cadena de suministro y atendiendo el crecimiento regional de vehículos eléctricos y energías renovables. Esta expansión demuestra que las empresas globales reconocen a Asia-Pacífico como un mercado clave en crecimiento para los materiales magnéticos blandos.
- En junio de 2023, Arnold Magnetic Technologies completó la adquisición de una empresa de fabricación especializada en materiales magnéticos blandos de alto rendimiento para aplicaciones automotrices. Esta adquisición refuerza la oferta global de Arnold en el segmento automotriz, lo que a su vez impacta en los mercados de Asia-Pacífico (APAC), dado el fuerte crecimiento de los vehículos eléctricos y la automoción en la región. Esto indica que la consolidación y la expansión de la capacidad están en marcha y afectarán la cadena de suministro de materiales magnéticos blandos de Asia-Pacífico.
SKU-
Obtenga acceso en línea al informe sobre la primera nube de inteligencia de mercado del mundo

- Panel de análisis de datos interactivo
- Panel de análisis de empresas para oportunidades con alto potencial de crecimiento
- Acceso de analista de investigación para personalización y consultas
- Análisis de la competencia con panel interactivo
- Últimas noticias, actualizaciones y análisis de tendencias
- Aproveche el poder del análisis de referencia para un seguimiento integral de la competencia
Tabla de contenido
1 INTRODUCCIÓN
1.1 OBJETIVOS DEL ESTUDIO
1.2 DEFINICIÓN DE MERCADO
1.3 RESUMEN
1.4 LIMITACIONES
1.5 MERCADOS CUBIERTOS
2 SEGMENTACIÓN DEL MERCADO
2.1 MERCADOS CUBIERTOS
2.2 ÁMBITO GEOGRÁFICO
2,3 AÑOS CONSIDERADOS PARA EL ESTUDIO
2.4 MONEDA Y PRECIOS
2.5 MODELO DE VALIDACIÓN DE DATOS TRÍPODE DBMR
2.6 MODELADO MULTIVARIADO
2.7 ENTREVISTAS PRINCIPALES CON LÍDERES DE OPINIÓN CLAVE
2.8 CUADRÍCULA DE POSICIÓN DE MERCADO DBMR
2.9 ANÁLISIS DE PARTICIPACIÓN DE PROVEEDORES DE DBMR
2.1 CUADRÍCULA DE COBERTURA DE APLICACIONES DEL MERCADO
2.11 FUENTES SECUNDARIAS
2.12 SUPUESTOS
3 RESUMEN EJECUTIVO
4 INFORMACIÓN PREMIUM
4.1 PERSPECTIVA DE LA MARCA
4.1.1 ANÁLISIS COMPARATIVO DE MARCAS DEL MERCADO DE MATERIALES MAGNÉTICOS BLANDO DE ORIENTE MEDIO Y ÁFRICA
4.1.2 RESUMEN DEL PRODUCTO VS. MARCA
4.1.3 DESCRIPCIÓN GENERAL DEL PRODUCTO
4.1.4 DESCRIPCIÓN GENERAL DE LA MARCA
4.2 ESCENARIO DE CAMBIO CLIMÁTICO – MERCADO DE MATERIALES MAGNÉTICOS BLANDO
4.2.1 PREOCUPACIONES AMBIENTALES
4.2.2 RESPUESTA DE LA INDUSTRIA
4.2.3 EL PAPEL DEL GOBIERNO
4.2.4 RECOMENDACIONES DE LOS ANALISTAS
4.2.5 CONCLUSIÓN
4.3 COMPORTAMIENTO DE COMPRA DEL CONSUMIDOR – MERCADO DE MATERIALES MAGNÉTICOS BLANDO EN ORIENTE MEDIO Y ÁFRICA
4.3.1 ¿QUÉ ES EL COMPORTAMIENTO DEL CONSUMIDOR?
4.3.2 RECONOCIMIENTO Y CONCIENCIACIÓN DEL PROBLEMA
4.3.3 BÚSQUEDA DE INFORMACIÓN
4.3.4 EVALUACIÓN DE ALTERNATIVAS
4.3.5 DECISIÓN DE COMPRA
4.3.6 COMPORTAMIENTO POST-COMPRA
4.3.7 INFORMACIÓN DEMOGRÁFICA
4.3.8 CONCLUSIÓN
4.4 ANÁLISIS DEL ECOSISTEMA INDUSTRIAL
4.4.1 EMPRESAS DESTACADAS
4.4.2 PEQUEÑAS Y MEDIANAS EMPRESAS
4.4.3 USUARIOS FINALES
4.4.4 CONCLUSIÓN
4.5 ENCUESTA DE PRECIOS
4.5.1 DESCRIPCIÓN GENERAL DE LA COMPAÑÍA MAXWELL
4.5.2 PRODUCTOS Y TECNOLOGÍAS
4.5.3 DESARROLLOS ESTRATÉGICOS
4.6 CORPORACIÓN IWATANI
4.6.1 DESCRIPCIÓN GENERAL DE LA EMPRESA
4.6.2 PRODUCTOS Y TECNOLOGÍAS
4.6.3 DESARROLLOS ESTRATÉGICOS
4.7 MATERIAL
4.7.1 ACERO ELECTROMAGNÉTICO CON ALTO CONTENIDO DE SILICIO (FE-6.5 SI)
4.7.2 Ε-ÓXIDO DE HIERRO (Ε-FE₂O₃)
4.8 SEGUIMIENTO DE INNOVACIÓN Y ANÁLISIS ESTRATÉGICO
4.8.1 INTRODUCCIÓN
4.8.2 ANÁLISIS DE GRANDES ACUERDOS Y ALIANZAS ESTRATÉGICAS
4.8.3 EMPRESAS CONJUNTAS
4.8.4 FUSIONES Y ADQUISICIONES
4.8.5 LICENCIAS Y ASOCIACIONES
4.8.6 COLABORACIONES TECNOLÓGICAS
4.8.7 DESINVERSIONES ESTRATÉGICAS
4.8.8 NÚMERO DE PRODUCTOS EN DESARROLLO
4.8.9 ETAPA DE DESARROLLO
4.8.10 CRONOGRAMAS E HITOS
4.8.11 ESTRATEGIAS Y METODOLOGÍAS DE INNOVACIÓN
4.8.12 EVALUACIÓN Y MITIGACIÓN DE RIESGOS
4.9 ANÁLISIS DE PATENTES
4.9.1 CALIDAD Y RESISTENCIA DE LA PATENTE
4.9.2 PANORAMA DE PATENTES REGIONALES
4.9.3 ESTRATEGIA Y GESTIÓN DE LA PROPIEDAD INTELECTUAL
4.9.4 FAMILIAS DE PATENTES
4.9.5 LICENCIAS Y COLABORACIÓN
4.1 COBERTURA DE MATERIA PRIMA
4.10.1 HIERRO Y ACERO CON BAJO CONTENIDO DE CARBONO
4.10.2 ALEACIONES DE SILICIO (ACERO ELÉCTRICO)
4.10.3 ALEACIONES DE NÍQUEL-HIERRO
4.10.4 ALEACIONES DE HIERRO-COBALTO
4.10.5 ALEACIONES AMORFAS Y NANOCRISTALINAS
4.10.6 FERRITAS Y COMPUESTOS MAGNÉTICOS BLANDOS
4.11 ANÁLISIS DE LA CADENA DE SUMINISTRO
4.11.1 DESCRIPCIÓN GENERAL
4.11.2 ESCENARIO DE COSTOS LOGÍSTICOS
4.11.3 IMPORTANCIA DE LOS PROVEEDORES DE SERVICIOS LOGÍSTICOS
4.11.4 CONCLUSIÓN
4.12 AVANCES TECNOLÓGICOS
4.12.1 AVANCES EN LA COMPOSICIÓN DE MATERIALES Y DISEÑO DE ALEACIONES
4.12.2 MEJORAS EN LAS TECNOLOGÍAS DE FABRICACIÓN Y PROCESAMIENTO
4.12.3 DESARROLLO DE MATERIALES DE ALTA FRECUENCIA Y EFICIENCIA ENERGÉTICA
4.12.4 INNOVACIONES EN INGENIERÍA DE SUPERFICIES Y RECUBRIMIENTOS
4.12.5 INTEGRACIÓN DE TECNOLOGÍAS DIGITALES Y DE SIMULACIÓN
4.12.6 CONCLUSIÓN
4.13 ANÁLISIS DE LA CADENA DE VALOR
4.13.1 DESCRIPCIÓN GENERAL
4.13.2 SUMINISTRO DE MATERIA PRIMA
4.13.3 FABRICACIÓN Y PROCESAMIENTO DE COMPONENTES
4.13.4 PROVEEDORES DE EQUIPOS Y TECNOLOGÍA
4.13.5 DISTRIBUCIÓN Y LOGÍSTICA
4.13.6 USUARIOS FINALES (MARCAS Y SECTORES INDUSTRIALES)
4.13.7 CONCLUSIÓN
4.14 CUADRANTE DE EVALUACIÓN DE EMPRESAS
4.15 NÚMERO DE OPERACIONES POR EMPRESAS
4.16 NÚMERO DE OPERACIONES, POR TIPO
5 DESCRIPCIÓN GENERAL DEL MERCADO
5.1 CONTROLADORES
5.1.1 CRECIENTE DEMANDA DE PRODUCTOS PROMOCIONALES Y MATERIALES PUBLICITARIOS
5.1.2 CRECIENTE ENFOQUE EN LA INTEGRACIÓN DE ENERGÍAS RENOVABLES
5.1.3 AVANCES TECNOLÓGICOS EN LA CIENCIA DE LOS MATERIALES
5.1.4 RÁPIDA EXPANSIÓN DE LA ELECTRÓNICA DE CONSUMO Y LA AUTOMATIZACIÓN INDUSTRIAL
5.2 RESTRICCIONES
5.2.1 VOLATILIDAD EN LOS PRECIOS DE LAS MATERIAS PRIMAS
5.2.2 REQUISITOS COMPLEJOS DE FABRICACIÓN Y PROCESAMIENTO
5.3 OPORTUNIDADES
5.3.1 AUMENTO DE LA DEMANDA DE MOTORES ELÉCTRICOS DE ALTA EFICIENCIA
5.3.2 EXPANSIÓN DE REDES INTELIGENTES Y SISTEMAS DE ALMACENAMIENTO DE ENERGÍA
5.3.3 DESARROLLO DE ALEACIONES MAGNÉTICAS DE PRÓXIMA GENERACIÓN
5.4 DESAFÍOS
5.4.1 COMPETENCIA DE MATERIALES SUSTITUTOS
5.4.2 VULNERABILIDADES DE LA CADENA DE SUMINISTRO Y VOLATILIDAD DE LAS MATERIA PRIMA
6 MERCADO DE MATERIALES MAGNÉTICOS BLANDO DE ORIENTE MEDIO Y ÁFRICA, POR TIPO DE PRODUCTO
6.1 DESCRIPCIÓN GENERAL
6.2 HOJAS Y TIRAS
6.3 NÚCLEOS Y TIPOS DE NÚCLEOS
6.4 POLVOS Y GRÁNULOS
6.5 CINTAS Y LÁMINAS
6.6 COMPONENTES ENSAMBLADOS
6.7 LINGOTETES
6.8 OTROS
7 MERCADO DE MATERIALES MAGNÉTICOS BLANDO DE ORIENTE MEDIO Y ÁFRICA, POR TIPO DE MATERIAL
7.1 DESCRIPCIÓN GENERAL
7.2 FERRITAS BLANDAS
7.3 ACEROS ELÉCTRICOS (FE-SI)
7.4 POLVOS DE HIERRO Y METALES EN POLVO
7.5 ALEACIONES AMORFAS Y NANOCRISTALINAS
7.6 ALEACIONES MAGNÉTICAS BLANDAS
7.7 PERMALLOY
7.8 PERMANENCIA
7.9 CIP — POLVO DE HIERRO CARBONILADO (CIP)
7.1 POLVO DE HIERRO DE ALTA PUREZA
7.11 POLVO DE ACERO INOXIDABLE DE CALIDAD SOLENOIDE
7.12 POLVO SENDUST (FE-SI-AL)
7.13 POLVO DE HIERRO-SILICIO
7.14 PELÍCULAS DELGADAS Y RECUBRIMIENTOS MAGNÉTICOS
7.15 OTROS
8 MERCADO DE MATERIALES MAGNÉTICOS BLANDO DE ORIENTE MEDIO Y ÁFRICA, POR PROCESO DE FABRICACIÓN
8.1 DESCRIPCIÓN GENERAL
8.2 LAMINADO EN FRÍO Y RECOCIDO
8.3 Hilado por fusión
8.4 METALURGIA DE PULVIDOS
8.5 OTROS
9 MERCADO DE MATERIALES MAGNÉTICOS BLANDO DE ORIENTE MEDIO Y ÁFRICA, POR APLICACIÓN
9.1 DESCRIPCIÓN GENERAL
9.2 INDUCCIÓN ELECTROMAGNÉTICA
9.3 CONVERSIÓN DE ENERGÍA ELECTROMAGNÉTICA
9.4 ACONDICIONAMIENTO Y CONVERSIÓN DE ENERGÍA
9.5 DETECCIÓN Y SENSACIÓN ELECTROMAGNÉTICA
9.6 BLINDAJE MAGNÉTICO
9.7 SISTEMAS DE MAGNETIZACIÓN Y DESMAGNETIZACIÓN
9.8 ALMACENAMIENTO Y TRANSFERENCIA DE ENERGÍA
9.9 GRABACIÓN MAGNÉTICA Y ALMACENAMIENTO DE DATOS
9.1 PROCESAMIENTO DE SEÑALES Y SUPRESIÓN DE RUIDO
9.11 OTROS
10 MERCADO DE MATERIALES MAGNÉTICOS BLANDO DE ORIENTE MEDIO Y ÁFRICA, POR USUARIO FINAL
10.1 DESCRIPCIÓN GENERAL
10.2 INDUSTRIA AUTOMOTRIZ
10.3 NÚCLEOS Y TIPOS DE NÚCLEOS
10.4 CINTAS Y LÁMINAS
10.5 SERVICIOS ELÉCTRICOS Y DE ENERGÍA
10.6 NÚCLEOS Y TIPOS DE NÚCLEOS
10.7 CINTAS Y LÁMINAS
10.8 ELECTRÓNICA DE CONSUMO
10.9 NÚCLEOS Y TIPOS DE NÚCLEOS
10.1 CINTAS Y LÁMINAS
10.11 TI Y TELECOMUNICACIONES
10.12 NÚCLEOS Y TIPOS DE NÚCLEOS
10.13 CINTAS Y LÁMINAS
10.14 FABRICACIÓN INDUSTRIAL
10.15 NÚCLEOS Y TIPOS DE NÚCLEOS
10.16 CINTAS Y LÁMINAS
10.17 AEROESPACIAL Y DEFENSA
10.18 NÚCLEOS Y TIPOS DE NÚCLEOS
10.19 CINTAS Y LÁMINAS
10.2 NÚCLEOS Y TIPOS DE NÚCLEOS
10.21 CINTAS Y LÁMINAS
10.22 ENERGÍA RENOVABLE
10.23 NÚCLEOS Y TIPOS DE NÚCLEOS
10.24 CINTAS Y LÁMINAS
10.25 INDUSTRIA DE LA CONSTRUCCIÓN
10.26 NÚCLEOS Y TIPOS DE NÚCLEOS
10.27 CINTAS Y LÁMINAS
10.28 OTROS
10.29 NÚCLEOS Y TIPOS DE NÚCLEOS
10.3 CINTAS Y LÁMINAS
11 MERCADO DE MATERIALES MAGNÉTICOS BLANDO DE ORIENTE MEDIO Y ÁFRICA, POR CANAL DE DISTRIBUCIÓN
11.1 DESCRIPCIÓN GENERAL
11.2 DIRECT
11.3 IN-DIRECTO
12 MERCADO DE MATERIALES MAGNÉTICOS BLANDO DE ORIENTE MEDIO Y ÁFRICA, POR REGIÓN
12.1 ORIENTE MEDIO Y ÁFRICA
12.1.1 ARABIA SAUDITA
12.1.2 EMIRATOS ÁRABES UNIDOS
12.1.3 SUDÁFRICA
12.1.4 EGIPTO
12.1.5 ISRAEL
12.1.6 CATAR
12.1.7 KUWAIT
12.1.8 BAHREIN
12.1.9 OMÁN
12.1.10 RESTO DE ORIENTE MEDIO Y ÁFRICA
13 ORIENTE MEDIO Y ÁFRICA MERCADO DE MATERIALES MAGNÉTICOS BLANDO, PANORAMA EMPRESARIAL
13.1 ANÁLISIS DE ACCIONES DE LA EMPRESA: GLOBAL
14 ANÁLISIS FODA
15 PERFILES DE EMPRESAS
15.1 ARCELORMITTAL
15.1.1 INSTANTÁNEA DE LA EMPRESA
15.1.2 ANÁLISIS DE INGRESOS
15.1.3 ANÁLISIS DE LAS ACCIONES DE LA EMPRESA
15.1.4 PORTAFOLIO DE PRODUCTOS
15.1.5 DESARROLLO RECIENTE
15.2 CORPORACIÓN DE ACERO JFE
15.2.1 INSTANTÁNEA DE LA EMPRESA
15.2.2 ANÁLISIS DE INGRESOS
15.2.3 ANÁLISIS DE LAS ACCIONES DE LA EMPRESA
15.2.4 PORTAFOLIO DE PRODUCTOS
15.2.5 DESARROLLO RECIENTE
15.3 TATA STEEL
15.3.1 INSTANTÁNEA DE LA EMPRESA
15.3.2 ANÁLISIS DE INGRESOS
15.3.3 ANÁLISIS DE LAS ACCIONES DE LA EMPRESA
15.3.4 PORTAFOLIO DE PRODUCTOS
15.3.5 DESARROLLO RECIENTE
15.4 CORPORACIÓN TDK
15.4.1 INSTANTÁNEA DE LA EMPRESA
15.4.2 ANÁLISIS DE INGRESOS
15.4.3 ANÁLISIS DE LAS ACCIONES DE LA EMPRESA
15.4.4 PORTAFOLIO DE PRODUCTOS
15.4.5 DESARROLLO RECIENTE
15.5 THYSSENKRUPP
15.5.1 INSTANTÁNEA DE LA EMPRESA
15.5.2 ANÁLISIS DE INGRESOS
15.5.3 ANÁLISIS DE LAS ACCIONES DE LA EMPRESA
15.5.4 PORTAFOLIO DE PRODUCTOS
15.5.5 DESARROLLO RECIENTE
15.6 TECNOLOGÍA AVANZADA Y MATERIALES CO., LTD.
15.6.1 INSTANTÁNEA DE LA EMPRESA
15.6.2 ANÁLISIS DE INGRESOS
15.6.3 PORTAFOLIO DE PRODUCTOS
15.6.4 DESARROLLO RECIENTE
15.7 AMES
15.7.1 INSTANTÁNEA DE LA EMPRESA
15.7.2 PORTAFOLIO DE PRODUCTOS
15.7.3 DESARROLLO RECIENTE
15.8 ARNOLD MAGNETIC TECHNOLOGIES
15.8.1 INSTANTÁNEA DE LA EMPRESA
15.8.2 PORTAFOLIO DE PRODUCTOS
15.8.3 DESARROLLO RECIENTE
15.9 DAIDO STEEL CO., LTD.
15.9.1 INSTANTÁNEA DE LA EMPRESA
15.9.2 ANÁLISIS DE INGRESOS
15.9.3 PORTAFOLIO DE PRODUCTOS
15.9.4 DESARROLLO RECIENTE
15.1 DMEGC MAGNETICS CO., LTD.
15.10.1 INSTANTÁNEA DE LA EMPRESA
15.10.2 ANÁLISIS DE INGRESOS
15.10.3 PORTAFOLIO DE PRODUCTOS
15.10.4 DESARROLLO RECIENTE
15.11 FERROXCUBO.
15.11.1 INSTANTÁNEA DE LA EMPRESA
15.11.2 PORTAFOLIO DE PRODUCTOS
15.11.3 DESARROLLO RECIENTE
15.12 GKN METALURGIA DE PULVIDOS
15.12.1 INSTANTÁNEA DE LA EMPRESA
15.12.2 ANÁLISIS DE INGRESOS
15.12.3 PORTAFOLIO DE PRODUCTOS
15.12.4 DESARROLLO RECIENTE
15.13 KEDE MAGNETICS
15.13.1 INSTANTÁNEA DE LA EMPRESA
15.13.2 PORTAFOLIO DE PRODUCTOS
15.13.3 DESARROLLO RECIENTE
15.14 MATE CO., LTD
15.14.1 INSTANTÁNEA DE LA EMPRESA
15.14.2 PORTAFOLIO DE PRODUCTOS
15.14.3 DESARROLLO RECIENTE
15.15 MIBA AG
15.15.1 INSTANTÁNEA DE LA EMPRESA
15.15.2 ANÁLISIS DE INGRESOS
15.15.3 PORTAFOLIO DE PRODUCTOS
15.15.4 DESARROLLO RECIENTE
15,16 MMG INDIA PVT. LTD.
15.16.1 INSTANTÁNEA DE LA EMPRESA
15.16.2 PORTAFOLIO DE PRODUCTOS
15.16.3 DESARROLLO RECIENTE
15.17 CORPORACIÓN DE ACERO NIPPON
15.17.1 INSTANTÁNEA DE LA EMPRESA
15.17.2 ANÁLISIS DE INGRESOS
15.17.3 PORTAFOLIO DE PRODUCTOS
15.17.4 DESARROLLO RECIENTE
15.18 POSCO HOLDINGS (FILIAL DE POSCO MOBILITY SOLUTION)
15.18.1 INSTANTÁNEA DE LA EMPRESA
15.18.2 ANÁLISIS DE INGRESOS
15.18.3 PORTAFOLIO DE PRODUCTOS
15.18.4 DESARROLLO RECIENTE
15.19 PROTERIAL, LTD
15.19.1 INSTANTÁNEA DE LA EMPRESA
15.19.2 PORTAFOLIO DE PRODUCTOS
15.19.3 DESARROLLO RECIENTE
15.2 VACUUMSCHMELZE GMBH & CO. KG
15.20.1 INSTANTÁNEA DE LA EMPRESA
15.20.2 PORTAFOLIO DE PRODUCTOS
15.20.3 DESARROLLO RECIENTE
15.21 VOESTALPINE AG
15.21.1 INSTANTÁNEA DE LA EMPRESA
15.21.2 ANÁLISIS DE INGRESOS
15.21.3 PORTAFOLIO DE PRODUCTOS
15.21.4 DESARROLLO RECIENTE
16 CUESTIONARIO
17 INFORMES RELACIONADOS
Lista de Tablas
TABLA 1 MERCADO DE MATERIALES MAGNÉTICOS BLANDO DE ORIENTE MEDIO Y ÁFRICA, POR TIPO DE PRODUCTO, 2018-2032 (MILLONES DE USD)
TABLA 2 MERCADO DE MATERIALES MAGNÉTICOS BLANDO DE ORIENTE MEDIO Y ÁFRICA, POR TIPO DE PRODUCTO, 2018-2032 (MILES DE TONELADAS)
TABLA 3 ORIENTE MEDIO Y ÁFRICA LÁMINAS Y TIRAS EN EL MERCADO DE MATERIALES MAGNÉTICOS BLANDO, POR REGIÓN, 2018-2032 (MILLONES DE USD)
TABLA 4 NÚCLEOS Y TIPOS DE NÚCLEOS EN EL MERCADO DE MATERIALES MAGNÉTICOS BLANDO DE ORIENTE MEDIO Y ÁFRICA, POR REGIÓN, 2018-2032 (MILLONES DE USD)
TABLA 5 NÚCLEOS Y TIPOS DE NÚCLEOS EN EL MERCADO DE MATERIALES MAGNÉTICOS BLANDO DE ORIENTE MEDIO Y ÁFRICA, POR TIPO, 2018-2032 (MILLONES DE USD)
TABLA 6 MERCADO DE POLVOS Y GRÁNULOS DE MATERIALES MAGNÉTICOS BLANDO EN ORIENTE MEDIO Y ÁFRICA, POR REGIÓN, 2018-2032 (MILLONES DE USD)
TABLA 7 ORIENTE MEDIO Y ÁFRICA CINTAS Y LÁMINAS EN EL MERCADO DE MATERIALES MAGNÉTICOS BLANDO, POR REGIÓN, 2018-2032 (MILLONES DE USD)
TABLA 8 CINTAS Y LÁMINAS DE ORIENTE MEDIO Y ÁFRICA EN EL MERCADO DE MATERIALES MAGNÉTICOS BLANDO, POR TIPO, 2018-2032 (MILLONES DE USD)
TABLA 9 COMPONENTES ENSAMBLADOS EN EL MERCADO DE MATERIALES MAGNÉTICOS BLANDO DE ORIENTE MEDIO Y ÁFRICA, POR REGIÓN, 2018-2032 (MILLONES DE USD)
TABLA 10 LINGOTES DE ORIENTE MEDIO Y ÁFRICA EN EL MERCADO DE MATERIALES MAGNÉTICOS BLANDO, POR REGIÓN, 2018-2032 (MILLONES DE USD)
TABLA 11 ORIENTE MEDIO Y ÁFRICA OTROS EN EL MERCADO DE MATERIALES MAGNÉTICOS BLANDO, POR REGIÓN, 2018-2032 (MILLONES DE USD)
TABLA 12 MERCADO DE MATERIALES MAGNÉTICOS BLANDO DE ORIENTE MEDIO Y ÁFRICA, POR TIPO DE MATERIAL, 2018-2032 (MILLONES DE USD)
TABLA 13 MERCADO DE MATERIALES MAGNÉTICOS BLANDO DE ORIENTE MEDIO Y ÁFRICA, POR TIPO DE MATERIAL, 2018-2032 (MILES DE TONELADAS)
TABLA 14 FERRITAS BLANDAS DE ORIENTE MEDIO Y ÁFRICA EN EL MERCADO DE MATERIALES MAGNÉTICOS BLANDOS, POR REGIÓN, 2018-2032 (MILLONES DE USD)
TABLA 15 FERRITAS BLANDAS DE ORIENTE MEDIO Y ÁFRICA EN EL MERCADO DE MATERIALES MAGNÉTICOS BLANDOS, POR TIPO, 2018-2032 (MILLONES DE USD)
TABLA 16 ACEROS ELÉCTRICOS (FE-SI) DE ORIENTE MEDIO Y ÁFRICA EN EL MERCADO DE MATERIALES MAGNÉTICOS BLANDO, POR REGIÓN, 2018-2032 (MILLONES DE USD)
TABLA 17 ACEROS ELÉCTRICOS (FE-SI) DE ORIENTE MEDIO Y ÁFRICA EN EL MERCADO DE MATERIALES MAGNÉTICOS BLANDO, POR TIPO, 2018-2032 (MILLONES DE USD)
TABLA 18 ORIENTE MEDIO Y ÁFRICA HIERRO EN POLVO Y POLVOS METÁLICOS EN EL MERCADO DE MATERIALES MAGNÉTICOS BLANDO, POR REGIÓN, 2018-2032 (MILLONES DE USD)
TABLA 19 ORIENTE MEDIO Y ÁFRICA ALEACIONES AMORFAS Y NANOCRISTALINAS EN EL MERCADO DE MATERIALES MAGNÉTICOS BLANDO, POR REGIÓN, 2018-2032 (MILLONES DE USD)
TABLA 20 ALEACIONES MAGNÉTICAS BLANDAS DE ORIENTE MEDIO Y ÁFRICA EN EL MERCADO DE MATERIALES MAGNÉTICOS BLANDOS, POR REGIÓN, 2018-2032 (MILLONES DE USD)
TABLA 21 ORIENTE MEDIO Y ÁFRICA MERCADO DE MATERIALES MAGNÉTICOS BLANDO DE PERMALLOY, POR REGIÓN, 2018-2032 (MILLONES DE USD)
TABLA 22 ORIENTE MEDIO Y ÁFRICA PERMENDUR EN EL MERCADO DE MATERIALES MAGNÉTICOS BLANDO, POR REGIÓN, 2018-2032 (MILLONES DE USD)
TABLA 23 ORIENTE MEDIO Y ÁFRICA CIP — POLVO DE HIERRO CARBONILO (CIP) EN EL MERCADO DE MATERIALES MAGNÉTICOS BLANDO, POR REGIÓN, 2018-2032 (MILLONES DE USD)
TABLA 24 ORIENTE MEDIO Y ÁFRICA CIP — POLVO DE HIERRO CARBONILO (CIP) EN EL MERCADO DE MATERIALES MAGNÉTICOS BLANDO, POR TIPO, 2018-2032 (MILLONES DE USD)
TABLA 25 ORIENTE MEDIO Y ÁFRICA MERCADO DE POLVO DE HIERRO DE ALTA PUREZA EN MATERIALES MAGNÉTICOS BLANDO, POR REGIÓN, 2018-2032 (MILLONES DE USD)
TABLA 26 ORIENTE MEDIO Y ÁFRICA POLVO DE ACERO INOXIDABLE DE CALIDAD SOLENOIDE EN EL MERCADO DE MATERIALES MAGNÉTICOS BLANDO, POR REGIÓN, 2018-2032 (MILLONES DE USD)
TABLA 27 ORIENTE MEDIO Y ÁFRICA POLVO SENDUST (FE-SI-AL) EN EL MERCADO DE MATERIALES MAGNÉTICOS BLANDO, POR REGIÓN, 2018-2032 (MILLONES DE USD)
TABLA 28 ORIENTE MEDIO Y ÁFRICA POLVO DE HIERRO-SILICIO EN EL MERCADO DE MATERIALES MAGNÉTICOS BLANDO, POR REGIÓN, 2018-2032 (MILLONES DE USD)
TABLA 29 ORIENTE MEDIO Y ÁFRICA PELÍCULAS DELGADAS Y RECUBRIMIENTOS MAGNÉTICOS EN EL MERCADO DE MATERIALES MAGNÉTICOS BLANDO, POR REGIÓN, 2018-2032 (MILLONES DE USD)
TABLA 30 ORIENTE MEDIO Y ÁFRICA OTROS MERCADOS DE MATERIALES MAGNÉTICOS BLANDO, POR REGIÓN, 2018-2032 (MILLONES DE USD)
TABLA 31 MERCADO DE MATERIALES MAGNÉTICOS BLANDO DE ORIENTE MEDIO Y ÁFRICA, POR PROCESO DE FABRICACIÓN, 2018-2032 (MILLONES DE USD)
TABLA 32 MERCADO DE LAMINADO EN FRÍO Y RECOCIDO DE MATERIALES MAGNÉTICOS BLANDO EN ORIENTE MEDIO Y ÁFRICA, POR REGIÓN, 2018-2032 (MILLONES DE USD)
TABLA 33 MERCADO DE MATERIALES MAGNÉTICOS BLANDO PARA HILATURA DE MATERIALES MAGNÉTICOS BLANDO EN ORIENTE MEDIO Y ÁFRICA, POR REGIÓN, 2018-2032 (MILLONES DE USD)
TABLA 34 MERCADO DE MATERIALES MAGNÉTICOS BLANDO EN METALURGIA DE ORIENTE MEDIO Y ÁFRICA, POR REGIÓN, 2018-2032 (MILLONES DE USD)
TABLA 35 ORIENTE MEDIO Y ÁFRICA OTROS EN EL MERCADO DE MATERIALES MAGNÉTICOS BLANDO, POR REGIÓN, 2018-2032 (MILLONES DE USD)
TABLA 36 MERCADO DE MATERIALES MAGNÉTICOS BLANDO DE ORIENTE MEDIO Y ÁFRICA, POR APLICACIÓN, 2018-2032 (MILLONES DE USD)
TABLA 37 ORIENTE MEDIO Y ÁFRICA MERCADO DE INDUCCIÓN ELECTROMAGNÉTICA EN MATERIALES MAGNÉTICOS BLANDO, POR REGIÓN, 2018-2032 (MILLONES DE USD)
TABLA 38 ORIENTE MEDIO Y ÁFRICA INDUCCIÓN ELECTROMAGNÉTICA EN EL MERCADO DE MATERIALES MAGNÉTICOS BLANDO, POR TIPO, 2018-2032 (MILLONES DE USD)
TABLA 39 CONVERSIÓN DE ENERGÍA ELECTROMAGNÉTICA EN EL MERCADO DE MATERIALES MAGNÉTICOS BLANDO DE ORIENTE MEDIO Y ÁFRICA, POR REGIÓN, 2018-2032 (MILLONES DE USD)
TABLA 40 ACONDICIONAMIENTO Y CONVERSIÓN DE ENERGÍA EN EL MERCADO DE MATERIALES MAGNÉTICOS BLANDO DE ORIENTE MEDIO Y ÁFRICA, POR REGIÓN, 2018-2032 (MILLONES DE USD)
TABLA 41 ACONDICIONAMIENTO Y CONVERSIÓN DE ENERGÍA EN EL MERCADO DE MATERIALES MAGNÉTICOS BLANDO DE ORIENTE MEDIO Y ÁFRICA, POR TIPO, 2018-2032 (MILLONES DE USD)
TABLA 42 ORIENTE MEDIO Y ÁFRICA DETECCIÓN Y SENSORÍA ELECTROMAGNÉTICA EN EL MERCADO DE MATERIALES MAGNÉTICOS BLANDO, POR REGIÓN, 2018-2032 (MILLONES DE USD)
TABLA 43 ORIENTE MEDIO Y ÁFRICA MERCADO DE BLINDAJE MAGNÉTICO EN MATERIALES MAGNÉTICOS BLANDO, POR REGIÓN, 2018-2032 (MILLONES DE USD)
TABLA 44 SISTEMAS DE MAGNETIZACIÓN Y DESMAGNETIZACIÓN EN EL MERCADO DE MATERIALES MAGNÉTICOS BLANDO DE ORIENTE MEDIO Y ÁFRICA, POR REGIÓN, 2018-2032 (MILLONES DE USD)
TABLA 45 ORIENTE MEDIO Y ÁFRICA ALMACENAMIENTO Y TRANSFERENCIA DE ENERGÍA EN EL MERCADO DE MATERIALES MAGNÉTICOS BLANDO, POR REGIÓN, 2018-2032 (MILLONES DE USD)
TABLA 46 ORIENTE MEDIO Y ÁFRICA REGISTRO MAGNÉTICO Y ALMACENAMIENTO DE DATOS EN EL MERCADO DE MATERIALES MAGNÉTICOS BLANDO, POR REGIÓN, 2018-2032 (MILLONES DE USD)
TABLA 47 ORIENTE MEDIO Y ÁFRICA PROCESAMIENTO DE SEÑALES Y SUPRESIÓN DE RUIDO EN EL MERCADO DE MATERIALES MAGNÉTICOS BLANDO, POR REGIÓN, 2018-2032 (MILLONES DE USD)
TABLA 48 ORIENTE MEDIO Y ÁFRICA OTROS EN EL MERCADO DE MATERIALES MAGNÉTICOS BLANDO, POR REGIÓN, 2018-2032 (MILLONES DE USD)
TABLA 49 MERCADO DE MATERIALES MAGNÉTICOS BLANDO DE ORIENTE MEDIO Y ÁFRICA, POR USUARIO FINAL, 2018-2032 (MILLONES DE USD)
TABLA 50 INDUSTRIA AUTOMOTRIZ DE ORIENTE MEDIO Y ÁFRICA EN EL MERCADO DE MATERIALES MAGNÉTICOS BLANDO, POR REGIÓN, 2018-2032 (MILLONES DE USD)
TABLA 51 INDUSTRIA AUTOMOTRIZ DE ORIENTE MEDIO Y ÁFRICA EN EL MERCADO DE MATERIALES MAGNÉTICOS BLANDO, POR APLICACIÓN, 2018-2032 (MILLONES DE USD)
TABLA 52 INDUSTRIA AUTOMOTRIZ DE ORIENTE MEDIO Y ÁFRICA EN EL MERCADO DE MATERIALES MAGNÉTICOS BLANDO, POR TIPO DE PRODUCTO, 2018-2032 (MILLONES DE USD)
TABLA 53 NÚCLEOS Y TIPOS DE NÚCLEOS DE ORIENTE MEDIO Y ÁFRICA EN EL MERCADO DE MATERIALES MAGNÉTICOS BLANDO, POR TIPO, 2018-2032 (MILLONES DE USD)
TABLA 54 ORIENTE MEDIO Y ÁFRICA CINTAS Y LÁMINAS EN EL MERCADO DE MATERIALES MAGNÉTICOS BLANDO, POR TIPO, 2018-2032 (MILLONES DE USD)
TABLA 55 SERVICIOS ELÉCTRICOS Y DE ENERGÍA DE ORIENTE MEDIO Y ÁFRICA EN EL MERCADO DE MATERIALES MAGNÉTICOS BLANDO, POR REGIÓN, 2018-2032 (MILLONES DE USD)
TABLA 56 SERVICIOS ELÉCTRICOS Y DE ENERGÍA DE ORIENTE MEDIO Y ÁFRICA EN EL MERCADO DE MATERIALES MAGNÉTICOS BLANDO, POR APLICACIÓN, 2018-2032 (MILLONES DE USD)
TABLA 57 SERVICIOS ELÉCTRICOS Y DE ENERGÍA DE ORIENTE MEDIO Y ÁFRICA EN EL MERCADO DE MATERIALES MAGNÉTICOS BLANDO, POR TIPO DE PRODUCTO, 2018-2032 (MILLONES DE USD)
TABLA 58 NÚCLEOS Y TIPOS DE NÚCLEOS DE ORIENTE MEDIO Y ÁFRICA EN EL MERCADO DE MATERIALES MAGNÉTICOS BLANDO, POR TIPO, 2018-2032 (MILLONES DE USD)
TABLA 59 ORIENTE MEDIO Y ÁFRICA CINTAS Y LÁMINAS EN EL MERCADO DE MATERIALES MAGNÉTICOS BLANDO, POR TIPO, 2018-2032 (MILLONES DE USD)
TABLA 60 MERCADO DE ELECTRÓNICA DE CONSUMO EN MATERIALES MAGNÉTICOS BLANDO DE ORIENTE MEDIO Y ÁFRICA, POR REGIÓN, 2018-2032 (MILLONES DE USD)
TABLA 61 MERCADO DE ELECTRÓNICA DE CONSUMO EN MATERIALES MAGNÉTICOS BLANDO DE ORIENTE MEDIO Y ÁFRICA, POR APLICACIÓN, 2018-2032 (MILLONES DE USD)
TABLA 62 MERCADO DE ELECTRÓNICA DE CONSUMO EN MATERIALES MAGNÉTICOS BLANDO DE ORIENTE MEDIO Y ÁFRICA, POR TIPO DE PRODUCTO, 2018-2032 (MILLONES DE USD)
TABLA 63 NÚCLEOS Y TIPOS DE NÚCLEOS DE ORIENTE MEDIO Y ÁFRICA EN EL MERCADO DE MATERIALES MAGNÉTICOS BLANDO, POR TIPO, 2018-2032 (MILLONES DE USD)
TABLA 64 ORIENTE MEDIO Y ÁFRICA CINTAS Y LÁMINAS EN EL MERCADO DE MATERIALES MAGNÉTICOS BLANDO, POR TIPO, 2018-2032 (MILLONES DE USD)
TABLA 65 ORIENTE MEDIO Y ÁFRICA TI Y TELECOMUNICACIONES EN EL MERCADO DE MATERIALES MAGNÉTICOS BLANDO, POR REGIÓN, 2018-2032 (MILLONES DE USD)
TABLA 66 ORIENTE MEDIO Y ÁFRICA TI Y TELECOMUNICACIONES EN EL MERCADO DE MATERIALES MAGNÉTICOS BLANDO, POR APLICACIÓN, 2018-2032 (MILLONES DE USD)
TABLA 67 ORIENTE MEDIO Y ÁFRICA TI Y TELECOMUNICACIONES EN EL MERCADO DE MATERIALES MAGNÉTICOS BLANDO, POR TIPO DE PRODUCTO, 2018-2032 (MILLONES DE USD)
TABLA 68 NÚCLEOS Y TIPOS DE NÚCLEOS DE ORIENTE MEDIO Y ÁFRICA EN EL MERCADO DE MATERIALES MAGNÉTICOS BLANDO, POR TIPO, 2018-2032 (MILLONES DE USD)
TABLA 69 ORIENTE MEDIO Y ÁFRICA CINTAS Y LÁMINAS EN EL MERCADO DE MATERIALES MAGNÉTICOS BLANDO, POR TIPO, 2018-2032 (MILLONES DE USD)
TABLA 70 MERCADO DE FABRICACIÓN INDUSTRIAL DE MATERIALES MAGNÉTICOS BLANDO EN ORIENTE MEDIO Y ÁFRICA, POR REGIÓN, 2018-2032 (MILLONES DE USD)
TABLA 71 FABRICACIÓN INDUSTRIAL DE MATERIALES MAGNÉTICOS BLANDO EN ORIENTE MEDIO Y ÁFRICA, POR APLICACIÓN, 2018-2032 (MILLONES DE USD)
TABLA 72 FABRICACIÓN INDUSTRIAL DE MATERIALES MAGNÉTICOS BLANDO EN ORIENTE MEDIO Y ÁFRICA, POR TIPO DE PRODUCTO, 2018-2032 (MILLONES DE USD)
TABLA 73 NÚCLEOS Y TIPOS DE NÚCLEOS DE ORIENTE MEDIO Y ÁFRICA EN EL MERCADO DE MATERIALES MAGNÉTICOS BLANDO, POR TIPO, 2018-2032 (MILLONES DE USD)
TABLA 74 ORIENTE MEDIO Y ÁFRICA CINTAS Y LÁMINAS EN EL MERCADO DE MATERIALES MAGNÉTICOS BLANDO, POR TIPO, 2018-2032 (MILLONES DE USD)
TABLA 75 ORIENTE MEDIO Y ÁFRICA AEROESPACIAL Y DEFENSA EN EL MERCADO DE MATERIALES MAGNÉTICOS BLANDO, POR REGIÓN, 2018-2032 (MILLONES DE USD)
TABLA 76 ORIENTE MEDIO Y ÁFRICA AEROESPACIAL Y DEFENSA EN EL MERCADO DE MATERIALES MAGNÉTICOS BLANDO, POR APLICACIÓN, 2018-2032 (MILLONES DE USD)
TABLA 77 ORIENTE MEDIO Y ÁFRICA AEROESPACIAL Y DEFENSA EN EL MERCADO DE MATERIALES MAGNÉTICOS BLANDO, POR TIPO DE PRODUCTO, 2018-2032 (MILLONES DE USD)
TABLA 78 NÚCLEOS Y TIPOS DE NÚCLEOS DE ORIENTE MEDIO Y ÁFRICA EN EL MERCADO DE MATERIALES MAGNÉTICOS BLANDO, POR TIPO, 2018-2032 (MILLONES DE USD)
TABLA 79 ORIENTE MEDIO Y ÁFRICA CINTAS Y LÁMINAS EN EL MERCADO DE MATERIALES MAGNÉTICOS BLANDO, POR TIPO, 2018-2032 (MILLONES DE USD)
TABLA 80 ATENCIÓN MÉDICA Y SALUD
TABLA 81 ORIENTE MEDIO Y ÁFRICA ATENCIÓN MÉDICA Y MERCADO DE MATERIALES MAGNÉTICOS BLANDO, POR REGIÓN, 2018-2032 (MILLONES DE USD)
TABLA 82 ORIENTE MEDIO Y ÁFRICA ATENCIÓN MÉDICA Y SALUD EN EL MERCADO DE MATERIALES MAGNÉTICOS BLANDO, POR APLICACIÓN, 2018-2032 (MILLONES DE USD)
TABLA 83 ORIENTE MEDIO Y ÁFRICA ATENCIÓN MÉDICA Y SALUD EN EL MERCADO DE MATERIALES MAGNÉTICOS BLANDO, POR TIPO DE PRODUCTO, 2018-2032 (MILLONES DE USD)
TABLA 84 NÚCLEOS Y TIPOS DE NÚCLEOS DE ORIENTE MEDIO Y ÁFRICA EN EL MERCADO DE MATERIALES MAGNÉTICOS BLANDO, POR TIPO, 2018-2032 (MILLONES DE USD)
TABLA 85 ORIENTE MEDIO Y ÁFRICA CINTAS Y LÁMINAS EN EL MERCADO DE MATERIALES MAGNÉTICOS BLANDO, POR TIPO, 2018-2032 (MILLONES DE USD)
TABLA 86 MERCADO DE ENERGÍAS RENOVABLES EN MATERIALES MAGNÉTICOS BLANDO DE ORIENTE MEDIO Y ÁFRICA, POR REGIÓN, 2018-2032 (MILLONES DE USD)
TABLA 87 MERCADO DE ENERGÍAS RENOVABLES EN MATERIALES MAGNÉTICOS BLANDO DE ORIENTE MEDIO Y ÁFRICA, POR APLICACIÓN, 2018-2032 (MILLONES DE USD)
TABLA 88 MERCADO DE ENERGÍA RENOVABLE EN MATERIALES MAGNÉTICOS BLANDO DE ORIENTE MEDIO Y ÁFRICA, POR TIPO DE PRODUCTO, 2018-2032 (MILLONES DE USD)
TABLA 89 NÚCLEOS Y TIPOS DE NÚCLEOS DE ORIENTE MEDIO Y ÁFRICA EN EL MERCADO DE MATERIALES MAGNÉTICOS BLANDO, POR TIPO, 2018-2032 (MILLONES DE USD)
TABLA 90 ORIENTE MEDIO Y ÁFRICA CINTAS Y LÁMINAS EN EL MERCADO DE MATERIALES MAGNÉTICOS BLANDO, POR TIPO, 2018-2032 (MILLONES DE USD)
TABLA 91 INDUSTRIA DE LA CONSTRUCCIÓN EN ORIENTE MEDIO Y ÁFRICA EN EL MERCADO DE MATERIALES MAGNÉTICOS BLANDO, POR REGIÓN, 2018-2032 (MILLONES DE USD)
TABLA 92 INDUSTRIA DE LA CONSTRUCCIÓN EN ORIENTE MEDIO Y ÁFRICA EN EL MERCADO DE MATERIALES MAGNÉTICOS BLANDO, POR APLICACIÓN, 2018-2032 (MILLONES DE USD)
TABLA 93 INDUSTRIA DE LA CONSTRUCCIÓN EN ORIENTE MEDIO Y ÁFRICA EN EL MERCADO DE MATERIALES MAGNÉTICOS BLANDO, POR TIPO DE PRODUCTO, 2018-2032 (MILLONES DE USD)
TABLA 94 NÚCLEOS Y TIPOS DE NÚCLEOS DE ORIENTE MEDIO Y ÁFRICA EN EL MERCADO DE MATERIALES MAGNÉTICOS BLANDO, POR TIPO, 2018-2032 (MILLONES DE USD)
TABLA 95 ORIENTE MEDIO Y ÁFRICA OTROS MERCADOS DE MATERIALES MAGNÉTICOS BLANDO, POR REGIÓN, 2018-2032 (MILLONES DE USD)
TABLA 96 ORIENTE MEDIO Y ÁFRICA OTROS MERCADOS DE MATERIALES MAGNÉTICOS BLANDO, POR APLICACIÓN, 2018-2032 (MILLONES DE USD)
TABLA 97 ORIENTE MEDIO Y ÁFRICA OTROS MERCADOS DE MATERIALES MAGNÉTICOS BLANDO, POR TIPO DE PRODUCTO, 2018-2032 (MILLONES DE USD)
TABLA 98 NÚCLEOS Y TIPOS DE NÚCLEOS DE ORIENTE MEDIO Y ÁFRICA EN EL MERCADO DE MATERIALES MAGNÉTICOS BLANDO, POR TIPO, 2018-2032 (MILLONES DE USD)
TABLA 99 ORIENTE MEDIO Y ÁFRICA CINTAS Y LÁMINAS EN EL MERCADO DE MATERIALES MAGNÉTICOS BLANDO, POR TIPO, 2018-2032 (MILLONES DE USD)
TABLA 100 MERCADO DE MATERIALES MAGNÉTICOS BLANDO DE ORIENTE MEDIO Y ÁFRICA, POR CANAL DE DISTRIBUCIÓN, 2018-2032 (MILLONES DE USD)
TABLA 101 ORIENTE MEDIO Y ÁFRICA INVERSIÓN DIRECTA EN EL MERCADO DE MATERIALES MAGNÉTICOS BLANDO, POR REGIÓN, 2018-2032 (MILLONES DE USD)
TABLA 102 ORIENTE MEDIO Y ÁFRICA INDIRECTO EN EL MERCADO DE MATERIALES MAGNÉTICOS BLANDO, POR REGIÓN, 2018-2032 (MILLONES DE USD)
TABLA 103 MERCADO DE MATERIALES MAGNÉTICOS BLANDO DE ORIENTE MEDIO Y ÁFRICA, POR PAÍS, 2018-2032 (MILLONES DE USD)
TABLA 104 MERCADO DE MATERIALES MAGNÉTICOS BLANDO DE ORIENTE MEDIO Y ÁFRICA, POR PAÍS, 2018-2032 (MILES DE TONELADAS)
TABLA 105 MERCADO DE MATERIALES MAGNÉTICOS BLANDO DE ORIENTE MEDIO Y ÁFRICA, POR TIPO DE PRODUCTO, 2018-2032 (MILLONES DE USD)
TABLA 106 MERCADO DE MATERIALES MAGNÉTICOS BLANDO DE ORIENTE MEDIO Y ÁFRICA, POR TIPO DE PRODUCTO, 2018-2032 (MILES DE TONELADAS)
TABLA 107 NÚCLEOS Y TIPOS DE NÚCLEOS DE ORIENTE MEDIO Y ÁFRICA EN EL MERCADO DE MATERIALES MAGNÉTICOS BLANDO, POR TIPO, 2018-2032 (MILLONES DE USD)
TABLA 108 ORIENTE MEDIO Y ÁFRICA CINTAS Y LÁMINAS EN EL MERCADO DE MATERIALES MAGNÉTICOS BLANDO, POR TIPO, 2018-2032 (MILLONES DE USD)
TABLA 109 MERCADO DE MATERIALES MAGNÉTICOS BLANDO DE ORIENTE MEDIO Y ÁFRICA, POR TIPO DE MATERIAL, 2018-2032 (MILLONES DE USD)
TABLA 110 MERCADO DE MATERIALES MAGNÉTICOS BLANDO DE ORIENTE MEDIO Y ÁFRICA, POR TIPO DE MATERIAL, 2018-2032 (MILES DE TONELADAS)
TABLA 111 FERRITAS BLANDAS DE ORIENTE MEDIO Y ÁFRICA EN EL MERCADO DE MATERIALES MAGNÉTICOS BLANDOS, POR TIPO, 2018-2032 (MILLONES DE USD)
TABLA 112 ACEROS ELÉCTRICOS (FE-SI) DE ORIENTE MEDIO Y ÁFRICA EN EL MERCADO DE MATERIALES MAGNÉTICOS BLANDO, POR TIPO, 2018-2032 (MILLONES DE USD)
TABLA 113 NÚCLEOS Y TIPOS DE NÚCLEOS DE ORIENTE MEDIO Y ÁFRICA EN EL MERCADO DE MATERIALES MAGNÉTICOS BLANDO, POR TIPO, 2018-2032 (MILLONES DE USD)
TABLA 114 MERCADO DE MATERIALES MAGNÉTICOS BLANDO DE ORIENTE MEDIO Y ÁFRICA, POR PROCESO DE FABRICACIÓN, 2018-2032 (MILLONES DE USD)
TABLA 115 MERCADO DE MATERIALES MAGNÉTICOS BLANDO DE ORIENTE MEDIO Y ÁFRICA, POR APLICACIÓN, 2018-2032 (MILLONES DE USD)
TABLA 116 ORIENTE MEDIO Y ÁFRICA MERCADO DE INDUCCIÓN ELECTROMAGNÉTICA EN MATERIALES MAGNÉTICOS BLANDO, POR TIPO, 2018-2032 (MILLONES DE USD)
TABLA 117 ACONDICIONAMIENTO Y CONVERSIÓN DE ENERGÍA EN EL MERCADO DE MATERIALES MAGNÉTICOS BLANDO DE ORIENTE MEDIO Y ÁFRICA, POR TIPO, 2018-2032 (MILLONES DE USD)
TABLA 118 MERCADO DE MATERIALES MAGNÉTICOS BLANDO DE ORIENTE MEDIO Y ÁFRICA, POR USUARIO FINAL, 2018-2032 (MILLONES DE USD)
TABLA 119 INDUSTRIA AUTOMOTRIZ DE ORIENTE MEDIO Y ÁFRICA EN EL MERCADO DE MATERIALES MAGNÉTICOS BLANDO, POR APLICACIÓN, 2018-2032 (MILLONES DE USD)
TABLA 120 INDUSTRIA AUTOMOTRIZ DE ORIENTE MEDIO Y ÁFRICA EN EL MERCADO DE MATERIALES MAGNÉTICOS BLANDO, POR TIPO DE PRODUCTO, 2018-2032 (MILLONES DE USD)
TABLA 121 NÚCLEOS Y TIPOS DE NÚCLEOS DE ORIENTE MEDIO Y ÁFRICA EN EL MERCADO DE MATERIALES MAGNÉTICOS BLANDO, POR TIPO, 2018-2032 (MILLONES DE USD)
TABLA 122 ORIENTE MEDIO Y ÁFRICA CINTAS Y LÁMINAS EN EL MERCADO DE MATERIALES MAGNÉTICOS BLANDO, POR TIPO, 2018-2032 (MILLONES DE USD)
TABLA 123 SERVICIOS ELÉCTRICOS Y DE ENERGÍA DE ORIENTE MEDIO Y ÁFRICA EN EL MERCADO DE MATERIALES MAGNÉTICOS BLANDO, POR APLICACIÓN, 2018-2032 (MILLONES DE USD)
TABLA 124 SERVICIOS ELÉCTRICOS Y DE ENERGÍA DE ORIENTE MEDIO Y ÁFRICA EN EL MERCADO DE MATERIALES MAGNÉTICOS BLANDO, POR TIPO DE PRODUCTO, 2018-2032 (MILLONES DE USD)
TABLA 125 NÚCLEOS Y TIPOS DE NÚCLEOS DE ORIENTE MEDIO Y ÁFRICA EN EL MERCADO DE MATERIALES MAGNÉTICOS BLANDO, POR TIPO, 2018-2032 (MILLONES DE USD)
TABLA 126 ORIENTE MEDIO Y ÁFRICA CINTAS Y LÁMINAS EN EL MERCADO DE MATERIALES MAGNÉTICOS BLANDO, POR TIPO, 2018-2032 (MILLONES DE USD)
TABLA 127 MERCADO DE ELECTRÓNICA DE CONSUMO EN MATERIALES MAGNÉTICOS BLANDO DE ORIENTE MEDIO Y ÁFRICA, POR APLICACIÓN, 2018-2032 (MILLONES DE USD)
TABLA 128 MERCADO DE ELECTRÓNICA DE CONSUMO EN MATERIALES MAGNÉTICOS BLANDO DE ORIENTE MEDIO Y ÁFRICA, POR TIPO DE PRODUCTO, 2018-2032 (MILLONES DE USD)
TABLA 129 NÚCLEOS Y TIPOS DE NÚCLEOS DE ORIENTE MEDIO Y ÁFRICA EN EL MERCADO DE MATERIALES MAGNÉTICOS BLANDO, POR TIPO, 2018-2032 (MILLONES DE USD)
TABLA 130 ORIENTE MEDIO Y ÁFRICA CINTAS Y LÁMINAS EN EL MERCADO DE MATERIALES MAGNÉTICOS BLANDO, POR TIPO, 2018-2032 (MILLONES DE USD)
TABLA 131 ORIENTE MEDIO Y ÁFRICA TI Y TELECOMUNICACIONES EN EL MERCADO DE MATERIALES MAGNÉTICOS BLANDO, POR APLICACIÓN, 2018-2032 (MILLONES DE USD)
TABLA 132 ORIENTE MEDIO Y ÁFRICA TI Y TELECOMUNICACIONES EN EL MERCADO DE MATERIALES MAGNÉTICOS BLANDO, POR TIPO DE PRODUCTO, 2018-2032 (MILLONES DE USD)
TABLA 133 NÚCLEOS Y TIPOS DE NÚCLEOS DE ORIENTE MEDIO Y ÁFRICA EN EL MERCADO DE MATERIALES MAGNÉTICOS BLANDO, POR TIPO, 2018-2032 (MILLONES DE USD)
TABLA 134 ORIENTE MEDIO Y ÁFRICA CINTAS Y LÁMINAS EN EL MERCADO DE MATERIALES MAGNÉTICOS BLANDO, POR TIPO, 2018-2032 (MILLONES DE USD)
TABLA 135 FABRICACIÓN INDUSTRIAL DE MATERIALES MAGNÉTICOS BLANDO EN ORIENTE MEDIO Y ÁFRICA, POR APLICACIÓN, 2018-2032 (MILLONES DE USD)
TABLA 136 FABRICACIÓN INDUSTRIAL DE MATERIALES MAGNÉTICOS BLANDO EN ORIENTE MEDIO Y ÁFRICA, POR TIPO DE PRODUCTO, 2018-2032 (MILLONES DE USD)
TABLA 137 NÚCLEOS Y TIPOS DE NÚCLEOS DE ORIENTE MEDIO Y ÁFRICA EN EL MERCADO DE MATERIALES MAGNÉTICOS BLANDO, POR TIPO, 2018-2032 (MILLONES DE USD)
TABLA 138 ORIENTE MEDIO Y ÁFRICA CINTAS Y LÁMINAS EN EL MERCADO DE MATERIALES MAGNÉTICOS BLANDO, POR TIPO, 2018-2032 (MILLONES DE USD)
TABLA 139 ORIENTE MEDIO Y ÁFRICA AEROESPACIAL Y DEFENSA EN EL MERCADO DE MATERIALES MAGNÉTICOS BLANDO, POR APLICACIÓN, 2018-2032 (MILLONES DE USD)
TABLA 140 ORIENTE MEDIO Y ÁFRICA AEROESPACIAL Y DEFENSA EN EL MERCADO DE MATERIALES MAGNÉTICOS BLANDO, POR TIPO DE PRODUCTO, 2018-2032 (MILLONES DE USD)
TABLA 141 NÚCLEOS Y TIPOS DE NÚCLEOS DE ORIENTE MEDIO Y ÁFRICA EN EL MERCADO DE MATERIALES MAGNÉTICOS BLANDO, POR TIPO, 2018-2032 (MILLONES DE USD)
TABLA 142 ORIENTE MEDIO Y ÁFRICA CINTAS Y LÁMINAS EN EL MERCADO DE MATERIALES MAGNÉTICOS BLANDO, POR TIPO, 2018-2032 (MILLONES DE USD)
TABLA 143 ORIENTE MEDIO Y ÁFRICA ATENCIÓN MÉDICA Y SALUD EN EL MERCADO DE MATERIALES MAGNÉTICOS BLANDO, POR APLICACIÓN, 2018-2032 (MILLONES DE USD)
TABLA 144 ORIENTE MEDIO Y ÁFRICA ATENCIÓN MÉDICA Y SALUD EN EL MERCADO DE MATERIALES MAGNÉTICOS BLANDO, POR TIPO DE PRODUCTO, 2018-2032 (MILLONES DE USD)
TABLA 145 NÚCLEOS Y TIPOS DE NÚCLEOS DE ORIENTE MEDIO Y ÁFRICA EN EL MERCADO DE MATERIALES MAGNÉTICOS BLANDO, POR TIPO, 2018-2032 (MILLONES DE USD)
TABLA 146 ORIENTE MEDIO Y ÁFRICA CINTAS Y LÁMINAS EN EL MERCADO DE MATERIALES MAGNÉTICOS BLANDO, POR TIPO, 2018-2032 (MILLONES DE USD)
TABLA 147 MERCADO DE ENERGÍAS RENOVABLES EN MATERIALES MAGNÉTICOS BLANDO DE ORIENTE MEDIO Y ÁFRICA, POR APLICACIÓN, 2018-2032 (MILLONES DE USD)
TABLA 148 MERCADO DE ENERGÍA RENOVABLE EN MATERIALES MAGNÉTICOS BLANDO DE ORIENTE MEDIO Y ÁFRICA, POR TIPO DE PRODUCTO, 2018-2032 (MILLONES DE USD)
TABLA 149 NÚCLEOS Y TIPOS DE NÚCLEOS DE ORIENTE MEDIO Y ÁFRICA EN EL MERCADO DE MATERIALES MAGNÉTICOS BLANDO, POR TIPO, 2018-2032 (MILLONES DE USD)
TABLA 150 CINTAS Y LÁMINAS DE ORIENTE MEDIO Y ÁFRICA EN EL MERCADO DE MATERIALES MAGNÉTICOS BLANDO, POR TIPO, 2018-2032 (MILLONES DE USD)
TABLA 151 INDUSTRIA DE LA CONSTRUCCIÓN EN ORIENTE MEDIO Y ÁFRICA EN EL MERCADO DE MATERIALES MAGNÉTICOS BLANDO, POR APLICACIÓN, 2018-2032 (MILLONES DE USD)
TABLA 152 INDUSTRIA DE LA CONSTRUCCIÓN EN ORIENTE MEDIO Y ÁFRICA EN EL MERCADO DE MATERIALES MAGNÉTICOS BLANDO, POR TIPO DE PRODUCTO, 2018-2032 (MILLONES DE USD)
TABLA 153 NÚCLEOS Y TIPOS DE NÚCLEOS DE ORIENTE MEDIO Y ÁFRICA EN EL MERCADO DE MATERIALES MAGNÉTICOS BLANDO, POR TIPO, 2018-2032 (MILLONES DE USD)
TABLA 154 ORIENTE MEDIO Y ÁFRICA CINTAS Y LÁMINAS EN EL MERCADO DE MATERIALES MAGNÉTICOS BLANDO, POR TIPO, 2018-2032 (MILLONES DE USD)
TABLA 155 ORIENTE MEDIO Y ÁFRICA OTROS MERCADOS DE MATERIALES MAGNÉTICOS BLANDO, POR APLICACIÓN, 2018-2032 (MILLONES DE USD)
TABLA 156 ORIENTE MEDIO Y ÁFRICA OTROS MERCADOS DE MATERIALES MAGNÉTICOS BLANDO, POR TIPO DE PRODUCTO, 2018-2032 (MILLONES DE USD)
TABLA 157 NÚCLEOS Y TIPOS DE NÚCLEOS DE ORIENTE MEDIO Y ÁFRICA EN EL MERCADO DE MATERIALES MAGNÉTICOS BLANDO, POR TIPO, 2018-2032 (MILLONES DE USD)
TABLA 158 ORIENTE MEDIO Y ÁFRICA CINTAS Y LÁMINAS EN EL MERCADO DE MATERIALES MAGNÉTICOS BLANDO, POR TIPO, 2018-2032 (MILLONES DE USD)
TABLA 159 MERCADO DE MATERIALES MAGNÉTICOS BLANDO DE ORIENTE MEDIO Y ÁFRICA, POR CANAL DE DISTRIBUCIÓN, 2018-2032 (MILLONES DE USD)
TABLA 160 MERCADO DE MATERIALES MAGNÉTICOS BLANDO DE ARABIA SAUDITA, POR TIPO DE PRODUCTO, 2018-2032 (MILLONES DE USD)
TABLA 161 MERCADO DE MATERIALES MAGNÉTICOS BLANDO DE ARABIA SAUDITA, POR TIPO DE PRODUCTO, 2018-2032 (MILES DE TONELADAS)
TABLA 162 NÚCLEOS Y TIPOS DE NÚCLEOS DE ARABIA SAUDITA EN EL MERCADO DE MATERIALES MAGNÉTICOS BLANDO, POR TIPO, 2018-2032 (MILLONES DE USD)
TABLA 163 CINTAS Y LÁMINAS DE ARABIA SAUDITA EN EL MERCADO DE MATERIALES MAGNÉTICOS BLANDO, POR TIPO, 2018-2032 (MILLONES DE USD)
TABLA 164 MERCADO DE MATERIALES MAGNÉTICOS BLANDO DE ARABIA SAUDITA, POR TIPO DE MATERIAL, 2018-2032 (MILLONES DE USD)
TABLA 165 MERCADO DE MATERIALES MAGNÉTICOS BLANDO DE ARABIA SAUDITA, POR TIPO DE MATERIAL, 2018-2032 (MILES DE TONELADAS)
TABLA 166 FERRITAS BLANDAS DE ARABIA SAUDITA EN EL MERCADO DE MATERIALES MAGNÉTICOS BLANDOS, POR TIPO, 2018-2032 (MILLONES DE USD)
TABLA 167 ACEROS ELÉCTRICOS (FE-SI) DE ARABIA SAUDITA EN EL MERCADO DE MATERIALES MAGNÉTICOS BLANDO, POR TIPO, 2018-2032 (MILLONES DE USD)
TABLA 168 NÚCLEOS Y TIPOS DE NÚCLEOS DE ARABIA SAUDITA EN EL MERCADO DE MATERIALES MAGNÉTICOS BLANDO, POR TIPO, 2018-2032 (MILLONES DE USD)
TABLA 169 MERCADO DE MATERIALES MAGNÉTICOS BLANDO DE ARABIA SAUDITA, POR PROCESO DE FABRICACIÓN, 2018-2032 (MILLONES DE USD)
TABLA 170 MERCADO DE MATERIALES MAGNÉTICOS BLANDO DE ARABIA SAUDITA, POR APLICACIÓN, 2018-2032 (MILLONES DE USD)
TABLA 171 ARABIA SAUDITA INDUCCIÓN ELECTROMAGNÉTICA EN EL MERCADO DE MATERIALES MAGNÉTICOS BLANDO, POR TIPO, 2018-2032 (MILLONES DE USD)
TABLA 172 ARABIA SAUDITA ACONDICIONAMIENTO Y CONVERSIÓN DE ENERGÍA EN EL MERCADO DE MATERIALES MAGNÉTICOS BLANDO, POR TIPO, 2018-2032 (MILLONES DE USD)
TABLA 173 MERCADO DE MATERIALES MAGNÉTICOS BLANDO DE ARABIA SAUDITA, POR USUARIO FINAL, 2018-2032 (MILLONES DE USD)
TABLA 174 INDUSTRIA AUTOMOTRIZ DE ARABIA SAUDITA EN EL MERCADO DE MATERIALES MAGNÉTICOS BLANDO, POR APLICACIÓN, 2018-2032 (MILLONES DE USD)
TABLA 175 INDUSTRIA AUTOMOTRIZ DE ARABIA SAUDITA EN EL MERCADO DE MATERIALES MAGNÉTICOS BLANDO, POR TIPO DE PRODUCTO, 2018-2032 (MILLONES DE USD)
TABLA 176 NÚCLEOS Y TIPOS DE NÚCLEOS DE ARABIA SAUDITA EN EL MERCADO DE MATERIALES MAGNÉTICOS BLANDO, POR TIPO, 2018-2032 (MILLONES DE USD)
TABLA 177 CINTAS Y LÁMINAS DE ARABIA SAUDITA EN EL MERCADO DE MATERIALES MAGNÉTICOS BLANDO, POR TIPO, 2018-2032 (MILLONES DE USD)
TABLA 178 SERVICIOS ELÉCTRICOS Y DE ENERGÍA DE ARABIA SAUDITA EN EL MERCADO DE MATERIALES MAGNÉTICOS BLANDO, POR APLICACIÓN, 2018-2032 (MILLONES DE USD)
TABLA 179 SERVICIOS ELÉCTRICOS Y DE ENERGÍA DE ARABIA SAUDITA EN EL MERCADO DE MATERIALES MAGNÉTICOS BLANDO, POR TIPO DE PRODUCTO, 2018-2032 (MILLONES DE USD)
TABLA 180 NÚCLEOS Y TIPOS DE NÚCLEOS DE ARABIA SAUDITA EN EL MERCADO DE MATERIALES MAGNÉTICOS BLANDO, POR TIPO, 2018-2032 (MILLONES DE USD)
TABLA 181 CINTAS Y LÁMINAS DE ARABIA SAUDITA EN EL MERCADO DE MATERIALES MAGNÉTICOS BLANDO, POR TIPO, 2018-2032 (MILLONES DE USD)
TABLA 182 MERCADO DE ELECTRÓNICA DE CONSUMO EN MATERIALES MAGNÉTICOS BLANDO DE ARABIA SAUDITA, POR APLICACIÓN, 2018-2032 (MILLONES DE USD)
TABLA 183 MERCADO DE ELECTRÓNICA DE CONSUMO EN MATERIALES MAGNÉTICOS BLANDO DE ARABIA SAUDITA, POR TIPO DE PRODUCTO, 2018-2032 (MILLONES DE USD)
TABLA 184 NÚCLEOS Y TIPOS DE NÚCLEOS DE ARABIA SAUDITA EN EL MERCADO DE MATERIALES MAGNÉTICOS BLANDO, POR TIPO, 2018-2032 (MILLONES DE USD)
TABLA 185 CINTAS Y LÁMINAS DE ARABIA SAUDITA EN EL MERCADO DE MATERIALES MAGNÉTICOS BLANDO, POR TIPO, 2018-2032 (MILLONES DE USD)
TABLA 186 ARABIA SAUDITA TI Y TELECOMUNICACIONES EN EL MERCADO DE MATERIALES MAGNÉTICOS BLANDO, POR APLICACIÓN, 2018-2032 (MILLONES DE USD)
TABLA 187 ARABIA SAUDITA TI Y TELECOMUNICACIONES EN EL MERCADO DE MATERIALES MAGNÉTICOS BLANDO, POR TIPO DE PRODUCTO, 2018-2032 (MILLONES DE USD)
TABLA 188 NÚCLEOS Y TIPOS DE NÚCLEOS DE ARABIA SAUDITA EN EL MERCADO DE MATERIALES MAGNÉTICOS BLANDO, POR TIPO, 2018-2032 (MILLONES DE USD)
TABLA 189 CINTAS Y LÁMINAS DE ARABIA SAUDITA EN EL MERCADO DE MATERIALES MAGNÉTICOS BLANDO, POR TIPO, 2018-2032 (MILLONES DE USD)
TABLA 190 FABRICACIÓN INDUSTRIAL DE MATERIALES MAGNÉTICOS BLANDO EN ARABIA SAUDITA, POR APLICACIÓN, 2018-2032 (MILLONES DE USD)
TABLA 191 FABRICACIÓN INDUSTRIAL DE MATERIALES MAGNÉTICOS BLANDO EN ARABIA SAUDITA, POR TIPO DE PRODUCTO, 2018-2032 (MILLONES DE USD)
TABLA 192 NÚCLEOS Y TIPOS DE NÚCLEOS DE ARABIA SAUDITA EN EL MERCADO DE MATERIALES MAGNÉTICOS BLANDO, POR TIPO, 2018-2032 (MILLONES DE USD)
TABLA 193 CINTAS Y LÁMINAS DE ARABIA SAUDITA EN EL MERCADO DE MATERIALES MAGNÉTICOS BLANDO, POR TIPO, 2018-2032 (MILLONES DE USD)
TABLA 194 ARABIA SAUDITA AEROESPACIAL Y DEFENSA EN EL MERCADO DE MATERIALES MAGNÉTICOS BLANDO, POR APLICACIÓN, 2018-2032 (MILLONES DE USD)
TABLA 195 ARABIA SAUDITA AEROESPACIAL Y DEFENSA EN EL MERCADO DE MATERIALES MAGNÉTICOS BLANDO, POR TIPO DE PRODUCTO, 2018-2032 (MILLONES DE USD)
TABLA 196 NÚCLEOS Y TIPOS DE NÚCLEOS DE ARABIA SAUDITA EN EL MERCADO DE MATERIALES MAGNÉTICOS BLANDO, POR TIPO, 2018-2032 (MILLONES DE USD)
TABLA 197 CINTAS Y LÁMINAS DE ARABIA SAUDITA EN EL MERCADO DE MATERIALES MAGNÉTICOS BLANDO, POR TIPO, 2018-2032 (MILLONES DE USD)
TABLA 198 ARABIA SAUDITA SALUD Y SERVICIOS MÉDICOS EN EL MERCADO DE MATERIALES MAGNÉTICOS BLANDO, POR APLICACIÓN, 2018-2032 (MILLONES DE USD)
TABLA 199 ARABIA SAUDITA: SALUD Y SERVICIOS MÉDICOS EN EL MERCADO DE MATERIALES MAGNÉTICOS BLANDO, POR TIPO DE PRODUCTO, 2018-2032 (MILLONES DE USD)
TABLA 200 NÚCLEOS Y TIPOS DE NÚCLEOS EN EL MERCADO DE MATERIALES MAGNÉTICOS BLANDO DE ARABIA SAUDITA, POR TIPO, 2018-2032 (MILLONES DE USD)
TABLA 201 CINTAS Y LÁMINAS DE ARABIA SAUDITA EN EL MERCADO DE MATERIALES MAGNÉTICOS BLANDO, POR TIPO, 2018-2032 (MILLONES DE USD)
TABLA 202 ARABIA SAUDITA MERCADO DE ENERGÍAS RENOVABLES EN MATERIALES MAGNÉTICOS BLANDO, POR APLICACIÓN, 2018-2032 (MILLONES DE USD)
TABLA 203 ARABIA SAUDITA MERCADO DE ENERGÍA RENOVABLE EN MATERIALES MAGNÉTICOS BLANDO, POR TIPO DE PRODUCTO, 2018-2032 (MILLONES DE USD)
TABLA 204 NÚCLEOS Y TIPOS DE NÚCLEOS DE ARABIA SAUDITA EN EL MERCADO DE MATERIALES MAGNÉTICOS BLANDO, POR TIPO, 2018-2032 (MILLONES DE USD)
TABLA 205 CINTAS Y LÁMINAS DE ARABIA SAUDITA EN EL MERCADO DE MATERIALES MAGNÉTICOS BLANDO, POR TIPO, 2018-2032 (MILLONES DE USD)
TABLA 206 INDUSTRIA DE LA CONSTRUCCIÓN EN ARABIA SAUDITA EN EL MERCADO DE MATERIALES MAGNÉTICOS BLANDO, POR APLICACIÓN, 2018-2032 (MILLONES DE USD)
TABLA 207 INDUSTRIA DE LA CONSTRUCCIÓN EN ARABIA SAUDITA EN EL MERCADO DE MATERIALES MAGNÉTICOS BLANDO, POR TIPO DE PRODUCTO, 2018-2032 (MILLONES DE USD)
TABLA 208 NÚCLEOS Y TIPOS DE NÚCLEOS DE ARABIA SAUDITA EN EL MERCADO DE MATERIALES MAGNÉTICOS BLANDO, POR TIPO, 2018-2032 (MILLONES DE USD)
TABLA 209 CINTAS Y LÁMINAS DE ARABIA SAUDITA EN EL MERCADO DE MATERIALES MAGNÉTICOS BLANDO, POR TIPO, 2018-2032 (MILLONES DE USD)
TABLA 210 ARABIA SAUDITA OTROS MERCADOS DE MATERIALES MAGNÉTICOS BLANDO, POR APLICACIÓN, 2018-2032 (MILLONES DE USD)
TABLA 211 ARABIA SAUDITA OTROS MERCADOS DE MATERIALES MAGNÉTICOS BLANDO, POR TIPO DE PRODUCTO, 2018-2032 (MILLONES DE USD)
TABLA 212 NÚCLEOS Y TIPOS DE NÚCLEOS DE ARABIA SAUDITA EN EL MERCADO DE MATERIALES MAGNÉTICOS BLANDO, POR TIPO, 2018-2032 (MILLONES DE USD)
TABLA 213 CINTAS Y LÁMINAS DE ARABIA SAUDITA EN EL MERCADO DE MATERIALES MAGNÉTICOS BLANDO, POR TIPO, 2018-2032 (MILLONES DE USD)
TABLA 214 MERCADO DE MATERIALES MAGNÉTICOS BLANDO DE ARABIA SAUDITA, POR CANAL DE DISTRIBUCIÓN, 2018-2032 (MILLONES DE USD)
TABLA 215 MERCADO DE MATERIALES MAGNÉTICOS BLANDO DE LOS EMIRATOS ÁRABES UNIDOS, POR TIPO DE PRODUCTO, 2018-2032 (MILLONES DE USD)
TABLA 216 MERCADO DE MATERIALES MAGNÉTICOS BLANDO DE LOS EMIRATOS ÁRABES UNIDOS, POR TIPO DE PRODUCTO, 2018-2032 (MILES DE TONELADAS)
TABLA 217 NÚCLEOS Y TIPOS DE NÚCLEOS DE LOS EMIRATOS ÁRABES UNIDOS EN EL MERCADO DE MATERIALES MAGNÉTICOS BLANDO, POR TIPO, 2018-2032 (MILLONES DE USD)
TABLA 218 EMIRATOS ÁRABES UNIDOS CINTAS Y LÁMINAS EN EL MERCADO DE MATERIALES MAGNÉTICOS BLANDO, POR TIPO, 2018-2032 (MILLONES DE USD)
TABLA 219 MERCADO DE MATERIALES MAGNÉTICOS BLANDO DE LOS EMIRATOS ÁRABES UNIDOS, POR TIPO DE MATERIAL, 2018-2032 (MILLONES DE USD)
TABLA 220 MERCADO DE MATERIALES MAGNÉTICOS BLANDO DE LOS EMIRATOS ÁRABES UNIDOS, POR TIPO DE MATERIAL, 2018-2032 (MILES DE TONELADAS)
TABLA 221 EMIRATOS ÁRABES UNIDOS FERRITAS BLANDAS EN EL MERCADO DE MATERIALES MAGNÉTICOS BLANDOS, POR TIPO, 2018-2032 (MILLONES DE USD)
TABLA 222 EMIRATOS ÁRABES UNIDOS ACEROS ELÉCTRICOS (FE-SI) EN EL MERCADO DE MATERIALES MAGNÉTICOS BLANDO, POR TIPO, 2018-2032 (MILLONES DE USD)
TABLA 223 NÚCLEOS Y TIPOS DE NÚCLEOS DE LOS EMIRATOS ÁRABES UNIDOS EN EL MERCADO DE MATERIALES MAGNÉTICOS BLANDO, POR TIPO, 2018-2032 (MILLONES DE USD)
TABLA 224 MERCADO DE MATERIALES MAGNÉTICOS BLANDO DE LOS EMIRATOS ÁRABES UNIDOS, POR PROCESO DE FABRICACIÓN, 2018-2032 (MILLONES DE USD)
TABLA 225 MERCADO DE MATERIALES MAGNÉTICOS BLANDO DE LOS EMIRATOS ÁRABES UNIDOS, POR APLICACIÓN, 2018-2032 (MILLONES DE USD)
TABLA 226 EMIRATOS ÁRABES UNIDOS MERCADO DE INDUCCIÓN ELECTROMAGNÉTICA EN MATERIALES MAGNÉTICOS BLANDO, POR TIPO, 2018-2032 (MILLONES DE USD)
TABLA 227 EMIRATOS ÁRABES UNIDOS ACONDICIONAMIENTO Y CONVERSIÓN DE ENERGÍA EN EL MERCADO DE MATERIALES MAGNÉTICOS BLANDO, POR TIPO, 2018-2032 (MILLONES DE USD)
TABLA 228 MERCADO DE MATERIALES MAGNÉTICOS BLANDO DE LOS EMIRATOS ÁRABES UNIDOS, POR USUARIO FINAL, 2018-2032 (MILLONES DE USD)
TABLA 229 EMIRATOS ÁRABES UNIDOS INDUSTRIA AUTOMOTRIZ EN EL MERCADO DE MATERIALES MAGNÉTICOS BLANDO, POR APLICACIÓN, 2018-2032 (MILLONES DE USD)
TABLA 230 EMIRATOS ÁRABES UNIDOS INDUSTRIA AUTOMOTRIZ EN EL MERCADO DE MATERIALES MAGNÉTICOS BLANDO, POR TIPO DE PRODUCTO, 2018-2032 (MILLONES DE USD)
TABLA 231 EMIRATOS ÁRABES UNIDOS NÚCLEOS Y TIPOS DE NÚCLEOS EN EL MERCADO DE MATERIALES MAGNÉTICOS BLANDO, POR TIPO, 2018-2032 (MILLONES DE USD)
TABLA 232 EMIRATOS ÁRABES UNIDOS CINTAS Y LÁMINAS EN EL MERCADO DE MATERIALES MAGNÉTICOS BLANDO, POR TIPO, 2018-2032 (MILLONES DE USD)
TABLA 233 EMIRATOS ÁRABES UNIDOS SERVICIOS ELÉCTRICOS Y DE ENERGÍA EN EL MERCADO DE MATERIALES MAGNÉTICOS BLANDO, POR APLICACIÓN, 2018-2032 (MILLONES DE USD)
TABLA 234 EMIRATOS ÁRABES UNIDOS SERVICIOS ELÉCTRICOS Y DE ENERGÍA EN EL MERCADO DE MATERIALES MAGNÉTICOS BLANDO, POR TIPO DE PRODUCTO, 2018-2032 (MILLONES DE USD)
TABLA 235 NÚCLEOS Y TIPOS DE NÚCLEOS DE LOS EMIRATOS ÁRABES UNIDOS EN EL MERCADO DE MATERIALES MAGNÉTICOS BLANDO, POR TIPO, 2018-2032 (MILLONES DE USD)
TABLA 236 EMIRATOS ÁRABES UNIDOS CINTAS Y LÁMINAS EN EL MERCADO DE MATERIALES MAGNÉTICOS BLANDO, POR TIPO, 2018-2032 (MILLONES DE USD)
TABLA 237 EMIRATOS ÁRABES UNIDOS MERCADO DE ELECTRÓNICA DE CONSUMO EN MATERIALES MAGNÉTICOS BLANDO, POR APLICACIÓN, 2018-2032 (MILLONES DE USD)
TABLA 238 EMIRATOS ÁRABES UNIDOS MERCADO DE ELECTRÓNICA DE CONSUMO EN MATERIALES MAGNÉTICOS BLANDO, POR TIPO DE PRODUCTO, 2018-2032 (MILLONES DE USD)
TABLA 239 EMIRATOS ÁRABES UNIDOS NÚCLEOS Y TIPOS DE NÚCLEOS EN EL MERCADO DE MATERIALES MAGNÉTICOS BLANDO, POR TIPO, 2018-2032 (MILLONES DE USD)
TABLA 240 EMIRATOS ÁRABES UNIDOS CINTAS Y LÁMINAS EN EL MERCADO DE MATERIALES MAGNÉTICOS BLANDO, POR TIPO, 2018-2032 (MILLONES DE USD)
TABLA 241 EMIRATOS ÁRABES UNIDOS TI Y TELECOMUNICACIONES EN EL MERCADO DE MATERIALES MAGNÉTICOS BLANDO, POR APLICACIÓN, 2018-2032 (MILLONES DE USD)
TABLA 242 EMIRATOS ÁRABES UNIDOS TI Y TELECOMUNICACIONES EN EL MERCADO DE MATERIALES MAGNÉTICOS BLANDO, POR TIPO DE PRODUCTO, 2018-2032 (MILLONES DE USD)
TABLA 243 NÚCLEOS Y TIPOS DE NÚCLEOS DE LOS EMIRATOS ÁRABES UNIDOS EN EL MERCADO DE MATERIALES MAGNÉTICOS BLANDO, POR TIPO, 2018-2032 (MILLONES DE USD)
TABLA 244 EMIRATOS ÁRABES UNIDOS CINTAS Y LÁMINAS EN EL MERCADO DE MATERIALES MAGNÉTICOS BLANDO, POR TIPO, 2018-2032 (MILLONES DE USD)
TABLA 245 EMIRATOS ÁRABES UNIDOS FABRICACIÓN INDUSTRIAL EN EL MERCADO DE MATERIALES MAGNÉTICOS BLANDO, POR APLICACIÓN, 2018-2032 (MILLONES DE USD)
TABLA 246 EMIRATOS ÁRABES UNIDOS FABRICACIÓN INDUSTRIAL EN EL MERCADO DE MATERIALES MAGNÉTICOS BLANDO, POR TIPO DE PRODUCTO, 2018-2032 (MILLONES DE USD)
TABLA 247 NÚCLEOS Y TIPOS DE NÚCLEOS DE LOS EMIRATOS ÁRABES UNIDOS EN EL MERCADO DE MATERIALES MAGNÉTICOS BLANDO, POR TIPO, 2018-2032 (MILLONES DE USD)
TABLA 248 EMIRATOS ÁRABES UNIDOS CINTAS Y LÁMINAS EN EL MERCADO DE MATERIALES MAGNÉTICOS BLANDO, POR TIPO, 2018-2032 (MILLONES DE USD)
TABLA 249 EMIRATOS ÁRABES UNIDOS AEROESPACIAL Y DEFENSA EN EL MERCADO DE MATERIALES MAGNÉTICOS BLANDO, POR APLICACIÓN, 2018-2032 (MILLONES DE USD)
TABLA 250 EMIRATOS ÁRABES UNIDOS AEROESPACIAL Y DEFENSA EN EL MERCADO DE MATERIALES MAGNÉTICOS BLANDO, POR TIPO DE PRODUCTO, 2018-2032 (MILLONES DE USD)
TABLA 251 EMIRATOS ÁRABES UNIDOS NÚCLEOS Y TIPOS DE NÚCLEOS EN EL MERCADO DE MATERIALES MAGNÉTICOS BLANDO, POR TIPO, 2018-2032 (MILLONES DE USD)
TABLA 252 EMIRATOS ÁRABES UNIDOS CINTAS Y LÁMINAS EN EL MERCADO DE MATERIALES MAGNÉTICOS BLANDO, POR TIPO, 2018-2032 (MILLONES DE USD)
TABLA 253 EMIRATOS ÁRABES UNIDOS SALUD Y MEDICINA EN EL MERCADO DE MATERIALES MAGNÉTICOS BLANDO, POR APLICACIÓN, 2018-2032 (MILLONES DE USD)
TABLA 254 EMIRATOS ÁRABES UNIDOS SALUD Y MEDICINA EN EL MERCADO DE MATERIALES MAGNÉTICOS BLANDO, POR TIPO DE PRODUCTO, 2018-2032 (MILLONES DE USD)
TABLA 255 NÚCLEOS Y TIPOS DE NÚCLEOS DE LOS EMIRATOS ÁRABES UNIDOS EN EL MERCADO DE MATERIALES MAGNÉTICOS BLANDO, POR TIPO, 2018-2032 (MILLONES DE USD)
TABLA 256 EMIRATOS ÁRABES UNIDOS CINTAS Y LÁMINAS EN EL MERCADO DE MATERIALES MAGNÉTICOS BLANDO, POR TIPO, 2018-2032 (MILLONES DE USD)
TABLA 257 EMIRATOS ÁRABES UNIDOS MERCADO DE ENERGÍAS RENOVABLES EN MATERIALES MAGNÉTICOS BLANDO, POR APLICACIÓN, 2018-2032 (MILLONES DE USD)
TABLA 258 EMIRATOS ÁRABES UNIDOS MERCADO DE ENERGÍA RENOVABLE EN MATERIALES MAGNÉTICOS BLANDO, POR TIPO DE PRODUCTO, 2018-2032 (MILLONES DE USD)
TABLA 259 NÚCLEOS Y TIPOS DE NÚCLEOS DE LOS EMIRATOS ÁRABES UNIDOS EN EL MERCADO DE MATERIALES MAGNÉTICOS BLANDO, POR TIPO, 2018-2032 (MILLONES DE USD)
TABLA 260 EMIRATOS ÁRABES UNIDOS CINTAS Y LÁMINAS EN EL MERCADO DE MATERIALES MAGNÉTICOS BLANDO, POR TIPO, 2018-2032 (MILLONES DE USD)
TABLA 261 INDUSTRIA DE LA CONSTRUCCIÓN DE LOS EMIRATOS ÁRABES UNIDOS EN EL MERCADO DE MATERIALES MAGNÉTICOS BLANDO, POR APLICACIÓN, 2018-2032 (MILLONES DE USD)
TABLA 262 EMIRATOS ÁRABES UNIDOS INDUSTRIA DE LA CONSTRUCCIÓN EN EL MERCADO DE MATERIALES MAGNÉTICOS BLANDO, POR TIPO DE PRODUCTO, 2018-2032 (MILLONES DE USD)
TABLA 263 NÚCLEOS Y TIPOS DE NÚCLEOS DE LOS EMIRATOS ÁRABES UNIDOS EN EL MERCADO DE MATERIALES MAGNÉTICOS BLANDO, POR TIPO, 2018-2032 (MILLONES DE USD)
TABLA 264 EMIRATOS ÁRABES UNIDOS CINTAS Y LÁMINAS EN EL MERCADO DE MATERIALES MAGNÉTICOS BLANDO, POR TIPO, 2018-2032 (MILLONES DE USD)
TABLA 265 EMIRATOS ÁRABES UNIDOS OTROS EN EL MERCADO DE MATERIALES MAGNÉTICOS BLANDO, POR APLICACIÓN, 2018-2032 (MILLONES DE USD)
TABLA 266 EMIRATOS ÁRABES UNIDOS OTROS EN EL MERCADO DE MATERIALES MAGNÉTICOS BLANDO, POR TIPO DE PRODUCTO, 2018-2032 (MILLONES DE USD)
TABLA 267 NÚCLEOS Y TIPOS DE NÚCLEOS DE LOS EMIRATOS ÁRABES UNIDOS EN EL MERCADO DE MATERIALES MAGNÉTICOS BLANDO, POR TIPO, 2018-2032 (MILLONES DE USD)
TABLA 268 EMIRATOS ÁRABES UNIDOS CINTAS Y LÁMINAS EN EL MERCADO DE MATERIALES MAGNÉTICOS BLANDO, POR TIPO, 2018-2032 (MILLONES DE USD)
TABLA 269 MERCADO DE MATERIALES MAGNÉTICOS BLANDO DE LOS EMIRATOS ÁRABES UNIDOS, POR CANAL DE DISTRIBUCIÓN, 2018-2032 (MILLONES DE USD)
TABLA 270 MERCADO DE MATERIALES MAGNÉTICOS BLANDO DE SUDÁFRICA, POR TIPO DE PRODUCTO, 2018-2032 (MILLONES DE USD)
TABLA 271 MERCADO DE MATERIALES MAGNÉTICOS BLANDO DE SUDÁFRICA, POR TIPO DE PRODUCTO, 2018-2032 (MILES DE TONELADAS)
TABLA 272 NÚCLEOS Y TIPOS DE NÚCLEOS DE SUDÁFRICA EN EL MERCADO DE MATERIALES MAGNÉTICOS BLANDO, POR TIPO, 2018-2032 (MILLONES DE USD)
TABLA 273 CINTAS Y LÁMINAS DE SUDÁFRICA EN EL MERCADO DE MATERIALES MAGNÉTICOS BLANDO, POR TIPO, 2018-2032 (MILLONES DE USD)
TABLA 274 MERCADO DE MATERIALES MAGNÉTICOS BLANDO DE SUDÁFRICA, POR TIPO DE MATERIAL, 2018-2032 (MILLONES DE USD)
TABLA 275 MERCADO DE MATERIALES MAGNÉTICOS BLANDO DE SUDÁFRICA, POR TIPO DE MATERIAL, 2018-2032 (MILES DE TONELADAS)
TABLA 276 FERRITAS BLANDAS DE SUDÁFRICA EN EL MERCADO DE MATERIALES MAGNÉTICOS BLANDOS, POR TIPO, 2018-2032 (MILLONES DE USD)
TABLA 277 ACEROS ELÉCTRICOS DE SUDÁFRICA (FE-SI) EN EL MERCADO DE MATERIALES MAGNÉTICOS BLANDO, POR TIPO, 2018-2032 (MILLONES DE USD)
TABLA 278 NÚCLEOS Y TIPOS DE NÚCLEOS DE SUDÁFRICA EN EL MERCADO DE MATERIALES MAGNÉTICOS BLANDO, POR TIPO, 2018-2032 (MILLONES DE USD)
TABLA 279 MERCADO DE MATERIALES MAGNÉTICOS BLANDO DE SUDÁFRICA, POR PROCESO DE FABRICACIÓN, 2018-2032 (MILLONES DE USD)
TABLA 280 MERCADO DE MATERIALES MAGNÉTICOS BLANDO DE SUDÁFRICA, POR APLICACIÓN, 2018-2032 (MILLONES DE USD)
TABLA 281 MERCADO DE INDUCCIÓN ELECTROMAGNÉTICA EN MATERIALES MAGNÉTICOS BLANDO DE SUDÁFRICA, POR TIPO, 2018-2032 (MILLONES DE USD)
TABLA 282 ACONDICIONAMIENTO Y CONVERSIÓN DE ENERGÍA EN EL MERCADO DE MATERIALES MAGNÉTICOS BLANDO DE SUDÁFRICA, POR TIPO, 2018-2032 (MILLONES DE USD)
TABLA 283 MERCADO DE MATERIALES MAGNÉTICOS BLANDO DE SUDÁFRICA, POR USUARIO FINAL, 2018-2032 (MILLONES DE USD)
TABLA 284 INDUSTRIA AUTOMOTRIZ DE SUDÁFRICA EN EL MERCADO DE MATERIALES MAGNÉTICOS BLANDO, POR APLICACIÓN, 2018-2032 (MILLONES DE USD)
TABLA 285 INDUSTRIA AUTOMOTRIZ DE SUDÁFRICA EN EL MERCADO DE MATERIALES MAGNÉTICOS BLANDO, POR TIPO DE PRODUCTO, 2018-2032 (MILLONES DE USD)
TABLA 286 NÚCLEOS Y TIPOS DE NÚCLEOS DE SUDÁFRICA EN EL MERCADO DE MATERIALES MAGNÉTICOS BLANDO, POR TIPO, 2018-2032 (MILLONES DE USD)
TABLA 287 CINTAS Y LÁMINAS DE SUDÁFRICA EN EL MERCADO DE MATERIALES MAGNÉTICOS BLANDO, POR TIPO, 2018-2032 (MILLONES DE USD)
TABLA 288 SERVICIOS ELÉCTRICOS Y DE ENERGÍA DE SUDÁFRICA EN EL MERCADO DE MATERIALES MAGNÉTICOS BLANDO, POR APLICACIÓN, 2018-2032 (MILLONES DE USD)
TABLA 289 SERVICIOS ELÉCTRICOS Y DE ENERGÍA DE SUDÁFRICA EN EL MERCADO DE MATERIALES MAGNÉTICOS BLANDO, POR TIPO DE PRODUCTO, 2018-2032 (MILLONES DE USD)
TABLA 290 NÚCLEOS Y TIPOS DE NÚCLEOS DE SUDÁFRICA EN EL MERCADO DE MATERIALES MAGNÉTICOS BLANDO, POR TIPO, 2018-2032 (MILLONES DE USD)
TABLA 291 CINTAS Y LÁMINAS DE SUDÁFRICA EN EL MERCADO DE MATERIALES MAGNÉTICOS BLANDO, POR TIPO, 2018-2032 (MILLONES DE USD)
TABLA 292 MERCADO DE ELECTRÓNICA DE CONSUMO EN MATERIALES MAGNÉTICOS BLANDO DE SUDÁFRICA, POR APLICACIÓN, 2018-2032 (MILLONES DE USD)
TABLA 293 MERCADO DE ELECTRÓNICA DE CONSUMO EN MATERIALES MAGNÉTICOS BLANDO DE SUDÁFRICA, POR TIPO DE PRODUCTO, 2018-2032 (MILLONES DE USD)
TABLA 294 NÚCLEOS Y TIPOS DE NÚCLEOS DE SUDÁFRICA EN EL MERCADO DE MATERIALES MAGNÉTICOS BLANDO, POR TIPO, 2018-2032 (MILLONES DE USD)
TABLA 295 CINTAS Y LÁMINAS DE SUDÁFRICA EN EL MERCADO DE MATERIALES MAGNÉTICOS BLANDO, POR TIPO, 2018-2032 (MILLONES DE USD)
TABLA 296 MERCADO DE TI Y TELECOMUNICACIONES EN MATERIALES MAGNÉTICOS BLANDO DE SUDÁFRICA, POR APLICACIÓN, 2018-2032 (MILLONES DE USD)
TABLA 297 MERCADO DE TI Y TELECOMUNICACIONES DE SUDÁFRICA EN MATERIALES MAGNÉTICOS BLANDO, POR TIPO DE PRODUCTO, 2018-2032 (MILLONES DE USD)
TABLA 298 NÚCLEOS Y TIPOS DE NÚCLEOS DE SUDÁFRICA EN EL MERCADO DE MATERIALES MAGNÉTICOS BLANDO, POR TIPO, 2018-2032 (MILLONES DE USD)
TABLA 299 CINTAS Y LÁMINAS DE SUDÁFRICA EN EL MERCADO DE MATERIALES MAGNÉTICOS BLANDO, POR TIPO, 2018-2032 (MILLONES DE USD)
TABLA 300 FABRICACIÓN INDUSTRIAL DE MATERIALES MAGNÉTICOS BLANDO EN SUDÁFRICA, POR APLICACIÓN, 2018-2032 (MILLONES DE USD)
TABLA 301 FABRICACIÓN INDUSTRIAL DE MATERIALES MAGNÉTICOS BLANDO EN SUDÁFRICA, POR TIPO DE PRODUCTO, 2018-2032 (MILLONES DE USD)
TABLA 302 NÚCLEOS Y TIPOS DE NÚCLEOS DE SUDÁFRICA EN EL MERCADO DE MATERIALES MAGNÉTICOS BLANDO, POR TIPO, 2018-2032 (MILLONES DE USD)
TABLA 303 CINTAS Y LÁMINAS DE SUDÁFRICA EN EL MERCADO DE MATERIALES MAGNÉTICOS BLANDO, POR TIPO, 2018-2032 (MILLONES DE USD)
TABLA 304 SUDÁFRICA AEROESPACIAL Y DEFENSA EN EL MERCADO DE MATERIALES MAGNÉTICOS BLANDO, POR APLICACIÓN, 2018-2032 (MILLONES DE USD)
TABLA 305 SUDÁFRICA AEROESPACIAL Y DEFENSA EN EL MERCADO DE MATERIALES MAGNÉTICOS BLANDO, POR TIPO DE PRODUCTO, 2018-2032 (MILLONES DE USD)
TABLA 306 NÚCLEOS Y TIPOS DE NÚCLEOS DE SUDÁFRICA EN EL MERCADO DE MATERIALES MAGNÉTICOS BLANDO, POR TIPO, 2018-2032 (MILLONES DE USD)
TABLA 307 CINTAS Y LÁMINAS DE SUDÁFRICA EN EL MERCADO DE MATERIALES MAGNÉTICOS BLANDO, POR TIPO, 2018-2032 (MILLONES DE USD)
TABLA 308 MERCADO DE MATERIALES MAGNÉTICOS BLANDO EN SUDÁFRICA, POR APLICACIÓN, 2018-2032 (MILLONES DE USD)
TABLA 309 SUDÁFRICA SALUD Y MEDICINA EN EL MERCADO DE MATERIALES MAGNÉTICOS BLANDO, POR TIPO DE PRODUCTO, 2018-2032 (MILLONES DE USD)
TABLA 310 NÚCLEOS Y TIPOS DE NÚCLEOS DE SUDÁFRICA EN EL MERCADO DE MATERIALES MAGNÉTICOS BLANDO, POR TIPO, 2018-2032 (MILLONES DE USD)
TABLA 311 CINTAS Y LÁMINAS DE SUDÁFRICA EN EL MERCADO DE MATERIALES MAGNÉTICOS BLANDO, POR TIPO, 2018-2032 (MILLONES DE USD)
TABLA 312 MERCADO DE ENERGÍA RENOVABLE EN MATERIALES MAGNÉTICOS BLANDO DE SUDÁFRICA, POR APLICACIÓN, 2018-2032 (MILLONES DE USD)
TABLA 313 MERCADO DE ENERGÍA RENOVABLE EN MATERIALES MAGNÉTICOS BLANDO DE SUDÁFRICA, POR TIPO DE PRODUCTO, 2018-2032 (MILLONES DE USD)
TABLA 314 NÚCLEOS Y TIPOS DE NÚCLEOS DE SUDÁFRICA EN EL MERCADO DE MATERIALES MAGNÉTICOS BLANDO, POR TIPO, 2018-2032 (MILLONES DE USD)
TABLA 315 CINTAS Y LÁMINAS DE SUDÁFRICA EN EL MERCADO DE MATERIALES MAGNÉTICOS BLANDO, POR TIPO, 2018-2032 (MILLONES DE USD)
TABLA 316 INDUSTRIA DE LA CONSTRUCCIÓN EN SUDÁFRICA EN EL MERCADO DE MATERIALES MAGNÉTICOS BLANDO, POR APLICACIÓN, 2018-2032 (MILLONES DE USD)
TABLA 317 INDUSTRIA DE LA CONSTRUCCIÓN EN SUDÁFRICA EN EL MERCADO DE MATERIALES MAGNÉTICOS BLANDO, POR TIPO DE PRODUCTO, 2018-2032 (MILLONES DE USD)
TABLA 318 NÚCLEOS Y TIPOS DE NÚCLEOS DE SUDÁFRICA EN EL MERCADO DE MATERIALES MAGNÉTICOS BLANDO, POR TIPO, 2018-2032 (MILLONES DE USD)
TABLA 319 CINTAS Y LÁMINAS DE SUDÁFRICA EN EL MERCADO DE MATERIALES MAGNÉTICOS BLANDO, POR TIPO, 2018-2032 (MILLONES DE USD)
TABLA 320 SUDÁFRICA OTROS EN EL MERCADO DE MATERIALES MAGNÉTICOS BLANDO, POR APLICACIÓN, 2018-2032 (MILLONES DE USD)
TABLA 321 SUDÁFRICA OTROS EN EL MERCADO DE MATERIALES MAGNÉTICOS BLANDO, POR TIPO DE PRODUCTO, 2018-2032 (MILLONES DE USD)
TABLA 322 NÚCLEOS Y TIPOS DE NÚCLEOS DE SUDÁFRICA EN EL MERCADO DE MATERIALES MAGNÉTICOS BLANDO, POR TIPO, 2018-2032 (MILLONES DE USD)
TABLA 323 CINTAS Y LÁMINAS DE SUDÁFRICA EN EL MERCADO DE MATERIALES MAGNÉTICOS BLANDO, POR TIPO, 2018-2032 (MILLONES DE USD)
TABLA 324 MERCADO DE MATERIALES MAGNÉTICOS BLANDO DE SUDÁFRICA, POR CANAL DE DISTRIBUCIÓN, 2018-2032 (MILLONES DE USD)
TABLA 325 MERCADO DE MATERIALES MAGNÉTICOS BLANDO DE EGIPTO, POR TIPO DE PRODUCTO, 2018-2032 (MILLONES DE USD)
TABLA 326 MERCADO DE MATERIALES MAGNÉTICOS BLANDO DE EGIPTO, POR TIPO DE PRODUCTO, 2018-2032 (MILES DE TONELADAS)
TABLA 327 NÚCLEOS Y TIPOS DE NÚCLEOS DE EGIPTO EN EL MERCADO DE MATERIALES MAGNÉTICOS BLANDO, POR TIPO, 2018-2032 (MILLONES DE USD)
TABLA 328 CINTAS Y LÁMINAS DE EGIPTO EN EL MERCADO DE MATERIALES MAGNÉTICOS BLANDO, POR TIPO, 2018-2032 (MILLONES DE USD)
TABLA 329 MERCADO DE MATERIALES MAGNÉTICOS BLANDO DE EGIPTO, POR TIPO DE MATERIAL, 2018-2032 (MILLONES DE USD)
TABLA 330 MERCADO DE MATERIALES MAGNÉTICOS BLANDO DE EGIPTO, POR TIPO DE MATERIAL, 2018-2032 (MILES DE TONELADAS)
TABLA 331 FERRITAS BLANDAS DE EGIPTO EN EL MERCADO DE MATERIALES MAGNÉTICOS BLANDOS, POR TIPO, 2018-2032 (MILLONES DE USD)
TABLA 332 ACEROS ELÉCTRICOS DE EGIPTO (FE-SI) EN EL MERCADO DE MATERIALES MAGNÉTICOS BLANDO, POR TIPO, 2018-2032 (MILLONES DE USD)
TABLA 333 NÚCLEOS Y TIPOS DE NÚCLEOS DE EGIPTO EN EL MERCADO DE MATERIALES MAGNÉTICOS BLANDO, POR TIPO, 2018-2032 (MILLONES DE USD)
TABLA 334 MERCADO DE MATERIALES MAGNÉTICOS BLANDO DE EGIPTO, POR PROCESO DE FABRICACIÓN, 2018-2032 (MILLONES DE USD)
TABLA 335 MERCADO DE MATERIALES MAGNÉTICOS BLANDO DE EGIPTO, POR APLICACIÓN, 2018-2032 (MILLONES DE USD)
TABLA 336 EGIPTO INDUCCIÓN ELECTROMAGNÉTICA EN EL MERCADO DE MATERIALES MAGNÉTICOS BLANDO, POR TIPO, 2018-2032 (MILLONES DE USD)
TABLA 337 ACONDICIONAMIENTO Y CONVERSIÓN DE ENERGÍA EN EGIPTO EN EL MERCADO DE MATERIALES MAGNÉTICOS BLANDO, POR TIPO, 2018-2032 (MILLONES DE USD)
TABLA 338 MERCADO DE MATERIALES MAGNÉTICOS BLANDO DE EGIPTO, POR USUARIO FINAL, 2018-2032 (MILLONES DE USD)
TABLA 339 INDUSTRIA AUTOMOTRIZ DE EGIPTO EN EL MERCADO DE MATERIALES MAGNÉTICOS BLANDO, POR APLICACIÓN, 2018-2032 (MILLONES DE USD)
TABLA 340 INDUSTRIA AUTOMOTRIZ DE EGIPTO EN EL MERCADO DE MATERIALES MAGNÉTICOS BLANDO, POR TIPO DE PRODUCTO, 2018-2032 (MILLONES DE USD)
TABLA 341 NÚCLEOS Y TIPOS DE NÚCLEOS DE EGIPTO EN EL MERCADO DE MATERIALES MAGNÉTICOS BLANDO, POR TIPO, 2018-2032 (MILLONES DE USD)
TABLA 342 CINTAS Y LÁMINAS DE EGIPTO EN EL MERCADO DE MATERIALES MAGNÉTICOS BLANDO, POR TIPO, 2018-2032 (MILLONES DE USD)
TABLA 343 SERVICIOS ELÉCTRICOS Y DE ENERGÍA DE EGIPTO EN EL MERCADO DE MATERIALES MAGNÉTICOS BLANDO, POR APLICACIÓN, 2018-2032 (MILLONES DE USD)
TABLA 344 SERVICIOS ELÉCTRICOS Y DE ENERGÍA DE EGIPTO EN EL MERCADO DE MATERIALES MAGNÉTICOS BLANDO, POR TIPO DE PRODUCTO, 2018-2032 (MILLONES DE USD)
TABLA 345 NÚCLEOS Y TIPOS DE NÚCLEOS DE EGIPTO EN EL MERCADO DE MATERIALES MAGNÉTICOS BLANDO, POR TIPO, 2018-2032 (MILLONES DE USD)
TABLA 346 CINTAS Y LÁMINAS DE EGIPTO EN EL MERCADO DE MATERIALES MAGNÉTICOS BLANDO, POR TIPO, 2018-2032 (MILLONES DE USD)
TABLA 347 MERCADO DE ELECTRÓNICA DE CONSUMO EN EGIPTO, POR APLICACIÓN, 2018-2032 (MILLONES DE USD)
TABLA 348 MERCADO DE ELECTRÓNICA DE CONSUMO EN EGIPTO, POR TIPO DE PRODUCTO, 2018-2032 (MILLONES DE USD)
TABLA 349 NÚCLEOS Y TIPOS DE NÚCLEOS DE EGIPTO EN EL MERCADO DE MATERIALES MAGNÉTICOS BLANDO, POR TIPO, 2018-2032 (MILLONES DE USD)
TABLA 350 CINTAS Y LÁMINAS DE EGIPTO EN EL MERCADO DE MATERIALES MAGNÉTICOS BLANDO, POR TIPO, 2018-2032 (MILLONES DE USD)
TABLA 351 EGIPTO TI Y TELECOMUNICACIONES EN EL MERCADO DE MATERIALES MAGNÉTICOS BLANDO, POR APLICACIÓN, 2018-2032 (MILLONES DE USD)
TABLA 352 EGIPTO TI Y TELECOMUNICACIONES EN EL MERCADO DE MATERIALES MAGNÉTICOS BLANDO, POR TIPO DE PRODUCTO, 2018-2032 (MILLONES DE USD)
TABLA 353 NÚCLEOS Y TIPOS DE NÚCLEOS DE EGIPTO EN EL MERCADO DE MATERIALES MAGNÉTICOS BLANDO, POR TIPO, 2018-2032 (MILLONES DE USD)
TABLA 354 CINTAS Y LÁMINAS DE EGIPTO EN EL MERCADO DE MATERIALES MAGNÉTICOS BLANDO, POR TIPO, 2018-2032 (MILLONES DE USD)
TABLA 355 FABRICACIÓN INDUSTRIAL DE MATERIALES MAGNÉTICOS BLANDO EN EGIPTO, POR APLICACIÓN, 2018-2032 (MILLONES DE USD)
TABLA 356 FABRICACIÓN INDUSTRIAL DE MATERIALES MAGNÉTICOS BLANDO EN EGIPTO, POR TIPO DE PRODUCTO, 2018-2032 (MILLONES DE USD)
TABLA 357 NÚCLEOS Y TIPOS DE NÚCLEOS DE EGIPTO EN EL MERCADO DE MATERIALES MAGNÉTICOS BLANDO, POR TIPO, 2018-2032 (MILLONES DE USD)
TABLA 358 CINTAS Y LÁMINAS DE EGIPTO EN EL MERCADO DE MATERIALES MAGNÉTICOS BLANDO, POR TIPO, 2018-2032 (MILLONES DE USD)
TABLA 359 EGIPTO AEROESPACIAL Y DEFENSA EN EL MERCADO DE MATERIALES MAGNÉTICOS BLANDO, POR APLICACIÓN, 2018-2032 (MILLONES DE USD)
TABLA 360 EGIPTO AEROESPACIAL Y DEFENSA EN EL MERCADO DE MATERIALES MAGNÉTICOS BLANDO, POR TIPO DE PRODUCTO, 2018-2032 (MILLONES DE USD)
TABLA 361 NÚCLEOS Y TIPOS DE NÚCLEOS DE EGIPTO EN EL MERCADO DE MATERIALES MAGNÉTICOS BLANDO, POR TIPO, 2018-2032 (MILLONES DE USD)
TABLA 362 CINTAS Y LÁMINAS DE EGIPTO EN EL MERCADO DE MATERIALES MAGNÉTICOS BLANDO, POR TIPO, 2018-2032 (MILLONES DE USD)
TABLA 363 EGIPTO SALUD Y SERVICIOS MÉDICOS EN EL MERCADO DE MATERIALES MAGNÉTICOS BLANDO, POR APLICACIÓN, 2018-2032 (MILLONES DE USD)
TABLA 364 EGIPTO SALUD Y SERVICIOS MÉDICOS EN EL MERCADO DE MATERIALES MAGNÉTICOS BLANDO, POR TIPO DE PRODUCTO, 2018-2032 (MILLONES DE USD)
TABLA 365 NÚCLEOS Y TIPOS DE NÚCLEOS DE EGIPTO EN EL MERCADO DE MATERIALES MAGNÉTICOS BLANDO, POR TIPO, 2018-2032 (MILLONES DE USD)
TABLA 366 CINTAS Y LÁMINAS DE EGIPTO EN EL MERCADO DE MATERIALES MAGNÉTICOS BLANDO, POR TIPO, 2018-2032 (MILLONES DE USD)
TABLA 367 EGIPTO MERCADO DE ENERGÍAS RENOVABLES EN MATERIALES MAGNÉTICOS BLANDO, POR APLICACIÓN, 2018-2032 (MILLONES DE USD)
TABLA 368 EGIPTO ENERGÍA RENOVABLE EN EL MERCADO DE MATERIALES MAGNÉTICOS BLANDO, POR TIPO DE PRODUCTO, 2018-2032 (MILLONES DE USD)
TABLA 369 NÚCLEOS Y TIPOS DE NÚCLEOS DE EGIPTO EN EL MERCADO DE MATERIALES MAGNÉTICOS BLANDO, POR TIPO, 2018-2032 (MILLONES DE USD)
TABLA 370 CINTAS Y LÁMINAS DE EGIPTO EN EL MERCADO DE MATERIALES MAGNÉTICOS BLANDO, POR TIPO, 2018-2032 (MILLONES DE USD)
TABLA 371 INDUSTRIA DE LA CONSTRUCCIÓN EN EGIPTO EN EL MERCADO DE MATERIALES MAGNÉTICOS BLANDO, POR APLICACIÓN, 2018-2032 (MILLONES DE USD)
TABLA 372 INDUSTRIA DE LA CONSTRUCCIÓN EN EGIPTO EN EL MERCADO DE MATERIALES MAGNÉTICOS BLANDO, POR TIPO DE PRODUCTO, 2018-2032 (MILLONES DE USD)
TABLA 373 NÚCLEOS Y TIPOS DE NÚCLEOS DE EGIPTO EN EL MERCADO DE MATERIALES MAGNÉTICOS BLANDO, POR TIPO, 2018-2032 (MILLONES DE USD)
TABLA 374 CINTAS Y LÁMINAS DE EGIPTO EN EL MERCADO DE MATERIALES MAGNÉTICOS BLANDO, POR TIPO, 2018-2032 (MILLONES DE USD)
TABLA 375 EGIPTO OTROS EN EL MERCADO DE MATERIALES MAGNÉTICOS BLANDO, POR APLICACIÓN, 2018-2032 (MILLONES DE USD)
TABLA 376 EGIPTO OTROS EN EL MERCADO DE MATERIALES MAGNÉTICOS BLANDO, POR TIPO DE PRODUCTO, 2018-2032 (MILLONES DE USD)
TABLA 377 NÚCLEOS Y TIPOS DE NÚCLEOS DE EGIPTO EN EL MERCADO DE MATERIALES MAGNÉTICOS BLANDO, POR TIPO, 2018-2032 (MILLONES DE USD)
TABLA 378 CINTAS Y LÁMINAS DE EGIPTO EN EL MERCADO DE MATERIALES MAGNÉTICOS BLANDO, POR TIPO, 2018-2032 (MILLONES DE USD)
TABLA 379 MERCADO DE MATERIALES MAGNÉTICOS BLANDO DE EGIPTO, POR CANAL DE DISTRIBUCIÓN, 2018-2032 (MILLONES DE USD)
TABLA 380 MERCADO DE MATERIALES MAGNÉTICOS BLANDO DE ISRAEL, POR TIPO DE PRODUCTO, 2018-2032 (MILLONES DE USD)
TABLA 381 MERCADO DE MATERIALES MAGNÉTICOS BLANDO DE ISRAEL, POR TIPO DE PRODUCTO, 2018-2032 (MILES DE TONELADAS)
TABLA 382 NÚCLEOS Y TIPOS DE NÚCLEOS DE ISRAEL EN EL MERCADO DE MATERIALES MAGNÉTICOS BLANDO, POR TIPO, 2018-2032 (MILLONES DE USD)
TABLA 383 CINTAS Y LÁMINAS DE ISRAEL EN EL MERCADO DE MATERIALES MAGNÉTICOS BLANDO, POR TIPO, 2018-2032 (MILLONES DE USD)
TABLA 384 MERCADO DE MATERIALES MAGNÉTICOS BLANDO DE ISRAEL, POR TIPO DE MATERIAL, 2018-2032 (MILLONES DE USD)
TABLA 385 MERCADO DE MATERIALES MAGNÉTICOS BLANDO DE ISRAEL, POR TIPO DE MATERIAL, 2018-2032 (MILES DE TONELADAS)
TABLA 386 FERRITAS BLANDAS DE ISRAEL EN EL MERCADO DE MATERIALES MAGNÉTICOS BLANDOS, POR TIPO, 2018-2032 (MILLONES DE USD)
TABLA 387 ACEROS ELÉCTRICOS DE ISRAEL (FE-SI) EN EL MERCADO DE MATERIALES MAGNÉTICOS BLANDO, POR TIPO, 2018-2032 (MILLONES DE USD)
TABLA 388 NÚCLEOS Y TIPOS DE NÚCLEOS DE ISRAEL EN EL MERCADO DE MATERIALES MAGNÉTICOS BLANDO, POR TIPO, 2018-2032 (MILLONES DE USD)
TABLA 389 MERCADO DE MATERIALES MAGNÉTICOS BLANDO DE ISRAEL, POR PROCESO DE FABRICACIÓN, 2018-2032 (MILLONES DE USD)
TABLA 390 MERCADO DE MATERIALES MAGNÉTICOS BLANDO DE ISRAEL, POR APLICACIÓN, 2018-2032 (MILLONES DE USD)
TABLA 391 MERCADO DE MATERIALES MAGNÉTICOS BLANDO DE INDUCCIÓN ELECTROMAGNÉTICA EN ISRAEL, POR TIPO, 2018-2032 (MILLONES DE USD)
TABLA 392 ACONDICIONAMIENTO Y CONVERSIÓN DE ENERGÍA EN EL MERCADO DE MATERIALES MAGNÉTICOS BLANDO DE ISRAEL, POR TIPO, 2018-2032 (MILLONES DE USD)
TABLA 393 MERCADO DE MATERIALES MAGNÉTICOS BLANDO DE ISRAEL, POR USUARIO FINAL, 2018-2032 (MILLONES DE USD)
TABLA 394 INDUSTRIA AUTOMOTRIZ DE ISRAEL EN EL MERCADO DE MATERIALES MAGNÉTICOS BLANDO, POR APLICACIÓN, 2018-2032 (MILLONES DE USD)
TABLA 395 INDUSTRIA AUTOMOTRIZ DE ISRAEL EN EL MERCADO DE MATERIALES MAGNÉTICOS BLANDO, POR TIPO DE PRODUCTO, 2018-2032 (MILLONES DE USD)
TABLA 396 NÚCLEOS Y TIPOS DE NÚCLEOS DE ISRAEL EN EL MERCADO DE MATERIALES MAGNÉTICOS BLANDO, POR TIPO, 2018-2032 (MILLONES DE USD)
TABLA 397 CINTAS Y LÁMINAS DE ISRAEL EN EL MERCADO DE MATERIALES MAGNÉTICOS BLANDO, POR TIPO, 2018-2032 (MILLONES DE USD)
TABLA 398 EMPRESAS ELÉCTRICAS Y DE ENERGÍA DE ISRAEL EN EL MERCADO DE MATERIALES MAGNÉTICOS BLANDO, POR APLICACIÓN, 2018-2032 (MILLONES DE USD)
TABLA 399 EMPRESAS ELÉCTRICAS Y DE ENERGÍA DE ISRAEL EN EL MERCADO DE MATERIALES MAGNÉTICOS BLANDO, POR TIPO DE PRODUCTO, 2018-2032 (MILLONES DE USD)
TABLA 400 NÚCLEOS Y TIPOS DE NÚCLEOS DE ISRAEL EN EL MERCADO DE MATERIALES MAGNÉTICOS BLANDO, POR TIPO, 2018-2032 (MILLONES DE USD)
TABLA 401 CINTAS Y LÁMINAS DE ISRAEL EN EL MERCADO DE MATERIALES MAGNÉTICOS BLANDO, POR TIPO, 2018-2032 (MILLONES DE USD)
TABLA 402 MERCADO DE ELECTRÓNICA DE CONSUMO DE MATERIALES MAGNÉTICOS BLANDO DE ISRAEL, POR APLICACIÓN, 2018-2032 (MILLONES DE USD)
TABLA 403 MERCADO DE ELECTRÓNICA DE CONSUMO DE MATERIALES MAGNÉTICOS BLANDO DE ISRAEL, POR TIPO DE PRODUCTO, 2018-2032 (MILLONES DE USD)
TABLA 404 NÚCLEOS Y TIPOS DE NÚCLEOS DE ISRAEL EN EL MERCADO DE MATERIALES MAGNÉTICOS BLANDO, POR TIPO, 2018-2032 (MILLONES DE USD)
TABLA 405 CINTAS Y LÁMINAS DE ISRAEL EN EL MERCADO DE MATERIALES MAGNÉTICOS BLANDO, POR TIPO, 2018-2032 (MILLONES DE USD)
TABLA 406 TI Y TELECOMUNICACIONES EN EL MERCADO DE MATERIALES MAGNÉTICOS BLANDO DE ISRAEL, POR APLICACIÓN, 2018-2032 (MILLONES DE USD)
TABLA 407 MERCADO DE TI Y TELECOMUNICACIONES DE ISRAEL EN MATERIALES MAGNÉTICOS BLANDO, POR TIPO DE PRODUCTO, 2018-2032 (MILLONES DE USD)
TABLA 408 NÚCLEOS Y TIPOS DE NÚCLEOS DE ISRAEL EN EL MERCADO DE MATERIALES MAGNÉTICOS BLANDO, POR TIPO, 2018-2032 (MILLONES DE USD)
TABLA 409 CINTAS Y LÁMINAS DE ISRAEL EN EL MERCADO DE MATERIALES MAGNÉTICOS BLANDO, POR TIPO, 2018-2032 (MILLONES DE USD)
TABLA 410 FABRICACIÓN INDUSTRIAL DE MATERIALES MAGNÉTICOS BLANDO EN ISRAEL, POR APLICACIÓN, 2018-2032 (MILLONES DE USD)
TABLA 411 FABRICACIÓN INDUSTRIAL DE MATERIALES MAGNÉTICOS BLANDO EN ISRAEL, POR TIPO DE PRODUCTO, 2018-2032 (MILLONES DE USD)
TABLA 412 NÚCLEOS Y TIPOS DE NÚCLEOS DE ISRAEL EN EL MERCADO DE MATERIALES MAGNÉTICOS BLANDO, POR TIPO, 2018-2032 (MILLONES DE USD)
TABLA 413 CINTAS Y LÁMINAS DE ISRAEL EN EL MERCADO DE MATERIALES MAGNÉTICOS BLANDO, POR TIPO, 2018-2032 (MILLONES DE USD)
TABLA 414 INDUSTRIA AEROESPACIAL Y DEFENSA DE ISRAEL EN EL MERCADO DE MATERIALES MAGNÉTICOS BLANDO, POR APLICACIÓN, 2018-2032 (MILLONES DE USD)
TABLA 415 INDUSTRIA AEROESPACIAL Y DEFENSA DE ISRAEL EN EL MERCADO DE MATERIALES MAGNÉTICOS BLANDO, POR TIPO DE PRODUCTO, 2018-2032 (MILLONES DE USD)
TABLA 416 NÚCLEOS Y TIPOS DE NÚCLEOS DE ISRAEL EN EL MERCADO DE MATERIALES MAGNÉTICOS BLANDO, POR TIPO, 2018-2032 (MILLONES DE USD)
TABLA 417 CINTAS Y LÁMINAS DE ISRAEL EN EL MERCADO DE MATERIALES MAGNÉTICOS BLANDO, POR TIPO, 2018-2032 (MILLONES DE USD)
TABLA 418 SALUD Y SERVICIOS MÉDICOS EN EL MERCADO DE MATERIALES MAGNÉTICOS BLANDO DE ISRAEL, POR APLICACIÓN, 2018-2032 (MILLONES DE USD)
TABLA 419 SALUD Y SERVICIOS MÉDICOS DE ISRAEL EN EL MERCADO DE MATERIALES MAGNÉTICOS BLANDO, POR TIPO DE PRODUCTO, 2018-2032 (MILLONES DE USD)
TABLA 420 NÚCLEOS Y TIPOS DE NÚCLEOS DE ISRAEL EN EL MERCADO DE MATERIALES MAGNÉTICOS BLANDO, POR TIPO, 2018-2032 (MILLONES DE USD)
TABLA 421 CINTAS Y LÁMINAS DE ISRAEL EN EL MERCADO DE MATERIALES MAGNÉTICOS BLANDO, POR TIPO, 2018-2032 (MILLONES DE USD)
TABLA 422 MERCADO DE ENERGÍA RENOVABLE EN MATERIALES MAGNÉTICOS BLANDO DE ISRAEL, POR APLICACIÓN, 2018-2032 (MILLONES DE USD)
TABLA 423 ENERGÍA RENOVABLE EN EL MERCADO DE MATERIALES MAGNÉTICOS BLANDO DE ISRAEL, POR TIPO DE PRODUCTO, 2018-2032 (MILLONES DE USD)
TABLA 424 NÚCLEOS Y TIPOS DE NÚCLEOS DE ISRAEL EN EL MERCADO DE MATERIALES MAGNÉTICOS BLANDO, POR TIPO, 2018-2032 (MILLONES DE USD)
TABLA 425 CINTAS Y LÁMINAS DE ISRAEL EN EL MERCADO DE MATERIALES MAGNÉTICOS BLANDO, POR TIPO, 2018-2032 (MILLONES DE USD)
TABLA 426 INDUSTRIA DE LA CONSTRUCCIÓN DE ISRAEL EN EL MERCADO DE MATERIALES MAGNÉTICOS BLANDO, POR APLICACIÓN, 2018-2032 (MILLONES DE USD)
TABLA 427 INDUSTRIA DE LA CONSTRUCCIÓN DE ISRAEL EN EL MERCADO DE MATERIALES MAGNÉTICOS BLANDO, POR TIPO DE PRODUCTO, 2018-2032 (MILLONES DE USD)
TABLA 428 NÚCLEOS Y TIPOS DE NÚCLEOS DE ISRAEL EN EL MERCADO DE MATERIALES MAGNÉTICOS BLANDO, POR TIPO, 2018-2032 (MILLONES DE USD)
TABLA 429 CINTAS Y LÁMINAS DE ISRAEL EN EL MERCADO DE MATERIALES MAGNÉTICOS BLANDO, POR TIPO, 2018-2032 (MILLONES DE USD)
TABLA 430 OTROS EN EL MERCADO DE MATERIALES MAGNÉTICOS BLANDO DE ISRAEL, POR APLICACIÓN, 2018-2032 (MILLONES DE USD)
TABLA 431 ISRAEL OTROS EN EL MERCADO DE MATERIALES MAGNÉTICOS BLANDO, POR TIPO DE PRODUCTO, 2018-2032 (MILLONES DE USD)
TABLA 432 NÚCLEOS Y TIPOS DE NÚCLEOS DE ISRAEL EN EL MERCADO DE MATERIALES MAGNÉTICOS BLANDO, POR TIPO, 2018-2032 (MILLONES DE USD)
TABLA 433 CINTAS Y LÁMINAS DE ISRAEL EN EL MERCADO DE MATERIALES MAGNÉTICOS BLANDO, POR TIPO, 2018-2032 (MILLONES DE USD)
TABLA 434 MERCADO DE MATERIALES MAGNÉTICOS BLANDO DE ISRAEL, POR CANAL DE DISTRIBUCIÓN, 2018-2032 (MILLONES DE USD)
TABLA 435 MERCADO DE MATERIALES MAGNÉTICOS BLANDO DE QATAR, POR TIPO DE PRODUCTO, 2018-2032 (MILLONES DE USD)
TABLA 436 MERCADO DE MATERIALES MAGNÉTICOS BLANDO DE QATAR, POR TIPO DE PRODUCTO, 2018-2032 (MILES DE TONELADAS)
TABLA 437 NÚCLEOS Y TIPOS DE NÚCLEOS DE QATAR EN EL MERCADO DE MATERIALES MAGNÉTICOS BLANDO, POR TIPO, 2018-2032 (MILLONES DE USD)
TABLA 438 CINTAS Y LÁMINAS DE QATAR EN EL MERCADO DE MATERIALES MAGNÉTICOS BLANDO, POR TIPO, 2018-2032 (MILLONES DE USD)
TABLA 439 MERCADO DE MATERIALES MAGNÉTICOS BLANDO DE QATAR, POR TIPO DE MATERIAL, 2018-2032 (MILLONES DE USD)
TABLA 440 MERCADO DE MATERIALES MAGNÉTICOS BLANDO DE QATAR, POR TIPO DE MATERIAL, 2018-2032 (MILES DE TONELADAS)
TABLA 441 FERRITAS BLANDAS DE QATAR EN EL MERCADO DE MATERIALES MAGNÉTICOS BLANDOS, POR TIPO, 2018-2032 (MILLONES DE USD)
TABLA 442 ACEROS ELÉCTRICOS DE QATAR (FE-SI) EN EL MERCADO DE MATERIALES MAGNÉTICOS BLANDO, POR TIPO, 2018-2032 (MILLONES DE USD)
TABLA 443 NÚCLEOS Y TIPOS DE NÚCLEOS DE QATAR EN EL MERCADO DE MATERIALES MAGNÉTICOS BLANDO, POR TIPO, 2018-2032 (MILLONES DE USD)
TABLA 444 MERCADO DE MATERIALES MAGNÉTICOS BLANDO DE QATAR, POR PROCESO DE FABRICACIÓN, 2018-2032 (MILLONES DE USD)
TABLA 445 MERCADO DE MATERIALES MAGNÉTICOS BLANDO DE QATAR, POR APLICACIÓN, 2018-2032 (MILLONES DE USD)
TABLA 446 MERCADO DE MATERIALES MAGNÉTICOS BLANDO DE INDUCCIÓN ELECTROMAGNÉTICA EN QATAR, POR TIPO, 2018-2032 (MILLONES DE USD)
TABLA 447 ACONDICIONAMIENTO Y CONVERSIÓN DE ENERGÍA EN EL MERCADO DE MATERIALES MAGNÉTICOS BLANDO DE QATAR, POR TIPO, 2018-2032 (MILLONES DE USD)
TABLA 448 MERCADO DE MATERIALES MAGNÉTICOS BLANDO DE QATAR, POR USUARIO FINAL, 2018-2032 (MILLONES DE USD)
TABLA 449 INDUSTRIA AUTOMOTRIZ DE QATAR EN EL MERCADO DE MATERIALES MAGNÉTICOS BLANDO, POR APLICACIÓN, 2018-2032 (MILLONES DE USD)
TABLA 450 INDUSTRIA AUTOMOTRIZ DE CATAR EN EL MERCADO DE MATERIALES MAGNÉTICOS BLANDO, POR TIPO DE PRODUCTO, 2018-2032 (MILLONES DE USD)
TABLA 451 NÚCLEOS Y TIPOS DE NÚCLEOS DE QATAR EN EL MERCADO DE MATERIALES MAGNÉTICOS BLANDO, POR TIPO, 2018-2032 (MILLONES DE USD)
TABLA 452 CINTAS Y LÁMINAS DE QATAR EN EL MERCADO DE MATERIALES MAGNÉTICOS BLANDO, POR TIPO, 2018-2032 (MILLONES DE USD)
TABLA 453 SERVICIOS ELÉCTRICOS Y DE ENERGÍA DE QATAR EN EL MERCADO DE MATERIALES MAGNÉTICOS BLANDO, POR APLICACIÓN, 2018-2032 (MILLONES DE USD)
TABLA 454 SERVICIOS ELÉCTRICOS Y DE ENERGÍA DE QATAR EN EL MERCADO DE MATERIALES MAGNÉTICOS BLANDO, POR TIPO DE PRODUCTO, 2018-2032 (MILLONES DE USD)
TABLA 455 NÚCLEOS Y TIPOS DE NÚCLEOS DE QATAR EN EL MERCADO DE MATERIALES MAGNÉTICOS BLANDO, POR TIPO, 2018-2032 (MILLONES DE USD)
TABLA 456 CINTAS Y LÁMINAS DE QATAR EN EL MERCADO DE MATERIALES MAGNÉTICOS BLANDO, POR TIPO, 2018-2032 (MILLONES DE USD)
TABLA 457 MERCADO DE ELECTRÓNICA DE CONSUMO EN MATERIALES MAGNÉTICOS BLANDO DE QATAR, POR APLICACIÓN, 2018-2032 (MILLONES DE USD)
TABLA 458 MERCADO DE ELECTRÓNICA DE CONSUMO EN MATERIALES MAGNÉTICOS BLANDO DE QATAR, POR TIPO DE PRODUCTO, 2018-2032 (MILLONES DE USD)
TABLA 459 NÚCLEOS Y TIPOS DE NÚCLEOS DE QATAR EN EL MERCADO DE MATERIALES MAGNÉTICOS BLANDO, POR TIPO, 2018-2032 (MILLONES DE USD)
TABLA 460 CINTAS Y LÁMINAS DE QATAR EN EL MERCADO DE MATERIALES MAGNÉTICOS BLANDO, POR TIPO, 2018-2032 (MILLONES DE USD)
TABLA 461 MERCADO DE TI Y TELECOMUNICACIONES DE QATAR EN MATERIALES MAGNÉTICOS BLANDO, POR APLICACIÓN, 2018-2032 (MILLONES DE USD)
TABLA 462 MERCADO DE TI Y TELECOMUNICACIONES DE QATAR EN MATERIALES MAGNÉTICOS BLANDO, POR TIPO DE PRODUCTO, 2018-2032 (MILLONES DE USD)
TABLA 463 NÚCLEOS Y TIPOS DE NÚCLEOS DE QATAR EN EL MERCADO DE MATERIALES MAGNÉTICOS BLANDO, POR TIPO, 2018-2032 (MILLONES DE USD)
TABLA 464 CINTAS Y LÁMINAS DE QATAR EN EL MERCADO DE MATERIALES MAGNÉTICOS BLANDO, POR TIPO, 2018-2032 (MILLONES DE USD)
TABLA 465 FABRICACIÓN INDUSTRIAL DE MATERIALES MAGNÉTICOS BLANDO EN CATAR, POR APLICACIÓN, 2018-2032 (MILLONES DE USD)
TABLA 466 FABRICACIÓN INDUSTRIAL DE MATERIALES MAGNÉTICOS BLANDO EN CATAR, POR TIPO DE PRODUCTO, 2018-2032 (MILLONES DE USD)
TABLA 467 NÚCLEOS Y TIPOS DE NÚCLEOS DE QATAR EN EL MERCADO DE MATERIALES MAGNÉTICOS BLANDO, POR TIPO, 2018-2032 (MILLONES DE USD)
TABLA 468 CINTAS Y LÁMINAS DE QATAR EN EL MERCADO DE MATERIALES MAGNÉTICOS BLANDO, POR TIPO, 2018-2032 (MILLONES DE USD)
TABLA 469 MERCADO DE MATERIALES MAGNÉTICOS BLANDO EN LA INDUSTRIA AEROESPACIAL Y DEFENSIVA DE QATAR, POR APLICACIÓN, 2018-2032 (MILLONES DE USD)
TABLA 470 MERCADO DE MATERIALES MAGNÉTICOS BLANDO EN LA INDUSTRIA AEROESPACIAL Y DEFENSIVA DE QATAR, POR TIPO DE PRODUCTO, 2018-2032 (MILLONES DE USD)
TABLA 471 NÚCLEOS Y TIPOS DE NÚCLEOS DE QATAR EN EL MERCADO DE MATERIALES MAGNÉTICOS BLANDO, POR TIPO, 2018-2032 (MILLONES DE USD)
TABLA 472 CINTAS Y LÁMINAS DE QATAR EN EL MERCADO DE MATERIALES MAGNÉTICOS BLANDO, POR TIPO, 2018-2032 (MILLONES DE USD)
TABLA 473 MERCADO DE MATERIALES MAGNÉTICOS BLANDO EN EL SECTOR DE LA SALUD Y LA SALUD DE QATAR, POR APLICACIÓN, 2018-2032 (MILLONES DE USD)
TABLA 474 MERCADO DE MATERIALES MAGNÉTICOS BLANDO EN EL SECTOR DE LA SALUD Y LA SALUD DE QATAR, POR TIPO DE PRODUCTO, 2018-2032 (MILLONES DE USD)
TABLA 475 NÚCLEOS Y TIPOS DE NÚCLEOS DE QATAR EN EL MERCADO DE MATERIALES MAGNÉTICOS BLANDO, POR TIPO, 2018-2032 (MILLONES DE USD)
TABLA 476 CINTAS Y LÁMINAS DE QATAR EN EL MERCADO DE MATERIALES MAGNÉTICOS BLANDO, POR TIPO, 2018-2032 (MILLONES DE USD)
TABLA 477 MERCADO DE ENERGÍA RENOVABLE EN MATERIALES MAGNÉTICOS BLANDO DE QATAR, POR APLICACIÓN, 2018-2032 (MILLONES DE USD)
TABLA 478 MERCADO DE ENERGÍA RENOVABLE EN MATERIALES MAGNÉTICOS BLANDO DE QATAR, POR TIPO DE PRODUCTO, 2018-2032 (MILLONES DE USD)
TABLA 479 NÚCLEOS Y TIPOS DE NÚCLEOS DE QATAR EN EL MERCADO DE MATERIALES MAGNÉTICOS BLANDO, POR TIPO, 2018-2032 (MILLONES DE USD)
TABLA 480 CINTAS Y LÁMINAS DE QATAR EN EL MERCADO DE MATERIALES MAGNÉTICOS BLANDO, POR TIPO, 2018-2032 (MILLONES DE USD)
TABLA 481 INDUSTRIA DE LA CONSTRUCCIÓN DE QATAR EN EL MERCADO DE MATERIALES MAGNÉTICOS BLANDO, POR APLICACIÓN, 2018-2032 (MILLONES DE USD)
TABLA 482 INDUSTRIA DE LA CONSTRUCCIÓN DE QATAR EN EL MERCADO DE MATERIALES MAGNÉTICOS BLANDO, POR TIPO DE PRODUCTO, 2018-2032 (MILLONES DE USD)
TABLA 483 NÚCLEOS Y TIPOS DE NÚCLEOS DE QATAR EN EL MERCADO DE MATERIALES MAGNÉTICOS BLANDO, POR TIPO, 2018-2032 (MILLONES DE USD)
TABLA 484 CINTAS Y LÁMINAS DE QATAR EN EL MERCADO DE MATERIALES MAGNÉTICOS BLANDO, POR TIPO, 2018-2032 (MILLONES DE USD)
TABLA 485 OTROS MERCADOS DE MATERIALES MAGNÉTICOS BLANDO EN QATAR, POR APLICACIÓN, 2018-2032 (MILLONES DE USD)
TABLA 486 OTROS MERCADOS DE MATERIALES MAGNÉTICOS BLANDO EN QATAR, POR TIPO DE PRODUCTO, 2018-2032 (MILLONES DE USD)
TABLA 487 NÚCLEOS Y TIPOS DE NÚCLEOS DE QATAR EN EL MERCADO DE MATERIALES MAGNÉTICOS BLANDO, POR TIPO, 2018-2032 (MILLONES DE USD)
TABLA 488 CINTAS Y LÁMINAS DE QATAR EN EL MERCADO DE MATERIALES MAGNÉTICOS BLANDO, POR TIPO, 2018-2032 (MILLONES DE USD)
TABLA 489 MERCADO DE MATERIALES MAGNÉTICOS BLANDO DE QATAR, POR CANAL DE DISTRIBUCIÓN, 2018-2032 (MILLONES DE USD)
TABLA 490 MERCADO DE MATERIALES MAGNÉTICOS BLANDO DE KUWAIT, POR TIPO DE PRODUCTO, 2018-2032 (MILLONES DE USD)
TABLA 491 MERCADO DE MATERIALES MAGNÉTICOS BLANDO DE KUWAIT, POR TIPO DE PRODUCTO, 2018-2032 (MILES DE TONELADAS)
TABLA 492 NÚCLEOS Y TIPOS DE NÚCLEOS DE KUWAIT EN EL MERCADO DE MATERIALES MAGNÉTICOS BLANDO, POR TIPO, 2018-2032 (MILLONES DE USD)
TABLA 493 CINTAS Y LÁMINAS DE KUWAIT EN EL MERCADO DE MATERIALES MAGNÉTICOS BLANDO, POR TIPO, 2018-2032 (MILLONES DE USD)
TABLA 494 MERCADO DE MATERIALES MAGNÉTICOS BLANDO DE KUWAIT, POR TIPO DE MATERIAL, 2018-2032 (MILLONES DE USD)
TABLA 495 MERCADO DE MATERIALES MAGNÉTICOS BLANDO DE KUWAIT, POR TIPO DE MATERIAL, 2018-2032 (MILES DE TONELADAS)
TABLA 496 FERRITAS BLANDAS DE KUWAIT EN EL MERCADO DE MATERIALES MAGNÉTICOS BLANDOS, POR TIPO, 2018-2032 (MILLONES DE USD)
TABLA 497 ACEROS ELÉCTRICOS DE KUWAIT (FE-SI) EN EL MERCADO DE MATERIALES MAGNÉTICOS BLANDO, POR TIPO, 2018-2032 (MILLONES DE USD)
TABLA 498 NÚCLEOS Y TIPOS DE NÚCLEOS DE KUWAIT EN EL MERCADO DE MATERIALES MAGNÉTICOS BLANDO, POR TIPO, 2018-2032 (MILLONES DE USD)
TABLA 499 MERCADO DE MATERIALES MAGNÉTICOS BLANDO DE KUWAIT, POR PROCESO DE FABRICACIÓN, 2018-2032 (MILLONES DE USD)
TABLA 500 MERCADO DE MATERIALES MAGNÉTICOS BLANDO DE KUWAIT, POR APLICACIÓN, 2018-2032 (MILLONES DE USD)
TABLA 501 MERCADO DE INDUCCIÓN ELECTROMAGNÉTICA EN MATERIALES MAGNÉTICOS BLANDO DE KUWAIT, POR TIPO, 2018-2032 (MILLONES DE USD)
TABLA 502 ACONDICIONAMIENTO Y CONVERSIÓN DE ENERGÍA EN EL MERCADO DE MATERIALES MAGNÉTICOS BLANDO DE KUWAIT, POR TIPO, 2018-2032 (MILLONES DE USD)
TABLA 503 MERCADO DE MATERIALES MAGNÉTICOS BLANDO DE KUWAIT, POR USUARIO FINAL, 2018-2032 (MILLONES DE USD)
TABLA 504 INDUSTRIA AUTOMOTRIZ DE KUWAIT EN EL MERCADO DE MATERIALES MAGNÉTICOS BLANDO, POR APLICACIÓN, 2018-2032 (MILLONES DE USD)
TABLA 505 INDUSTRIA AUTOMOTRIZ DE KUWAIT EN EL MERCADO DE MATERIALES MAGNÉTICOS BLANDO, POR TIPO DE PRODUCTO, 2018-2032 (MILLONES DE USD)
TABLA 506 NÚCLEOS Y TIPOS DE NÚCLEOS DE KUWAIT EN EL MERCADO DE MATERIALES MAGNÉTICOS BLANDO, POR TIPO, 2018-2032 (MILLONES DE USD)
TABLA 507 CINTAS Y LÁMINAS DE KUWAIT EN EL MERCADO DE MATERIALES MAGNÉTICOS BLANDO, POR TIPO, 2018-2032 (MILLONES DE USD)
TABLA 508 SERVICIOS ELÉCTRICOS Y DE ENERGÍA DE KUWAIT EN EL MERCADO DE MATERIALES MAGNÉTICOS BLANDO, POR APLICACIÓN, 2018-2032 (MILLONES DE USD)
TABLA 509 SERVICIOS ELÉCTRICOS Y DE ENERGÍA DE KUWAIT EN EL MERCADO DE MATERIALES MAGNÉTICOS BLANDO, POR TIPO DE PRODUCTO, 2018-2032 (MILLONES DE USD)
TABLA 510 NÚCLEOS Y TIPOS DE NÚCLEOS DE KUWAIT EN EL MERCADO DE MATERIALES MAGNÉTICOS BLANDO, POR TIPO, 2018-2032 (MILLONES DE USD)
TABLA 511 CINTAS Y LÁMINAS DE KUWAIT EN EL MERCADO DE MATERIALES MAGNÉTICOS BLANDO, POR TIPO, 2018-2032 (MILLONES DE USD)
TABLA 512 MERCADO DE ELECTRÓNICA DE CONSUMO EN MATERIALES MAGNÉTICOS BLANDO DE KUWAIT, POR APLICACIÓN, 2018-2032 (MILLONES DE USD)
TABLA 513 MERCADO DE ELECTRÓNICA DE CONSUMO DE KUWAIT EN MATERIALES MAGNÉTICOS BLANDO, POR TIPO DE PRODUCTO, 2018-2032 (MILLONES DE USD)
TABLA 514 NÚCLEOS Y TIPOS DE NÚCLEOS DE KUWAIT EN EL MERCADO DE MATERIALES MAGNÉTICOS BLANDO, POR TIPO, 2018-2032 (MILLONES DE USD)
TABLA 515 CINTAS Y LÁMINAS DE KUWAIT EN EL MERCADO DE MATERIALES MAGNÉTICOS BLANDO, POR TIPO, 2018-2032 (MILLONES DE USD)
TABLA 516 KUWAIT IT Y TELECOMUNICACIONES EN EL MERCADO DE MATERIALES MAGNÉTICOS BLANDO, POR APLICACIÓN, 2018-2032 (MILLONES DE USD)
TABLA 517 KUWAIT IT Y TELECOMUNICACIONES EN EL MERCADO DE MATERIALES MAGNÉTICOS BLANDO, POR TIPO DE PRODUCTO, 2018-2032 (MILLONES DE USD)
TABLA 518 NÚCLEOS Y TIPOS DE NÚCLEOS DE KUWAIT EN EL MERCADO DE MATERIALES MAGNÉTICOS BLANDO, POR TIPO, 2018-2032 (MILLONES DE USD)
TABLA 519 CINTAS Y LÁMINAS DE KUWAIT EN EL MERCADO DE MATERIALES MAGNÉTICOS BLANDO, POR TIPO, 2018-2032 (MILLONES DE USD)
TABLA 520 FABRICACIÓN INDUSTRIAL DE MATERIALES MAGNÉTICOS BLANDO EN KUWAIT, POR APLICACIÓN, 2018-2032 (MILLONES DE USD)
TABLA 521 FABRICACIÓN INDUSTRIAL DE MATERIALES MAGNÉTICOS BLANDO EN KUWAIT, POR TIPO DE PRODUCTO, 2018-2032 (MILLONES DE USD)
TABLA 522 NÚCLEOS Y TIPOS DE NÚCLEOS DE KUWAIT EN EL MERCADO DE MATERIALES MAGNÉTICOS BLANDO, POR TIPO, 2018-2032 (MILLONES DE USD)
TABLA 523 CINTAS Y LÁMINAS DE KUWAIT EN EL MERCADO DE MATERIALES MAGNÉTICOS BLANDO, POR TIPO, 2018-2032 (MILLONES DE USD)
TABLA 524 KUWAIT AEROESPACIAL Y DEFENSA EN EL MERCADO DE MATERIALES MAGNÉTICOS BLANDO, POR APLICACIÓN, 2018-2032 (MILLONES DE USD)
TABLA 525 KUWAIT AEROESPACIAL Y DEFENSA EN EL MERCADO DE MATERIALES MAGNÉTICOS BLANDO, POR TIPO DE PRODUCTO, 2018-2032 (MILLONES DE USD)
TABLA 526 NÚCLEOS Y TIPOS DE NÚCLEOS DE KUWAIT EN EL MERCADO DE MATERIALES MAGNÉTICOS BLANDO, POR TIPO, 2018-2032 (MILLONES DE USD)
TABLA 527 CINTAS Y LÁMINAS DE KUWAIT EN EL MERCADO DE MATERIALES MAGNÉTICOS BLANDO, POR TIPO, 2018-2032 (MILLONES DE USD)
TABLA 528 MERCADO DE MATERIALES MAGNÉTICOS BLANDO EN KUWAIT, POR APLICACIÓN, 2018-2032 (MILLONES DE USD)
TABLA 529 MERCADO DE MATERIALES MAGNÉTICOS BLANDO EN KUWAIT, POR TIPO DE PRODUCTO, 2018-2032 (MILLONES DE USD)
TABLA 530 NÚCLEOS Y TIPOS DE NÚCLEOS DE KUWAIT EN EL MERCADO DE MATERIALES MAGNÉTICOS BLANDO, POR TIPO, 2018-2032 (MILLONES DE USD)
TABLA 531 CINTAS Y LÁMINAS DE KUWAIT EN EL MERCADO DE MATERIALES MAGNÉTICOS BLANDO, POR TIPO, 2018-2032 (MILLONES DE USD)
TABLA 532 MERCADO DE ENERGÍA RENOVABLE EN MATERIALES MAGNÉTICOS BLANDO DE KUWAIT, POR APLICACIÓN, 2018-2032 (MILLONES DE USD)
TABLA 533 MERCADO DE ENERGÍA RENOVABLE EN MATERIALES MAGNÉTICOS BLANDO DE KUWAIT, POR TIPO DE PRODUCTO, 2018-2032 (MILLONES DE USD)
TABLA 534 NÚCLEOS Y TIPOS DE NÚCLEOS DE KUWAIT EN EL MERCADO DE MATERIALES MAGNÉTICOS BLANDO, POR TIPO, 2018-2032 (MILLONES DE USD)
TABLA 535 CINTAS Y LÁMINAS DE KUWAIT EN EL MERCADO DE MATERIALES MAGNÉTICOS BLANDO, POR TIPO, 2018-2032 (MILLONES DE USD)
TABLA 536 INDUSTRIA DE LA CONSTRUCCIÓN DE KUWAIT EN EL MERCADO DE MATERIALES MAGNÉTICOS BLANDO, POR APLICACIÓN, 2018-2032 (MILLONES DE USD)
TABLA 537 INDUSTRIA DE LA CONSTRUCCIÓN DE KUWAIT EN EL MERCADO DE MATERIALES MAGNÉTICOS BLANDO, POR TIPO DE PRODUCTO, 2018-2032 (MILLONES DE USD)
TABLA 538 NÚCLEOS Y TIPOS DE NÚCLEOS DE KUWAIT EN EL MERCADO DE MATERIALES MAGNÉTICOS BLANDO, POR TIPO, 2018-2032 (MILLONES DE USD)
TABLA 539 CINTAS Y LÁMINAS DE KUWAIT EN EL MERCADO DE MATERIALES MAGNÉTICOS BLANDO, POR TIPO, 2018-2032 (MILLONES DE USD)
TABLA 540 KUWAIT OTROS EN EL MERCADO DE MATERIALES MAGNÉTICOS BLANDO, POR APLICACIÓN, 2018-2032 (MILLONES DE USD)
TABLA 541 KUWAIT OTROS EN EL MERCADO DE MATERIALES MAGNÉTICOS BLANDO, POR TIPO DE PRODUCTO, 2018-2032 (MILLONES DE USD)
TABLA 542 NÚCLEOS Y TIPOS DE NÚCLEOS DE KUWAIT EN EL MERCADO DE MATERIALES MAGNÉTICOS BLANDO, POR TIPO, 2018-2032 (MILLONES DE USD)
TABLA 543 CINTAS Y LÁMINAS DE KUWAIT EN EL MERCADO DE MATERIALES MAGNÉTICOS BLANDO, POR TIPO, 2018-2032 (MILLONES DE USD)
TABLA 544 MERCADO DE MATERIALES MAGNÉTICOS BLANDO DE KUWAIT, POR CANAL DE DISTRIBUCIÓN, 2018-2032 (MILLONES DE USD)
TABLA 545 MERCADO DE MATERIALES MAGNÉTICOS BLANDO DE BAHREIN, POR TIPO DE PRODUCTO, 2018-2032 (MILLONES DE USD)
TABLA 546 MERCADO DE MATERIALES MAGNÉTICOS BLANDO DE BAHREIN, POR TIPO DE PRODUCTO, 2018-2032 (MILES DE TONELADAS)
TABLA 547 NÚCLEOS Y TIPOS DE NÚCLEOS DE BAHREIN EN EL MERCADO DE MATERIALES MAGNÉTICOS BLANDO, POR TIPO, 2018-2032 (MILLONES DE USD)
TABLA 548 CINTAS Y LÁMINAS DE BAHREIN EN EL MERCADO DE MATERIALES MAGNÉTICOS BLANDO, POR TIPO, 2018-2032 (MILLONES DE USD)
TABLA 549 MERCADO DE MATERIALES MAGNÉTICOS BLANDO DE BAHREIN, POR TIPO DE MATERIAL, 2018-2032 (MILLONES DE USD)
TABLA 550 MERCADO DE MATERIALES MAGNÉTICOS BLANDO DE BAHREIN, POR TIPO DE MATERIAL, 2018-2032 (MILES DE TONELADAS)
TABLA 551 FERRITAS BLANDAS DE BAHREIN EN EL MERCADO DE MATERIALES MAGNÉTICOS BLANDOS, POR TIPO, 2018-2032 (MILLONES DE USD)
TABLA 552 ACEROS ELÉCTRICOS DE BAHREIN (FE-SI) EN EL MERCADO DE MATERIALES MAGNÉTICOS BLANDO, POR TIPO, 2018-2032 (MILLONES DE USD)
TABLA 553 NÚCLEOS Y TIPOS DE NÚCLEOS DE BAHREIN EN EL MERCADO DE MATERIALES MAGNÉTICOS BLANDO, POR TIPO, 2018-2032 (MILLONES DE USD)
TABLA 554 MERCADO DE MATERIALES MAGNÉTICOS BLANDO DE BAHREIN, POR PROCESO DE FABRICACIÓN, 2018-2032 (MILLONES DE USD)
TABLA 555 MERCADO DE MATERIALES MAGNÉTICOS BLANDO DE BAHREIN, POR APLICACIÓN, 2018-2032 (MILLONES DE USD)
TABLA 556 MERCADO DE INDUCCIÓN ELECTROMAGNÉTICA EN MATERIALES MAGNÉTICOS BLANDO DE BAHREIN, POR TIPO, 2018-2032 (MILLONES DE USD)
TABLA 557 ACONDICIONAMIENTO Y CONVERSIÓN DE ENERGÍA EN EL MERCADO DE MATERIALES MAGNÉTICOS BLANDO DE BAHREIN, POR TIPO, 2018-2032 (MILLONES DE USD)
TABLA 558 MERCADO DE MATERIALES MAGNÉTICOS BLANDO DE BAHREIN, POR USUARIO FINAL, 2018-2032 (MILLONES DE USD)
TABLA 559 INDUSTRIA AUTOMOTRIZ DE BAHREIN EN EL MERCADO DE MATERIALES MAGNÉTICOS BLANDO, POR APLICACIÓN, 2018-2032 (MILLONES DE USD)
TABLA 560 INDUSTRIA AUTOMOTRIZ DE BAHREIN EN EL MERCADO DE MATERIALES MAGNÉTICOS BLANDO, POR TIPO DE PRODUCTO, 2018-2032 (MILLONES DE USD)
TABLA 561 NÚCLEOS Y TIPOS DE NÚCLEOS DE BAHREIN EN EL MERCADO DE MATERIALES MAGNÉTICOS BLANDO, POR TIPO, 2018-2032 (MILLONES DE USD)
TABLA 562 CINTAS Y LÁMINAS DE BAHREIN EN EL MERCADO DE MATERIALES MAGNÉTICOS BLANDO, POR TIPO, 2018-2032 (MILLONES DE USD)
TABLA 563 SERVICIOS ELÉCTRICOS Y DE ENERGÍA DE BAHREIN EN EL MERCADO DE MATERIALES MAGNÉTICOS BLANDO, POR APLICACIÓN, 2018-2032 (MILLONES DE USD)
TABLA 564 SERVICIOS ELÉCTRICOS Y DE ENERGÍA DE BAHREIN EN EL MERCADO DE MATERIALES MAGNÉTICOS BLANDO, POR TIPO DE PRODUCTO, 2018-2032 (MILLONES DE USD)
TABLA 565 NÚCLEOS Y TIPOS DE NÚCLEOS DE BAHREIN EN EL MERCADO DE MATERIALES MAGNÉTICOS BLANDO, POR TIPO, 2018-2032 (MILLONES DE USD)
TABLA 566 CINTAS Y LÁMINAS DE BAHREIN EN EL MERCADO DE MATERIALES MAGNÉTICOS BLANDO, POR TIPO, 2018-2032 (MILLONES DE USD)
TABLA 567 MERCADO DE ELECTRÓNICA DE CONSUMO EN MATERIALES MAGNÉTICOS BLANDO DE BAHREIN, POR APLICACIÓN, 2018-2032 (MILLONES DE USD)
TABLA 568 MERCADO DE ELECTRÓNICA DE CONSUMO EN MATERIALES MAGNÉTICOS BLANDO DE BAHREIN, POR TIPO DE PRODUCTO, 2018-2032 (MILLONES DE USD)
TABLA 569 NÚCLEOS Y TIPOS DE NÚCLEOS DE BAHREIN EN EL MERCADO DE MATERIALES MAGNÉTICOS BLANDO, POR TIPO, 2018-2032 (MILLONES DE USD)
TABLA 570 CINTAS Y LÁMINAS DE BAHREIN EN EL MERCADO DE MATERIALES MAGNÉTICOS BLANDO, POR TIPO, 2018-2032 (MILLONES DE USD)
TABLA 571 MERCADO DE TI Y TELECOMUNICACIONES DE BAHREIN EN MATERIALES MAGNÉTICOS BLANDO, POR APLICACIÓN, 2018-2032 (MILLONES DE USD)
TABLA 572 BAHREIN TI Y TELECOMUNICACIONES EN EL MERCADO DE MATERIALES MAGNÉTICOS BLANDO, POR TIPO DE PRODUCTO, 2018-2032 (MILLONES DE USD)
TABLA 573 NÚCLEOS Y TIPOS DE NÚCLEOS DE BAHREIN EN EL MERCADO DE MATERIALES MAGNÉTICOS BLANDO, POR TIPO, 2018-2032 (MILLONES DE USD)
TABLA 574 CINTAS Y LÁMINAS DE BAHREIN EN EL MERCADO DE MATERIALES MAGNÉTICOS BLANDO, POR TIPO, 2018-2032 (MILLONES DE USD)
TABLA 575 FABRICACIÓN INDUSTRIAL DE MATERIALES MAGNÉTICOS BLANDO EN BAHREIN, POR APLICACIÓN, 2018-2032 (MILLONES DE USD)
TABLA 576 FABRICACIÓN INDUSTRIAL DE MATERIALES MAGNÉTICOS BLANDO EN BAHREIN, POR TIPO DE PRODUCTO, 2018-2032 (MILLONES DE USD)
TABLA 577 NÚCLEOS Y TIPOS DE NÚCLEOS DE BAHREIN EN EL MERCADO DE MATERIALES MAGNÉTICOS BLANDO, POR TIPO, 2018-2032 (MILLONES DE USD)
TABLA 578 CINTAS Y LÁMINAS DE BAHREIN EN EL MERCADO DE MATERIALES MAGNÉTICOS BLANDO, POR TIPO, 2018-2032 (MILLONES DE USD)
TABLA 579 MERCADO DE MATERIALES MAGNÉTICOS BLANDO EN LA INDUSTRIA AEROESPACIAL Y DE DEFENSA DE BAHREIN, POR APLICACIÓN, 2018-2032 (MILLONES DE USD)
TABLA 580 BAHREIN AEROESPACIAL Y DEFENSA EN EL MERCADO DE MATERIALES MAGNÉTICOS BLANDO, POR TIPO DE PRODUCTO, 2018-2032 (MILLONES DE USD)
TABLA 581 NÚCLEOS Y TIPOS DE NÚCLEOS DE BAHREIN EN EL MERCADO DE MATERIALES MAGNÉTICOS BLANDO, POR TIPO, 2018-2032 (MILLONES DE USD)
TABLA 582 CINTAS Y LÁMINAS DE BAHREIN EN EL MERCADO DE MATERIALES MAGNÉTICOS BLANDO, POR TIPO, 2018-2032 (MILLONES DE USD)
TABLA 583 MERCADO DE MATERIALES MAGNÉTICOS BLANDO EN SALUD Y SERVICIOS MÉDICOS DE BAHREIN, POR APLICACIÓN, 2018-2032 (MILLONES DE USD)
TABLA 584 SALUD Y SERVICIOS MÉDICOS DE BAHREIN EN EL MERCADO DE MATERIALES MAGNÉTICOS BLANDO, POR TIPO DE PRODUCTO, 2018-2032 (MILLONES DE USD)
TABLA 585 NÚCLEOS Y TIPOS DE NÚCLEOS DE BAHREIN EN EL MERCADO DE MATERIALES MAGNÉTICOS BLANDO, POR TIPO, 2018-2032 (MILLONES DE USD)
TABLA 586 CINTAS Y LÁMINAS DE BAHREIN EN EL MERCADO DE MATERIALES MAGNÉTICOS BLANDO, POR TIPO, 2018-2032 (MILLONES DE USD)
TABLA 587 MERCADO DE ENERGÍAS RENOVABLES EN MATERIALES MAGNÉTICOS BLANDO DE BAHREIN, POR APLICACIÓN, 2018-2032 (MILLONES DE USD)
TABLA 588 MERCADO DE ENERGÍA RENOVABLE EN MATERIALES MAGNÉTICOS BLANDO DE BAHREIN, POR TIPO DE PRODUCTO, 2018-2032 (MILLONES DE USD)
TABLA 589 NÚCLEOS Y TIPOS DE NÚCLEOS DE BAHREIN EN EL MERCADO DE MATERIALES MAGNÉTICOS BLANDO, POR TIPO, 2018-2032 (MILLONES DE USD)
TABLA 590 CINTAS Y LÁMINAS DE BAHREIN EN EL MERCADO DE MATERIALES MAGNÉTICOS BLANDO, POR TIPO, 2018-2032 (MILLONES DE USD)
TABLA 591 INDUSTRIA DE LA CONSTRUCCIÓN DE BAHREIN EN EL MERCADO DE MATERIALES MAGNÉTICOS BLANDO, POR APLICACIÓN, 2018-2032 (MILLONES DE USD)
TABLA 592 INDUSTRIA DE LA CONSTRUCCIÓN DE BAHREIN EN EL MERCADO DE MATERIALES MAGNÉTICOS BLANDO, POR TIPO DE PRODUCTO, 2018-2032 (MILLONES DE USD)
TABLA 593 NÚCLEOS Y TIPOS DE NÚCLEOS DE BAHREIN EN EL MERCADO DE MATERIALES MAGNÉTICOS BLANDO, POR TIPO, 2018-2032 (MILLONES DE USD)
TABLA 594 CINTAS Y LÁMINAS DE BAHREIN EN EL MERCADO DE MATERIALES MAGNÉTICOS BLANDO, POR TIPO, 2018-2032 (MILLONES DE USD)
TABLA 595 BARÉIN OTROS MERCADOS DE MATERIALES MAGNÉTICOS BLANDO, POR APLICACIÓN, 2018-2032 (MILLONES DE USD)
TABLA 596 OTROS MERCADOS DE MATERIALES MAGNÉTICOS BLANDO EN BAHREIN, POR TIPO DE PRODUCTO, 2018-2032 (MILLONES DE USD)
TABLA 597 NÚCLEOS Y TIPOS DE NÚCLEOS DE BAHREIN EN EL MERCADO DE MATERIALES MAGNÉTICOS BLANDO, POR TIPO, 2018-2032 (MILLONES DE USD)
TABLA 598 CINTAS Y LÁMINAS DE BAHREIN EN EL MERCADO DE MATERIALES MAGNÉTICOS BLANDO, POR TIPO, 2018-2032 (MILLONES DE USD)
TABLA 599 MERCADO DE MATERIALES MAGNÉTICOS BLANDO DE BAHREIN, POR CANAL DE DISTRIBUCIÓN, 2018-2032 (MILLONES DE USD)
TABLA 600 MERCADO DE MATERIALES MAGNÉTICOS BLANDO DE OMÁN, POR TIPO DE PRODUCTO, 2018-2032 (MILLONES DE USD)
TABLA 601 MERCADO DE MATERIALES MAGNÉTICOS BLANDO DE OMÁN, POR TIPO DE PRODUCTO, 2018-2032 (MILES DE TONELADAS)
TABLA 602 NÚCLEOS Y TIPOS DE NÚCLEOS DE OMÁN EN EL MERCADO DE MATERIALES MAGNÉTICOS BLANDO, POR TIPO, 2018-2032 (MILLONES DE USD)
TABLA 603 CINTAS Y LÁMINAS DE OMÁN EN EL MERCADO DE MATERIALES MAGNÉTICOS BLANDO, POR TIPO, 2018-2032 (MILLONES DE USD)
TABLA 604 MERCADO DE MATERIALES MAGNÉTICOS BLANDO DE OMÁN, POR TIPO DE MATERIAL, 2018-2032 (MILLONES DE USD)
TABLA 605 MERCADO DE MATERIALES MAGNÉTICOS BLANDO DE OMÁN, POR TIPO DE MATERIAL, 2018-2032 (MILES DE TONELADAS)
TABLA 606 FERRITAS BLANDAS DE OMÁN EN EL MERCADO DE MATERIALES MAGNÉTICOS BLANDOS, POR TIPO, 2018-2032 (MILLONES DE USD)
TABLA 607 ACEROS ELÉCTRICOS DE OMÁN (FE-SI) EN EL MERCADO DE MATERIALES MAGNÉTICOS BLANDO, POR TIPO, 2018-2032 (MILLONES DE USD)
TABLA 608 NÚCLEOS Y TIPOS DE NÚCLEOS DE OMÁN EN EL MERCADO DE MATERIALES MAGNÉTICOS BLANDO, POR TIPO, 2018-2032 (MILLONES DE USD)
TABLA 609 MERCADO DE MATERIALES MAGNÉTICOS BLANDO DE OMÁN, POR PROCESO DE FABRICACIÓN, 2018-2032 (MILLONES DE USD)
TABLA 610 MERCADO DE MATERIALES MAGNÉTICOS BLANDO DE OMÁN, POR APLICACIÓN, 2018-2032 (MILLONES DE USD)
TABLA 611 INDUCCIÓN ELECTROMAGNÉTICA EN EL MERCADO DE MATERIALES MAGNÉTICOS BLANDO DE OMÁN, POR TIPO, 2018-2032 (MILLONES DE USD)
TABLA 612 ACONDICIONAMIENTO Y CONVERSIÓN DE ENERGÍA EN EL MERCADO DE MATERIALES MAGNÉTICOS BLANDO DE OMÁN, POR TIPO, 2018-2032 (MILLONES DE USD)
TABLA 613 MERCADO DE MATERIALES MAGNÉTICOS BLANDO DE OMÁN, POR USUARIO FINAL, 2018-2032 (MILLONES DE USD)
TABLA 614 INDUSTRIA AUTOMOTRIZ DE OMÁN EN EL MERCADO DE MATERIALES MAGNÉTICOS BLANDO, POR APLICACIÓN, 2018-2032 (MILLONES DE USD)
TABLA 615 INDUSTRIA AUTOMOTRIZ DE OMÁN EN EL MERCADO DE MATERIALES MAGNÉTICOS BLANDO, POR TIPO DE PRODUCTO, 2018-2032 (MILLONES DE USD)
TABLA 616 NÚCLEOS Y TIPOS DE NÚCLEOS DE OMÁN EN EL MERCADO DE MATERIALES MAGNÉTICOS BLANDO, POR TIPO, 2018-2032 (MILLONES DE USD)
TABLA 617 CINTAS Y LÁMINAS DE OMÁN EN EL MERCADO DE MATERIALES MAGNÉTICOS BLANDO, POR TIPO, 2018-2032 (MILLONES DE USD)
TABLA 618 SERVICIOS ELÉCTRICOS Y DE ENERGÍA DE OMÁN EN EL MERCADO DE MATERIALES MAGNÉTICOS BLANDO, POR APLICACIÓN, 2018-2032 (MILLONES DE USD)
TABLA 619 SERVICIOS ELÉCTRICOS Y DE ENERGÍA DE OMÁN EN EL MERCADO DE MATERIALES MAGNÉTICOS BLANDO, POR TIPO DE PRODUCTO, 2018-2032 (MILLONES DE USD)
TABLA 620 NÚCLEOS Y TIPOS DE NÚCLEOS DE OMÁN EN EL MERCADO DE MATERIALES MAGNÉTICOS BLANDO, POR TIPO, 2018-2032 (MILLONES DE USD)
TABLA 621 CINTAS Y LÁMINAS DE OMÁN EN EL MERCADO DE MATERIALES MAGNÉTICOS BLANDO, POR TIPO, 2018-2032 (MILLONES DE USD)
TABLA 622 MERCADO DE ELECTRÓNICA DE CONSUMO EN MATERIALES MAGNÉTICOS BLANDO DE OMÁN, POR APLICACIÓN, 2018-2032 (MILLONES DE USD)
TABLA 623 MERCADO DE ELECTRÓNICA DE CONSUMO DE MATERIALES MAGNÉTICOS BLANDO DE OMÁN, POR TIPO DE PRODUCTO, 2018-2032 (MILLONES DE USD)
TABLA 624 NÚCLEOS Y TIPOS DE NÚCLEOS DE OMÁN EN EL MERCADO DE MATERIALES MAGNÉTICOS BLANDO, POR TIPO, 2018-2032 (MILLONES DE USD)
TABLA 625 CINTAS Y LÁMINAS DE OMÁN EN EL MERCADO DE MATERIALES MAGNÉTICOS BLANDO, POR TIPO, 2018-2032 (MILLONES DE USD)
TABLA 626 MERCADO DE TI Y TELECOMUNICACIONES DE OMÁN EN MATERIALES MAGNÉTICOS BLANDO, POR APLICACIÓN, 2018-2032 (MILLONES DE USD)
TABLA 627 MERCADO DE TI Y TELECOMUNICACIONES DE OMÁN EN MATERIALES MAGNÉTICOS BLANDO, POR TIPO DE PRODUCTO, 2018-2032 (MILLONES DE USD)
TABLA 628 NÚCLEOS Y TIPOS DE NÚCLEOS DE OMÁN EN EL MERCADO DE MATERIALES MAGNÉTICOS BLANDO, POR TIPO, 2018-2032 (MILLONES DE USD)
TABLA 629 CINTAS Y LÁMINAS DE OMÁN EN EL MERCADO DE MATERIALES MAGNÉTICOS BLANDO, POR TIPO, 2018-2032 (MILLONES DE USD)
TABLA 630 FABRICACIÓN INDUSTRIAL DE MATERIALES MAGNÉTICOS BLANDO EN OMÁN, POR APLICACIÓN, 2018-2032 (MILLONES DE USD)
TABLA 631 FABRICACIÓN INDUSTRIAL DE MATERIALES MAGNÉTICOS BLANDO EN OMÁN, POR TIPO DE PRODUCTO, 2018-2032 (MILLONES DE USD)
TABLA 632 NÚCLEOS Y TIPOS DE NÚCLEOS DE OMÁN EN EL MERCADO DE MATERIALES MAGNÉTICOS BLANDO, POR TIPO, 2018-2032 (MILLONES DE USD)
TABLA 633 CINTAS Y LÁMINAS DE OMÁN EN EL MERCADO DE MATERIALES MAGNÉTICOS BLANDO, POR TIPO, 2018-2032 (MILLONES DE USD)
TABLA 634 OMÁN AEROESPACIAL Y DEFENSA EN EL MERCADO DE MATERIALES MAGNÉTICOS BLANDO, POR APLICACIÓN, 2018-2032 (MILLONES DE USD)
TABLA 635 OMÁN AEROESPACIAL Y DEFENSA EN EL MERCADO DE MATERIALES MAGNÉTICOS BLANDO, POR TIPO DE PRODUCTO, 2018-2032 (MILLONES DE USD)
TABLA 636 NÚCLEOS Y TIPOS DE NÚCLEOS DE OMÁN EN EL MERCADO DE MATERIALES MAGNÉTICOS BLANDO, POR TIPO, 2018-2032 (MILLONES DE USD)
TABLA 637 CINTAS Y LÁMINAS DE OMÁN EN EL MERCADO DE MATERIALES MAGNÉTICOS BLANDO, POR TIPO, 2018-2032 (MILLONES DE USD)
TABLA 638 OMÁN, SALUD Y MEDICINA, MERCADO DE MATERIALES MAGNÉTICOS BLANDO, POR APLICACIÓN, 2018-2032 (MILLONES DE USD)
TABLA 639 OMÁN, SALUD Y MEDICINA EN EL MERCADO DE MATERIALES MAGNÉTICOS BLANDO, POR TIPO DE PRODUCTO, 2018-2032 (MILLONES DE USD)
TABLA 640 NÚCLEOS Y TIPOS DE NÚCLEOS DE OMÁN EN EL MERCADO DE MATERIALES MAGNÉTICOS BLANDO, POR TIPO, 2018-2032 (MILLONES DE USD)
TABLA 641 CINTAS Y LÁMINAS DE OMÁN EN EL MERCADO DE MATERIALES MAGNÉTICOS BLANDO, POR TIPO, 2018-2032 (MILLONES DE USD)
TABLA 642 MERCADO DE ENERGÍAS RENOVABLES EN MATERIALES MAGNÉTICOS BLANDO DE OMÁN, POR APLICACIÓN, 2018-2032 (MILLONES DE USD)
TABLA 643 MERCADO DE ENERGÍA RENOVABLE EN MATERIALES MAGNÉTICOS BLANDO DE OMÁN, POR TIPO DE PRODUCTO, 2018-2032 (MILLONES DE USD)
TABLA 644 NÚCLEOS Y TIPOS DE NÚCLEOS DE OMÁN EN EL MERCADO DE MATERIALES MAGNÉTICOS BLANDO, POR TIPO, 2018-2032 (MILLONES DE USD)
TABLA 645 CINTAS Y LÁMINAS DE OMÁN EN EL MERCADO DE MATERIALES MAGNÉTICOS BLANDO, POR TIPO, 2018-2032 (MILLONES DE USD)
TABLA 646 INDUSTRIA DE LA CONSTRUCCIÓN DE OMÁN EN EL MERCADO DE MATERIALES MAGNÉTICOS BLANDO, POR APLICACIÓN, 2018-2032 (MILLONES DE USD)
TABLA 647 INDUSTRIA DE LA CONSTRUCCIÓN DE OMÁN EN EL MERCADO DE MATERIALES MAGNÉTICOS BLANDO, POR TIPO DE PRODUCTO, 2018-2032 (MILLONES DE USD)
TABLA 648 NÚCLEOS Y TIPOS DE NÚCLEOS DE OMÁN EN EL MERCADO DE MATERIALES MAGNÉTICOS BLANDO, POR TIPO, 2018-2032 (MILLONES DE USD)
TABLA 649 CINTAS Y LÁMINAS DE OMÁN EN EL MERCADO DE MATERIALES MAGNÉTICOS BLANDO, POR TIPO, 2018-2032 (MILLONES DE USD)
TABLA 650 OTROS MERCADOS DE MATERIALES MAGNÉTICOS BLANDO EN OMÁN, POR APLICACIÓN, 2018-2032 (MILLONES DE USD)
TABLA 651 OTROS MERCADOS DE MATERIALES MAGNÉTICOS BLANDO EN OMÁN, POR TIPO DE PRODUCTO, 2018-2032 (MILLONES DE USD)
TABLA 652 NÚCLEOS Y TIPOS DE NÚCLEOS EN EL MERCADO DE MATERIALES MAGNÉTICOS BLANDO, POR TIPO, 2018-2032 (MILLONES DE USD)
TABLA 653 CINTAS Y LÁMINAS DE OMÁN EN EL MERCADO DE MATERIALES MAGNÉTICOS BLANDO, POR TIPO, 2018-2032 (MILLONES DE USD)
TABLA 654 MERCADO DE MATERIALES MAGNÉTICOS BLANDO DE OMÁN, POR CANAL DE DISTRIBUCIÓN, 2018-2032 (MILLONES DE USD)
TABLA 655 RESTO DEL MERCADO DE MATERIALES MAGNÉTICOS BLANDO DE ORIENTE MEDIO Y ÁFRICA, POR TIPO DE PRODUCTO, 2018-2032 (MILLONES DE USD)
TABLA 656 RESTO DEL MERCADO DE MATERIALES MAGNÉTICOS BLANDO DE ORIENTE MEDIO Y ÁFRICA, POR TIPO DE PRODUCTO, 2018-2032 (MILES DE TONELADAS)
TABLA 657 RESTO DE ORIENTE MEDIO Y ÁFRICA NÚCLEOS Y TIPOS DE NÚCLEOS EN EL MERCADO DE MATERIALES MAGNÉTICOS BLANDO, POR TIPO, 2018-2032 (MILLONES DE USD)
TABLA 658 RESTO DE ORIENTE MEDIO Y ÁFRICA CINTAS Y LÁMINAS EN EL MERCADO DE MATERIALES MAGNÉTICOS BLANDO, POR TIPO, 2018-2032 (MILLONES DE USD)
TABLA 659 RESTO DEL MERCADO DE MATERIALES MAGNÉTICOS BLANDO DE ORIENTE MEDIO Y ÁFRICA, POR TIPO DE MATERIAL, 2018-2032 (MILLONES DE USD)
TABLA 660 RESTO DEL MERCADO DE MATERIALES MAGNÉTICOS BLANDO DE ORIENTE MEDIO Y ÁFRICA, POR TIPO DE MATERIAL, 2018-2032 (MILES DE TONELADAS)
TABLA 661 RESTO DE ORIENTE MEDIO Y ÁFRICA FERRITAS BLANDAS EN EL MERCADO DE MATERIALES MAGNÉTICOS BLANDOS, POR TIPO, 2018-2032 (MILLONES DE USD)
TABLA 662 RESTO DE ORIENTE MEDIO Y ÁFRICA ACEROS ELÉCTRICOS (FE-SI) EN EL MERCADO DE MATERIALES MAGNÉTICOS BLANDO, POR TIPO, 2018-2032 (MILLONES DE USD)
TABLA 663 RESTO DE ORIENTE MEDIO Y ÁFRICA NÚCLEOS Y TIPOS DE NÚCLEOS EN EL MERCADO DE MATERIALES MAGNÉTICOS BLANDO, POR TIPO, 2018-2032 (MILLONES DE USD)
TABLA 664 RESTO DEL MERCADO DE MATERIALES MAGNÉTICOS BLANDO DE ORIENTE MEDIO Y ÁFRICA, POR PROCESO DE FABRICACIÓN, 2018-2032 (MILLONES DE USD)
TABLA 665 RESTO DEL MERCADO DE MATERIALES MAGNÉTICOS BLANDO DE ORIENTE MEDIO Y ÁFRICA, POR APLICACIÓN, 2018-2032 (MILLONES DE USD)
TABLA 666 RESTO DE ORIENTE MEDIO Y ÁFRICA MERCADO DE INDUCCIÓN ELECTROMAGNÉTICA EN MATERIALES MAGNÉTICOS BLANDO, POR TIPO, 2018-2032 (MILLONES DE USD)
TABLA 667 RESTO DE ORIENTE MEDIO Y ÁFRICA ACONDICIONAMIENTO Y CONVERSIÓN DE ENERGÍA EN EL MERCADO DE MATERIALES MAGNÉTICOS BLANDO, POR TIPO, 2018-2032 (MILLONES DE USD)
TABLA 668 RESTO DEL MERCADO DE MATERIALES MAGNÉTICOS BLANDO DE ORIENTE MEDIO Y ÁFRICA, POR USUARIO FINAL, 2018-2032 (MILLONES DE USD)
TABLA 669 RESTO DE LA INDUSTRIA AUTOMOTRIZ DE ORIENTE MEDIO Y ÁFRICA EN EL MERCADO DE MATERIALES MAGNÉTICOS BLANDO, POR APLICACIÓN, 2018-2032 (MILLONES DE USD)
TABLA 670 RESTO DE LA INDUSTRIA AUTOMOTRIZ DE ORIENTE MEDIO Y ÁFRICA EN EL MERCADO DE MATERIALES MAGNÉTICOS BLANDO, POR TIPO DE PRODUCTO, 2018-2032 (MILLONES DE USD)
TABLA 671 RESTO DE ORIENTE MEDIO Y ÁFRICA NÚCLEOS Y TIPOS DE NÚCLEOS EN EL MERCADO DE MATERIALES MAGNÉTICOS BLANDO, POR TIPO, 2018-2032 (MILLONES DE USD)
TABLA 672 RESTO DE ORIENTE MEDIO Y ÁFRICA CINTAS Y LÁMINAS EN EL MERCADO DE MATERIALES MAGNÉTICOS BLANDO, POR TIPO, 2018-2032 (MILLONES DE USD)
TABLA 673 RESTO DE ORIENTE MEDIO Y ÁFRICA SERVICIOS ELÉCTRICOS Y DE ENERGÍA EN EL MERCADO DE MATERIALES MAGNÉTICOS BLANDO, POR APLICACIÓN, 2018-2032 (MILLONES DE USD)
TABLA 674 RESTO DE ORIENTE MEDIO Y ÁFRICA SERVICIOS ELÉCTRICOS Y DE ENERGÍA EN EL MERCADO DE MATERIALES MAGNÉTICOS BLANDO, POR TIPO DE PRODUCTO, 2018-2032 (MILLONES DE USD)
TABLA 675 RESTO DE ORIENTE MEDIO Y ÁFRICA NÚCLEOS Y TIPOS DE NÚCLEOS EN EL MERCADO DE MATERIALES MAGNÉTICOS BLANDO, POR TIPO, 2018-2032 (MILLONES DE USD)
TABLA 676 RESTO DE ORIENTE MEDIO Y ÁFRICA CINTAS Y LÁMINAS EN EL MERCADO DE MATERIALES MAGNÉTICOS BLANDO, POR TIPO, 2018-2032 (MILLONES DE USD)
TABLA 677 RESTO DEL MERCADO DE ELECTRÓNICA DE CONSUMO EN MATERIALES MAGNÉTICOS BLANDO DE ORIENTE MEDIO Y ÁFRICA, POR APLICACIÓN, 2018-2032 (MILLONES DE USD)
TABLA 678 RESTO DEL MERCADO DE ELECTRÓNICA DE CONSUMO EN MATERIALES MAGNÉTICOS BLANDO DE ORIENTE MEDIO Y ÁFRICA, POR TIPO DE PRODUCTO, 2018-2032 (MILLONES DE USD)
TABLA 679 RESTO DE ORIENTE MEDIO Y ÁFRICA NÚCLEOS Y TIPOS DE NÚCLEOS EN EL MERCADO DE MATERIALES MAGNÉTICOS BLANDO, POR TIPO, 2018-2032 (MILLONES DE USD)
TABLA 680 RESTO DE ORIENTE MEDIO Y ÁFRICA CINTAS Y LÁMINAS EN EL MERCADO DE MATERIALES MAGNÉTICOS BLANDO, POR TIPO, 2018-2032 (MILLONES DE USD)
TABLA 681 RESTO DE ORIENTE MEDIO Y ÁFRICA MERCADO DE TI Y TELECOMUNICACIONES EN MATERIALES MAGNÉTICOS BLANDO, POR APLICACIÓN, 2018-2032 (MILLONES DE USD)
TABLA 682 RESTO DE ORIENTE MEDIO Y ÁFRICA TI Y TELECOMUNICACIONES EN EL MERCADO DE MATERIALES MAGNÉTICOS BLANDO, POR TIPO DE PRODUCTO, 2018-2032 (MILLONES DE USD)
TABLA 683 RESTO DE ORIENTE MEDIO Y ÁFRICA NÚCLEOS Y TIPOS DE NÚCLEOS EN EL MERCADO DE MATERIALES MAGNÉTICOS BLANDO, POR TIPO, 2018-2032 (MILLONES DE USD)
TABLA 684 RESTO DE ORIENTE MEDIO Y ÁFRICA CINTAS Y LÁMINAS EN EL MERCADO DE MATERIALES MAGNÉTICOS BLANDO, POR TIPO, 2018-2032 (MILLONES DE USD)
TABLA 685 RESTO DEL MERCADO DE FABRICACIÓN INDUSTRIAL DE MATERIALES MAGNÉTICOS BLANDO EN ORIENTE MEDIO Y ÁFRICA, POR APLICACIÓN, 2018-2032 (MILLONES DE USD)
TABLA 686 RESTO DE ORIENTE MEDIO Y ÁFRICA FABRICACIÓN INDUSTRIAL EN EL MERCADO DE MATERIALES MAGNÉTICOS BLANDO, POR TIPO DE PRODUCTO, 2018-2032 (MILLONES DE USD)
TABLA 687 RESTO DE ORIENTE MEDIO Y ÁFRICA NÚCLEOS Y TIPOS DE NÚCLEOS EN EL MERCADO DE MATERIALES MAGNÉTICOS BLANDO, POR TIPO, 2018-2032 (MILLONES DE USD)
TABLA 688 RESTO DE ORIENTE MEDIO Y ÁFRICA CINTAS Y LÁMINAS EN EL MERCADO DE MATERIALES MAGNÉTICOS BLANDO, POR TIPO, 2018-2032 (MILLONES DE USD)
TABLA 689 RESTO DE ORIENTE MEDIO Y ÁFRICA AEROESPACIAL Y DEFENSA EN EL MERCADO DE MATERIALES MAGNÉTICOS BLANDO, POR APLICACIÓN, 2018-2032 (MILLONES DE USD)
TABLA 690 RESTO DE ORIENTE MEDIO Y ÁFRICA AEROESPACIAL Y DEFENSA EN EL MERCADO DE MATERIALES MAGNÉTICOS BLANDO, POR TIPO DE PRODUCTO, 2018-2032 (MILLONES DE USD)
TABLA 691 RESTO DE ORIENTE MEDIO Y ÁFRICA NÚCLEOS Y TIPOS DE NÚCLEOS EN EL MERCADO DE MATERIALES MAGNÉTICOS BLANDO, POR TIPO, 2018-2032 (MILLONES DE USD)
TABLA 692 RESTO DE ORIENTE MEDIO Y ÁFRICA CINTAS Y LÁMINAS EN EL MERCADO DE MATERIALES MAGNÉTICOS BLANDO, POR TIPO, 2018-2032 (MILLONES DE USD)
TABLA 693 RESTO DEL MERCADO DE MATERIALES MAGNÉTICOS BLANDO EN ORIENTE MEDIO Y ÁFRICA, POR APLICACIÓN, 2018-2032 (MILLONES DE USD)
TABLA 694 RESTO DE ORIENTE MEDIO Y ÁFRICA ATENCIÓN MÉDICA Y SALUD EN EL MERCADO DE MATERIALES MAGNÉTICOS BLANDO, POR TIPO DE PRODUCTO, 2018-2032 (MILLONES DE USD)
TABLA 695 RESTO DE ORIENTE MEDIO Y ÁFRICA NÚCLEOS Y TIPOS DE NÚCLEOS EN EL MERCADO DE MATERIALES MAGNÉTICOS BLANDO, POR TIPO, 2018-2032 (MILLONES DE USD)
TABLA 696 RESTO DE ORIENTE MEDIO Y ÁFRICA CINTAS Y LÁMINAS EN EL MERCADO DE MATERIALES MAGNÉTICOS BLANDO, POR TIPO, 2018-2032 (MILLONES DE USD)
TABLA 697 RESTO DEL MERCADO DE ENERGÍAS RENOVABLES EN MATERIALES MAGNÉTICOS BLANDOS DE ORIENTE MEDIO Y ÁFRICA, POR APLICACIÓN, 2018-2032 (MILLONES DE USD)
TABLA 698 RESTO DEL MERCADO DE ENERGÍAS RENOVABLES EN MATERIALES MAGNÉTICOS BLANDOS DE ORIENTE MEDIO Y ÁFRICA, POR TIPO DE PRODUCTO, 2018-2032 (MILLONES DE USD)
TABLA 699 RESTO DE ORIENTE MEDIO Y ÁFRICA NÚCLEOS Y TIPOS DE NÚCLEOS EN EL MERCADO DE MATERIALES MAGNÉTICOS BLANDO, POR TIPO, 2018-2032 (MILLONES DE USD)
TABLA 700 RESTO DE ORIENTE MEDIO Y ÁFRICA CINTAS Y LÁMINAS EN EL MERCADO DE MATERIALES MAGNÉTICOS BLANDO, POR TIPO, 2018-2032 (MILLONES DE USD)
TABLA 701 RESTO DE ORIENTE MEDIO Y ÁFRICA INDUSTRIA DE LA CONSTRUCCIÓN EN EL MERCADO DE MATERIALES MAGNÉTICOS BLANDO, POR APLICACIÓN, 2018-2032 (MILLONES DE USD)
TABLA 702 RESTO DE ORIENTE MEDIO Y ÁFRICA INDUSTRIA DE LA CONSTRUCCIÓN EN EL MERCADO DE MATERIALES MAGNÉTICOS BLANDO, POR TIPO DE PRODUCTO, 2018-2032 (MILLONES DE USD)
TABLA 703 RESTO DE ORIENTE MEDIO Y ÁFRICA NÚCLEOS Y TIPOS DE NÚCLEOS EN EL MERCADO DE MATERIALES MAGNÉTICOS BLANDO, POR TIPO, 2018-2032 (MILLONES DE USD)
TABLA 704 RESTO DE ORIENTE MEDIO Y ÁFRICA CINTAS Y LÁMINAS EN EL MERCADO DE MATERIALES MAGNÉTICOS BLANDO, POR TIPO, 2018-2032 (MILLONES DE USD)
TABLA 705 RESTO DE ORIENTE MEDIO Y ÁFRICA OTROS EN EL MERCADO DE MATERIALES MAGNÉTICOS BLANDO, POR APLICACIÓN, 2018-2032 (MILLONES DE USD)
TABLA 706 RESTO DE ORIENTE MEDIO Y ÁFRICA OTROS EN EL MERCADO DE MATERIALES MAGNÉTICOS BLANDO, POR TIPO DE PRODUCTO, 2018-2032 (MILLONES DE USD)
TABLA 707 RESTO DE ORIENTE MEDIO Y ÁFRICA NÚCLEOS Y TIPOS DE NÚCLEOS EN EL MERCADO DE MATERIALES MAGNÉTICOS BLANDO, POR TIPO, 2018-2032 (MILLONES DE USD)
TABLA 708 RESTO DE ORIENTE MEDIO Y ÁFRICA CINTAS Y LÁMINAS EN EL MERCADO DE MATERIALES MAGNÉTICOS BLANDO, POR TIPO, 2018-2032 (MILLONES DE USD)
TABLA 709 RESTO DEL MERCADO DE MATERIALES MAGNÉTICOS BLANDO DE ORIENTE MEDIO Y ÁFRICA, POR CANAL DE DISTRIBUCIÓN, 2018-2032 (MILLONES DE USD)
Lista de figuras
FIGURA 1 MERCADO DE MATERIALES MAGNÉTICOS BLANDO DE ORIENTE MEDIO Y ÁFRICA
FIGURA 2 MERCADO DE MATERIALES MAGNÉTICOS BLANDO DE ORIENTE MEDIO Y ÁFRICA: TRIANGULACIÓN DE DATOS
FIGURA 3 MERCADO DE MATERIALES MAGNÉTICOS BLANDO DE ORIENTE MEDIO Y ÁFRICA: ANÁLISIS DROC
FIGURA 4 MERCADO DE MATERIALES MAGNÉTICOS BLANDO DE ORIENTE MEDIO Y ÁFRICA: ANÁLISIS DEL MERCADO DE ORIENTE MEDIO Y ÁFRICA VS. REGIONAL
FIGURA 5 MERCADO DE MATERIALES MAGNÉTICOS BLANDO DE ORIENTE MEDIO Y ÁFRICA: ANÁLISIS DE INVESTIGACIÓN DE EMPRESAS
FIGURA 6 MERCADO DE MATERIALES MAGNÉTICOS BLANDO DE ORIENTE MEDIO Y ÁFRICA: MODELADO MULTIVARIADO
FIGURA 7 MERCADO DE MATERIALES MAGNÉTICOS BLANDO DE ORIENTE MEDIO Y ÁFRICA: DATOS DEMOGRÁFICOS DE LAS ENTREVISTAS
FIGURA 8 MERCADO DE MATERIALES MAGNÉTICOS BLANDO DE ORIENTE MEDIO Y ÁFRICA: CUADRÍCULA DE POSICIÓN DE MERCADO DBMR
FIGURA 9 MERCADO DE MATERIALES MAGNÉTICOS BLANDO DE ORIENTE MEDIO Y ÁFRICA: ANÁLISIS DE LA PARTICIPACIÓN DE LOS PROVEEDORES
FIGURA 10 MERCADO DE MATERIALES MAGNÉTICOS BLANDO DE ORIENTE MEDIO Y ÁFRICA: SEGMENTACIÓN
FIGURA 11 RESUMEN EJECUTIVO
FIGURA 12 DECISIONES ESTRATÉGICAS
FIGURA 13 SIETE SEGMENTOS COMPRENDEN EL MERCADO DE MATERIALES MAGNÉTICOS BLANDO DE ORIENTE MEDIO Y ÁFRICA, POR PRODUCTO (2024)
FIGURA 14 SE ESPERA QUE EL AUMENTO DEL USO DE SISTEMAS DE DETECCIÓN DE NEUTRONES IMPULSE EL MERCADO DE MATERIALES MAGNÉTICOS BLANDO DE ORIENTE MEDIO Y ÁFRICA EN EL PERÍODO PRONOSTICADO DE 2025 A 2032
FIGURA 15 SE ESPERA QUE EL SEGMENTO DE HOJAS Y TIRAS REPRESENTE LA MAYOR PARTICIPACIÓN DE MERCADO DE MATERIALES MAGNÉTICOS BLANDO DE ORIENTE MEDIO Y ÁFRICA EN 2025 Y 2032
FIGURA 16 ANÁLISIS DE PATENTES POR CÓDIGO IPC
FIGURA 17 ANÁLISIS DE PATENTES POR PAÍSES
FIGURA 18 ANÁLISIS DE PATENTES POR AÑO
FIGURA 19 IMPULSORES, RESTRICCIONES, OPORTUNIDADES Y DESAFÍOS DEL MERCADO DE MATERIALES MAGNÉTICOS BLANDO DE ORIENTE MEDIO Y ÁFRICA
FIGURA 20 MERCADO DE MATERIALES MAGNÉTICOS BLANDO DE ORIENTE MEDIO Y ÁFRICA: POR TIPO DE PRODUCTO, 2024
FIGURA 21 MERCADO DE MATERIALES MAGNÉTICOS BLANDO DE ORIENTE MEDIO Y ÁFRICA: POR TIPO DE MATERIAL, 2024
FIGURA 22 MERCADO DE MATERIALES MAGNÉTICOS BLANDO DE ORIENTE MEDIO Y ÁFRICA: POR PROCESO DE FABRICACIÓN, 2024
FIGURA 23 MERCADO DE MATERIALES MAGNÉTICOS BLANDO DE ORIENTE MEDIO Y ÁFRICA: POR APLICACIÓN, 2024
FIGURA 24 MERCADO DE MATERIALES MAGNÉTICOS BLANDO DE ORIENTE MEDIO Y ÁFRICA: POR USUARIO FINAL, 2024
FIGURA 25 MERCADO DE MATERIALES MAGNÉTICOS BLANDO DE ORIENTE MEDIO Y ÁFRICA: POR CANAL DE DISTRIBUCIÓN, 2024
FIGURA 26 MERCADO DE MATERIALES MAGNÉTICOS BLANDO DE ORIENTE MEDIO
FIGURA 27 MERCADO DE MATERIALES MAGNÉTICOS BLANDO DE ORIENTE MEDIO Y ÁFRICA: PARTICIPACIÓN DE LA EMPRESA 2024 (%)
Metodología de investigación
La recopilación de datos y el análisis del año base se realizan utilizando módulos de recopilación de datos con muestras de gran tamaño. La etapa incluye la obtención de información de mercado o datos relacionados a través de varias fuentes y estrategias. Incluye el examen y la planificación de todos los datos adquiridos del pasado con antelación. Asimismo, abarca el examen de las inconsistencias de información observadas en diferentes fuentes de información. Los datos de mercado se analizan y estiman utilizando modelos estadísticos y coherentes de mercado. Además, el análisis de la participación de mercado y el análisis de tendencias clave son los principales factores de éxito en el informe de mercado. Para obtener más información, solicite una llamada de un analista o envíe su consulta.
La metodología de investigación clave utilizada por el equipo de investigación de DBMR es la triangulación de datos, que implica la extracción de datos, el análisis del impacto de las variables de datos en el mercado y la validación primaria (experto en la industria). Los modelos de datos incluyen cuadrícula de posicionamiento de proveedores, análisis de línea de tiempo de mercado, descripción general y guía del mercado, cuadrícula de posicionamiento de la empresa, análisis de patentes, análisis de precios, análisis de participación de mercado de la empresa, estándares de medición, análisis global versus regional y de participación de proveedores. Para obtener más información sobre la metodología de investigación, envíe una consulta para hablar con nuestros expertos de la industria.
Personalización disponible
Data Bridge Market Research es líder en investigación formativa avanzada. Nos enorgullecemos de brindar servicios a nuestros clientes existentes y nuevos con datos y análisis que coinciden y se adaptan a sus objetivos. El informe se puede personalizar para incluir análisis de tendencias de precios de marcas objetivo, comprensión del mercado de países adicionales (solicite la lista de países), datos de resultados de ensayos clínicos, revisión de literatura, análisis de mercado renovado y base de productos. El análisis de mercado de competidores objetivo se puede analizar desde análisis basados en tecnología hasta estrategias de cartera de mercado. Podemos agregar tantos competidores sobre los que necesite datos en el formato y estilo de datos que esté buscando. Nuestro equipo de analistas también puede proporcionarle datos en archivos de Excel sin procesar, tablas dinámicas (libro de datos) o puede ayudarlo a crear presentaciones a partir de los conjuntos de datos disponibles en el informe.

