North America Frozen Fruit And Vegetables Mix Market
Tamaño del mercado en miles de millones de dólares
Tasa de crecimiento anual compuesta (CAGR) :
% 
 USD
1.13 Billion
USD
1.19 Billion
2024
2032
USD
1.13 Billion
USD
1.19 Billion
2024
2032
| 2025 –2032 | |
| USD 1.13 Billion | |
| USD 1.19 Billion | |
| % | |
|
Segmentación del mercado de mezclas de frutas y verduras congeladas de América del Norte, por tipo (mezcla de frutas y verduras), tecnología (IQF, congelación rápida, congelación criogénica, lecho fluidizado, congelación isocórica, otras), categoría de producto (congelado crudo, escaldado al vapor y luego IQF, crudo IQF, asado a la parrilla y luego IQF, asado y luego IQF, marinado o recubierto congelado, mezclas congeladas con salsa incluida, precocido y luego congelado, rehidratado y luego congelado, pre-sazonado y luego IQF, otras), forma (entero, rebanado, cortado en cubos, mitades, en puré, picado, machacado, desmenuzado, en espiral, en juliana, triturado, rallado, granulado, recubierto y otras), categoría (convencional y orgánico), fuente (convencional, hidropónico, de agricultura regenerativa, basado en granjas verticales, biodinámico y otras), etiquetado y certificación (etiqueta limpia, verificado sin OGM, vegano, sin gluten, sin pesticidas, Sin alérgenos, Kosher, Halal, con certificación de Comercio Justo y otros), Formato de empaque (Bolsa, Sellado al vacío, Cubos individuales, Paquete institucional a granel, Bandeja multicompartimento, Bag in Box, Bolsa a granel para tiendas, Paquete de ladrillo para minoristas, Bolsa con ventana, Tubos de plástico), Tamaño del empaque (Tamaños de empaque minorista, Tamaños de empaque para servicios de alimentación/institucionales), Vida útil (≤6 meses, 6-9 meses, 9-12 meses, 12-15 meses, 15-24 meses, 24 meses), Aplicación (Uso minorista, Servicios de alimentación (HORECA), Empresas de kits de comidas, Industria de servicios de alimentación, Fabricantes de alimentos para bebés, Fabricantes de suplementos nutricionales, Cocinas institucionales, Paquetes combinados de productos frescos congelados para minoristas, Otros), Canal de distribución (B2B, B2C (Tienda, No tienda)), Tendencias de la industria y pronóstico hasta 2032
Tamaño del mercado de mezclas de frutas y verduras congeladas en América del Norte
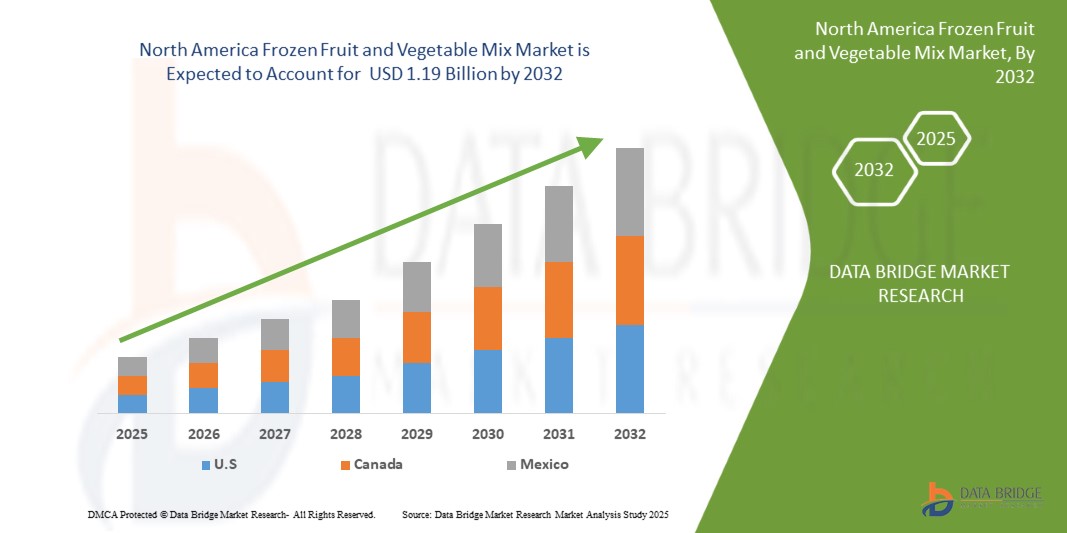
- El tamaño del mercado de mezcla de frutas y verduras congeladas de América del Norte se valoró en USD 1.13 mil millones en 2024 y se espera que alcance los USD 1.19 mil millones para 2032 , con una CAGR del 6,8% durante el período de pronóstico.
- El crecimiento del mercado se debe en gran medida a la creciente demanda de opciones de comidas convenientes y listas para cocinar debido a los estilos de vida ocupados y los hogares con dos ingresos.
- Además, la creciente conciencia de la disponibilidad estacional, la reducción del desperdicio de alimentos y la preservación del valor nutricional respaldan aún más el cambio hacia alternativas congeladas.
Análisis del mercado de mezclas de frutas y verduras congeladas en América del Norte
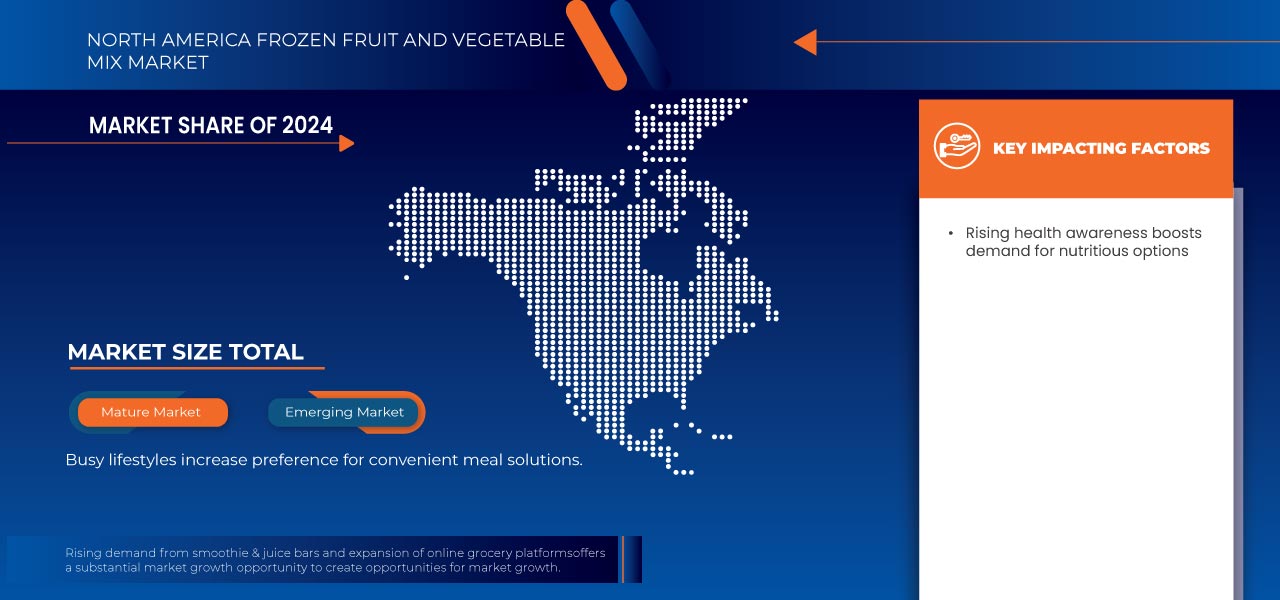
- La creciente conciencia sobre la salud y la demanda de soluciones de comidas de preparación rápida han impulsado la popularidad de las mezclas de frutas y verduras congeladas. Estos productos ofrecen una mayor vida útil y conservan su valor nutricional, en línea con las preferencias de los consumidores por alimentos de etiqueta limpia, sin OGM y mínimamente procesados.
- Los sectores de servicios de alimentación y venta minorista son motores clave de crecimiento, aprovechando las mezclas congeladas para lograr eficiencia operativa y consistencia estacional. La creciente adopción en restaurantes, cafeterías y supermercados, especialmente con marcas blancas, está ampliando el alcance del mercado y apoyando una demanda constante durante todo el año.
- Estados Unidos dominó el mercado de frutas y verduras congeladas de América del Norte debido a su avanzada infraestructura de cadena de frío, la alta demanda de los consumidores de alimentos convenientes y la creciente preferencia por la disponibilidad de productos de temporada durante todo el año, lo que impulsó un fuerte crecimiento del mercado en toda la región.
- Estados Unidos es el país de más rápido crecimiento en el mercado de frutas y verduras congeladas de América del Norte, impulsado por la creciente demanda de alimentos listos para comer, estilos de vida ocupados y fuertes redes de distribución que respaldan la disponibilidad y accesibilidad de los productos.
- Se espera que el segmento de mezclas de frutas domine el mercado de mezclas de frutas y verduras congeladas con una participación del 76,47 % en 2025, impulsado por su capacidad superior de intercambio iónico, potencial de administración controlada de fármacos y capacidad para mejorar la eficacia terapéutica, lo que respalda su creciente adopción en formulaciones de tratamientos avanzados y aplicaciones de investigación.
Alcance del informe y segmentación del mercado de mezclas de frutas y verduras congeladas en América del Norte
|
Atributos |
Perspectivas clave del mercado de mezclas de frutas y verduras congeladas en América del Norte |
|
Segmentos cubiertos |
|
|
Actores clave del mercado |
|
|
Oportunidades de mercado |
|
|
Conjuntos de información de datos de valor añadido |
Además de los conocimientos sobre escenarios de mercado como valor de mercado, tasa de crecimiento, segmentación, cobertura geográfica y actores principales, los informes de mercado seleccionados por Data Bridge Market Research también incluyen análisis de importación y exportación, descripción general de la capacidad de producción, análisis del consumo de producción, análisis de tendencias de precios, escenario de cambio climático, análisis de la cadena de suministro, análisis de la cadena de valor, descripción general de materias primas/consumibles, criterios de selección de proveedores, análisis PESTLE, análisis de Porter y marco regulatorio. |
Tendencias del mercado de mezclas de frutas y verduras congeladas en América del Norte
Los estilos de vida ocupados aumentan la preferencia por soluciones de comidas convenientes
- En el mundo acelerado de hoy, los consumidores hacen cada vez más malabarismos con horarios laborales exigentes, responsabilidades familiares y obligaciones sociales, lo que les deja poco tiempo para planificar y preparar sus comidas. Como resultado, existe una creciente preferencia por opciones de alimentos prácticos que ahorran tiempo y que no comprometen la nutrición ni el sabor. Las frutas y verduras congeladas se adaptan perfectamente a este cambio de estilo de vida, ofreciendo una solución rápida y sencilla para mantener hábitos alimenticios saludables sin necesidad de lavar, pelar, picar ni hacer la compra con frecuencia.
- Los productos congelados ayudan a los consumidores a reducir el tiempo de preparación, garantizando al mismo tiempo la disponibilidad de frutas y verduras de temporada durante todo el año. Ya sea para batidos, salteados o sopas y ensaladas, las opciones congeladas ofrecen versatilidad, consistencia y mínimo desperdicio. Esta comodidad es especialmente atractiva para residentes urbanos, profesionales, estudiantes universitarios y familias jóvenes que buscan soluciones de alimentación eficientes y adaptadas a sus objetivos de salud.
- Además, las frutas y verduras congeladas suelen congelarse instantáneamente en su punto óptimo de maduración, lo que conserva sus nutrientes y sabor, lo que resulta atractivo para quienes se preocupan por su salud y buscan alternativas nutritivas a los alimentos procesados o para llevar. El auge de los envases individuales y las mezclas premezcladas facilita la preparación rápida de comidas y el control de las porciones, en línea con la demanda de formatos listos para usar y para llevar.
Dinámica del mercado de mezclas de frutas y verduras congeladas en América del Norte
Conductor
Los avances en la tecnología de congelación mejoran la conservación de la calidad del producto.
- Los avances tecnológicos en los métodos de congelación han mejorado significativamente la calidad, la vida útil y la percepción del consumidor sobre las frutas y verduras congeladas. Las preocupaciones previas sobre la pérdida de nutrientes, las texturas pastosas y el color deficiente se han abordado con innovaciones como la Congelación Rápida Individual (IQF), que congela los productos rápidamente y por separado, evitando la formación de grumos y conservando su textura, sabor y valor nutricional naturales.
- Además, la congelación criogénica con nitrógeno líquido o dióxido de carbono ofrece una congelación ultrarrápida que protege la estructura celular de productos delicados como bayas y hierbas. Estos métodos reducen la formación de cristales de hielo, garantizando que el producto congelado mantenga una apariencia y textura similares a las del producto fresco. Las mejoras en el escaldado (el pretratamiento previo a la congelación) también han ayudado a conservar mayores niveles de nutrientes como la vitamina C y los antioxidantes mediante el uso de vapor controlado en lugar de la ebullición tradicional.
- Además, las soluciones de envasado avanzadas, como las bolsas resellables y las películas resistentes a la humedad, mejoran aún más la calidad del producto, previniendo las quemaduras por congelación y manteniendo la frescura. Estas innovaciones permiten que las frutas y verduras congeladas satisfagan a los consumidores preocupados por su salud y ocupados que priorizan la comodidad sin comprometer su valor nutricional.
Restricción/Desafío
Percepción de que los alimentos congelados son menos frescos
- A pesar de los avances en la tecnología de congelación y la creciente demanda de soluciones alimentarias convenientes, la percepción de que los alimentos congelados, especialmente las frutas y verduras, son menos frescos que sus contrapartes frescas, continúa frenando el crecimiento del mercado. Muchos consumidores aún asocian los productos congelados con un menor valor nutricional, sabor alterado y mala textura, a pesar de que estas preocupaciones están cada vez más desfasadas.
- Esta percepción proviene de hábitos y suposiciones arraigadas de que "fresco" es sinónimo de más sano y de mayor calidad. Durante décadas, las frutas y verduras congeladas se consideraron una opción de segunda categoría, a menudo utilizadas solo cuando no había productos frescos disponibles. Si bien las técnicas modernas de congelación, como la Congelación Rápida Individual (IQF) y la congelación criogénica, ahora conservan la mayoría de los nutrientes y previenen la degradación de la textura, la mentalidad de muchos consumidores permanece inalterada, especialmente entre los grupos de mayor edad o aquellos menos informados sobre tecnología alimentaria.
- Además, la apariencia del empaque, las quemaduras por congelación o la aglomeración de los productos congelados pueden reforzar la creencia de que estos alimentos están excesivamente procesados o conservados artificialmente. Estas ideas erróneas se ven agravadas por la preferencia por productos frescos visualmente vibrantes en los mercados o expositores de supermercados, que a menudo se priorizan en el marketing y la distribución minorista sobre las secciones de congelados.
Alcance del mercado de mezclas de frutas y verduras congeladas en América del Norte
El mercado está segmentado en función del tipo, la tecnología, la categoría del producto, la forma, la categoría, la fuente, el etiquetado y las certificaciones, el formato del embalaje, el tamaño del embalaje, la vida útil, la aplicación y el canal de distribución.
Por tipo de producto
Según el tipo de producto, el mercado se segmenta en mezclas de verduras, mezclas de frutas y mezclas de frutas y verduras. En 2025, se prevé que el segmento de mezclas de verduras domine el mercado con una cuota de mercado del 76,67 %, impulsado por la creciente demanda de conveniencia, mayor vida útil y una mejor retención de sabor y nutrientes.
Se proyecta que el segmento de mezclas de vegetales experimentará el crecimiento más rápido con una CAGR del 6,8 % entre 2025 y 2032, impulsado por la creciente preferencia de los consumidores por comidas saludables listas para cocinar, las crecientes tendencias vegetarianas y veganas y la creciente popularidad de alternativas de alimentos congelados ricos en nutrientes.
Por tecnología
Según la tecnología, el mercado se segmenta en IQF, congelación rápida, congelación criogénica, lecho fluidizado, congelación isocórica y otros. En 2025, se prevé que el segmento IQF domine el mercado, impulsado por la calidad superior del producto, una mayor vida útil, la reducción del deterioro y la creciente demanda de frutas y verduras congeladas rápidamente de forma individual, tanto en el sector minorista como en el de servicios de alimentación.
Se espera que el segmento IQF crezca a la CAGR más rápida del 7,0 % durante 2025-2032 debido a la creciente demanda de productos congelados de alta calidad, una mejor conservación de la textura y los nutrientes y un uso cada vez mayor en alimentos listos para comer y procesados.
Por categoría de producto
Según la categoría de producto, el mercado se segmenta en crudo congelado, escaldado al vapor y luego congelado IQF, crudo IQF, asado y luego congelado IQF, marinado o rebozado congelado, mezclas congeladas con salsa, precocido y luego congelado, rehidratado y luego congelado, pre-sazonado y luego congelado, y otros. En 2025, se prevé que el segmento crudo IQF domine, gracias a su uso en soluciones de comidas preparadas y al auge de la cocina casera.
Se proyecta que el segmento Raw IQF crecerá a la CAGR más alta del 7,9 % durante 2025-2032 debido a la creciente preferencia de los consumidores por alimentos mínimamente procesados, una mejor retención de nutrientes y crecientes aplicaciones en productos de comidas listas para cocinar y enfocados en la salud.
Por formulario
En cuanto a su presentación, el mercado norteamericano de mezclas de frutas y verduras congeladas se segmenta en: enteras, rebanadas, cortadas en cubos, en mitades, en puré, picadas, machacadas, desmenuzadas, espiralizadas, en juliana, trituradas, ralladas, granuladas, rebozadas, entre otras. Para 2025, se prevé que este segmento domine el mercado norteamericano de mezclas de frutas y verduras congeladas debido a la creciente preferencia de los consumidores por productos naturales y sin procesar, una mejor retención de textura y su idoneidad para diversas aplicaciones culinarias.
Se proyecta que todo el segmento crecerá a la CAGR más alta del 7,9 % durante el período 2025-2032 debido a la infraestructura agrícola a gran escala establecida, los menores costos de producción y la amplia aceptación por parte de los consumidores y la industria de las fuentes convencionales para el procesamiento de frutas y verduras congeladas en toda la región.
Por categoría
Según la categoría, el mercado norteamericano de mezclas de frutas y verduras congeladas se segmenta en convencional y orgánico. En 2025, se prevé que el segmento convencional domine el mercado norteamericano de mezclas de frutas y verduras congeladas con una cuota de mercado significativa, gracias a su amplia disponibilidad, menor coste en comparación con las opciones orgánicas y una alta aceptación por parte de los consumidores en todos los canales de distribución.
Se proyecta que el segmento convencional crecerá a la CAGR más alta, es decir, 6,9% durante 2025-2032, debido a la infraestructura agrícola a gran escala establecida, los menores costos de producción y la amplia aceptación de los consumidores y la industria de las fuentes convencionales en el procesamiento de frutas y verduras congeladas en toda la región.
Por fuente
Según el origen, el mercado norteamericano de mezclas de frutas y verduras congeladas se segmenta en convencional, hidropónico, de agricultura regenerativa, basado en granjas verticales, biodinámico, entre otros. En 2025, se prevé que el segmento convencional domine el mercado norteamericano de mezclas de frutas y verduras congeladas debido a su asequibilidad, amplia aceptación por parte de los consumidores, mayor disponibilidad en tiendas minoristas y una fuerte demanda tanto en aplicaciones domésticas como de servicios de alimentación.
Se proyecta que el segmento convencional crecerá a la CAGR más alta del 7,1 % durante 2025-2032 debido a la infraestructura agrícola a gran escala establecida, los menores costos de producción y la amplia aceptación por parte de los consumidores y la industria de las fuentes convencionales en el procesamiento de frutas y verduras congeladas en toda la región.
Por etiquetado y certificación
Sobre la base del etiquetado y la certificación, el mercado está segmentado en Sin OGM verificado, Sin gluten, Kosher, Halal, Vegano, Certificado de comercio justo, Etiqueta limpia, Sin pesticidas, Sin alérgenos y otros. En 2025, se espera que el segmento Sin OGM verificado domine el mercado debido a la creciente conciencia de los consumidores sobre la seguridad alimentaria, la preferencia por productos de etiqueta limpia y la creciente demanda de transparencia en el abastecimiento y la calidad de los ingredientes en América del Norte.
Se espera que el segmento Non-GMO Verified se expanda rápidamente entre 2025 y 2032 a una CAGR del 8,7 %, respaldado por la creciente demanda de los consumidores de productos sostenibles y de origen ético y una mayor conciencia sobre las certificaciones de salud y etiqueta limpia.
Por formato de embalaje
Según el formato de envasado, el mercado se segmenta en bolsas, envases sellados al vacío, cubos individuales, envases institucionales a granel, bandejas multicompartimentales, bolsas en caja, bolsas a granel para tiendas, envases modulares para minoristas, bolsas con ventana y tarrinas de plástico. En 2025, se prevé que el segmento de bolsas domine el mercado gracias a su diseño ligero y resellable, su larga vida útil, su facilidad de almacenamiento y la creciente preferencia de los consumidores por soluciones de envasado prácticas y sostenibles.
Se proyecta que el segmento de bolsas crecerá más rápido entre 2025 y 2032 debido a la creciente demanda de envases livianos, portátiles y ecológicos, junto con la creciente preferencia de los consumidores por formatos resellables y fáciles de usar en productos alimenticios congelados.
Por tamaño de embalaje
Según el tamaño del envase, el mercado se segmenta en envases para comercio minorista y envases para servicios de alimentación/institucionales. En 2025, se prevé que el segmento de envases para comercio minorista domine la cuota de mercado gracias a las tendencias de consumo en los hogares.
Se prevé que el segmento de tamaños de envases minoristas crezca rápidamente entre 2025 y 2032, es decir, un 6,90%, debido a la creciente demanda de los restaurantes y proveedores de servicios de comidas.
Por vida útil
Según la vida útil, el mercado se segmenta en ≤6 meses, 6-9 meses, 9-12 meses, 12-15 meses, 15-24 meses y >24 meses. En 2025, se espera que el segmento ≤6 meses domine el mercado, con una cuota de mercado gracias a la logística minorista y la percepción de frescura.
Se espera que el segmento ≤6 meses crezca más rápido de 2025 a 2032, es decir, un 7,2% debido a la vida útil entre la frescura del producto, la retención de la calidad y la flexibilidad de la gestión del inventario, lo que se alinea con las preferencias operativas de los minoristas y los patrones de compra de los consumidores dentro del mercado de mezclas de frutas y verduras congeladas.
Por aplicación
Según la aplicación, el mercado se segmenta en Consumo Minorista, Servicios de Alimentación (HORECA), Empresas de Kits de Comida, Industria de Servicios de Alimentación, Fabricantes de Alimentos Infantiles, Fabricantes de Suplementos Nutricionales, Cocinas Institucionales, Paquetes Combinados de Frutas y Verduras Congeladas para la Venta Minorista, entre otros. En 2025, se prevé que el segmento Consumo Minorista domine el mercado con una cuota de mercado considerable, impulsada por la creciente demanda de mezclas de frutas y verduras congeladas prácticas, rápidas y nutritivas para el consumo doméstico, impulsada por una mayor concienciación sobre la salud, un estilo de vida ajetreado y la expansión del comercio electrónico y los supermercados en toda la región.
Se proyecta que el segmento de consumo minorista crecerá a la CAGR más rápida durante 2025-2032, es decir, un 7,0 %, debido a la creciente demanda de nutrición personalizada y tecnología alimentaria.
Por canal de distribución
Según el canal de distribución, el mercado se segmenta en B2B y B2C (con tienda física y sin tienda física). En 2025, se prevé que el segmento B2B domine el mercado gracias a su amplio alcance minorista y a su penetración en el mercado de consumo.
Se anticipa que el segmento B2B será testigo de la tasa de crecimiento más rápida durante el período de pronóstico, es decir, 6,80%, respaldado por la preferencia de los consumidores por comprar mezclas de frutas y verduras congeladas directamente a través de tiendas minoristas, supermercados y plataformas de comestibles en línea, impulsada por la demanda de opciones de alimentos convenientes y saludables y la creciente penetración del comercio minorista organizado en toda la región.
Análisis regional del mercado de mezclas de frutas y verduras congeladas en América del Norte
- Se espera que EE. UU. domine el mercado de mezclas de frutas y verduras congeladas con la mayor participación en los ingresos y se proyecta que crezca a la CAGR más rápida del 6,8 % en 2025, impulsado por la creciente prevalencia de trastornos venosos, una gran conciencia de la terapia de compresión y una fuerte demanda de los segmentos médicos y deportivos.
- La rica infraestructura sanitaria de la región, las favorables políticas de reembolso y el aumento de la población geriátrica impulsan aún más la expansión del mercado. Además, las crecientes tendencias en fitness y la concienciación sobre el bienestar preventivo contribuyen a la demanda no médica.
- Las principales economías, como Estados Unidos y Canadá, desempeñan un papel importante en el crecimiento del mercado, y Estados Unidos representa la mayor parte debido a su avanzado sistema médico, un mayor gasto en atención médica y una amplia disponibilidad de productos en canales tanto en línea como fuera de línea.
Análisis del mercado de mezclas de frutas y verduras congeladas de EE. UU.
Estados Unidos representó la mayor participación en los ingresos del mercado en la región de América del Norte en 2025, atribuido a una alta prevalencia de enfermedades venosas crónicas, una infraestructura de atención médica avanzada, una creciente adopción de la terapia de compresión en la atención posoperatoria y una fuerte presencia de actores clave del mercado que ofrecen soluciones de compresión tecnológicamente avanzadas.
Canadá. Análisis del mercado de mezclas de frutas y verduras congeladas
Se espera que Estados Unidos registre la CAGR más rápida de la región entre 2025 y 2032, impulsada por la creciente conciencia de la atención médica preventiva, la creciente demanda de ropa de compresión entre las poblaciones mayores y activas, la expansión de la penetración del comercio electrónico y las continuas innovaciones en tecnología de materiales y diseño de productos.
Cuota de mercado de mezclas de frutas y verduras congeladas en América del Norte
La industria de mezclas de frutas y verduras congeladas está liderada principalmente por empresas bien establecidas, entre las que se incluyen:
- Ardo (Bélgica)
- Alimentos congelados Wawona (EE. UU.)
- Titan Frozen Fruit (EE. UU.)
- Earthbound Farm (EE. UU.)
- Dole Packaged Foods LLC (EE. UU.)
- Toque de la naturaleza (Canadá)
- SunOpta (EE. UU.)
- JR Simplot Company (EE. UU.)
- Compañía frutícola de Oregón (EE. UU.)
- Greenyard (Bélgica)
- Scenic Fruit Company (EE. UU.)
- Granjas de la isla Stahlbush (EE. UU.)
- Productos de fruta Milne (EE. UU.)
- Alaska (Canadá)
- Fruit d'Or (Canadá)
Últimos avances en el mercado de mezclas de frutas y verduras congeladas en América del Norte
- En octubre de 2024, SunOpta anunció la expansión de su Dream Oatmilk a 6700 tiendas adicionales mediante una alianza con una importante cadena de cafeterías. Este desarrollo aumenta significativamente la presencia de Dream Oatmilk en tiendas minoristas y se alinea con la creciente demanda de bebidas vegetales en los canales de café. Fortalece la posición de SunOpta en el competitivo segmento de la leche de avena, a la vez que impulsa el crecimiento de su portafolio de bebidas vegetales en Norteamérica.
- En junio de 2024, SunOpta invirtió 26 mil millones de dólares para ampliar su planta de procesamiento de bebidas vegetales en Modesto, California. Este desarrollo aumenta la capacidad de producción de bebidas de avena, almendras y soja para satisfacer la creciente demanda de productos vegetales. La expansión impulsa la eficiencia operativa y la escalabilidad, a la vez que refuerza el compromiso de SunOpta de atender al creciente mercado norteamericano de bebidas vegetales con productos de alta calidad y de etiqueta limpia.
- En marzo de 2025, Sligro Food Group y Greenyard firmaron una alianza estratégica para el suministro de frutas, verduras y patatas frescas en Bélgica. Greenyard Fresh Belgium se encargará del abastecimiento y la entrega de más de 5.100 millones de productos al año, priorizando los productos locales y sostenibles y las cadenas de suministro más cortas. Esta colaboración fortalece la oferta de servicios de alimentación de Sligro, alineándose con la visión de Greenyard de establecer relaciones integradas y a largo plazo con los clientes.
- En febrero de 2025, Oregon Fruit Company colaboró con Xicha Brewing para lanzar un puré de fruta aséptico diseñado para bebidas artesanales. Este desarrollo permite a las cerveceras incorporar un sabor a fruta de alta calidad, manteniendo la seguridad y consistencia del producto. Impulsa el crecimiento de Oregon Fruit en el segmento de bebidas artesanales y enriquece la oferta de Xicha Brewing con bebidas innovadoras con sabor a fruta, en línea con la creciente demanda de los consumidores de sabores únicos y de etiqueta limpia en el competitivo mercado.
- En mayo de 2025, Dot Foods anuncia una nueva solución integral de contenido de productos que ayuda a los proveedores a crear y optimizar datos para cumplir con los estándares GDSN y atender a sus clientes. Dot Data Services también proporciona a distribuidores y operadores acceso al contenido de productos y herramientas para su mantenimiento.
SKU-
Obtenga acceso en línea al informe sobre la primera nube de inteligencia de mercado del mundo

- Panel de análisis de datos interactivo
- Panel de análisis de empresas para oportunidades con alto potencial de crecimiento
- Acceso de analista de investigación para personalización y consultas
- Análisis de la competencia con panel interactivo
- Últimas noticias, actualizaciones y análisis de tendencias
- Aproveche el poder del análisis de referencia para un seguimiento integral de la competencia
Tabla de contenido
1 INTRODUCCIÓN
1.1 OBJETIVOS DEL ESTUDIO
1.2 DEFINICIÓN DE MERCADO
1.3 DESCRIPCIÓN GENERAL DEL MERCADO DE MEZCLAS DE FRUTAS Y VERDURAS CONGELADAS DE AMÉRICA DEL NORTE
1.4 MERCADOS CUBIERTOS
2 SEGMENTACIÓN DEL MERCADO
2.1 MERCADOS CUBIERTOS
2.2 ÁMBITO GEOGRÁFICO
2,3 AÑOS CONSIDERADOS PARA EL ESTUDIO
2.4 MONEDA Y PRECIOS
2.5 MODELO DE VALIDACIÓN DE DATOS TRÍPODE DBMR
2.6 MODELADO MULTIVARIADO
2.7 ENTREVISTAS PRINCIPALES CON LÍDERES DE OPINIÓN CLAVE
2.8 CUADRÍCULA DE POSICIÓN DE MERCADO DBMR
2.9 ANÁLISIS DE LA PARTICIPACIÓN DE LOS PROVEEDORES
2.1 CUADRÍCULA DE COBERTURA DE APLICACIONES DEL MERCADO
2.11 FUENTES SECUNDARIAS
2.12 SUPUESTOS
3 RESUMEN EJECUTIVO
4 INFORMACIÓN PREMIUM
4.1 ANÁLISIS PESTEL
4.1.1 FACTORES POLÍTICOS
4.1.2 FACTORES ECONÓMICOS
4.1.3 FACTORES SOCIALES
4.1.4 FACTORES TECNOLÓGICOS
4.1.5 FACTORES AMBIENTALES
4.1.6 FACTORES LEGALES
4.2 ANÁLISIS DE LAS CINCO FUERZAS DE PORTER
4.2.1 AMENAZA DE NUEVOS ENTRANTES
4.2.2 PODER DE NEGOCIACIÓN DE LOS PROVEEDORES
4.2.3 PODER DE NEGOCIACIÓN DE LOS COMPRADORES
4.2.4 AMENAZA DE PRODUCTOS SUSTITUTOS
4.2.5 RIVALIDAD EN LA INDUSTRIA
4.3 ESCENARIO DE IMPORTACIÓN Y EXPORTACIÓN
4.4 ANÁLISIS DE PRECIOS
4.4.1 COSTOS DE LA MATERIA PRIMA Y DINÁMICA DE LA CADENA DE SUMINISTRO
4.4.2 DEMANDA DEL MERCADO Y PREFERENCIAS DEL CONSUMIDOR
4.4.3 PANORAMA COMPETITIVO Y ESTRATEGIAS DE PRECIOS
4.4.4 AVANCES TECNOLÓGICOS Y EFICIENCIA DE PRODUCCIÓN
4.4.5 INFLUENCIAS REGULADORAS Y CONSIDERACIONES AMBIENTALES
4.5 ANÁLISIS DE LA CADENA DE VALOR
4.5.1 ABASTECIMIENTO DE MATERIA PRIMA
4.5.2 PROCESAMIENTO Y FABRICACIÓN
4.5.3 EMBALAJE Y ETIQUETADO
4.5.4 LOGÍSTICA DE DISTRIBUCIÓN Y CADENA DE FRÍO
4.5.5 CANALES DE COMERCIO MINORISTA Y SERVICIO DE ALIMENTACIÓN
4.6 CRITERIOS DE SELECCIÓN DE PROVEEDORES
4.6.1 CALIDAD Y CONSISTENCIA
4.6.2 EXPERIENCIA TÉCNICA
4.6.3 CONFIABILIDAD DE LA CADENA DE SUMINISTRO
4.6.4 CUMPLIMIENTO Y SOSTENIBILIDAD
4.6.5 ESTRUCTURA DE COSTOS Y PRECIOS
4.6.6 ESTABILIDAD FINANCIERA
4.6.7 FLEXIBILIDAD Y PERSONALIZACIÓN
4.6.8 GESTIÓN DE RIESGOS Y PLANES DE CONTINGENCIA
4.7 PERSPECTIVA DE LA MARCA
4.7.1 ANÁLISIS COMPARITIVO DE MARCAS DEL MERCADO DE MEZCLAS DE FRUTAS Y VERDURAS CONGELADAS DE AMÉRICA DEL NORTE
4.7.2 RESUMEN DEL PRODUCTO VS. MARCA
4.7.2.1 DESCRIPCIÓN GENERAL DEL PRODUCTO
4.7.2.2 DESCRIPCIÓN GENERAL DE LA MARCA
4.8 ESCENARIO DE CAMBIO CLIMÁTICO
4.8.1 PREOCUPACIONES AMBIENTALES
4.8.2 RESPUESTA DE LA INDUSTRIA
4.8.3 EL PAPEL DEL GOBIERNO
4.8.4 RECOMENDACIONES DE LOS ANALISTAS
4.9 COMPORTAMIENTO DE COMPRA DE LOS CONSUMIDORES
4.9.1 COMPRAS CONSCIENTES PARA LA SALUD
4.9.2 DECISIONES BASADAS EN LA CONVENIENCIA
4.9.3 CONCIENCIA DE PRECIO VS. CONCIENCIA DE VALOR
4.9.4 SOSTENIBILIDAD Y ABASTECIMIENTO ÉTICO
4.9.5 INFLUENCIA DIGITAL Y TRANSPARENCIA DE MARCA
4.1 DESGLOSE DEL ANÁLISIS DE COSTOS
4.11 ANÁLISIS DEL ECOSISTEMA INDUSTRIA
4.11.1 EMPRESAS DESTACADAS
4.11.2 PEQUEÑAS Y MEDIANAS EMPRESAS
4.11.3 USUARIOS FINALES
4.12 LOS ARANCELES DE EE. UU. (TRUMP) TENDRÁ UN IMPACTO EN LAS CADENAS DE SUMINISTRO. ¿SE DESVIARA LA CARGA CANADIENSE DE EE. UU. A PAÍSES EUROPEOS?
4.12.1 ARANCELES ESTADOUNIDENSES E INTERRUPCIÓN DE LA CADENA DE SUMINISTRO
4.12.2 LIMITACIONES AL DESVÍO DE LAS EXPORTACIONES CANADIENSES A EUROPA
4.13 ANÁLISIS DE PRODUCCIÓN Y CONSUMO
4.14 SEGUIMIENTO DE INNOVACIÓN Y ANÁLISIS ESTRATÉGICO
4.14.1 ANÁLISIS DE GRANDES ACUERDOS Y ALIANZAS ESTRATÉGICAS
4.14.1.1 EMPRESAS CONJUNTAS
4.14.1.2 FUSIONES Y ADQUISICIONES
4.14.1.3 LICENCIAS Y ASOCIACIONES
4.14.1.4 COLABORACIONES TECNOLÓGICAS
4.14.1.5 DESINVERSIONES ESTRATÉGICAS
4.14.2 NÚMERO DE PRODUCTOS EN DESARROLLO
4.14.3 ETAPA DE DESARROLLO
4.14.4 CRONOGRAMAS E HITOS
4.14.5 ESTRATEGIAS Y METODOLOGÍAS DE INNOVACIÓN
4.14.6 EVALUACIÓN Y MITIGACIÓN DE RIESGOS
4.14.7 PERSPECTIVAS FUTURAS
4.15 ESCENARIO DE MÁRGENES DE GANANCIA
4.15.1 RANGO DE MARGEN POR TIPO DE PRODUCTO
4.15.2 FACTORES CLAVE QUE INFLUYEN EN LOS MÁRGENES
4.15.3 MÁRGENES DEL MERCADO NACIONAL VS. DE EXPORTACIÓN
4.16 COBERTURA DE MATERIA PRIMA
4.16.1 MATERIAS PRIMAS CLAVE Y REGIONES DE CULTIVO
4.16.2 CADENA DE FRÍO E INFRAESTRUCTURA DE PROCESAMIENTO
4.16.3 ABASTECIMIENTO ORGÁNICO, NO OGM Y SOSTENIBILIDAD
4.16.4 DEPENDENCIA DE LAS IMPORTACIONES Y ABASTECIMIENTO DIVERSIFICADO
4.16.5 RIESGO CLIMÁTICO E INNOVACIONES AGRONÓMICAS
4.17 ANÁLISIS DE LA CADENA DE SUMINISTRO
4.17.1 DESCRIPCIÓN GENERAL
4.17.2 ESCENARIO DE COSTOS LOGÍSTICOS
4.17.3 IMPORTANCIA DE LOS PROVEEDORES DE SERVICIOS LOGÍSTICOS
4.18 AVANCES TECNOLÓGICOS
4.18.1 EVOLUCIÓN DE LA TECNOLOGÍA DE CONGELACIÓN RÁPIDA INDIVIDUAL (IQF)
4.18.2 IA Y VISIÓN ARTIFICIAL EN CLASIFICACIÓN Y CONTROL DE CALIDAD
4.18.3 MONITOREO DE LA CADENA DE FRÍO E INTEGRACIÓN DE IOT
4.18.4 INNOVACIONES EN EMBALAJES SOSTENIBLES
4.18.5 PRONÓSTICO DE LA DEMANDA Y GESTIÓN DEL INVENTARIO BASADOS EN DATOS
4.19 ANÁLISIS DE IMPORTACIONES DE CARGAS CONGELADAS, POR COSTA (FRUTAS Y VERDURAS CONGELADAS)
4.19.1 COSTA ESTE
4.19.2 COSTA OESTE
5 ARANCELES Y SU IMPACTO EN EL MERCADO
5.1 TASAS ARANCELARIAS ACTUALES EN LOS MERCADOS DE LOS PAÍSES PRINCIPALES
5.2 PERSPECTIVAS: PRODUCCIÓN LOCAL VS. DEPENDENCIA DE LAS IMPORTACIONES
5.3 DINÁMICA DE LOS CRITERIOS DE SELECCIÓN DE PROVEEDORES
5.4 IMPACTO EN LA CADENA DE SUMINISTRO
5.4.1 ADQUISICIÓN DE MATERIA PRIMA
5.4.2 FABRICACIÓN Y PRODUCCIÓN
5.4.3 LOGÍSTICA Y DISTRIBUCIÓN
5.4.4 PRECIOS DE LANZAMIENTO Y POSICIÓN DEL MERCADO
5.5 PARTICIPANTES DE LA INDUSTRIA: ACCIONES PROACTIVAS
5.5.1 OPTIMIZACIÓN DE LA CADENA DE SUMINISTRO
5.5.2 ESTABLECIMIENTOS DE EMPRESAS CONJUNTAS
5.6 IMPACTO EN LOS PRECIOS
5.7 INCLINACIÓN REGULADORA
5.7.1 SITUACIÓN GEOPOLÍTICA
5.7.2 ASOCIACIONES COMERCIALES ENTRE PAÍSES
5.7.2.1 TRATADOS DE LIBRE COMERCIO
5.7.2.2 ESTABLECIMIENTOS DE LA ALIANZA
5.7.3 ACREDITACIÓN DE ESTATUS (INCLUIDA LA NMF)
5.7.4 CURSO DE CORRECCIÓN DOMÉSTICA
5.7.4.1 ESQUEMAS DE INCENTIVOS PARA IMPULSAR LA PRODUCCIÓN
5.7.4.2 ESTABLECIMIENTO DE ZONAS ECONÓMICAS ESPECIALES / PARQUES INDUSTRIALES
6 COBERTURA REGULATORIA
7 DESCRIPCIÓN GENERAL DEL MERCADO
7.1 CONTROLADORES
7.1.1 LA CRECIENTE CONCIENCIA SOBRE LA SALUD IMPULSA LA DEMANDA DE OPCIONES NUTRITIVAS
7.1.2 LOS ESTILOS DE VIDA OCUPADOS AUMENTAN LA PREFERENCIA POR SOLUCIONES DE COMIDAS CONVENIENTES
7.1.3 LOS AVANCES EN LA TECNOLOGÍA DE CONGELACIÓN MEJORAN LA CONSERVACIÓN DE LA CALIDAD DEL PRODUCTO
7.2 RESTRICCIONES
7.2.1 PERCEPCIÓN DE QUE LOS ALIMENTOS CONGELADOS SON MENOS FRESCOS
7.2.2 LA FLUCTUACIÓN DE LOS PRECIOS DE LAS MATERIAS PRIMAS AFECTA LA ESTABILIDAD DE LA PRODUCCIÓN
7.3 OPORTUNIDADES
7.3.1 CRECIENTE DEMANDA DE BARRAS DE BATIDOS Y ZUMOS
7.3.2 EXPANSIÓN DE LAS PLATAFORMAS DE COMESTIBLES EN LÍNEA
7.3.3 MEZCLAS INNOVADORAS QUE SATISFACEN LAS PREFERENCIAS DE GUSTO CAMBIANTES DE LOS CONSUMIDORES
7.4 DESAFÍOS
7.4.1 LA LOGÍSTICA DE LA CADENA DE FRÍO REQUIERE DE ALTA INFRAESTRUCTURA E INVERSIÓN
7.4.2 PREOCUPACIONES SOBRE RESIDUOS Y SOSTENIBILIDAD
8 MERCADO DE MEZCLAS DE FRUTAS Y VERDURAS CONGELADAS DE AMÉRICA DEL NORTE, POR TIPO
8.1 DESCRIPCIÓN GENERAL
8.2 MEZCLAS DE VERDURAS
8.2.1 HORTALIZAS DE RAÍZ
8.2.2 VERDURAS DE HOJA VERDE
8.2.3 MEZCLAS DE CRUCÍFERAS
8.2.4 MEZCLAS DE SOLANES
8.2.5 MEZCLAS DE LEGUMINOSAS
8.2.6 MEZCLAS DE ALLIUM
8.2.7 MEZCLAS DE CALABAZA
8.2.8 OTROS
8.3 MEZCLAS DE FRUTAS
8.3.1 MEZCLA SOLO DE BAYAS
8.3.1.1 TRIPLE BAYAS
8.3.2 MEZCLA DE FRUTAS CÍTRICAS
8.3.2.1 FRUTAS CÍTRICAS
8.3.2.2 CÍTRICOS IQF
8.3.2.3 CÁSCARA DE CÍTRICOS
8.3.2.4 INCLUSIONES DE ZUMO DE CÍTRICOS EN CUBOS
8.3.3 MEZCLA A BASE DE MANZANA
8.3.4 MEZCLA DE FRUTAS TROPICALES
8.3.5 MEZCLA DE MELÓN (MELONES)
8.3.6 MEZCLA A BASE DE SANDÍA
8.3.7 MEZCLA DE FRUTAS DE HUESO
8.3.8 MEZCLA DE GRANADA
8.3.9 OTROS
8.4 MEZCLAS DE FRUTAS Y VERDURAS MIXTAS
8.4.1 MEZCLAS DE SMOOTHIES
8.4.2 MEZCLAS PARA ENSALADAS
8.4.3 MEZCLA PARA TAZÓN DE DESAYUNO
8.4.4 MEZCLAS DE ALIMENTOS PARA BEBÉS
8.4.5 MEZCLAS DE SUPERALIMENTOS
8.4.6 MEZCLAS DE TEMPORADA/VACACIONES
8.4.7 OTROS
9 MERCADO DE MEZCLAS DE FRUTAS Y VERDURAS CONGELADAS DE AMÉRICA DEL NORTE, POR TECNOLOGÍA
9.1 DESCRIPCIÓN GENERAL
9.2 Envasado individual rápido
9.3 CONGELADO
9.4 CONGELADO CRIOGÉNICO
9.5 CONGELACIÓN ISOCÓRICA
9.6 LECHO FLUIDIZADO
9.7 OTROS
10 MERCADO DE MEZCLAS DE FRUTAS Y VERDURAS CONGELADAS DE AMÉRICA DEL NORTE, POR CATEGORÍA DE PRODUCTO
10.1 DESCRIPCIÓN GENERAL
10.2 IQF CRUDO
10.3 BLANQUEADO AL VAPOR Y LUEGO IQF
10.4 ASADO Y LUEGO IQF
10.5 A LA PARRILLA Y LUEGO IQF
10.6 MARINADOS O RECUBIERTOS CONGELADOS
10.7 CRUDO CONGELADO
10.8 PRE-SAZONADO LUEGO IQF
10.8.1 MEZCLAS CONDIMENTADAS CON HIERBAS
10.8.2 MEZCLAS ESPECIADAS
10.8.3 CONDIMENTO DE INSPIRACIÓN ASIÁTICA
10.8.4 MEZCLA MEDITERRÁNEA
10.8.5 MEZCLAS PARA GLASEADOS DULCES
10.8.6 MEZCLA DE ESTILO INDIO
10.9 SALSA INCLUIDA MEZCLAS CONGELADAS,
10.1 PARBOILIZADO Y LUEGO CONGELADO
10.11 REHIDRATADO Y LUEGO CONGELADO
10.12 OTROS
11 MERCADO DE MEZCLAS DE FRUTAS Y VERDURAS CONGELADAS DE AMÉRICA DEL NORTE, POR FORMA
11.1 DESCRIPCIÓN GENERAL
11.2 ENTERO
11.3 REBANADO
11.4 CORTADO EN CUBOS
11.5 MITADES
11.6 PURÉ
11.7 PICADO
11.8 PURÉ
11.9 DESMORONADO
11.1 ESPIRALIZADO
11.11 EN JULIANA
11.12 APLASTADO
11.13 ENCANTADO
11.14 GRANULADO
11.15 RECUBIERTO
11.16 OTROS
12 MERCADO DE FRUTAS Y VERDURAS CONGELADAS MIXTAS DE AMÉRICA DEL NORTE, POR CATEGORÍA
12.1 DESCRIPCIÓN GENERAL
12.2 CONVENCIONAL
12.3 ORGÁNICO
13 MERCADO DE MEZCLAS DE FRUTAS Y VERDURAS CONGELADAS DE AMÉRICA DEL NORTE, POR FUENTE
13.1 DESCRIPCIÓN GENERAL
13.2 CONVENCIONAL
13.3 HIDROPÓNICO
13.4 AGRICULTURA REGENERATIVA DE ORIGEN
13.5 GRANJAS VERTICALES BASADAS
13.6 BIODINÁMICO
13.7 OTROS
14 MERCADO DE MEZCLAS DE FRUTAS Y VERDURAS CONGELADAS DE AMÉRICA DEL NORTE, POR ETIQUETADO Y CERTIFICACIÓN
14.1 DESCRIPCIÓN GENERAL
14.2 ETIQUETA LIMPIA
14.3 VERIFICADO SIN OMG
14.4 VEGANO
14.5 SIN GLUTEN
14.6 LIBRE DE PESTICIDAS
14.7 LIBRE DE ALÉRGENOS
14.8 KOSHER
14.9 Halal
14.1 CERTIFICADO DE COMERCIO JUSTO
14.11 OTROS
15 MERCADO DE MEZCLAS DE FRUTAS Y VERDURAS CONGELADAS DE AMÉRICA DEL NORTE, POR FORMATO DE ENVASE
15.1 DESCRIPCIÓN GENERAL
15.2 BOLSA
15.3 SELLADO AL VACÍO
15.4 PAQUETE INSTITUCIONAL A GRANEL
15.5 BANDEJA MULTICOMPARTIMENTO
15.6 BOLSA EN CAJA
15.7 CUBOS INDIVIDUALES
15.8 BOLSA A GRANEL PARA TIENDA DEL CLUB
15.9 PAQUETE DE LADRILLOS PARA VENTA AL POR MENOR
15.1 BOLSA CON VENTANA
15.11 TUBOS DE PLÁSTICO
16 MERCADO DE MEZCLAS DE FRUTAS Y VERDURAS CONGELADAS DE AMÉRICA DEL NORTE, POR TAMAÑO DE ENVASE
16.1 DESCRIPCIÓN GENERAL
16.2 TAMAÑOS DE ENVASES PARA VENTA AL POR MENOR
16.3 TAMAÑOS DE ENVASES PARA SERVICIOS DE ALIMENTOS/INSTITUCIONALES
17 MERCADO DE MEZCLAS DE FRUTAS Y VERDURAS CONGELADAS DE AMÉRICA DEL NORTE, POR VIDA ÚTIL
17.1 DESCRIPCIÓN GENERAL
17.2 9–12 MESES
17.3 6–9 MESES
17.4 12–15 MESES
17.5 15–24 MESES
17.6 24 MESES
17,7 ≤6 MESES
18 MERCADO DE MEZCLAS DE FRUTAS Y VERDURAS CONGELADAS DE AMÉRICA DEL NORTE, POR APLICACIÓN
18.1 DESCRIPCIÓN GENERAL
18.2 USO POR PARTE DEL CONSUMIDOR MINORISTA
18.3 SERVICIO DE ALIMENTACIÓN (HORECA)
18.4 INDUSTRIA DE SERVICIOS DE ALIMENTOS
18.5 EMPRESAS DE KITS DE COMIDA
18.6 FABRICANTES DE ALIMENTOS PARA BEBÉS
18.7 COCINAS INSTITUCIONALES
18.8 FABRICANTES DE SUPLEMENTOS NUTRICIONALES
18.9 PAQUETES COMBINADOS FRESCOS CONGELADOS AL POR MENOR
18.1 OTROS
19 MERCADO DE FRUTAS Y VERDURAS CONGELADAS MIXTAS DE AMÉRICA DEL NORTE, POR CANAL DE DISTRIBUCIÓN
19.1 DESCRIPCIÓN GENERAL
19.2 B2B
19.2.1 BASADO EN TIENDA
19.2.2 SIN TIENDA
19.3 B2C
20 MERCADO DE MEZCLAS DE FRUTAS Y VERDURAS CONGELADAS DE AMÉRICA DEL NORTE POR PAÍSES
20.1 RESUMEN
20.1.1 EE. UU.
20.1.2 CANADÁ
20.1.3 MÉXICO
21 MERCADO DE MEZCLAS DE FRUTAS Y VERDURAS CONGELADAS DE AMÉRICA DEL NORTE: PANORAMA DE LA EMPRESA
21.1 ANÁLISIS DE ACCIONES DE LA EMPRESA: AMÉRICA DEL NORTE
22 ANÁLISIS FODA
23 PERFILES DE EMPRESAS FABRICANTES
23.1 COMPAÑÍA JR SIMPLOT.
23.1.1 INSTANTÁNEA DE LA EMPRESA
23.1.2 PORTAFOLIO DE PRODUCTOS
23.1.3 DESARROLLO RECIENTE
23.2 SUNOPTA
23.2.1 INSTANTÁNEA DE LA EMPRESA
23.2.2 ANÁLISIS DE INGRESOS
23.2.3 PORTAFOLIO DE PRODUCTOS
23.2.4 DESARROLLO RECIENTE
23.3 ALASKA
23.3.1 INSTANTÁNEA DE LA EMPRESA
23.3.2 PORTAFOLIO DE PRODUCTOS
23.3.3 DESARROLLO RECIENTE
23.4 GRANJAS DE LA ISLA STAHLBUSH.
23.4.1 INSTANTÁNEA DE LA EMPRESA
23.4.2 PORTAFOLIO DE PRODUCTOS
23.4.3 ACTUALIZACIONES RECIENTES
23.5 VERDEO
23.5.1 INSTANTÁNEA DE LA EMPRESA
23.5.2 INFORMACIÓN FINANCIERA RECIENTE
23.5.3 PORTAFOLIO DE PRODUCTOS
23.5.4 ACTUALIZACIONES RECIENTES
23.6 ARDO
23.6.1 INSTANTÁNEA DE LA EMPRESA
23.6.2 PORTAFOLIO DE PRODUCTOS
23.6.3 DESARROLLOS RECIENTES
23.7 DOLE PACKAGED FOODS, LLC
23.7.1 INSTANTÁNEA DE LA EMPRESA
23.7.2 PORTAFOLIO DE PRODUCTOS
23.7.3 DESARROLLO RECIENTE
23.8 GRANJA TERRESTRE
23.8.1 INSTANTÁNEA DE LA EMPRESA
23.8.2 PORTAFOLIO DE PRODUCTOS
23.8.3 DESARROLLOS RECIENTES
23.9 FRUTA DE ORO
23.9.1 INSTANTÁNEA DE LA EMPRESA
23.9.2 PORTAFOLIO DE PRODUCTOS
23.9.3 DESARROLLO RECIENTE
23.1 PRODUCTOS DE FRUTAS MILNE, INC.
23.10.1 INSTANTÁNEA DE LA EMPRESA
23.10.2 PORTAFOLIO DE PRODUCTOS
23.10.3 DESARROLLO RECIENTE
23.11 EL TOQUE DE LA NATURALEZA
23.11.1 INSTANTÁNEA DE LA EMPRESA
23.11.2 PORTAFOLIO DE PRODUCTOS
23.11.3 DESARROLLO RECIENTE
23.12 COMPAÑÍA FRUTAL DE OREGÓN
23.12.1 INSTANTÁNEA DE LA EMPRESA
23.12.2 PORTAFOLIO DE PRODUCTOS
23.12.3 DESARROLLO RECIENTE
23.13 PRODUCTORES DE LA COSTA DEL PACÍFICO
23.13.1 INSTANTÁNEA DE LA EMPRESA
23.13.2 PORTAFOLIO DE PRODUCTOS
23.13.3 DESARROLLO RECIENTE
23.14 COMPAÑÍA DE FRUTAS ESCÉNICAS
23.14.1 INSTANTÁNEA DE LA EMPRESA
23.14.2 PORTAFOLIO DE PRODUCTOS
23.14.3 ACTUALIZACIONES RECIENTES
23.15 TITAN FRUTA CONGELADA
23.15.1 INSTANTÁNEA DE LA EMPRESA
23.15.2 PORTAFOLIO DE PRODUCTOS
23.15.3 ACONTECIMIENTOS RECIENTES
23.16 ALIMENTOS CONGELADOS WAWONA
23.16.1 INSTANTÁNEA DE LA EMPRESA
23.16.2 PORTAFOLIO DE PRODUCTOS
23.16.3 ACONTECIMIENTOS RECIENTES
23.17 WYMAN'S
23.17.1 INSTANTÁNEA DE LA EMPRESA
23.17.2 PORTAFOLIO DE PRODUCTOS
23.17.3 DESARROLLO RECIENTE
24 PERFILES DE EMPRESAS DISTRIBUIDORES
24.1 PRODUCTOS DE LA ZONA SOLAR COSTERA
24.1.1 INSTANTÁNEA DE LA EMPRESA
24.1.2 PORTAFOLIO DE PRODUCTOS
24.1.3 DESARROLLO RECIENTE
24.2 ALIMENTOS DOT
24.2.1 INSTANTÁNEA DE LA EMPRESA
24.2.2 PORTAFOLIO DE PRODUCTOS
24.2.3 DESARROLLO RECIENTE
24.3 CONSIGA PRODUCTOS FRESCOS
24.3.1 INSTANTÁNEA DE LA EMPRESA
24.3.2 PORTAFOLIO DE PRODUCTOS
24.3.3 DESARROLLO RECIENTE
24.4 SERVICIO DE ALIMENTOS GORDON
24.4.1 INSTANTÁNEA DE LA EMPRESA
24.4.2 PORTAFOLIO DE PRODUCTOS
24.4.3 DESARROLLO RECIENTE
24.5 KEHE DISTRIBUIDORES LLC
24.5.1 INSTANTÁNEA DE LA EMPRESA
24.5.2 PORTAFOLIO DE PRODUCTOS
24.5.3 DESARROLLO RECIENTE
24.6 ROBINSON
24.6.1 INSTANTÁNEA DE LA EMPRESA
24.6.2 PORTAFOLIO DE PRODUCTOS
24.6.3 DESARROLLO RECIENTE
24.7 CAPA DE NIEVE LTD.
24.7.1 INSTANTÁNEA DE LA EMPRESA
24.7.2 PORTAFOLIO DE PRODUCTOS
24.7.3 DESARROLLO RECIENTE
24.8 CORPORACIÓN SYSCO
24.8.1 INSTANTÁNEA DE LA EMPRESA
24.8.2 ANÁLISIS DE INGRESOS
24.8.3 PORTAFOLIO DE PRODUCTOS
24.8.4 DESARROLLO RECIENTE
24.9 UNFI
24.9.1 INSTANTÁNEA DE LA EMPRESA
24.9.2 ANÁLISIS DE INGRESOS
24.9.3 PORTAFOLIO DE PRODUCTOS
24.9.4 DESARROLLO RECIENTE
24.1 Alimentos de EE. UU. INC.
24.10.1 INSTANTÁNEA DE LA EMPRESA
24.10.2 ANÁLISIS DE INGRESOS
24.10.3 PORTAFOLIO DE PRODUCTOS
24.10.4 DESARROLLO RECIENTE
25 CUESTIONARIO
26 INFORMES RELACIONADOS
Lista de Tablas
CUADRO 1 COBERTURA REGULATORIA
TABLA 2 MERCADO DE MEZCLAS DE FRUTAS Y VERDURAS CONGELADAS DE AMÉRICA DEL NORTE, POR TIPO, 2018-2032 (MILES DE USD)
CUADRO 3 MERCADO DE FRUTAS Y VERDURAS CONGELADAS DE AMÉRICA DEL NORTE, POR TIPO, 2018-2032 (MILES DE TONELADAS)
TABLA 4 MEZCLAS DE VEGETALES EN EL MERCADO DE FRUTAS Y VEGETALES CONGELADOS DE AMÉRICA DEL NORTE, POR TIPO, 2018-2032 (MILES DE TONELADAS)
TABLA 5 HORTALIZAS DE RAÍZ EN EL MERCADO DE MEZCLAS DE FRUTAS Y HORTALIZAS CONGELADAS DE AMÉRICA DEL NORTE, POR TIPO, 2018-2032 (MILES DE USD)
TABLA 6 HORTALIZAS DE HOJA VERDE EN EL MERCADO DE MEZCLAS DE FRUTAS Y VERDURAS CONGELADAS DE AMÉRICA DEL NORTE, POR TIPO, 2018-2032 (MILES DE USD)
TABLA 7 MEZCLAS DE CRUCÍFERAS EN EL MERCADO DE MEZCLAS DE FRUTAS Y VERDURAS CONGELADAS DE AMÉRICA DEL NORTE, POR TIPO, 2018-2032 (MILES DE USD)
TABLA 8 MEZCLAS DE SOLANES EN EL MERCADO DE FRUTAS Y VERDURAS CONGELADAS DE AMÉRICA DEL NORTE, POR TIPO, 2018-2032 (MILES DE USD)
TABLA 9 MEZCLAS DE LEGUMINOSAS EN EL MERCADO DE FRUTAS Y VERDURAS CONGELADAS DE AMÉRICA DEL NORTE, POR TIPO, 2018-2032 (MILES DE USD)
TABLA 10 MEZCLAS DE ALLIUM EN EL MERCADO DE FRUTAS Y VERDURAS CONGELADAS DE AMÉRICA DEL NORTE, POR TIPO, 2018-2032 (MILES DE USD)
TABLA 11 MEZCLAS DE CALABAZA EN EL MERCADO DE FRUTAS Y VERDURAS CONGELADAS DE AMÉRICA DEL NORTE, POR TIPO, 2018-2032 (MILES DE USD)
TABLA 12 MEZCLAS DE FRUTAS EN EL MERCADO DE MEZCLAS DE FRUTAS Y VERDURAS CONGELADAS DE AMÉRICA DEL NORTE, POR TIPO, 2018-2032 (MILES DE USD)
TABLA 13 MERCADO DE FRUTAS Y VERDURAS CONGELADAS SOLO CON MEZCLA DE BERRIES EN AMÉRICA DEL NORTE, POR TIPO, 2018-2032 (MILES DE USD)
TABLA 14 MERCADO DE FRUTAS Y VERDURAS CONGELADAS DE TRIPLE BERRY EN AMÉRICA DEL NORTE, POR TIPO, 2018-2032 (MILES DE USD)
TABLA 15 MEZCLA DE FRUTAS CÍTRICAS EN EL MERCADO DE MEZCLAS DE FRUTAS Y VERDURAS CONGELADAS DE AMÉRICA DEL NORTE, POR TIPO, 2018-2032 (MILES DE USD)
CUADRO 16 MERCADO DE FRUTAS CÍTRICAS EN MEZCLA DE FRUTAS Y VERDURAS CONGELADAS DE AMÉRICA DEL NORTE, POR TIPO, 2018-2032 (MILES DE USD)
TABLA 17 MERCADO DE CÍTRICOS IQF EN MEZCLA DE FRUTAS Y VERDURAS CONGELADAS DE AMÉRICA DEL NORTE, POR TIPO, 2018-2032 (MILES DE USD)
CUADRO 18 MERCADO DE CÁSCARA DE CÍTRICOS EN MEZCLAS DE FRUTAS Y VERDURAS CONGELADAS DE AMÉRICA DEL NORTE, POR TIPO, 2018-2032 (MILES DE USD)
CUADRO 19 INCLUSIONES DE JUGO DE CÍTRICOS EN CUBOS EN EL MERCADO DE MEZCLAS DE FRUTAS Y VERDURAS CONGELADAS DE AMÉRICA DEL NORTE, POR TIPO, 2018-2032 (MILES DE USD)
TABLA 20 MEZCLA A BASE DE MANZANA EN EL MERCADO DE MEZCLAS DE FRUTAS Y VERDURAS CONGELADAS DE AMÉRICA DEL NORTE, POR TIPO, 2018-2032 (MILES DE USD)
CUADRO 21 MEZCLA DE FRUTAS TROPICALES DE AMÉRICA DEL NORTE EN EL MERCADO DE MEZCLAS DE FRUTAS Y VERDURAS CONGELADAS, POR TIPO, 2018-2032 (MILES DE USD)
TABLA 22 MEZCLA DE FRUTAS DE HUESO DE AMÉRICA DEL NORTE EN EL MERCADO DE MEZCLAS DE FRUTAS Y VERDURAS CONGELADAS, POR TIPO, 2018-2032 (MILES DE USD)
TABLA 23 MEZCLA DE GRANADA EN EL MERCADO DE FRUTAS Y VERDURAS CONGELADAS DE AMÉRICA DEL NORTE, POR TIPO, 2018-2032 (MILES DE USD)
TABLA 24 MEZCLAS DE FRUTAS Y VERDURAS MIXTAS EN AMÉRICA DEL NORTE EN EL MERCADO DE MEZCLAS DE FRUTAS Y VERDURAS CONGELADAS, POR TIPO, 2018-2032 (MILES DE USD)
TABLA 25 MEZCLAS DE SMOOTHIES EN EL MERCADO DE FRUTAS Y VERDURAS CONGELADAS DE AMÉRICA DEL NORTE, POR TIPO, 2018-2032 (MILES DE USD)
TABLA 26 MEZCLAS PARA ENSALADAS EN EL MERCADO DE FRUTAS Y VERDURAS CONGELADAS DE AMÉRICA DEL NORTE, POR TIPO, 2018-2032 (MILES DE USD)
TABLA 27 MEZCLA PARA DESAYUNO EN EL MERCADO DE MEZCLAS DE FRUTAS Y VERDURAS CONGELADAS DE AMÉRICA DEL NORTE, POR TIPO, 2018-2032 (MILES DE USD)
TABLA 28 MEZCLAS DE ALIMENTOS INFANTILES EN EL MERCADO DE FRUTAS Y VERDURAS CONGELADAS DE AMÉRICA DEL NORTE, POR TIPO, 2018-2032 (MILES DE USD)
TABLA 29 MEZCLAS DE SUPERALIMENTOS EN EL MERCADO DE MEZCLAS DE FRUTAS Y VERDURAS CONGELADAS DE AMÉRICA DEL NORTE, POR TIPO, 2018-2032 (MILES DE USD)
TABLA 30 MEZCLAS DE FRUTAS Y VERDURAS CONGELADAS DE TEMPORADA/FESTIVOS EN EL MERCADO DE AMÉRICA DEL NORTE, POR TIPO, 2018-2032 (MILES DE USD)
CUADRO 31 MERCADO DE FRUTAS Y VEGETALES CONGELADOS DE AMÉRICA DEL NORTE, POR TIPO DE CULTIVO, 2018-2032 (MILES DE USD)
CUADRO 32 MERCADO DE MEZCLAS DE FRUTAS Y VERDURAS CONGELADAS DE AMÉRICA DEL NORTE, POR CATEGORÍA DE PRODUCTO, 2018-2032 (MILES DE USD)
TABLA 33 MERCADO DE FRUTAS Y VEGETALES CONGELADOS PRE-SAÑADOS Y LUEGO IQF EN MEZCLA DE AMÉRICA DEL NORTE, POR CATEGORÍA DE PRODUCTO, 2018-2032 (MILES DE USD)
TABLA 34 MEZCLAS DE HIERBAS CONDIMENTADAS EN EL MERCADO DE MEZCLAS DE FRUTAS Y VERDURAS CONGELADAS DE AMÉRICA DEL NORTE, POR CATEGORÍA DE PRODUCTO, 2018-2032 (MILES DE USD)
TABLA 35 MEZCLAS ESPECIADAS DE AMÉRICA DEL NORTE EN EL MERCADO DE MEZCLAS DE FRUTAS Y VERDURAS CONGELADAS, POR CATEGORÍA DE PRODUCTO, 2018-2032 (MILES DE USD)
TABLA 36 MERCADO DE CONDIMENTOS DE INSPIRACIÓN ASIÁTICA EN MEZCLAS DE FRUTAS Y VERDURAS CONGELADAS DE AMÉRICA DEL NORTE, POR CATEGORÍA DE PRODUCTO, 2018-2032 (MILES DE USD)
TABLA 37 MEZCLA MEDITERRÁNEA EN EL MERCADO DE FRUTAS Y VERDURAS CONGELADAS, POR CATEGORÍA DE PRODUCTO, 2018-2032 (MILES DE USD)
TABLA 38 MEZCLAS DE FRUTAS Y VERDURAS CONGELADAS EN EL MERCADO DE MEZCLAS DE FRUTAS Y VERDURAS CONGELADAS DE AMÉRICA DEL NORTE, POR CATEGORÍA DE PRODUCTO, 2018-2032 (MILES DE USD)
TABLA 39 MEZCLA DE FRUTAS Y VERDURAS CONGELADAS AL ESTILO INDIO DE AMÉRICA DEL NORTE, POR CATEGORÍA DE PRODUCTO, 2018-2032 (MILES DE USD)
TABLA 40 MERCADO DE FRUTAS Y VERDURAS CONGELADAS DE AMÉRICA DEL NORTE, POR FORMA, 2018-2032 (MILES DE USD)
CUADRO 41 MERCADO DE FRUTAS Y VERDURAS CONGELADAS DE AMÉRICA DEL NORTE, POR CATEGORÍA, 2018-2032 (MILES DE USD)
CUADRO 42 MERCADO DE MEZCLAS DE FRUTAS Y VERDURAS CONGELADAS DE AMÉRICA DEL NORTE, POR FUENTE, 2018-2032 (MILES DE USD)
TABLA 43 MERCADO DE FRUTAS Y VERDURAS CONGELADAS EN AMÉRICA DEL NORTE, POR ETIQUETADO Y CERTIFICACIÓN, 2018-2032 (MILES DE USD)
TABLA 44 MERCADO DE FRUTAS Y VERDURAS CONGELADAS MIXTAS DE AMÉRICA DEL NORTE, POR FORMATO DE ENVASE, 2018-2032 (MILES DE USD)
TABLA 45 MERCADO DE MEZCLAS DE FRUTAS Y VERDURAS CONGELADAS EN BOLSA DE AMÉRICA DEL NORTE, POR FORMATO DE ENVASE, 2018-2032 (MILES DE USD)
TABLA 46 MERCADO DE FRUTAS Y VERDURAS CONGELADAS MIXTAS DE AMÉRICA DEL NORTE, POR TAMAÑO DE ENVASE, 2018-2032 (MILES DE USD)
TABLA 47 TAMAÑOS DE ENVASES PARA LA VENTA AL POR MENOR EN AMÉRICA DEL NORTE EN EL MERCADO DE MEZCLAS DE FRUTAS Y VERDURAS CONGELADAS, POR FORMATO DE ENVASE, 2018-2032 (MILES DE USD)
TABLA 48 TAMAÑOS DE ENVASE EN EL MERCADO DE MEZCLAS DE FRUTAS Y VERDURAS CONGELADAS DE AMÉRICA DEL NORTE PARA SERVICIOS DE ALIMENTOS/INSTITUCIONES, POR FORMATO DE ENVASE, 2018-2032 (MILES DE USD)
TABLA 49 MERCADO DE MEZCLAS DE FRUTAS Y VERDURAS CONGELADAS DE AMÉRICA DEL NORTE, POR VIDA ÚTIL, 2018-2032 (MILES DE USD)
CUADRO 50 MERCADO DE MEZCLAS DE FRUTAS Y VERDURAS CONGELADAS DE AMÉRICA DEL NORTE, POR APLICACIÓN, 2018-2032 (MILES DE USD)
TABLA 51 SERVICIO DE ALIMENTACIÓN EN AMÉRICA DEL NORTE EN EL MERCADO DE MEZCLAS DE FRUTAS Y VERDURAS CONGELADAS, POR APLICACIÓN, 2018-2032 (MILES DE USD)
TABLA 52 INDUSTRIA DE SERVICIOS DE ALIMENTOS EN AMÉRICA DEL NORTE EN EL MERCADO DE MEZCLAS DE FRUTAS Y VERDURAS CONGELADAS, POR APLICACIÓN, 2018-2032 (MILES DE USD)
TABLA 53 COCINAS INSTITUCIONALES DE AMÉRICA DEL NORTE EN EL MERCADO DE MEZCLAS DE FRUTAS Y VERDURAS CONGELADAS, POR APLICACIÓN, 2018-2032 (MILES DE USD)
TABLA 54 FABRICANTES DE SUPLEMENTOS NUTRICIONALES DE AMÉRICA DEL NORTE EN EL MERCADO DE MEZCLAS DE FRUTAS Y VERDURAS CONGELADAS, POR APLICACIÓN, 2018-2032 (MILES DE USD)
TABLA 55 MERCADO DE FRUTAS Y VERDURAS CONGELADAS DE AMÉRICA DEL NORTE, POR CANAL DE DISTRIBUCIÓN, 2018-2032 (MILES DE USD)
TABLA 56 MERCADO DE MEZCLAS DE FRUTAS Y VERDURAS CONGELADAS EN TIENDAS DE AMÉRICA DEL NORTE, POR CANAL DE DISTRIBUCIÓN, 2018-2032 (MILES DE USD)
TABLA 57 MERCADO DE MEZCLAS DE FRUTAS Y VERDURAS CONGELADAS SIN TIENDAS EN AMÉRICA DEL NORTE, POR CANAL DE DISTRIBUCIÓN, 2018-2032 (MILES DE USD)
TABLA 58 MERCADO DE FRUTAS Y VERDURAS CONGELADAS EN AMÉRICA DEL NORTE, POR PAÍS, 2018-2032 (MILES DE USD)
CUADRO 59 MERCADO DE MEZCLAS DE FRUTAS Y VERDURAS CONGELADAS DE AMÉRICA DEL NORTE, POR PAÍS, 2018-2032 (TONELADAS)
TABLA 60 MERCADO DE FRUTAS Y VERDURAS CONGELADAS DE EE. UU., POR TIPO, 2018-2032 (MILES DE USD)
TABLA 61 MERCADO DE FRUTAS Y VERDURAS CONGELADAS DE EE. UU., POR TIPO, 2018-2032 (TONELADAS)
TABLA 62 MEZCLAS DE VEGETALES ESTADOUNIDENSES EN EL MERCADO DE MEZCLAS DE FRUTAS Y VEGETALES CONGELADOS, POR TIPO, 2018-2032 (MILES DE USD)
TABLA 63 HORTALIZAS DE RAÍZ ESTADOUNIDENSES EN EL MERCADO DE MEZCLAS DE FRUTAS Y HORTALIZAS CONGELADAS, POR TIPO, 2018-2032 (MILES DE USD)
TABLA 64 VEGETALES DE HOJA VERDE DE EE. UU. EN EL MERCADO DE MEZCLAS DE FRUTAS Y VERDURAS CONGELADAS, POR TIPO, 2018-2032 (MILES DE USD)
TABLA 65 MEZCLAS DE CRUCÍFERAS DE EE. UU. EN EL MERCADO DE MEZCLAS DE FRUTAS Y VERDURAS CONGELADAS, POR TIPO, 2018-2032 (MILES DE USD)
TABLA 66 MEZCLAS DE SOLANAS DE EE. UU. EN EL MERCADO DE MEZCLAS DE FRUTAS Y VERDURAS CONGELADAS, POR TIPO, 2018-2032 (MILES DE USD)
TABLA 67 MEZCLAS DE LEGUMINOSAS DE EE. UU. EN EL MERCADO DE MEZCLAS DE FRUTAS Y VERDURAS CONGELADAS, POR TIPO, 2018-2032 (MILES DE USD)
TABLA 68 MEZCLAS DE ALLIUM DE EE. UU. EN EL MERCADO DE MEZCLAS DE FRUTAS Y VERDURAS CONGELADAS, POR TIPO, 2018-2032 (MILES DE USD)
TABLA 69 MEZCLAS DE CALABAZA ESTADOUNIDENSES EN EL MERCADO DE MEZCLAS DE FRUTAS Y VERDURAS CONGELADAS, POR TIPO, 2018-2032 (MILES DE USD)
TABLA 70 MEZCLAS DE FRUTAS ESTADOUNIDENSES EN EL MERCADO DE MEZCLAS DE FRUTAS Y VERDURAS CONGELADAS, POR TIPO, 2018-2032 (MILES DE USD)
TABLA 71 MEZCLAS DE FRUTAS Y VERDURAS CONGELADAS SOLO EN ESTADOS UNIDOS, POR TIPO, 2018-2032 (MILES DE USD)
TABLA 72 MERCADO DE FRUTAS Y VERDURAS CONGELADAS DE TRIPLE BERRY DE EE. UU., POR TIPO, 2018-2032 (MILES DE USD)
TABLA 73 MEZCLA DE FRUTAS CÍTRICAS ESTADOUNIDENSES EN EL MERCADO DE MEZCLAS DE FRUTAS Y VERDURAS CONGELADAS, POR TIPO, 2018-2032 (MILES DE USD)
TABLA 74 FRUTAS CÍTRICAS ESTADOUNIDENSES EN EL MERCADO DE MEZCLAS DE FRUTAS Y VERDURAS CONGELADAS, POR TIPO, 2018-2032 (MILES DE USD)
TABLA 75 SEGMENTOS DE CÍTRICOS IQF DE EE. UU. EN EL MERCADO DE MEZCLAS DE FRUTAS Y VERDURAS CONGELADAS, POR TIPO, 2018-2032 (MILES DE USD)
TABLA 76 MERCADO DE CÁSCARA DE CÍTRICOS DE EE. UU. EN MEZCLA DE FRUTAS Y VERDURAS CONGELADAS, POR TIPO, 2018-2032 (MILES DE USD)
TABLA 77 INCLUSIONES DE JUGO DE CÍTRICOS ESTADOUNIDENSES EN CUBOS EN EL MERCADO DE MEZCLAS DE FRUTAS Y VERDURAS CONGELADAS, POR TIPO, 2018-2032 (MILES DE USD)
TABLA 78 MEZCLA A BASE DE MANZANA EN EL MERCADO DE FRUTAS Y VERDURAS CONGELADAS DE EE. UU., POR TIPO, 2018-2032 (MILES DE USD)
TABLA 79 MEZCLA DE FRUTAS TROPICALES DE EE. UU. EN EL MERCADO DE MEZCLAS DE FRUTAS Y VERDURAS CONGELADAS, POR TIPO, 2018-2032 (MILES DE USD)
TABLA 80 MEZCLA DE FRUTAS DE HUESO ESTADOUNIDENSES EN EL MERCADO DE MEZCLAS DE FRUTAS Y VERDURAS CONGELADAS, POR TIPO, 2018-2032 (MILES DE USD)
TABLA 81 MEZCLA DE GRANADA ESTADOUNIDENSE EN EL MERCADO DE MEZCLAS DE FRUTAS Y VERDURAS CONGELADAS, POR TIPO, 2018-2032 (MILES DE USD)
TABLA 82 MEZCLAS DE FRUTAS Y VERDURAS MIXTAS DE EE. UU. EN EL MERCADO DE MEZCLAS DE FRUTAS Y VERDURAS CONGELADAS, POR TIPO, 2018-2032 (MILES DE USD)
TABLA 83 MEZCLAS DE SMOOTHIES DE EE. UU. EN EL MERCADO DE MEZCLAS DE FRUTAS Y VERDURAS CONGELADAS, POR TIPO, 2018-2032 (MILES DE USD)
TABLA 84 MEZCLAS DE ENSALADAS DE EE. UU. EN EL MERCADO DE MEZCLAS DE FRUTAS Y VERDURAS CONGELADAS, POR TIPO, 2018-2032 (MILES DE USD)
TABLA 85 MEZCLAS PARA DESAYUNO EN EL MERCADO DE FRUTAS Y VERDURAS CONGELADAS, POR TIPO, 2018-2032 (MILES DE USD)
TABLA 86 MEZCLAS DE ALIMENTOS PARA BEBÉS EN EL MERCADO DE FRUTAS Y VERDURAS CONGELADAS DE EE. UU., POR TIPO, 2018-2032 (MILES DE USD)
TABLA 87 MEZCLAS DE SUPERALIMENTOS DE EE. UU. EN EL MERCADO DE MEZCLAS DE FRUTAS Y VERDURAS CONGELADAS, POR TIPO, 2018-2032 (MILES DE USD)
TABLA 88 MEZCLAS DE FRUTAS Y VERDURAS CONGELADAS DE TEMPORADA/FESTIVOS DE EE. UU., POR TIPO, 2018-2032 (MILES DE USD)
TABLA 89 MERCADO ESTADOUNIDENSE DE MEZCLAS DE FRUTAS Y VERDURAS CONGELADAS, POR TECNOLOGÍA, 2018-2032 (MILES DE USD)
TABLA 90 MERCADO ESTADOUNIDENSE DE MEZCLAS DE FRUTAS Y VERDURAS CONGELADAS, POR CATEGORÍA DE PRODUCTO, 2018-2032 (MILES DE USD)
TABLA 91 MERCADO DE FRUTAS Y VEGETALES CONGELADOS PRE-SAZONADOS Y LUEGO IQF, POR CATEGORÍA DE PRODUCTO, 2018-2032 (MILES DE USD)
TABLA 92 MEZCLAS DE FRUTAS Y VERDURAS CONGELADAS CON HIERBAS DE EE. UU. EN EL MERCADO DE MEZCLAS DE FRUTAS Y VERDURAS CONGELADAS, POR CATEGORÍA DE PRODUCTO, 2018-2032 (MILES DE USD)
TABLA 93 MEZCLAS ESPECIADAS DE EE. UU. EN EL MERCADO DE MEZCLAS DE FRUTAS Y VERDURAS CONGELADAS, POR CATEGORÍA DE PRODUCTO, 2018-2032 (MILES DE USD)
TABLA 94 CONDIMENTOS DE INSPIRACIÓN ASIÁTICA EN EL MERCADO DE MEZCLAS DE FRUTAS Y VERDURAS CONGELADAS, POR CATEGORÍA DE PRODUCTO, 2018-2032 (MILES DE USD)
TABLA 95 MEZCLA MEDITERRÁNEA DE EE. UU. EN EL MERCADO DE MEZCLAS DE FRUTAS Y VERDURAS CONGELADAS, POR CATEGORÍA DE PRODUCTO, 2018-2032 (MILES DE USD)
TABLA 96 MEZCLAS DE FRUTAS Y VERDURAS CONGELADAS DULCES EN EL MERCADO DE MEZCLAS DE FRUTAS Y VERDURAS CONGELADAS DE EE. UU., POR CATEGORÍA DE PRODUCTO, 2018-2032 (MILES DE USD)
TABLA 97 MEZCLA DE ESTILO INDIO DE EE. UU. EN EL MERCADO DE MEZCLAS DE FRUTAS Y VERDURAS CONGELADAS, POR CATEGORÍA DE PRODUCTO, 2018-2032 (MILES DE USD)
TABLA 98 MERCADO ESTADOUNIDENSE DE MEZCLAS DE FRUTAS Y VERDURAS CONGELADAS, POR FORMA, 2018-2032 (MILES DE USD)
TABLA 99 MERCADO ESTADOUNIDENSE DE MEZCLAS DE FRUTAS Y VERDURAS CONGELADAS, POR CATEGORÍA, 2018-2032 (MILES DE USD)
TABLA 100 MERCADO DE FRUTAS Y VERDURAS CONGELADAS DE EE. UU., POR FUENTE, 2018-2032 (MILES DE USD)
TABLA 101 MERCADO DE FRUTAS Y VERDURAS CONGELADAS EN EE. UU., POR ETIQUETADO Y CERTIFICACIÓN, 2018-2032 (MILES DE USD)
TABLA 102 MERCADO DE FRUTAS Y VERDURAS CONGELADAS DE EE. UU., POR FORMATO DE ENVASE, 2018-2032 (MILES DE USD)
TABLA 103 BOLSAS ESTADOUNIDENSES EN EL MERCADO DE MEZCLAS DE FRUTAS Y VERDURAS CONGELADAS, POR FORMATO DE ENVASE, 2018-2032 (MILES DE USD)
TABLA 104 MERCADO DE FRUTAS Y VERDURAS CONGELADAS DE EE. UU., POR TAMAÑO DE ENVASE, 2018-2032 (MILES DE USD)
TABLA 105 TAMAÑOS DE ENVASES PARA LA VENTA AL POR MENOR EN EE. UU. EN EL MERCADO DE MEZCLAS DE FRUTAS Y VERDURAS CONGELADAS, POR TAMAÑO DE ENVASE, 2018-2032 (MILES DE USD)
TABLA 106 TAMAÑOS DE ENVASE EN EL MERCADO DE MEZCLAS DE FRUTAS Y VERDURAS CONGELADAS DE EE. UU./INSTITUCIONALES, POR TAMAÑO DE ENVASE, 2018-2032 (MILES DE USD)
TABLA 107 MERCADO DE FRUTAS Y VERDURAS CONGELADAS EN EE. UU., POR VIDA ÚTIL, 2018-2032 (MILES DE USD)
TABLA 108 MERCADO DE MEZCLAS DE FRUTAS Y VERDURAS CONGELADAS DE EE. UU., POR APLICACIÓN, 2018-2032 (MILES DE USD)
TABLA 109 SERVICIO DE ALIMENTACIÓN (HORECA) EN EE. UU. EN EL MERCADO DE MEZCLAS DE FRUTAS Y VERDURAS CONGELADAS, POR APLICACIÓN, 2018-2032 (MILES DE USD)
TABLA 110 INDUSTRIA DE SERVICIOS DE ALIMENTOS DE EE. UU. EN EL MERCADO DE MEZCLAS DE FRUTAS Y VERDURAS CONGELADAS, POR APLICACIÓN, 2018-2032 (MILES DE USD)
TABLA 111 COCINAS INSTITUCIONALES DE EE. UU. EN EL MERCADO DE MEZCLAS DE FRUTAS Y VERDURAS CONGELADAS, POR APLICACIÓN, 2018-2032 (MILES DE USD)
TABLA 112 FABRICANTES DE SUPLEMENTOS NUTRICIONALES DE EE. UU. EN EL MERCADO DE MEZCLAS DE FRUTAS Y VERDURAS CONGELADAS, POR APLICACIÓN, 2018-2032 (MILES DE USD)
TABLA 113 MERCADO ESTADOUNIDENSE DE MEZCLAS DE FRUTAS Y VERDURAS CONGELADAS, POR CANAL DE DISTRIBUCIÓN, 2018-2032 (MILES DE USD)
TABLA 114 MERCADO B2C DE FRUTAS Y VERDURAS CONGELADAS EN EE. UU., POR CANAL DE DISTRIBUCIÓN, 2018-2032 (MILES DE USD)
TABLA 115 MERCADO DE MEZCLAS DE FRUTAS Y VERDURAS CONGELADAS EN TIENDAS DE EE. UU., POR CANAL DE DISTRIBUCIÓN, 2018-2032 (MILES DE USD)
TABLA 116 MERCADO DE FRUTAS Y VERDURAS CONGELADAS SIN TIENDAS EN EE. UU., POR CANAL DE DISTRIBUCIÓN, 2018-2032 (MILES DE USD)
TABLA 117 MERCADO DE FRUTAS Y VERDURAS CONGELADAS DE CANADÁ, POR TIPO, 2018-2032 (MILES DE USD)
TABLA 118 MERCADO DE FRUTAS Y VERDURAS CONGELADAS DE CANADÁ, POR TIPO, 2018-2032 (TONELADAS)
TABLA 119 MEZCLAS DE VEGETALES EN EL MERCADO DE FRUTAS Y VEGETALES CONGELADOS DE CANADÁ, POR TIPO, 2018-2032 (MILES DE USD)
TABLA 120 HORTALIZAS DE RAÍZ EN EL MERCADO DE FRUTAS Y HORTALIZAS CONGELADAS DE CANADÁ, POR TIPO, 2018-2032 (MILES DE USD)
TABLA 121 VEGETALES DE HOJA VERDE EN EL MERCADO DE MEZCLAS DE FRUTAS Y VERDURAS CONGELADAS DE CANADÁ, POR TIPO, 2018-2032 (MILES DE USD)
TABLA 122 MEZCLAS DE CRUCÍFERAS DE CANADÁ EN EL MERCADO DE MEZCLAS DE FRUTAS Y VERDURAS CONGELADAS, POR TIPO, 2018-2032 (MILES DE USD)
TABLA 123 MEZCLAS DE SOLANES DE CANADÁ EN EL MERCADO DE MEZCLAS DE FRUTAS Y VERDURAS CONGELADAS, POR TIPO, 2018-2032 (MILES DE USD)
TABLA 124 MEZCLAS DE LEGUMINOSAS DE CANADÁ EN EL MERCADO DE MEZCLAS DE FRUTAS Y VERDURAS CONGELADAS, POR TIPO, 2018-2032 (MILES DE USD)
TABLA 125 MEZCLAS DE ALLIUM DE CANADÁ EN EL MERCADO DE MEZCLAS DE FRUTAS Y VERDURAS CONGELADAS, POR TIPO, 2018-2032 (MILES DE USD)
TABLA 126 MEZCLAS DE CALABAZA CANADIENSE EN EL MERCADO DE MEZCLAS DE FRUTAS Y VERDURAS CONGELADAS, POR TIPO, 2018-2032 (MILES DE USD)
TABLA 127 MEZCLAS DE FRUTAS DE CANADÁ EN EL MERCADO DE MEZCLAS DE FRUTAS Y VERDURAS CONGELADAS, POR TIPO, 2018-2032 (MILES DE USD)
TABLA 128 MEZCLAS DE FRUTAS Y VERDURAS CONGELADAS SOLO EN EL MERCADO DE FRUTAS Y VERDURAS CONGELADAS DE CANADÁ, POR TIPO, 2018-2032 (MILES DE USD)
TABLA 129 MERCADO DE FRUTAS Y VERDURAS CONGELADAS DE TRIPLE BERRY DE CANADÁ, POR TIPO, 2018-2032 (MILES DE USD)
TABLA 130 MEZCLA DE FRUTAS CÍTRICAS DE CANADÁ EN EL MERCADO DE MEZCLAS DE FRUTAS Y VERDURAS CONGELADAS, POR TIPO, 2018-2032 (MILES DE USD)
CUADRO 131 FRUTAS CÍTRICAS DE CANADÁ EN EL MERCADO DE MEZCLAS DE FRUTAS Y VERDURAS CONGELADAS, POR TIPO, 2018-2032 (MILES DE USD)
TABLA 132 SEGMENTOS DE CÍTRICOS IQF DE CANADÁ EN EL MERCADO DE MEZCLAS DE FRUTAS Y VERDURAS CONGELADAS, POR TIPO, 2018-2032 (MILES DE USD)
TABLA 133 MERCADO DE CÁSCARA DE CÍTRICOS EN MEZCLA DE FRUTAS Y VERDURAS CONGELADAS DE CANADÁ, POR TIPO, 2018-2032 (MILES DE USD)
TABLA 134 INCLUSIONES DE JUGO DE CÍTRICOS EN CUBOS DE CANADÁ EN EL MERCADO DE MEZCLAS DE FRUTAS Y VERDURAS CONGELADAS, POR TIPO, 2018-2032 (MILES DE USD)
TABLA 135 MEZCLA A BASE DE MANZANA DE CANADÁ EN EL MERCADO DE MEZCLAS DE FRUTAS Y VERDURAS CONGELADAS, POR TIPO, 2018-2032 (MILES DE USD)
TABLA 136 MEZCLA DE FRUTAS TROPICALES DE CANADÁ EN EL MERCADO DE MEZCLAS DE FRUTAS Y VERDURAS CONGELADAS, POR TIPO, 2018-2032 (MILES DE USD)
TABLA 137 MEZCLA DE FRUTAS DE HUESO DE CANADÁ EN EL MERCADO DE MEZCLAS DE FRUTAS Y VERDURAS CONGELADAS, POR TIPO, 2018-2032 (MILES DE USD)
TABLA 138 MEZCLA DE GRANADA DE CANADÁ EN EL MERCADO DE MEZCLAS DE FRUTAS Y VERDURAS CONGELADAS, POR TIPO, 2018-2032 (MILES DE USD)
TABLA 139 MEZCLAS DE FRUTAS Y VERDURAS MIXTAS DE CANADÁ EN EL MERCADO DE MEZCLAS DE FRUTAS Y VERDURAS CONGELADAS, POR TIPO, 2018-2032 (MILES DE USD)
TABLA 140 MEZCLAS DE SMOOTHIES DE CANADÁ EN EL MERCADO DE MEZCLAS DE FRUTAS Y VERDURAS CONGELADAS, POR TIPO, 2018-2032 (MILES DE USD)
TABLA 141 MEZCLAS DE ENSALADAS DE CANADÁ EN EL MERCADO DE MEZCLAS DE FRUTAS Y VERDURAS CONGELADAS, POR TIPO, 2018-2032 (MILES DE USD)
TABLA 142 MEZCLAS PARA DESAYUNO EN EL MERCADO DE FRUTAS Y VERDURAS CONGELADAS DE CANADÁ, POR TIPO, 2018-2032 (MILES DE USD)
TABLA 143 MEZCLAS DE ALIMENTOS INFANTILES EN EL MERCADO DE FRUTAS Y VERDURAS CONGELADAS DE CANADÁ, POR TIPO, 2018-2032 (MILES DE USD)
TABLA 144 MEZCLAS DE SUPERALIMENTOS DE CANADÁ EN EL MERCADO DE MEZCLAS DE FRUTAS Y VERDURAS CONGELADAS, POR TIPO, 2018-2032 (MILES DE USD)
TABLA 145 MEZCLAS DE FRUTAS Y VERDURAS CONGELADAS DE TEMPORADA/FESTIVOS DE CANADÁ, POR TIPO, 2018-2032 (MILES DE USD)
TABLA 146 MERCADO DE FRUTAS Y VERDURAS CONGELADAS DE CANADÁ, POR TECNOLOGÍA, 2018-2032 (MILES DE USD)
TABLA 147 MERCADO DE MEZCLAS DE FRUTAS Y VERDURAS CONGELADAS DE CANADÁ, POR CATEGORÍA DE PRODUCTO, 2018-2032 (MILES DE USD)
TABLA 148 MERCADO DE FRUTAS Y VEGETALES CONGELADOS PRE-SAÑADOS Y LUEGO IQF EN CANADÁ, POR CATEGORÍA DE PRODUCTO, 2018-2032 (MILES DE USD)
TABLA 149 MEZCLAS DE FRUTAS Y VERDURAS CONGELADAS CON HIERBAS DE CANADÁ EN EL MERCADO DE MEZCLAS DE FRUTAS Y VERDURAS CONGELADAS, POR CATEGORÍA DE PRODUCTO, 2018-2032 (MILES DE USD)
TABLA 150 MEZCLAS ESPECIADAS DE CANADÁ EN EL MERCADO DE MEZCLAS DE FRUTAS Y VERDURAS CONGELADAS, POR CATEGORÍA DE PRODUCTO, 2018-2032 (MILES DE USD)
TABLA 151 CONDIMENTOS DE INSPIRACIÓN ASIÁTICA EN EL MERCADO DE MEZCLAS DE FRUTAS Y VERDURAS CONGELADAS DE CANADÁ, POR CATEGORÍA DE PRODUCTO, 2018-2032 (MILES DE USD)
TABLA 152 MEZCLA MEDITERRÁNEA DE CANADÁ EN EL MERCADO DE MEZCLAS DE FRUTAS Y VERDURAS CONGELADAS, POR CATEGORÍA DE PRODUCTO, 2018-2032 (MILES DE USD)
TABLA 153 MEZCLAS DE FRUTAS Y VERDURAS CONGELADAS DULCES EN EL MERCADO DE CANADÁ, POR CATEGORÍA DE PRODUCTO, 2018-2032 (MILES DE USD)
TABLA 154 MEZCLA DE ESTILO INDIO DE CANADÁ EN EL MERCADO DE MEZCLAS DE FRUTAS Y VERDURAS CONGELADAS, POR CATEGORÍA DE PRODUCTO, 2018-2032 (MILES DE USD)
TABLA 155 MERCADO DE MEZCLAS DE FRUTAS Y VERDURAS CONGELADAS DE CANADÁ, POR FORMA, 2018-2032 (MILES DE USD)
TABLA 156 MERCADO DE FRUTAS Y VERDURAS CONGELADAS DE CANADÁ, POR CATEGORÍA, 2018-2032 (MILES DE USD)
TABLA 157 MERCADO DE FRUTAS Y VERDURAS CONGELADAS DE CANADÁ, POR ORIGEN, 2018-2032 (MILES DE USD)
TABLA 158 MERCADO DE MEZCLAS DE FRUTAS Y VERDURAS CONGELADAS DE CANADÁ, POR ETIQUETADO Y CERTIFICACIÓN, 2018-2032 (MILES DE USD)
TABLA 159 MERCADO DE MEZCLAS DE FRUTAS Y VERDURAS CONGELADAS DE CANADÁ, POR FORMATO DE ENVASE, 2018-2032 (MILES DE USD)
TABLA 160 MERCADO DE MEZCLAS DE FRUTAS Y VERDURAS CONGELADAS EN BOLSA DE CANADÁ, POR FORMATO DE ENVASE, 2018-2032 (MILES DE USD)
TABLA 161 MERCADO DE FRUTAS Y VERDURAS CONGELADAS DE CANADÁ, POR TAMAÑO DE ENVASE, 2018-2032 (MILES DE USD)
TABLA 162 TAMAÑOS DE ENVASE PARA VENTA AL POR MENOR EN CANADÁ EN EL MERCADO DE MEZCLAS DE FRUTAS Y VERDURAS CONGELADAS, POR TAMAÑO DE ENVASE, 2018-2032 (MILES DE USD)
TABLA 163 TAMAÑOS DE ENVASE EN EL MERCADO DE MEZCLAS DE FRUTAS Y VERDURAS CONGELADAS DE CANADÁ, POR TAMAÑO DE ENVASE, 2018-2032 (MILES DE USD)
TABLA 164 MERCADO DE MEZCLAS DE FRUTAS Y VERDURAS CONGELADAS DE CANADÁ, POR VIDA ÚTIL, 2018-2032 (MILES DE USD)
TABLA 165 MERCADO DE MEZCLAS DE FRUTAS Y VERDURAS CONGELADAS DE CANADÁ, POR APLICACIÓN, 2018-2032 (MILES DE USD)
TABLA 166 SERVICIO DE ALIMENTACIÓN CANADIENSE (HORECA) EN EL MERCADO DE MEZCLAS DE FRUTAS Y VERDURAS CONGELADAS, POR APLICACIÓN, 2018-2032 (MILES DE USD)
TABLA 167 INDUSTRIA DE SERVICIOS DE ALIMENTOS DE CANADÁ EN EL MERCADO DE MEZCLAS DE FRUTAS Y VERDURAS CONGELADAS, POR APLICACIÓN, 2018-2032 (MILES DE USD)
TABLA 168 COCINAS INSTITUCIONALES DE CANADÁ EN EL MERCADO DE MEZCLAS DE FRUTAS Y VERDURAS CONGELADAS, POR APLICACIÓN, 2018-2032 (MILES DE USD)
TABLA 169 FABRICANTES DE SUPLEMENTOS NUTRICIONALES DE CANADÁ EN EL MERCADO DE MEZCLAS DE FRUTAS Y VERDURAS CONGELADAS, POR APLICACIÓN, 2018-2032 (MILES DE USD)
TABLA 170 MERCADO DE MEZCLAS DE FRUTAS Y VERDURAS CONGELADAS DE CANADÁ, POR CANAL DE DISTRIBUCIÓN, 2018-2032 (MILES DE USD)
TABLA 171 MERCADO B2C DE FRUTAS Y VERDURAS CONGELADAS EN CANADÁ, POR CANAL DE DISTRIBUCIÓN, 2018-2032 (MILES DE USD)
TABLA 172 MERCADO DE MEZCLAS DE FRUTAS Y VERDURAS CONGELADAS EN TIENDAS DE CANADÁ, POR CANAL DE DISTRIBUCIÓN, 2018-2032 (MILES DE USD)
TABLA 173 MERCADO DE MEZCLAS DE FRUTAS Y VERDURAS CONGELADAS SIN TIENDAS DE CANADÁ, POR CANAL DE DISTRIBUCIÓN, 2018-2032 (MILES DE USD)
TABLA 174 MERCADO DE FRUTAS Y VERDURAS CONGELADAS EN MÉXICO, POR TIPO, 2018-2032 (MILES DE USD)
CUADRO 175 MERCADO DE FRUTAS Y VERDURAS CONGELADAS EN MÉXICO, POR TIPO, 2018-2032 (TONELADAS)
TABLA 176 MEZCLAS DE VEGETALES EN EL MERCADO DE FRUTAS Y VEGETALES CONGELADOS DE MEZCLAS DE MEZCLAS DE VEGETALES CONGELADOS DE MÉXICO, POR TIPO, 2018-2032 (MILES DE USD)
CUADRO 177 HORTALIZAS DE RAÍZ EN EL MERCADO DE FRUTAS Y VEGETALES CONGELADOS DE MÉXICO, POR TIPO, 2018-2032 (MILES DE USD)
TABLA 178 MÉXICO: HORTALIZAS DE HOJA VERDE EN EL MERCADO DE FRUTAS Y VEGETALES CONGELADOS, POR TIPO, 2018-2032 (MILES DE USD)
TABLA 179 MEZCLAS DE CRUCÍFERAS EN EL MERCADO DE FRUTAS Y VERDURAS CONGELADAS, POR TIPO, 2018-2032 (MILES DE USD)
TABLA 180 MEZCLAS DE SOLANES DE MÉXICO EN EL MERCADO DE MEZCLAS DE FRUTAS Y VERDURAS CONGELADAS, POR TIPO, 2018-2032 (MILES DE USD)
TABLA 181 MEZCLAS DE LEGUMINOSAS EN EL MERCADO DE FRUTAS Y VERDURAS CONGELADAS, POR TIPO, 2018-2032 (MILES DE USD)
TABLA 182 MEZCLAS DE ALLIUM EN EL MERCADO DE FRUTAS Y VERDURAS CONGELADAS, POR TIPO, 2018-2032 (MILES DE USD)
TABLA 183 MEZCLAS DE CALABAZA MÉXICO EN EL MERCADO DE MEZCLAS DE FRUTAS Y VERDURAS CONGELADAS, POR TIPO, 2018-2032 (MILES DE USD)
TABLA 184 MEZCLAS DE FRUTAS DE MÉXICO EN EL MERCADO DE MEZCLAS DE FRUTAS Y VERDURAS CONGELADAS, POR TIPO, 2018-2032 (MILES DE USD)
TABLA 185 MEZCLAS DE FRUTAS Y VERDURAS CONGELADAS EN EL MERCADO DE MEZCLAS DE FRUTAS Y VERDURAS CONGELADAS DE MÉXICO, POR TIPO, 2018-2032 (MILES DE USD)
TABLA 186 MERCADO DE MÉXICO DE FRUTAS Y VERDURAS CONGELADAS, POR TIPO, 2018-2032 (MILES DE USD)
TABLA 187 MEZCLA DE FRUTAS CÍTRICAS DE MÉXICO EN EL MERCADO DE MEZCLAS DE FRUTAS Y VERDURAS CONGELADAS, POR TIPO, 2018-2032 (MILES DE USD)
CUADRO 188 FRUTAS CÍTRICAS DE MÉXICO EN EL MERCADO DE MEZCLAS DE FRUTAS Y VERDURAS CONGELADAS, POR TIPO, 2018-2032 (MILES DE USD)
TABLA 189 SEGMENTOS DE CÍTRICOS IQF DE MÉXICO EN EL MERCADO DE MEZCLAS DE FRUTAS Y VERDURAS CONGELADAS, POR TIPO, 2018-2032 (MILES DE USD)
TABLA 190 MERCADO DE CÁSCARA DE CÍTRICOS EN MEZCLA DE FRUTAS Y VERDURAS CONGELADAS DE MÉXICO, POR TIPO, 2018-2032 (MILES DE USD)
TABLA 191 INCLUSIONES DE JUGO DE CÍTRICOS EN CUBOS DE MÉXICO EN EL MERCADO DE MEZCLAS DE FRUTAS Y VERDURAS CONGELADAS, POR TIPO, 2018-2032 (MILES DE USD)
TABLA 192 MEZCLA A BASE DE MANZANA EN EL MERCADO DE FRUTAS Y VERDURAS CONGELADAS, POR TIPO, 2018-2032 (MILES DE USD)
TABLA 193 MEZCLA DE FRUTAS TROPICALES DE MÉXICO EN EL MERCADO DE MEZCLAS DE FRUTAS Y VERDURAS CONGELADAS, POR TIPO, 2018-2032 (MILES DE USD)
TABLA 194 MEZCLA DE FRUTAS DE HUESO DE MÉXICO EN EL MERCADO DE MEZCLAS DE FRUTAS Y VERDURAS CONGELADAS, POR TIPO, 2018-2032 (MILES DE USD)
TABLA 195 MEZCLA DE GRANADA DE MÉXICO EN EL MERCADO DE MEZCLAS DE FRUTAS Y VERDURAS CONGELADAS, POR TIPO, 2018-2032 (MILES DE USD)
TABLA 196 MEZCLAS DE FRUTAS Y VERDURAS MIXTAS DE MÉXICO EN EL MERCADO DE MEZCLAS DE FRUTAS Y VERDURAS CONGELADAS, POR TIPO, 2018-2032 (MILES DE USD)
TABLA 197 MEZCLAS DE SMOOTHIES DE MÉXICO EN EL MERCADO DE MEZCLAS DE FRUTAS Y VERDURAS CONGELADAS, POR TIPO, 2018-2032 (MILES DE USD)
TABLA 198 MEZCLAS PARA ENSALADAS DE MÉXICO EN EL MERCADO DE MEZCLAS DE FRUTAS Y VERDURAS CONGELADAS, POR TIPO, 2018-2032 (MILES DE USD)
TABLA 199 MEZCLAS PARA DESAYUNO EN EL MERCADO DE FRUTAS Y VERDURAS CONGELADAS, POR TIPO, 2018-2032 (MILES DE USD)
TABLA 200 MEZCLAS DE ALIMENTOS INFANTILES EN EL MERCADO DE FRUTAS Y VERDURAS CONGELADAS, POR TIPO, 2018-2032 (MILES DE USD)
TABLA 201 MEZCLAS DE SUPERFOODS DE MÉXICO EN EL MERCADO DE MEZCLAS DE FRUTAS Y VERDURAS CONGELADAS, POR TIPO, 2018-2032 (MILES DE USD)
TABLA 202 MEZCLAS DE FRUTAS Y VERDURAS CONGELADAS DE TEMPORADA/VACACIONES EN EL MERCADO DE MEZCLAS DE FRUTAS Y VERDURAS CONGELADAS, POR TIPO, 2018-2032 (MILES DE USD)
TABLA 203 MERCADO DE MEZCLAS DE FRUTAS Y VERDURAS CONGELADAS EN MÉXICO, POR TECNOLOGÍA, 2018-2032 (MILES DE USD)
CUADRO 204 MERCADO MÉXICO DE MEZCLAS DE FRUTAS Y VERDURAS CONGELADAS, POR CATEGORÍA DE PRODUCTO, 2018-2032 (MILES DE USD)
TABLA 205 MERCADO DE MÉXICO DE FRUTAS Y VEGETALES CONGELADOS PRE SAZONADOS Y LUEGO IQF, POR CATEGORÍA DE PRODUCTO, 2018-2032 (MILES DE USD)
TABLA 206 MEZCLAS DE HIERBAS CONDIMENTADAS CON HIERBAS DE MÉXICO EN EL MERCADO DE MEZCLAS DE FRUTAS Y VERDURAS CONGELADAS, POR CATEGORÍA DE PRODUCTO, 2018-2032 (MILES DE USD)
TABLA 207 MEZCLAS ESPECIADAS DE MÉXICO EN EL MERCADO DE MEZCLAS DE FRUTAS Y VERDURAS CONGELADAS, POR CATEGORÍA DE PRODUCTO, 2018-2032 (MILES DE USD)
TABLA 208 CONDIMENTOS DE INSPIRACIÓN ASIÁTICA EN EL MERCADO DE MEZCLAS DE FRUTAS Y VERDURAS CONGELADAS, POR CATEGORÍA DE PRODUCTO, 2018-2032 (MILES DE USD)
TABLA 209 MEZCLA MEDITERRÁNEA DE MÉXICO EN EL MERCADO DE MEZCLAS DE FRUTAS Y VERDURAS CONGELADAS, POR CATEGORÍA DE PRODUCTO, 2018-2032 (MILES DE USD)
TABLA 210 MEZCLAS DE FRUTAS Y VERDURAS CONGELADAS EN EL MERCADO DE MEZCLAS DULCES GLASEADAS DE MÉXICO, POR CATEGORÍA DE PRODUCTO, 2018-2032 (MILES DE USD)
TABLA 211 MEZCLA DE FRUTAS Y VERDURAS CONGELADAS AL ESTILO INDIO DE MÉXICO, POR CATEGORÍA DE PRODUCTO, 2018-2032 (MILES DE USD)
TABLA 212 MERCADO MÉXICO DE MEZCLAS DE FRUTAS Y VERDURAS CONGELADAS, POR FORMA, 2018-2032 (MILES DE USD)
TABLA 213 MERCADO DE FRUTAS Y VERDURAS CONGELADAS EN MÉXICO, POR CATEGORÍA, 2018-2032 (MILES DE USD)
CUADRO 214 MERCADO DE FRUTAS Y VERDURAS CONGELADAS EN MÉXICO, POR ORIGEN, 2018-2032 (MILES DE USD)
TABLA 215 MERCADO DE FRUTAS Y VERDURAS CONGELADAS EN MÉXICO, POR ETIQUETADO Y CERTIFICACIÓN, 2018-2032 (MILES DE USD)
TABLA 216 MERCADO DE FRUTAS Y VERDURAS CONGELADAS EN MÉXICO, POR FORMATO DE EMPAQUE, 2018-2032 (MILES DE USD)
TABLA 217 MERCADO DE MEZCLAS DE FRUTAS Y VERDURAS CONGELADAS EN BOLSA DE MÉXICO, POR FORMATO DE ENVASE, 2018-2032 (MILES DE USD)
TABLA 218 MERCADO DE FRUTAS Y VERDURAS CONGELADAS EN MÉXICO, POR TAMAÑO DE ENVASE, 2018-2032 (MILES DE USD)
TABLA 219 TAMAÑOS DE ENVASE PARA VENTA AL POR MENOR EN MÉXICO EN EL MERCADO DE MEZCLAS DE FRUTAS Y VERDURAS CONGELADAS, POR TAMAÑO DE ENVASE, 2018-2032 (MILES DE USD)
TABLA 220 TAMAÑOS DE EMPAQUE EN EL MERCADO DE MEZCLAS DE FRUTAS Y VERDURAS CONGELADAS DE MÉXICO, POR TAMAÑO DE EMPAQUE, 2018-2032 (MILES DE USD)
TABLA 221 MERCADO MÉXICO DE MEZCLAS DE FRUTAS Y VERDURAS CONGELADAS, POR VIDA ÚTIL, 2018-2032 (MILES DE USD)
CUADRO 222 MERCADO MÉXICO DE MEZCLAS DE FRUTAS Y VERDURAS CONGELADAS, POR APLICACIÓN, 2018-2032 (MILES DE USD)
TABLA 223 SERVICIO DE ALIMENTOS (HORECA) EN MÉXICO EN EL MERCADO DE MEZCLAS DE FRUTAS Y VERDURAS CONGELADAS, POR APLICACIÓN, 2018-2032 (MILES DE USD)
TABLA 224 INDUSTRIA DE SERVICIOS DE ALIMENTOS EN MÉXICO EN EL MERCADO DE MEZCLAS DE FRUTAS Y VERDURAS CONGELADAS, POR APLICACIÓN, 2018-2032 (MILES DE USD)
TABLA 225 COCINAS INSTITUCIONALES DE MÉXICO EN EL MERCADO DE MEZCLAS DE FRUTAS Y VERDURAS CONGELADAS, POR APLICACIÓN, 2018-2032 (MILES DE USD)
TABLA 226 FABRICANTES DE SUPLEMENTOS NUTRICIONALES EN MÉXICO EN EL MERCADO DE MEZCLAS DE FRUTAS Y VERDURAS CONGELADAS, POR APLICACIÓN, 2018-2032 (MILES DE USD)
TABLA 227 MERCADO DE FRUTAS Y VERDURAS CONGELADAS EN MÉXICO, POR CANAL DE DISTRIBUCIÓN, 2018-2032 (MILES DE USD)
TABLA 228 MÉXICO B2C EN EL MERCADO DE MEZCLAS DE FRUTAS Y VERDURAS CONGELADAS, POR CANAL DE DISTRIBUCIÓN, 2018-2032 (MILES DE USD)
TABLA 229 MERCADO DE MEZCLAS DE FRUTAS Y VERDURAS CONGELADAS EN TIENDAS DE MÉXICO, POR CANAL DE DISTRIBUCIÓN, 2018-2032 (MILES DE USD)
TABLA 230 MERCADO DE MEZCLAS DE FRUTAS Y VERDURAS CONGELADAS SIN TIENDA EN MÉXICO, POR CANAL DE DISTRIBUCIÓN, 2018-2032 (MILES DE USD)
Lista de figuras
FIGURA 1 MERCADO DE MEZCLAS DE FRUTAS Y VERDURAS CONGELADAS DE AMÉRICA DEL NORTE: SEGMENTACIÓN
FIGURA 2 MERCADO DE MEZCLAS DE FRUTAS Y VERDURAS CONGELADAS DE AMÉRICA DEL NORTE: TRIANGULACIÓN DE DATOS
FIGURA 3 MERCADO DE MEZCLAS DE FRUTAS Y VERDURAS CONGELADAS DE AMÉRICA DEL NORTE: ANÁLISIS DE DROC
FIGURA 4 MERCADO DE MEZCLAS DE FRUTAS Y VERDURAS CONGELADAS DE AMÉRICA DEL NORTE: ANÁLISIS DEL MERCADO DE AMÉRICA DEL NORTE VS. EL MUNDO
FIGURA 5 MERCADO DE MEZCLAS DE FRUTAS Y VERDURAS CONGELADAS DE AMÉRICA DEL NORTE: ANÁLISIS DE INVESTIGACIÓN DE EMPRESAS
FIGURA 6 MERCADO DE MEZCLAS DE FRUTAS Y VERDURAS CONGELADAS DE AMÉRICA DEL NORTE: MODELADO MULTIVARIADO
FIGURA 7 MERCADO DE MEZCLAS DE FRUTAS Y VERDURAS CONGELADAS DE AMÉRICA DEL NORTE: DATOS DEMOGRÁFICOS DE LAS ENTREVISTAS
FIGURA 8 MERCADO DE MEZCLAS DE FRUTAS Y VERDURAS CONGELADAS DE AMÉRICA DEL NORTE: CUADRÍCULA DE POSICIÓN DEL MERCADO DBMR
FIGURA 9 MERCADO DE MEZCLAS DE FRUTAS Y VERDURAS CONGELADAS DE AMÉRICA DEL NORTE: ANÁLISIS DE LA PARTICIPACIÓN DE LOS PROVEEDORES
FIGURA 10 MERCADO DE MEZCLAS DE FRUTAS Y VERDURAS CONGELADAS DE AMÉRICA DEL NORTE: CUADRÍCULA DE COBERTURA DE APLICACIÓN DEL MERCADO
FIGURA 11 MERCADO DE MEZCLAS DE FRUTAS Y VERDURAS CONGELADAS DE AMÉRICA DEL NORTE: SEGMENTACIÓN
FIGURA 12 MERCADO DE MEZCLAS DE FRUTAS Y VERDURAS CONGELADAS DE AMÉRICA DEL NORTE: RESUMEN EJECUTIVO
FIGURA 13 DECISIONES ESTRATÉGICAS
FIGURA 14 DOS SEGMENTOS COMPRENDEN EL MERCADO DE MEZCLAS DE FRUTAS Y VERDURAS CONGELADAS DE AMÉRICA DEL NORTE, POR TIPO
FIGURA 15. SE ESPERA QUE LA CRECIENTE CONCIENCIA SOBRE LA SALUD IMPULSE LA DEMANDA DE OPCIONES NUTRITIVAS IMPULSE EL MERCADO DE MEZCLAS DE FRUTAS Y VERDURAS CONGELADAS DE AMÉRICA DEL NORTE EN EL PERÍODO PRONOSTICADO (2025-2032).
FIGURA 16 SE ESPERA QUE EL SEGMENTO DE MEZCLAS DE VEGETALES REPRESENTE LA MAYOR PARTICIPACIÓN DEL MERCADO DE MEZCLAS DE FRUTAS Y VEGETALES CONGELADOS DE AMÉRICA DEL NORTE EN 2025 Y 2032
FIGURA 17 ANÁLISIS PESTEL
FIGURA 18 ANÁLISIS DE LAS CINCO FUERZAS DE PORTER
FIGURA 19 ESCENARIO DE IMPORTACIÓN Y EXPORTACIÓN (MILES DE USD)
FIGURA 20 MERCADO DE MEZCLAS DE FRUTAS Y VERDURAS CONGELADAS DE AMÉRICA DEL NORTE, 2018-2032, PRECIO DE VENTA PROMEDIO (USD/TONELADAS)
FIGURA 21 CADENA DE VALOR DEL MERCADO DE MEZCLAS DE FRUTAS Y VERDURAS CONGELADAS DE AMÉRICA DEL NORTE
FIGURA 22 CRITERIOS DE SELECCIÓN DE PROVEEDORES
FIGURA 23 ANÁLISIS DE PRODUCCIÓN Y CONSUMO
FIGURA 24 IMPULSORES, RESTRICCIONES, OPORTUNIDADES Y DESAFÍOS DEL MERCADO DE BEBIDAS NO ALCOHÓLICAS
FIGURA 25 MERCADO DE MEZCLAS DE FRUTAS Y VERDURAS CONGELADAS DE AMÉRICA DEL NORTE: POR TIPO, 2024
FIGURA 26 MERCADO DE MEZCLAS DE FRUTAS Y VERDURAS CONGELADAS DE AMÉRICA DEL NORTE: POR TIPO DE CULTIVO, 2024
FIGURA 27 MERCADO DE MEZCLAS DE FRUTAS Y VERDURAS CONGELADAS DE AMÉRICA DEL NORTE: POR CATEGORÍA DE PRODUCTO, 2024
FIGURA 28 MERCADO DE MEZCLAS DE FRUTAS Y VERDURAS CONGELADAS DE AMÉRICA DEL NORTE: POR FORMA, 2024
FIGURA 29 MERCADO DE MEZCLAS DE FRUTAS Y VERDURAS CONGELADAS DE AMÉRICA DEL NORTE: POR CATEGORÍA, 2024
FIGURA 30 MERCADO DE MEZCLAS DE FRUTAS Y VERDURAS CONGELADAS DE AMÉRICA DEL NORTE: POR FUENTE, 2024
FIGURA 31 MERCADO DE MEZCLAS DE FRUTAS Y VERDURAS CONGELADAS DE AMÉRICA DEL NORTE: POR ETIQUETADO Y CERTIFICACIÓN, 2024
FIGURA 32 MERCADO DE MEZCLAS DE FRUTAS Y VERDURAS CONGELADAS DE AMÉRICA DEL NORTE: POR FORMATO DE ENVASE, 2024
FIGURA 33 MERCADO DE MEZCLAS DE FRUTAS Y VERDURAS CONGELADAS DE AMÉRICA DEL NORTE: POR TAMAÑO DE ENVASE, 2024
FIGURA 34 MERCADO DE MEZCLAS DE FRUTAS Y VERDURAS CONGELADAS DE AMÉRICA DEL NORTE: POR VIDA ÚTIL, 2024
FIGURA 35 MERCADO DE MEZCLAS DE FRUTAS Y VERDURAS CONGELADAS DE AMÉRICA DEL NORTE: POR APLICACIÓN, 2024
FIGURA 36 MERCADO DE MEZCLAS DE FRUTAS Y VERDURAS CONGELADAS DE AMÉRICA DEL NORTE: POR DISTRIBUCIÓN CHJANNEL, 2024
FIGURA 37 MERCADO DE FRUTAS Y VERDURAS CONGELADAS MIXTAS DE AMÉRICA DEL NORTE, INSTANTÁNEAS
FIGURA 38 MERCADO DE MEZCLAS DE FRUTAS Y VERDURAS CONGELADAS DE AMÉRICA DEL NORTE: PARTICIPACIÓN DE LA EMPRESA 2024 (%)
Metodología de investigación
La recopilación de datos y el análisis del año base se realizan utilizando módulos de recopilación de datos con muestras de gran tamaño. La etapa incluye la obtención de información de mercado o datos relacionados a través de varias fuentes y estrategias. Incluye el examen y la planificación de todos los datos adquiridos del pasado con antelación. Asimismo, abarca el examen de las inconsistencias de información observadas en diferentes fuentes de información. Los datos de mercado se analizan y estiman utilizando modelos estadísticos y coherentes de mercado. Además, el análisis de la participación de mercado y el análisis de tendencias clave son los principales factores de éxito en el informe de mercado. Para obtener más información, solicite una llamada de un analista o envíe su consulta.
La metodología de investigación clave utilizada por el equipo de investigación de DBMR es la triangulación de datos, que implica la extracción de datos, el análisis del impacto de las variables de datos en el mercado y la validación primaria (experto en la industria). Los modelos de datos incluyen cuadrícula de posicionamiento de proveedores, análisis de línea de tiempo de mercado, descripción general y guía del mercado, cuadrícula de posicionamiento de la empresa, análisis de patentes, análisis de precios, análisis de participación de mercado de la empresa, estándares de medición, análisis global versus regional y de participación de proveedores. Para obtener más información sobre la metodología de investigación, envíe una consulta para hablar con nuestros expertos de la industria.
Personalización disponible
Data Bridge Market Research es líder en investigación formativa avanzada. Nos enorgullecemos de brindar servicios a nuestros clientes existentes y nuevos con datos y análisis que coinciden y se adaptan a sus objetivos. El informe se puede personalizar para incluir análisis de tendencias de precios de marcas objetivo, comprensión del mercado de países adicionales (solicite la lista de países), datos de resultados de ensayos clínicos, revisión de literatura, análisis de mercado renovado y base de productos. El análisis de mercado de competidores objetivo se puede analizar desde análisis basados en tecnología hasta estrategias de cartera de mercado. Podemos agregar tantos competidores sobre los que necesite datos en el formato y estilo de datos que esté buscando. Nuestro equipo de analistas también puede proporcionarle datos en archivos de Excel sin procesar, tablas dinámicas (libro de datos) o puede ayudarlo a crear presentaciones a partir de los conjuntos de datos disponibles en el informe.