Asia-Pacific Polyglycerol Market, By Type (Polyglycerol Polyricinoleate, Polyglycerol EstersPolyglycerol Sebacate and Others), Product (PG 2, PG 3, PG 4, PG 6, PG 10 and Others), Application (Emulsifiers, Food Additives, Surfactants, Stabilizers, Non-Ionic Emulsifiers, Dispersants, Emollients, Wetting Agents, Thickeners and Others), End-Use (Food, Cosmetics, Pharmaceuticals, Others) - Industry Trends and Forecast to 2029.
Asia-Pacific Polyglycerol Market Analysis and Insights
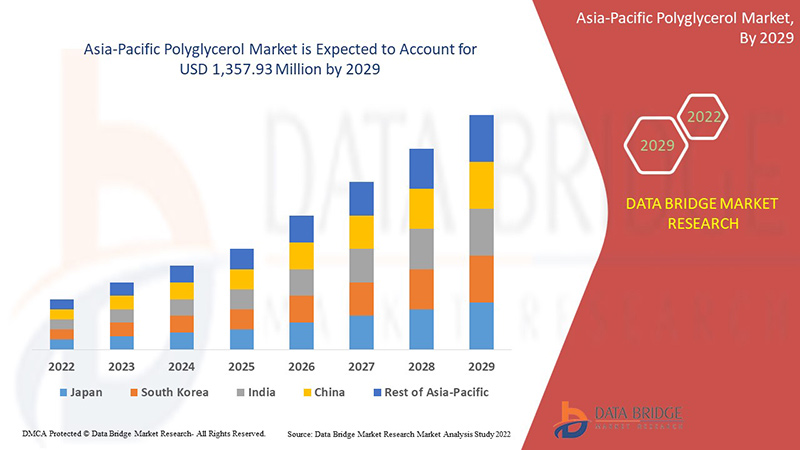
Asia-Pacific polyglycerol market is expected to grow significantly in the forecast period of 2022 to 2029. Data Bridge Market Research analyses that the market is growing with a CAGR of 5.9% in the forecast period of 2022 to 2029 and is expected to reach USD 1,357.93 million by 2029. The major factor driving the growth of the polyglycerol market is the inclination toward food additive consumption in the food & beverage industry, the rising popularity of polyglycerols in the cosmetics industry and growing awareness regarding the properties of polyglycerols.
Polyglycerols have been gaining popularity and are widely used in the pharmaceutical industry as drug carriers and in the biomedical sector for regenerative medicines. On account of the rising prevalence of medical ailments and the increasing development of healthcare infrastructure, the thriving pharmaceutical industry is expected to provide the opportunity for bolstering market growth. Furthermore, several market players are investing in research and development (R&D) activities to launch new products to cater to the requirements of the healthcare industry.
Asia-Pacific polyglycerol market report provides details of market share, new developments, and the impact of domestic and localized market players, analyses opportunities in terms of emerging revenue pockets, changes in market regulations, products approvals, strategic decisions, product launches, geographic expansions, and technological innovations in the market. To understand the analysis and the market scenario, contact us for an Analyst Brief. Our team will help you create a revenue impact solution to achieve your desired goal.
|
Report Metric |
Details |
|
Forecast Period |
2022 to 2029 |
|
Base Year |
2021 |
|
Historic Years |
2020 (Customizable to 2019 - 2014) |
|
Quantitative Units |
Revenue in USD Million, Volumes in Kilo Tons |
|
Segments Covered |
By Type (Polyglycerol Polyricinoleate, Polyglycerol Esters, Polyglycerol Sebacate and Others), Product (PG 2, PG 3, PG 4, PG 6, PG 10 and Others), Application (Emulsifiers, Food Additives, Surfactants, Stabilizers, Non-Ionic Emulsifiers, Dispersants, Emollients, Wetting Agents, Thickeners And Others), End-Use (Food, Cosmetics, Pharmaceuticals, Others) |
|
Countries Covered |
Japan, China, South Korea, India, Singapore, Thailand, Indonesia, Malaysia, Philippines, Australia & New Zealand and the Rest of Asia-Pacific |
|
Market Players Covered |
Taiyo Kagaku Co., Ltd., Estelle Chemicals Pvt. Ltd., NOVEL CHEM, SPELL ORGANICS LTD, Oleon NV., Spiga Nord S.p.A, Salamoto Yakuhin Kogyo Co., Ltd., DSM, Merck KGaA, Croda International Plc, International Flavors & Fragrances Inc. |
Market Definition
Polyglycerol is a transparent, viscous and nonvolatile liquid made by dehydrating glycerol with epoxy intermediates using an alkali catalyst. Its fatty acid esters, safe, biodegradable and nonionic surfactants, are used as antistatic and antifogging agents in food packaging in the food and beverage (F&B) business. Mold inhibitors and emulsifiers are also employed in preparing baked goods, chewing gum and low-fat spreads. Polyglycerol is also used worldwide in the pharmaceutical and cosmetics sectors due to its amphiphilic characteristics.
Asia-Pacific Polyglycerol Market Dynamics
Drivers
- Inclination towards food additive consumption in the food & beverage industry
Polyglyceryl-3-monostearate (PGM) is a type of polyglycerol used as a surfactant and emulsifier in food products. PGM shows good and effective results in reducing the interfacial tension between oil and water, which leads to improved emulsion stability. Fatty acid esters, safe, biodegradable, and non-ionic surfactants, are used as antistatic and anti-scale agents in food packaging in the food and beverage industry. Mold inhibitors and emulsifiers are also used to make low-fat baked goods, chewing gum, pastries, and other bakery products. Moreover, polyglycerol's properties, such as emulsifying and stabilizing agents, make it suitable for various applications, including bakery and confectionery products.
- The rising popularity of polyglycerols in the cosmetics industry
The use of polyglycerol as a humectant and thickener in the cosmetic industry also benefits from the growing preference for organic products. Sales of personal care and cosmetic products are also driven by the growing influence of social media and growing interest in health and cleanliness. Therefore, these factors are expected to drive the growth of cosmetic items. Furthermore, emulsifiers derived from polyglycerol are also used as ingredients in cosmetic products. In addition, Japan, Singapore, South Korea, Hong Kong, and China are among the top cosmetic exporters in the world.
- Growing awareness regarding the properties of polyglycerols
Growing application of polyglycerol in the pharmaceuticals sector as an excipient and tablet binder. Polyglycerol is also used in the pharmaceutical and cosmetic fields due to its amphiphilic properties. In addition, its growth is supported by cost-effective processes and the high usage of polyglycerol in the pharmaceutical industry. The increasing adoption of science and technology during the manufacturing and development of drugs is one of the critical factors responsible for the rising demand for the polyglycerol market in the pharmaceutical industry.
Opportunities
- Rising prevalence of medical ailments and development in the healthcare industry
Polyglycerols have been gaining popularity and are widely used in the pharmaceutical industry as drug carriers and in the biomedical sector for regenerative medicines. On account of the rising prevalence of medical ailments and the increasing development of healthcare infrastructure, the thriving pharmaceutical industry is expected to provide the opportunity for bolstering market growth. Furthermore, several market players are investing in research and development (R&D) activities to launch new products to cater to the requirements of the healthcare industry.
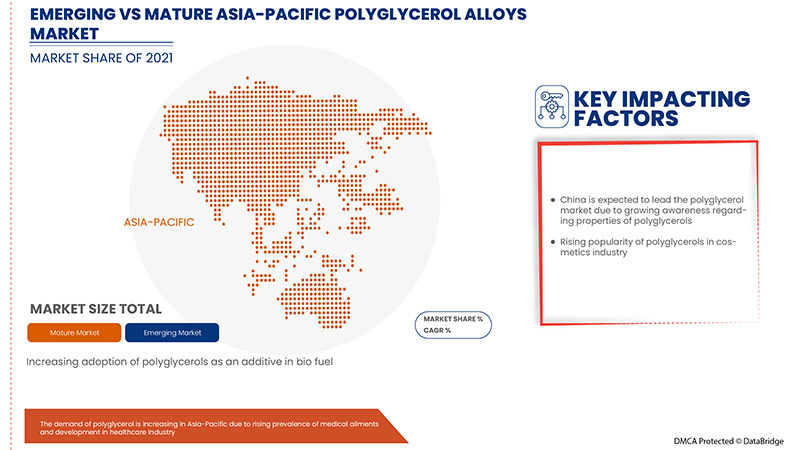
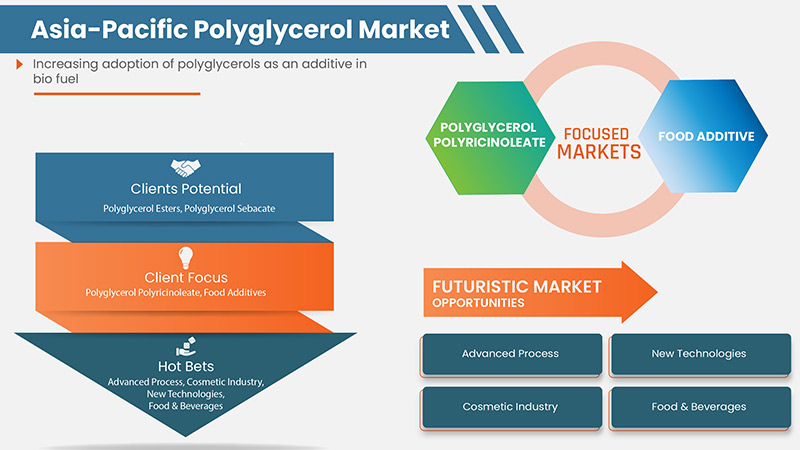
- Increasing adoption of polyglycerols as an additive in biofuel
The increasing adoption of polyglycerols as fuel additives to improve the performance of diesel engines is gaining popularity in the oil industry. A variety of diesel fuel additives are associated with bio-diesel fuel and/or petroleum-derived diesel fuel having one or more solvent(s) and one or more pour-point depressants. These pour-point depressants include polyglycerol ester, polyglycerol polyricinoleate, and/or polyglycerol esters of mixed fatty acids.
Restraints/Challenges
- Easy availability of substitutes
In pharmaceutical applications, particular use is palmitic, stearic, myristic, and short-chain fatty acids. The derivatives include monostearate, monoglycerides, propylene glycol esters, sorbitans, ethylene oxide products, isopropyl palmitic, and myristate. Specific powdered stearins and cocoa butter substitutes are also used in various formulations. Moreover, lipid-based drug delivery (LBDD) is gaining popularity as a co-emulsifying agent and in the development of Self-Emulsifying Drug Delivery Systems (SEDDS), which enhance oral delivery and absorption of lipophilic drugs. Thus, the availability of a large number of substitutes for polyglycerols has impacted the growth of the Asia-Pacific polyglycerol market and is expected to restrain the market growth.
- Adverse effects on health
When used in high concentrations in various products humans directly consume, Polyglycerols may have severe side effects. Moreover, some people may also be allergic to polyglycerols in various items such as food products, cosmetics, and personal care products and may experience skin-related allergies and rashes. Apart from this, owing to the suitable side effects of polyglycerols, various regulatory bodies and organizations have set limits for using polyglycerols in different applications.
Recent Development
- In July 2022, Oleon signed a land acquisition agreement with Central Spectrum. It was an important milestone for Oleon's continued growth in Malaysia. This will enhance the company to growth and expands its facilities
Asia-Pacific Polyglycerol Market Scope
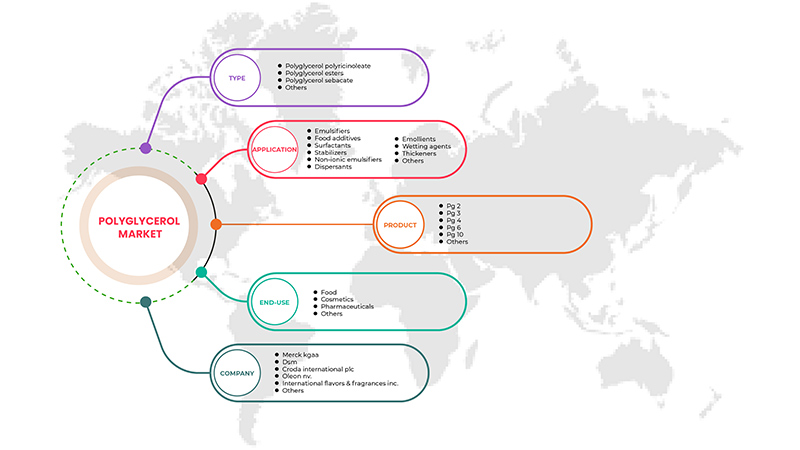
Asia-Pacific polyglycerol market is categorized based on type, product, application, and end-user. The growth amongst these segments will help you analyze major growth segments in the industries and provide the users with a valuable market overview and market insights to make strategic decisions to identify core market applications.
Type
- Polyglycerol Polyricinoleate
- Polyglycerol Esters
- Polyglycerol Sebacate
- Others
Based on type, the Asia-Pacific polyglycerol market is classified into four segments polyglycerol Polyricinoleate, polyglycerol esters, polyglycerol sebacate, and others.
Product
- PG 3
- PG 4
- PG 2
- PG 6
- PG 10
- Others
Based on product, the Asia-Pacific polyglycerol market is classified into six segments PG 2, PG 3, PG 4, PG 6, PG 10, and others.
Application
- Emulsifiers
- Food Additives
- Surfactants
- Stabilizers
- Non-Ionic Emulsifiers
- Dispersants
- Emollients
- Wetting Agents
- Thickeners
- Others
Based on the application, the Asia-Pacific polyglycerol market is classified into ten segments food additives, surfactants, emulsifiers, stabilizers, nonionic emulsifiers, nonionic emulsifiers, emollients, wetting agents, thickeners, and others.
End-Use
- Cosmetics
- Food
- Pharmaceuticals
- Others
Based on end-use, the Asia-Pacific polyglycerol market is classified into four segments food, cosmetics, pharmaceuticals, and others.
Asia-Pacific Polyglycerol Market Regional Analysis/Insights
Asia-Pacific polyglycerol market is segmented on the basis of type, product, application, and end-user.
The countries in the Asia-Pacific polyglycerol market are Japan, China, South Korea, India, Singapore, Thailand, Indonesia, Malaysia, Philippines, Australia & New Zealand and the Rest of Asia-Pacific.
China is dominating the Asia-Pacific polyglycerol market in terms of market share and market revenue due to growing awareness of the excellent characteristics and properties of polyglycerol in the region.
The country section of the report also provides individual market-impacting factors and changes in market regulation that impact the current and future trends of the market. Data point downstream and upstream value chain analysis, technical trends, porter's five forces analysis, and case studies are some of the pointers used to forecast the market scenario for individual countries. Also, the presence and availability of Asia-Pacific brands and their challenges faced due to large or scarce competition from local and domestic brands, the impact of domestic tariffs, and trade routes are considered while providing forecast analysis of the country data.
Competitive Landscape and Asia-Pacific Polyglycerol Market Share Analysis
Asia-Pacific polyglycerol market competitive landscape provides details by competitors. Details included are company overview, company financials, revenue generated, market potential, investment in research and development, new market initiatives, production sites and facilities, company strengths and weaknesses, product launch, product trials pipelines, product approvals, patents, product width and breadth, application dominance, technology lifeline curve. The above data points only relate to the company's focus on the Asia-Pacific Polyglycerol market.
Some of the prominent participants operating in the Asia-Pacific polyglycerol market are Taiyo Kagaku Co., Ltd., Estelle Chemicals Pvt. Ltd., NOVEL CHEM, SPELL ORGANICS LTD, Oleon NV., Spiga Nord S.p.A, Salamoto Yakuhin Kogyo Co., Ltd., DSM, Merck KGaA, Croda International Plc, and International Flavors & Fragrances Inc.
Research Methodology
Data collection and base year analysis are done using data collection modules with large sample sizes. The market data is analyzed and estimated using market statistical and coherent models. In addition, market share analysis and key trend analysis are the major success factors in the market report. The key research methodology used by the DBMR research team is data triangulation which involves data mining, analysis of the impact of data variables on the market, and primary (industry expert) validation. Data models include Vendor Positioning grids, Market Time Line Analysis, Market Overview and Guide, Company Positioning grids, Company Market Share Analysis, Standards of Measurement, Asia-Pacific Vs. Regional and Vendor Share Analysis. Please request an analyst call in case of further inquiry.
SKU-
Accédez en ligne au rapport sur le premier cloud mondial de veille économique

- Tableau de bord d'analyse de données interactif
- Tableau de bord d'analyse d'entreprise pour les opportunités à fort potentiel de croissance
- Accès d'analyste de recherche pour la personnalisation et les requêtes
- Analyse de la concurrence avec tableau de bord interactif
- Dernières actualités, mises à jour et analyse des tendances
- Exploitez la puissance de l'analyse comparative pour un suivi complet de la concurrence
Table des matières
1 INTRODUCTION
1.1 OBJECTIFS DE L'ÉTUDE
1.2 DÉFINITION DU MARCHÉ
1.3 APERÇU DU MARCHÉ DES POLYGLYCÉROLS EN ASIE-PACIFIQUE
1.4 LIMITATIONS
1,5 MARCHÉS COUVERTS
2 SEGMENTATION DU MARCHÉ
2.1 MARCHÉS COUVERTS
2.2 PORTÉE GÉOGRAPHIQUE
2,3 ANS CONSIDÉRÉS POUR L'ÉTUDE
2.4 MONNAIE ET TARIFS
2.5 MODÈLE DE VALIDATION DES DONNÉES DU TRÉPIED DBMR
2.6 COURBE DE VIE DU PRODUIT
2.7 MODÉLISATION MULTIVARIÉE
2.8 ENTRETIENS PRIMAIRES AVEC DES LEADERS D'OPINION CLÉS
2.9 GRILLE DE POSITIONNEMENT DU MARCHÉ DBMR
2.1 GRILLE DE COUVERTURE DES UTILISATIONS FINALES DU MARCHÉ
2.11 MATRICE DES DÉFIS DU MARCHÉ DBMR
2.12 ANALYSE DES PARTS DES FOURNISSEURS DBMR
2.13 DONNÉES D'IMPORTATION-EXPORTATION
2.14 SOURCES SECONDAIRES
2.15 HYPOTHÈSES
3 RÉSUMÉ EXÉCUTIF
4 INFORMATIONS PREMIUM
4.1 ANALYSE DU PILON
4.1.1 FACTEURS POLITIQUES
4.1.2 FACTEURS ÉCONOMIQUES
4.1.3 FACTEURS SOCIAUX
4.1.4 FACTEURS TECHNOLOGIQUES
4.1.5 FACTEURS JURIDIQUES
4.1.6 FACTEURS ENVIRONNEMENTAUX
4.2 LES CINQ FORCES DE PORTER :
4.2.1 LA MENACE DES NOUVEAUX ENTRANTS :
4.2.2 LA MENACE DES SUBSTITUTS :
4.2.3 POUVOIR DE NÉGOCIATION DU CLIENT :
4.2.4 POUVOIR DE NÉGOCIATION DES FOURNISSEURS :
4.2.5 CONCURRENCE INTERNE (RIVALITÉ) :
4.3 SCÉNARIO DE CHANGEMENT CLIMATIQUE
4.3.1 PRÉOCCUPATIONS ENVIRONNEMENTALES
4.3.2 RÉPONSE DE L'INDUSTRIE
4.3.3 RÔLE DU GOUVERNEMENT
4.3.4 RECOMMANDATION DE L'ANALYSTE
4.4 SCÉNARIO D'IMPORT-EXPORT
4.5 POLYGLYCÉROL UTILISÉ DANS L'INDUSTRIE COSMÉTIQUE COMME TENSIOACTIF
4.6 ANALYSE DE LA PRODUCTION ET DE LA CONSOMMATION - MARCHÉ DES POLYGLYCÉROLS EN ASIE-PACIFIQUE
4.7 COUVERTURE DE LA PRODUCTION DE MATIÈRES PREMIÈRES
4.8 ANALYSE DE LA CHAÎNE D'APPROVISIONNEMENT
4.8.1 APERÇU
4.8.2 SCÉNARIO DE COÛTS LOGISTIQUES
4.8.3 IMPORTANCE DES PRESTATAIRES DE SERVICES LOGISTIQUES
4.9 AVANCEMENT TECHNOLOGIQUE DES FABRICANTS
4.1 CRITÈRES DE SÉLECTION DES FOURNISSEURS
5 COUVERTURE RÉGLEMENTAIRE
RÉSUMÉ DES 6 PAYS - CORÉE DU SUD
7 APERÇU DU MARCHÉ
7.1 PILOTES
7.1.1 PROBLÉMATIQUE DE CONSOMMATION D'ADDITIFS ALIMENTAIRES DANS L'INDUSTRIE ALIMENTAIRE ET DES BOISSONS
7.1.2 POPULARITÉ CROISSANTE DES POLYGLYCÉROLS DANS L'INDUSTRIE COSMÉTIQUE
7.1.3 SENSIBILISATION CROISSANTE AUX PROPRIÉTÉS DES POLYGLYCÉROLS
7.2 RESTRICTIONS
7.2.1 DISPONIBILITÉ FACILE DE SUBSTITUTS
7.2.2 EFFETS NÉFASTES SUR LA SANTÉ
7.3 OPPORTUNITÉS
7.3.1 PRÉVALENCE AUGMENTANTE DES MALADIES MÉDICALES ET DÉVELOPPEMENT DU SECTEUR DE LA SANTÉ
7.3.2 ADOPTION CROISSANTE DES POLYGLYCÉROLS COMME ADDITIF DANS LES BIOCARBURANT
7.4 DÉFIS
7.4.1 FLUCTUATION DES COÛTS DES MATIÈRES PREMIÈRES
8 MARCHÉ DES POLYGLYCÉROLS EN ASIE-PACIFIQUE, PAR TYPE
8.1 APERÇU
8.2 POLYRICINOLÉATE DE POLYGLYCÉROL
8.3 ESTERS DE POLYGLYCÉROL
8.4 SÉBACATE DE POLYGLYCÉROL
8,5 AUTRES
9 MARCHÉ DES POLYGLYCÉROLS EN ASIE-PACIFIQUE, PAR PRODUIT
9.1 APERÇU
9.2 PG 3
9.3 PG 4
9.4 PG 2
9,5 PG 6
9,6 PG 10
9.7 AUTRES
10 MARCHÉ DES POLYGLYCÉROLS EN ASIE-PACIFIQUE, PAR APPLICATION
10.1 APERÇU
10.2 ÉMULSIFIANTS
10.3 ADDITIFS ALIMENTAIRES
10.4 TENSIOACTIFS
10.5 STABILISATEURS
10.6 ÉMULSIFIANTS NON IONIQUES
10.7 DISPERSANTS
10.8 ÉMOLLIENTS
10.9 AGENTS MOUILLANTS
10.1 ÉPAISSISSANTS
10.11 AUTRES
11 MARCHÉ DES POLYGLYCÉROLS EN ASIE-PACIFIQUE, PAR UTILISATION FINALE
11.1 APERÇU
11.2 COSMÉTIQUES
11.2.1 BRILLANT À LÈVRES
11.2.2 FONDATION
11.2.3 SÉRUMS ANTI-ÂGE
11.2.4 SÉRUMS À BASE D'HUILE
11.2.5 BAUMES À LÈVRES
11.2.6 HYDRATANTS
11.2.7 APRÈS-SHAMPOOINGS
11.2.8 COSMÉTIQUES COLORANTS
11.2.9 MASCARA
11.2.10 CRÈMES
11.2.11 AUTRES
11.3 ALIMENTATION
11.3.1 BOULANGERIE
11.3.1.1 PAIN ET PETITS PAINS
11.3.1.2 GÂTEAUX, PÂTISSERIES ET TRUFFES
11.3.1.3 BISCUITS, COOKIES ET CRACKERS
11.3.1.4 TARTES ET TOURTES
11.3.1.5 BROWNIES
11.3.1.6 ROULEAUX SUISSES
11.3.1.7 AUTRES
11.3.2 CONFISERIE
11.3.2.1 BONBONS GELÉS
11.3.2.2 BARRES CHOCOLATÉES
11.3.2.3 CONFITURES ET GELÉES
11.3.2.4 CONFITURES
11.3.2.5 DESSERT À LA GELÉE DE FRUITS
11.3.2.6 GARNITURES
11.3.2.7 AUTRES
11.3.3 PRODUITS PÉTROLIERS
11.3.4 DESSERTS
11.4 PRODUITS PHARMACEUTIQUES
11,5 AUTRES
12 MARCHÉ DES POLYGLYCÉROLS EN ASIE-PACIFIQUE, PAR RÉGION
12.1 ASIE-PACIFIQUE
12.1.1 CHINE
12.1.2 INDE
12.1.3 JAPON
12.1.4 CORÉE DU SUD
12.1.5 THAÏLANDE
12.1.6 SINGAPOUR
12.1.7 INDONÉSIE
12.1.8 AUSTRALIE ET NOUVELLE-ZÉLANDE
12.1.9 PHILIPPINES
12.1.10 MALAISIE
12.1.11 RESTE DE L'ASIE-PACIFIQUE
13 MARCHÉ DES POLYGLYCÉROLS EN ASIE-PACIFIQUE : PAYSAGE DES ENTREPRISES
13.1 ANALYSE DES ACTIONS DE L'ENTREPRISE : ASIE-PACIFIQUE
13.1.1 PARTENARIAT
13.1.2 EXPANSION DES INSTALLATIONS
13.1.3 PRIX
13.2 FUSION
13.2.1 ÉVÉNEMENT
14 ANALYSE SWOT
15 PROFILS D'ENTREPRISE
15.1 MERCK KGAA
15.1.1 INSTANTANÉ DE L'ENTREPRISE
15.1.2 ANALYSE DES REVENUS
15.1.3 ANALYSE DES ACTIONS DE LA SOCIÉTÉ
15.1.4 SWOT
15.1.5 PORTEFEUILLE DE PRODUITS
15.1.6 MISES À JOUR RÉCENTES
15.2 DSM
15.2.1 INSTANTANÉ DE L'ENTREPRISE
15.2.2 ANALYSE DES REVENUS
15.2.3 ANALYSE DES ACTIONS DE L'ENTREPRISE
15.2.4 SWOT
15.2.5 PORTEFEUILLE DE PRODUITS
15.2.6 MISES À JOUR RÉCENTES
15.3 CRODA INTERNATIONAL PLC
15.3.1 INSTANTANÉ DE L'ENTREPRISE
15.3.2 ANALYSE DES REVENUS
15.3.3 ANALYSE DES ACTIONS DE L'ENTREPRISE
15.3.4 SWOT
15.3.5 PORTEFEUILLE DE PRODUITS
15.3.6 MISES À JOUR RÉCENTES
15.4 OLEON NV.
15.4.1 INSTANTANÉ DE L'ENTREPRISE
15.4.2 ANALYSE DES ACTIONS DE L'ENTREPRISE
15.4.3 SWOT
15.4.4 PORTEFEUILLE DE PRODUITS
15.4.5 MISES À JOUR RÉCENTES
15.5 INTERNATIONAL FLAVORS & FRAGRANCES INC.
15.5.1 INSTANTANÉ DE L'ENTREPRISE
15.5.2 ANALYSE DES REVENUS
15.5.3 ANALYSE DES ACTIONS DE L'ENTREPRISE
15.5.4 SWOT
15.5.5 PORTEFEUILLE DE PRODUITS
15.5.6 MISES À JOUR RÉCENTES
15.6 ESTELLE CHEMICALS PVT. LTD.
15.6.1 INSTANTANÉ DE L'ENTREPRISE
15.6.2 SWOT
15.6.3 CAPACITÉ DE PRODUCTION
15.6.4 PORTEFEUILLE DE PRODUITS
15.6.5 MISES À JOUR RÉCENTES
15.7 NOUVELLE CHIMIE
15.7.1 INSTANTANÉ DE L'ENTREPRISE
15.7.2 SWOT
15.7.3 PORTEFEUILLE DE PRODUITS
15.7.4 MISES À JOUR RÉCENTES
15.8 SALAMOTO YAKUHIN KOGYO CO., LTD.
15.8.1 INSTANTANÉ DE L'ENTREPRISE
15.8.2 SWOT
15.8.3 PORTEFEUILLE DE PRODUITS
15.8.4 MISES À JOUR RÉCENTES
15.9 SPELL ORGANICS LTD
15.9.1 INSTANTANÉ DE L'ENTREPRISE
15.9.2 SWOT
15.9.3 PORTEFEUILLE DE PRODUITS
15.9.4 MISES À JOUR RÉCENTES
15.1 SPIGA NORD SPA
15.10.1 INSTANTANÉ DE L'ENTREPRISE
15.10.2 SWOT
15.10.3 PORTEFEUILLE DE PRODUITS
15.10.4 MISES À JOUR RÉCENTES
15.11 TAIYO KAGAKU CO., LTD.
15.11.1 INSTANTANÉ DE L'ENTREPRISE
15.11.2 SWOT
15.11.3 PORTEFEUILLE DE PRODUITS
15.11.4 MISES À JOUR RÉCENTES
16 QUESTIONNAIRE
17 RAPPORTS CONNEXES
Liste des tableaux
TABLEAU 1 DONNÉES D'IMPORTATION D'ACIDE PALMITIQUE, D'ACIDE STÉARIQUE, DE LEURS SELS ET ESTERS ; CODE SH – 291570 (MILLIERS USD)
TABLEAU 2 DONNÉES D'EXPORTATION D'ACIDE PALMITIQUE, D'ACIDE STÉARIQUE, DE LEURS SELS ET ESTERS ; CODE SH – 291570 (MILLIERS USD)
TABLEAU 3 CADRE RÉGLEMENTAIRE
TABLEAU 4 MARCHÉ DES POLYGLYCÉROLS EN ASIE-PACIFIQUE, PAR TYPE, 2020-2029 (EN MILLIONS USD)
TABLEAU 5 MARCHÉ DES POLYGLYCÉROLS EN ASIE-PACIFIQUE, PAR TYPE, 2020-2029 (KILO TONNES)
TABLEAU 6 MARCHÉ DES POLYGLYCÉROLS EN ASIE-PACIFIQUE, PAR TYPE, 2020-2029 (PRIX)
TABLEAU 7 MARCHÉ DU POLYRICINOLÉATE DE POLYGLYCÉROL EN ASIE-PACIFIQUE, PAR RÉGION, 2020-2029 (EN MILLIONS USD)
TABLEAU 8 MARCHÉ DU POLYRICINOLÉATE DE POLYGLYCÉROL EN ASIE-PACIFIQUE, PAR RÉGION, 2020-2029 (KILO TONNES)
TABLEAU 9 ESTERS DE POLYGLYCÉROL SUR LE MARCHÉ DES POLYGLYCÉROLS EN ASIE-PACIFIQUE, PAR RÉGION, 2020-2029 (EN MILLIONS USD)
TABLEAU 10 ESTERS DE POLYGLYCÉROL SUR LE MARCHÉ DES POLYGLYCÉROLS EN ASIE-PACIFIQUE, PAR RÉGION, 2020-2029 (KILO TONNES)
TABLEAU 11 MARCHÉ DU SÉBACATE DE POLYGLYCÉROL EN ASIE-PACIFIQUE, PAR RÉGION, 2020-2029 (EN MILLIONS USD)
TABLEAU 12 SÉBACATE DE POLYGLYCÉROL SUR LE MARCHÉ DES POLYGLYCÉROLS EN ASIE-PACIFIQUE, PAR RÉGION, 2020-2029 (KILO TONNES)
TABLEAU 13 AUTRES ENTREPRISES SUR LE MARCHÉ DES POLYGLYCÉROLS EN ASIE-PACIFIQUE, PAR RÉGION, 2020-2029 (EN MILLIONS USD)
TABLEAU 14 AUTRES MARCHÉS DES POLYGLYCÉROLS EN ASIE-PACIFIQUE, PAR RÉGION, 2020-2029 (KILO TONNES)
TABLEAU 15 MARCHÉ DES POLYGLYCÉROLS EN ASIE-PACIFIQUE, PAR PRODUIT, 2020-2029 (EN MILLIONS USD)
TABLEAU 16 MARCHÉ DES POLYGLYCÉROLS EN ASIE-PACIFIQUE, PAR PRODUIT, 2020-2029 (KILO TONNES)
TABLEAU 17 MARCHÉ DES POLYGLYCÉROLS EN ASIE-PACIFIQUE, PAR PRODUIT, 2020-2029 (PRIX)
TABLEAU 18 ASIE-PACIFIQUE PG 3 SUR LE MARCHÉ DES POLYGLYCÉROLS, PAR RÉGION, 2020-2029 (EN MILLIONS USD)
TABLEAU 19 ASIE-PACIFIQUE PG 3 SUR LE MARCHÉ DES POLYGLYCÉROLS, PAR RÉGION, 2020-2029 (KILO TONNES)
TABLEAU 20 ASIE-PACIFIQUE PG 4 SUR LE MARCHÉ DES POLYGLYCÉROLS, PAR RÉGION, 2020-2029 (EN MILLIONS USD)
TABLEAU 21 ASIE-PACIFIQUE PG 4 SUR LE MARCHÉ DES POLYGLYCÉROLS, PAR RÉGION, 2020-2029 (KILO TONNES)
TABLEAU 22 MARCHÉ DES POLYGLYCÉROLS EN ASIE-PACIFIQUE, PAR RÉGION, 2020-2029 (EN MILLIONS USD)
TABLEAU 23 ASIE-PACIFIQUE PG 2 SUR LE MARCHÉ DES POLYGLYCÉROLS, PAR RÉGION, 2020-2029 (KILO TONNES)
TABLEAU 24 ASIE-PACIFIQUE PG 6 SUR LE MARCHÉ DES POLYGLYCÉROLS, PAR RÉGION, 2020-2029 (EN MILLIONS USD)
TABLEAU 25 ASIE-PACIFIQUE PG 6 SUR LE MARCHÉ DES POLYGLYCÉROLS, PAR RÉGION, 2020-2029 (KILO TONNES)
TABLEAU 26 ASIE-PACIFIQUE PG 10 SUR LE MARCHÉ DES POLYGLYCÉROLS, PAR RÉGION, 2020-2029 (EN MILLIONS USD)
TABLEAU 27 ASIE-PACIFIQUE PG 10 SUR LE MARCHÉ DES POLYGLYCÉROLS, PAR RÉGION, 2020-2029 (KILO TONNES)
TABLEAU 28 AUTRES ENTREPRISES SUR LE MARCHÉ DES POLYGLYCÉROLS EN ASIE-PACIFIQUE, PAR RÉGION, 2020-2029 (EN MILLIONS USD)
TABLEAU 29 AUTRES MARCHÉS DES POLYGLYCÉROLS EN ASIE-PACIFIQUE, PAR RÉGION, 2020-2029 (KILO TONNES)
TABLEAU 30 MARCHÉ DES POLYGLYCÉROLS EN ASIE-PACIFIQUE, PAR APPLICATION, 2020-2029 (EN MILLIONS USD)
TABLEAU 31 MARCHÉ DES POLYGLYCÉROLS EN ASIE-PACIFIQUE, PAR APPLICATION, 2020-2029 (KILO TONNES)
TABLEAU 32 MARCHÉ DES POLYGLYCÉROLS EN ASIE-PACIFIQUE, PAR APPLICATION, 2020-2029 (PRIX)
TABLEAU 33 ÉMULSIFIANTS SUR LE MARCHÉ DES POLYGLYCÉROLS EN ASIE-PACIFIQUE, PAR RÉGION, 2020-2029 (EN MILLIONS USD)
TABLEAU 34 ÉMULSIFIANTS SUR LE MARCHÉ DES POLYGLYCÉROLS EN ASIE-PACIFIQUE, PAR RÉGION, 2020-2029 (KILO TONNES)
TABLEAU 35 ADDITIFS ALIMENTAIRES SUR LE MARCHÉ DES POLYGLYCÉROLS EN ASIE-PACIFIQUE, PAR RÉGION, 2020-2029 (EN MILLIONS USD)
TABLEAU 36 ADDITIFS ALIMENTAIRES SUR LE MARCHÉ DES POLYGLYCÉROLS EN ASIE-PACIFIQUE, PAR RÉGION, 2020-2029 (KILO TONNES)
TABLEAU 37 ASIE-PACIFIQUE : MARCHÉ DES TENSIOACTIFS SUR LES POLYGLYCÉROLS, PAR RÉGION, 2020-2029 (EN MILLIONS USD)
TABLEAU 38 ASIE-PACIFIQUE : TENSIOACTIFS SUR LE MARCHÉ DES POLYGLYCÉROLS, PAR RÉGION, 2020-2029 (KILO TONNES)
TABLEAU 39 STABILISANTS DU MARCHÉ DES POLYGLYCÉROLS EN ASIE-PACIFIQUE, PAR RÉGION, 2020-2029 (EN MILLIONS USD)
TABLEAU 40 STABILISANTS SUR LE MARCHÉ DES POLYGLYCÉROLS EN ASIE-PACIFIQUE, PAR RÉGION, 2020-2029 (KILO TONNES)
TABLEAU 41 MARCHÉ DES ÉMULSIFIANTS NON IONIQUES DANS LE POLYGLYCÉROL EN ASIE-PACIFIQUE, PAR RÉGION, 2020-2029 (EN MILLIONS USD)
TABLEAU 42 ÉMULSIFIANTS NON IONIQUES SUR LE MARCHÉ DES POLYGLYCÉROLS EN ASIE-PACIFIQUE, PAR RÉGION, 2020-2029 (KILO TONNES)
TABLEAU 43 ASIE-PACIFIQUE : MARCHÉ DES DISPERSANTS SUR LE MARCHÉ DES POLYGLYCÉROLS, PAR RÉGION, 2020-2029 (EN MILLIONS USD)
TABLEAU 44 ASIE-PACIFIQUE : DISPERSANTS SUR LE MARCHÉ DES POLYGLYCÉROLS, PAR RÉGION, 2020-2029 (KILO TONNES)
TABLEAU 45 MARCHÉ DES ÉMOLLIENTS DANS LES POLYGLYCÉROLS EN ASIE-PACIFIQUE, PAR RÉGION, 2020-2029 (EN MILLIONS USD)
TABLEAU 46 MARCHÉ DES ÉMOLLIENTS DANS LE POLYGLYCÉROL EN ASIE-PACIFIQUE, PAR RÉGION, 2020-2029 (KILO TONNES)
TABLEAU 47 AGENTS MOUILLANTS SUR LE MARCHÉ DES POLYGLYCÉROLS EN ASIE-PACIFIQUE, PAR RÉGION, 2020-2029 (EN MILLIONS USD)
TABLEAU 48 AGENTS MOUILLANTS SUR LE MARCHÉ DES POLYGLYCÉROLS EN ASIE-PACIFIQUE, PAR RÉGION, 2020-2029 (KILO TONNES)
TABLEAU 49 ÉPAISSISSANTS SUR LE MARCHÉ DES POLYGLYCÉROLS EN ASIE-PACIFIQUE, PAR RÉGION, 2020-2029 (EN MILLIONS USD)
TABLEAU 50 ÉPAISSISSANTS SUR LE MARCHÉ DES POLYGLYCÉROLS EN ASIE-PACIFIQUE, PAR RÉGION, 2020-2029 (KILO TONNES)
TABLEAU 51 AUTRES ENTREPRISES SUR LE MARCHÉ DES POLYGLYCÉROLS EN ASIE-PACIFIQUE, PAR RÉGION, 2020-2029 (EN MILLIONS USD)
TABLEAU 52 AUTRES MARCHÉS DES POLYGLYCÉROLS EN ASIE-PACIFIQUE, PAR RÉGION, 2020-2029 (KILO TONNES)
TABLEAU 53 MARCHÉ DES POLYGLYCÉROLS EN ASIE-PACIFIQUE, PAR UTILISATION FINALE, 2020-2029 (EN MILLIONS USD)
TABLEAU 54 MARCHÉ DES POLYGLYCÉROLS EN ASIE-PACIFIQUE, PAR UTILISATION FINALE, 2020-2029 (KILO TONNES)
TABLEAU 55 MARCHÉ DES POLYGLYCÉROLS EN ASIE-PACIFIQUE, PAR UTILISATION FINALE, 2020-2029 (PRIX)
TABLEAU 56 MARCHÉ DES COSMÉTIQUES À BASE DE POLYGLYCÉROL EN ASIE-PACIFIQUE, PAR RÉGION, 2020-2029 (EN MILLIONS USD)
TABLEAU 57 MARCHÉ DES COSMÉTIQUES À BASE DE POLYGLYCÉROL EN ASIE-PACIFIQUE, PAR RÉGION, 2020-2029 (KILO TONNES)
TABLEAU 58 MARCHÉ DES COSMÉTIQUES À BASE DE POLYGLYCÉROL EN ASIE-PACIFIQUE, PAR TYPE, 2020-2029 (EN MILLIONS USD)
TABLEAU 59 MARCHÉ DES ALIMENTS EN POLYGLYCÉROLS EN ASIE-PACIFIQUE, PAR RÉGION, 2020-2029 (EN MILLIONS USD)
TABLEAU 60 MARCHÉ DES ALIMENTS EN POLYGLYCÉROLS EN ASIE-PACIFIQUE, PAR RÉGION, 2020-2029 (KILO TONNES)
TABLEAU 61 MARCHÉ DES ALIMENTS À BASE DE POLYGLYCÉROLS EN ASIE-PACIFIQUE, PAR TYPE, 2020-2029 (EN MILLIONS USD)
TABLEAU 62 MARCHÉ DES PRODUITS DE BOULANGERIE EN ASIE-PACIFIQUE, PAR TYPE, 2020-2029 (EN MILLIONS USD)
TABLEAU 63 MARCHÉ DES PRODUITS DE BOULANGERIE EN ASIE-PACIFIQUE, PAR TYPE, 2020-2029 (EN MILLIONS USD)
TABLEAU 64 PRODUITS PHARMACEUTIQUES SUR LE MARCHÉ DES POLYGLYCÉROLS EN ASIE-PACIFIQUE, PAR RÉGION, 2020-2029 (EN MILLIONS USD)
TABLEAU 65 PRODUITS PHARMACEUTIQUES SUR LE MARCHÉ DES POLYGLYCÉROLS EN ASIE-PACIFIQUE, PAR RÉGION, 2020-2029 (KILO TONNES)
TABLEAU 66 AUTRES ENTREPRISES SUR LE MARCHÉ DES POLYGLYCÉROLS EN ASIE-PACIFIQUE, PAR RÉGION, 2020-2029 (EN MILLIONS USD)
TABLEAU 67 AUTRES MARCHÉS DES POLYGLYCÉROLS EN ASIE-PACIFIQUE, PAR RÉGION, 2020-2029 (KILO TONNES)
TABLEAU 68 MARCHÉ DES POLYGLYCÉROLS EN ASIE-PACIFIQUE, PAR PAYS, 2020-2029 (EN MILLIONS USD)
TABLEAU 69 MARCHÉ DES POLYGLYCÉROLS EN ASIE-PACIFIQUE, PAR PAYS, 2020-2029 (KILO TONNES)
TABLEAU 70 MARCHÉ DES POLYGLYCÉROLS EN ASIE-PACIFIQUE, PAR TYPE, 2020-2029 (EN MILLIONS USD)
TABLEAU 71 MARCHÉ DES POLYGLYCÉROLS EN ASIE-PACIFIQUE, PAR TYPE, 2020-2029 (KILO TONNES)
TABLEAU 72 MARCHÉ DES POLYGLYCÉROLS EN ASIE-PACIFIQUE, PAR PRODUIT, 2020-2029 (EN MILLIONS USD)
TABLEAU 73 MARCHÉ DES POLYGLYCÉROLS EN ASIE-PACIFIQUE, PAR PRODUIT, 2020-2029 (KILO TONNES)
TABLEAU 74 MARCHÉ DES POLYGLYCÉROLS EN ASIE-PACIFIQUE, PAR APPLICATION, 2020-2029 (EN MILLIONS USD)
TABLEAU 75 MARCHÉ DES POLYGLYCÉROLS EN ASIE-PACIFIQUE, PAR APPLICATION, 2020-2029 (KILO TONNES)
TABLEAU 76 MARCHÉ DES POLYGLYCÉROLS EN ASIE-PACIFIQUE, PAR UTILISATION FINALE, 2020-2029 (EN MILLIONS USD)
TABLEAU 77 MARCHÉ DES POLYGLYCÉROLS EN ASIE-PACIFIQUE, PAR UTILISATION FINALE, 2020-2029 (KILO TONNES)
TABLEAU 78 MARCHÉ DES ALIMENTS À BASE DE POLYGLYCÉROLS EN ASIE-PACIFIQUE, PAR TYPE, 2020-2029 (EN MILLIONS USD)
TABLEAU 79 MARCHÉ DES PRODUITS DE BOULANGERIE EN ASIE-PACIFIQUE, PAR TYPE, 2020-2029 (EN MILLIONS USD)
TABLEAU 80 MARCHÉ DES CONFISERIES À BASE DE POLYGLYCÉROLS EN ASIE-PACIFIQUE, PAR TYPE, 2020-2029 (EN MILLIONS USD)
TABLEAU 81 MARCHÉ DES COSMÉTIQUES À BASE DE POLYGLYCÉROL EN ASIE-PACIFIQUE, PAR TYPE, 2020-2029 (EN MILLIONS USD)
TABLEAU 82 MARCHÉ CHINOIS DES POLYGLYCÉROLS, PAR TYPE, 2020-2029 (EN MILLIONS USD)
TABLEAU 83 MARCHÉ DES POLYGLYCÉROLS EN CHINE, PAR TYPE, 2020-2029 (KILO TONNES)
TABLEAU 84 MARCHÉ CHINOIS DES POLYGLYCÉROLS, PAR PRODUIT, 2020-2029 (EN MILLIONS USD)
TABLEAU 85 MARCHÉ DES POLYGLYCÉROLS EN CHINE, PAR PRODUIT, 2020-2029 (KILO TONNES)
TABLEAU 86 MARCHÉ DES POLYGLYCÉROLS EN CHINE, PAR APPLICATION, 2020-2029 (EN MILLIONS USD)
TABLEAU 87 MARCHÉ DES POLYGLYCÉROLS EN CHINE, PAR APPLICATION, 2020-2029 (KILO TONNES)
TABLEAU 88 MARCHÉ DES POLYGLYCÉROLS EN CHINE, PAR UTILISATION FINALE, 2020-2029 (EN MILLIONS USD)
TABLEAU 89 MARCHÉ DES POLYGLYCÉROLS EN CHINE, PAR UTILISATION FINALE, 2020-2029 (KILO TONNES)
TABLEAU 90 MARCHÉ DES ALIMENTS EN CHINOIS SUR LE MARCHÉ DES POLYGLYCÉROLS, PAR TYPE, 2020-2029 (EN MILLIONS USD)
TABLEAU 91 MARCHÉ DES PRODUITS DE BOULANGERIE EN CHINE, PAR TYPE, 2020-2029 (EN MILLIONS USD)
TABLEAU 92 MARCHÉ DES CONFISERIES CHINOISES SUR LE MARCHÉ DES POLYGLYCÉROLS, PAR TYPE, 2020-2029 (EN MILLIONS USD)
TABLEAU 93 MARCHÉ DES COSMÉTIQUES À BASE DE POLYGLYCÉROL EN CHINE, PAR TYPE, 2020-2029 (EN MILLIONS USD)
TABLEAU 94 MARCHÉ INDIEN DES POLYGLYCÉROLS, PAR TYPE, 2020-2029 (EN MILLIONS USD)
TABLEAU 95 MARCHÉ INDIEN DES POLYGLYCÉROLS, PAR TYPE, 2020-2029 (KILO TONNES)
TABLEAU 96 MARCHÉ INDIEN DU POLYGLYCÉROL, PAR PRODUIT, 2020-2029 (EN MILLIONS USD)
TABLEAU 97 MARCHÉ INDIEN DES POLYGLYCÉROLS, PAR PRODUIT, 2020-2029 (KILO TONNES)
TABLEAU 98 MARCHÉ INDIEN DES POLYGLYCÉROLS, PAR APPLICATION, 2020-2029 (EN MILLIONS USD)
TABLEAU 99 MARCHÉ INDIEN DES POLYGLYCÉROLS, PAR APPLICATION, 2020-2029 (KILO TONNES)
TABLEAU 100 MARCHÉ INDIEN DU POLYGLYCÉROL, PAR UTILISATION FINALE, 2020-2029 (EN MILLIONS USD)
TABLEAU 101 MARCHÉ INDIEN DU POLYGLYCÉROL, PAR UTILISATION FINALE, 2020-2029 (KILO TONNES)
TABLEAU 102 MARCHÉ INDIEN DES ALIMENTS À BASE DE POLYGLYCÉROLS, PAR TYPE, 2020-2029 (EN MILLIONS USD)
TABLEAU 103 MARCHÉ INDIEN DES POLYGLYCÉROLS DANS LA BOULANGERIE, PAR TYPE, 2020-2029 (EN MILLIONS USD)
TABLEAU 104 MARCHÉ INDIEN DES CONFISERIES SUR LE MARCHÉ DES POLYGLYCÉROLS, PAR TYPE, 2020-2029 (EN MILLIONS USD)
TABLEAU 105 MARCHÉ INDIEN DES COSMÉTIQUES À BASE DE POLYGLYCÉROL, PAR TYPE, 2020-2029 (EN MILLIONS USD)
TABLEAU 106 MARCHÉ JAPONAIS DES POLYGLYCÉROLS, PAR TYPE, 2020-2029 (EN MILLIONS USD)
TABLEAU 107 MARCHÉ JAPONAIS DES POLYGLYCÉROLS, PAR TYPE, 2020-2029 (KILO TONNES)
TABLEAU 108 MARCHÉ JAPONAIS DES POLYGLYCÉROLS, PAR PRODUIT, 2020-2029 (EN MILLIONS USD)
TABLEAU 109 MARCHÉ JAPONAIS DES POLYGLYCÉROLS, PAR PRODUIT, 2020-2029 (KILO TONNES)
TABLEAU 110 MARCHÉ JAPONAIS DES POLYGLYCÉROLS, PAR APPLICATION, 2020-2029 (EN MILLIONS USD)
TABLEAU 111 MARCHÉ JAPONAIS DES POLYGLYCÉROLS, PAR APPLICATION, 2020-2029 (KILO TONNES)
TABLEAU 112 MARCHÉ JAPONAIS DES POLYGLYCÉROLS, PAR UTILISATION FINALE, 2020-2029 (EN MILLIONS USD)
TABLEAU 113 MARCHÉ JAPONAIS DES POLYGLYCÉROLS, PAR UTILISATION FINALE, 2020-2029 (KILO TONNES)
TABLEAU 114 MARCHÉ JAPONAIS DES ALIMENTS À BASE DE POLYGLYCÉROLS, PAR TYPE, 2020-2029 (EN MILLIONS USD)
TABLEAU 115 MARCHÉ JAPONAIS DES PRODUITS DE BOULANGERIE SUR LE MARCHÉ DES POLYGLYCÉROLS, PAR TYPE, 2020-2029 (EN MILLIONS USD)
TABLEAU 116 MARCHÉ JAPONAIS DES CONFISERIES SUR LE MARCHÉ DES POLYGLYCÉROLS, PAR TYPE, 2020-2029 (EN MILLIONS USD)
TABLEAU 117 MARCHÉ JAPONAIS DES COSMÉTIQUES À BASE DE POLYGLYCÉROL, PAR TYPE, 2020-2029 (EN MILLIONS USD)
TABLEAU 118 MARCHÉ DES POLYGLYCÉROLS EN CORÉE DU SUD, PAR TYPE, 2020-2029 (EN MILLIONS USD)
TABLEAU 119 MARCHÉ DES POLYGLYCÉROLS EN CORÉE DU SUD, PAR TYPE, 2020-2029 (KILO TONNES)
TABLEAU 120 MARCHÉ DES POLYGLYCÉROLS EN CORÉE DU SUD, PAR PRODUIT, 2020-2029 (EN MILLIONS USD)
TABLEAU 121 MARCHÉ DES POLYGLYCÉROLS EN CORÉE DU SUD, PAR PRODUIT, 2020-2029 (KILO TONNES)
TABLEAU 122 MARCHÉ DES POLYGLYCÉROLS EN CORÉE DU SUD, PAR APPLICATION, 2020-2029 (EN MILLIONS USD)
TABLEAU 123 MARCHÉ DES POLYGLYCÉROLS EN CORÉE DU SUD, PAR APPLICATION, 2020-2029 (KILO TONNES)
TABLEAU 124 MARCHÉ DES POLYGLYCÉROLS EN CORÉE DU SUD, PAR UTILISATION FINALE, 2020-2029 (EN MILLIONS USD)
TABLEAU 125 MARCHÉ DES POLYGLYCÉROLS EN CORÉE DU SUD, PAR UTILISATION FINALE, 2020-2029 (KILO TONNES)
TABLEAU 126 MARCHÉ DES ALIMENTS SUD-CORÉENS SUR LE MARCHÉ DES POLYGLYCÉROLS, PAR TYPE, 2020-2029 (EN MILLIONS USD)
TABLEAU 127 MARCHÉ DES PRODUITS DE BOULANGERIE SUR LE MARCHÉ DES POLYGLYCÉROLS EN CORÉE DU SUD, PAR TYPE, 2020-2029 (EN MILLIONS USD)
TABLEAU 128 CONFISERIE CORÉENNE SUR LE MARCHÉ DES POLYGLYCÉROLS, PAR TYPE, 2020-2029 (EN MILLIONS USD)
TABLEAU 129 COSMÉTIQUES SUR LE MARCHÉ DES POLYGLYCÉROLS EN CORÉE DU SUD, PAR TYPE, 2020-2029 (EN MILLIONS USD)
TABLEAU 130 MARCHÉ THAÏLANDAIS DU POLYGLYCÉROL, PAR TYPE, 2020-2029 (EN MILLIONS USD)
TABLEAU 131 MARCHÉ THAÏLANDAIS DU POLYGLYCÉROL, PAR TYPE, 2020-2029 (KILO TONNES)
TABLEAU 132 MARCHÉ THAÏLANDAIS DU POLYGLYCÉROL, PAR PRODUIT, 2020-2029 (EN MILLIONS USD)
TABLEAU 133 MARCHÉ THAÏLANDAIS DU POLYGLYCÉROL, PAR PRODUIT, 2020-2029 (KILO TONNES)
TABLEAU 134 MARCHÉ THAÏLANDAIS DU POLYGLYCÉROL, PAR APPLICATION, 2020-2029 (EN MILLIONS USD)
TABLEAU 135 MARCHÉ THAÏLANDAIS DU POLYGLYCÉROL, PAR APPLICATION, 2020-2029 (KILO TONNES)
TABLEAU 136 MARCHÉ THAÏLANDAIS DU POLYGLYCÉROL, PAR UTILISATION FINALE, 2020-2029 (EN MILLIONS USD)
TABLEAU 137 MARCHÉ THAÏLANDAIS DU POLYGLYCÉROL, PAR UTILISATION FINALE, 2020-2029 (KILO TONNES)
TABLEAU 138 MARCHÉ DES ALIMENTS THAÏLANDAIS SUR LE MARCHÉ DES POLYGLYCÉROLS, PAR TYPE, 2020-2029 (EN MILLIONS USD)
TABLEAU 139 MARCHÉ DES PRODUITS DE BOULANGERIE THAÏLANDAIS SUR LE MARCHÉ DES POLYGLYCÉROLS, PAR TYPE, 2020-2029 (EN MILLIONS USD)
TABLEAU 140 CONFISERIE THAÏLANDAISE SUR LE MARCHÉ DES POLYGLYCÉROLS, PAR TYPE, 2020-2029 (EN MILLIONS USD)
TABLEAU 141 MARCHÉ DES COSMÉTIQUES À BASE DE POLYGLYCÉROL EN THAÏLANDE, PAR TYPE, 2020-2029 (EN MILLIONS USD)
TABLEAU 142 MARCHÉ DES POLYGLYCÉROLS À SINGAPOUR, PAR TYPE, 2020-2029 (EN MILLIONS USD)
TABLEAU 143 MARCHÉ DES POLYGLYCÉROLS À SINGAPOUR, PAR TYPE, 2020-2029 (KILO TONNES)
TABLEAU 144 MARCHÉ DES POLYGLYCÉROLS À SINGAPOUR, PAR PRODUIT, 2020-2029 (EN MILLIONS USD)
TABLEAU 145 MARCHÉ DES POLYGLYCÉROLS À SINGAPOUR, PAR PRODUIT, 2020-2029 (KILO TONNES)
TABLEAU 146 MARCHÉ DES POLYGLYCÉROLS À SINGAPOUR, PAR APPLICATION, 2020-2029 (EN MILLIONS USD)
TABLEAU 147 MARCHÉ DES POLYGLYCÉROLS À SINGAPOUR, PAR APPLICATION, 2020-2029 (KILO TONNES)
TABLEAU 148 MARCHÉ DES POLYGLYCÉROLS À SINGAPOUR, PAR UTILISATION FINALE, 2020-2029 (EN MILLIONS USD)
TABLEAU 149 MARCHÉ DES POLYGLYCÉROLS À SINGAPOUR, PAR UTILISATION FINALE, 2020-2029 (KILO TONNES)
TABLEAU 150 MARCHÉ DES ALIMENTS À SINGAPOUR SUR LE MARCHÉ DES POLYGLYCÉROLS, PAR TYPE, 2020-2029 (EN MILLIONS USD)
TABLEAU 151 BOULANGERIE DE SINGAPOUR SUR LE MARCHÉ DES POLYGLYCÉROLS, PAR TYPE, 2020-2029 (EN MILLIONS USD)
TABLEAU 152 CONFISERIE DE SINGAPOUR SUR LE MARCHÉ DES POLYGLYCÉROLS, PAR TYPE, 2020-2029 (EN MILLIONS USD)
TABLEAU 153 MARCHÉ DES COSMÉTIQUES À SINGAPOUR SUR LE MARCHÉ DES POLYGLYCÉROLS, PAR TYPE, 2020-2029 (EN MILLIONS USD)
TABLEAU 154 MARCHÉ INDONÉSIEN DES POLYGLYCÉROLS, PAR TYPE, 2020-2029 (EN MILLIONS USD)
TABLEAU 155 MARCHÉ INDONÉSIEN DES POLYGLYCÉROLS, PAR TYPE, 2020-2029 (KILO TONNES)
TABLEAU 156 MARCHÉ INDONÉSIEN DU POLYGLYCÉROL, PAR PRODUIT, 2020-2029 (EN MILLIONS USD)
TABLEAU 157 MARCHÉ INDONÉSIEN DES POLYGLYCÉROLS, PAR PRODUIT, 2020-2029 (KILO TONNES)
TABLEAU 158 MARCHÉ INDONÉSIEN DES POLYGLYCÉROLS, PAR APPLICATION, 2020-2029 (EN MILLIONS USD)
TABLEAU 159 MARCHÉ INDONÉSIEN DES POLYGLYCÉROLS, PAR APPLICATION, 2020-2029 (KILO TONNES)
TABLEAU 160 MARCHÉ INDONÉSIEN DU POLYGLYCÉROL, PAR UTILISATION FINALE, 2020-2029 (EN MILLIONS USD)
TABLEAU 161 MARCHÉ INDONÉSIEN DES POLYGLYCÉROLS, PAR UTILISATION FINALE, 2020-2029 (KILO TONNES)
TABLEAU 162 MARCHÉ INDONÉSIEN DES ALIMENTS À BASE DE POLYGLYCÉROLS, PAR TYPE, 2020-2029 (EN MILLIONS USD)
TABLEAU 163 MARCHÉ INDONÉSIEN DES PRODUITS DE BOULANGERIE SUR LE MARCHÉ DES POLYGLYCÉROLS, PAR TYPE, 2020-2029 (EN MILLIONS USD)
TABLEAU 164 MARCHÉ INDONÉSIEN DES CONFISERIES SUR LE MARCHÉ DES POLYGLYCÉROLS, PAR TYPE, 2020-2029 (EN MILLIONS USD)
TABLEAU 165 MARCHÉ INDONÉSIEN DES COSMÉTIQUES À BASE DE POLYGLYCÉROL, PAR TYPE, 2020-2029 (EN MILLIONS USD)
TABLEAU 166 MARCHÉ DES POLYGLYCÉROLS EN AUSTRALIE ET EN NOUVELLE-ZÉLANDE, PAR TYPE, 2020-2029 (EN MILLIONS USD)
TABLEAU 167 MARCHÉ DES POLYGLYCÉROLS EN AUSTRALIE ET EN NOUVELLE-ZÉLANDE, PAR TYPE, 2020-2029 (KILO TONNES)
TABLEAU 168 MARCHÉ DES POLYGLYCÉROLS EN AUSTRALIE ET EN NOUVELLE-ZÉLANDE, PAR PRODUIT, 2020-2029 (EN MILLIONS USD)
TABLEAU 169 MARCHÉ DES POLYGLYCÉROLS EN AUSTRALIE ET EN NOUVELLE-ZÉLANDE, PAR PRODUIT, 2020-2029 (KILO TONNES)
TABLEAU 170 MARCHÉ DES POLYGLYCÉROLS EN AUSTRALIE ET EN NOUVELLE-ZÉLANDE, PAR APPLICATION, 2020-2029 (EN MILLIONS USD)
TABLEAU 171 MARCHÉ DES POLYGLYCÉROLS EN AUSTRALIE ET EN NOUVELLE-ZÉLANDE, PAR APPLICATION, 2020-2029 (KILO TONNES)
TABLEAU 172 MARCHÉ DES POLYGLYCÉROLS EN AUSTRALIE ET EN NOUVELLE-ZÉLANDE, PAR UTILISATION FINALE, 2020-2029 (EN MILLIONS USD)
TABLEAU 173 MARCHÉ DES POLYGLYCÉROLS EN AUSTRALIE ET EN NOUVELLE-ZÉLANDE, PAR UTILISATION FINALE, 2020-2029 (KILO TONNES)
TABLEAU 174 MARCHÉ DES ALIMENTS EN POLYGLYCÉROL EN AUSTRALIE ET EN NOUVELLE-ZÉLANDE, PAR TYPE, 2020-2029 (EN MILLIONS USD)
TABLEAU 175 MARCHÉ DES PRODUITS DE BOULANGERIE EN AUSTRALIE ET EN NOUVELLE-ZÉLANDE, PAR TYPE, 2020-2029 (EN MILLIONS USD)
TABLEAU 176 MARCHÉ DES CONFISERIES EN AUSTRALIE ET EN NOUVELLE-ZÉLANDE, PAR TYPE, 2020-2029 (EN MILLIONS USD)
TABLEAU 177 AUSTRALIE ET NOUVELLE-ZÉLANDE : MARCHÉ DES COSMÉTIQUES À BASE DE POLYGLYCÉROL, PAR TYPE, 2020-2029 (EN MILLIONS USD)
TABLEAU 178 MARCHÉ PHILIPPINIEN DU POLYGLYCÉROL, PAR TYPE, 2020-2029 (EN MILLIONS USD)
TABLEAU 179 MARCHÉ PHILIPPINIEN DU POLYGLYCÉROL, PAR TYPE, 2020-2029 (KILO TONNES)
TABLEAU 180 MARCHÉ PHILIPPINIEN DU POLYGLYCÉROL, PAR PRODUIT, 2020-2029 (EN MILLIONS USD)
TABLEAU 181 MARCHÉ PHILIPPINIEN DU POLYGLYCÉROL, PAR PRODUIT, 2020-2029 (KILO TONNES)
TABLEAU 182 MARCHÉ PHILIPPINIEN DU POLYGLYCÉROL, PAR APPLICATION, 2020-2029 (EN MILLIONS USD)
TABLEAU 183 MARCHÉ PHILIPPINIEN DU POLYGLYCÉROL, PAR APPLICATION, 2020-2029 (KILO TONNES)
TABLEAU 184 MARCHÉ PHILIPPINIEN DU POLYGLYCÉROL, PAR UTILISATION FINALE, 2020-2029 (EN MILLIONS USD)
TABLEAU 185 MARCHÉ PHILIPPINIEN DU POLYGLYCÉROL, PAR UTILISATION FINALE, 2020-2029 (KILO TONNES)
TABLEAU 186 PHILIPPINES ALIMENTS SUR LE MARCHÉ DES POLYGLYCÉROLS, PAR TYPE, 2020-2029 (EN MILLIONS USD)
TABLEAU 187 PHILIPPINES BOULANGERIE SUR LE MARCHÉ DES POLYGLYCÉROLS, PAR TYPE, 2020-2029 (EN MILLIONS USD)
TABLEAU 188 PHILIPPINES CONFISERIE SUR LE MARCHÉ DU POLYGLYCÉROL, PAR TYPE, 2020-2029 (EN MILLIONS USD)
TABLEAU 189 PHILIPPINES : MARCHÉ DES COSMÉTIQUES À BASE DE POLYGLYCÉROL, PAR TYPE, 2020-2029 (EN MILLIONS USD)
TABLEAU 190 MARCHÉ MALAISIEN DES POLYGLYCÉROLS, PAR TYPE, 2020-2029 (EN MILLIONS USD)
TABLEAU 191 MARCHÉ MALAISIEN DU POLYGLYCÉROL, PAR TYPE, 2020-2029 (KILO TONNES)
TABLEAU 192 MARCHÉ MALAISIEN DU POLYGLYCÉROL, PAR PRODUIT, 2020-2029 (EN MILLIONS USD)
TABLEAU 193 MARCHÉ MALAISIEN DU POLYGLYCÉROL, PAR PRODUIT, 2020-2029 (KILO TONNES)
TABLEAU 194 MARCHÉ MALAISIEN DU POLYGLYCÉROL, PAR APPLICATION, 2020-2029 (EN MILLIONS USD)
TABLEAU 195 MARCHÉ MALAISIEN DES POLYGLYCÉROLS, PAR APPLICATION, 2020-2029 (KILO TONNES)
TABLEAU 196 MARCHÉ MALAISIEN DU POLYGLYCÉROL, PAR UTILISATION FINALE, 2020-2029 (EN MILLIONS USD)
TABLEAU 197 MARCHÉ MALAISIEN DU POLYGLYCÉROL, PAR UTILISATION FINALE, 2020-2029 (KILO TONNES)
TABLEAU 198 MARCHÉ ALIMENTAIRE DES POLYGLYCÉROLS EN MALAISIE, PAR TYPE, 2020-2029 (EN MILLIONS USD)
TABLEAU 199 MARCHÉ DES PRODUITS DE BOULANGERIE MALAISIENS SUR LE MARCHÉ DES POLYGLYCÉROLS, PAR TYPE, 2020-2029 (EN MILLIONS USD)
TABLEAU 200 CONFISERIE MALAISIENNE SUR LE MARCHÉ DES POLYGLYCÉROLS, PAR TYPE, 2020-2029 (EN MILLIONS USD)
TABLEAU 201 MARCHÉ DES COSMÉTIQUES À BASE DE POLYGLYCÉROL EN MALAISIE, PAR TYPE, 2020-2029 (EN MILLIONS USD)
TABLEAU 202 MARCHÉ DES POLYGLYCÉROLS DU RESTE DE L'ASIE-PACIFIQUE, PAR TYPE, 2020-2029 (EN MILLIONS USD)
TABLEAU 203 MARCHÉ DES POLYGLYCÉROLS DU RESTE DE L'ASIE-PACIFIQUE, PAR TYPE, 2020-2029 (KILO TONNES)
Liste des figures
FIGURE 1 MARCHÉ DES POLYGLYCÉROLS EN ASIE-PACIFIQUE
FIGURE 2 MARCHÉ DES POLYGLYCÉROLS EN ASIE-PACIFIQUE : TRIANGULATION DES DONNÉES
FIGURE 3 MARCHÉ DES POLYGLYCÉROLS EN ASIE-PACIFIQUE : ANALYSE DROC
FIGURE 4 MARCHÉ DES POLYGLYCÉROLS EN ASIE-PACIFIQUE : ANALYSE DU MARCHÉ ASIE-PACIFIQUE PAR RAPPORT AU MARCHÉ RÉGIONAL
FIGURE 5 MARCHÉ DES POLYGLYCÉROLS EN ASIE-PACIFIQUE : ANALYSE DE LA RECHERCHE DES ENTREPRISES
FIGURE 6 MARCHÉ DES POLYGLYCÉROLS EN ASIE-PACIFIQUE : LA COURBE DE VIE DU PRODUIT
FIGURE 7 MARCHÉ DES POLYGLYCÉROLS EN ASIE-PACIFIQUE : MODÉLISATION MULTIVARIÉE
FIGURE 8 MARCHÉ DES POLYGLYCÉROLS EN ASIE-PACIFIQUE : DONNÉES DÉMOGRAPHIQUES DES ENTRETIENS
FIGURE 9 MARCHÉ DES POLYGLYCÉROLS EN ASIE-PACIFIQUE : GRILLE DE POSITIONNEMENT DU MARCHÉ DBMR
FIGURE 10 MARCHÉ DES POLYGLYCÉROLS EN ASIE-PACIFIQUE : GRILLE DE COUVERTURE DES UTILISATIONS FINALES DU MARCHÉ
FIGURE 11 MARCHÉ DES POLYGLYCÉROLS EN ASIE-PACIFIQUE : LA MATRICE DES DÉFIS DU MARCHÉ
FIGURE 12 MARCHÉ DES POLYGLYCÉROLS EN ASIE-PACIFIQUE : ANALYSE DES PARTS DE FOURNISSEURS
FIGURE 13 MARCHÉ DES POLYGLYCÉROLS EN ASIE-PACIFIQUE : SEGMENTATION
FIGURE 14 LA SENSIBILISATION CROISSANTE AUX PROPRIÉTÉS DES POLYGLYCÉROLS DEVRAIT STIMULER LE MARCHÉ DES POLYGLYCÉROLS EN ASIE-PACIFIQUE AU COURS DE LA PÉRIODE DE PRÉVISION
FIGURE 15 LE SEGMENT DU POLYRICINOLÉATE DE POLYGLYCÉROL DEVRAIT REPRÉSENTER LA PLUS GRANDE PART DU MARCHÉ DU POLYGLYCÉROL EN ASIE-PACIFIQUE EN 2022 ET 2029
FIGURE 16 SCÉNARIO D'IMPORTATION-EXPORTATION (EN MILLIERS USD)
FIGURE 17 MOTEURS, CONTRAINTES, OPPORTUNITÉS ET DÉFIS DU MARCHÉ DES POLYGLYCÉROLS EN ASIE-PACIFIQUE
FIGURE 18 MARCHÉ DES POLYGLYCÉROLS EN ASIE-PACIFIQUE : PAR TYPE, 2021
FIGURE 19 MARCHÉ DES POLYGLYCÉROLS EN ASIE-PACIFIQUE : PAR PRODUIT, 2021
FIGURE 20 MARCHÉ DES POLYGLYCÉROLS EN ASIE-PACIFIQUE : PAR APPLICATION, 2021
FIGURE 21 MARCHÉ DES POLYGLYCÉROLS EN ASIE-PACIFIQUE : PAR UTILISATION FINALE, 2021
FIGURE 22 MARCHÉ DES POLYGLYCÉROLS EN ASIE-PACIFIQUE : INSTANTANÉ (2021)
FIGURE 23 MARCHÉ DES POLYGLYCÉROLS EN ASIE-PACIFIQUE : PAR PAYS (2021)
FIGURE 24 MARCHÉ DES POLYGLYCÉROLS EN ASIE-PACIFIQUE : PAR PAYS (2022 et 2029)
FIGURE 25 MARCHÉ DES POLYGLYCÉROLS EN ASIE-PACIFIQUE : PAR PAYS (2021 et 2029)
FIGURE 26 MARCHÉ DES POLYGLYCÉROLS EN ASIE-PACIFIQUE : PAR TYPE (2022-2029)
FIGURE 27 MARCHÉ DES POLYGLYCÉROLS EN ASIE-PACIFIQUE : PART DE L'ENTREPRISE EN 2021 (%)
Méthodologie de recherche
La collecte de données et l'analyse de l'année de base sont effectuées à l'aide de modules de collecte de données avec des échantillons de grande taille. L'étape consiste à obtenir des informations sur le marché ou des données connexes via diverses sources et stratégies. Elle comprend l'examen et la planification à l'avance de toutes les données acquises dans le passé. Elle englobe également l'examen des incohérences d'informations observées dans différentes sources d'informations. Les données de marché sont analysées et estimées à l'aide de modèles statistiques et cohérents de marché. De plus, l'analyse des parts de marché et l'analyse des tendances clés sont les principaux facteurs de succès du rapport de marché. Pour en savoir plus, veuillez demander un appel d'analyste ou déposer votre demande.
La méthodologie de recherche clé utilisée par l'équipe de recherche DBMR est la triangulation des données qui implique l'exploration de données, l'analyse de l'impact des variables de données sur le marché et la validation primaire (expert du secteur). Les modèles de données incluent la grille de positionnement des fournisseurs, l'analyse de la chronologie du marché, l'aperçu et le guide du marché, la grille de positionnement des entreprises, l'analyse des brevets, l'analyse des prix, l'analyse des parts de marché des entreprises, les normes de mesure, l'analyse globale par rapport à l'analyse régionale et des parts des fournisseurs. Pour en savoir plus sur la méthodologie de recherche, envoyez une demande pour parler à nos experts du secteur.
Personnalisation disponible
Data Bridge Market Research est un leader de la recherche formative avancée. Nous sommes fiers de fournir à nos clients existants et nouveaux des données et des analyses qui correspondent à leurs objectifs. Le rapport peut être personnalisé pour inclure une analyse des tendances des prix des marques cibles, une compréhension du marché pour d'autres pays (demandez la liste des pays), des données sur les résultats des essais cliniques, une revue de la littérature, une analyse du marché des produits remis à neuf et de la base de produits. L'analyse du marché des concurrents cibles peut être analysée à partir d'une analyse basée sur la technologie jusqu'à des stratégies de portefeuille de marché. Nous pouvons ajouter autant de concurrents que vous le souhaitez, dans le format et le style de données que vous recherchez. Notre équipe d'analystes peut également vous fournir des données sous forme de fichiers Excel bruts, de tableaux croisés dynamiques (Fact book) ou peut vous aider à créer des présentations à partir des ensembles de données disponibles dans le rapport.

