Marché des circuits intégrés spécifiques à une application (ASIC) de l'Union européenne, par type de conception (ASIC entièrement personnalisé, semi-personnalisé et programmable), technologie (SRAM, anti-fusible, EPROM, Flash/EEPROM et autres), fonctionnalité (temps réel et autonome), application (équipement de défense, aéronefs, armes, engins spatiaux, navires et autres) - Tendances et prévisions de l'industrie jusqu'en 2030.
Analyse et taille du marché des circuits intégrés spécifiques à une application (ASIC) de l'Union européenne
Les fabricants cherchent en permanence des moyens d'augmenter la précision du travail, d'améliorer les services et de travailler avec une technologie en constante évolution. Ces besoins sont satisfaits par la mise en œuvre de systèmes de circuits intégrés spécifiques à l'application (ASIC) car ils sont utilisés pour fournir des services améliorés, ininterrompus, gratuits et rapides aux applications des utilisateurs finaux.
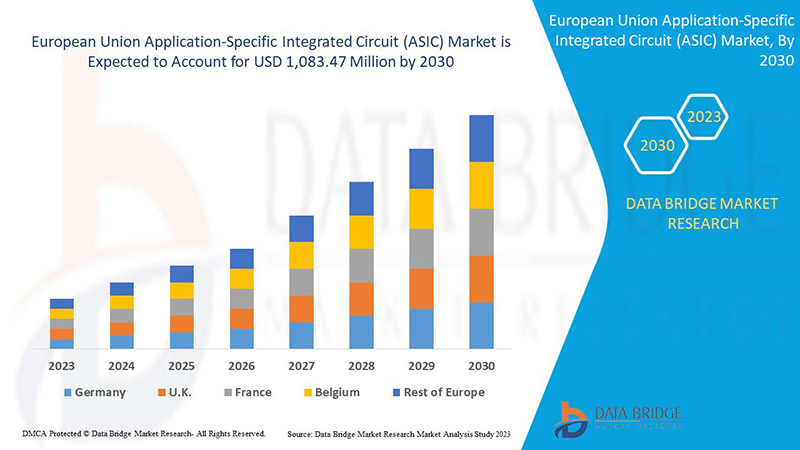
Data Bridge Market Research estime que le marché des circuits intégrés spécifiques aux applications (ASIC) de l'Union européenne devrait atteindre la valeur de 1 083,47 millions USD d'ici 2030, à un TCAC de 6,8 % au cours de la période de prévision. Le rapport sur le marché des circuits intégrés spécifiques aux applications (ASIC) couvre également en profondeur l'analyse des prix, l'analyse des brevets et les avancées technologiques.
|
Rapport métrique |
Détails |
|
Période de prévision |
2023 à 2030 |
|
Année de base |
2022 |
|
Années historiques |
2021 |
|
Unités quantitatives |
Chiffre d'affaires en millions USD, prix en USD |
|
Segments couverts |
Par type de conception (ASIC entièrement personnalisé, semi-personnalisé et programmable), technologie (SRAM, anti-fusible, EPROM, Flash/EEPROM et autres), fonctionnalité (temps réel et autonome), application (équipement de défense, aéronefs, armes, engins spatiaux, navires et autres) |
|
Pays couverts |
Allemagne, France, Pays-Bas, Belgique, Italie, Espagne, Pologne, Suède, Danemark, Autriche et reste de l'Union européenne. |
|
Acteurs du marché couverts |
Français STMicroelectronics, Intel Corporation, Lattice Semiconductor, Cobham Advanced Electronic Solutions, Texas Instruments Incorporated, ARQUIMEA GROUP, SA IC'Alps SAS, QuickLogic Corporation, Tekmos Inc., NanoXplore, Achronix Semiconductor Corporation, Renesas Electronics Corporation, EnSilica, Infineon Technologies AG, Microchip Technology Inc., Advanced Micro Devices, Inc., Honeywell International Inc., TTTech Computertechnik AG, Marvell et Semiconductor Components Industries, LLC, entre autres. |
Définition du marché
Un circuit intégré spécifique à une application (ASIC) est une puce CI conçue pour une application spécifique plutôt que pour une utilisation générale. Un ASIC est, par exemple, une puce qui fonctionne dans un enregistreur vocal numérique ou un encodeur vidéo à haute efficacité (tel que AMD VCE). Les puces ASSP (Application-specific standard product) sont un compromis entre les ASIC et les circuits intégrés standard de l'industrie tels que les séries 7400 ou 4000. En tant que puces de circuit intégré MOS, les puces ASIC sont généralement produites à l'aide de la technologie métal-oxyde-semiconducteur (MOS).
La complexité maximale (et donc l'utilité) disponible dans un ASIC est passée de 5 000 portes logiques à plus de 100 millions à mesure que la taille des fonctionnalités a diminué et que les outils de conception se sont améliorés au fil du temps. Les microprocesseurs, les blocs de mémoire tels que la ROM, la RAM, l'EEPROM, la mémoire flash et d'autres blocs de construction importants sont fréquemment inclus dans les ASIC modernes. Un SoC est un surnom courant pour un tel ASIC (système sur puce). Un langage de description de matériel (HDL), tel que Verilog ou VHDL, est fréquemment utilisé par les concepteurs d'ASIC numériques pour définir le fonctionnement des ASIC.
Dynamique du marché des circuits intégrés spécifiques aux applications (ASIC) de l'Union européenne
Cette section traite de la compréhension des moteurs, des opportunités, des contraintes et des défis du marché. Tout cela est discuté en détail ci-dessous :
Conducteurs
- Augmentation de l'utilisation des solutions de guerre électronique
La guerre électronique consiste à utiliser des signaux électromagnétiques tels que la radio, l'infrarouge ou le radar pour détecter, protéger et communiquer afin de protéger les ressources militaires contre des menaces potentielles. De plus, les cadets de la guerre électronique aident à protéger un avion ou un hélicoptère contre les missiles guidés par radar ou infrarouge. Ces cadets ont été inventés il y a plus de 50 ans et ont évolué au fil des ans avec le développement de nouvelles technologies.
L’essor de l’innovation et l’adoption de technologies modernes, telles que la réalité augmentée, l’intelligence artificielle et d’autres, dans divers secteurs maritimes, ont favorisé l’acceptation de composants électroniques et de solutions modernes, telles que les navires intelligents et les processus de travail autonomes en temps de guerre. Ces solutions aideront à défendre et à attaquer les ennemis sans aucune intervention humaine, ce qui réduira les risques à vie des cadets.
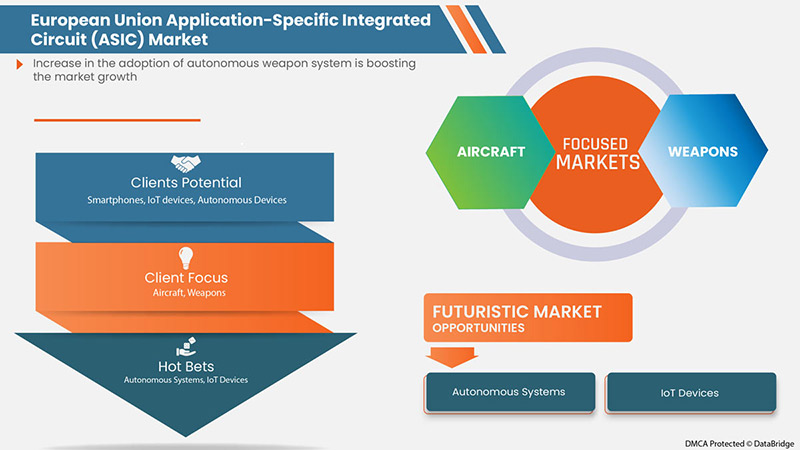
- Augmentation de l’adoption de systèmes d’armes autonomes
L'autonomie est la capacité d'une machine à exécuter des tâches sans intervention humaine en utilisant les interactions de la programmation informatique et des composants électroniques. Cela reconnaîtra la relation de commandement et de contrôle homme-machine et la sophistication de la capacité de prise de décision d'une machine peut varier d'une fonction à l'autre. Certains systèmes d'armes nécessitent un niveau d'autonomie plus élevé grâce à des composants électroniques et à une technologie logicielle.
En outre, le développement de systèmes d'armes autonomes adoptera des algorithmes logiciels pour identifier, sélectionner et détruire les cibles sans intervention humaine. De même, il existe un large éventail d'avantages qui ont incité de nombreux pays européens, comme l'Allemagne, la France et bien d'autres, à former un accord de coalition pour promouvoir les systèmes d'armes autonomes.
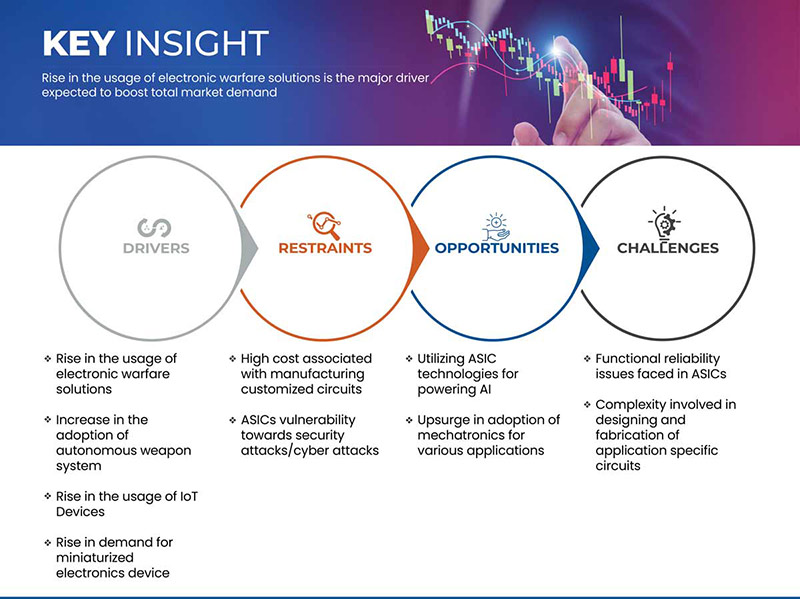
Opportunités
- Augmentation de l'adoption de la mécatronique pour diverses applications
Les systèmes mécatroniques sont des systèmes conçus à partir d'une combinaison de technologies mécaniques, électriques, de télécommunications, de contrôle et d'informatique. Les systèmes mécatroniques sont largement utilisés dans les applications automobiles telles que la fabrication d'automobiles, de châssis de véhicules autonomes, de chaînes cinématiques et de systèmes de sécurité. De nos jours, les systèmes mécatroniques jouent un rôle majeur dans l'industrie aérospatiale et de la défense.
Au fil des décennies, les systèmes mécatroniques ont été utilisés dans l'industrie automobile pour développer des systèmes de fabrication autonomes de véhicules. De plus, ces systèmes ont également gagné en importance dans le système de contrôle des véhicules. Ces derniers temps, les véhicules autonomes ont gagné en popularité en raison de facteurs tels que des capacités mécatroniques avancées, des processeurs et logiciels avancés et une IA et une vision par ordinateur avancées.
Contraintes/Défis
- Coût élevé associé à la fabrication de circuits personnalisés
Le coût associé à la fabrication de puces ou de masques de circuits intégrés spécifiques à une application (ASIC) est considérablement élevé. Ces technologies sont largement adoptées dans les secteurs de l'automobile, de la fabrication et des transports.
Selon diverses publications de presse à travers le monde, les ASIC personnalisés sont de plus en plus utilisés dans diverses industries technologiques. Cela favorise l'adoption de la création et de la conception de puces d'intelligence artificielle ASIC de pointe et de services de cloud computing.
La conception d'une puce implique différents processus, tels que les besoins en matières premières, les coûts de fabrication et de test. Une puce ASIC comporte un nombre variable de couches allant de 4 à 12. En général, les 3 à 4 couches inférieures contiennent les transistors et certains composants d'interconnectivité, ce qui augmente également le coût de fabrication.
Les couches supérieures sont presque entièrement utilisées pour les connexions. Ensuite, différents types de masques transparents sont utilisés pour la photogravure. En combinant tous les composants nécessaires à la conception d'une puce ASIC, le coût devient considérablement élevé.
- Complexité impliquée dans la conception et la fabrication de circuits spécifiques à une application
La conception de la technologie ASIC est une méthode de fabrication de circuits électroniques rentables grâce à la miniaturisation et à l'intégration de divers composants individuels fonctionnant en une seule unité. Un dispositif électronique à semi-conducteurs est constitué de divers composants électroniques, tels que des circuits intégrés (CI) qui sont entrelacés les uns avec les autres pour exécuter une fonction particulière. J'ai divers composants tels que des résistances, des transistors, des condensateurs, des portes logiques et autres.
Avec les progrès des technologies VLSI/CMOS, la complexité est passée de 5 000 portes logiques à plus de 100 millions de portes logiques dans une seule puce de conception ASIC. Selon la loi de Moore, le nombre de portes ou de transistors utilisés dans les circuits intégrés (CI) changera tous les 18 mois. Les progrès technologiques dans la logique, la parallélisation, le VLSI/CMOS et les outils de CAO augmenteront encore la complexité des CI.
Impact de la pandémie de COVID-19 sur le marché des circuits intégrés spécifiques aux applications (ASIC) de l'Union européenne
La COVID-19 a eu un impact négatif sur le marché des circuits intégrés spécifiques à une application (ASIC) en raison de la fermeture des installations de fabrication.
La pandémie de COVID-19 a eu un impact négatif sur le marché des circuits intégrés spécifiques à une application (ASIC). L'adoption croissante de la guerre électronique et autonome dans le secteur de la défense a contribué à la croissance du marché après la pandémie. En outre, on s'attend à une croissance sectorielle considérable dans un avenir proche.
Les fabricants prennent diverses décisions stratégiques pour améliorer leurs offres dans le scénario post-COVID-19. Les acteurs mènent de multiples activités de recherche et développement pour améliorer la technologie impliquée dans le circuit intégré spécifique à l'application (ASIC). Grâce à cela, les entreprises apporteront des technologies avancées au marché. En outre, les initiatives gouvernementales visant à utiliser la technologie de l'intelligence artificielle dans le secteur de l'aérospatiale et de la défense ont conduit à la croissance du marché.
Développement récent
- En octobre 2023, Cobham Advanced Electronic Solutions a annoncé le partenariat avec SkyWater pour la fabrication de circuits intégrés résistants aux radiations. Cela aidera l'entreprise à améliorer la conception et la fabrication d'ASIC, ce qui élargit le portefeuille de produits pour accélérer la croissance des revenus
- En octobre 2022, QuickLogic Corporation a annoncé la disponibilité de son premier bloc eFPGA défini par le client à partir du générateur IP australien pour le processus UMC 22 nm. L'outil australien permet une génération rapide d'IP eFPGA pour presque toutes les fonderies et tous les nœuds. Ce lancement de produit enrichit le portefeuille de produits de l'entreprise
Champ d'application du marché des circuits intégrés spécifiques à une application (ASIC) de l'Union européenne
Le marché des circuits intégrés spécifiques aux applications (ASIC) de l'Union européenne est segmenté en quatre segments notables, basés sur le type de conception, la technologie, la fonctionnalité et l'application. La croissance parmi ces segments vous aidera à analyser les segments de faible croissance dans les industries et fournira aux utilisateurs un aperçu précieux du marché et des informations sur le marché pour les aider à prendre des décisions stratégiques pour identifier les principales applications du marché.
Type de conception
- Personnalisé complet
- Semi-personnalisé
- ASIC programmable
Sur la base du type de conception, le marché des circuits intégrés spécifiques à une application (ASIC) de l'Union européenne est segmenté en ASIC entièrement personnalisés, semi-personnalisés et programmables.
Technologie
- Mémoire SRAM
- Anti-Fusible
- Mémoire EPROM
- Mémoire Flash/EEPROM
- Autres
Sur la base de la technologie, le marché des circuits intégrés spécifiques à l'application (ASIC) de l'Union européenne a été segmenté en SRAM, anti-fusible, EPROM, flash/EEPROM et autres.
Fonctionnalité
- En temps réel
- Autonome
Sur la base de la fonctionnalité, le marché des circuits intégrés spécifiques à une application (ASIC) de l'Union européenne a été segmenté en temps réel et autonome.
Application
- Équipement de défense
- Aéronef
- Armes
- Vaisseau spatial
- Navires
- Autres
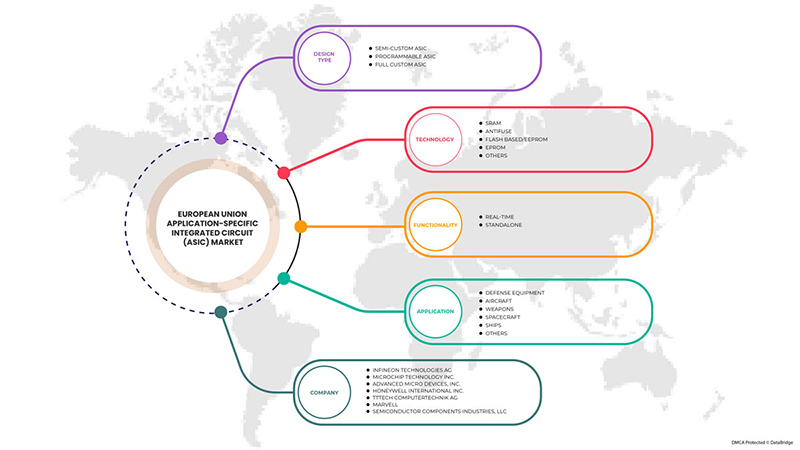
Sur la base des applications, le marché des circuits intégrés spécifiques à une application (ASIC) de l'Union européenne est segmenté en équipements de défense, avions, armes, engins spatiaux, navires et autres.
Analyse/perspectives régionales du marché des circuits intégrés spécifiques aux applications (ASIC) de l'Union européenne
Le marché des circuits intégrés spécifiques aux applications (ASIC) de l'Union européenne est analysé et des informations et tendances sur la taille du marché sont fournies par pays, type de conception, technologie, fonctionnalité et application, comme référencé ci-dessus.
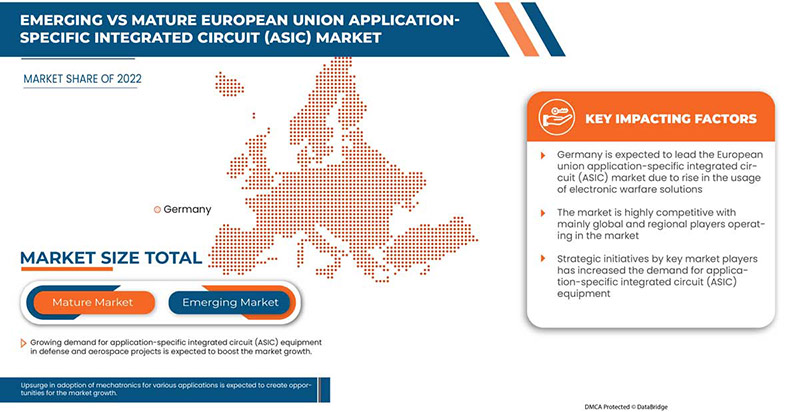
Les pays couverts par le rapport sur le marché des circuits intégrés spécifiques aux applications (ASIC) de l'Union européenne sont l'Allemagne, la France, les Pays-Bas, la Belgique, l'Italie, l'Espagne, la Pologne, la Suède, le Danemark, l'Autriche et le reste de l'Union européenne. L'Allemagne domine la région Europe en raison de l'augmentation des activités de recherche et développement dans les technologies de circuits intégrés pour le secteur de l'aérospatiale et de la défense.
La section par pays du rapport fournit également des facteurs individuels ayant un impact sur le marché et des changements dans la réglementation du marché qui ont un impact sur les tendances actuelles et futures du marché. Des points de données tels que l'analyse de la chaîne de valeur en aval et en amont, les tendances techniques, l'analyse des cinq forces du porteur et les études de cas sont quelques-uns des indicateurs utilisés pour prévoir le scénario du marché pour les différents pays. En outre, la présence et la disponibilité des marques de l'Union européenne et les défis auxquels elles sont confrontées en raison de la concurrence importante ou rare des marques locales et nationales, l'impact des tarifs nationaux et des routes commerciales sont pris en compte tout en fournissant une analyse prévisionnelle des données nationales.
Analyse du paysage concurrentiel et des parts de marché des circuits intégrés spécifiques aux applications (ASIC) de l'Union européenne
Le paysage concurrentiel du marché des circuits intégrés spécifiques aux applications (ASIC) de l'Union européenne fournit des détails par concurrent. Les détails inclus sont la présentation de l'entreprise, les finances de l'entreprise, les revenus générés, le potentiel du marché, les investissements dans la recherche et le développement, les nouvelles initiatives du marché, la présence en Europe, les sites et installations de production, les capacités de production, les forces et les faiblesses de l'entreprise, le lancement du produit, la largeur et l'étendue du produit, la domination de l'application. Les points de données ci-dessus fournis ne concernent que l'orientation des entreprises liée au marché des circuits intégrés spécifiques aux applications (ASIC).
Français Certains des principaux acteurs opérant sur le marché des circuits intégrés spécifiques à une application (ASIC) de l'Union européenne sont STMicroelectronics, Intel Corporation, Lattice Semiconductor, Cobham Advanced Electronic Solutions, Texas Instruments Incorporated, ARQUIMEA GROUP, SA, IC'Alps SAS, QuickLogic Corporation, Tekmos Inc., NanoXplore, Achronix Semiconductor Corporation, Renesas Electronics Corporation, EnSilica, Infineon Technologies AG, Microchip Technology Inc., Advanced Micro Devices, Inc., Honeywell International Inc., TTTech Computertechnik AG, Marvell et Semiconductor Components Industries, LLC, entre autres.
SKU-
Accédez en ligne au rapport sur le premier cloud mondial de veille économique

- Tableau de bord d'analyse de données interactif
- Tableau de bord d'analyse d'entreprise pour les opportunités à fort potentiel de croissance
- Accès d'analyste de recherche pour la personnalisation et les requêtes
- Analyse de la concurrence avec tableau de bord interactif
- Dernières actualités, mises à jour et analyse des tendances
- Exploitez la puissance de l'analyse comparative pour un suivi complet de la concurrence
Table des matières
1 INTRODUCTION
1.1 OBJECTIFS DE L'ÉTUDE
1.2 DÉFINITION DU MARCHÉ
1.3 APERÇU DU MARCHÉ DES CIRCUITS INTÉGRÉS SPÉCIFIQUES À UNE APPLICATION (ASIC) DE L'UNION EUROPÉENNE
1.4 MONNAIE ET TARIFS
1.5 LIMITATIONS
1.6 MARCHÉS COUVERTS
2 SEGMENTATION DU MARCHÉ
2.1 MARCHÉS COUVERTS
2.2 PORTÉE GÉOGRAPHIQUE
2,3 ANS CONSIDÉRÉS POUR L'ÉTUDE
2.4 MODÈLE DE VALIDATION DES DONNÉES DU TRÉPIED DBMR
2.5 ENTRETIENS PRIMAIRES AVEC DES LEADERS D'OPINION CLÉS
2.6 GRILLE DE POSITIONNEMENT DU MARCHÉ DBMR
2.7 ANALYSE DES PARTS DES FOURNISSEURS
2.8 MODÉLISATION MULTIVARIÉE
2.9 COURBE DE CHRONOLOGIE DU TYPE DE CONCEPTION
2.1 GRILLE DE COUVERTURE DES APPLICATIONS DU MARCHÉ
2.11 SOURCES SECONDAIRES
2.12 HYPOTHÈSES
3 RÉSUMÉ EXÉCUTIF
4 INFORMATIONS PREMIUM
4.1 ANALYSE DES CINQ FORCES DE PORTER
4.2 ANALYSE DE LA CHAÎNE D'APPROVISIONNEMENT
4.3 ANALYSE TECHNOLOGIQUE
4.3.1 IA
4.3.2 INTERNET DES OBJETS (IOT)
4.3.3 TECHNOLOGIE VLSI
4.3.4 NANOTECHNOLOGIE
4.4 CRITICALITÉS SUR LE MARCHÉ
4.4.1 DÉBOGAGE DES PROBLÈMES DE CONCEPTION
4.4.2 PROBLÈMES D'INTÉGRATION DU SYSTÈME
4.5 ÉTUDE DE CAS
4.5.1 GROUPE ARQUIMEA, SA
4.5.2 IC'ALPS SAS
4.6 CADRE RÉGLEMENTAIRE
5 APERÇU DU MARCHÉ
5.1 PILOTES
5.1.1 AUGMENTATION DE L'UTILISATION DES SOLUTIONS DE GUERRE ÉLECTRONIQUE
5.1.2 AUGMENTATION DE L'ADOPTION DE SYSTÈMES D'ARMES AUTONOMES
5.1.3 AUGMENTATION DE L'UTILISATION DES APPAREILS IOT
5.1.4 AUGMENTATION DE LA DEMANDE D'APPAREILS ÉLECTRONIQUES MINIATURISÉS
5.2 RESTRICTIONS
5.2.1 COÛT ÉLEVÉ ASSOCIÉ À LA FABRICATION DE CIRCUITS PERSONNALISÉS
5.2.2 VULNÉRABILITÉ DES SYSTÈMES ASICS AUX ATTAQUES DE SÉCURITÉ/CYBERATTAQUES
5.3 OPPORTUNITÉS
5.3.1 UTILISATION DES TECHNOLOGIES ASIC POUR ALIMENTER L'IA
5.3.2 MONTÉE EN PUISSANCE DE L'ADOPTION DE LA MÉCATRONIQUE POUR DIVERSES APPLICATIONS
5.3.3 AUGMENTATION DU DÉPLOIEMENT DES CENTRES DE DONNÉES ET DU CALCUL HAUTE PERFORMANCE
5.4 DÉFIS
5.4.1 PROBLÈMES DE FIABILITÉ FONCTIONNELLE RENCONTRÉS DANS LES ASIC
5.4.2 COMPLEXITÉ IMPLIQUÉE DANS LA CONCEPTION ET LA FABRICATION DE CIRCUITS SPÉCIFIQUES À UNE APPLICATION
6 MARCHÉ DES CIRCUITS INTÉGRÉS SPÉCIFIQUES À APPLICATION (ASIC) DE L'UNION EUROPÉENNE, PAR TYPE DE CONCEPTION
6.1 APERÇU
6.2 ASIC SEMI-PERSONNALISÉ
6.2.1 STANDARD – À BASE DE CELLULES
6.2.2 BASÉ SUR UN RÉSEAU DE PORTES
6.2.2.1 RÉSEAUX DE PORTES SANS CANAL
6.2.2.2 RÉSEAUX DE PORTES STRUCTURÉS
6.2.2.3 RÉSEAUX DE PORTES CANALISÉS
6.3 ASIC PROGRAMMABLE
6.3.1 SÉCURITÉ DES FPGA (RÉSEAU DE PORTES PROGRAMMABLES SUR PLACE)
6.3.1.1 PAR TYPE
6.3.1.1.1 FPGA HAUT DE GAMME
6.3.1.1.2 FPGA BAS DE GAMME
6.3.1.1.3 FPGA MILIEU DE GAMME
6.3.1.2 PAR NŒUD
6.3.1.2.1 MOINS DE 28 NM
6.3.1.2.2 28-90 NM
6.3.1.2.3 PLUS DE 90 NM
6.3.1.3 PAR SÉCURITÉ
6.3.1.3.1 SÉCURITÉ DE NIVEAU DÉFENSE
6.3.1.3.1.1 SÉCURITÉ DE CONCEPTION
6.3.1.3.1.2 SÉCURITÉ DES DONNÉES
6.3.1.3.1.3 MATÉRIEL SÉCURISÉ
6.3.1.3.1.4 AUTRES
6.3.1.3.2 PROTECTION DE LA MÉMOIRE PHYSIQUE (PMP)
6.3.1.4 PAR MÉMOIRE
6.3.1.4.1 MÉMOIRE DE BLOC
6.3.1.4.2 MÉMOIRE DISTRIBUÉE
6.3.1.5 PAR BLOC FONCTIONNEL
6.3.1.5.1 BLOCS LOGIQUES
6.3.1.5.1.1 PORTES COMBINÉES
6.3.1.5.1.2 MULTIPLEXES
6.3.1.5.1.3 PAIRES DE TRANSISTORS
6.3.1.5.1.4 AUTRES
6.3.1.5.2 ROUTAGE
6.3.2 DISPOSITIFS LOGIQUES PROGRAMMABLES (PLDS)
6.3.2.1 DISPOSITIF LOGIQUE PROGRAMMABLE SIMPLE (SPLD)
6.3.2.2 DISPOSITIF LOGIQUE PROGRAMMABLE HAUTE CAPACITÉ (HCPLDS)
6.4 ASIC ENTIÈREMENT PERSONNALISÉ
7 MARCHÉ DES CIRCUITS INTÉGRÉS SPÉCIFIQUES À APPLICATION (ASIC) DE L'UNION EUROPÉENNE, PAR TECHNOLOGIE
7.1 APERÇU
7.2 SRAM
7.3 ANTIFUSIBLE
7.4 FLASH/EEPROM
7.5 EPROM
7.6 AUTRES
8 MARCHÉ DES CIRCUITS INTÉGRÉS SPÉCIFIQUES À APPLICATION (ASIC) DE L'UNION EUROPÉENNE, PAR FONCTIONNALITÉ
8.1 APERÇU
8.2 TEMPS RÉEL
8.3 AUTONOME
9 MARCHÉ DES CIRCUITS INTÉGRÉS SPÉCIFIQUES À APPLICATION (ASIC) DE L'UNION EUROPÉENNE, PAR APPLICATION
9.1 APERÇU
9.2 ÉQUIPEMENT DE DÉFENSE
9.3 AVIONS
9.4 ARMES
9.5 VAISSEAU SPATIAL
9.6 NAVIRES
9.7 AUTRES
10 MARCHÉ DES CIRCUITS INTÉGRÉS SPÉCIFIQUES À APPLICATION (ASIC) DE L'UNION EUROPÉENNE, PAR PAYS
10.1 ALLEMAGNE
10.2 FRANCE
10.3 PAYS-BAS
10.4 ITALIE
10,5 ESPAGNE
10.6 POLOGNE
10,7 SUÈDE
10.8 BELGIQUE
10.9 AUTRICHE
10.1 DANEMARK
10.11 RESTE DE L'UNION EUROPÉENNE
11 MARCHÉ DES CIRCUITS INTÉGRÉS SPÉCIFIQUES À APPLICATION (ASIC) DE L'UNION EUROPÉENNE : PAYSAGE DES ENTREPRISES
11.1 ANALYSE DES ACTIONS DE L'ENTREPRISE : UNION EUROPÉENNE
12 ANALYSE SWOT
13 PROFIL DE L'ENTREPRISE
13.1 INFINEON TECHNOLOGIES AG
13.1.1 INSTANTANÉ DE L'ENTREPRISE
13.1.2 ANALYSE DES REVENUS
13.1.3 PORTEFEUILLE DE PRODUITS
13.1.4 ÉVOLUTIONS RÉCENTES
13.2 MICROCHIP TECHNOLOGY INC. (2021)
13.2.1 INSTANTANÉ DE L'ENTREPRISE
13.2.2 ANALYSE DES REVENUS
13.2.3 PORTEFEUILLE DE PRODUITS
13.2.4 ÉVOLUTIONS RÉCENTES
13.3 ADVANCED MICRO DEVICES, INC.
13.3.1 INSTANTANÉ DE L'ENTREPRISE
13.3.2 ANALYSE DES REVENUS
13.3.3 PORTEFEUILLE DE PRODUITS
13.3.4 ÉVOLUTIONS RÉCENTES
13.4 HONEYWELL INTERNATIONAL INC.
13.4.1 INSTANTANÉ DE L'ENTREPRISE
13.4.2 ANALYSE DES REVENUS
13.4.3 PORTEFEUILLE DE PRODUITS
13.4.4 ÉVOLUTION RÉCENTE
13.5 TTTECH COMPUTERTECHNIK AG
13.5.1 INSTANTANÉ DE L'ENTREPRISE
13.5.2 PORTEFEUILLE DE SOLUTIONS
13.5.3 ÉVOLUTIONS RÉCENTES
13.6 ACHRONIX SEMICONDUCTOR CORPORATION
13.6.1 INSTANTANÉ DE L'ENTREPRISE
13.6.2 PORTEFEUILLE DE PRODUITS
13.6.3 ÉVOLUTIONS RÉCENTES
13.7 ARQUIMEA
13.7.1 INSTANTANÉ DE L'ENTREPRISE
13.7.2 PORTEFEUILLE DE PRODUITS
13.7.3 ÉVOLUTION RÉCENTE
13.8 COBHAM SOLUTIONS ÉLECTRONIQUES AVANCÉES
13.8.1 INSTANTANÉ DE L'ENTREPRISE
13.8.2 PORTEFEUILLE DE PRODUITS
13.8.3 ÉVOLUTIONS RÉCENTES
13.9 ENSILICA
13.9.1 INSTANTANÉ DE L'ENTREPRISE
13.9.2 PORTEFEUILLE DE PRODUITS
13.9.3 ÉVOLUTIONS RÉCENTES
13.1 IC'ALPS SAS
13.10.1 INSTANTANÉ DE L'ENTREPRISE
13.10.2 PORTEFEUILLE DE SERVICES
13.10.3 ÉVOLUTION RÉCENTE
13.11 INTEL CORPORATION
13.11.1 INSTANTANÉ DE L'ENTREPRISE
13.11.2 ANALYSE DES REVENUS
13.11.3 PORTEFEUILLE DE SOLUTIONS
13.11.4 ÉVOLUTIONS RÉCENTES
13.12 SEMI-CONDUCTEUR EN RÉSEAU
13.12.1 INSTANTANÉ DE L'ENTREPRISE
13.12.2 ANALYSE DES REVENUS
13.12.3 PORTEFEUILLE DE SOLUTIONS
13.12.4 ÉVOLUTIONS RÉCENTES
13.13 MARVELL
13.13.1 INSTANTANÉ DE L'ENTREPRISE
13.13.2 ANALYSE DES REVENUS
13.13.3 PORTEFEUILLE DE SOLUTIONS
13.13.4 ÉVOLUTION RÉCENTE
13.14 NANOXPLORE
13.14.1 INSTANTANÉ DE L'ENTREPRISE
13.14.2 PORTEFEUILLE DE PRODUITS
13.14.3 ÉVOLUTION RÉCENTE
13.15 QUICKLOGIC CORPORATION
13.15.1 INSTANTANÉ DE L'ENTREPRISE
13.15.2 ANALYSE DES REVENUS
13.15.3 PORTEFEUILLE DE PRODUITS
13.15.4 ÉVOLUTIONS RÉCENTES
13.16 RENESAS ELECTRONICS CORPORATION
13.16.1 INSTANTANÉ DE L'ENTREPRISE
13.16.2 ANALYSE DES REVENUS
13.16.3 PORTEFEUILLE DE PRODUITS
13.16.4 ÉVOLUTIONS RÉCENTES
13.17 SEMICONDUCTOR COMPONENTS INDUSTRIES, LLC
13.17.1 INSTANTANÉ DE L'ENTREPRISE
13.17.2 ANALYSE DES REVENUS
13.17.3 PORTEFEUILLE DE PRODUITS
13.17.4 ÉVOLUTION RÉCENTE
13.18 STMICROELECTRONICS
13.18.1 INSTANTANÉ DE L'ENTREPRISE
13.18.2 ANALYSE DES REVENUS
13.18.3 PORTEFEUILLE DE PRODUITS
13.18.4 ÉVOLUTION RÉCENTE
13.19 TEXAS INSTRUMENTS INCORPORATED (2022)
13.19.1 INSTANTANÉ DE L'ENTREPRISE
13.19.2 ANALYSE DES REVENUS
13.19.3 PORTEFEUILLE DE PRODUITS
13.19.4 ÉVOLUTIONS RÉCENTES
13.2 TEKMOS INC.
13.20.1 INSTANTANÉ DE L'ENTREPRISE
13.20.2 PORTEFEUILLE DE PRODUITS
13.20.3 ÉVOLUTION RÉCENTE
14 QUESTIONNAIRE
15 RAPPORTS CONNEXES
Liste des tableaux
TABLEAU 1 MARCHÉ DES CIRCUITS INTÉGRÉS SPÉCIFIQUES À L'APPLICATION (ASIC) DE L'UNION EUROPÉENNE, PAR TYPE DE CONCEPTION, 2021-2030 (EN MILLIONS USD)
TABLEAU 2 ASIC SEMI-PERSONNALISÉS DE L'UNION EUROPÉENNE SUR LE MARCHÉ DES CIRCUITS INTÉGRÉS À APPLICATION SPÉCIFIQUE (ASIC), PAR TYPE, 2021-2030 (EN MILLIONS USD)
TABLEAU 3 MARCHÉ DES CIRCUITS INTÉGRÉS À APPLICATION SPÉCIFIQUE (ASIC) BASÉS SUR DES RÉSEAU DE PORTES DE L'UNION EUROPÉENNE, PAR TYPE, 2021-2030 (EN MILLIONS USD)
TABLEAU 4 ASIC PROGRAMMABLES DE L'UNION EUROPÉENNE SUR LE MARCHÉ DES CIRCUITS INTÉGRÉS À APPLICATION SPÉCIFIQUE (ASIC), PAR TYPE, 2021-2030 (EN MILLIONS USD)
TABLEAU 5 SÉCURITÉ DES FPGAS (FIELD PROGRAMMABLE GATE ARRAY) DE L'UNION EUROPÉENNE SUR LE MARCHÉ DES CIRCUITS INTÉGRÉS À APPLICATION SPÉCIFIQUE (ASIC), PAR TYPE, 2021-2030 (EN MILLIONS USD)
TABLEAU 6 SÉCURITÉ DES FPGAS (FIELD PROGRAMMABLE GATE ARRAY) DE L'UNION EUROPÉENNE SUR LE MARCHÉ DES CIRCUITS INTÉGRÉS À APPLICATION SPÉCIFIQUE (ASIC), PAR NŒUD, 2021-2030 (EN MILLIONS USD)
TABLEAU 7 SÉCURITÉ DES FPGA (RÉSEAU DE PORTES PROGRAMMABLES) DE L'UNION EUROPÉENNE SUR LE MARCHÉ DES CIRCUITS INTÉGRÉS À APPLICATION SPÉCIFIQUE (ASIC), PAR SÉCURITÉ, 2021-2030 (EN MILLIONS USD)
TABLEAU 8 SÉCURITÉ DE NIVEAU DÉFENSE DE L'UNION EUROPÉENNE SUR LE MARCHÉ DES CIRCUITS INTÉGRÉS À APPLICATION SPÉCIFIQUE (ASIC), PAR TYPE, 2021-2030 (EN MILLIONS USD)
TABLEAU 9 SÉCURITÉ DES FPGAS (FIELD PROGRAMMABLE GATE ARRAY) DE L'UNION EUROPÉENNE SUR LE MARCHÉ DES CIRCUITS INTÉGRÉS À APPLICATION SPÉCIFIQUE (ASIC), PAR MÉMOIRE, 2021-2030 (EN MILLIONS USD)
TABLEAU 10 SÉCURITÉ DES FPGAS (FIELD PROGRAMMABLE GATE ARRAY) DE L'UNION EUROPÉENNE SUR LE MARCHÉ DES CIRCUITS INTÉGRÉS À APPLICATION SPÉCIFIQUE (ASIC), PAR BLOC FONCTIONNEL, 2021-2030 (EN MILLIONS USD)
TABLEAU 11 BLOCS LOGIQUES DE L'UNION EUROPÉENNE SUR LE MARCHÉ DES CIRCUITS INTÉGRÉS SPÉCIFIQUES À L'APPLICATION (ASIC), PAR TYPE, 2021-2030 (EN MILLIONS USD)
TABLEAU 12 DISPOSITIFS LOGIQUES PROGRAMMABLES (PLDS) DE L'UNION EUROPÉENNE SUR LE MARCHÉ DES CIRCUITS INTÉGRÉS SPÉCIFIQUES À L'APPLICATION (ASIC), PAR TYPE, 2021-2030 (EN MILLIONS USD)
TABLEAU 13 MARCHÉ DES CIRCUITS INTÉGRÉS SPÉCIFIQUES À APPLICATION (ASIC) DE L'UNION EUROPÉENNE, PAR TECHNOLOGIE, 2021-2030 (EN MILLIONS USD)
TABLEAU 14 MARCHÉ DES CIRCUITS INTÉGRÉS SPÉCIFIQUES À APPLICATION (ASIC) DE L'UNION EUROPÉENNE, PAR FONCTIONNALITÉ, 2021-2030 (EN MILLIONS USD)
TABLEAU 15 MARCHÉ DES CIRCUITS INTÉGRÉS SPÉCIFIQUES À APPLICATION (ASIC) DE L'UNION EUROPÉENNE, PAR APPLICATION, 2021-2030 (EN MILLIONS USD)
TABLEAU 16 MARCHÉ DES CIRCUITS INTÉGRÉS SPÉCIFIQUES À APPLICATION (ASIC) DE L'UNION EUROPÉENNE, PAR PAYS, 2021-2030 (EN MILLIONS USD)
TABLEAU 17 MARCHÉ ALLEMAND DES CIRCUITS INTÉGRÉS SPÉCIFIQUES À L'APPLICATION (ASIC), PAR TYPE DE CONCEPTION, 2021-2030 (EN MILLIONS USD)
TABLEAU 18 ASIC SEMI-PERSONNALISÉS EN ALLEMAGNE SUR LE MARCHÉ DES CIRCUITS INTÉGRÉS SPÉCIFIQUES À L'APPLICATION (ASIC), PAR TYPE, 2021-2030 (EN MILLIONS USD)
TABLEAU 19 MARCHÉ ALLEMAND DES CIRCUITS INTÉGRÉS À APPLICATION SPÉCIFIQUE (ASIC) BASÉS SUR DES RÉSEAU DE PORTES, PAR TYPE, 2021-2030 (EN MILLIONS USD)
TABLEAU 20 MARCHÉ DES ASIC PROGRAMMABLES EN ALLEMAGNE SUR LE MARCHÉ DES CIRCUITS INTÉGRÉS SPÉCIFIQUES À L'APPLICATION (ASIC), PAR TYPE, 2021-2030 (EN MILLIONS USD)
TABLEAU 21 SÉCURITÉ DES FPGAS (FIELD PROGRAMMABLE GATE ARRAY) EN ALLEMAGNE SUR LE MARCHÉ DES CIRCUITS INTÉGRÉS À APPLICATION SPÉCIFIQUE (ASIC), PAR TYPE, 2021-2030 (EN MILLIONS USD)
TABLEAU 22 SÉCURITÉ DES FPGAS (RÉSEAU DE PORTES PROGRAMMABLES) EN ALLEMAGNE SUR LE MARCHÉ DES CIRCUITS INTÉGRÉS SPÉCIFIQUES À L'APPLICATION (ASIC), PAR NŒUD, 2021-2030 (EN MILLIONS USD)
TABLEAU 23 SÉCURITÉ DES FPGAS (FIELD PROGRAMMABLE GATE ARRAY) EN ALLEMAGNE SUR LE MARCHÉ DES CIRCUITS INTÉGRÉS SPÉCIFIQUES À L'APPLICATION (ASIC), PAR SÉCURITÉ, 2021-2030 (EN MILLIONS USD)
TABLEAU 24 SÉCURITÉ DE NIVEAU DÉFENSE EN ALLEMAGNE SUR LE MARCHÉ DES CIRCUITS INTÉGRÉS SPÉCIFIQUES À APPLICATION (ASIC), PAR TYPE, 2021-2030 (EN MILLIONS USD)
TABLEAU 25 SÉCURITÉ DES FPGAS (RÉSEAU DE PORTES PROGRAMMABLES) EN ALLEMAGNE SUR LE MARCHÉ DES CIRCUITS INTÉGRÉS SPÉCIFIQUES À L'APPLICATION (ASIC), PAR MÉMOIRE, 2021-2030 (EN MILLIONS USD)
TABLEAU 26 SÉCURITÉ DES FPGAS (RÉSEAU DE PORTES PROGRAMMABLES SUR PLACE) EN ALLEMAGNE SUR LE MARCHÉ DES CIRCUITS INTÉGRÉS SPÉCIFIQUES À L'APPLICATION (ASIC), PAR BLOC FONCTIONNEL, 2021-2030 (EN MILLIONS USD)
TABLEAU 27 BLOCS LOGIQUES SUR LE MARCHÉ DES CIRCUITS INTÉGRÉS SPÉCIFIQUES À L'APPLICATION (ASIC) EN ALLEMAGNE, PAR TYPE, 2021-2030 (EN MILLIONS USD)
TABLEAU 28 DISPOSITIFS LOGIQUES PROGRAMMABLES (PLDS) SUR LE MARCHÉ DES CIRCUITS INTÉGRÉS SPÉCIFIQUES À L'APPLICATION (ASIC) EN ALLEMAGNE, PAR TYPE, 2021-2030 (EN MILLIONS USD)
TABLEAU 29 MARCHÉ ALLEMAND DES CIRCUITS INTÉGRÉS SPÉCIFIQUES À APPLICATION (ASIC), PAR TECHNOLOGIE, 2021-2030 (EN MILLIONS USD)
TABLEAU 30 MARCHÉ ALLEMAND DES CIRCUITS INTÉGRÉS SPÉCIFIQUES À APPLICATION (ASIC), PAR FONCTIONNALITÉ, 2021-2030 (EN MILLIONS USD)
TABLEAU 31 MARCHÉ ALLEMAND DES CIRCUITS INTÉGRÉS SPÉCIFIQUES À APPLICATION (ASIC), PAR APPLICATION, 2021-2030 (EN MILLIONS USD)
TABLEAU 32 MARCHÉ FRANÇAIS DES CIRCUITS INTÉGRÉS SPÉCIFIQUES À APPLICATION (ASIC), PAR TYPE DE CONCEPTION, 2021-2030 (EN MILLIONS USD)
TABLEAU 33 ASIC SEMI-PERSONNALISÉS SUR LE MARCHÉ DES CIRCUITS INTÉGRÉS À APPLICATION SPÉCIFIQUE (ASIC) EN FRANCE, PAR TYPE, 2021-2030 (EN MILLIONS USD)
TABLEAU 34 MARCHÉ FRANÇAIS DES CIRCUITS INTÉGRÉS À APPLICATION SPÉCIFIQUE (ASIC) BASÉS SUR DES RÉSEAU DE PORTES, PAR TYPE, 2021-2030 (EN MILLIONS USD)
TABLEAU 35 MARCHÉ DES ASIC PROGRAMMABLES EN FRANCE SUR LE MARCHÉ DES CIRCUITS INTÉGRÉS À APPLICATION SPÉCIFIQUE (ASIC), PAR TYPE, 2021-2030 (EN MILLIONS USD)
TABLEAU 36 SÉCURITÉ DES FPGAS (FIELD PROGRAMMABLE GATE ARRAY) SUR LE MARCHÉ DES CIRCUITS INTÉGRÉS À APPLICATION SPÉCIFIQUE (ASIC) EN FRANCE, PAR TYPE, 2021-2030 (EN MILLIONS USD)
TABLEAU 37 SÉCURITÉ DES FPGAS (FIELD PROGRAMMABLE GATE ARRAY) SUR LE MARCHÉ DES CIRCUITS INTÉGRÉS À APPLICATION SPÉCIFIQUE (ASIC) EN FRANCE, PAR NŒUD, 2021-2030 (EN MILLIONS USD)
TABLEAU 38 SÉCURITÉ DES FPGAS (FIELD PROGRAMMABLE GATE ARRAY) SUR LE MARCHÉ DES CIRCUITS INTÉGRÉS À APPLICATION SPÉCIFIQUE (ASIC) EN FRANCE, PAR SÉCURITÉ, 2021-2030 (EN MILLIONS USD)
TABLEAU 39 MARCHÉ FRANÇAIS DE LA SÉCURITÉ DE NIVEAU DÉFENSE SUR LE MARCHÉ DES CIRCUITS INTÉGRÉS À APPLICATION SPÉCIFIQUE (ASIC), PAR TYPE, 2021-2030 (EN MILLIONS USD)
TABLEAU 40 SÉCURITÉ DES FPGAS (FIELD PROGRAMMABLE GATE ARRAY) SUR LE MARCHÉ DES CIRCUITS INTÉGRÉS À APPLICATION SPÉCIFIQUE (ASIC) EN FRANCE, PAR MÉMOIRE, 2021-2030 (EN MILLIONS USD)
TABLEAU 41 SÉCURITÉ DES FPGAS (FIELD PROGRAMMABLE GATE ARRAY) SUR LE MARCHÉ DES CIRCUITS INTÉGRÉS À APPLICATION SPÉCIFIQUE (ASIC) EN FRANCE, PAR BLOC FONCTIONNEL, 2021-2030 (EN MILLIONS USD)
TABLEAU 42 BLOCS LOGIQUES SUR LE MARCHÉ DES CIRCUITS INTÉGRÉS SPÉCIFIQUES À APPLICATION (ASIC) EN FRANCE, PAR TYPE, 2021-2030 (EN MILLIONS USD)
TABLEAU 43 DISPOSITIFS LOGIQUES PROGRAMMABLES (PLDS) SUR LE MARCHÉ DES CIRCUITS INTÉGRÉS SPÉCIFIQUES À L'APPLICATION (ASIC) EN FRANCE, PAR TYPE, 2021-2030 (EN MILLIONS USD)
TABLEAU 44 MARCHÉ FRANÇAIS DES CIRCUITS INTÉGRÉS SPÉCIFIQUES À APPLICATION (ASIC), PAR TECHNOLOGIE, 2021-2030 (EN MILLIONS USD)
TABLEAU 45 MARCHÉ FRANÇAIS DES CIRCUITS INTÉGRÉS SPÉCIFIQUES À APPLICATION (ASIC), PAR FONCTIONNALITÉ, 2021-2030 (EN MILLIONS USD)
TABLEAU 46 MARCHÉ FRANÇAIS DES CIRCUITS INTÉGRÉS SPÉCIFIQUES À APPLICATION (ASIC), PAR APPLICATION, 2021-2030 (EN MILLIONS USD)
TABLEAU 47 MARCHÉ DES CIRCUITS INTÉGRÉS SPÉCIFIQUES À L'APPLICATION (ASIC) AUX PAYS-BAS, PAR TYPE DE CONCEPTION, 2021-2030 (EN MILLIONS USD)
TABLEAU 48 ASIC SEMI-PERSONNALISÉS AUX PAYS-BAS SUR LE MARCHÉ DES CIRCUITS INTÉGRÉS SPÉCIFIQUES À L'APPLICATION (ASIC), PAR TYPE, 2021-2030 (EN MILLIONS USD)
TABLEAU 49 MARCHÉ DES CIRCUITS INTÉGRÉS À APPLICATION SPÉCIFIQUE (ASIC) BASÉS SUR DES RÉSEAU DE PORTES AUX PAYS-BAS, PAR TYPE, 2021-2030 (EN MILLIONS USD)
TABLEAU 50 ASIC PROGRAMMABLES AUX PAYS-BAS SUR LE MARCHÉ DES CIRCUITS INTÉGRÉS SPÉCIFIQUES À L'APPLICATION (ASIC), PAR TYPE, 2021-2030 (EN MILLIONS USD)
TABLEAU 51 SÉCURITÉ DES FPGAS (FIELD PROGRAMMABLE GATE ARRAY) AUX PAYS-BAS SUR LE MARCHÉ DES CIRCUITS INTÉGRÉS SPÉCIFIQUES À L'APPLICATION (ASIC), PAR TYPE, 2021-2030 (EN MILLIONS USD)
TABLEAU 52 SÉCURITÉ DES FPGAS (FIELD PROGRAMMABLE GATE ARRAY) AUX PAYS-BAS SUR LE MARCHÉ DES CIRCUITS INTÉGRÉS SPÉCIFIQUES À L'APPLICATION (ASIC), PAR NŒUD, 2021-2030 (EN MILLIONS USD)
TABLEAU 53 SÉCURITÉ DES FPGAS (FIELD PROGRAMMABLE GATE ARRAY) AUX PAYS-BAS SUR LE MARCHÉ DES CIRCUITS INTÉGRÉS SPÉCIFIQUES À L'APPLICATION (ASIC), PAR SÉCURITÉ, 2021-2030 (EN MILLIONS USD)
TABLEAU 54 SÉCURITÉ DE NIVEAU DÉFENSE AUX PAYS-BAS SUR LE MARCHÉ DES CIRCUITS INTÉGRÉS SPÉCIFIQUES À UNE APPLICATION (ASIC), PAR TYPE, 2021-2030 (EN MILLIONS USD)
TABLEAU 55 SÉCURITÉ DES FPGAS (FIELD PROGRAMMABLE GATE ARRAY) AUX PAYS-BAS SUR LE MARCHÉ DES CIRCUITS INTÉGRÉS SPÉCIFIQUES À L'APPLICATION (ASIC), PAR MÉMOIRE, 2021-2030 (EN MILLIONS USD)
TABLEAU 56 SÉCURITÉ DES FPGAS (RÉSEAU DE PORTES PROGRAMMABLES) AUX PAYS-BAS SUR LE MARCHÉ DES CIRCUITS INTÉGRÉS SPÉCIFIQUES À L'APPLICATION (ASIC), PAR BLOC FONCTIONNEL, 2021-2030 (EN MILLIONS USD)
TABLEAU 57 BLOCS LOGIQUES SUR LE MARCHÉ DES CIRCUITS INTÉGRÉS SPÉCIFIQUES À L'APPLICATION (ASIC) AUX PAYS-BAS, PAR TYPE, 2021-2030 (EN MILLIONS USD)
TABLEAU 58 DISPOSITIFS LOGIQUES PROGRAMMABLES (PLDS) SUR LE MARCHÉ DES CIRCUITS INTÉGRÉS SPÉCIFIQUES À L'APPLICATION (ASIC) AUX PAYS-BAS, PAR TYPE, 2021-2030 (EN MILLIONS USD)
TABLEAU 59 MARCHÉ DES CIRCUITS INTÉGRÉS SPÉCIFIQUES À L'APPLICATION (ASIC) AUX PAYS-BAS, PAR TECHNOLOGIE, 2021-2030 (EN MILLIONS USD)
TABLEAU 60 MARCHÉ DES CIRCUITS INTÉGRÉS SPÉCIFIQUES À L'APPLICATION (ASIC) AUX PAYS-BAS, PAR FONCTIONNALITÉ, 2021-2030 (EN MILLIONS USD)
TABLEAU 61 MARCHÉ DES CIRCUITS INTÉGRÉS SPÉCIFIQUES À L'APPLICATION (ASIC) AUX PAYS-BAS, PAR APPLICATION, 2021-2030 (EN MILLIONS USD)
TABLEAU 62 MARCHÉ ITALIEN DES CIRCUITS INTÉGRÉS SPÉCIFIQUES À APPLICATION (ASIC), PAR TYPE DE CONCEPTION, 2021-2030 (EN MILLIONS USD)
TABLEAU 63 ASIC SEMI-PERSONNALISÉS EN ITALIE SUR LE MARCHÉ DES CIRCUITS INTÉGRÉS À APPLICATION SPÉCIFIQUE (ASIC), PAR TYPE, 2021-2030 (EN MILLIONS USD)
TABLEAU 64 MARCHÉ ITALIEN DES CIRCUITS INTÉGRÉS À APPLICATION SPÉCIFIQUE (ASIC) BASÉS SUR DES RÉSEAU DE PORTES, PAR TYPE, 2021-2030 (EN MILLIONS USD)
TABLEAU 65 ASIC PROGRAMMABLES EN ITALIE SUR LE MARCHÉ DES CIRCUITS INTÉGRÉS SPÉCIFIQUES À L'APPLICATION (ASIC), PAR TYPE, 2021-2030 (EN MILLIONS USD)
TABLEAU 66 SÉCURITÉ DES FPGAS (RÉSEAU DE PORTES PROGRAMMABLES) EN ITALIE SUR LE MARCHÉ DES CIRCUITS INTÉGRÉS À APPLICATION SPÉCIFIQUE (ASIC), PAR TYPE, 2021-2030 (EN MILLIONS USD)
TABLEAU 67 SÉCURITÉ DES FPGAS (RÉSEAU DE PORTES PROGRAMMABLES) EN ITALIE SUR LE MARCHÉ DES CIRCUITS INTÉGRÉS À APPLICATION SPÉCIFIQUE (ASIC), PAR NŒUD, 2021-2030 (EN MILLIONS USD)
TABLEAU 68 SÉCURITÉ DES FPGAS (RÉSEAU DE PORTES PROGRAMMABLES) EN ITALIE SUR LE MARCHÉ DES CIRCUITS INTÉGRÉS À APPLICATION SPÉCIFIQUE (ASIC), PAR SÉCURITÉ, 2021-2030 (EN MILLIONS USD)
TABLEAU 69 SÉCURITÉ DE NIVEAU DÉFENSE EN ITALIE SUR LE MARCHÉ DES CIRCUITS INTÉGRÉS SPÉCIFIQUES À APPLICATION (ASIC), PAR TYPE, 2021-2030 (EN MILLIONS USD)
TABLEAU 70 SÉCURITÉ DES FPGAS (RÉSEAU DE PORTES PROGRAMMABLES) EN ITALIE SUR LE MARCHÉ DES CIRCUITS INTÉGRÉS À APPLICATION SPÉCIFIQUE (ASIC), PAR MÉMOIRE, 2021-2030 (EN MILLIONS USD)
TABLEAU 71 SÉCURITÉ DES FPGAS (RÉSEAU DE PORTES PROGRAMMABLES) EN ITALIE SUR LE MARCHÉ DES CIRCUITS INTÉGRÉS À APPLICATION SPÉCIFIQUE (ASIC), PAR BLOC FONCTIONNEL, 2021-2030 (EN MILLIONS USD)
TABLEAU 72 BLOCS LOGIQUES SUR LE MARCHÉ DES CIRCUITS INTÉGRÉS SPÉCIFIQUES À L'APPLICATION (ASIC) EN ITALIE, PAR TYPE, 2021-2030 (EN MILLIONS USD)
TABLEAU 73 DISPOSITIFS LOGIQUES PROGRAMMABLES (PLDS) EN ITALIE SUR LE MARCHÉ DES CIRCUITS INTÉGRÉS SPÉCIFIQUES À L'APPLICATION (ASIC), PAR TYPE, 2021-2030 (EN MILLIONS USD)
TABLEAU 74 MARCHÉ ITALIEN DES CIRCUITS INTÉGRÉS SPÉCIFIQUES À APPLICATION (ASIC), PAR TECHNOLOGIE, 2021-2030 (EN MILLIONS USD)
TABLEAU 75 MARCHÉ ITALIEN DES CIRCUITS INTÉGRÉS SPÉCIFIQUES À L'APPLICATION (ASIC), PAR FONCTIONNALITÉ, 2021-2030 (EN MILLIONS USD)
TABLEAU 76 MARCHÉ ITALIEN DES CIRCUITS INTÉGRÉS SPÉCIFIQUES À APPLICATION (ASIC), PAR APPLICATION, 2021-2030 (EN MILLIONS USD)
TABLEAU 77 MARCHÉ ESPAGNOL DES CIRCUITS INTÉGRÉS SPÉCIFIQUES À APPLICATION (ASIC), PAR TYPE DE CONCEPTION, 2021-2030 (EN MILLIONS USD)
TABLEAU 78 ESPAGNE ASIC SEMI-PERSONNALISÉS SUR LE MARCHÉ DES CIRCUITS INTÉGRÉS À APPLICATION SPÉCIFIQUE (ASIC), PAR TYPE, 2021-2030 (EN MILLIONS USD)
TABLEAU 79 MARCHÉ ESPAGNOL DES CIRCUITS INTÉGRÉS À APPLICATION SPÉCIFIQUE (ASIC) BASÉS SUR LES RÉSEAU DE PORTES, PAR TYPE, 2021-2030 (EN MILLIONS USD)
TABLEAU 80 ESPAGNE ASIC PROGRAMMABLES SUR LE MARCHÉ DES CIRCUITS INTÉGRÉS SPÉCIFIQUES À L'APPLICATION (ASIC), PAR TYPE, 2021-2030 (EN MILLIONS USD)
TABLEAU 81 ESPAGNE SÉCURITÉ DES FPGAS (FIELD PROGRAMMABLE GATE ARRAY) SUR LE MARCHÉ DES CIRCUITS INTÉGRÉS À APPLICATION SPÉCIFIQUE (ASIC), PAR TYPE, 2021-2030 (EN MILLIONS USD)
TABLEAU 82 ESPAGNE SÉCURITÉ DES FPGAS (RÉSEAU DE PORTES PROGRAMMABLES) SUR LE MARCHÉ DES CIRCUITS INTÉGRÉS SPÉCIFIQUES À L'APPLICATION (ASIC), PAR NŒUD, 2021-2030 (EN MILLIONS USD)
TABLEAU 83 ESPAGNE SÉCURITÉ DES FPGAS (FIELD PROGRAMMABLE GATE ARRAY) SUR LE MARCHÉ DES CIRCUITS INTÉGRÉS À APPLICATION SPÉCIFIQUE (ASIC), PAR SÉCURITÉ, 2021-2030 (EN MILLIONS USD)
TABLEAU 84 SÉCURITÉ DE NIVEAU DÉFENSE EN ESPAGNE SUR LE MARCHÉ DES CIRCUITS INTÉGRÉS SPÉCIFIQUES À APPLICATION (ASIC), PAR TYPE, 2021-2030 (EN MILLIONS USD)
TABLEAU 85 ESPAGNE SÉCURITÉ DES FPGAS (RÉSEAU DE PORTES PROGRAMMABLES) SUR LE MARCHÉ DES CIRCUITS INTÉGRÉS À APPLICATION SPÉCIFIQUE (ASIC), PAR MÉMOIRE, 2021-2030 (EN MILLIONS USD)
TABLEAU 86 ESPAGNE SÉCURITÉ DES FPGAS (RÉSEAU DE PORTES PROGRAMMABLES) SUR LE MARCHÉ DES CIRCUITS INTÉGRÉS SPÉCIFIQUES À L'APPLICATION (ASIC), PAR BLOC FONCTIONNEL, 2021-2030 (EN MILLIONS USD)
TABLEAU 87 BLOCS LOGIQUES ESPAGNOLS SUR LE MARCHÉ DES CIRCUITS INTÉGRÉS SPÉCIFIQUES À L'APPLICATION (ASIC), PAR TYPE, 2021-2030 (EN MILLIONS USD)
TABLEAU 88 ESPAGNE DISPOSITIFS LOGIQUES PROGRAMMABLES (PLDS) SUR LE MARCHÉ DES CIRCUITS INTÉGRÉS SPÉCIFIQUES À L'APPLICATION (ASIC), PAR TYPE, 2021-2030 (EN MILLIONS USD)
TABLEAU 89 MARCHÉ ESPAGNOL DES CIRCUITS INTÉGRÉS SPÉCIFIQUES À APPLICATION (ASIC), PAR TECHNOLOGIE, 2021-2030 (EN MILLIONS USD)
TABLEAU 90 MARCHÉ ESPAGNOL DES CIRCUITS INTÉGRÉS SPÉCIFIQUES À APPLICATION (ASIC), PAR FONCTIONNALITÉ, 2021-2030 (EN MILLIONS USD)
TABLEAU 91 MARCHÉ ESPAGNOL DES CIRCUITS INTÉGRÉS SPÉCIFIQUES À APPLICATION (ASIC), PAR APPLICATION, 2021-2030 (EN MILLIONS USD)
TABLEAU 92 MARCHÉ POLOGNE DES CIRCUITS INTÉGRÉS SPÉCIFIQUES À APPLICATION (ASIC), PAR TYPE DE CONCEPTION, 2021-2030 (EN MILLIONS USD)
TABLEAU 93 POLOGNE ASIC SEMI-PERSONNALISÉS SUR LE MARCHÉ DES CIRCUITS INTÉGRÉS À APPLICATION SPÉCIFIQUE (ASIC), PAR TYPE, 2021-2030 (EN MILLIONS USD)
TABLEAU 94 MARCHÉ POLOGNE DES CIRCUITS INTÉGRÉS À APPLICATION SPÉCIFIQUE (ASIC) BASÉS SUR LES RÉSEAU DE PORTES, PAR TYPE, 2021-2030 (EN MILLIONS USD)
TABLEAU 95 POLOGNE ASIC PROGRAMMABLES SUR LE MARCHÉ DES CIRCUITS INTÉGRÉS SPÉCIFIQUES À L'APPLICATION (ASIC), PAR TYPE, 2021-2030 (EN MILLIONS USD)
TABLEAU 96 POLOGNE SÉCURITÉ DES FPGAS (RÉSEAU DE PORTES PROGRAMMABLES) SUR LE MARCHÉ DES CIRCUITS INTÉGRÉS À APPLICATION SPÉCIFIQUE (ASIC), PAR TYPE, 2021-2030 (EN MILLIONS USD)
TABLEAU 97 POLOGNE SÉCURITÉ DES FPGAS (RÉSEAU DE PORTES PROGRAMMABLES) SUR LE MARCHÉ DES CIRCUITS INTÉGRÉS SPÉCIFIQUES À L'APPLICATION (ASIC), PAR NŒUD, 2021-2030 (EN MILLIONS USD)
TABLEAU 98 SÉCURITÉ DES FPGAS (RÉSEAU DE PORTES PROGRAMMABLES) EN POLOGNE SUR LE MARCHÉ DES CIRCUITS INTÉGRÉS À APPLICATION SPÉCIFIQUE (ASIC), PAR SÉCURITÉ, 2021-2030 (EN MILLIONS USD)
TABLEAU 99 POLOGNE SÉCURITÉ DE NIVEAU DÉFENSE SUR LE MARCHÉ DES CIRCUITS INTÉGRÉS À APPLICATION SPÉCIFIQUE (ASIC), PAR TYPE, 2021-2030 (EN MILLIONS USD)
TABLEAU 100 SÉCURITÉ DES FPGAS (RÉSEAU DE PORTES PROGRAMMABLES) EN POLOGNE SUR LE MARCHÉ DES CIRCUITS INTÉGRÉS À APPLICATION SPÉCIFIQUE (ASIC), PAR MÉMOIRE, 2021-2030 (EN MILLIONS USD)
TABLEAU 101 POLOGNE SÉCURITÉ DES FPGAS (RÉSEAU DE PORTES PROGRAMMABLES) SUR LE MARCHÉ DES CIRCUITS INTÉGRÉS À APPLICATION SPÉCIFIQUE (ASIC), PAR BLOC FONCTIONNEL, 2021-2030 (EN MILLIONS USD)
TABLEAU 102 BLOCS LOGIQUES POLOGNES SUR LE MARCHÉ DES CIRCUITS INTÉGRÉS SPÉCIFIQUES À L'APPLICATION (ASIC), PAR TYPE, 2021-2030 (EN MILLIONS USD)
TABLEAU 103 DISPOSITIFS LOGIQUES PROGRAMMABLES (PLDS) EN POLOGNE SUR LE MARCHÉ DES CIRCUITS INTÉGRÉS SPÉCIFIQUES À L'APPLICATION (ASIC), PAR TYPE, 2021-2030 (EN MILLIONS USD)
TABLEAU 104 MARCHÉ POLOGNE DES CIRCUITS INTÉGRÉS SPÉCIFIQUES À APPLICATION (ASIC), PAR TECHNOLOGIE, 2021-2030 (EN MILLIONS USD)
TABLEAU 105 MARCHÉ POLOGNE DES CIRCUITS INTÉGRÉS SPÉCIFIQUES À APPLICATION (ASIC), PAR FONCTIONNALITÉ, 2021-2030 (EN MILLIONS USD)
TABLEAU 106 MARCHÉ POLOGNE DES CIRCUITS INTÉGRÉS SPÉCIFIQUES À APPLICATION (ASIC), PAR APPLICATION, 2021-2030 (EN MILLIONS USD)
TABLEAU 107 MARCHÉ SUÉDOIS DES CIRCUITS INTÉGRÉS SPÉCIFIQUES À L'APPLICATION (ASIC), PAR TYPE DE CONCEPTION, 2021-2030 (EN MILLIONS USD)
TABLEAU 108 SUÈDE ASIC SEMI-PERSONNALISÉS SUR LE MARCHÉ DES CIRCUITS INTÉGRÉS SPÉCIFIQUES À L'APPLICATION (ASIC), PAR TYPE, 2021-2030 (EN MILLIONS USD)
TABLEAU 109 MARCHÉ SUÉDOIS DES CIRCUITS INTÉGRÉS À APPLICATION SPÉCIFIQUE (ASIC) BASÉS SUR LES RÉSEAU DE PORTES, PAR TYPE, 2021-2030 (EN MILLIONS USD)
TABLEAU 110 SUÈDE ASIC PROGRAMMABLES SUR LE MARCHÉ DES CIRCUITS INTÉGRÉS SPÉCIFIQUES À L'APPLICATION (ASIC), PAR TYPE, 2021-2030 (EN MILLIONS USD)
TABLEAU 111 SUÈDE SÉCURITÉ DES FPGAS (RÉSEAU DE PORTES PROGRAMMABLES) SUR LE MARCHÉ DES CIRCUITS INTÉGRÉS À APPLICATION SPÉCIFIQUE (ASIC), PAR TYPE, 2021-2030 (EN MILLIONS USD)
TABLEAU 112 SÉCURITÉ DES FPGAS (RÉSEAU DE PORTES PROGRAMMABLES) SUÈDE SUR LE MARCHÉ DES CIRCUITS INTÉGRÉS SPÉCIFIQUES À L'APPLICATION (ASIC), PAR NŒUD, 2021-2030 (EN MILLIONS USD)
TABLEAU 113 SÉCURITÉ DES FPGAS (RÉSEAU DE PORTES PROGRAMMABLES) SUÈDE SUR LE MARCHÉ DES CIRCUITS INTÉGRÉS À APPLICATION SPÉCIFIQUE (ASIC), PAR SÉCURITÉ, 2021-2030 (EN MILLIONS USD)
TABLEAU 114 SÉCURITÉ DE NIVEAU DÉFENSE EN SUÈDE SUR LE MARCHÉ DES CIRCUITS INTÉGRÉS SPÉCIFIQUES À APPLICATION (ASIC), PAR TYPE, 2021-2030 (EN MILLIONS USD)
TABLEAU 115 SÉCURITÉ DES FPGAS (RÉSEAU DE PORTES PROGRAMMABLES) SUÈDE SUR LE MARCHÉ DES CIRCUITS INTÉGRÉS À APPLICATION SPÉCIFIQUE (ASIC), PAR MÉMOIRE, 2021-2030 (EN MILLIONS USD)
TABLEAU 116 SÉCURITÉ DES FPGAS (RÉSEAU DE PORTES PROGRAMMABLES) SUÈDE SUR LE MARCHÉ DES CIRCUITS INTÉGRÉS SPÉCIFIQUES À L'APPLICATION (ASIC), PAR BLOC FONCTIONNEL, 2021-2030 (EN MILLIONS USD)
TABLEAU 117 SUÈDE BLOCS LOGIQUES SUR LE MARCHÉ DES CIRCUITS INTÉGRÉS SPÉCIFIQUES À L'APPLICATION (ASIC), PAR TYPE, 2021-2030 (EN MILLIONS USD)
TABLEAU 118 DISPOSITIFS LOGIQUES PROGRAMMABLES (PLDS) SUÉDOIS SUR LE MARCHÉ DES CIRCUITS INTÉGRÉS SPÉCIFIQUES À L'APPLICATION (ASIC), PAR TYPE, 2021-2030 (EN MILLIONS USD)
TABLEAU 119 MARCHÉ SUÉDOIS DES CIRCUITS INTÉGRÉS SPÉCIFIQUES À L'APPLICATION (ASIC), PAR TECHNOLOGIE, 2021-2030 (EN MILLIONS USD)
TABLEAU 120 MARCHÉ SUÉDOIS DES CIRCUITS INTÉGRÉS SPÉCIFIQUES À L'APPLICATION (ASIC), PAR FONCTIONNALITÉ, 2021-2030 (EN MILLIONS USD)
TABLEAU 121 MARCHÉ SUÉDOIS DES CIRCUITS INTÉGRÉS SPÉCIFIQUES À L'APPLICATION (ASIC), PAR APPLICATION, 2021-2030 (EN MILLIONS USD)
TABLEAU 122 MARCHÉ BELGE DES CIRCUITS INTÉGRÉS SPÉCIFIQUES À APPLICATION (ASIC), PAR TYPE DE CONCEPTION, 2021-2030 (EN MILLIONS USD)
TABLEAU 123 ASIC SEMI-PERSONNALISÉS BELGES SUR LE MARCHÉ DES CIRCUITS INTÉGRÉS À APPLICATION SPÉCIFIQUE (ASIC), PAR TYPE, 2021-2030 (EN MILLIONS USD)
TABLEAU 124 MARCHÉ BELGE DES CIRCUITS INTÉGRÉS À APPLICATION SPÉCIFIQUE (ASIC) BASÉS SUR DES RÉSEAU DE PORTES, PAR TYPE, 2021-2030 (EN MILLIONS USD)
TABLEAU 125 MARCHÉ DES ASIC PROGRAMMABLES EN BELGIQUE SUR LE MARCHÉ DES CIRCUITS INTÉGRÉS À APPLICATION SPÉCIFIQUE (ASIC), PAR TYPE, 2021-2030 (EN MILLIONS USD)
TABLEAU 126 SÉCURITÉ DES FPGAS (FIELD PROGRAMMABLE GATE ARRAY) EN BELGIQUE SUR LE MARCHÉ DES CIRCUITS INTÉGRÉS À APPLICATION SPÉCIFIQUE (ASIC), PAR TYPE, 2021-2030 (EN MILLIONS USD)
TABLEAU 127 SÉCURITÉ DES FPGAS (FIELD PROGRAMMABLE GATE ARRAY) EN BELGIQUE SUR LE MARCHÉ DES CIRCUITS INTÉGRÉS À APPLICATION SPÉCIFIQUE (ASIC), PAR NŒUD, 2021-2030 (EN MILLIONS USD)
TABLEAU 128 SÉCURITÉ DES FPGAS (FIELD PROGRAMMABLE GATE ARRAY) EN BELGIQUE SUR LE MARCHÉ DES CIRCUITS INTÉGRÉS À APPLICATION SPÉCIFIQUE (ASIC), PAR SÉCURITÉ, 2021-2030 (EN MILLIONS USD)
TABLEAU 129 SÉCURITÉ DE NIVEAU DÉFENSE EN BELGIQUE SUR LE MARCHÉ DES CIRCUITS INTÉGRÉS SPÉCIFIQUES À APPLICATION (ASIC), PAR TYPE, 2021-2030 (EN MILLIONS USD)
TABLEAU 130 SÉCURITÉ DES FPGAS (FIELD PROGRAMMABLE GATE ARRAY) EN BELGIQUE SUR LE MARCHÉ DES CIRCUITS INTÉGRÉS À APPLICATION SPÉCIFIQUE (ASIC), PAR MÉMOIRE, 2021-2030 (EN MILLIONS USD)
TABLEAU 131 SÉCURITÉ DES FPGAS (RÉSEAU DE PORTES PROGRAMMABLES) EN BELGIQUE SUR LE MARCHÉ DES CIRCUITS INTÉGRÉS À APPLICATION SPÉCIFIQUE (ASIC), PAR BLOC FONCTIONNEL, 2021-2030 (EN MILLIONS USD)
TABLEAU 132 BLOCS LOGIQUES BELGES SUR LE MARCHÉ DES CIRCUITS INTÉGRÉS SPÉCIFIQUES À L'APPLICATION (ASIC), PAR TYPE, 2021-2030 (EN MILLIONS USD)
TABLEAU 133 DISPOSITIFS LOGIQUES PROGRAMMABLES (PLDS) SUR LE MARCHÉ DES CIRCUITS INTÉGRÉS SPÉCIFIQUES À L'APPLICATION (ASIC) EN BELGIQUE, PAR TYPE, 2021-2030 (EN MILLIONS USD)
TABLEAU 134 MARCHÉ BELGE DES CIRCUITS INTÉGRÉS SPÉCIFIQUES À APPLICATION (ASIC), PAR TECHNOLOGIE, 2021-2030 (EN MILLIONS USD)
TABLEAU 135 MARCHÉ BELGE DES CIRCUITS INTÉGRÉS SPÉCIFIQUES À APPLICATION (ASIC), PAR FONCTIONNALITÉ, 2021-2030 (EN MILLIONS USD)
TABLEAU 136 MARCHÉ BELGE DES CIRCUITS INTÉGRÉS SPÉCIFIQUES À APPLICATION (ASIC), PAR APPLICATION, 2021-2030 (EN MILLIONS USD)
TABLEAU 137 MARCHÉ AUTRICHIEN DES CIRCUITS INTÉGRÉS SPÉCIFIQUES À L'APPLICATION (ASIC), PAR TYPE DE CONCEPTION, 2021-2030 (EN MILLIONS USD)
TABLEAU 138 ASIC SEMI-PERSONNALISÉS AUTRICHIENS SUR LE MARCHÉ DES CIRCUITS INTÉGRÉS À APPLICATION SPÉCIFIQUE (ASIC), PAR TYPE, 2021-2030 (EN MILLIONS USD)
TABLEAU 139 MARCHÉ AUTRICHIEN DES CIRCUITS INTÉGRÉS À APPLICATION SPÉCIFIQUE (ASIC) BASÉS SUR DES RÉSEAU DE PORTES, PAR TYPE, 2021-2030 (EN MILLIONS USD)
TABLEAU 140 ASIC PROGRAMMABLES EN AUTRICHE SUR LE MARCHÉ DES CIRCUITS INTÉGRÉS SPÉCIFIQUES À L'APPLICATION (ASIC), PAR TYPE, 2021-2030 (EN MILLIONS USD)
TABLEAU 141 SÉCURITÉ DES FPGAS (RÉSEAU DE PORTES PROGRAMMABLES) AUTRICHIENNES SUR LE MARCHÉ DES CIRCUITS INTÉGRÉS À APPLICATION SPÉCIFIQUE (ASIC), PAR TYPE, 2021-2030 (EN MILLIONS USD)
TABLEAU 142 AUTRICHE SÉCURITÉ DES FPGAS (RÉSEAU DE PORTES PROGRAMMABLES) SUR LE MARCHÉ DES CIRCUITS INTÉGRÉS SPÉCIFIQUES À L'APPLICATION (ASIC), PAR NŒUD, 2021-2030 (EN MILLIONS USD)
TABLEAU 143 AUTRICHE SÉCURITÉ DES FPGAS (RÉSEAU DE PORTES PROGRAMMABLES) SUR LE MARCHÉ DES CIRCUITS INTÉGRÉS À APPLICATION SPÉCIFIQUE (ASIC), PAR SÉCURITÉ, 2021-2030 (EN MILLIONS USD)
TABLEAU 144 SÉCURITÉ DE NIVEAU DÉFENSE EN AUTRICHE SUR LE MARCHÉ DES CIRCUITS INTÉGRÉS SPÉCIFIQUES À APPLICATION (ASIC), PAR TYPE, 2021-2030 (EN MILLIONS USD)
TABLEAU 145 AUTRICHE SÉCURITÉ DES FPGAS (RÉSEAU DE PORTES PROGRAMMABLES) SUR LE MARCHÉ DES CIRCUITS INTÉGRÉS À APPLICATION SPÉCIFIQUE (ASIC), PAR MÉMOIRE, 2021-2030 (EN MILLIONS USD)
TABLEAU 146 AUTRICHE SÉCURITÉ DES FPGAS (RÉSEAU DE PORTES PROGRAMMABLES) SUR LE MARCHÉ DES CIRCUITS INTÉGRÉS À APPLICATION SPÉCIFIQUE (ASIC), PAR BLOC FONCTIONNEL, 2021-2030 (EN MILLIONS USD)
TABLEAU 147 BLOCS LOGIQUES AUTRICHIENS SUR LE MARCHÉ DES CIRCUITS INTÉGRÉS SPÉCIFIQUES À L'APPLICATION (ASIC), PAR TYPE, 2021-2030 (EN MILLIONS USD)
TABLEAU 148 DISPOSITIFS LOGIQUES PROGRAMMABLES (PLDS) AUTRICHIENS SUR LE MARCHÉ DES CIRCUITS INTÉGRÉS SPÉCIFIQUES À L'APPLICATION (ASIC), PAR TYPE, 2021-2030 (EN MILLIONS USD)
TABLEAU 149 MARCHÉ AUTRICHIEN DES CIRCUITS INTÉGRÉS SPÉCIFIQUES À APPLICATION (ASIC), PAR TECHNOLOGIE, 2021-2030 (EN MILLIONS USD)
TABLEAU 150 MARCHÉ AUTRICHIEN DES CIRCUITS INTÉGRÉS SPÉCIFIQUES À L'APPLICATION (ASIC), PAR FONCTIONNALITÉ, 2021-2030 (EN MILLIONS USD)
TABLEAU 151 MARCHÉ AUTRICHIEN DES CIRCUITS INTÉGRÉS SPÉCIFIQUES À APPLICATION (ASIC), PAR APPLICATION, 2021-2030 (EN MILLIONS USD)
TABLEAU 152 MARCHÉ DES CIRCUITS INTÉGRÉS SPÉCIFIQUES À L'APPLICATION (ASIC) AU DANEMARK, PAR TYPE DE CONCEPTION, 2021-2030 (EN MILLIONS USD)
TABLEAU 153 DANEMARK ASIC SEMI-PERSONNALISÉS SUR LE MARCHÉ DES CIRCUITS INTÉGRÉS SPÉCIFIQUES À L'APPLICATION (ASIC), PAR TYPE, 2021-2030 (EN MILLIONS USD)
TABLEAU 154 MARCHÉ DES CIRCUITS INTÉGRÉS À APPLICATION SPÉCIFIQUE (ASIC) BASÉS SUR LES RÉSEAU DE PORTES AU DANEMARK, PAR TYPE, 2021-2030 (EN MILLIONS USD)
TABLEAU 155 DANEMARK ASIC PROGRAMMABLES SUR LE MARCHÉ DES CIRCUITS INTÉGRÉS SPÉCIFIQUES À L'APPLICATION (ASIC), PAR TYPE, 2021-2030 (EN MILLIONS USD)
TABLEAU 156 DANEMARK SÉCURITÉ DES FPGAS (FIELD PROGRAMMABLE GATE ARRAY) SUR LE MARCHÉ DES CIRCUITS INTÉGRÉS À APPLICATION SPÉCIFIQUE (ASIC), PAR TYPE, 2021-2030 (EN MILLIONS USD)
TABLEAU 157 DANEMARK SÉCURITÉ DES FPGAS (FIELD PROGRAMMABLE GATE ARRAY) SUR LE MARCHÉ DES CIRCUITS INTÉGRÉS SPÉCIFIQUES À L'APPLICATION (ASIC), PAR NŒUD, 2021-2030 (EN MILLIONS USD)
TABLEAU 158 DANEMARK SÉCURITÉ DES FPGAS (FIELD PROGRAMMABLE GATE ARRAY) SUR LE MARCHÉ DES CIRCUITS INTÉGRÉS À APPLICATION SPÉCIFIQUE (ASIC), PAR SÉCURITÉ, 2021-2030 (EN MILLIONS USD)
TABLEAU 159 DANEMARK : SÉCURITÉ DE NIVEAU DÉFENSE SUR LE MARCHÉ DES CIRCUITS INTÉGRÉS SPÉCIFIQUES À L'APPLICATION (ASIC), PAR TYPE, 2021-2030 (EN MILLIONS USD)
TABLEAU 160 DANEMARK SÉCURITÉ DES FPGAS (RÉSEAU DE PORTES PROGRAMMABLES) SUR LE MARCHÉ DES CIRCUITS INTÉGRÉS À APPLICATION SPÉCIFIQUE (ASIC), PAR MÉMOIRE, 2021-2030 (EN MILLIONS USD)
TABLEAU 161 DANEMARK SÉCURITÉ DES FPGAS (RÉSEAU DE PORTES PROGRAMMABLES) SUR LE MARCHÉ DES CIRCUITS INTÉGRÉS À APPLICATION SPÉCIFIQUE (ASIC), PAR BLOC FONCTIONNEL, 2021-2030 (EN MILLIONS USD)
TABLEAU 162 BLOCS LOGIQUES DU MARCHÉ DES CIRCUITS INTÉGRÉS SPÉCIFIQUES À L'APPLICATION (ASIC) AU DANEMARK, PAR TYPE, 2021-2030 (EN MILLIONS USD)
TABLEAU 163 DANEMARK DISPOSITIFS LOGIQUES PROGRAMMABLES (PLDS) SUR LE MARCHÉ DES CIRCUITS INTÉGRÉS SPÉCIFIQUES À L'APPLICATION (ASIC), PAR TYPE, 2021-2030 (EN MILLIONS USD)
TABLEAU 164 MARCHÉ DES CIRCUITS INTÉGRÉS SPÉCIFIQUES À L'APPLICATION (ASIC) AU DANEMARK, PAR TECHNOLOGIE, 2021-2030 (EN MILLIONS USD)
TABLEAU 165 MARCHÉ DES CIRCUITS INTÉGRÉS SPÉCIFIQUES À L'APPLICATION (ASIC) AU DANEMARK, PAR FONCTIONNALITÉ, 2021-2030 (EN MILLIONS USD)
TABLEAU 166 MARCHÉ DES CIRCUITS INTÉGRÉS SPÉCIFIQUES À L'APPLICATION (ASIC) AU DANEMARK, PAR APPLICATION, 2021-2030 (EN MILLIONS USD)
TABLEAU 167 RESTE DU MARCHÉ DES CIRCUITS INTÉGRÉS SPÉCIFIQUES À APPLICATION (ASIC) DE L'UNION EUROPÉENNE, PAR TYPE DE CONCEPTION, 2021-2030 (EN MILLIONS USD)
Liste des figures
FIGURE 1 MARCHÉ DES CIRCUITS INTÉGRÉS SPÉCIFIQUES À L'APPLICATION (ASIC) DE L'UNION EUROPÉENNE : SEGMENTATION
FIGURE 2 MARCHÉ DES CIRCUITS INTÉGRÉS SPÉCIFIQUES À L'APPLICATION (ASIC) DE L'UNION EUROPÉENNE : TRIANGULATION DES DONNÉES
FIGURE 3 MARCHÉ DES CIRCUITS INTÉGRÉS SPÉCIFIQUES À L'APPLICATION (ASIC) DE L'UNION EUROPÉENNE : ANALYSE DROC
FIGURE 4 MARCHÉ DES CIRCUITS INTÉGRÉS SPÉCIFIQUES À L'APPLICATION (ASIC) DE L'UNION EUROPÉENNE : ANALYSE UNION EUROPÉENNE VS PAYS
FIGURE 5 MARCHÉ DES CIRCUITS INTÉGRÉS SPÉCIFIQUES À L'APPLICATION (ASIC) DE L'UNION EUROPÉENNE : ANALYSE DE LA RECHERCHE DES ENTREPRISES
FIGURE 6 MARCHÉ DES CIRCUITS INTÉGRÉS SPÉCIFIQUES À L'APPLICATION (ASIC) DE L'UNION EUROPÉENNE : DONNÉES DÉMOGRAPHIQUES DES ENTRETIENS
FIGURE 7 MARCHÉ DES CIRCUITS INTÉGRÉS SPÉCIFIQUES À L'APPLICATION (ASIC) DE L'UNION EUROPÉENNE : GRILLE DE POSITIONNEMENT DBMRMARKET
FIGURE 8 MARCHÉ DES CIRCUITS INTÉGRÉS SPÉCIFIQUES À L'APPLICATION (ASIC) DE L'UNION EUROPÉENNE : ANALYSE DES PARTS DE FOURNISSEURS
FIGURE 9 MARCHÉ DES CIRCUITS INTÉGRÉS SPÉCIFIQUES À L'APPLICATION (ASIC) DE L'UNION EUROPÉENNE : MODÉLISATION MULTIVARIABLE
FIGURE 10 MARCHÉ DES CIRCUITS INTÉGRÉS SPÉCIFIQUES À L'APPLICATION (ASIC) DE L'UNION EUROPÉENNE : COURBE CHRONOLOGIQUE
FIGURE 11 MARCHÉ DES CIRCUITS INTÉGRÉS SPÉCIFIQUES À L'APPLICATION (ASIC) DE L'UNION EUROPÉENNE : GRILLE DE COUVERTURE DES APPLICATIONS DU MARCHÉ
FIGURE 12 MARCHÉ DES CIRCUITS INTÉGRÉS SPÉCIFIQUES À L'APPLICATION (ASIC) DE L'UNION EUROPÉENNE : SEGMENTATION
FIGURE 13 L'AUGMENTATION DE L'ADOPTION DE SYSTÈMES D'ARMES AUTONOMES DEVRAIT STIMULER LE MARCHÉ DES CIRCUITS INTÉGRÉS SPÉCIFIQUES À L'APPLICATION (ASIC) DE L'UNION EUROPÉENNE AU COURS DE LA PÉRIODE DE PRÉVISION DE 2023 À 2030
FIGURE 14 LE SEGMENT ASIC SEMI-PERSONNALISÉ DEVRAIT REPRÉSENTER LA PLUS GRANDE PART DU MARCHÉ DES CIRCUITS INTÉGRÉS SPÉCIFIQUES À L'APPLICATION (ASIC) DE L'UNION EUROPÉENNE EN 2023 ET 2030
FIGURE 15 TENDANCES TECHNOLOGIQUES SUR LE MARCHÉ EUROPÉEN DES CIRCUITS INTÉGRÉS SPÉCIFIQUES À APPLICATION (ASIC)
FIGURE 16 MOTEURS, CONTRAINTES, OPPORTUNITÉS ET DÉFIS DU MARCHÉ DES CIRCUITS INTÉGRÉS SPÉCIFIQUES À UNE APPLICATION (ASIC) DE L'UNION EUROPÉENNE
FIGURE 17 (2020-2025) – TAUX D'ADOPTION MONDIAL DE L'AUTOMATISATION DANS LES INDUSTRIES
FIGURE 18 MARCHÉ DES CIRCUITS INTÉGRÉS SPÉCIFIQUES À L'APPLICATION (ASIC) DE L'UNION EUROPÉENNE, PAR TYPE DE CONCEPTION, 2022
FIGURE 19 MARCHÉ DES CIRCUITS INTÉGRÉS SPÉCIFIQUES À APPLICATION (ASIC) DE L'UNION EUROPÉENNE, PAR TECHNOLOGIE, 2022
FIGURE 20 MARCHÉ DES CIRCUITS INTÉGRÉS SPÉCIFIQUES À APPLICATION (ASIC) DE L'UNION EUROPÉENNE, PAR FONCTIONNALITÉ, 2022
FIGURE 21 MARCHÉ DES CIRCUITS INTÉGRÉS SPÉCIFIQUES À APPLICATION (ASIC) DE L'UNION EUROPÉENNE, PAR APPLICATION, 2022
FIGURE 22 MARCHÉ DES CIRCUITS INTÉGRÉS SPÉCIFIQUES À APPLICATION (ASIC) DE L'UNION EUROPÉENNE : INSTANTANÉ (2022)
FIGURE 23 MARCHÉ DES CIRCUITS INTÉGRÉS SPÉCIFIQUES À APPLICATION (ASIC) DE L'UNION EUROPÉENNE : PAR PAYS (2022)
FIGURE 24 MARCHÉ DES CIRCUITS INTÉGRÉS SPÉCIFIQUES À APPLICATION (ASIC) DE L'UNION EUROPÉENNE : PAR PAYS (2023 ET 2030)
FIGURE 25 MARCHÉ DES CIRCUITS INTÉGRÉS SPÉCIFIQUES À APPLICATION (ASIC) DE L'UNION EUROPÉENNE : PAR PAYS (2022 ET 2030)
FIGURE 26 MARCHÉ DES CIRCUITS INTÉGRÉS SPÉCIFIQUES À UNE APPLICATION (ASIC) DE L'UNION EUROPÉENNE : PAR TYPE DE CONCEPTION (2023-2030)
FIGURE 27 MARCHÉ DES CIRCUITS INTÉGRÉS SPÉCIFIQUES À APPLICATION (ASIC) DE L'UNION EUROPÉENNE : PART DES ENTREPRISES EN 2022 (%)
Méthodologie de recherche
La collecte de données et l'analyse de l'année de base sont effectuées à l'aide de modules de collecte de données avec des échantillons de grande taille. L'étape consiste à obtenir des informations sur le marché ou des données connexes via diverses sources et stratégies. Elle comprend l'examen et la planification à l'avance de toutes les données acquises dans le passé. Elle englobe également l'examen des incohérences d'informations observées dans différentes sources d'informations. Les données de marché sont analysées et estimées à l'aide de modèles statistiques et cohérents de marché. De plus, l'analyse des parts de marché et l'analyse des tendances clés sont les principaux facteurs de succès du rapport de marché. Pour en savoir plus, veuillez demander un appel d'analyste ou déposer votre demande.
La méthodologie de recherche clé utilisée par l'équipe de recherche DBMR est la triangulation des données qui implique l'exploration de données, l'analyse de l'impact des variables de données sur le marché et la validation primaire (expert du secteur). Les modèles de données incluent la grille de positionnement des fournisseurs, l'analyse de la chronologie du marché, l'aperçu et le guide du marché, la grille de positionnement des entreprises, l'analyse des brevets, l'analyse des prix, l'analyse des parts de marché des entreprises, les normes de mesure, l'analyse globale par rapport à l'analyse régionale et des parts des fournisseurs. Pour en savoir plus sur la méthodologie de recherche, envoyez une demande pour parler à nos experts du secteur.
Personnalisation disponible
Data Bridge Market Research est un leader de la recherche formative avancée. Nous sommes fiers de fournir à nos clients existants et nouveaux des données et des analyses qui correspondent à leurs objectifs. Le rapport peut être personnalisé pour inclure une analyse des tendances des prix des marques cibles, une compréhension du marché pour d'autres pays (demandez la liste des pays), des données sur les résultats des essais cliniques, une revue de la littérature, une analyse du marché des produits remis à neuf et de la base de produits. L'analyse du marché des concurrents cibles peut être analysée à partir d'une analyse basée sur la technologie jusqu'à des stratégies de portefeuille de marché. Nous pouvons ajouter autant de concurrents que vous le souhaitez, dans le format et le style de données que vous recherchez. Notre équipe d'analystes peut également vous fournir des données sous forme de fichiers Excel bruts, de tableaux croisés dynamiques (Fact book) ou peut vous aider à créer des présentations à partir des ensembles de données disponibles dans le rapport.

