Global Free Standing Electrical Height Adjustable Tables Market
Taille du marché en milliards USD
TCAC :
% 
 USD
4.43 Billion
USD
7.81 Billion
2025
2033
USD
4.43 Billion
USD
7.81 Billion
2025
2033
| 2026 –2033 | |
| USD 4.43 Billion | |
| USD 7.81 Billion | |
| % | |
|
Global Free Standing Electrical Height-Ajustable Tables Segmentation du marché, par type de produit (moteur simple, moteur double, multimoteur et autres), matériel (métal, bois, plastique/composite, verre et autres), application (bureaux d'entreprise, éducation, soins de santé, résidentiel et autres), utilisateur final (grandes entreprises, petites et moyennes entreprises, consommateurs individuels, institutions publiques et autres), canal de distribution (ventes directes, ventes indirectes, ventes contractuelles et autres) - tendances de l'industrie et prévisions à 2033.
Tables réglables en hauteur sur piedTaille du marché
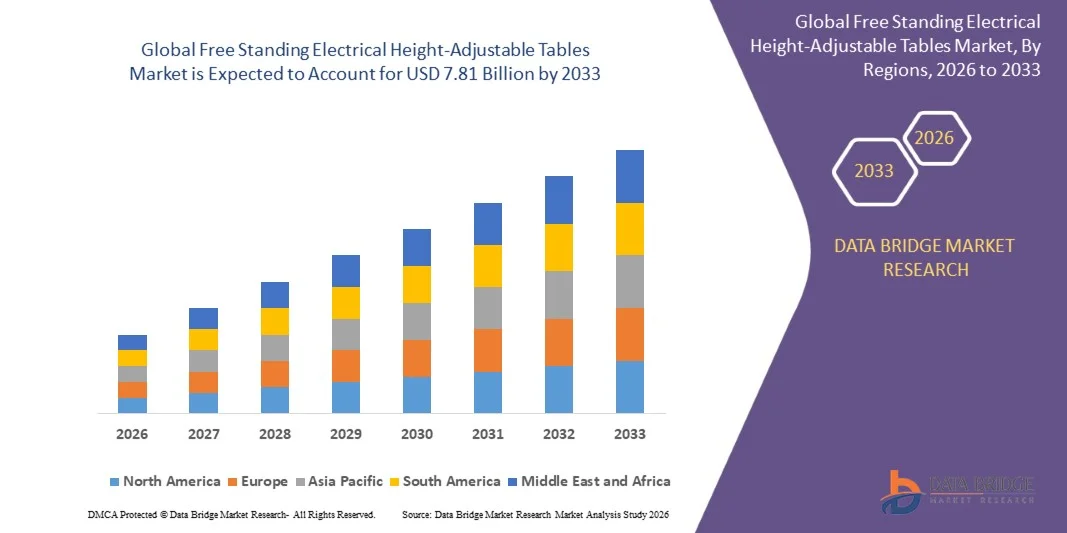
- La taille du marché mondial des tables électriques réglables en hauteur a été évaluée à4,43 milliards de dollars en 2025et devrait atteindre7,81 milliards de dollars avant 2033, à uneTCAC de 7,4%pendant la période de prévision.
- La croissance du marché est principalement attribuable à l'adoption croissante de solutions ergonomiques de mobilier de bureau, à une sensibilisation accrue à la santé des employés et au bien-être en milieu de travail, ainsi qu'à la demande croissante d'environnements de travail souples et productifs dans les entreprises, les établissements d'enseignement et les bureaux à domicile.
- De plus, les progrès technologiques dans le mobilier de bureau intelligent, l'intégration croissante des mécanismes d'ajustement de la hauteur électrique et l'augmentation des investissements dans les infrastructures modernes du lieu de travail accélèrent encore l'adoption de tables réglables de la hauteur électrique debout, ce qui stimule la croissance générale du marché.
Tables réglables en hauteur sur piedAnalyse du marché
- La croissance du marché est alimentée par l'accent croissant mis sur les solutions ergonomiques en milieu de travail, l'augmentation de la prévalence des modèles de travail hybrides et à distance et l'accent croissant mis par l'entreprise sur l'amélioration du confort des employés, de la gestion des postures et de la productivité.
- L'innovation continue dans les technologies de bureau réglables, y compris les réglages de hauteur programmables, les systèmes anticollision, les bureaux intelligents compatibles IoT et les mécanismes de levage écoénergétiques, soutient davantage l'expansion du marché à travers le monde.
- L'Amérique du Nord est devenue la plus grande région productrice de revenus sur le marché mondial des tables électriques réglables en hauteur, avec une part de 31,83 % en 2025, appuyée par une solide infrastructure de bureau, une forte adoption de mobilier ergonomique et des investissements accrus dans les initiatives de modernisation du milieu de travail.
- On s'attend à ce que l'Amérique du Nord soit la région qui connaît la croissance la plus rapide, avec un TCAC de 8,4% au cours de la période de prévision, en raison de la demande croissante de mobilier ergonomique de bureau, de la sensibilisation accrue à la santé au travail et de l'adoption de solutions d'espace de travail flexibles dans les secteurs commercial et éducatif.
- Le segment des tables réglables en hauteur monomoteur a dominé le marché avec une part de 47,97 % en 2025, en raison d'une stabilité supérieure, d'une capacité de charge plus élevée, d'une fonctionnalité de réglage de la hauteur plus lisse et d'une préférence croissante parmi les utilisateurs d'entreprises pour des solutions de poste de travail ergonomiques de qualité supérieure.
Portée etSegmentation du marché des tables réglables en hauteur sur pied
|
Attributs |
Tables réglables en hauteur électrique librePerspectives du marché |
|
Segments couverts |
|
|
Pays couverts |
Amérique du Nord · États-Unis · Canada · Mexique Europe · Allemagne · France · Royaume-Uni · Pays-Bas · Suisse · Belgique · Russie · Italie · Espagne · Turquie · Reste de l'Europe Asie-Pacifique · Chine · Japon · Inde · Corée du Sud · Singapour · Malaisie · Australie · Thaïlande · Indonésie · Philippines · Reste de l'Asie-Pacifique Moyen-Orient et Afrique · Arabie saoudite · U.A.E. · Afrique du Sud · Égypte · Israël · Reste du Moyen-Orient et de l'Afrique Amérique du Sud · Brésil · Argentine · Reste de l'Amérique du Sud |
|
Principaux acteurs du marché |
· Herman Miller, Inc. (États-Unis) · Steelcase Inc. (États-Unis) · Inter IKEA Systems B.V. (Pays-Bas) · Haworth, Inc. (États-Unis) · Kinnarps AB (Suède) · Teknion (Canada) · Ergotron (États-Unis) · CEKA (Allemagne) · Martela (Finlande) · SUNON (Chine) · Xdesk.com (États-Unis) · Evodesk.com (États-Unis) · Loctek Ergonomic Technology Corp. (Chine) · Bureau UPLIFT (États-Unis) · Sedus Stoll AG (Allemagne) · Ergosphère (Inde) · Schiavello (Australie) · KOKUYO Co., Ltd. (Japon) · Vitra International AG (Suisse) · Échelle humaine (États-Unis) · Okamura Corporation (Japon) · HON (partie de HNI Corporation) (États-Unis) · Fellowes, Inc. (États-Unis) · ApexDesk (États-Unis) · Autonome (États-Unis) · Vari Inc. (États-Unis) |
|
Possibilités de marché |
· Progrès technologiques dans les mécanismes de levage électrique et l'intégration des bureaux intelligents · Innovation dans les tables compactes et modulables · Augmentation de l'adoption dans les postes de travail de jeu et de création |
|
Infos sur la valeur ajoutée |
En plus des renseignements sur les scénarios du marché tels que la valeur du marché, le taux de croissance, la segmentation, la couverture géographique et les principaux intervenants, les rapports de marché établis par Data Bridge Market Research comprennent également une analyse approfondie des experts, une analyse des prix, une analyse des parts de marque, une enquête auprès des consommateurs, une analyse démographique, une analyse de la chaîne d'approvisionnement, une analyse de la chaîne de valeur, une vue d'ensemble des matières premières et des consommables, des critères de sélection des fournisseurs, une analyse PESTLE, une analyse Porter et un cadre réglementaire. |
Tables réglables en hauteur électrique libre Tendances du marché
(en milliers de dollars)Demande croissante d'espaces de travail ergonomiques et flexibles(en milliers de dollars)
- Les organisations de partout dans le monde adoptent de plus en plus des tables réglables en hauteur pour promouvoir le bien-être des employés, améliorer la posture et réduire les problèmes de santé associés à des séances prolongées dans les bureaux.
- La popularité croissante des modèles de travail hybrides et des structures de bureau à domicile encourage tant les entreprises que les consommateurs individuels à investir dans des solutions ergonomiques de mobilier qui soutiennent des modalités de travail flexibles et améliorent la productivité.
- Les tables modernes réglables en hauteur sont intégrées à des technologies intelligentes telles que les préréglages de mémoire, les ports de recharge USB, les systèmes de gestion des câbles et les réglages contrôlés par l'application pour améliorer la commodité et l'efficacité du travail.
- Les bureaux ministériels se concentrent sur la conception de lieux de travail axés sur les employés, où les comptoirs d'assise deviennent une composante standard de l'infrastructure moderne de bureau pour améliorer le confort, l'engagement et l'efficacité opérationnelle.
- La sensibilisation croissante aux troubles musculosquelettiques, aux maux de dos et aux problèmes de santé sédentaires accélère l'adoption de mobilier de bureau ergonomique dans les secteurs commercial et résidentiel.
- Les fabricants introduisent des tables réglables en hauteur esthétiquement attrayantes et personnalisables avec des matériaux avancés, des conceptions compactes et des caractéristiques axées sur la durabilité pour répondre aux préférences changeantes des consommateurs.
- Au-delà des bureaux d'entreprise, les établissements d'enseignement, les établissements de santé, les espaces de coworking et les organisations gouvernementales déploient de plus en plus de tables réglables en hauteur pour améliorer le confort des utilisateurs, l'accessibilité et l'adaptabilité au travail.
Tables réglables en hauteur électrique libre
Chauffeur
L'adoption de normes ergonomiques sur les lieux de travail dans les bureaux des entreprises
- L'accent de plus en plus mis sur la santé des employés, le bien-être en milieu de travail et l'amélioration de la productivité est l'un des principaux moteurs du marché mondial des tables réglables en hauteur. Les organisations appliquent de plus en plus des normes ergonomiques en milieu de travail pour réduire les contraintes physiques, améliorer la posture et créer des environnements de travail plus sains pour les employés. Les tables réglables en hauteur permettent d'alterner entre les positions assises et debout, ce qui contribue à réduire la fatigue, l'inconfort musculo-squelettique et le comportement sédentaire associé à de longues heures de travail.
- Par exemple, en mars 2025, plusieurs fabricants de meubles de bureau de premier plan de Global ont élargi leurs portefeuilles smart sit-stand avec des rappels de posture compatibles avec l'IA, des réglages de hauteur programmables et des fonctions intégrées de suivi du bien-être conçues pour les lieux de travail hybrides. Ces innovations soutiennent le confort et la productivité des employés tout en s'adaptant à l'accent de plus en plus mis sur l'infrastructure de bureau ergonomique et la transformation de l'espace de travail axé sur le bien-être. De tels développements contribuent de manière significative à la croissance du marché mondial des tables réglables en hauteur.
- En outre, l'expansion de la culture de travail hybride et des tendances du travail à distance a encouragé les consommateurs à investir dans des solutions ergonomiques de mobilier de bureau. Les employeurs offrent également de plus en plus d'indemnités ergonomiques pour le mobilier et améliorent l'infrastructure de bureau pour se conformer aux lignes directrices en matière de santé et de sécurité au travail.
- La sensibilisation croissante à l'ergonomie en milieu de travail, conjuguée à l'augmentation des investissements dans les environnements de travail modernes et les initiatives de bien-être des employés, continue de soutenir la forte demande de tables réglables en hauteur d'électricité libres à l'échelle mondiale.
Restriction/Défi
(en milliers de dollars)Coût des produits plus élevé que les bureaux fixes classiques(en milliers de dollars)
- Le coût relativement élevé des bureaux réglables électriquement par rapport aux meubles de bureau fixes traditionnels constitue une contrainte majeure sur le marché mondial des tables réglables en hauteur. Les tables réglables en hauteur de pointe intègrent des moteurs électriques, des systèmes de commande, des réglages programmables et des matériaux de qualité supérieure, ce qui entraîne des coûts de fabrication et de détail beaucoup plus élevés.
- L'introduction de bureaux intelligents de pointe dotés de capteurs intégrés, de systèmes de recharge sans fil, de systèmes anticollision et de contrôles compatibles IoT a encore augmenté le prix des produits. Bien que ces innovations améliorent la fonctionnalité et l'expérience utilisateur, elles créent également des défis d'accessibilité pour les petites entreprises, les start-up, les établissements d'enseignement et les consommateurs sensibles aux prix.
- Par exemple, en octobre 2024, plusieurs marques de mobilier de bureau haut de gamme ont lancé des postes de travail réglables en hauteur intelligents de nouvelle génération dotés de capacités d'automatisation et de surveillance du bien-être. Bien que ces produits aient amélioré les performances ergonomiques et l'efficacité sur le lieu de travail, leur prix haut de gamme a mis en évidence un défi majeur pour l'adoption plus large du marché, en particulier parmi les organismes soucieux du budget et les utilisateurs résidentiels.
- De plus, les coûts d'installation, d'entretien et de réparation associés aux systèmes de bureau motorisés peuvent augmenter le coût total de la propriété au fil du temps. Les organisations qui exploitent des bureaux à grande échelle peuvent faire face à d'importantes dépenses en capital lorsqu'elles remplacent des bureaux classiques par des bureaux électriques réglables en hauteur.
- Par conséquent, malgré la prise de conscience croissante des avantages ergonomiques et des initiatives de mieux-être en milieu de travail, l'investissement initial plus élevé associé à Free Standing Electrical Height-Adjustable Tables demeure un facteur important limitant la pénétration du marché dans certains segments de la clientèle mondiale.
Tables réglables en hauteur électrique libre Portée du marché
Le marché est segmenté sur la base de cinq segments notables basés sur le type de produit, le matériel, l'application, l'utilisateur final et le canal de distribution.
- Par type de produit
Sur la base du type de produit, le marché mondial des tables réglables en hauteur est segmenté en un seul moteur, vitesse de réglage, interface de commande, double moteur, vitesse de réglage, interface de commande, multimoteur, vitesse de réglage, interface de commande, etc. En 2026, le segment monomoteur devrait dominer le marché avec une part de marché de 47,89 %.
Le segment Multi-Motor devrait enregistrer le TCAC le plus rapide de 7,8 % entre 2026 et 2033, en raison de la demande croissante de solutions de bureau ergonomiques haut de gamme avec une stabilité accrue, une capacité de levage plus élevée et des performances de réglage de hauteur plus fluides. Les systèmes multimoteurs sont de plus en plus utilisés dans les grands bureaux de l'entreprise, les espaces de travail collaboratifs et les environnements exécutifs en raison de leur fonctionnalité supérieure, des systèmes de contrôle avancés et de la capacité de supporter les configurations de postes de travail plus importants. De plus, l'intégration croissante des technologies intelligentes telles que les contrôles basés sur l'application, les paramètres de mémoire programmables et les systèmes de gestion de bureau compatibles avec l'IoT soutient davantage la croissance rapide du segment.
- Par matière
Sur la base du matériel, le marché mondial des tables réglables en hauteur est segmenté en métal, bois, bois d'ingénierie, plastique/composite, verre, etc. En 2026, le segment Metal devrait dominer le marché avec une part de marché de 43,58 % Le segment Plastic/Composite devrait connaître la croissance la plus rapide du marché mondial des tables réglables en hauteur, avec un TCAC de 8,0 % entre 2026 et 2033. Cette croissance s'explique par la préférence croissante des consommateurs pour des solutions de mobilier de bureau esthétiquement attrayantes, durables et haut de gamme.
- Par demande
Sur la base de l'application, le marché mondial des tables réglables en hauteur est segmenté en bureaux d'entreprise, en éducation, en santé, en résidence et autres. En 2026, le segment des bureaux d'entreprise devrait dominer le marché avec une part de marché de 50,52 % Le segment résidentiel devrait connaître le TCAC le plus rapide de 7,9 % entre 2026 et 2033, en raison de l'adoption croissante de modèles de travail à distance et hybrides à travers Global. Les consommateurs investissent de plus en plus dans des meubles ergonomiques de bureau pour améliorer le confort, la productivité et la flexibilité de l'espace de travail. De plus, la prise de conscience accrue des problèmes de santé liés à la posture, l'augmentation des revenus disponibles et la disponibilité de solutions de table compactes et personnalisables réglables en hauteur accélèrent encore la croissance du segment dans les applications résidentielles.
- Par utilisateur final
Sur la base de l'utilisateur final, le marché mondial des tables électriques réglables en hauteur est segmenté en grandes entreprises, petites et moyennes entreprises, consommateurs individuels, institutions publiques et gouvernementales. En 2026, le segment des grandes entreprises devrait dominer le marché avec une part de marché de 40,41 %.
Le segment du gouvernement et des institutions publiques devrait connaître le TCAC le plus rapide de 8,2 %, de 2026 à 2033, en raison de l'adoption croissante de solutions ergonomiques en milieu de travail dans les bureaux du gouvernement, les organismes du secteur public, les établissements d'enseignement et les installations administratives. L'accent mis de plus en plus sur le bien-être des employés, les normes de santé au travail et la modernisation des espaces de travail publics encourage les investissements dans les tables réglables en hauteur. De plus, les initiatives gouvernementales visant à promouvoir des environnements de travail sains, à remplacer de plus en plus le mobilier de bureau traditionnel et à mettre davantage l'accent sur la productivité et l'efficacité en milieu de travail appuient davantage la forte croissance du segment dans le monde entier.
- Par canal de distribution
Sur la base du canal de distribution, le marché mondial des tables électriques réglables en hauteur est segmenté en ventes directes, ventes indirectes, commerce électronique, ventes contractuelles, etc. En 2026, le segment des ventes indirectes devrait dominer le marché avec une part de marché de 41,66 % Le segment des ventes directes devrait connaître le TCAC le plus rapide de 7,6 % entre 2026 et 2033, principalement en raison de la préférence croissante des clients d'entreprise et des grandes entreprises pour des solutions de mobilier ergonomiques personnalisées et des accords d'approvisionnement en vrac. Les canaux de vente directs permettent aux fabricants d'offrir des configurations de produits sur mesure, des services d'installation dédiés, une assistance après-vente et des contrats de maintenance à long terme, améliorant la satisfaction des clients et l'efficacité opérationnelle. De plus, la demande croissante de projets de modernisation des lieux de travail, l'expansion des bureaux commerciaux et l'accent croissant mis sur l'établissement de relations directes avec les clients accélèrent encore la croissance du segment des ventes directes dans l'ensemble du monde.
Tables réglables en hauteur sur le marché
- L'Amérique du Nord a dominé le marché mondial des tables électriques réglables en hauteur, avec la plus grande part de revenus de 31,83 % en 2025.
- L'Amérique du Nord domine le marché avec la plus grande part de revenus, appuyée par la forte présence de bureaux d'entreprise, l'adoption rapide de solutions ergonomiques en milieu de travail, une grande sensibilisation des consommateurs au bien-être des employés et l'augmentation des investissements dans les infrastructures de bureau modernes.
- La région bénéficie d'infrastructures commerciales de pointe, d'une culture de travail hybride en croissance, d'un pouvoir d'achat élevé et de la présence généralisée de grands fabricants de meubles de bureau, qui soutiennent collectivement l'adoption de tables électriques fixes et réglables gratuites dans les bureaux d'entreprise, les établissements d'enseignement, les établissements de santé et les espaces de travail résidentiels.
Europe Libre Standing électrique Tables réglables en hauteur Aperçu du marché
Le marché européen des tables électriques réglables en hauteur est en pleine croissance, grâce à une prise de conscience accrue de l'ergonomie du travail, à l'adoption croissante de modèles de travail hybrides et à des investissements croissants dans des solutions modernes de mobilier de bureau. L'expansion du secteur des entreprises, l'accent mis sur la santé et la productivité des employés et l'augmentation de la demande d'aménagements ergonomiques de bureaux à domicile stimulent l'adoption de produits dans toutes les applications commerciales et résidentielles. De plus, les normes de soutien en matière de santé au travail et la pénétration croissante des technologies de bureau intelligents contribuent à l'expansion du marché dans toute l'Europe.
Asia-Pacific Free Standing Electrical Height-Ajustable Tables Aperçu du marché
Le marché des tables électriques réglables en hauteur en position libre pour l'Asie et le Pacifique est en pleine expansion au sein de la planète, appuyé par l'expansion des infrastructures commerciales, l'augmentation des investissements étrangers et la sensibilisation aux environnements ergonomiques du travail. Le développement croissant des bureaux d'entreprise, des espaces de coworking et des établissements d'enseignement stimule la demande de solutions modernes de mobilier de bureau partout au pays. De plus, l'adoption croissante de solutions de bureau réglables en hauteur, l'expansion des canaux de distribution du commerce électronique et l'accent accru mis sur la productivité en milieu de travail et le bien-être des employés appuient davantage la croissance du marché en Asie-Pacifique.
Part de marché des tables réglables en hauteur électrique
L'industrie des tables réglables en hauteur est principalement dirigée par des entreprises bien établies, notamment :
- Herman Miller, Inc. (États-Unis)
- Steelcase Inc. (États-Unis)
- Inter IKEA Systems B.V. (Pays-Bas)
- Haworth, Inc. (États-Unis)
- Kinnarps AB (Suède)
- Teknion (Canada)
- Ergotron (États-Unis)
- CEKA (Allemagne)
- Martela (Finlande)
- SUNON (Chine)
- Xdesk.com (États-Unis)
- Evodesk.com (États-Unis)
- Loctek Ergonomic Technology Corp. (Chine)
- Bureau uplift (États-Unis)
- Sedus Stoll AG (Allemagne)
- Ergosphère (Inde)
- Schiavello (Australie)
- KOKUYO Co., Ltd. (Japon)
- Vitra International AG (Suisse)
- Échelle humaine (États-Unis)
- Okamura Corporation (Japon)
- HON (partie de HNI Corporation) (États-Unis)
- Fellowes, Inc. (États-Unis)
- ApexDesk (États-Unis)
- Autonome (États-Unis)
- Vari Inc. (États-Unis)
Les derniers développements du marché mondial des tables réglables en hauteur
- En février 2026, l'article de BTOD examine le bureau électrique IKEA Idasen, qui est une table réglable en hauteur électrique. Il explique que l'Idasen a été présenté comme une amélioration par rapport à l'IKEA, plus tôt Bekant sit-stand desk en utilisant des composants d'actionneur linéaire de qualité supérieure de la société Linak, ce qui améliore la fiabilité et les performances de mouvement. La revue couvre la gamme de hauteur réglable du bureau (environ 24′′ à 50′′), la vitesse à différents poids, niveaux de bruit, et la capacité de poids, ainsi que la stabilité du bureau quand surélevé ou abaissé des caractéristiques importantes pour les bureaux réglables en hauteur électrique. Il traite également d'aspects pratiques tels que l'expérience de montage, la qualité de construction du cadre et du moteur, et l'électronique, y compris l'évitement des collisions.
- En mars 2025, Steelcase élargit sa présence au hong kong avec un nouveau rendez-vous de concession. La société a nommé MVKM comme son nouveau concessionnaire autorisé dans la R-S de Hong Kong, renforçant son engagement à servir la communauté dynamique d'affaires et de design de la région.
- En août 2025, Haworth a publié l'article « De Jefferson à aujourd'hui : la montée des bureaux ajustables », soulignant l'évolution historique des bureaux traditionnels aux solutions ajustables modernes. Il met l'accent sur les tables réglables en hauteur, ce qui montre comment l'innovation ergonomique permet aux utilisateurs de basculer entre l'assise et l'assise. L'article relie le contexte historique aux bureaux modernes de Haworth, comme le Upside, démontrant leur pertinence dans les espaces de travail flexibles et axés sur la santé d'aujourd'hui. Ces tableaux illustrent l'aboutissement de la conception ergonomique et de la technologie que les cadres d'article sont essentiels dans les environnements de bureau contemporains.
- En novembre 2023, Okamura Corporation a lancé le Swift Nex, une version repensée de son bureau électrique réglable en hauteur Swift, initialement sorti en 2015. Le nouveau modèle offre une fonctionnalité améliorée et un design moderne visant à promouvoir le bien-être et le confort des employés de bureau. Le Swift Nex renforce la position d'Okamura dans le marché ergonomique du mobilier de bureau tout en soutenant des environnements de travail plus sains et plus productifs pour les employés.
- En mars 2025, Kokuyo Co., Ltd. a annoncé qu'elle s'associerait à Lamex pour participer à une importante foire du mobilier et du commerce intérieur, l'exposition internationale de meubles Shenzhen en Chine du 16 au 19 mars 2025. Le stand présentera des idées sur le bureau de l'avenir en utilisant le thème "No Space – A Boundless Workplace with Unlimited Possibilitys". Les visiteurs verront des plans de bureau novateurs, des outils de conception spatiale assistés par l'IA et des discussions avec des entreprises de conception de haut niveau sur la façon de planifier des environnements de bureau flexibles et respectueux de l'environnement.
SKU-
Accédez en ligne au rapport sur le premier cloud mondial de veille économique

- Tableau de bord d'analyse de données interactif
- Tableau de bord d'analyse d'entreprise pour les opportunités à fort potentiel de croissance
- Accès d'analyste de recherche pour la personnalisation et les requêtes
- Analyse de la concurrence avec tableau de bord interactif
- Dernières actualités, mises à jour et analyse des tendances
- Exploitez la puissance de l'analyse comparative pour un suivi complet de la concurrence
Table des matières
1 INTRODUCTION
1.1 OBJECTIFS DE L'ÉTUDE
1.2 DÉFINITION DU MARCHÉ
1.3 APERÇU GÉNÉRAL DU MARCHÉ DES TABLEAUX ELECTRIQUES DURABLES
1.4 MONNAIE ET PRÊT
1.5 LIMITATIONS
1.6 MARCHÉS COUVERTS
2 SEGMENTATION DU MARCHÉ
2.1 MARCHÉS COUVERTS
2.2 CHAMP D'APPLICATION GÉOGRAPHIQUE
2.3 ANS CONSIDÉRÉS POUR L'ÉTUDE
2.4 MODÈLE DE VALIDATION DES DONNÉES DU TRIPOD DBMR
2.5 INTERVIEWS PRIMAIRES AVEC LES PRINCIPAUX LEADERS D'AVIS
2.6 GRID DE POSITION DU MARCHÉ DBMR
2.7 ANALYSE DU PARTAGE DES VENDEURS
2.8 MODÈLE MULTIVARIAT
2.9 COURS DE LIGNE DE VIE TECHNOLOGIE
2.1 COUVERTURE DE LA DEMANDE DE MARCHÉ
2.11 SOURCES SECONDAIRES
2.12 OBSERVATIONS
3 RÉSUMÉ
4 PRIMAIRES
4.1 ANALYSE DES CINQ FORCES
4.1.1 LA PROTECTION DES NOUVEAUX ENTRANTS
4.1.2 POUVOIR DE FABRICATION
4.1.3 POUVOIR D'ACHETEURS
4.1.4 MENACES DES PRODUITS SUSCITUTAIRES
4.1.5 RIVALISATION DE L'INDUSTRIE
4.2 PERSPECTIVES GÉNÉRALES
4.2.1 ANALYSE COMPARATIVE GÉNÉRALE
4.2.1.1 NARRATIVE ANALYTIQUE
4.2.2 APERÇU GÉNÉRAL DU PRODUIT VS
4.2.2.1 APERÇU DU PRODUIT
4.2.2.2 APERÇU GÉNÉRAL
4.3 CHANGEMENT CLIMATIQUE SCÉNARIO
4.3.1 QUESTIONS ENVIRONNEMENTALES
4.3.2 RÉPONSES DE L'INDUSTRIE
4.3.3 RÔLE DU GOUVERNEMENT
4.3.4 RECOMMANDATIONS D'ANALYSE
4.4 COMPORTEMENT DES CONSOMMATEURS
4.4.1 CARACTÉRISTIQUES DU PRODUIT ET VALEUR ERGONOMIQUE
4.4.2 CONSIDÉRATIONS ÉCONOMIQUES
4.4.3 FACTEURS PSYCHOLOGIQUES
4.4.4 TENDANCES SOCIALES ET DE TRAVAIL
4.4.5 INFLUENCE DE MISE SUR LE MARCHE ET D'INFORMATION
4.4.6 TABLEAU DE PRÉFÉRENCE DES CONSOMMATEURS
4.4.7 PRINCIPAUX CLIENTS INFLUENCES DE COMPORTEMENT DES CONSOMMATEURS
4.4.8 CONCLUSION
4.5 AVANTAGES TECHNOLOGIQUES
4.5.1 SYSTÈMES AVANCÉS D'ACTUATEURS MOTORISÉS
4.5.2 PANNEAUX DE CONTRÔLE SMART ET FONCTIONS PROGRAMMABLES
4.5.3 TECHNOLOGIE DE LA SÉCURITÉ ET DE LA TECHNOLOGIE DE L'ANTICOLLISION
4.5.4 CONNECTIVITÉ NUMÉRIQUE ET INTÉGRATION DU LIEU DE TRAVAIL
4.5.5 AMÉLIORATION DE LA CONCEPTION STRUCTURELLE ET DE LA STABILITÉ
4.5.6 EFFICACITÉ ÉNERGÉTIQUE ET MATIÈRES DURABLES
4.5.7 CONCLUSION
4.6 CRITÈRES DE SÉLECTION DES VENDEURS
4.6.1 QUALITÉ DES PRODUITS ET STABILITÉ STRUCTURELLE
4.6.2 CAPACITÉ TECHNOLOGIQUE ET RENDEMENT DES MOTEURS
4.6.3 DESIGN ET EXPÉRIENCE D'UTILISATEUR
4.6.4 CAPACITÉ DE FABRICATION ET FABRICATION
4.6.5 DIVERSITÉ DE LA DOUANISATION ET DU PRODUIT
4.6.6 DURABLE ET CONFORMITÉ DES MATIÈRES
4.6.7 SERVICES DE SOUTIEN ET DE GARANTIE APRÈS LES SALES
4.6.8 EFFICACITÉ DES COÛTS ET PROPOSITION GLOBALE DE VALEUR
4.6.9 RÉPUTATION ET PRÉSENTATION DU MARCHÉ
4.6.10 CONCLUSION
4.7 COUVERTURE DES MATÉRIAUX RAW
4.7.1 ACIER HAUTGRADE
4.7.2 ALLOCUTIONS ALUMINALES
4.7.3 FIBERBOARD MOYEN DE DENSITÉ (MDF)
4.7.4 VENIER SOLIDE DE LA BOIS
4.7.5 LAMINE HAUT-PRESSURE (HPL)
4.7.6 COPPER (pour l'examen électrique)
4.7.7 COMPOSANTES D'ACTEURS ÉLECTRIQUES (MOTEURS ET ASSEMBLIES GÉAR)
4.7.8 POLYMÈRES PLASTIQUES (ABS/PVC LOGEMENTS ET BANDE D'EDGE)
4.7.9 AUDIENCES ET GUIDES LINÉAIRES
4.8 ANALYSE DE LA CHAINE DE VALEUR
4.8.1 SOURCE DES MATÉRIAUX RAW
4.8.2 FABRICATION ET ASSEMBLÉE
4.8.3 DESIGNATION ET ENGINERATION DES PRODUITS
4.8.4 ASSURANCE ET CERTIFICATION DE LA QUALITÉ
4.8.5 DISTRIBUTION ET LOGISTIQUE
4.8.6 CONCLUSION
4.9 ANALYSE DES ÉCOSYSTÈMES DE L'INDUSTRIE
4.9.1 ENTREPRISES PROMINENTES
4.9.2 Petites et moyennes entreprises
4.9.3 UTILISATEURS DE FIN
4.1 CIRCULATION D'INNOVATION ET ANALYSE STRATÉGIQUE
4.10.1 PRINCIPAUX DEALS ET ANALYSE DES ALLIANCES STRATÉGIQUES.
4.10.1.1 VALEURS COMMUNES
4.10.1.2 MARCHANDISES ET ACQUISITIONS
4.10.1.3 LICENCE ET PARTENARIAT
4.10.1.4 COLLABORATION DES TECHNOLOGIES
4.10.1.5 DIVERSEMENTS STRATÉGIQUES
4.10.2 NOMBRE DE PRODUITS EN DÉVELOPPEMENT
4.10.3 ÉCHANGE DE DÉVELOPPEMENT
4.10.4 ÉLÉMENTS ET MILLETS
4.10.5 STRATÉGIES ET MÉTHODES D'INNOVATION
4.10.6 ÉVALUATION ET MITIGATION DES RISQUES
4.10.7 PERSPECTIVES FUTURES
4.11 ANALYSE PRICTE
4.12 ANALYSE DE LA CHAINE D'APPROVISIONNEMENT
4.12.1 APERÇU
4.12.2 SCÉNARIO DES COÛTS LOGISTIQUES
4.12.3 IMPORTANCE DES SERVICES LOGISTIQUES
4.12.4 CONCLUSION
5 TARIF ET IMPACT SUR LE MARCHÉ
5.1 TAUX TARIFAIRES ACTUELS SUR LES MARCHÉS DES TOP-5
5.2 PERSPECTIVES: PRODUCTION LOCALE V/S RELIANCE DES IMPORTATIONS
5.3 CRITÈRES DE SÉLECTION DES VENDEURS DYNAMIQUES
5.4 IMPACT SUR LA CHAINE D'APPROVISIONNEMENT
5.4.1 Achats de matières premières
5.4.2 FABRICATION ET PRODUCTION
5.4.3 LOGISTIQUE ET DISTRIBUTION
5.4.4 ÉQUIPEMENT DES PRIX ET POSITION DU MARCHÉ
5.5 PARTICIPANTS DE L'INDUSTRIE: MOUVEMENTS PROACTIFS
5.5.1 OPTIMISATION DE LA CHAINE D ' APPUI
5.5.2 ÉTABLISSEMENTS COMMUNS DE VENTURE
5.6 IMPACT SUR LES PRIX
6 COUVERTURE DU RÈGLEMENT
6.1 CODES DES PRODUITS
6.2 NORMES CERTIFIÉES
6.3 NORMES DE SÉCURITÉ
6.3.1 MATÉRIEL ET STOCKAGE
6.3.2 TRANSPORT ET PRÉCAUTIONS
6.3.3 IDENTIFICATION DE LA HAZRADE
7 APERÇU DU MARCHÉ
7.1 Conducteurs
7.1.1 ADOPTION DE LA CROISSANCE DES NORMES DE TRAVAIL ERGONOMIQUES
7.1.2 ACCROISSEMENT DE L'EMPLOYEUR SUR L'OUVERTURE DE L'EMPLOYÉ ET DE LA PRODUCTION
7.1.3 PRÉFÉRENCE DES CONSOMMATEURS D'RISQUES POUR LES SOLUTIONS DOUANIÈRES
7.1.4 DEMANDE DE CIRCULATION POUR LES SOLUTIONS DURABLES ET ECOFRINDEMENT MOBILIÈRES
7.2 RÉSULTATS
7.2.1 COÛT DU PRODUIT SUPÉRIEUR COMPARÉ AUX DESQUETS DE BUREAU FIXÉS CLASSIQUES
7.2.2 FLUCTUATIONS DANS LES PRIX DES MATÉRIAUX REÇUS EN ACIER ET EN COMPOSANT ÉLECTRONIQUE
7.3 OPPORTUNITÉS
7.3.1 AVANCEMENTS TECHNOLOGIQUES DANS LES MÉCANISMES DE LIFT ÉLECTRIQUES ET L'INTÉGRATION DE PETITE DESQUETE
7.3.2 L'INNOVATION DANS LES TABLEAUX DE DESSINS AJUSTABLES DE COMPACT ET D'ESPACE
7.3.3 RENFORCEMENT DE L'ADOPTION DANS LES TRAVAUX D'AMÉNAGEMENT ET DE CRÉATEUR
7.4 DÉFIS
7.4.1 COMPLEXITÉ LOGISTIQUE ET D'INSTALLATION POUR LES DÉPLOYEMENTS DE LARGE-SCALE
7.4.2 DISRUPTIONS DE CHAINE AFFECTANT DES COMPOSANTES ÉLECTRONIQUES
8 MARCHÉ DES TABLEAUX ÉLECTRIQUES AJUSTABLES, PAR TYPE DE PRODUITS, 2018-2033
8.1 Aperçu général
8.2 MOTEUR UNIQUE
8.3 MOTEUR DUAL
8.4 MULTI-MOTEUR
8.5 AUTRES
8.5.1 MARCHÉ DES TABLEAUX ÉLECTRIQUES AJUSTABLES À L'ÉTRANGER GRATUITEMENT, PAR FORMULAIRE DE PRODUIT, 2018-2032
8.5.1.1 MOTEUR UNIQUE
8.5.1.2 MOTEUR DUAL
8.5.1.3 MULTI-MOTEUR
8.5.1.4 AUTRES
8.5.2 MOTEUR UNIQUE GLOBAL DANS LE MARCHÉ DES TABLEAUX ÉLECTRIQUES STANDARD GRATUIT, PAR TYPE DE CADRE, 2018-2032
8.5.2.1 CADRE D ' UN GROUPE
8.5.2.2 CADRE DE DEUX LÉGISLATIONS
8.5.2.3 CADRE DE TROISIÈME LÉGISLATION
8.5.3 MOTEUR UNIQUE GLOBAL DANS LE MARCHÉ DES TABLEAUX AJUSTABLES ÉLECTRIQUES STANDARD LIBRE, PAR AJUSTEMENT SPEED, 2018-2032 (en MILLEUR USD)
8.5.3.1 MOINS DE 25 MM/ S
8.5.3.2 25–40 MM/ S
8.5.3 ABOVE 40 MM/ S
8.5.4 MOTEUR UNIQUE GLOBAL DANS LE MARCHÉ DES TABLEAUX ELECTRIQUES STANDING LIBRE, PAR INTERFACE DE CONTRÔLE, 2018-2032 (en MILLE USD)
8.5.4.1 SUITE SIMPLE
8.5.4.2 PANIER DE CONTRÔLE DE LA MÉMOIRE
8.5.4.3 CONTRÔLE RAPIDE
8.5.5 MOTEUR UNIQUE GLOBAL DANS LE MARCHÉ DES TABLEAUX ELECTRIQUES STANDARD GRATUIT, PAR RÉGION, 2018-2033
8.5.5.1 AMÉRIQUE DU NORD
8.5.5.2 EUROPE
8.5.5.3 ASIE-PACIFIQUE
8.5.4 AMÉRIQUE DU SUD
8.5.5.5 MOYEN-ORIENT ET AFRIQUE
8.5.6 MOTEUR UNIQUE GLOBAL DANS LE MARCHÉ DES TABLEAUX ELECTRIQUES STANDARD GRATUIT, PAR RÉGION, 2018-2033
8.5.6.1 AMÉRIQUE DU NORD
8.5.6.2 EUROPE
8.5.6.3 ASIE-PACIFIQUE
8.5.6.4 AMÉRIQUE DU SUD
8.5.6.5 MOYEN-ORIENT ET AFRIQUE
8.5.7 MOTEUR DUAL GLOBAL DANS LE MARCHÉ DES TABLEAUX AJUSTABLES ÉLECTRIQUES STANDARD LIBRE, PAR TYPE DE CADRE, 2018-2032 (en MILLE USD)
8.5.7.1 CADRE DEUXIÈME
8.5.7.2 CADRE DE TROISIÈME GROUPE
8.5.8 MOTEUR DUAL GLOBAL DANS LE MARCHÉ DES TABLEAUX AJUSTABLES ÉLECTRIQUES STANDARD LIBRE, PAR AJUSTEMENT SPEED, 2018-2032 (en MILLEUR DE DOLLARS)
8.5.8.1 30–50 MM/ S
8.5.8.2 ABOVE 50 MM/ S
8.5.3 MOINS DE 30 MM/ S
8.5.9 MOTEUR DUAL GLOBAL DANS LE MARCHÉ DES TABLEAUX AJUSTABLES ÉLECTRIQUES STANDARD LIBRE, PAR INTERFACE DE CONTRÔLE, 2018-2032 (en MILLEUR)
8.5.9.1 PANIER DE CONTRÔLE DE LA MÉMOIRE
8.5.9.2 CONTRÔLE DE LA TOUCHSCRÉENNE
8.5.9.3 CONTRÔLE INTÉGRÉ
8.5.10 MOTEURS DUAUX GLOBAUX DANS LE MARCHÉ DES TABLEAUX ELECTRIQUES STANDING LIBRE, PAR RÉGION, 2018-2033 (en MILLIERS USD)
8.5.10.1 AMÉRIQUE DU NORD
8.5.10.2 EUROPE
8.5.10.3 ASIE-PACIFIQUE
8.5.10.4 AMÉRIQUE DU SUD
8.5.10.5 MOYEN-ORIENT ET AFRIQUE
8.5.11 MOTEUR DUAL GLOBAL DANS LE MARCHÉ DES TABLEAUX AJUSTABLES ÉLECTRIQUES STANDARD LIBRE, PAR RÉGION, 2018-2033 (milliers d'unités)
8.5.11.1 AMÉRIQUE DU NORD
8.5.11.2 EUROPE
8.5.11.3 ASIE-PACIFIQUE
8.5.11.4 AMÉRIQUE DU SUD
8.5.11.5 MOYEN-ORIENT ET AFRIQUE
8.5.12 MULTI-MOTEUR GLOBAL DANS LE MARCHÉ DES TABLEAUX ÉLECTRIQUES STANDARD GRATUIT, PAR TYPE DE CADRE, 2018-2032 (en milliers de dollars)
8.5.12.1 CADRE DE TROISIÈME GROUPE
8.5.12.2 CADRE DE DEUX GROUPES
8.5.13 MULTI-MOTEUR GLOBAL DANS LE MARCHÉ DES TABLEAUX AJUSTABLES ÉLECTRIQUES PERMANENTES LIBREMENT, PAR AJUSTEMENT PRÉVUE, 2018-2032 (en MILLEUR)
8.5.13.1 ABOVE 50 MM/ S
85.13.2 30-50 MM/ S
8,5.13.3 MOINS DE 30 MM/ S
8.5.14 MULTI-MOTEUR GLOBAL DANS LE MARCHÉ DES TABLEAUX ELECTRIQUES STANDING LIBRE, PAR INTERFACE DE CONTRÔLE, 2018-2032
8.5.14.1 CONTRÔLE DE LA TOUCHSCRÈNE
8.5.14.2 CONTRÔLE INTÉGRÉ DU APP
8.5.14.3 PANIER DE CONTRÔLE DE MÉMOIRE
8.5.15 MULTI-MOTEUR GLOBAL DANS LE MARCHÉ DES TABLEAUX AJUSTABLES ÉLECTRIQUES STANDARD GRATUIT, PAR RÉGION, 2018-2033 (en millions de dollars)
8.5.15.1 AMÉRIQUE DU NORD
8.5.15.2 L'EUROPE
8.5.15.3 ASIE-PACIFIQUE
8.5.154 AMÉRIQUE DU SUD
85.15.5 MOYEN-ORIENT & AFRIQUE
8.5.16 MULTI-MOTEUR GLOBAL DANS LE MARCHÉ DES TABLEAUX ELECTRIQUES STANDARD GRATUIT, PAR RÉGION, 2018-2033
8.5.16.1 AMÉRIQUE DU NORD
8.5.16.2 EUROPE
8.5.16.3 ASIE-PACIFIQUE
85.16.4 AMÉRIQUE DU SUD
8.5.16.5 MOYEN-ORIENT & AFRIQUE
8.5.17 AUTRES GLOBAUX DANS LE MARCHÉ DES TABLEAUX ELECTRIQUES STANDING LIBRE, PAR RÉGION, 2018-2033 (en MILLIERS DE USD)
8.5.17.1 AMÉRIQUE DU NORD
8.5.17.2 L'EUROPE
8.5.17.3 ASIE-PACIFIQUE
8.5.1.7.4 AMÉRIQUE DU SUD
8.5.17.5 MOYEN-ORIENT ET AFRIQUE
8.5.18 AUTRES GLOBAUX DANS LE MARCHÉ DES TABLEAUX ELECTRIQUES STANDING LIBRE, PAR RÉGION, 2018-2033
8.5.18.1 AMÉRIQUE DU NORD
8.5.18.2 L'EUROPE
8.5.18.3 ASIE-PACIFIQUE
85.18.4 AMÉRIQUE DU SUD
8.5.18.5 MOYEN-ORIENT & AFRIQUE
9 MARCHÉ DES TABLEAUX ÉLECTRIQUES AJUSTABLES, PAR MATÉRIEL, 2018-2033
9.1 Aperçu général
9.2 MÉTAUX
9,3 BOIS
9.4 PLASTIQUE/COMPOSITE
9.5 GLASSE
9.6 AUTRES
9.6.1 MÉTAUX GLOBAUX DANS LE MARCHÉ DES TABLEAUX ÉLECTRIQUES STANDING LIBRE, PAR TYPE, 2018-2032 (en milliers de dollars)
9.6.1.1 ACIER
9.6.1.2 ALUMINUM
9.6.2 ACIER GLOBAL DANS LE MARCHÉ DES TABLEAUX AJUSTABLES À L'HAUTE LIBRE STANDARD, PAR TYPE, 2018-2032 (en MILLIERS USD)
9.6.2.1 ACIER COATÉ
9.6.2.2 ACIER DE TENEUR
9.6.3 MÉTAUX GLOBAUX DANS LE MARCHÉ DES TABLEAUX AJUSTABLES ÉLECTRIQUES STANDARD LIBRE, PAR RÉGION, 2018-2033 (en MILLOIS USD)
9.6.3.1 AMÉRIQUE DU NORD
9.6.3.2 L'EUROPE
9.6.3.3 ASIE-PACIFIQUE
9.6.3.4 AMÉRIQUE DU SUD
9.6.3.5 MOYEN-ORIENT & AFRIQUE
9.6.4 BOIS MONDIALE DANS LE MARCHÉ DES TABLEAUX AJUSTABLES À L'HAUTE LIBRE STANDARD, PAR TYPE, 2018-2032
9.6.4.1 BOIS ENGINÉES
9.6.4.2 BOIS SOLIDES
9.6.5 BOIS GLOBALE ENGINÉE DANS LE MARCHÉ DES TABLEAUX AJUSTABLES DE L'HAUTE LIBRE STANDING, PAR TYPE, 2018-2032
9.6.5.1 MDF
9.6.5.2 PLYWOOD
9.6.5.3 CONSEIL PARTICULIER
9.6.6 BOIS SOLIDE GLOBALE DANS LE MARCHÉ DES TABLEAUX AJUSTABLES DE L'HAUTEUR LIBRE STANDARD, PAR TYPE, 2018-2032 (MILLIERS DE USD)
9.6.6.1 OAK
9.6.6.2 WALNUT
9.6.6.3 MAPLE
9.6.7 BOIS GLOBALE SUR LE MARCHÉ DES TABLEAUX ELECTRIQUES STANDING LIBRE, PAR RÉGION, 2018-2033 (en MILLIERS USD)
9.6.7.1 AMÉRIQUE DU NORD
9.6.7.2 L'EUROPE
9.6.7.3 ASIE-PACIFIQUE
9.6.7.4 AMÉRIQUE DU SUD
9.6.7.5 MOYEN-ORIENT & AFRIQUE
9.6.8 PLASTIQUE GLOBALE/COMPOSITE DANS LE MARCHÉ DES TABLEAUX AJUSTABLES DE L'HAUTEUR LIBRE STANDING, PAR TYPE, 2018-2032
9.6.8.1 ABS
9.6.8.2 POLYMÈRES RENFORCÉS
9.6.8.3 PVC
9.6.9 PLASTIQUE/COMPOSITE MONDIALE DANS LE MARCHÉ DES TABLEAUX AJUSTABLES À L'HAUTE ÉLECTRIQUE LIBRE, PAR RÉGION, 2018-2033 (en millions de dollars)
9.6.9.1 AMÉRIQUE DU NORD
9.6.9.2 EUROPE
9.6.9.3 ASIE-PACIFIQUE
9.6.9.4 AMÉRIQUE DU SUD
9.6.9.5 MOYEN-ORIENT & AFRIQUE
9.6.10 GLASS GLOBAL SUR LE MARCHÉ DES TABLEAUX ELECTRIQUES STANDING LIBRE, PAR RÉGION, 2018-2033 (en milliers de dollars)
9.6.10.1 AMÉRIQUE DU NORD
9.6.10.2 EUROPE
9.6.10.3 ASIE-PACIFIQUE
9.6.10.4 AMÉRIQUE DU SUD
9.6.10.5 MOYEN-ORIENT ET AFRIQUE
9.6.11 AUTRES GLOBAUX) DANS LE MARCHÉ DES TABLEAUX ELECTRIQUES STANDING LIBRE, PAR RÉGION, 2018-2033 (en MILLIERS DE USD)
9.6.11.1 AMÉRIQUE DU NORD
9.6.11.2 L'EUROPE
9.6.11.3 ASIE-PACIFIQUE
9.6.11.4 AMÉRIQUE DU SUD
9.6.11.5 MOYEN-ORIENT ET AFRIQUE
10 MARCHÉ DES TABLEAUX ELECTRIQUES AJUSTABLES, PAR DEMANDE, 2018-2033
10.1 Aperçu général
10.2 BUREAUX CORPORÉS
10.3 RÉSIDENTIEL
10.4 ÉDUCATION
10.5 SANTÉ
10.6 AUTRES
10.6.1 BUREAUX DU CORPORAT MONDIAL DANS LE MARCHÉ DES TABLEAUX AJUSTABLES ÉLECTRIQUES PERMANENT LIBRE, PAR TYPE, 2018-2032 (en milliers de dollars)
10.6.1.1 PLAN D'OUVERTURE
10.6.1.2 CABINS DE GESTION
10.6.1.3 ESPACE DE COLLABORATION
10.6.2 BUREAUX DU CORPORAT MONDIAL DANS LE MARCHÉ DES TABLEAUX AJUSTABLES DE L'HAUTE ÉLECTRIQUE LIBRE, PAR RÉGION, 2018-2033 (en millions de dollars)
10.6.2.1 AMÉRIQUE DU NORD
10.6.2.2 L'EUROPE
10.6.2.3 ASIE-PACIFIQUE
10.6.2.4 AMÉRIQUE DU SUD
10.6.2.5 MOYEN-ORIENT & AFRIQUE
10.6.3 RÉSIDENTIEL GLOBAL DANS LE MARCHÉ DES TABLEAUX AJUSTABLES À L'HAUTE LIBRE STANDING, PAR TYPE, 2018-2032 (en MILLIERS USD)
10.6.3.1 OFFICES DOMESTIQUES
10.6.3.2 CHAMBRES D'ÉTUDE
10.6.3.3 ESPACE DE VIE
10.6.4 RESIDENTIEL GLOBAL DANS LE MARCHÉ DES TABLEAUX ELECTRIQUES STANDING LIBRE, PAR RÉGION, 2018-2033 (MILLIERS DE USD)
10.6.4.1 AMÉRIQUE DU NORD
10.6.4.2 L'EUROPE
10.6.4.3 ASIE-PACIFIQUE
10.6.4.4 AMÉRIQUE DU SUD
10.6.4.5 MOYEN-ORIENT & AFRIQUE
10.6.5 ÉDUCATION GLOBALE DANS LE MARCHÉ DES TABLEAUX ELECTRIQUES STANDING LIBRE, PAR TYPE, 2018-2032 (en milliers de dollars)
10.6.5.1 UNIVERSITÉS
10.6.5.2 ÉCOLES
10.6.5.3 CENTRES DE FORMATION
10.6.6 ÉDUCATION GLOBALE DANS LE MARCHÉ DES TABLEAUX ELECTRIQUES STANDING LIBRE, PAR RÉGION, 2018-2033 (en milliers de dollars)
10.6.6.1 AMÉRIQUE DU NORD
10.6.6.2 EUROPE
10.6.6.3 ASIE-PACIFIQUE
10.6.6.4 AMÉRIQUE DU SUD
10.6.6.5 MOYEN-ORIENT & AFRIQUE
10.6.7 SANTÉ MONDIALE DANS LE MARCHÉ DES TABLEAUX AJUSTABLES À L'HAUTE ÉLECTRIQUE PERMANENTE, PAR TYPE, 2018-2032 (en milliers de dollars)
10.6.7.1 HÔPITALS
10.6.7.2 CLINIQUES PHYSIOTHERAPIE
10.6.7.3 CENTRES DE RÉHABILITATION
10.6.8 SANTE MONDIALE DANS LE MARCHÉ DES TABLEAUX AJUSTABLES ÉLECTRIQUES PERMANENTES, PAR RÉGION, 2018-2033
10.6.8.1 AMÉRIQUE DU NORD
10.6.8.2 EUROPE
10.6.8.3 ASIE-PACIFIQUE
10.6.8.4 AMÉRIQUE DU SUD
10.6.8.5 MOYEN-ORIENT & AFRIQUE
10.6.9 AUTRES GLOBAUX DANS LE MARCHÉ DES TABLEAUX ÉLECTRIQUES STANDARD LIBRE, PAR RÉGION, 2018-2033 (en milliers de dollars)
10.6.9.1 AMÉRIQUE DU NORD
10.6.9.2 L'EUROPE
10.6.9.3 ASIE-PACIFIQUE
10.6.9.4 AMÉRIQUE DU SUD
10.6.9.5 MOYEN-ORIENT & AFRIQUE
11 MARCHÉ MONDIAL DES TABLEAUX AJUSTABLES DE HAUTE ÉLECTRIQUE, PAR UTILISATEUR FINAL, 2018-2033 (en milliers de dollars É.-U.)
11.1 Aperçu général
11.2 GRANDES ENTREPRISES
11.3 PETITES ET MOYENNES ENTREPRISES
11.4 CONSOMMATEURS INDIVIDUELS
11.5 INSTITUTIONS GOUVERNEMENTALES ET PUBLIQUES
11.6 AUTRES
11.6.1 ENTREPRISE GLOBALE D'ENTREPRISES DANS LE MARCHÉ DES TABLEAUX ELECTRIQUES PERMANENT LIBREMENT, PAR RÉGION, 2018-2033 (en millions de dollars)
11.6.1.1 AMÉRIQUE DU NORD
11.6.1.2 L'EUROPE
11.6.1.3 ASIE-PACIFIQUE
11.6.1.4 AMÉRIQUE DU SUD
11.6.1.5 MOYEN-ORIENT & AFRIQUE
11.6.2 PETITES ET MOYENNES ENTREPRISES GLOBALES DANS LE MARCHÉ DES TABLEAUX ELECTRIQUES STANDING LIBRE ET AJUSTABLES, PAR RÉGION, 2018-2033
11.6.2.1 AMÉRIQUE DU NORD
11.6.2.2 L'EUROPE
11.6.2.3 ASIE-PACIFIQUE
11.6.2.4 AMÉRIQUE DU SUD
11.6.2.5 MOYEN-ORIENT & AFRIQUE
11.6.3 CONSOMMATEURS INDIVIDUELS GLOBAUX DANS LE MARCHÉ DES TABLEAUX AJUSTABLES ÉLECTRIQUES PERMANENT LIBREMENT, PAR RÉGION, 2018-2033 (MILLIERS DE USD)
11.6.3.1 AMÉRIQUE DU NORD
11.6.3.2 L'EUROPE
11.6.3.3 ASIE-PACIFIQUE
11.6.3.4 AMÉRIQUE DU SUD
11.6.3.5 MOYEN-ORIENT & AFRIQUE
11.6.4 LE GOUVERNEMENT MONDIAL ET LES INSTITUTIONS PUBLIQUES DANS LE MARCHÉ DES TABLEAUX AJUSTABLES À L'HAUTE ÉLECTRIQUE, PAR RÉGION, 2018-2033 (en millions de dollars É.-U.)
11.6.4.1 AMÉRIQUE DU NORD
11.6.4.2 L'EUROPE
11.6.4.3 ASIE-PACIFIQUE
11.6.4.4 AMÉRIQUE DU SUD
11.6.4.5 MOYEN-ORIENT & AFRIQUE
11.6.5 AUTRES GLOBAUX DANS LE MARCHÉ DES TABLEAUX ÉLECTRIQUES STANDARD GRATUIT, PAR RÉGION, 2018-2033
11.6.5.1 AMÉRIQUE DU NORD
11.6.5.2 EUROPE
11.6.5.3 ASIE-PACIFIQUE
11.6.5.4 AMÉRIQUE DU SUD
11.6.5.5 MOYEN-ORIENT ET AFRIQUE
12 MARCHÉ DES TABLEAUX ÉLECTRIQUES AJUSTABLES À L'ÉTRANGER GRATUITEMENT, PAR CHANEAU DE DISTRIBUTION, 2018-2033
12.1 Aperçu général
12.2 VENTES INDIRECTES
12.3 VENTES DIRECTS
12.4 VENTES DE CONTRATS
12.5 AUTRES
12.5.1 MARCHÉ DES TABLEAUX ÉLECTRIQUES AJUSTABLES À L'ÉTRANGER GRATUITEMENT, PAR CHANEAU DE DISTRIBUTION, 2018-2033
12.5.1.1 VENTES INDIRECTES
12.5.1.2 VENTES DIRECTES
12.5.1.3 VENTES DE CONTRATS
12.5.1.4 AUTRES
12.5.2 VENTES INDIRECTES GLOBALES DANS LE MARCHÉ DES TABLEAUX ELECTRIQUES STANDARDS GRATUITS, PAR TYPE, 2018-2032 (en milliers de dollars)
12.5.2.1 SECTEURS DE DÉTAILS
12.5.2.2 E-COMMERCE
12.5.3 STOCKS GLOBAUX DE DÉTAILLAGE DANS LE MARCHÉ DES TABLEAUX ELECTRIQUES STANDARD GRATUIT, PAR TYPE, 2018-2032
12.5.3.1 SECTEURS D'AVENIR
12.5.3.2 STOCKAGE DES BUREAUX
12.5.4 COMMERCE ÉLECTRIQUE MONDIAL DANS LE MARCHÉ DES TABLEAUX AJUSTABLES DE L'HAUTEUR LIBRE STANDING, PAR TYPE, 2018-2032
12.5.4.1 PLATES-FORMES EN LIGNE
12.5.4.2 GRANDS SITES WEB
12.5.5 VENTES INDIRECTES MONDIALES SUR LE MARCHÉ DES TABLEAUX ELECTRIQUES STANDARDS LIBREMENT AJUSTABLES, PAR RÉGION, 2018-2033 (en MILLEUR)
12.5.5.1 AMÉRIQUE DU NORD
12.5.5.2 EUROPE
12.5.5.3 ASIE-PACIFIQUE
12.5.5.4 AMÉRIQUE DU SUD
12.5.5.5 MOYEN-ORIENT ET AFRIQUE
12.5.6 VENTES INDIRECTES MONDIALES SUR LE MARCHÉ DES TABLEAUX ELECTRIQUES STANDARDS LIBREMENT AJUSTABLES, PAR RÉGION, 2018-2033 (EN MILLIERS)
12.5.6.1 AMÉRIQUE DU NORD
12.5.6.2 EUROPE
12.5.6.3 ASIE-PACIFIQUE
12.5.6.4 AMÉRIQUE DU SUD
12.5.6.5 MOYEN-ORIENT ET AFRIQUE
12.5.7 VENTES GLOBALES DIRECTES SUR LE MARCHÉ DES TABLEAUX ELECTRIQUES STANDARDS LIBREMENT AJUSTABLES, PAR RÉGION, 2018-2033 (en MILLIERS USD)
12.5.7.1 AMÉRIQUE DU NORD
12.5.7.2 EUROPE
12.5.7.3 ASIE-PACIFIQUE
12.5.7.4 AMÉRIQUE DU SUD
12.5.7.5 MOYEN-ORIENT & AFRIQUE
12.5.8 VENTES GLOBALES DIRECTES SUR LE MARCHÉ DES TABLEAUX ELECTRIQUES STANDARDS LIBREMENT AJUSTABLES, PAR RÉGION, 2018-2033 (EN MILLIERS)
12.5.8.1 AMÉRIQUE DU NORD
12.5.8.2 EUROPE
12.5.8.3 ASIE-PACIFIQUE
12.5.8.4 AMÉRIQUE DU SUD
12.5.8.5 MOYEN-ORIENT ET AFRIQUE
12.5.9 VENTES DE CONTRATS GLOBAUX SUR LE MARCHÉ DES TABLEAUX ELECTRIQUES STANDING LIBRE, PAR RÉGION, 2018-2033 (MILLIERS DE USD)
12.5.9.1 AMÉRIQUE DU NORD
12.5.9.2 EUROPE
12.5.9.3 ASIE-PACIFIQUE
12.5.9.4 AMÉRIQUE DU SUD
12.5.9.5 MOYEN-ORIENT & AFRIQUE
12.5.10 VENTES DE CONTRATS MONDIALES SUR LE MARCHÉ DES TABLEAUX ÉLECTRIQUES STANDARDS LIBREMENT AJUSTABLES, PAR RÉGION, 2018-2033
12.5.10.1 AMÉRIQUE DU NORD
12.5.10.2 L'EUROPE
12.5.10.3 ASIE-PACIFIQUE
12.5.10.4 AMÉRIQUE DU SUD
12.5.10.5 MOYEN-ORIENT ET AFRIQUE
12.5.11 AUTRES GLOBAUX DANS LE MARCHÉ DES TABLEAUX ÉLECTRIQUES STANDING LIBRE, PAR RÉGION, 2018-2033 (en milliers de dollars)
12.5.11.1 AMÉRIQUE DU NORD
12.5.11.2 L'EUROPE
12.5.11.3 ASIE-PACIFIQUE
12.5.11.4 AMÉRIQUE DU SUD
12.5.11.5 MOYEN-ORIENT & AFRIQUE
12.5.12 AUTRES GLOBAUX DANS LE MARCHÉ DES TABLEAUX ELECTRIQUES STANDING LIBRE, PAR RÉGION, 2018-2033 (EN MILLIERS)
12.5.12.1 AMÉRIQUE DU NORD
12.5.12.2 EUROPE
12.5.12.3 ASIE-PACIFIQUE
12.5.12.4 AMÉRIQUE DU SUD
12.5.12.5 MOYEN-ORIENT ET AFRIQUE
13 MARCHÉ MONDIAL DES TABLEAUX AJUSTABLES À L'HAUTE ÉLECTRIQUE, PAR RÉGION
13.1 Aperçu général
13.2 AMÉRIQUE DU NORD
13.2.1 États-Unis
13.2.2 CANADA
13.2.3 MEXIQUE
13.3 EUROPE
13.3.1 ALLEMAGNE
13.3.2 Royaume-Uni
13.3.3 FRANCE
13.3.4 ITALIE
13.3.5 SCANDINAVIE
13.3.6 BÉNELUX
13.3.7 ESPAGNE
13.3.8 CEI
13.3.9 RESTE D'EUROPE
13.4 ASIE-PACIFIQUE
13.4.1 CHINE
13.4.2 INDE
13.4.3 JAPON
13.4.4 CORÉE DU SUD
13.4.5 AUSTRALIE
13.4.6 THAILANDE
13.4.7 MALAISIE
13.4.8 INDONÉSIE
13.4.9 SINGAPORE
13.4.10 EST D'ASIE-PACIFIQUE
13.5 AMÉRIQUE DU SUD
13.5.1 BRÉSIL
13.5.2 ARGENTINE
13.5.3 COLOMBIE
13.5.4 CHILI
13.5.5 EST D'AMÉRIQUE DU SUD
13.6 MOYEN-ORIENT ET AFRIQUE
13.6.1 ARABIE SAUDIE
13.6.2 EMIRATS ARABES UNIS
13.6.3 AFRIQUE DU SUD
13.6.4 ISRAEL
13.6.5 EST DU MOYEN-ORIENT ET AFRIQUE
14 MARCHÉ MONDIAL DES TABLEAUX AJUSTABLES DE L'HAUTE ÉLECTRIQUE, PAYSAGE DE L'ENTREPRISE
14.1 ANALYSE DU PARTAGE DES ENTREPRISES:
14.2 ANALYSE DU PARTAGE DES ENTREPRISES: ASIE-PACIFIQUE
14.3 ANALYSE DU PARTAGE DES ENTREPRISES: AMÉRIQUE DU NORD
14.4 ANALYSE DU PARTAGE DES ENTREPRISES: EUROPE
15 ANALYSE SWOT
16 PROFIL D'ENTREPRISE
16.1 SYSTÈMES INTERIKEA B.V.
16.1.1 COMPAGNIE
16.1.2 ANALYSE DU PARTAGE DES ENTREPRISES
16.1.3 PORTEFEUILLE DE PRODUITS
16.1.4 DÉVELOPPEMENT RÉCENT
16.2 ACIER INC.
16.2.1 COMPAGNIE SNAPSHOT
16.2.2 ANALYSE DES RECETTES
16.2.3 ANALYSE DU PARTAGE DES ENTREPRISES
16.2.4 PORTEFEUILLE DE PRODUITS
16.2.5 DÉVELOPPEMENT RÉCENT
16.3 HAWORTH, INC.
16.3.1 COMPAGNIE SNAPSHOT
16.3.2 ANALYSE DU PARTAGE DES ENTREPRISES
16.3.3 PORTEFEUILLE DE PRODUITS
16.3.4 DÉVELOPPEMENT RÉCENT
16.4 CORPORATION D'OKAMURA
16.4.1 COMPAGNIE SNAPSHOT
16.4.2 ANALYSE DES RECETTES
16.4.3 ANALYSE DU PARTAGE DES ENTREPRISES
16.4.4 PORTEFEUILLE DE PRODUITS
16.4.5 DÉVELOPPEMENT RÉCENT
16.5 KOKUYO CO., LTD
16.5.1 COMPAGNIE SNAPSHOT
16.5.2 ANALYSE DES RECETTES
16.5.3 ANALYSE DU PARTAGE DES ENTREPRISES
16.5.4 PORTEFEUILLE DE PRODUITS
16.5.5 DÉVELOPPEMENT RÉCENT
16.6 APEXDESK
16.6.1 COMPAGNIE SNAPSHOT
16.6.2 PORTEFEUILLE DE PRODUITS
16.6.3 4.4 DÉVELOPPEMENT RÉCENT
16.7 AUTONOMES
16.7.1 COMPAGNIE SNAPSHOT
16.7.2 PORTEFEUILLE DE PRODUITS
16.7.3 DÉVELOPPEMENT RÉCENT
16.8 CEKA
16.8.1 COMPAGNIE SNAPSHOT
16.8.2 PORTEFEUILLE DE PRODUITS
16.8.3 DÉVELOPPEMENT RÉCENT
16.9 ERGOSPHERE
16.9.1 COMPAGNIE SNAPSHOT
16.9.2 PORTEFEUILLE DE PRODUITS
16.9.3 DÉVELOPPEMENT RÉCENT
16.1 ERGOTRON
16.10.1 COMPAGNIE SNAPSHOT
16.10.2 PORTEFEUILLE DE PRODUITS
16.10.3 DÉVELOPPEMENT RÉCENT
16.11 EVODESK.COM
16.11.1 COMPAGNIE SNAPSHOT
16.11.2 PORTEFEUILLE DE PRODUITS
16.11.3 DÉVELOPPEMENT RÉCENT
16.12 FLEURS, INC.
16.12.1 COMPAGNIE SNAPSHOT
16.12.2 PORTEFEUILLE DE PRODUITS
16.12.3 DÉVELOPPEMENT RÉCENT
16.13 HERMAN MILLER, INC.
16.13.1 COMPAGNIE SNAPSHOT
16.13.2 ANALYSE DES RECETTES
16.13.3 PORTEFEUILLE DE PRODUITS
16.13.4 DÉVELOPPEMENT RÉCENT
16.14 HON (PARTIE DE SOCIÉTÉ HNI)
16.14.1 COMPAGNIE SNAPSHOT
16.14.2 ANALYSE DES RECETTES
16.14.3 PORTEFEUILLE DE PRODUITS
16.14.4 DÉVELOPPEMENT RÉCENT
16.15 SALLE HUMAINE
16.15.1 COMPAGNIE SNAPSHOT
16.15.2 PORTEFEUILLE DE PRODUITS
16.15.3 DÉVELOPPEMENT RÉCENT
16.16 KINNARPS AB
16.16.1 COMPAGNIE SNAPSHOT
16.16.2 PORTEFEUILLE DE PRODUITS
16.16.3 DÉVELOPPEMENT RÉCENT
16.17 LOCTEK ERGONOMIC TECHNOLOGY CORP.
16.17.1 COMPAGNIE SNAPSHOT
16.17.2 PORTEFEUILLE DE PRODUITS
16.17.3 DÉVELOPPEMENT RÉCENT
16.18 MARTELA
16.18.1 COMPAGNIE SNAPSHOT
16.18.2 ANALYSE DES RECETTES
16.18.3 PORTEFEUILLE DE PRODUITS
16.18.4 DÉVELOPPEMENT RÉCENT/NOUVELLES
16.19 CORPORATION D'OKAMURA
16.19.1 COMPAGNIE SNAPSHOT
16.19.2 ANALYSE DES RECETTES
16.19.3 PORTEFEUILLE DE PRODUITS
16.19.4 DÉVELOPPEMENT RÉCENT
16.2 SCHIAVELLO
16.20.1 COMPAGNIE SNAPSHOT
16.20.2 PORTEFEUILLE DE PRODUITS
16.20.3 DÉVELOPPEMENT RÉCENT
16.21 SEDUS STILL AG.
16.21.1 COMPAGNIE SNAPSHOT
16.21.2 PORTEFEUILLE DE PRODUITS
16.21.3 DÉVELOPPEMENT RÉCENT
16.22 TEKNION
16.22.1 COMPAGNIE SNAPSHOT
16.22.2 PORTEFEUILLE DE PRODUITS
16.22.3 DÉVELOPPEMENT RÉCENT
16.23 DOSSIER SUPPLÉMENTAIRE
16.23.1 COMPAGNIE SNAPSHOT
16.23.2 PORTEFEUILLE DE PRODUITS
16.23.3 DÉVELOPPEMENT RÉCENT
16.24 VARI (FORMEMENT VARIDESK, LLC)
16.24.1 COMPAGNIE SNAPSHOT
16.24.2 PORTEFEUILLE DE PRODUITS
16.24.3 DÉVELOPPEMENT RÉCENT
16.25 XDESK.COM
16.25.1 COMPAGNIE SNAPSHOT
16.25.2 PORTEFEUILLE DE PRODUITS
16.25.3 DÉVELOPPEMENT RÉCENT
16.26 VITRA INTERNATIONAL AG
16.26.1 COMPAGNIE SNAPSHOT
16.26.2 PORTEFEUILLE DE PRODUITS
16.26.3 DÉVELOPPEMENT RÉCENT
17 QUESTIONNAIRE
18 RAPPORTS CONNEXES
Liste des tableaux
TABLEAU 1 MARCHÉ DES TABLEAUX ÉLECTRIQUES AJUSTABLES À L'ÉTRANGER GRATUITEMENT, PAR FORMULAIRE DE PRODUIT, 2018-2032 (en MILLE USD)
TABLEAU 2 MARCHÉ DES TABLEAUX ÉLECTRIQUES AJUSTABLES, PAR FORMULAIRE DE PRODUIT, 2018-2032
TABLEAU 3 MOTEUR UNIQUE GLOBAL DANS LE MARCHÉ DES TABLEAUX ELECTRIQUES STANDARD GRATUIT, PAR TYPE DE CADRE, 2018-2032
TABLEAU 4 MOTEUR UNIQUE GLOBAL DANS LE MARCHÉ DES TABLEAUX AJUSTABLES ÉLECTRIQUES PERMANENT LIBREMENT, PAR AJUSTEMENT SPEED, 2018-2032 (en MILLEUR DE USD)
TABLEAU 5 MOTEUR UNIQUE GLOBAL DANS LE MARCHÉ DES TABLEAUX ELECTRIQUES STANDING LIBRE, PAR INTERFACE DE CONTRÔLE, 2018-2032
TABLEAU 6 MOTEUR UNIQUE GLOBAL DANS LE MARCHÉ DES TABLEAUX ELECTRIQUES STANDING LIBRE, PAR RÉGION, 2018-2033
TABLEAU 7 MOTEUR UNIQUE GLOBAL DANS LE MARCHÉ DES TABLEAUX ELECTRIQUES LIBREMENT STANDARD, PAR RÉGION, 2018-2033 (milliers d'unités)
TABLEAU 8 MOTEURS DUAUX GLOBAUX DANS LE MARCHÉ DES TABLEAUX AJUSTABLES DE L'HAUTE ÉLECTRIQUE, PAR TYPE DE CADRE, 2018-2032
TABLEAU 9 MOTEURS DUAUX GLOBAUX DANS LE MARCHÉ DES TABLEAUX ELECTRIQUES LIBREMENT STANDING, PAR AJUSTEMENT SPEED, 2018-2032 (MILLIERS DE USD)
TABLEAU 10 MOTEUR DUAL GLOBAL DANS LE MARCHÉ DES TABLEAUX ELECTRIQUES STANDING LIBRE, PAR INTERFACE DE CONTRÔLE, 2018-2032
TABLEAU 11 MOTEURS DUAUX GLOBAUX DANS LE MARCHÉ DES TABLEAUX AJUSTABLES À L'HAUTE ÉLECTRIQUE LIBRE STANDING, PAR RÉGION, 2018-2033
TABLEAU 12 MOTEURS DUAUX GLOBAUX DANS LE MARCHÉ DES TABLEAUX ELECTRIQUES STANDING LIBRE, PAR RÉGION, 2018-2033 (MILLIERS)
TABLEAU 13 MULTI-MOTEUR GLOBAL DANS LE MARCHÉ DES TABLEAUX ELECTRIQUES STANDING GRATUIT, PAR TYPE DE CADRE, 2018-2032
TABLEAU 14 MULTI-MOTEUR GLOBAL DANS LE MARCHÉ DES TABLEAUX ELECTRIQUES STANDING LIBRE, PAR AJUSTEMENT SPEED, 2018-2032 (en MILLEUR DE USD)
TABLEAU 15 MULTI-MOTEUR GLOBAL DANS LE MARCHÉ DES TABLEAUX ELECTRIQUES STANDING LIBRE, PAR INTERFACE DE CONTRÔLE, 2018-2032
TABLEAU 16 MULTI-MOTEUR GLOBAL DANS LE MARCHÉ DES TABLEAUX ELECTRIQUES STANDING LIBRE, PAR RÉGION, 2018-2033 (MILLIERS DE USD)
TABLEAU 17 MULTI-MOTEUR GLOBAL DANS LE MARCHÉ DES TABLEAUX ÉLECTRIQUES PERMANENT LIBREMENT AJUSTABLES, PAR RÉGION, 2018-2033
TABLEAU 18 AUTRES GLOBAUX DANS LE MARCHÉ DES TABLEAUX ELECTRIQUES STANDING LIBRE, PAR RÉGION, 2018-2033
TABLEAU 19 AUTRES GLOBAUX DANS LE MARCHÉ DES TABLEAUX ELECTRIQUES PERMANENT LIBREMENT AJUSTABLES, PAR RÉGION, 2018-2033
TABLEAU 20 MARCHÉ DES TABLEAUX ÉLECTRIQUES AJUSTABLES, PAR MATÉRIEL, 2018-2032
TABLEAU 21 MÉTAUX GLOBAUX DANS LE MARCHÉ DES TABLEAUX ELECTRIQUES STANDING LIBRE, PAR TYPE, 2018-2032 (en milliers de dollars)
TABLEAU 22 ACIER MONDIAL DANS LE MARCHÉ DES TABLEAUX ÉLECTRIQUES STANDARD GRATUIT, PAR TYPE, 2018-2032
TABLEAU 23 MÉTAUX GLOBAUX DANS LE MARCHÉ DES TABLEAUX ELECTRIQUES LIBREMENT STANDING, PAR RÉGION, 2018-2033 (MILLIERS USD)
TABLEAU 24 BOIS GLOBALE DANS LE MARCHÉ DES TABLEAUX ELECTRIQUES STANDING LIBRE, PAR TYPE, 2018-2032 (MILLE US)
TABLEAU 25 BOIS GÉNÉRÉES GLOBALES DANS LE MARCHÉ DES TABLEAUX AJUSTABLES À L'HAUTE LIBRE STANDING, PAR TYPE, 2018-2032
TABLEAU 26 BOIS SOLIDES GLOBALES DANS LE MARCHÉ DES TABLEAUX AJUSTABLES DE L'HAUTEUR LIBRE STANDARD, PAR TYPE, 2018-2032 (en MILLEUR)
TABLEAU 27 BOIS GLOBALE DANS LE MARCHÉ DES TABLEAUX ELECTRIQUES STANDING LIBRE, PAR RÉGION, 2018-2033 (MILLIERS DE USD)
TABLEAU 28 PLASTIQUE GLOBALE/COMPOSITE DANS LE MARCHÉ DES TABLEAUX ELECTRIQUES STANDARD GRATUIT, PAR TYPE, 2018-2032 (en MILLIERS DE USD)
TABLEAU 29 PLASTIQUE/COMPOSITE MONDIALE DANS LE MARCHÉ DES TABLEAUX ELECTRIQUES PERMANENT LIBREMENT AJUSTABLES, PAR RÉGION, 2018-2033
TABLEAU 30 GLASSE MONDIALE DANS LE MARCHÉ DES TABLEAUX ÉLECTRIQUES STANDARD LIBRE, PAR RÉGION, 2018-2033 (en milliers de dollars)
TABLEAU 31 AUTRES GLOBAUX) DANS LE MARCHÉ DES TABLEAUX ELECTRIQUES STANDING LIBRE, PAR RÉGION, 2018-2033 (MILLIERS DE USD)
TABLEAU 32 MARCHÉ DES TABLEAUX AJUSTABLES À L'HAUTE ÉLECTRIQUE, PAR DEMANDE, 2018-2032 (en MILLIERS USD)
TABLEAU 33 BUREAUX GLOBAUX DES COMPÉTENCES DANS LE MARCHÉ DES TABLEAUX ELECTRIQUES PERMANENT GRATUITEMENT, PAR TYPE, 2018-2032 (MILLIERS USD)
TABLEAU 34 BUREAUX DU CORPORAT MONDIAL DANS LE MARCHÉ DES TABLEAUX ÉLECTRIQUES PERMANENT LIBREMENT, PAR RÉGION, 2018-2033 (MILLIERS DE USD)
TABLEAU 35 RÉSIDENTIEL GLOBAL DANS LE MARCHÉ DES TABLEAUX ELECTRIQUES STANDING LIBRE, PAR TYPE, 2018-2032 (en milliers de dollars)
TABLEAU 36 RESIDENTIEL GLOBAL DANS LE MARCHÉ DES TABLEAUX ELECTRIQUES STANDING LIBRE, PAR RÉGION, 2018-2033 (MILLIERS DE USD)
TABLEAU 37 ÉDUCATION GLOBALE DANS LE MARCHÉ DES TABLEAUX ELECTRIQUES STANDING LIBRE, PAR TYPE, 2018-2032 (en milliers de dollars)
TABLEAU 38 ÉDUCATION GLOBALE DANS LE MARCHÉ DES TABLEAUX ELECTRIQUES LIBREMENT STANDING, PAR RÉGION, 2018-2033
TABLEAU 39 SANTE MONDIALE DANS LE MARCHÉ DES TABLEAUX AJUSTABLES À L'HAUTE ÉLECTRIQUE LIBRE STANDING, PAR TYPE, 2018-2032 (en milliers de dollars)
TABLEAU 40 SANTE MONDIALE DANS LE MARCHÉ DES TABLEAUX AJUSTABLES À L'HAUTE ÉLECTRIQUE LIBRE STANDING, PAR RÉGION, 2018-2033
TABLEAU 41 AUTRES GLOBAUX DANS LE MARCHÉ DES TABLEAUX ÉLECTRIQUES STANDING LIBRE, PAR RÉGION, 2018-2033 (en milliers de dollars)
TABLEAU 42 MARCHÉ DES TABLEAUX AJUSTABLES DE L'HAUTEUR ÉLECTRIQUE, PAR UTILISATEUR DE FIN, 2018-2033 (en millions d'USD)
TABLEAU 43 ENTREPRISE GLOBALE D'ENTREPRISES DANS LE MARCHÉ DES TABLEAUX AJUSTABLES À L'HAUTE ÉLECTRIQUE LIBRE, PAR RÉGION, 2018-2033 (en millions de dollars É.-U.)
TABLEAU 44 PETITES ET MOYENNES ENTREPRISES GLOBALES DANS LE MARCHÉ DES TABLEAUX ELECTRIQUES STANDARD GRATUIT, PAR RÉGION, 2018-2033 (MILLIERS DE USD)
TABLEAU 45 CONSOMMATEURS INDIVIDUELS GLOBAUX DANS LE MARCHÉ DES TABLEAUX ELECTRIQUES STANDARD GRATUIT, PAR RÉGION, 2018-2033
TABLEAU 46 GOUVERNEMENTS GLOBAUX ET INSTITUTIONS PUBLIQUES DANS LE MARCHÉ DES TABLEAUX ELECTRIQUES PERMANENTES, PAR RÉGION, 2018-2033 (en millions de dollars)
TABLEAU 47 AUTRES GLOBAUX DANS LE MARCHÉ DES TABLEAUX ELECTRIQUES STANDING LIBRE, PAR RÉGION, 2018-2033 (en milliers de dollars)
TABLEAU 48 MARCHÉ DES TABLEAUX ELECTRIQUES AJUSTABLES À L'ÉTRANGER GRATUITEMENT, PAR CHANEAU DE DISTRIBUTION, 2018-2033
TABLEAU 49 MARCHÉ DES TABLEAUX ÉLECTRIQUES AJUSTABLES À L'ÉTRANGER GRATUITEMENT, PAR CHANEAU DE DISTRIBUTION, 2018-2033 (milliers d'unités)
TABLEAU 50 VENTES INDIRECTES MONDIALES DANS LE MARCHÉ DES TABLEAUX ELECTRIQUES STANDING GRATUIT, PAR TYPE, 2018-2032
TABLEAU 51 STOCKS GLOBAUX DE STAIL DANS LE MARCHÉ DES TABLEAUX ELECTRIQUES STANDING GRATUIT, PAR TYPE, 2018-2032
TABLEAU 52 COMMERCE ÉLECTRIQUE MONDIAL DANS LE MARCHÉ DES TABLEAUX AJUSTABLES DE L'HAUTE LIBRE STANDING, PAR TYPE, 2018-2032 (MILLIERS DE USD)
TABLEAU 53 VENTES INDIRECTES GLOBALES SUR LE MARCHÉ DES TABLEAUX ELECTRIQUES STANDING LIBRE, PAR RÉGION, 2018-2033 (MILLIERS USD)
TABLEAU 54 VENTES INDIRECTES MONDIALES SUR LE MARCHÉ DES TABLEAUX ELECTRIQUES STANDARDS LIBREMENT AJUSTABLES, PAR RÉGION, 2018-2033 (MILLIERS)
TABLEAU 55 VENTES GLOBALES DIRECTES SUR LE MARCHÉ DES TABLEAUX ELECTRIQUES STANDING GRATUIT, PAR RÉGION, 2018-2033 (MILLIERS DE USD)
TABLEAU 56 VENTES GLOBALES DIRECTES SUR LE MARCHÉ DES TABLEAUX ELECTRIQUES STANDARDS LIBREMENT AJUSTABLES, PAR RÉGION, 2018-2033
TABLEAU 57 VENTES DE CONTRATS GLOBAUX DANS LE MARCHÉ DES TABLEAUX ELECTRIQUES STANDING GRATUIT, PAR RÉGION, 2018-2033 (en millions de dollars)
TABLEAU 58 VENTES DE CONTRATS MONDIALES SUR LE MARCHÉ DES TABLEAUX ÉLECTRIQUES STANDARDS LIBREMENT AJUSTABLES, PAR RÉGION, 2018-2033
TABLEAU 59 AUTRES GLOBAUX DANS LE MARCHÉ DES TABLEAUX ÉLECTRIQUES STANDING LIBRE, PAR RÉGION, 2018-2033 (en milliers de dollars)
TABLEAU 60 AUTRES GLOBAUX DANS LE MARCHÉ DES TABLEAUX ELECTRIQUES STANDING LIBRE, PAR RÉGION, 2018-2033 (MILLIERS)
TABLEAU 61 MARCHÉ DES TABLEAUX ÉLECTRIQUES AJUSTABLES À L'ÉTRANGER GRATUITEMENT, PAR RÉGION, 2018-2033, (en millions de dollars)
TABLEAU 62 MARCHÉ DES TABLEAUX ÉLECTRIQUES AJUSTABLES À L'ÉTRANGER GRATUITEMENT, PAR RÉGION, 2018-2033, (milliers d'unités)
TABLEAU 63 MARCHÉ DES TABLEAUX ELECTRIQUES AJUSTABLES DE L'AMÉRIQUE DU NORD, PAR PAYS, 2018-2032
TABLEAU 64 MARCHÉ DES TABLEAUX ELECTRIQUES AJUSTABLES DE L'AMÉRIQUE DU NORD, PAR PAYS, 2018-2032
TABLEAU 65 MARCHÉ DES TABLEAUX ELECTRIQUES AJUSTABLES DE L'AMÉRIQUE DU NORD, PAR FORMULAIRE DE PRODUIT, 2018-2032 (en MILLE USD)
TABLEAU 66 MARCHÉ DES TABLEAUX ELECTRIQUES AJUSTABLES DE L'AMÉRIQUE DU NORD, PAR FORMULAIRE DE PRODUIT, 2018-2032 (EN MILLIERS)
TABLEAU 67 MOTEUR UNIQUE DE L'AMÉRIQUE DU NORD DANS LE MARCHÉ DES TABLEAUX AJUSTABLES DE L'HAUTE LIBRE STANDING, PAR TYPE DE CADRE, 2018-2032
TABLEAU 68 MOTEUR UNIQUE DE L'AMÉRIQUE DU NORD DANS LE MARCHÉ DES TABLEAUX AJUSTABLES DE L'HAUTEUR ÉLECTRIQUE PERMANENT LIBRE, PAR AJUSTEMENT SPEED, 2018-2032 (MILLIERS DE USD)
TABLEAU 69 MOTEUR UNIQUE DE L'AMÉRIQUE DU NORD DANS LE MARCHÉ DES TABLEAUX AJUSTABLES DE L'HAUTE ÉLECTRIQUE PERMANENTE LIBRE, PAR INTERFACE DE CONTRÔLE, 2018-2032 (MILLIERS DE USD)
TABLEAU 70 AMERIQUE NORD DUAL MOTEUR DANS LE MARCHÉ DES TABLEAUX ELECTRIQUES STANDING LIBRE, PAR TYPE DE CADRE, 2018-2032 (en MILLIERS DE USD)
TABLEAU 71 AMÉRIQUE DU NORD AUTOMOBILE DANS LE MARCHÉ DES TABLEAUX AJUSTABLES ÉLECTRIQUES STANDARD LIBRE, PAR AJUSTEMENT SPEED, 2018-2032 (en MILLEUR USD)
TABLEAU 72 AMÉRIQUE NORD DUAL MOTEUR DANS LE MARCHÉ DES TABLEAUX ELECTRIQUES STANDING LIBRE, PAR INTERFACE DE CONTRÔLE, 2018-2032 (MILLIERS DE USD)
TABLEAU 73 AMÉRIQUE DU NORD MULTI-MOTEUR DANS LE MARCHÉ DES TABLEAUX AJUSTABLES ÉLECTRIQUES STANDARD GRATUIT, PAR TYPE DE CADRE, 2018-2032
TABLEAU 74 AMÉRIQUE DU NORD MULTI-MOTEUR DANS LE MARCHÉ DES TABLEAUX AJUSTABLES ÉLECTRIQUES PERMANENTES LIBREMENT, PAR AJUSTEMENT SPEED, 2018-2032 (MILLIERS DE USD)
TABLEAU 75 AMÉRIQUE DU NORD MULTI-MOTEUR DANS LE MARCHÉ DES TABLEAUX ELECTRIQUES STANDING LIBRE, PAR INTERFACE DE CONTRÔLE, 2018-2032 (en MILLEUR)
TABLEAU 76 MARCHÉ DES TABLEAUX ELECTRIQUES AJUSTABLES DE L'AMÉRIQUE DU NORD, PAR MATÉRIEL, 2018-2032
TABLEAU 77 MÉTAL DE L'AMÉRIQUE DU NORD DANS LE MARCHÉ DES TABLEAUX AJUSTABLES DE L'HAUTEUR LIBRE STANDING, PAR TYPE, 2018-2032
TABLEAU 78 ACIER DE L'AMÉRIQUE DU NORD DANS LE MARCHÉ DES TABLEAUX AJUSTABLES ÉLECTRIQUES STANDARD GRATUIT, PAR TYPE, 2018-2032
TABLEAU 79 BOIS D'AMÉRIQUE DU NORD DANS LE MARCHÉ DES TABLEAUX ELECTRIQUES STANDING LIBRE, PAR TYPE, 2018-2032
TABLEAU 80 BOIS ENGINÉES EN AMÉRIQUE DU NORD DANS LE MARCHÉ DES TABLEAUX AJUSTABLES ÉLECTRIQUES STANDARD GRATUIT, PAR TYPE, 2018-2032 (en MILLEUR)
TABLEAU 81 BOIS SOLIDE DE L'AMÉRIQUE DU NORD DANS LE MARCHÉ DES TABLEAUX AJUSTABLES ÉLECTRIQUES STANDARD GRATUIT, PAR TYPE, 2018-2032 (en MILLEUR)
TABLEAU 82 PLASTIQUE DE L'AMÉRIQUE NORD/COMPOSITE DANS LE MARCHÉ DES TABLEAUX ELECTRIQUES STANDARD GRATUIT, PAR TYPE, 2018-2032
TABLEAU 83 MARCHÉ DES TABLEAUX AJUSTABLES DE L'AMÉRIQUE DU NORD, PAR DEMANDE, 2018-2032 (en MILLIERS DE USD)
TABLEAU 84 BUREAUX DU CORPORAT DE L'AMÉRIQUE DU NORD DANS LE MARCHÉ DES TABLEAUX AJUSTABLES ÉLECTRIQUES PERMANENT GRATUITEMENT, PAR TYPE, 2018-2032 (en milliers de dollars)
TABLEAU 85 RÉSIDENTIEL DE L'AMÉRIQUE DU NORD DANS LE MARCHÉ DES TABLEAUX AJUSTABLES ÉLECTRIQUES PERMANENT, PAR TYPE, 2018-2032
TABLEAU 86 ÉDUCATION DE L'AMÉRIQUE DU NORD DANS LE MARCHÉ DES TABLEAUX AJUSTABLES À L'HAUTE ÉLECTRIQUE LIBRE STANDING, PAR TYPE, 2018-2032 (en milliers de dollars)
TABLEAU 87 BIEN-ÊTRE DE L'AMÉRIQUE DU NORD DANS LE MARCHÉ DES TABLEAUX AJUSTABLES ÉLECTRIQUES STANDING LIBRE, PAR TYPE, 2018-2032 (en milliers de dollars)
TABLEAU 88 MARCHÉ DES TABLEAUX ELECTRIQUES AJUSTABLES DE L'AMÉRIQUE DU NORD, PAR UTILISATEUR, 2018-2033
TABLEAU 89 MARCHÉ DES TABLEAUX AJUSTABLES DE L'AMÉRIQUE DU NORD, PAR CHANEAU DE DISTRIBUTION, 2018-2033
TABLEAU 90 MARCHÉ DES TABLEAUX AJUSTABLES DE L'AMÉRIQUE DU NORD, PAR CHANEAU DE DISTRIBUTION, 2018-2033
TABLEAU 91 VENTES INDIRECTES D'AMÉRIQUE DU NORD DANS LE MARCHÉ DES TABLEAUX AJUSTABLES ÉLECTRIQUES STANDING LIBRE, PAR TYPE, 2018-2032 (en milliers de dollars)
TABLEAU 92 STOCKS DE DÉTAILLAGE DE L'AMÉRIQUE DU NORD DANS LE MARCHÉ DES TABLEAUX ELECTRIQUES STANDING LIBRE, PAR TYPE, 2018-2032 (en MILLEUR)
TABLEAU 93 COMMERCE-E DE L'AMÉRIQUE DU NORD DANS LE MARCHÉ DES TABLEAUX AJUSTABLES ÉLECTRIQUES PERMANENT LIBRE, PAR TYPE, 2018-2032 (en MILLEUR)
TABLEAU 94 MARCHÉ DES TABLEAUX ELECTRIQUES LIBREMENT STANDING, PAR FORMULAIRE DE PRODUIT, 2018-2032
TABLEAU 95 MARCHÉ DES TABLEAUX ÉLECTRIQUES AJUSTABLES À L'ÉTRANGER GRATUITEMENT, PAR FORMULAIRE DE PRODUIT, 2018-2032 (EN MILLIERS)
TABLEAU 96 MOTEUR UNIQUE DES É.-U. DANS LE MARCHÉ DES TABLEAUX ELECTRIQUES STANDING LIBRE, PAR TYPE DE CADRE, 2018-2032 (en MILLEUR DE USD)
TABLEAU 97 MOTEUR UNIQUE DES É.-U. DANS LE MARCHÉ DES TABLEAUX ELECTRIQUES D'ADJUSTABLES LIBREMENT STANDING, PAR AJUSTEMENT SPEED, 2018-2032 (MILLIERS DE USD)
TABLEAU 98 MOTEUR UNIQUE DES ÉTATS-UNIS DANS LE MARCHÉ DES TABLEAUX ELECTRIQUES STANDING LIBRE, PAR INTERFACE DE CONTRÔLE, 2018-2032 (en MILLIERS DE USD)
TABLEAU 99 DUAL MOTOR É.-U. DANS LE MARCHÉ DES TABLEAUX ELECTRIQUES STANDING LIBRE, PAR TYPE DE CADRE, 2018-2032 (MILLIERS DE USD)
TABLEAU 100 DUAL MOTOR U.S. DANS LE MARCHÉ DES TABLEAUX ELECTRIQUES LIBREMENT STANDING, PAR AJUSTEMENT SPEED, 2018-2032 (MILLIERS DE USD)
TABLEAU 101 DUAL MOTOR U.S. DANS LE MARCHÉ DES TABLEAUX ELECTRIQUES AJUSTABLES LIBREMENT STANDING, PAR INTERFACE DE CONTRÔLE, 2018-2032 (en MILLE USD)
TABLEAU 102 É.-U. MULTI-MOTEUR DANS LE MARCHÉ DES TABLEAUX ELECTRIQUES STANDING GRATUIT, PAR TYPE DE CADRE, 2018-2032
TABLEAU 103 U.S. MULTI-MOTOR DANS LE MARCHÉ DES TABLEAUX ÉLECTRIQUES D'ADJUSTABLES LIBREMENT STANDING, PAR AJUSTEMENT SPEED, 2018-2032
TABLEAU 104 U.S. MULTI-MOTEUR DANS LE MARCHÉ DES TABLEAUX ÉLECTRIQUES LIBREMENT STANDING, PAR INTERFACE DE CONTRÔLE, 2018-2032
TABLEAU 105 MARCHÉ DES TABLEAUX AJUSTABLES DE L'HAUTEUR ÉLECTRIQUE, PAR MATÉRIEL, 2018-2032
TABLEAU 106 MÉTAUX DES ÉTATS-UNIS DANS LE MARCHÉ DES TABLEAUX ÉLECTRIQUES STANDING LIBRE, PAR TYPE, 2018-2032 (en milliers de dollars)
TABLEAU 107 ACIER U.S. DANS LE MARCHÉ DES TABLEAUX ELECTRIQUES STANDING LIBRE, PAR TYPE, 2018-2032 (en MILLIERS USD)
TABLEAU 108 BOIS DES ÉTATS-UNIS DANS LE MARCHÉ DES TABLEAUX ELECTRIQUES STANDING LIBRE, PAR TYPE, 2018-2032
TABLEAU 109 BOIS ENGINÉES DES É.-U. DANS LE MARCHÉ DES TABLEAUX AJUSTABLES ÉLECTRIQUES À L'ÉTRANGER GRATUITEMENT, PAR TYPE, 2018-2032 (en milliers de dollars)
TABLEAU 110 BOIS SOLIDES U.S. DANS LE MARCHÉ DES TABLEAUX ELECTRIQUES STANDING LIBRE, PAR TYPE, 2018-2032
TABLEAU 111 PLASTIQUE/COMPOSITE DES É.-U. DANS LE MARCHÉ DES TABLEAUX ÉLECTRIQUES STANDARD GRATUIT, PAR TYPE, 2018-2032 (en MILLIERS USD)
TABLEAU 112 MARCHÉ DES TABLEAUX AJUSTABLES À L'HAUTE ÉLECTRIQUE, PAR DEMANDE, 2018-2032 (en MILLIERS DE USD)
TABLEAU 113 BUREAUX CORPORATIQUES DES ÉTATS-UNIS DANS LE MARCHÉ DES TABLEAUX AJUSTABLES À L'HAUTE ÉLECTRIQUE, PAR TYPE, 2018-2032
TABLEAU 114 RÉSIDENTIEL DES ÉTATS-UNIS DANS LE MARCHÉ DES TABLEAUX ELECTRIQUES STANDING LIBRE, PAR TYPE, 2018-2032
TABLEAU 115 ÉDUCATION DES ÉTATS-UNIS DANS LE MARCHÉ DES TABLEAUX ELECTRIQUES STANDING LIBRE, PAR TYPE, 2018-2032
TABLEAU 116 É.-U. SANTÉ DANS LE MARCHÉ DES TABLEAUX ELECTRIQUES STANDING LIBRE, PAR TYPE, 2018-2032 (MILLIERS DE USD)
TABLEAU 117 MARCHÉ DES TABLEAUX ÉLECTRIQUES AJUSTABLES, PAR UTILISATEUR, 2018-2033
TABLEAU 118 MARCHÉ DES TABLEAUX AJUSTABLES DE L'HAUTEUR ÉLECTRIQUE, PAR CHANEAU DE DISTRIBUTION, 2018-2033 (en MILLIERS USD)
TABLEAU 119 MARCHÉ DES TABLEAUX AJUSTABLES À L'HAUTE ÉLECTRIQUE, PAR CHANEAU DE DISTRIBUTION, 2018-2033
TABLEAU 120 VENTES INDIRECTES U.S. DANS LE MARCHÉ DES TABLEAUX ELECTRIQUES STANDING GRATUIT, PAR TYPE, 2018-2032 (MILLIERS DE USD)
TABLEAU 121 STOCKS DE STAIL US DANS LE MARCHÉ DES TABLEAUX ELECTRIQUES STANDING GRATUIT, PAR TYPE, 2018-2032
TABLEAU 122 É.-U. COMMERCE-E DANS LE MARCHÉ DES TABLEAUX ELECTRIQUES STANDING LIBRE, PAR TYPE, 2018-2032 (MILLIERS DE USD)
TABLEAU 123 MARCHÉ DES TABLEAUX ÉLECTRIQUES STANDING LIBRE AU CANADA, PAR FORMULAIRE DE PRODUIT, 2018-2032 (en MILLIERS USD)
TABLEAU 124 MARCHÉ DES TABLEAUX ÉLECTRIQUES AJUSTABLES À L'ÉTRANGER LIBRE AU CANADA, PAR FORMULAIRE DE PRODUIT, 2018-2032 (EN MILLIERS)
TABLEAU 125 MOTEUR UNIQUE DU CANADA DANS LE MARCHÉ DES TABLEAUX ELECTRIQUES AJUSTABLES À L'HAUTE LIBRE STANDING, PAR TYPE DE CADRE, 2018-2032 (en MILLEUR)
TABLEAU 126 MOTEUR UNIQUE DU CANADA DANS LE MARCHÉ DES TABLEAUX ÉLECTRIQUES D'ADJUSTABLES LIBREMENT STANDING, PAR AJUSTEMENT SPEED, 2018-2032
TABLEAU 127 MOTEUR UNIQUE DU CANADA DANS LE MARCHÉ DES TABLEAUX ELECTRIQUES AJUSTABLES LIBREMENT STANDARD, PAR INTERFACE DE CONTRÔLE, 2018-2032
TABLEAU 128 DUAL MOTOR DU CANADA DANS LE MARCHÉ DES TABLEAUX ELECTRIQUES STANDING LIBRE, PAR TYPE DE CADRE, 2018-2032 (MILLIERS DE USD)
TABLEAU 129 DUAL MOTOR DU CANADA DANS LE MARCHÉ DES TABLEAUX ELECTRIQUES D'ADJUSTABLES LIBREMENT STANDING, PAR AJUSTEMENT SPEED, 2018-2032 (MILLIERS DE USD)
TABLEAU 130 DUAL MOTOR DU CANADA DANS LE MARCHÉ DES TABLEAUX ELECTRIQUES AJUSTABLES À L'ÉTABLISSEMENT LIBRE, PAR INTERFACE DE CONTRÔLE, 2018-2032 (en MILLIERS USD)
TABLEAU 131 MULTI-MOTEUR DU CANADA DANS LE MARCHÉ DES TABLEAUX ÉLECTRIQUES STANDING LIBRE, PAR TYPE DE CADRE, 2018-2032 (MILLIERS DE USD)
TABLEAU 132 CANADA MULTI-MOTEUR DANS LE MARCHÉ DES TABLEAUX ELECTRIQUES STANDING LIBRE, PAR AJUSTEMENT SPEED, 2018-2032 (MILLIERS DE USD)
TABLEAU 133 MULTI-MOTEUR DU CANADA DANS LE MARCHÉ DES TABLEAUX ÉLECTRIQUES LIBREMENT STANDING, PAR INTERFACE DE CONTRÔLE, 2018-2032
TABLEAU 134 MARCHÉ CANADIEN DES TABLEAUX ÉLECTRIQUES AJUSTABLES À L'ÉTRANGER LIBRE, PAR MATÉRIEL, 2018-2032 (en MILLE USD)
TABLEAU 135 MÉTAL DU CANADA DANS LE MARCHÉ DES TABLEAUX ELECTRIQUES LIBREMENT STANDING, PAR TYPE, 2018-2032
TABLEAU 136 ACIER DU CANADA DANS LE MARCHÉ DES TABLEAUX ÉLECTRIQUES STANDARD GRATUIT, PAR TYPE, 2018-2032
TABLEAU 137 BIEN-ÊTRE DU CANADA DANS LE MARCHÉ DES TABLEAUX ELECTRIQUES STANDING LIBRE, PAR TYPE, 2018-2032 (MILLE US)
TABLEAU 138 BOIS ENGINÉES DU CANADA DANS LE MARCHÉ DES TABLEAUX ÉLECTRIQUES STANDING LIBRE, PAR TYPE, 2018-2032 (MILLIERS DE USD)
TABLEAU 139 BOIS SOLIDES DU CANADA DANS LE MARCHÉ DES TABLEAUX ELECTRIQUES STANDING LIBRE, PAR TYPE, 2018-2032 (en MILLE US)
TABLEAU 140 PLASTIQUE/COMPOSITE DU CANADA DANS LE MARCHÉ DES TABLEAUX ELECTRIQUES STANDING LIBRE, PAR TYPE, 2018-2032 (en MILLIERS USD)
TABLEAU 141 MARCHÉ CANADIEN DES TABLEAUX ÉLECTRIQUES AJUSTABLES, PAR DEMANDE, 2018-2032
TABLEAU 142 BUREAUX CORPORATIQUES DU CANADA DANS LE MARCHÉ DES TABLEAUX ELECTRIQUES STANDING LIBRE, PAR TYPE, 2018-2032 (MILLIERS DE USD)
TABLEAU 143 RÉSIDENTIEL DU CANADA DANS LE MARCHÉ DES TABLEAUX ÉLECTRIQUES STANDING LIBRE, PAR TYPE, 2018-2032 (en milliers de dollars américains)
TABLEAU 144 ÉDUCATION DU CANADA DANS LE MARCHÉ DES TABLEAUX AJUSTABLES À L'HAUTE ÉLECTRIQUE LIBRE STANDING, PAR TYPE, 2018-2032 (en MILLE USD)
TABLEAU 145 PAR TYPE DE MARCHÉ DES TABLEAUX ÉLECTRIQUES DE LA SANTÉ AU CANADA, 2018-2032
TABLEAU 146 MARCHÉ DES TABLEAUX ELECTRIQUES AJUSTABLES À L'ÉTRANGER AU CANADA, PAR UTILISATEUR EN FIN, 2018-2033 (en milliers de dollars)
TABLEAU 147 MARCHÉ DES TABLEAUX ÉLECTRIQUES À L'ÉTAT LIBRE DU CANADA, PAR CHANEAU DE DISTRIBUTION, 2018-2033
TABLEAU 148 MARCHÉ DES TABLEAUX ÉLECTRIQUES AJUSTABLES À L'ÉTRANGER AU CANADA, PAR CHANEAU DE DISTRIBUTION, 2018-2033 (EN MILLIERS)
TABLEAU 149 LES VENTES INDIRECTES DU CANADA DANS LE MARCHÉ DES TABLEAUX ELECTRIQUES STANDING LIBRE, PAR TYPE, 2018-2032 (en MILLIERS USD)
TABLEAU 150 STOCKS DE DÉTAILLAGE DU CANADA DANS LE MARCHÉ DES TABLEAUX ÉLECTRIQUES STANDING LIBRE, PAR TYPE, 2018-2032 (MILLIERS USD)
TABLEAU 151 COMMERCE ÉLECTRIQUE DU CANADA DANS LE MARCHÉ DES TABLEAUX AJUSTABLES À L'HAUTE LIBRE STANDING, PAR TYPE, 2018-2032
TABLEAU 152 MARCHÉ DES TABLEAUX AJUSTABLES DE L'HAUTE ÉLECTRIQUE, PAR FORMULAIRE DE PRODUIT, 2018-2032 (en M$)
TABLEAU 153 MARCHÉ DES TABLEAUX ÉLECTRIQUES AJUSTABLES, PAR FORMULAIRE DE PRODUIT, 2018-2032 (EN MOYENS)
TABLEAU 154 MOTEUR UNIQUE MEXIQUE DANS LE MARCHÉ DES TABLEAUX AJUSTABLES ÉLECTRIQUES PERSONNELS, PAR TYPE DE CADRE, 2018-2032
TABLEAU 155 MOTEUR UNIQUE MEXIQUE DANS LE MARCHÉ DES TABLEAUX AJUSTABLES ÉLECTRIQUES LIBREMENT STANDARD, PAR AJUSTEMENT SPEED, 2018-2032 (en MILLIERS DE USD)
TABLEAU 156 MOTEUR UNIQUE MEXIQUE DANS LE MARCHÉ DES TABLEAUX AJUSTABLES ÉLECTRIQUES PERMANENT LIBRE, PAR INTERFACE DE CONTRÔLE, 2018-2032 (en MILLEUR)
TABLEAU 157 MOTEUR DUAL MEXIQUE DANS LE MARCHÉ DES TABLEAUX ELECTRIQUES STANDING LIBRE, PAR TYPE DE CADRE, 2018-2032 (MILLIERS DE USD)
TABLEAU 158 MEXIQUE DUAL MOTOR DANS LE MARCHÉ DES TABLEAUX AJUSTABLES ÉLECTRIQUES LIBREMENT STANDARD, PAR AJUSTEMENT PRÉVUE, 2018-2032 (en milliers de dollars)
TABLEAU 159 MEXIQUE DUAL MOTEUR DANS LE MARCHÉ DES TABLEAUX ELECTRIQUES STANDING LIBRE, PAR INTERFACE DE CONTRÔLE, 2018-2032 (en MILLEUR)
TABLEAU 160 MEXIQUE MULTI-MOTEUR DANS LE MARCHÉ DES TABLEAUX ELECTRIQUES STANDING LIBRE, PAR TYPE DE CADRE, 2018-2032 (en MILLEUR)
TABLEAU 161 MEXIQUE MULTI-MOTEUR DANS LE MARCHÉ DES TABLEAUX ELECTRIQUES STANDING LIBRE, PAR AJUSTEMENT SPEED, 2018-2032 (en MILLIERS DE USD)
TABLEAU 162 MEXIQUE MULTI-MOTEUR DANS LE MARCHÉ DES TABLEAUX ELECTRIQUES STANDING LIBRE, PAR INTERFACE DE CONTRÔLE, 2018-2032 (en MILLE USD)
TABLEAU 163 MARCHÉ DES TABLEAUX ÉLECTRIQUES AJUSTABLES, PAR MATÉRIEL, 2018-2032 (MILLIERS USD)
TABLEAU 164 MEXIQUE MÉTAL DANS LE MARCHÉ DES TABLEAUX ÉLECTRIQUES STANDING LIBRE, PAR TYPE, 2018-2032 (en milliers de dollars)
TABLEAU 165 ACIER MEXIQUE DANS LE MARCHÉ DES TABLEAUX ELECTRIQUES STANDING LIBRE, PAR TYPE, 2018-2032
TABLEAU 166 BOIS MEXIQUE DANS LE MARCHÉ DES TABLEAUX ELECTRIQUES STANDING LIBRE, PAR TYPE, 2018-2032
TABLEAU 167 BOIS ENGINÉES MEXIQUE DANS LE MARCHÉ DES TABLEAUX AJUSTABLES ÉLECTRIQUES PERSONNELS, PAR TYPE, 2018-2032
TABLEAU 168 BOIS SOLIDES MEXIQUE DANS LE MARCHÉ DES TABLEAUX AJUSTABLES ÉLECTRIQUES STANDARD GRATUIT, PAR TYPE, 2018-2032
TABLEAU 169 MEXIQUE PLASTIQUE/COMPOSITE DANS LE MARCHÉ DES TABLEAUX ÉLECTRIQUES STANDARD GRATUIT, PAR TYPE, 2018-2032 (en MILLEUR)
TABLEAU 170 MARCHÉ MEXIQUE DES TABLEAUX AJUSTABLES DE L'HAUTE ELECTRIQUE, PAR DEMANDE, 2018-2032 (en MILLIERS USD)
TABLEAU 171 BUREAUX CORPORATIQUES MEXIQUE DANS LE MARCHÉ DES TABLEAUX ELECTRIQUES PERMANENT LIBREMENT, PAR TYPE, 2018-2032 (en MILLEUR)
TABLEAU 172 RÉSIDENTIEL MEXIQUE DANS LE MARCHÉ DES TABLEAUX ELECTRIQUES STANDING LIBRE, PAR TYPE, 2018-2032 (en milliers de dollars)
TABLEAU 173 ÉDUCATION MEXIQUE DANS LE MARCHÉ DES TABLEAUX AJUSTABLES À L'HAUTE ÉLECTRIQUE LIBRE STANDING, PAR TYPE, 2018-2032 (en milliers de dollars)
TABLEAU 174 BIEN-ÊTRE MEXIQUE DANS LE MARCHÉ DES TABLEAUX ELECTRIQUES STANDING LIBRE, PAR TYPE, 2018-2032 (en milliers de dollars)
TABLEAU 175 MARCHÉ MEXIQUE DES TABLEAUX AJUSTABLES DE L'HAUTEUR ELECTRIQUE, PAR UTILISATEUR DE FIN, 2018-2033 (en milliers d'USD)
TABLEAU 176 MARCHÉ DES TABLEAUX ÉLECTRIQUES AJUSTABLES, PAR CHANEAU DE DISTRIBUTION, 2018-2033
TABLEAU 177 MARCHÉ DES TABLEAUX AJUSTABLES DE L'HAUTE ÉLECTRIQUE, PAR CHANEAU DE DISTRIBUTION, 2018-2033
TABLEAU 178 VENTES INDIRECTES MEXIQUE DANS LE MARCHÉ DES TABLEAUX ELECTRIQUES STANDING LIBRE, PAR TYPE, 2018-2032 (en MILLEUR)
TABLEAU 179 STOCKS DE DÉTAILLAGE MEXIQUE DANS LE MARCHÉ DES TABLEAUX ELECTRIQUES STANDARD GRATUIT, PAR TYPE, 2018-2032 (en milliers de dollars)
TABLEAU 180 COMMERCE-E-MEXIQUE DANS LE MARCHÉ DES TABLEAUX ELECTRIQUES STANDING GRATUIT, PAR TYPE, 2018-2032
TABLEAU 181 EUROPE GRANDE STANDING ELECTRIQUE TABLEAUX AJUSTABLES PAR PAYS, 2018-2032
TABLEAU 182 EUROPE GRANDE STANDING ELECTRIQUE TABLEAUX AJUSTABLES, PAR PAYS, 2018-2032 (EN MILLIERS)
TABLEAU 183 EUROPE GRANDE STANDING ELECTRIQUE TABLEAUX AJUSTABLES MARCHÉ, PAR FORMULAIRE DE PRODUIT, 2018-2032 (MILLIERS USD)
TABLEAU 184 EUROPE GRANDE STANDING ELECTRICAL TABLEAUX AJUSTABLES MARCHÉ, PAR FORMULAIRE DE PRODUIT, 2018-2032 (UNITS DE MOINS)
TABLEAU 185 EUROPE UNIQUE MOTEUR DANS LE MARCHÉ DES TABLEAUX ELECTRIQUES STANDING LIBRE-ADJUSTABLES, PAR TYPE DE CADRE, 2018-2032
TABLEAU 186 EUROPE UNIQUE MOTEUR DANS LE MARCHÉ DES TABLEAUX AJUSTABLES ÉLECTRIQUES STANDARD LIBRE, PAR AJUSTEMENT SPEED, 2018-2032 (en MILLEUR DE USD)
TABLEAU 187 EUROPE UNIQUE MOTEUR DANS LE MARCHÉ DES TABLEAUX ELECTRIQUES AJUSTABLES LIBREMENT STANDARD, PAR INTERFACE DE CONTRÔLE, 2018-2032
TABLEAU 188 EUROPE DUAL MOTOR DANS LE MARCHÉ DES TABLEAUX ELECTRIQUES LIBREMENT STANDING, PAR TYPE DE CADRE, 2018-2032 (MILLIERS USD)
TABLEAU 189 EUROPE DUAL MOTOR DANS LE MARCHÉ DES TABLEAUX ELECTRIQUES AJUSTABLES LIBREMENT STANDING, PAR AJUSTEMENT SPEED, 2018-2032 (MILLIERS DE USD)
TABLEAU 190 EUROPE DUAL MOTOR DANS LE MARCHÉ DES TABLEAUX ELECTRIQUES AJUSTABLES LIBREMENT STANDING, PAR INTERFACE DE CONTRÔLE, 2018-2032
TABLEAU 191 EUROPE MULTI-MOTEUR DANS LE MARCHÉ DES TABLEAUX ÉLECTRIQUES STANDING LIBRE, PAR TYPE DE CADRE, 2018-2032 (en milliers de dollars)
TABLEAU 192 EUROPE MULTI-MOTEUR DANS LE MARCHÉ DES TABLEAUX ELECTRIQUES LIBREMENT STANDING, PAR AJUSTEMENT SPEED, 2018-2032 (MILLIERS DE USD)
TABLEAU 193 EUROPE MULTI-MOTEUR DANS LE MARCHÉ DES TABLEAUX ELECTRIQUES STANDING LIBRE, PAR INTERFACE DE CONTRÔLE, 2018-2032 (MILLIERS DE USD)
TABLEAU 194 EUROPE STANDING LIBRE MARCHÉ DES TABLEAUX ELECTRIQUES AJUSTABLES, PAR MATÉRIEL, 2018-2032
TABLEAU 195 EUROPE MÉTAL DANS LE MARCHÉ DES TABLEAUX ÉLECTRIQUES LIBREMENT STANDING, PAR TYPE, 2018-2032 (en MILLIERS USD)
TABLEAU 196 EUROPE ACIER DANS LE MARCHÉ DES TABLEAUX ELECTRIQUES STANDARD GRATUIT, PAR TYPE, 2018-2032
TABLEAU 197 BIENVENUE DE L'EUROPE DANS LE MARCHÉ DES TABLEAUX ELECTRIQUES STANDING LIBRE, PAR TYPE, 2018-2032 (en MILLE USD)
TABLEAU 198 BOIS DE L'EUROPE ENGINÉE DANS LE MARCHÉ DES TABLEAUX ELECTRIQUES STANDING LIBRE, PAR TYPE, 2018-2032 (en milliers de dollars)
TABLEAU 199 EUROPE BOIS SOLIDES DANS LE MARCHÉ DES TABLEAUX ELECTRIQUES STANDING LIBRE, PAR TYPE, 2018-2032
TABLEAU 200 EUROPE PLASTIQUE/COMPOSITE DANS LE MARCHÉ DES TABLEAUX ÉLECTRIQUES STANDING LIBRE, PAR TYPE, 2018-2032 (en MILLIERS USD)
TABLEAU 201 EUROPE MARCHÉ DES TABLEAUX AJUSTABLES À L'HAUTE ÉLECTRIQUE, PAR APPLICATION, 2018-2032 (en MILLIERS USD)
TABLEAU 202 BUREAUX CORPORATIQUES D'EUROPE DANS LE MARCHÉ DES TABLEAUX ELECTRIQUES STANDING LIBRE, PAR TYPE, 2018-2032 (MILLIERS USD)
TABLEAU 203 EUROPE RESIDENTIEL DANS LE MARCHÉ DES TABLEAUX ELECTRIQUES LIBREMENT STANDING, PAR TYPE, 2018-2032 (en milliers de dollars)
TABLEAU 204 ÉDUCATION DE L'EUROPE DANS LE MARCHÉ DES TABLEAUX ELECTRIQUES STANDING LIBRE, PAR TYPE, 2018-2032 (en MILLIERS USD)
TABLEAU 205 SANTE DE L'EUROPE DANS LE MARCHÉ DES TABLEAUX ELECTRIQUES STANDING LIBRE, PAR TYPE, 2018-2032 (en milliers de dollars)
TABLEAU 206 EUROPE MARCHÉ DES TABLEAUX ELECTRIQUES AJUSTABLES, PAR UTILISATEUR DE FIN, 2018-2033 (MILLIERS USD)
TABLEAU 207 EUROPE GRANDE STANDING ELECTRICAL TABLEAUX AJUSTABLES MARCHÉ, PAR CHANEAU DE DISTRIBUTION, 2018-2033 (en milliers de dollars)
TABLEAU 208 EUROPE STANDING LIBRE MARCHÉ DES TABLEAUX ELECTRIQUES AJUSTABLES, PAR CHANEAU DE DISTRIBUTION, 2018-2033
TABLEAU 209 EUROPE VENTES INDIRECTES DANS LE MARCHÉ DES TABLEAUX ELECTRIQUES STANDING LIBRE, PAR TYPE, 2018-2032 (MILLIERS USD)
TABLEAU 210 ÉTAT DE L'EUROPE DANS LE MARCHÉ DES TABLEAUX ELECTRIQUES STANDING LIBRE, PAR TYPE, 2018-2032
TABLEAU 211 EUROPE E-COMMERCE DANS LE MARCHÉ DES TABLEAUX ELECTRIQUES STANDING LIBRE, PAR TYPE, 2018-2032 (en MILLIERS USD)
TABLEAU 212 MARCHÉ ALLEMAGNE DES TABLEAUX ELECTRIQUES AJUSTABLES DE L'HAUTEUR, PAR FORMULAIRE DE PRODUIT, 2018-2032
TABLEAU 213 MARCHÉ ALLEMAGNE DES TABLEAUX ELECTRIQUES AJUSTABLES DE L'HAUTE, PAR FORMULAIRE DE PRODUIT, 2018-2032 (MILLIERS)
TABLEAU 214 MOTEUR UNIQUE ALLEMAGNE DANS LE MARCHÉ DES TABLEAUX ELECTRIQUES STANDARD GRATUIT, PAR TYPE DE CADRE, 2018-2032
TABLEAU 215 MOTEUR UNIQUE ALLEMAGNE DANS LE MARCHÉ DES TABLEAUX ELECTRIQUES PERMANENT LIBREMENT AJUSTABLES, PAR AJUSTEMENT SPEED, 2018-2032 (en MILLEUR USD)
TABLEAU 216 MOTEUR UNIQUE ALLEMAGNE DANS LE MARCHÉ DES TABLEAUX AJUSTABLES ELECTRIQUES STANDARD GRATUIT, PAR INTERFACE DE CONTRÔLE, 2018-2032
TABLEAU 217 DUAL MOTEUR ALLEMAGNE DANS LE MARCHÉ DES TABLEAUX ELECTRIQUES STANDING LIBRE, PAR TYPE DE CADRE, 2018-2032 (MILLIERS DE USD)
TABLEAU 218 DUAL MOTEUR ALLEMAGNE DANS LE MARCHÉ DES TABLEAUX ELECTRIQUES AJUSTABLES LIBREMENT STANDARD, PAR AJUSTEMENT SPEED, 2018-2032 (en MILLEUR DE USD)
TABLEAU 219 DUAL MOTEUR ALLEMAGNE DANS LE MARCHÉ DES TABLEAUX ELECTRIQUES STANDING LIBRE, PAR INTERFACE DE CONTRÔLE, 2018-2032 (en MILLE USD)
TABLEAU 220 ALLEMAGNE MULTI-MOTEUR DANS LE MARCHÉ DES TABLEAUX ELECTRIQUES STANDING LIBRE, PAR TYPE DE CADRE, 2018-2032 (MILLIERS DE USD)
TABLEAU 221 ALLEMAGNE MULTI-MOTEUR DANS LE MARCHÉ DES TABLEAUX ELECTRIQUES STANDING LIBRE, PAR AJUSTEMENT SPEED, 2018-2032 (MILLIERS DE USD)
TABLEAU 222 ALLEMAGNE MULTI-MOTEUR DANS LE MARCHÉ DES TABLEAUX ELECTRIQUES STANDING LIBRE, PAR INTERFACE DE CONTRÔLE, 2018-2032 (en MILLIERS USD)
TABLEAU 223 MARCHÉ ALLEMAGNE DES TABLEAUX ELECTRIQUES AJUSTABLES, PAR MATÉRIEL, 2018-2032
TABLEAU 224 MÉTAUX ALLEMAGNES DANS LE MARCHÉ DES TABLEAUX ELECTRIQUES STANDING LIBRE, PAR TYPE, 2018-2032 (en milliers de dollars)
TABLEAU 225 ACIER ALLEMAGNE DANS LE MARCHÉ DES TABLEAUX ELECTRIQUES STANDING GRATUIT, PAR TYPE, 2018-2032
TABLEAU 226 BOIS ALLEMAGNE DANS LE MARCHÉ DES TABLEAUX ELECTRIQUES STANDING GRATUIT, PAR TYPE, 2018-2032
TABLEAU 227 BOIS GÉNÉRÉES ALLEMAGNES DANS LE MARCHÉ DES TABLEAUX AJUSTABLES ÉLECTRIQUES STANDARD GRATUIT, PAR TYPE, 2018-2032
TABLEAU 228 BOIS SOLIDE D'ALLEMAGNE DANS LE MARCHÉ DES TABLEAUX AJUSTABLES DE L'HAUTEUR LIBRE STANDARD, PAR TYPE, 2018-2032 (MILLIERS USD)
TABLEAU 229 PLASTIQUE ALLEMAGNE/COMPOSITE DANS LE MARCHÉ DES TABLEAUX ELECTRIQUES STANDARD GRATUIT, PAR TYPE, 2018-2032 (en milliers de dollars)
TABLEAU 230 MARCHÉ ALLEMAGNE DES TABLEAUX ELECTRIQUES AJUSTABLES, PAR DEMANDE, 2018-2032
TABLEAU 231 BUREAUX DU CORPORAT DE L'ALLEMAGNE DANS LE MARCHÉ DES TABLEAUX AJUSTABLES À L'HAUTE ÉLECTRIQUE, PAR TYPE, 2018-2032 (en MILLEUR)
TABLEAU 232 RÉSIDENTIEL ALLEMAGNE DANS LE MARCHÉ DES TABLEAUX AJUSTABLES À L'HAUTE LIBRE STANDING, PAR TYPE, 2018-2032 (en MILLEUR)
TABLEAU 233 ÉDUCATION ALLEMAGNE DANS LE MARCHÉ DES TABLEAUX ELECTRIQUES STANDING LIBRE, PAR TYPE, 2018-2032 (en milliers de dollars É.-U.)
TABLEAU 234 BIEN-ÊTRE ALLEMAGNE DANS LE MARCHÉ DES TABLEAUX ELECTRIQUES STANDING LIBRE, PAR TYPE, 2018-2032
TABLEAU 235 MARCHÉ ALLEMAGNE DES TABLEAUX ELECTRIQUES AJUSTABLES, PAR UTILISATEUR, 2018-2033
TABLEAU 236 MARCHÉ ALLEMAGNE DES TABLEAUX AJUSTABLES DE L'HAUTEUR AJUSTABLE, PAR CHANEAU DE DISTRIBUTION, 2018-2033 (en milliers de dollars)
TABLEAU 237 MARCHÉ ALLEMAGNE DES TABLEAUX ELECTRIQUES AJUSTABLES, PAR CHANEAU DE DISTRIBUTION, 2018-2033
TABLEAU 238 VENTES INDIRECTES ALLEMAGNES DANS LE MARCHÉ DES TABLEAUX ELECTRIQUES STANDING GRATUIT, PAR TYPE, 2018-2032
TABLEAU 239 STOCKS DE STAIL ALLEMAGNE DANS LE MARCHÉ DES TABLEAUX ELECTRIQUES STANDING GRATUIT, PAR TYPE, 2018-2032
TABLEAU 240 ALLEMAGNE E-COMMERCE DANS LE MARCHÉ DES TABLEAUX ELECTRIQUES STANDING LIBRE, PAR TYPE, 2018-2032 (en milliers de dollars)
TABLEAU 241 MARCHÉ DES TABLEAUX ÉLECTRIQUES STANDARDS GRATUITS AU ROYAUME-UNI, PAR FORMULAIRE DE PRODUIT, 2018-2032 (MILLIERS DE USD)
TABLEAU 242 MARCHÉ DES TABLEAUX ÉLECTRIQUES STANDARDS LIBRE AU ROYAUME-UNI, PAR FORMULAIRE DE PRODUIT, 2018-2032
TABLEAU 243 MOTEUR UNIQUE AU ROYAUME-UNI DANS LE MARCHÉ DES TABLEAUX AJUSTABLES ÉLECTRICAUX, PAR TYPE DE CADRE, 2018-2032 (en milliers de dollars É.-U.)
TABLEAU 244 MOTEUR UNIQUE AU ROYAUME-UNI DANS LE MARCHÉ DES TABLEAUX AJUSTABLES ÉLECTRIQUES PERMANENT LIBREMENT, PAR AJUSTEMENT SPEED, 2018-2032 (MILLIERS USD)
TABLEAU 245 MOTEUR UNIQUE AU ROYAUME-UNI DANS LE MARCHÉ DES TABLEAUX ELECTRIQUES À AJUSTABLE, PAR INTERFACE DE CONTRÔLE, 2018-2032
TABLEAU 246 MOTEUR DUAL AU ROYAUME-UNI DANS LE MARCHÉ DES TABLEAUX AJUSTABLES ÉLECTRIQUES PERMANENT LIBRE, PAR TYPE DE CADRE, 2018-2032 (en milliers de dollars)
TABLEAU 247 MOTEUR DUAL DU ROYAUME-UNI DANS LE MARCHÉ DES TABLEAUX ELECTRIQUES PERMANENT LIBREMENT AJUSTABLES, PAR AJUSTEMENT SPEED, 2018-2032 (en MILLEUR DE USD)
TABLEAU 248 MOTEUR DUAL DU ROYAUME-UNI DANS LE MARCHÉ DES TABLEAUX ELECTRIQUES AJUSTABLES LIBREMENT STANDING, PAR INTERFACE DE CONTRÔLE, 2018-2032
TABLEAU 249 U.K. MULTI-MOTEUR DANS LE MARCHÉ DES TABLEAUX ÉLECTRIQUES STANDARD GRATUIT, PAR TYPE DE CADRE, 2018-2032 (en MILLEUR)
TABLEAU 250 U.K. MULTI-MOTEUR DANS LE MARCHÉ DES TABLEAUX ÉLECTRIQUES À AJUSTABLES LIBREMENT STANDING, PAR AJUSTEMENT SPEED, 2018-2032 (en MILLEUR)
TABLEAU 251 U.K. MULTI-MOTEUR DANS LE MARCHÉ DES TABLEAUX ELECTRIQUES LIBREMENT STANDING, PAR INTERFACE DE CONTRÔLE, 2018-2032 (MILLIERS DE USD)
TABLEAU 252 MARCHÉ DES TABLEAUX AJUSTABLES DE L'HAUTEUR ÉLECTRIQUE, PAR MATÉRIEL, 2018-2032 (en milliers de dollars)
TABLEAU 253 MÉTAUX DU ROYAUME-UNI DANS LE MARCHÉ DES TABLEAUX ELECTRIQUES STANDING LIBRE, PAR TYPE, 2018-2032 (en milliers de dollars)
TABLEAU 254 ACIER DU ROYAUME-UNI DANS LE MARCHÉ DES TABLEAUX AJUSTABLES À L'HAUTEUR LIBRE STANDING, PAR TYPE, 2018-2032
TABLEAU 255 BOIS DU ROYAUME-UNI DANS LE MARCHÉ DES TABLEAUX ELECTRIQUES STANDING GRATUIT, PAR TYPE, 2018-2032
TABLEAU 256 BOIS ENGINÉES AU ROYAUME-UNI DANS LE MARCHÉ DES TABLEAUX AJUSTABLES ÉLECTRIQUES PERMANENTES, PAR TYPE, 2018-2032 (en milliers de dollars)
TABLEAU 257 BOIS SOLIDES DU ROYAUME-UNI DANS LE MARCHÉ DES TABLEAUX ELECTRIQUES STANDARDS LIBRE, PAR TYPE, 2018-2032 (en milliers de dollars)
TABLEAU 258 PLASTIQUE/COMPOSITE U.K. DANS LE MARCHÉ DES TABLEAUX AJUSTABLES À L'HAUTE ÉLECTRIQUE LIBRE, PAR TYPE, 2018-2032 (en milliers de dollars)
TABLEAU 259 MARCHÉ DES TABLEAUX AJUSTABLES À L'HAUTE ÉLECTRIQUE, PAR APPLICATION, 2018-2032 (en MILLE USD)
TABLEAU 260 BUREAUX DU CORPORAT AU ROYAUME-UNI DANS LE MARCHÉ DES TABLEAUX AJUSTABLES À L'HAUTE ÉLECTRIQUE, PAR TYPE, 2018-2032
TABLEAU 261 RÉSIDENTIEL AU ROYAUME-UNI DANS LE MARCHÉ DES TABLEAUX AJUSTABLES À L'HAUTE LIBRE STANDING, PAR TYPE, 2018-2032
TABLEAU 262 ÉDUCATION AU ROYAUME-UNI DANS LE MARCHÉ DES TABLEAUX ELECTRIQUES STANDING LIBRE, PAR TYPE, 2018-2032 (MILLIERS USD)
TABLEAU 263 BIEN-ÊTRE DU ROYAUME-UNI DANS LE MARCHÉ DES TABLEAUX ÉLECTRIQUES STANDARD GRATUIT, PAR TYPE, 2018-2032 (en milliers de dollars É.-U.)
TABLEAU 264 MARCHÉ DES TABLEAUX ÉLECTRIQUES AJUSTABLES, PAR UTILISATEUR, 2018-2033
TABLEAU 265 MARCHÉ DES TABLEAUX AJUSTABLES DE L'HAUTEUR ÉLECTRIQUE, PAR CHANEAU DE DISTRIBUTION, 2018-2033
TABLEAU 266 MARCHÉ DES TABLEAUX ELECTRIQUES AJUSTABLES, PAR CHANEAU DE DISTRIBUTION, 2018-2033
TABLEAU 267 VENTES INDIRECTES AU ROYAUME-UNI DANS LE MARCHÉ DES TABLEAUX ELECTRIQUES STANDING LIBRE, PAR TYPE, 2018-2032 (MILLIERS DE USD)
TABLEAU 268 STOCKS DE STAIL AU ROYAUME-UNI DANS LE MARCHÉ DES TABLEAUX AJUSTABLES ÉLECTRIQUES PERMANENT GRATUITEMENT, PAR TYPE, 2018-2032 (en millions de dollars)
TABLEAU 269 U.K. E-COMMERCE DANS LE MARCHÉ DES TABLEAUX AJUSTABLES DE HAUTE ÉLECTRIQUE LIBRE STANDING, PAR TYPE, 2018-2032
TABLEAU 270 FRANCE STANDING LIBRE MARCHÉ DES TABLEAUX ELECTRIQUES AJUSTABLES, PAR FORMULAIRE DE PRODUIT, 2018-2032 (MILLIERS USD)
TABLEAU 271 FRANCE MARCHÉ DES TABLEAUX ÉLECTRIQUES AJUSTABLES, PAR FORMULAIRE DE PRODUIT, 2018-2032
TABLEAU 272 FRANCE MOTEUR UNIQUE DANS LE MARCHÉ DES TABLEAUX ÉLECTRIQUES STANDING LIBRE, PAR TYPE DE CADRE, 2018-2032 (MILLIERS DE USD)
TABLEAU 273 FRANCE UNIQUE MOTEUR DANS LE MARCHÉ DES TABLEAUX AJUSTABLES ÉLECTRIQUES STANDARD GRATUIT, PAR AJUSTEMENT SPEED, 2018-2032 (en MILLEUR DE USD)
TABLEAU 274 FRANCE MOTEUR UNIQUE DANS LE MARCHÉ DES TABLEAUX ELECTRIQUES STANDING LIBRE, PAR INTERFACE DE CONTRÔLE, 2018-2032
TABLEAU 275 FRANCE DUAL MOTOR DANS LE MARCHÉ DES TABLEAUX ELECTRIQUES STANDING LIBRE, PAR TYPE DE CADRE, 2018-2032 (MILLIERS DE USD)
TABLEAU 276 FRANCE DUAL MOTOR DANS LE MARCHÉ DES TABLEAUX ELECTRIQUES LIBREMENT STANDING, PAR AJUSTEMENT SPEED, 2018-2032 (en MILLIERS USD)
TABLEAU 277 FRANCE DUAL MOTOR DANS LE MARCHÉ DES TABLEAUX ELECTRIQUES AJUSTABLES LIBREMENT STANDARD, PAR INTERFACE DE CONTRÔLE, 2018-2032 (en MILLEUR)
TABLEAU 278 FRANCE MULTI-MOTEUR DANS LE MARCHÉ DES TABLEAUX ELECTRIQUES STANDING LIBRE, PAR TYPE DE CADRE, 2018-2032 (MILLIERS DE USD)
TABLEAU 279 FRANCE MULTI-MOTEUR DANS LE MARCHÉ DES TABLEAUX ELECTRIQUES STANDING LIBRE, PAR AJUSTEMENT PRÉVUE, 2018-2032 (en MILLIERS USD)
TABLEAU 280 FRANCE MULTI-MOTEUR DANS LE MARCHÉ DES TABLEAUX ELECTRIQUES LIBREMENT STANDING, PAR INTERFACE DE CONTRÔLE, 2018-2032 (MILLIERS DE USD)
TABLEAU 281 FRANCE STANDING LIBRE MARCHÉ DES TABLEAUX ELECTRIQUES AJUSTABLES, PAR MATÉRIEL, 2018-2032
TABLEAU 282 FRANCE MÉTAL DANS LE MARCHÉ DES TABLEAUX ELECTRIQUES STANDING LIBRE, PAR TYPE, 2018-2032 (en milliers de dollars)
TABLEAU 283 FRANCE ACIER DANS LE MARCHÉ DES TABLEAUX ELECTRIQUES STANDARD GRATUIT, PAR TYPE, 2018-2032
TABLEAU 284 BOIS DE FRANCE DANS LE MARCHÉ DES TABLEAUX ELECTRIQUES STANDING LIBRE, PAR TYPE, 2018-2032 (en milliers de dollars)
TABLEAU 285 FRANCE ENGINEERED WOOD EN STANDING LIBRE MARCHÉ DES TABLEAUX ELECTRIQUES AJUSTABLES, PAR TYPE, 2018-2032
TABLEAU 286 FRANCE BOIS SOLIDES DANS LE MARCHÉ DES TABLEAUX ELECTRIQUES STANDING LIBRE, PAR TYPE, 2018-2032 (en MILLIERS USD)
TABLEAU 287 FRANCE PLASTIQUE/COMPOSITE DANS LE MARCHÉ DES TABLEAUX ÉLECTRIQUES STANDARD GRATUIT, PAR TYPE, 2018-2032 (en MILLIERS USD)
TABLEAU 288 FRANCE STANDING LIBRE MARCHÉ DES TABLEAUX AJUSTABLES DE HAUTE ÉLECTRIQUE, PAR APPLICATION, 2018-2032 (MILLIERS USD)
TABLEAU 289 FRANCE BUREAUX CORPORATIQUES DANS LE MARCHÉ DES TABLEAUX ELECTRIQUES STANDING LIBRE, PAR TYPE, 2018-2032 (MILLIERS USD)
TABLEAU 290 FRANCE RESIDENTIEL DANS LE MARCHÉ DES TABLEAUX ELECTRIQUES STANDING LIBRE, PAR TYPE, 2018-2032 (en milliers de dollars)
TABLEAU 291 FRANCE ÉDUCATION DANS LE MARCHÉ DES TABLEAUX ELECTRIQUES STANDING LIBRE, PAR TYPE, 2018-2032
TABLEAU 292 FRANCE SANTÉ DANS LE MARCHÉ DES TABLEAUX ELECTRIQUES STANDING LIBRE, PAR TYPE, 2018-2032 (en MILLIERS USD)
TABLEAU 293 FRANCE MARCHÉ DES TABLEAUX AJUSTABLES À L'HAUTE ÉLECTRIQUE, PAR UTILISATEUR DE FIN 2018-2033
TABLEAU 294 FRANCE STANDING LIBRE MARCHÉ DES TABLEAUX ELECTRIQUES AJUSTABLES, PAR CHANEAU DE DISTRIBUTION, 2018-2033
TABLEAU 295 FRANCE STANDING LIBRE MARCHÉ DES TABLEAUX ELECTRIQUES AJUSTABLES, PAR CHANEAU DE DISTRIBUTION, 2018-2033
TABLEAU 296 FRANCE VENTES INDIRECTES DANS LE MARCHÉ DES TABLEAUX ELECTRIQUES STANDING GRATUIT, PAR TYPE, 2018-2032 (MILLIERS USD)
TABLEAU 297 ÉTAT DE FRANCE DANS LE MARCHÉ DES TABLEAUX ELECTRIQUES STANDING LIBRE, PAR TYPE, 2018-2032
TABLEAU 298 FRANCE E-COMMERCE DANS LE MARCHÉ DES TABLEAUX ÉLECTRIQUES STANDING LIBRE, PAR TYPE, 2018-2032 (MILLIERS USD)
TABLEAU 299 PAR FORMULAIRE DE PRODUCTION, 2018-2032 (en MILLE USD)
TABLEAU 300 PAR FORMULAIRE DE PRODUCTION, 2018-2032 (milliers d'unités)
TABLEAU 301 MOTEUR ITALIE UNIQUE DANS LE MARCHÉ DES TABLEAUX ELECTRIQUES STANDING LIBRE, PAR TYPE DE CADRE, 2018-2032
TABLEAU 302 MOTEUR ITALIE UNIQUE DANS LE MARCHÉ DES TABLEAUX AJUSTABLES ÉLECTRIQUES STANDARD LIBRE, PAR AJUSTEMENT SPEED, 2018-2032 (en MILLEUR DE USD)
TABLEAU 303 MOTEUR ITALIE UNIQUE DANS LE MARCHÉ DES TABLEAUX AJUSTABLES ÉLECTRIQUES LIBREMENT STANDARD, PAR INTERFACE DE CONTRÔLE, 2018-2032 (en MILLE USD)
TABLEAU 304 MOTEUR DUAL ITALIE DANS LE MARCHÉ DES TABLEAUX ÉLECTRIQUES STANDING LIBRE, PAR TYPE DE CADRE, 2018-2032 (MILLIERS DE USD)
TABLEAU 305 ITALIE DUAL MOTOR DANS LE MARCHÉ DES TABLEAUX ELECTRIQUES LIBREMENT STANDING, PAR AJUSTEMENT SPEED, 2018-2032 (MILLIERS DE USD)
TABLEAU 306 ITALIE DUAL MOTOR DANS LE MARCHÉ DES TABLEAUX ELECTRIQUES LIBREMENT STANDING, PAR INTERFACE DE CONTRÔLE, 2018-2032 (MILLIERS DE USD)
TABLEAU 307 ITALIE MULTI-MOTEUR DANS LE MARCHÉ DES TABLEAUX ÉLECTRIQUES PERMANENT LIBREMENT, PAR TYPE DE CADRE, 2018-2032 (MILLIERS DE USD)
TABLEAU 308 ITALIE MULTI-MOTEUR DANS LE MARCHÉ DES TABLEAUX ELECTRIQUES STANDING LIBRE, PAR AJUSTEMENT SPEED, 2018-2032 (MILLIERS DE USD)
TABLEAU 309 ITALIE MULTI-MOTEUR DANS LE MARCHÉ DES TABLEAUX ELECTRIQUES LIBREMENT STANDING, PAR INTERFACE DE CONTRÔLE, 2018-2032 (en MILLEUR DE USD)
TABLEAU 310 MARCHÉ DES TABLEAUX AJUSTABLES DE L'HAUTEUR ÉLECTRIQUE, PAR MATÉRIEL, 2018-2032
TABLEAU 311 ITALIE MÉTAL DANS LE MARCHÉ DES TABLEAUX ELECTRIQUES STANDING LIBRE, PAR TYPE, 2018-2032 (en MILLIERS USD)
TABLEAU 312 ITALIE DE L'ACIER DANS LE MARCHÉ DES TABLEAUX ELECTRIQUES STANDING GRATUIT, PAR TYPE, 2018-2032
TABLEAU 313 BIENVENUE ITALIE DANS LE MARCHÉ DES TABLEAUX AJUSTABLES À L'HAUTE ÉLECTRIQUE LIBRE STANDING, PAR TYPE, 2018-2032
TABLEAU 314 BOIS LIBREMENT ENGINÉES DANS LE MARCHÉ DES TABLEAUX AJUSTABLES ÉLECTRIQUES, PAR TYPE, 2018-2032
TABLEAU 315 BOIS DE SOLIDE ITALIE DANS LE MARCHÉ DES TABLEAUX AJUSTABLES ÉLECTRIQUES STANDARD LIBRE, PAR TYPE, 2018-2032 (MILLIERS DE USD)
TABLEAU 316 ITALIE PLASTIQUE/COMPOSITE DANS LE MARCHÉ DES TABLEAUX ELECTRIQUES STANDARD GRATUIT, PAR TYPE, 2018-2032
TABLEAU 317 MARCHÉ DES TABLEAUX AJUSTABLES À L'HAUTE ÉLECTRIQUE, PAR APPLICATION, 2018-2032 (en MILLE USD)
TABLEAU 318 BUREAUX DE CORPORATION ITALIE DANS LE MARCHÉ DES TABLEAUX ELECTRIQUES PERMANENT GRATUITEMENT, PAR TYPE, 2018-2032 (MILLIERS USD)
TABLEAU 319 RÉSIDENTIEL ITALIE DANS LE MARCHÉ DES TABLEAUX ELECTRIQUES STANDING GRATUIT, PAR TYPE, 2018-2032
TABLEAU 320 ÉDUCATION ITALIE DANS LE MARCHÉ DES TABLEAUX ELECTRIQUES STANDING LIBRE, PAR TYPE, 2018-2032 (en milliers de dollars)
TABLEAU 321 PAR TYPE, 2018-2032 (en milliers de dollars É.-U.)
TABLEAU 322 MARCHÉ DES TABLEAUX AJUSTABLES DE L'HAUTE ÉLECTRIQUE, PAR UTILISATEUR DE FIN, 2018-2033 (en millions de dollars)
TABLEAU 323 PAR CHANEAU DE DISTRIBUTION, 2018-2033 (MILLIERS DE DOLLARS)
TABLEAU 324 PAR CHANEAU DE DISTRIBUTION, 2018-2033
TABLEAU 325 SOLDES INDIRECTES INDIRECTES PAR TYPE DE MARCHÉ DES TABLEAUX ELECTRIQUES STANDING LIBRE, PAR TYPE, 2018-2032 (MILLIERS USD)
TABLEAU 326 STOCKAGE ITALIE DANS LE MARCHÉ DES TABLEAUX ÉLECTRIQUES STANDARD GRATUIT, PAR TYPE, 2018-2032
TABLEAU 327 ITALIE E-COMMERCE DANS LE MARCHÉ DES TABLEAUX ELECTRIQUES STANDING LIBRE, PAR TYPE, 2018-2032 (en milliers de dollars)
TABLEAU 328 STANDINAVIE LIBRE STANDING TABLEAUX ELECTRIQUES AJUSTABLES MARCHÉ, PAR FORMULAIRE DE PRODUIT, 2018-2032 (en MILLIERS USD)
TABLEAU 329 STANDINAVIA STANDING LIBRE MARCHÉ DES TABLEAUX ELECTRIQUES AJUSTABLES, PAR FORMULAIRE DE PRODUIT, 2018-2032
TABLEAU 330 SCANDINAVIA MOTEUR UNIQUE DANS LE MARCHÉ DES TABLEAUX AJUSTABLES ÉLECTRIQUES STANDARD LIBRE, PAR TYPE DE CADRE, 2018-2032 (en milliers de dollars)
TABLEAU 331 SCANDINAVIA MOTEUR UNIQUE DANS LE MARCHÉ DES TABLEAUX AJUSTABLES ÉLECTRIQUES STANDARD LIBRE, PAR AJUSTEMENT PRÉVUE, 2018-2032 (en MILLEUR)
TABLEAU 332 SCANDINAVIA MOTEUR UNIQUE DANS LE MARCHÉ DES TABLEAUX AJUSTABLES ÉLECTRIQUES PERMANENT LIBRE, PAR INTERFACE DE CONTRÔLE, 2018-2032 (en MILLEUR USD)
TABLEAU 333 SCANDINAVIA DUAL MOTOR DANS LE MARCHÉ DES TABLEAUX ÉLECTRIQUES STANDARD GRATUIT, PAR TYPE DE CADRE, 2018-2032
TABLEAU 334 SCANDINAVIA DUAL MOTOR DANS LE MARCHÉ DES TABLEAUX ÉLECTRIQUES PERMANENT LIBREMENT AJUSTABLES, PAR AJUSTEMENT SPEED, 2018-2032
TABLEAU 335 SCANDINAVIA DUAL MOTOR DANS LE MARCHÉ DES TABLEAUX ÉLECTRIQUES PERMANENTES, PAR INTERFACE DE CONTRÔLE, 2018-2032 (en MILLEUR DE USD)
TABLEAU 336 SCANDINAVIA MULTI-MOTEUR DANS LE MARCHÉ DES TABLEAUX ELECTRIQUES PERMANENTES, PAR TYPE DE CADRE, 2018-2032
TABLEAU 337 SCANDINAVIA MULTI-MOTEUR DANS LE MARCHÉ DES TABLEAUX AJUSTABLES ÉLECTRIQUES PERMANENT LIBRE, PAR AJUSTEMENT SPEED, 2018-2032 (en MILLEUR)
TABLEAU 338 SCANDINAVIA MULTI-MOTEUR DANS LE MARCHÉ DES TABLEAUX ÉLECTRIQUES STANDARD GRATUIT, PAR INTERFACE DE CONTRÔLE, 2018-2032 (en MILLEUR)
TABLEAU 339 STANDINAVIA LIBRE STANDING ÉLECTRIQUE TABLEAUX AJUSTABLES, PAR MATÉRIEL, 2018-2032 (en MILLIERS USD)
TABLEAU 340 MÉTAUX SCANDINAVIES DANS LE MARCHÉ DES TABLEAUX ELECTRIQUES STANDING LIBRE, PAR TYPE, 2018-2032
TABLEAU 341 ACIER SCANDINAVIA DANS LE MARCHÉ DES TABLEAUX ÉLECTRIQUES STANDARD GRATUIT, PAR TYPE, 2018-2032
TABLEAU 342 BOIS SCANDINAVIA DANS LE MARCHÉ DES TABLEAUX AJUSTABLES À L'HAUTEUR LIBRE STANDARD, PAR TYPE, 2018-2032 (en MILLIERS USD)
TABLEAU 343 BOIS ENGINÉES SCANDINAVIA DANS LE MARCHÉ DES TABLEAUX ÉLECTRIQUES STANDARDS, PAR TYPE, 2018-2032 (en MILLE USD)
TABLEAU 344 BOIS SOLIDE DE SCANDINAVIA DANS LE MARCHÉ DES TABLEAUX AJUSTABLES ÉLECTRIQUES STANDARD LIBRE, PAR TYPE, 2018-2032 (en MILLEUR)
TABLEAU 345 SCANDINAVIA PLASTIQUE/COMPOSITE DANS LE MARCHÉ DES TABLEAUX ELECTRIQUES STANDARD GRATUIT, PAR TYPE, 2018-2032
TABLEAU 346 STANDINAVIE LIBRE STANDING MARCHÉ DES TABLEAUX ELECTRIQUES AJUSTABLES, PAR DEMANDE, 2018-2032 (MILLIERS DE USD)
TABLEAU 347 BUREAUX CORPORATIQUES DE SCANDINAVIE DANS LE MARCHÉ DES TABLEAUX ELECTRIQUES PERMANENTES, PAR TYPE, 2018-2032 (MILLIERS DE USD)
TABLEAU 348 RÉSIDENTIEL DE SCANDINAVIE DANS LE MARCHÉ DES TABLEAUX AJUSTABLES À L'HAUTE ÉLECTRIQUE PERMANENTE, PAR TYPE, 2018-2032 (en milliers de dollars)
TABLEAU 349 ÉDUCATION SCANDINAVIE DANS LE MARCHÉ DES TABLEAUX AJUSTABLES À L'HAUTE ÉLECTRIQUE LIBRE STANDING, PAR TYPE, 2018-2032
TABLEAU 350 BIEN-ÊTRE SCANDINAVIA DANS LE MARCHÉ DES TABLEAUX AJUSTABLES À LA HAUTE ÉLECTRIQUE PERMANENTE, PAR TYPE, 2018-2032 (en milliers de dollars)
TABLEAU 351 STANDINAVIE LIBRE STANDING LE MARCHÉ DES TABLEAUX ELECTRIQUES AJUSTABLES, PAR UTILISATEUR DE FIN, 2018-2033 (MILLIERS DE USD)
TABLEAU 352 STANDINAVIE LIBRE STANDING ÉLECTRIQUE TABLEAUX AJUSTABLES, PAR CHANEAU DE DISTRIBUTION, 2018-2033 (en MILLIERS DE USD)
TABLEAU 353 PAR CHANEAU DE DISTRIBUTION, 2018-2033
TABLEAU 354 VENTES INDIRECTES DE SCANDINAVIE DANS LE MARCHÉ DES TABLEAUX ELECTRIQUES STANDARDS, PAR TYPE, 2018-2032 (MILLIERS DE USD)
TABLEAU 355 STOCKS DE DÉTAILLAGE SCANDINAVIA DANS LE MARCHÉ DES TABLEAUX ÉLECTRIQUES STANDARD GRATUIT, PAR TYPE, 2018-2032 (en milliers de dollars)
TABLEAU 356 E-COMMERCE SCANDINAVIA DANS LE MARCHÉ DES TABLEAUX AJUSTABLES ÉLECTRIQUES STANDARD LIBRE, PAR TYPE, 2018-2032 (MILLIERS DE USD)
TABLEAU 357 BENELUX MARCHÉ DES TABLEAUX ELECTRIQUES AJUSTABLES, PAR FORMULAIRE DE PRODUIT, 2018-2032 (MILLIERS USD)
TABLEAU 358 BENELUX MARCHÉ DES TABLEAUX AJUSTABLES À L'HAUTE ÉLECTRIQUE STANDARD GRATUIT, PAR FORMULAIRE DE PRODUIT, 2018-2032 (milliers d'unités)
TABLEAU 359 BENELUX SINGLE MOTOR DANS LE MARCHÉ DES TABLEAUX ELECTRIQUES STANDING LIBRE, PAR TYPE DE CADRE, 2018-2032 (MILLIERS DE USD)
TABLEAU 360 BENELUX SINGLE MOTOR DANS LE MARCHÉ DES TABLEAUX ELECTRIQUES STANDING LIBRE, PAR AJUSTEMENT SPEED, 2018-2032 (MILLIERS DE USD)
TABLEAU 361 BENELUX SINGLE MOTOR DANS LE MARCHÉ DES TABLEAUX ELECTRIQUES STANDING GRATUIT, PAR INTERFACE DE CONTRÔLE, 2018-2032
TABLEAU 362 BENELUX DUAL MOTOR DANS LE MARCHÉ DES TABLEAUX ELECTRIQUES STANDING GRATUIT, PAR TYPE DE CADRE, 2018-2032
TABLEAU 363 BENELUX DUAL MOTOR DANS LE MARCHÉ DES TABLEAUX AJUSTABLES ELECTRIQUES PERMANENTES LIBREMENT, PAR AJUSTEMENT SPEED, 2018-2032 (MILLIERS USD)
TABLEAU 364 BENELUX DUAL MOTOR DANS LE MARCHÉ DES TABLEAUX ELECTRIQUES STANDING GRATUIT, PAR INTERFACE DE CONTRÔLE, 2018-2032
TABLEAU 365 BENELUX MULTI-MOTEUR DANS LE MARCHÉ DES TABLEAUX ELECTRIQUES STANDING LIBRE, PAR TYPE DE CADRE, 2018-2032 (MILLIERS DE USD)
TABLEAU 366 BENELUX MULTI-MOTEUR DANS LE MARCHÉ DES TABLEAUX ELECTRIQUES PERSONNELS, PAR AJUSTEMENT PRÉVUE, 2018-2032 (en MILLEUR)
TABLEAU 367 BENELUX MULTI-MOTEUR DANS LE MARCHÉ DES TABLEAUX ELECTRIQUES STANDING LIBRE, PAR INTERFACE DE CONTRÔLE, 2018-2032 (MILLIERS DE USD)
TABLEAU 368 BENELUX MARCHÉ DES TABLEAUX ÉLECTRIQUES AJUSTABLES, PAR MATÉRIEL, 2018-2032
TABLEAU 369 MÉTAUX DE BENELUX DANS LE MARCHÉ DES TABLEAUX ELECTRIQUES STANDING LIBRE, PAR TYPE, 2018-2032 (en MILLIERS USD)
TABLEAU 370 BENELUX ACIER DANS LE MARCHÉ DES TABLEAUX ELECTRIQUES STANDING LIBRE, PAR TYPE, 2018-2032 (en milliers de dollars)
TABLEAU 371 BIENLUX BOIS DANS LE MARCHÉ DES TABLEAUX ELECTRIQUES STANDING LIBRE, PAR TYPE, 2018-2032 (en MILLIERS DE USD)
TABLEAU 372 BENELUX ENGINEERED WOOD DANS LE MARCHÉ DES TABLEAUX ELECTRIQUES STANDING LIBRE, PAR TYPE, 2018-2032 (en MILLE USD)
TABLEAU 373 BOIS SOLIDES BENELUX DANS LE MARCHÉ DES TABLEAUX ELECTRIQUES STANDARD GRATUIT, PAR TYPE, 2018-2032
TABLEAU 374 BENELUX PLASTIQUE/COMPOSITE DANS LE MARCHÉ DES TABLEAUX ÉLECTRIQUES STANDARD GRATUIT, PAR TYPE, 2018-2032 (MILLIERS DE USD)
TABLEAU 375 MARCHÉ DES TABLEAUX AJUSTABLES À L'HAUTE ÉLECTRIQUE, PAR DEMANDE, 2018-2032
TABLEAU 376 BUREAUX CORPORATIQUES DE BENELUX DANS LE MARCHÉ DES TABLEAUX AJUSTABLES ÉLECTRIQUES PERSONNELS, PAR TYPE, 2018-2032 (en milliers de dollars)
TABLEAU 377 BENELUX RESIDENTIEL DANS LE MARCHÉ DES TABLEAUX AJUSTABLES À L'HAUTE LIBRE STANDING, PAR TYPE, 2018-2032 (en millions de dollars)
TABLEAU 378 ÉDUCATION DES BÉNELUX DANS LE MARCHÉ DES TABLEAUX ELECTRIQUES STANDING LIBRE, PAR TYPE, 2018-2032 (en MILLIERS DE USD)
TABLEAU 379 BENELUX SANTÉ DANS LE MARCHÉ DES TABLEAUX AJUSTABLES ÉLECTRIQUES STANDARD GRATUIT, PAR TYPE, 2018-2032
TABLEAU 380 BENELUX MARCHÉ DES TABLEAUX ELECTRIQUES AJUSTABLES À L'ÉTRANGER GRATUITEMENT, PAR UTILISATEUR EN FIN, 2018-2033 (MILLIERS USD)
TABLEAU 381 BENELUX LIBRE STANDING MARCHÉ DES TABLEAUX ELECTRIQUES AJUSTABLES, PAR CHANEAU DE DISTRIBUTION, 2018-2033
TABLEAU 382 BENELUX LIBRE STANDING MARCHÉ DES TABLEAUX ELECTRIQUES AJUSTABLES, PAR CHANEAU DE DISTRIBUTION, 2018-2033
TABLEAU 383 BENELUX INDIRECT SOLDES DANS LE MARCHÉ DES TABLEAUX ELECTRIQUES STANDING GRATUIT, PAR TYPE, 2018-2032
TABLEAU 384 STOCKS DE DÉTAILLAGE DES BENELUX DANS LE MARCHÉ DES TABLEAUX ELECTRIQUES STANDING GRATUIT, PAR TYPE, 2018-2032
TABLEAU 385 BENELUX E-COMMERCE DANS LE MARCHÉ DES TABLEAUX ELECTRIQUES STANDING LIBRE, PAR TYPE, 2018-2032 (en milliers de dollars)
TABLEAU 386 PAR FORMULAIRE DE PRODUCTION, 2018-2032 (en MILLIERS USD)
TABLEAU 387 PAR FORMULAIRE DE PRODUCTION, 2018-2032 (milliers d'unités)
TABLEAU 388 ESPAGNE À MOTEUR UNIQUE DANS LE MARCHÉ DES TABLEAUX AJUSTABLES ÉLECTRIQUES PERMANENTES, PAR TYPE DE CADRE, 2018-2032 (en MILLOIS USD)
TABLEAU 389 ESPAGNE À MOTEUR UNIQUE DANS LE MARCHÉ DES TABLEAUX AJUSTABLES ÉLECTRIQUES LIBREMENT STANDARD, PAR AJUSTEMENT SPEED, 2018-2032 (en MILLEUR DE USD)
TABLEAU 390 ESPAGNE À MOTEUR UNIQUE DANS LE MARCHÉ DES TABLEAUX ELECTRIQUES LIBREMENT STANDING, PAR INTERFACE DE CONTRÔLE, 2018-2032 (MILLIERS DE USD)
TABLEAU 391 ESPAGNE DUAL MOTOR DANS LE MARCHÉ DES TABLEAUX ELECTRIQUES STANDING LIBRE, PAR TYPE DE CADRE, 2018-2032 (MILLIERS DE USD)
TABLEAU 392 ESPAGNE DUAL MOTOR DANS LE MARCHÉ DES TABLEAUX ELECTRIQUES LIBREMENT STANDING, PAR AJUSTEMENT SPEED, 2018-2032 (MILLIERS DE USD)
TABLEAU 393 ESPAGNE DUAL MOTOR DANS LE MARCHÉ DES TABLEAUX ELECTRIQUES AJUSTABLES LIBREMENT STANDING, PAR INTERFACE DE CONTRÔLE, 2018-2032
TABLEAU 394 ESPAGNE MULTI-MOTEUR DANS LE MARCHÉ DES TABLEAUX ELECTRIQUES STANDING LIBRE, PAR TYPE DE CADRE, 2018-2032 (MILLIERS DE USD)
TABLEAU 395 ESPAGNE MULTI-MOTEUR DANS LE MARCHÉ DES TABLEAUX ELECTRIQUES LIBREMENT STANDING, PAR AJUSTEMENT SPEED, 2018-2032 (en MILLEUR DE USD)
TABLEAU 396 ESPAGNE MULTI-MOTEUR DANS LE MARCHÉ DES TABLEAUX ELECTRIQUES STANDING LIBRE, PAR INTERFACE DE CONTRÔLE, 2018-2032 (en MILLE USD)
TABLEAU 397 ESPAGNE STANDING GRATUIT MARCHÉ DES TABLEAUX ELECTRIQUES AJUSTABLES DE L'HAUTE, PAR MATÉRIEL, 2018-2032
TABLEAU 398 MÉTAL DE L'ESPAGNE DANS LE MARCHÉ DES TABLEAUX ÉLECTRIQUES STANDING LIBRE, PAR TYPE, 2018-2032 (en milliers de dollars)
TABLEAU 399 ACIER D'ESPAGNE DANS LE MARCHÉ DES TABLEAUX ELECTRIQUES STANDING GRATUIT, PAR TYPE, 2018-2032
TABLEAU 400 BOIS D'ESPAGNE DANS LE MARCHÉ DES TABLEAUX ELECTRIQUES STANDING GRATUIT, PAR TYPE, 2018-2032
TABLEAU 401 BOIS ENGINÉES EN ESPAGNE DANS LE MARCHÉ DES TABLEAUX AJUSTABLES À L'HAUTE ÉLECTRIQUE LIBRE, PAR TYPE, 2018-2032 (en MILLEUR)
TABLEAU 402 BOIS SOLIDE D'ESPAGNE DANS LE MARCHÉ DES TABLEAUX ELECTRIQUES STANDING GRATUIT, PAR TYPE, 2018-2032
TABLEAU 403 ESPAGNE PLASTIQUE/COMPOSITE DANS LE MARCHÉ DES TABLEAUX ÉLECTRIQUES STANDARD GRATUIT, PAR TYPE, 2018-2032
TABLEAU 404 ESPAGNE STANDING LIBRE MARCHÉ DES TABLEAUX ELECTRIQUES AJUSTABLES, PAR DEMANDE, 2018-2032 (en MILLE USD)
TABLEAU 405 BUREAUX CORPORATAIRES D'ESPAGNE DANS LE MARCHÉ DES TABLEAUX ELECTRIQUES STANDING LIBRE, PAR TYPE, 2018-2032 (MILLIERS USD)
TABLEAU 406 RÉSIDENTIEL DE L'ESPAGNE DANS LE MARCHÉ DES TABLEAUX AJUSTABLES À L'HAUTEUR LIBRE STANDING, PAR TYPE, 2018-2032 (en MILLEUR)
TABLEAU 407 ÉDUCATION DE L'ESPAGNE DANS LE MARCHÉ DES TABLEAUX ELECTRIQUES STANDING GRATUIT, PAR TYPE, 2018-2032
TABLEAU 408 ESPAGNE SOINS DE SANTÉ DANS LE MARCHÉ DES TABLEAUX ELECTRIQUES STANDING LIBRE, PAR TYPE, 2018-2032 (en milliers de dollars)
TABLEAU 409 PAR UTILISATEUR D'ENTREPRISE, PAR UTILISATEUR D'ENTREPRISE, 2018-2033
TABLEAU 410 ESPAGNE STANDING LIBRE MARCHÉ DES TABLEAUX AJUSTABLES DE HAUTE ÉLECTRIQUE, PAR CHANEAU DE DISTRIBUTION, 2018-2033
TABLEAU 411 ESPAGNE STANDING LIBRE MARCHÉ DES TABLEAUX ELECTRIQUES AJUSTABLES, PAR CHANEAU DE DISTRIBUTION, 2018-2033
TABLEAU 412 VENTES INDIRECTES D'ESPAGNE DANS LE MARCHÉ DES TABLEAUX ELECTRIQUES STANDING GRATUIT, PAR TYPE, 2018-2032 (MILLIERS DE USD)
TABLEAU 413 STOCKS DE DÉTAILLAGE DE L'ESPAGNE DANS LE MARCHÉ DES TABLEAUX ELECTRIQUES PERMANENTES, PAR TYPE, 2018-2032 (en MILLIERS USD)
TABLEAU 414 ESPAGNE E-COMMERCE DANS LE MARCHÉ DES TABLEAUX ELECTRIQUES LIBREMENT STANDING, PAR TYPE, 2018-2032 (MILLIERS USD)
TABLEAU 415 PAYS DE LA CEI MARCHÉ DES TABLEAUX ELECTRIQUES STANDING LIBRE, PAR FORMULAIRE DE PRODUIT, 2018-2032 (en MILLIERS USD)
TABLEAU 416 PAYS DE LA CEI MARCHÉ DES TABLEAUX ÉLECTRIQUES STANDARDS LIBRE, PAR FORMULAIRE DE PRODUIT, 2018-2032 (UNITS DE MÉTHODES)
TABLEAU 417 PAYS DE LA CEI MOTEUR UNIQUE DANS LE MARCHÉ DES TABLEAUX ÉLECTRIQUES STANDARD GRATUIT, PAR TYPE DE CADRE, 2018-2032
TABLEAU 418 PAYS DE LA CEI MOTEUR UNIQUE DANS LE MARCHÉ DES TABLEAUX AJUSTABLES ÉLECTRIQUES PERMANENT LIBRE, PAR AJUSTEMENT SPEED, 2018-2032 (en MILLEUR DE USD)
TABLEAU 419 PAYS DE LA CEI MOTEUR UNIQUE DANS LE MARCHÉ DES TABLEAUX ELECTRIQUES AJUSTABLES LIBREMENT STANDARD, PAR INTERFACE DE CONTRÔLE, 2018-2032
TABLEAU 420 PAYS DE LA CEI DUAL MOTOR DANS LE MARCHÉ DES TABLEAUX ELECTRIQUES STANDING LIBRE, PAR TYPE DE CADRE, 2018-2032 (MILLIERS DE USD)
TABLEAU 421 PAYS DE LA CEI DUAL MOTOR IN STANDING LIBRE STANDING ELECTRICAL HEIGHT-ADJUSTABLE TABLES MARCHANDISES, PAR AJUSTEMENT SPEED, 2018-2032
TABLEAU 422 PAYS DE LA CEI DUAL MOTOR DANS LE MARCHÉ DES TABLEAUX ELECTRIQUES AJUSTABLES LIBREMENT STANDARD, PAR INTERFACE DE CONTRÔLE, 2018-2032
TABLEAU 423 PAYS DE LA CEI MULTI-MOTEUR DANS LE MARCHÉ DES TABLEAUX ELECTRIQUES STANDARDS LIBREMENT AJUSTABLES, PAR TYPE DE CADRE, 2018-2032
TABLEAU 424 PAYS DE LA CEI MULTI-MOTEUR DANS LE MARCHÉ DES TABLEAUX ÉLECTRIQUES STANDARD GRATUIT, PAR AJUSTEMENT PRÉVUE, 2018-2032 (MILLIERS DE USD)
TABLEAU 425 PAYS DE LA CEI MULTI-MOTEUR DANS LE MARCHÉ DES TABLEAUX ELECTRIQUES STANDARDS LIBREMENT AJUSTABLES, PAR INTERFACE DE CONTRÔLE, 2018-2032
TABLEAU 426 PAYS DE LA CEI MARCHÉ DES TABLEAUX ELECTRIQUES AJUSTABLES, PAR MATÉRIEL, 2018-2032
TABLEAU 427 MÉTAUX DES PAYS DE LA CEI DANS LE MARCHÉ DES TABLEAUX ELECTRIQUES STANDING LIBRE, PAR TYPE, 2018-2032 (en milliers de dollars)
TABLEAU 428 ENSEMBLE DES PAYS DE LA CEI DANS LE MARCHÉ DES TABLEAUX ELECTRIQUES STANDING LIBRE, PAR TYPE, 2018-2032 (en milliers de dollars)
TABLEAU 429 PAR TYPE, 2018-2032 (en milliers de dollars)
TABLEAU 430 PAYS DE LA CEI ENGINÉS DANS LE MARCHÉ DES TABLEAUX ELECTRIQUES STANDING LIBRE, PAR TYPE, 2018-2032
TABLEAU 431 PAYS DE LA CEI BOIS SOLIDE DANS LE MARCHÉ DES TABLEAUX ÉLECTRIQUES STANDARD GRATUIT, PAR TYPE, 2018-2032
TABLEAU 432 PAYS DE LA CEI PLASTIQUE/COMPOSITE DANS LE MARCHÉ DES TABLEAUX ELECTRIQUES STANDARDS LIBREMENT AJUSTABLES, PAR TYPE, 2018-2032
TABLEAU 433 PAYS DE LA CEI MARCHÉ DES TABLEAUX AJUSTABLES À L'HAUTE ÉLECTRIQUE, PAR DEMANDE, 2018-2032 (en MILLE USD)
TABLEAU 434 PAYS DE LA CEI BUREAUX CORPORATIFS DU MARCHÉ DES TABLEAUX ELECTRIQUES PERMANENT LIBREMENT, PAR TYPE, 2018-2032 (MILLIERS DE USD)
TABLEAU 435 PAYS DE LA CEI RÉSIDENTIEL DU MARCHÉ DES TABLEAUX ELECTRIQUES STANDING LIBRE, PAR TYPE, 2018-2032
TABLEAU 436 ÉDUCATION DES PAYS DE LA CEI DANS LE MARCHÉ DES TABLEAUX ELECTRIQUES STANDING LIBRE, PAR TYPE, 2018-2032
TABLEAU 437 PAYS DE LA CEI PROTECTION DE LA SANTÉ DANS LE MARCHÉ DES TABLEAUX ELECTRIQUES STANDING LIBRE, PAR TYPE, 2018-2032 (MILLIERS USD)
TABLEAU 438 PAR PAYS DE LA CEI STANDING LIBRE MARCHÉ DES TABLEAUX ELECTRIQUES AJUSTABLES, PAR UTILISATEUR DE FIN, 2018-2033 (MILLIERS USD)
TABLEAU 439 PAR PAYS DE LA CEI STANDING LIBRE MARCHÉ DES TABLEAUX ELECTRIQUES AJUSTABLES, PAR CHANEAU DE DISTRIBUTION, 2018-2033
TABLEAU 440 PAYS DE LA CEI MARCHÉ DES TABLEAUX ÉLECTRIQUES AJUSTABLES, PAR CHANEAU DE DISTRIBUTION, 2018-2033
TABLEAU 441 PAYS DE LA CEI VENTES INDIRECTES DANS LE MARCHÉ DES TABLEAUX ELECTRIQUES STANDARDS LIBREMENT AJUSTABLES, PAR TYPE, 2018-2032
TABLEAU 442 ÉTAT DES PAYS DE LA CEI SUR LE MARCHÉ DES TABLEAUX ELECTRIQUES STANDARDS LIBREMENT AJUSTABLES, PAR TYPE, 2018-2032
TABLEAU 443 PAYS DE LA CEI COMMERCE EN ÉLECTRIQUE LIBRE STANDING MARCHÉ DES TABLEAUX AJUSTABLES, PAR TYPE, 2018-2032
TABLEAU 444 RESTE D'EUROPE MARCHÉ DES TABLEAUX ELECTRIQUES STANDING LIBRE, PAR FORMULAIRE DE PRODUIT, 2018-2032 (en MILLE USD)
TABLEAU 445 RESTREIN D'EUROPE MARCHÉ DES TABLEAUX ELECTRIQUES STANDING LIBRE, PAR FORMULAIRE DE PRODUIT, 2018-2032 (MILLIERS)
TABLEAU 446 RESTREIN D'EUROPE MOTEUR UNIQUE DANS LE MARCHÉ DES TABLEAUX ÉLECTRIQUES STANDARD LIBRE, PAR TYPE DE CADRE, 2018-2032 (en MILLE USD)
TABLEAU 447 RESTE D'EUROPE MOTEUR UNIQUE DANS LE MARCHÉ DES TABLEAUX ELECTRIQUES D'ADJUSTABLES LIBREMENT STANDING, PAR AJUSTEMENT SPEED, 2018-2032
TABLEAU 448 RESTE D'EUROPE MOTEUR UNIQUE DANS LE MARCHÉ DES TABLEAUX AJUSTABLES ÉLECTRIQUES LIBREMENT STANDING, PAR INTERFACE DE CONTRÔLE, 2018-2032 (en MILLEUR DE USD)
TABLEAU 449 RESTE D'EUROPE DUAL MOTOR DANS LE MARCHÉ DES TABLEAUX ELECTRIQUES STANDING LIBRE, PAR TYPE DE CADRE, 2018-2032 (MILLIERS DE USD)
TABLEAU 450 RESTE D'EUROPE DUAL MOTOR DANS LE MARCHÉ DES TABLEAUX ELECTRIQUES LIBREMENT STANDING, PAR AJUSTEMENT SPEED, 2018-2032 (MILLIERS DE USD)
TABLEAU 451 RESTE D'EUROPE DUAL MOTOR DANS LE MARCHÉ DES TABLEAUX ELECTRIQUES STANDING LIBRE, PAR INTERFACE DE CONTRÔLE, 2018-2032 (en MILLEUR DE USD)
TABLEAU 452 RESTE D'EUROPE MULTI-MOTEUR DANS LE MARCHÉ DES TABLEAUX ELECTRIQUES STANDING LIBRE, PAR TYPE DE CADRE, 2018-2032
TABLEAU 453 RESTE D'EUROPE MULTI-MOTEUR DANS LE MARCHÉ DES TABLEAUX ELECTRIQUES D'ADJUSTABLES LIBREMENT STANDING, PAR AJUSTEMENT PRÉVUE, 2018-2032 (MILLIERS DE USD)
TABLEAU 454 RESTE D'EUROPE MULTI-MOTEUR DANS LE MARCHÉ DES TABLEAUX ELECTRIQUES STANDING LIBRE, PAR INTERFACE DE CONTRÔLE, 2018-2032 (en MILLEUR)
TABLEAU 455 RESTREIN D'EUROPE MARCHÉ DES TABLEAUX ELECTRIQUES AJUSTABLES, PAR MATÉRIEL, 2018-2032 (en MILLIERS USD)
TABLEAU 456 RESTE D'EUROPE METAL DANS LE MARCHÉ DES TABLEAUX ELECTRIQUES STANDING LIBRE, PAR TYPE, 2018-2032
TABLEAU 457 EST D'EUROPE ACIER DANS LE MARCHÉ DES TABLEAUX ELECTRIQUES STANDING GRATUIT, PAR TYPE, 2018-2032
TABLEAU 458 RESTREIN D'EUROPE DANS LE MARCHÉ DES TABLEAUX ELECTRIQUES STANDING LIBRE, PAR TYPE, 2018-2032 (MILLIERS DE USD)
TABLEAU 459 RESTREIN D'EUROPE BOIS ENGINÉES DANS LE MARCHÉ DES TABLEAUX AJUSTABLES ÉLECTRIQUES STANDARD GRATUIT, PAR TYPE, 2018-2032
TABLEAU 460 RESTE D'EUROPE BOIS SOLIDES DANS LE MARCHÉ DES TABLEAUX ELECTRIQUES STANDARDS LIBREMENT AJUSTABLES, PAR TYPE, 2018-2032
TABLEAU 461 RESTE D'EUROPE PLASTIQUE/COMPOSITE DANS LE MARCHÉ DES TABLEAUX ELECTRIQUES STANDING LIBRE ET ADJUSTABLES, PAR TYPE, 2018-2032
TABLEAU 462 RESTREIN D'EUROPE MARCHÉ DES TABLEAUX ELECTRIQUES STANDING LIBRE, PAR DEMANDE, 2018-2032
TABLEAU 463 BUREAUX CORPORATIFS DU RESTE D'EUROPE DANS LE MARCHÉ DES TABLEAUX AJUSTABLES ÉLECTRICAUX, PAR TYPE, 2018-2032
TABLEAU 464 RESIDENTIEL DE L'EUROPE DANS LE MARCHÉ DES TABLEAUX AJUSTABLES À L'HAUTE ÉLECTRIQUE LIBRE STANDING, PAR TYPE, 2018-2032
TABLEAU 465 EST D'EUROPE L'ENSEIGNEMENT DANS LE MARCHÉ DES TABLEAUX ELECTRIQUES STANDING LIBRE, PAR TYPE, 2018-2032 (en MILLIERS USD)
TABLEAU 466 BIEN-ÊTRE DE L'EUROPE DANS LE MARCHÉ DES TABLEAUX AJUSTABLES DE L'HAUTE ÉLECTRIQUE, PAR TYPE, 2018-2032 (en millions de dollars)
TABLEAU 467 RESTE D'EUROPE MARCHÉ DES TABLEAUX ELECTRIQUES AJUSTABLES, PAR UTILISATEUR D'ENTREPRISE, 2018-2033
TABLEAU 468 RESTE D'EUROPE MARCHÉ DES TABLEAUX ELECTRIQUES D'AJUSTABLE, PAR CHANEAU DE DISTRIBUTION, 2018-2033
TABLEAU 469 RESTE D'EUROPE MARCHÉ DES TABLEAUX ELECTRIQUES AJUSTABLES, PAR CHANEAU DE DISTRIBUTION, 2018-2033
TABLEAU 470 VENTES INDIRECTES DE LA RESTREINTE D'EUROPE DANS LE MARCHÉ DES TABLEAUX ELECTRIQUES STANDING GRATUIT, PAR TYPE, 2018-2032 (en MILLIERS DE USD)
TABLEAU 471 STOCKS DE STAIL DE L'EUROPE DANS LE MARCHÉ DES TABLEAUX ELECTRIQUES STANDING LIBRE, PAR TYPE, 2018-2032
TABLEAU 472 RESTREIN D'EUROPE E-COMMERCE DANS LE MARCHÉ DES TABLEAUX ELECTRIQUES STANDING GRATUIT, PAR TYPE, 2018-2032
TABLEAU 473 MARCHÉ DES TABLEAUX ÉLECTRIQUES AJUSTABLES, PAR PAYS, 2018-2032
TABLEAU 474 MARCHÉ DES TABLEAUX ELECTRIQUES AJUSTABLES ASIE-PACIFIQUE, PAR PAYS, 2018-2032
TABLEAU 475 MARCHÉ DES TABLEAUX ELECTRIQUES AJUSTABLES ASIE-PACIFIQUE, PAR FORMULAIRE DE PRODUIT, 2018-2032
TABLEAU 476 PAR FORMULAIRE DE PRODUITS, 2018-2032 (EN MILLIERS)
TABLEAU 477 MOTEUR UNIQUE ASIE-PACIFIQUE DANS LE MARCHÉ DES TABLEAUX AJUSTABLES ÉLECTRIQUES STANDARD LIBRE, PAR TYPE DE CADRE, 2018-2032 (en MILLE USD)
TABLEAU 478 MOTEUR UNIQUE ASIE-PACIFIQUE DANS LE MARCHÉ DES TABLEAUX AJUSTABLES ÉLECTRIQUES STANDARD LIBRE, PAR AJUSTEMENT PRÉVUE, 2018-2032 (MILLIERS DE USD)
TABLEAU 479 MOTEUR UNIQUE ASIE-PACIFIQUE DANS LE MARCHÉ DES TABLEAUX AJUSTABLES ÉLECTRIQUES STANDARD LIBRE, PAR INTERFACE DE CONTRÔLE, 2018-2032 (MILLIERS DE USD)
TABLEAU 480 MOTEUR DU DUAL ASIE-PACIFIQUE DANS LE MARCHÉ DES TABLEAUX AJUSTABLES ÉLECTRIQUES STANDARD LIBRE, PAR TYPE DE CADRE, 2018-2032 (en MILLE USD)
TABLEAU 481 MOTEUR DU DUAL ASIE-PACIFIQUE DANS LE MARCHÉ DES TABLEAUX AJUSTABLES ÉLECTRIQUES PERMANENT LIBRE, PAR AJUSTEMENT SPEED, 2018-2032 (en MILLIERS DE DOLLARS)
TABLEAU 482 MOTEUR DU DUAL ASIE-PACIFIQUE DANS LE MARCHÉ DES TABLEAUX AJUSTABLES ÉLECTRIQUES PERMANENT LIBRE, PAR INTERFACE DE CONTRÔLE, 2018-2032 (MILLIERS DE USD)
TABLEAU 483 MULTI-MOTEUR ASIE-PACIFIQUE DANS LE MARCHÉ DES TABLEAUX ÉLECTRIQUES STANDARD GRATUIT, PAR TYPE DE CADRE, 2018-2032 (en MILLEUR)
TABLEAU 484 MULTI-MOTEUR ASIE-PACIFIQUE DANS LE MARCHÉ DES TABLEAUX AJUSTABLES ÉLECTRIQUES PERMANENTES, PAR AJUSTEMENT PRÉVUE, 2018-2032 (MILLIERS DE DOLLARS)
TABLEAU 485 MULTI-MOTEUR ASIE-PACIFIQUE DANS LE MARCHÉ DES TABLEAUX ELECTRIQUES AJUSTABLES LIBREMENT STANDING, PAR INTERFACE DE CONTRÔLE, 2018-2032 (en MILLEUR)
TABLEAU 486 MARCHÉ DES TABLEAUX ELECTRIQUES AJUSTABLES ASIE-PACIFIQUE LIBRE STANDING, PAR MATÉRIEL, 2018-2032
TABLEAU 487 MÉTAL ASIE-PACIFIQUE DANS LE MARCHÉ DES TABLEAUX ELECTRIQUES STANDING LIBRE, PAR TYPE, 2018-2032 (en MILLIERS USD)
TABLEAU 488 ACIER ASIE-PACIFIQUE DANS LE MARCHÉ DES TABLEAUX ELECTRIQUES STANDARD GRATUIT, PAR TYPE, 2018-2032
TABLEAU 489 BOIS ASIE-PACIFIQUE DANS LE MARCHÉ DES TABLEAUX ELECTRIQUES STANDING GRATUIT, PAR TYPE, 2018-2032
TABLEAU 490 BOIS ENGINÉES ASIE-PACIFIQUES DANS LE MARCHÉ DES TABLEAUX ELECTRIQUES STANDARDS, PAR TYPE, 2018-2032
TABLEAU 491 BOIS SOLIDE ASIE-PACIFIQUE DANS LE MARCHÉ DES TABLEAUX ELECTRIQUES STANDARD GRATUIT, PAR TYPE, 2018-2032
TABLEAU 492 PLASTIQUE ASIE-PACIFIQUE/COMPOSITE DANS LE MARCHÉ DES TABLEAUX ELECTRIQUES STANDARD GRATUIT, PAR TYPE, 2018-2032 (en milliers de dollars)
TABLEAU 493 MARCHÉ DES TABLEAUX ELECTRIQUES AJUSTABLES, PAR APPLICATION, 2018-2032 (en MILLIERS USD)
TABLEAU 494 BUREAUX DU CORPORAT ASIE-PACIFIQUE DU MARCHÉ DES TABLEAUX ELECTRIQUES STANDARD GRATUIT, PAR TYPE, 2018-2032
TABLEAU 495 RESIDENTIEL ASIE-PACIFIQUE DANS LE MARCHÉ DES TABLEAUX AJUSTABLES ÉLECTRIQUES PERMANENT, PAR TYPE, 2018-2032
TABLEAU 496 ÉDUCATION ASIE-PACIFIQUE DANS LE MARCHÉ DES TABLEAUX AJUSTABLES À L'HAUTE ÉLECTRIQUE LIBRE STANDING, PAR TYPE, 2018-2032
TABLEAU 497 CARTE DE SANTÉ ASIE-PACIFIQUE DANS LE MARCHÉ DES TABLEAUX AJUSTABLES ÉLECTRIQUES STANDARD LIBRE, PAR TYPE, 2018-2032 (MILLIERS DE USD)
TABLEAU 498 MARCHÉ DES TABLEAUX ÉLECTRIQUES AJUSTABLES ASIE-PACIFIQUE LIBRE STANDING, PAR UTILISATEUR, 2018-2033
TABLEAU 499 MARCHÉ DES TABLEAUX ELECTRIQUES AJUSTABLES, PAR CHANEAU DE DISTRIBUTION, 2018-2033
TABLEAU 500 PAR CHANEAU DE DISTRIBUTION, 2018-2033 (milliers d'unités)
TABLEAU 501 VENTES INDIRECTES ASIE-PACIFIQUES DANS LE MARCHÉ DES TABLEAUX ELECTRIQUES STANDARD GRATUIT, PAR TYPE, 2018-2032 (MILLIERS DE USD)
TABLEAU 502 STOCKS DE DÉTAILLAGE ASIE-PACIFIQUE DANS LE MARCHÉ DES TABLEAUX ELECTRIQUES STANDARD GRATUIT, PAR TYPE, 2018-2032
TABLEAU 503 COMMERCE électronique ASIE-PACIFIQUE DANS LE MARCHÉ DES TABLEAUX AJUSTABLES ÉLECTRIQUES PERMANENT LIBRE, PAR TYPE, 2018-2032 (en milliers de dollars)
TABLEAU 504 TABLEAUX AJUSTABLES DE L'HAUTEUR ÉLECTRIQUE DE LA CHINE LIBRE STANDING, PAR FORMULAIRE DE PRODUIT, 2018-2032
TABLEAU 505 TABLEAUX AJUSTABLES DE L'HAUTEUR ELECTRIQUE DE LA CHINE, PAR FORMULAIRE DE PRODUIT, 2018-2032
TABLEAU 506 CHINE SINGLE MOTEUR DANS LE MARCHÉ DES TABLEAUX ELECTRIQUES STANDING LIBRE, PAR TYPE DE CADRE, 2018-2032 (MILLIERS DE USD)
TABLEAU 507 CHINE SINGLE MOTEUR DANS LE MARCHÉ DES TABLEAUX ELECTRIQUES LIBREMENT STANDING, PAR AJUSTEMENT SPEED, 2018-2032 (MILLIERS DE USD)
TABLEAU 508 CHINE SINGLE MOTEUR DANS LE MARCHÉ DES TABLEAUX ELECTRIQUES LIBREMENT STANDING, PAR INTERFACE DE CONTRÔLE, 2018-2032 (MILLIERS DE USD)
TABLEAU 509 CHINE DUAL MOTOR DANS LE MARCHÉ DES TABLEAUX ELECTRIQUES STANDING LIBRE, PAR TYPE DE CADRE, 2018-2032 (MILLIERS DE USD)
TABLEAU 510 CHINE DUAL MOTOR DANS LE MARCHÉ DES TABLEAUX ELECTRIQUES LIBREMENT STANDING, PAR AJUSTEMENT SPEED, 2018-2032 (en MILLEUR DE USD)
TABLEAU 511 CHINE DUAL MOTOR DANS LE MARCHÉ DES TABLEAUX ELECTRIQUES LIBREMENT STANDING, PAR INTERFACE DE CONTRÔLE, 2018-2032 (MILLIERS DE USD)
TABLEAU 512 CHINE MULTI-MOTEUR DANS LE MARCHÉ DES TABLEAUX ELECTRIQUES STANDING LIBRE, PAR TYPE DE CADRE, 2018-2032 (MILLIERS DE USD)
TABLEAU 513 CHINE MULTI-MOTEUR DANS LE MARCHÉ DES TABLEAUX AJUSTABLES ÉLECTRIQUES PERMANENT LIBRE, PAR AJUSTEMENT SPEED, 2018-2032 (MILLIERS DE USD)
TABLEAU 514 CHINE MULTI-MOTEUR DANS LE MARCHÉ DES TABLEAUX ELECTRIQUES LIBREMENT STANDING, PAR INTERFACE DE CONTRÔLE, 2018-2032 (MILLIERS DE USD)
TABLEAU 515 MARCHÉ DES TABLEAUX AJUSTABLES DE L'HAUTEUR ÉLECTRIQUE, PAR MATÉRIEL, 2018-2032
TABLEAU 516 MÉTAL DE LA CHINE DANS LE MARCHÉ DES TABLEAUX ELECTRIQUES STANDING LIBRE, PAR TYPE, 2018-2032 (en milliers d'USD)
TABLEAU 517 ACIER DE CHINE DANS LE MARCHÉ DES TABLEAUX AJUSTABLES À L'HAUTE ÉLECTRIQUE LIBRE STANDING, PAR TYPE, 2018-2032
TABLEAU 518 BOIS DE CHINE DANS LE MARCHÉ DES TABLEAUX ELECTRIQUES STANDING LIBRE, PAR TYPE, 2018-2032 (en MILLIERS USD)
TABLEAU 519 BOIS ENGINÉES DE CHINE DANS LE MARCHÉ DES TABLEAUX AJUSTABLES À L'HAUTE ÉLECTRIQUE LIBRE, PAR TYPE, 2018-2032 (en milliers de dollars)
TABLEAU 520 BOIS SOLIDE DE CHINE DANS LE MARCHÉ DES TABLEAUX ÉLECTRIQUES STANDARD GRATUIT, PAR TYPE, 2018-2032
TABLEAU 521 CHINE PLASTIQUE/COMPOSITE DANS LE MARCHÉ DES TABLEAUX ÉLECTRIQUES STANDARD GRATUIT, PAR TYPE, 2018-2032
TABLEAU 522 MARCHÉ DES TABLEAUX AJUSTABLES À L'HAUTE ELECTRIQUE, PAR DEMANDE, 2018-2032
TABLEAU 523 BUREAUX CORPORATIQUES DE CHINE DANS LE MARCHÉ DES TABLEAUX ELECTRIQUES PERMANENTES, PAR TYPE, 2018-2032
TABLEAU 524 RÉSIDENTIEL DE LA CHINE DANS LE MARCHÉ DES TABLEAUX ÉLECTRIQUES STANDING LIBRE, PAR TYPE, 2018-2032 (en milliers de dollars)
TABLEAU 525 ÉDUCATION DE LA CHINE DANS LE MARCHÉ DES TABLEAUX ELECTRIQUES STANDING LIBRE, PAR TYPE, 2018-2032
TABLEAU 526 CHINE SANTÉ DANS LE MARCHÉ DES TABLEAUX ELECTRIQUES STANDING LIBRE, PAR TYPE, 2018-2032 (en milliers de dollars)
TABLEAU 527 MARCHÉ DES TABLEAUX AJUSTABLES ÉLECTRIQUES, PAR UTILISATEUR DE CHINE, 2018-2033 (en milliers de dollars)
TABLEAU 528 CHINE LIBRE STANDING ÉLECTRIQUE TABLEAUX AJUSTABLES MARCHÉ, PAR CHANEAU DE DISTRIBUTION, 2018-2033 (en MILLEUR)
TABLEAU 529 CHINE LIBRE STANDING ELECTRICAL HEIGHT-ADJUSTABLE TABLES MARCHÉ, PAR CHANEAU DE DISTRIBUTION, 2018-2033
TABLEAU 530 VENTES INDIRECTES DE CHINE DANS LE MARCHÉ DES TABLEAUX ELECTRIQUES STANDING GRATUIT, PAR TYPE, 2018-2032
TABLEAU 531 STOCKS DE DÉTAILLAGE DE CHINE DANS LE MARCHÉ DES TABLEAUX ÉLECTRIQUES STANDARD GRATUIT, PAR TYPE, 2018-2032 (en milliers de dollars É.-U.)
TABLEAU 532 CHINE COMMERCE EN ÉLECTRIQUE LIBRE STANDING MARCHÉ DES TABLEAUX AJUSTABLES, PAR TYPE, 2018-2032
TABLEAU 533 PAR FORMULAIRE DE PRODUIT, INDE LIBRE STANDING, MARCHÉ DES TABLEAUX ELECTRIQUES AJUSTABLES DE L'HAUTEUR, 2018-2032 (en milliers de dollars)
TABLEAU 534 TABLEAUX AJUSTABLES À L'HAUTE ELECTRIQUE, PAR FORMULAIRE DE PRODUIT, EN INDE LIBRE STANDING 2018-2032
TABLEAU 535 MOTEUR UNIQUE DE L'INDE DANS LE MARCHÉ DES TABLEAUX ELECTRIQUES STANDARD GRATUIT, PAR TYPE DE CADRE, 2018-2032
TABLEAU 536 MOTEUR UNIQUE DE L'INDE DANS LE MARCHÉ DES TABLEAUX AJUSTABLES ÉLECTRIQUES PERMANENT LIBREMENT, PAR AJUSTEMENT SPEED, 2018-2032 (en MILLEUR DE USD)
TABLEAU 537 MOTEUR UNIQUE DE L'INDE DANS LE MARCHÉ DES TABLEAUX AJUSTABLES ÉLECTRIQUES LIBREMENT STANDARD, PAR INTERFACE DE CONTRÔLE, 2018-2032 (en MILLIERS DE USD)
TABLEAU 538 INDE DUAL MOTOR DANS LE MARCHÉ DES TABLEAUX ELECTRIQUES STANDARD GRATUIT, PAR TYPE DE CADRE, 2018-2032
TABLEAU 539 INDE DUAL MOTOR DANS LE MARCHÉ DES TABLEAUX AJUSTABLES ÉLECTRIQUES PERMANENTES LIBREMENT, PAR AJUSTEMENT SPEED, 2018-2032 (MILLIERS USD)
TABLEAU 540 INDE DUAL MOTOR DANS LE MARCHÉ DES TABLEAUX ELECTRIQUES STANDING GRATUIT, PAR INTERFACE DE CONTRÔLE, 2018-2032
TABLEAU 541 INDE MULTI-MOTEUR DANS LE MARCHÉ DES TABLEAUX ÉLECTRIQUES PERMANENT GRATUITEMENT, PAR TYPE DE CADRE, 2018-2032 (en milliers de dollars)
TABLEAU 542 INDE MULTI-MOTEUR DANS LE MARCHÉ DES TABLEAUX AJUSTABLES ÉLECTRIQUES PERSONNELS, PAR AJUSTEMENT PRÉVUE, 2018-2032 (en MILLEUR)
TABLEAU 543 INDE MULTI-MOTEUR DANS LE MARCHÉ DES TABLEAUX ÉLECTRIQUES PERMANENT LIBREMENT AJUSTABLES, PAR INTERFACE DE CONTRÔLE, 2018-2032
TABLEAU 544 INDE LIBRE STANDING ELECTRIQUE TABLEAUX AJUSTABLES, PAR MATÉRIEL, 2018-2032
TABLEAU 545 MÉTAL INDIEN DANS LE MARCHÉ DES TABLEAUX ELECTRIQUES STANDING LIBRE, PAR TYPE, 2018-2032
TABLEAU 546 ACIER DE L'INDE DANS LE MARCHÉ DES TABLEAUX ELECTRIQUES STANDING LIBRE, PAR TYPE, 2018-2032 (en milliers de dollars)
TABLEAU 547 BOIS DE L'INDE DANS LE MARCHÉ DES TABLEAUX ELECTRIQUES STANDING LIBRE, PAR TYPE, 2018-2032
TABLEAU 548 BOIS ENGINÉES DE L'INDE DANS LE MARCHÉ DES TABLEAUX AJUSTABLES À L'HAUTE ÉLECTRIQUE LIBRE, PAR TYPE, 2018-2032 (en milliers de dollars)
TABLEAU 549 BOIS SOLIDE DE L'INDE DANS LE MARCHÉ DES TABLEAUX AJUSTABLES À L'HAUTE ÉLECTRIQUE LIBRE, PAR TYPE, 2018-2032 (en milliers de dollars)
TABLEAU 550 PLASTIQUE DE L'INDE/COMPOSITE DANS LE MARCHÉ DES TABLEAUX AJUSTABLES À L'HAUTE ÉLECTRIQUE LIBRE, PAR TYPE, 2018-2032 (en millions de dollars)
TABLEAU 551 INDE LIBRE STANDING ELECTRICAL HEIGHT-ADJUSTABLE TABLES MARCHÉ, PAR DEMANDE, 2018-2032 (en MILLE USD)
TABLEAU 552 BUREAUX CORPORATAIRES DE L'INDE DANS LE MARCHÉ DES TABLEAUX ELECTRIQUES PERMANENTES, PAR TYPE, 2018-2032
TABLEAU 553 RÉSIDENTIEL DE L'INDE DANS LE MARCHÉ DES TABLEAUX AJUSTABLES À L'HAUTE ÉLECTRIQUE LIBRE STANDING, PAR TYPE, 2018-2032
TABLEAU 554 ÉDUCATION DE L'INDE DANS LE MARCHÉ DES TABLEAUX ELECTRIQUES STANDING LIBRE, PAR TYPE, 2018-2032
TABLEAU 555 SANTE DE L'INDE DANS LE MARCHÉ DES TABLEAUX ELECTRIQUES STANDING LIBRE, PAR TYPE, 2018-2032
TABLEAU 556 MARCHÉ DES TABLEAUX AJUSTABLES DE L'HAUTE ELECTRIQUE, PAR UTILISATEUR DE FIN, 2018-2033
TABLEAU 557 PAR CHANEAU DE DISTRIBUTION, 2018-2033 (en milliers de dollars É.-U.)
TABLEAU 558 MARCHÉ DES TABLEAUX AJUSTABLES À L'HAUTE ÉLECTRIQUE, PAR CHANEAU DE DISTRIBUTION, 2018-2033
TABLEAU 559 INDE VENTES INDIRECTES DANS LE MARCHÉ DES TABLEAUX ELECTRIQUES STANDING GRATUIT, PAR TYPE, 2018-2032
TABLEAU 560 STOCKS DE DÉTAILLAGE DE L'INDE DANS LE MARCHÉ DES TABLEAUX ELECTRIQUES STANDARDS, PAR TYPE, 2018-2032
TABLEAU 561 INDE COMMERCE-E DANS LE MARCHÉ DES TABLEAUX AJUSTABLES DE L'HAUTEUR LIBRE STANDARD, PAR TYPE, 2018-2032 (en milliers de dollars)
TABLEAU 562 MARCHÉ DES TABLEAUX ÉLECTRIQUES AJUSTABLES DU JAPON, PAR FORMULAIRE DE PRODUIT, 2018-2032
TABLEAU 563 MARCHÉ DES TABLEAUX AJUSTABLES DE L'HAUTE ELECTRIQUE, PAR FORMULAIRE DE PRODUIT, 2018-2032 (milliers d'unités)
TABLEAU 564 MOTEUR UNIQUE DU JAPON DANS LE MARCHÉ DES TABLEAUX AJUSTABLES ÉLECTRIQUES STANDARD LIBRE, PAR TYPE DE CADRE, 2018-2032 (en milliers de dollars)
TABLEAU 565 MOTEUR UNIQUE DU JAPON DANS LE MARCHÉ DES TABLEAUX AJUSTABLES ÉLECTRIQUES PERMANENTES LIBREMENT, PAR AJUSTEMENT SPEED, 2018-2032 (en milliers de dollars)
TABLEAU 566 MOTEUR UNIQUE DU JAPON DANS LE MARCHÉ DES TABLEAUX AJUSTABLES ÉLECTRIQUES LIBREMENT STANDARD, PAR INTERFACE DE CONTRÔLE, 2018-2032 (en MILLEUR USD)
TABLEAU 567 DUAL MOTOR JAPON DANS LE MARCHÉ DES TABLEAUX ELECTRIQUES STANDING LIBRE, PAR TYPE DE CADRE, 2018-2032 (MILLIERS DE USD)
TABLEAU 568 DUAL MOTOR DU JAPON DANS LE MARCHÉ DES TABLEAUX ELECTRIQUES LIBREMENT STANDING, PAR AJUSTEMENT SPEED, 2018-2032 (MILLIERS DE USD)
TABLEAU 569 JAPON DUAL MOTOR DANS LE MARCHÉ DES TABLEAUX ELECTRIQUES STANDING GRATUIT, PAR INTERFACE DE CONTRÔLE, 2018-2032
TABLEAU 570 JAPON MULTI-MOTEUR DANS LE MARCHÉ DES TABLEAUX ELECTRIQUES STANDING LIBRE, PAR TYPE DE CADRE, 2018-2032 (MILLIERS DE USD)
TABLEAU 571 JAPON MULTI-MOTEUR DANS LE MARCHÉ DES TABLEAUX ELECTRIQUES STANDING LIBRE, PAR AJUSTEMENT SPEED, 2018-2032 (MILLIERS DE USD)
TABLEAU 572 JAPON MULTI-MOTEUR DANS LE MARCHÉ DES TABLEAUX ÉLECTRIQUES STANDARD GRATUIT, PAR INTERFACE DE CONTRÔLE, 2018-2032
TABLEAU 573 MARCHÉ DES TABLEAUX ELECTRIQUES AJUSTABLES, PAR MATÉRIEL, JAPON, 2018-2032
TABLEAU 574 MÉTAL JAPON DANS LE MARCHÉ DES TABLEAUX ELECTRIQUES STANDING GRATUIT, PAR TYPE, 2018-2032
TABLEAU 575 ACIER DU JAPON DANS LE MARCHÉ DES TABLEAUX ELECTRIQUES STANDING GRATUIT, PAR TYPE, 2018-2032
TABLEAU 576 BOIS DU JAPON DANS LE MARCHÉ DES TABLEAUX ELECTRIQUES STANDING LIBRE, PAR TYPE, 2018-2032 (en MILLE USD)
TABLEAU 577 BOIS GÉNÉRÉES PAR JAPON DANS LE MARCHÉ DES TABLEAUX ÉLECTRIQUES STANDARD GRATUIT, PAR TYPE, 2018-2032
TABLEAU 578 BOIS SOLIDE DU JAPON DANS LE MARCHÉ DES TABLEAUX ELECTRIQUES STANDARD GRATUIT, PAR TYPE, 2018-2032
TABLEAU 579 JAPON PLASTIQUE/COMPOSITE DANS LE MARCHÉ DES TABLEAUX ÉLECTRIQUES STANDARD GRATUIT, PAR TYPE, 2018-2032 (en milliers de dollars)
TABLEAU 580 MARCHÉ DES TABLEAUX AJUSTABLES À L'HAUTE ÉLECTRIQUE, PAR DEMANDE, 2018-2032 (en MILLE USD)
TABLEAU 581 BUREAUX CORPORATIQUES DU JAPON DANS LE MARCHÉ DES TABLEAUX AJUSTABLES À L'HAUTE ELECTRIQUE, PAR TYPE, 2018-2032 (en milliers de dollars)
TABLEAU 582 RÉSIDENTIEL DU JAPON DANS LE MARCHÉ DES TABLEAUX ELECTRIQUES STANDING LIBRE, PAR TYPE, 2018-2032
TABLEAU 583 ÉDUCATION DU JAPON DANS LE MARCHÉ DES TABLEAUX ELECTRIQUES STANDING LIBRE, PAR TYPE, 2018-2032
TABLEAU 584 BIEN-ÊTRE JAPON DANS LE MARCHÉ DES TABLEAUX ELECTRIQUES STANDING LIBRE, PAR TYPE, 2018-2032 (MILLIERS DE USD)
TABLEAU 585 MARCHÉ DES TABLEAUX AJUSTABLES DE L'HAUTEUR ÉLECTRIQUE, PAR UTILISATEUR DE FIN, 2018-2033 (en milliers de dollars É.-U.)
TABLEAU 586 MARCHÉ DES TABLEAUX AJUSTABLES DE HAUTE ÉLECTRIQUE, PAR CHANEAU DE DISTRIBUTION, JAPON, 2018-2033 (en millions de dollars)
TABLEAU 587 MARCHÉ DES TABLEAUX AJUSTABLES DE L'HAUTEUR ÉLECTRIQUE, PAR CHANEAU DE DISTRIBUTION, 2018-2033
TABLEAU 588 VENTES INDIRECTES DU JAPON DANS LE MARCHÉ DES TABLEAUX AJUSTABLES À L'HAUTE ÉLECTRIQUE LIBRE, PAR TYPE, 2018-2032 (en milliers de dollars)
TABLEAU 589 STOCKS DE STAIL JAPON DANS LE MARCHÉ DES TABLEAUX ELECTRIQUES STANDING GRATUIT, PAR TYPE, 2018-2032
TABLEAU 590 COMMERCE-E-JAPON DANS LE MARCHÉ DES TABLEAUX ELECTRIQUES STANDING LIBRE, PAR TYPE, 2018-2032 (en milliers de dollars)
TABLEAU 591 CORÉE DU SUD MARCHÉ DES TABLEAUX ÉLECTRIQUES AJUSTABLES, PAR FORMULAIRE DE PRODUIT, 2018-2032 (MILLIERS USD)
TABLEAU 592 CORÉE DU SUD MARCHÉ DES TABLEAUX ÉLECTRIQUES AJUSTABLES, PAR FORMULAIRE DE PRODUIT, 2018-2032
TABLEAU 593 MOTEUR UNIQUE DE LA CORÉE DU SUD DANS LE MARCHÉ DES TABLEAUX AJUSTABLES ÉLECTRIQUES STANDARD LIBRE, PAR TYPE DE CADRE, 2018-2032 (en MILLE USD)
TABLEAU 594 MOTEUR UNIQUE DE LA CORÉE DU SUD DANS LE MARCHÉ DES TABLEAUX AJUSTABLES ÉLECTRIQUES STANDARD LIBRE, PAR AJUSTEMENT PRÉVUE, 2018-2032 (en MILLIERS DE USD)
TABLEAU 595 MOTEUR UNIQUE DE LA CORÉE DU SUD DANS LE MARCHÉ DES TABLEAUX AJUSTABLES ÉLECTRIQUES STANDARD LIBRE, PAR INTERFACE DE CONTRÔLE, 2018-2032 (en MILLEUR)
TABLEAU 596 MOTEUR DU DUAL DE LA CORÉE DU SUD DANS LE MARCHÉ DES TABLEAUX AJUSTABLES ÉLECTRIQUES PERSONNELS, PAR TYPE DE CADRE, 2018-2032 (en MILLEUR DE USD)
TABLEAU 597 MOTEUR DU DUAL DE LA CORÉE DU SUD DANS LE MARCHÉ DES TABLEAUX AJUSTABLES ÉLECTRIQUES PERMANENT LIBRE, PAR AJUSTEMENT SPEED, 2018-2032 (MILLIERS DE USD)
TABLEAU 598 MOTEUR DU DUAL DE LA CORÉE DU SUD DANS LE MARCHÉ DES TABLEAUX AJUSTABLES ÉLECTRIQUES STANDING LIBRE, PAR INTERFACE DE CONTRÔLE, 2018-2032 (MILLIERS DE USD)
TABLEAU 599 CORÉE DU SUD MULTI-MOTEUR DANS LE MARCHÉ DES TABLEAUX ELECTRIQUES STANDING GRATUIT, PAR TYPE DE CADRE, 2018-2032 (en MILLEUR)
TABLEAU 600 CORÉE DU SUD MULTI-MOTEUR DANS LE MARCHÉ DES TABLEAUX ELECTRIQUES D'ADJUSTABLES LIBREMENT STANDING, PAR AJUSTEMENT SPEED, 2018-2032 (en millions de dollars)
TABLEAU 601 CORÉE DU SUD MULTI-MOTEUR DANS LE MARCHÉ DES TABLEAUX ELECTRIQUES STANDING LIBRE, PAR INTERFACE DE CONTRÔLE, 2018-2032 (MILLIERS DE USD)
TABLEAU 602 CORÉE DU SUD MARCHÉ DES TABLEAUX ELECTRIQUES AJUSTABLES, PAR MATÉRIEL, 2018-2032
TABLEAU 603 MÉTAL DE LA CORÉE DU SUD DANS LE MARCHÉ DES TABLEAUX AJUSTABLES DE L'HAUTEUR LIBRE STANDING, PAR TYPE, 2018-2032
TABLEAU 604 ACIER DE CORÉE DU SUD DANS LE MARCHÉ DES TABLEAUX AJUSTABLES ÉLECTRIQUES À L'ÉTRANGER GRATUITEMENT, PAR TYPE, 2018-2032 (en millions de dollars)
TABLEAU 605 BOIS DE CORÉE DU SUD DANS LE MARCHÉ DES TABLEAUX ELECTRIQUES STANDING LIBRE, PAR TYPE, 2018-2032
TABLEAU 606 CORÉE DU SUD ENGINÉE DANS LE MARCHÉ DES TABLEAUX ÉLECTRIQUES STANDARDS, PAR TYPE, 2018-2032 (MILLIERS DE USD)
TABLEAU 607 CORÉE DU SUD BOIS SOLIDE DANS LE MARCHÉ DES TABLEAUX ELECTRIQUES STANDARD GRATUIT, PAR TYPE, 2018-2032 (MILLIERS DE USD)
TABLEAU 608 PLASTIQUE/COMPOSITE DE LA CORÉE DU SUD DANS LE MARCHÉ DES TABLEAUX AJUSTABLES À LA HAUTE ÉLECTRIQUE LIBRE, PAR TYPE, 2018-2032 (en milliers de dollars)
TABLEAU 609 CORÉE DU SUD MARCHÉ DES TABLEAUX AJUSTABLES À L'HAUTE ÉLECTRIQUE, PAR APPLICATION, 2018-2032 (en milliers de dollars)
TABLEAU 610 BUREAUX DE CORÉE DU SUD DANS LE MARCHÉ DES TABLEAUX ELECTRIQUES STANDING GRATUIT, PAR TYPE, 2018-2032 (en milliers de dollars)
TABLEAU 611 RÉSIDENTIEL DE LA CORÉE DU SUD DANS LE MARCHÉ DES TABLEAUX AJUSTABLES ÉLECTRIQUES PERMANENTES, PAR TYPE, 2018-2032 (en milliers de dollars)
TABLEAU 612 ÉDUCATION DE LA CORÉE DU SUD DANS LE MARCHÉ DES TABLEAUX AJUSTABLES À LA HAUTE ÉLECTRIQUE LIBRE STANDING, PAR TYPE, 2018-2032
TABLEAU 613 COURS DE SANTÉ DE LA CORÉE DU SUD DANS LE MARCHÉ DES TABLEAUX AJUSTABLES À L'HAUTE ÉLECTRIQUE PERMANENTE, PAR TYPE, 2018-2032 (en milliers de dollars)
TABLEAU 614 CORÉE DU SUD MARCHÉ DES TABLEAUX ELECTRIQUES AJUSTABLES, PAR UTILISATEUR FINAL, 2018-2033
TABLEAU 615 CORÉE DU SUD MARCHÉ DES TABLEAUX ELECTRIQUES AJUSTABLES, PAR CHANEAU DE DISTRIBUTION, 2018-2033
TABLEAU 616 CORÉE DU SUD MARCHÉ DES TABLEAUX ELECTRIQUES AJUSTABLES, PAR CHANEAU DE DISTRIBUTION, 2018-2033
TABLEAU 617 VENTES INDIRECTES DE LA CORÉE DU SUD DANS LE MARCHÉ DES TABLEAUX ELECTRIQUES STANDING GRATUIT, PAR TYPE, 2018-2032 (MILLIERS USD)
TABLEAU 618 STOCKS DE STAIL DE LA CORÉE DU SUD DANS LE MARCHÉ DES TABLEAUX ELECTRIQUES STANDARDS, PAR TYPE, 2018-2032 (en milliers de dollars)
TABLEAU 619 CORÉE DU SUD COMMERCE-E DANS LE MARCHÉ DES TABLEAUX ÉLECTRIQUES STANDARD GRATUIT, PAR TYPE, 2018-2032
TABLEAU 620 PAR FORMULAIRE DE PRODUIT, AUSTRALIE LIBRE STANDING ÉLECTRIQUE TABLEAUX AJUSTABLES, 2018-2032
TABLEAU 621 MARCHÉ DES TABLEAUX ÉLECTRIQUES AJUSTABLES, PAR FORMULAIRE DE PRODUIT, EN AUSTRALIE, 2018-2032 (EN MILLIERS)
TABLEAU 622 MOTEUR UNIQUE D'AUSTRALIE DANS LE MARCHÉ DES TABLEAUX AJUSTABLES ÉLECTRIQUES STANDARD GRATUIT, PAR TYPE DE CADRE, 2018-2032 (en MILLEUR DE USD)
TABLEAU 623 AUSTRALIE MOTEUR UNIQUE DANS LE MARCHÉ DES TABLEAUX AJUSTABLES ÉLECTRIQUES STANDARD GRATUIT, PAR AJUSTEMENT SPEED, 2018-2032
TABLEAU 624 AUSTRALIE MOTEUR UNIQUE DANS LE MARCHÉ DES TABLEAUX AJUSTABLES ÉLECTRIQUES STANDARD LIBRE, PAR INTERFACE DE CONTRÔLE, 2018-2032 (en MILLE USD)
TABLEAU 625 AUSTRALIE DUAL MOTOR DANS LE MARCHÉ DES TABLEAUX ELECTRIQUES STANDING LIBRE, PAR TYPE DE CADRE, 2018-2032 (MILLIERS DE USD)
TABLEAU 626 AUSTRALIE DUAL MOTEUR DANS LE MARCHÉ DES TABLEAUX AJUSTABLES ÉLECTRIQUES STANDARD LIBRE, PAR AJUSTEMENT SPEED, 2018-2032 (MILLIERS USD)
TABLEAU 627 AUSTRALIE DUAL MOTEUR DANS LE MARCHÉ DES TABLEAUX AJUSTABLES ÉLECTRIQUES STANDARD GRATUIT, PAR INTERFACE DE CONTRÔLE, 2018-2032 (en MILLEUR DE USD)
TABLEAU 628 AUSTRALIE MULTI-MOTEUR DANS LE MARCHÉ DES TABLEAUX ELECTRIQUES STANDING LIBRE, PAR TYPE DE CADRE, 2018-2032 (MILLIERS DE USD)
TABLEAU 629 AUSTRALIE MULTI-MOTEUR DANS LE MARCHÉ DES TABLEAUX ELECTRIQUES D'ADJUSTABLES LIBREMENT STANDING, PAR AJUSTEMENT SPEED, 2018-2032
TABLEAU 630 AUSTRALIE MULTI-MOTEUR DANS LE MARCHÉ DES TABLEAUX ELECTRIQUES STANDING GRATUIT, PAR INTERFACE DE CONTRÔLE, 2018-2032
TABLEAU 631 MARCHÉ DES TABLEAUX ELECTRIQUES AJUSTABLES DE L'AUSTRALIE, PAR MATÉRIEL, 2018-2032 (en milliers de dollars)
TABLEAU 632 MÉTAL DE L'AUSTRALIE DANS LE MARCHÉ DES TABLEAUX ELECTRIQUES STANDING GRATUIT, PAR TYPE, 2018-2032
TABLEAU 633 ACIER D'AUSTRALIE DANS LE MARCHÉ DES TABLEAUX AJUSTABLES ÉLECTRIQUES STANDARD GRATUIT, PAR TYPE, 2018-2032 (en MILLIERS USD)
TABLEAU 634 BOIS DE L'AUSTRALIE DANS LE MARCHÉ DES TABLEAUX ELECTRIQUES STANDARD GRATUIT, PAR TYPE, 2018-2032
TABLEAU 635 BOIS ENGINÉES EN AUSTRALIE DANS LE MARCHÉ DES TABLEAUX AJUSTABLES ÉLECTRIQUES STANDARD GRATUIT, PAR TYPE, 2018-2032 (en MILLEUR)
TABLEAU 636 BOIS SOLIDE D'AUSTRALIE DANS LE MARCHÉ DES TABLEAUX AJUSTABLES DE L'HAUTEUR LIBRE STANDING, PAR TYPE, 2018-2032 (en MILLEUR)
TABLEAU 637 AUSTRALIE PLASTIQUE/COMPOSITE DANS LE MARCHÉ DES TABLEAUX ELECTRIQUES STANDARD GRATUIT, PAR TYPE, 2018-2032
TABLEAU 638 MARCHÉ DES TABLEAUX AJUSTABLES DE L'AUSTRALIE LIBRE STANDING ÉLECTRIQUE, PAR DEMANDE, 2018-2032 (en MILLIERS DE USD)
TABLEAU 639 BUREAUX CORPORATAIRES D'AUSTRALIE DANS LE MARCHÉ DES TABLEAUX AJUSTABLES DE L'HAUTEUR LIBRE STANDING, PAR TYPE, 2018-2032
TABLEAU 640 RÉSIDENTIEL DE L'AUSTRALIE DANS LE MARCHÉ DES TABLEAUX AJUSTABLES DE L'HAUTEUR LIBRE STANDING, PAR TYPE, 2018-2032 (en milliers de dollars)
TABLEAU 641 ÉDUCATION EN AUSTRALIE DANS LE MARCHÉ DES TABLEAUX ELECTRIQUES STANDING LIBRE, PAR TYPE, 2018-2032
TABLEAU 642 BIEN-ÊTRE DE L'AUSTRALIE DANS LE MARCHÉ DES TABLEAUX AJUSTABLES ÉLECTRIQUES STANDARD GRATUIT, PAR TYPE, 2018-2032 (en MILLEUR)
TABLEAU 643 MARCHÉ DES TABLEAUX AJUSTABLES DE L'AUSTRALIE LIBRE STANDING ELECTRICAL, PAR UTILISATEUR DE FIN, 2018-2033 (en millions de dollars)
TABLEAU 644 AUSTRALIE LIBRE STANDING ELECTRICAL TABLEAUX AJUSTABLES MARCHÉ, PAR CHANEAU DE DISTRIBUTION, 2018-2033 (MILLIERS DE USD)
TABLEAU 645 AUSTRALIE LIBRE STANDING ELECTRICAL HEIGHT-ADJUSTABLE TABLES MARCHANDISES, PAR CHANEAU DE DISTRIBUTION, 2018-2033
TABLEAU 646 VENTES INDIRECTES D'AUSTRALIE DANS LE MARCHÉ DES TABLEAUX AJUSTABLES DE L'HAUTEUR LIBRE STANDING, PAR TYPE, 2018-2032
TABLEAU 647 STOCKS DE DÉTAILLAGE DE L'AUSTRALIE DANS LE MARCHÉ DES TABLEAUX AJUSTABLES À L'HAUTE LIBRE STANDARD, PAR TYPE, 2018-2032 (en MILLEUR)
TABLEAU 648 COMMERCE-E D'AUSTRALIE DANS LE MARCHÉ DES TABLEAUX AJUSTABLES ÉLECTRIQUES PERSONNELS, PAR TYPE, 2018-2032
TABLEAU 649 THAÏLANDE MARCHÉ DES TABLEAUX ELECTRIQUES AJUSTABLES, PAR FORMULAIRE DE PRODUIT, 2018-2032 (en MILLE USD)
TABLEAU 650 THAÏLANDE MARCHÉ DES TABLEAUX ELECTRIQUES AJUSTABLES, PAR FORMULAIRE DE PRODUIT, 2018-2032 (MILLIERS)
TABLEAU 651 MOTEUR UNIQUE DE LA THAILANDE DANS LE MARCHÉ DES TABLEAUX AJUSTABLES DE L'HAUTE LIBRE STANDING, PAR TYPE DE CADRE, 2018-2032
TABLEAU 652 MOTEUR UNIQUE DE LA THAILANDE DANS LE MARCHÉ DES TABLEAUX AJUSTABLES ÉLECTRIQUES STANDARD LIBRE, PAR AJUSTEMENT SPEED, 2018-2032 (en MILLIERS DE USD)
TABLEAU 653 MOTEUR UNIQUE DE LA THAÏLANDE DANS LE MARCHÉ DES TABLEAUX ELECTRIQUES STANDING LIBRE, PAR INTERFACE DE CONTRÔLE, 2018-2032 (en MILLE USD)
TABLEAU 654 THAÏLANDE DUAL MOTOR DANS LE MARCHÉ DES TABLEAUX ELECTRIQUES STANDING LIBRE, PAR TYPE DE CADRE, 2018-2032 (en MILLE USD)
TABLEAU 655 THAÏLANDE DUAL MOTOR DANS LE MARCHÉ DES TABLEAUX ELECTRIQUES STANDING LIBRE, PAR AJUSTEMENT SPEED, 2018-2032 (MILLIERS DE USD)
TABLEAU 656 THAÏLANDE DUAL MOTOR DANS LE MARCHÉ DES TABLEAUX ELECTRIQUES STANDING LIBRE, PAR INTERFACE DE CONTRÔLE, 2018-2032 (MILLIERS DE USD)
TABLEAU 657 THAÏLANDE MULTI-MOTEUR DANS LE MARCHÉ DES TABLEAUX ELECTRIQUES STANDARDS LIBREMENT AJUSTABLES, PAR TYPE DE CADRE, 2018-2032
TABLEAU 658 THAILAND MULTI-MOTEUR DANS LE MARCHÉ DES TABLEAUX ELECTRIQUES STANDING LIBRE, PAR AJUSTEMENT SPEED, 2018-2032 (en MILLIERS DE USD)
TABLEAU 659 THAÏLANDE MULTI-MOTEUR DANS LE MARCHÉ DES TABLEAUX ELECTRIQUES STANDING LIBRE, PAR INTERFACE DE CONTRÔLE, 2018-2032 (MILLIERS DE USD)
TABLEAU 660 THAÏLANDE MARCHÉ DES TABLEAUX ELECTRIQUES AJUSTABLES, PAR MATÉRIEL, 2018-2032
TABLEAU 661 THAÏLANDE MÉTAL DANS LE MARCHÉ DES TABLEAUX ELECTRIQUES STANDING LIBRE, PAR TYPE, 2018-2032 (en MILLIERS USD)
TABLEAU 662 ACIER THAÏLANDE DANS LE MARCHÉ DES TABLEAUX ELECTRIQUES STANDING LIBRE, PAR TYPE, 2018-2032 (MILLIERS USD)
TABLEAU 663 GRANDE THAÏLANDE DANS LE MARCHÉ DES TABLEAUX ÉLECTRIQUES STANDING LIBRE, PAR TYPE, 2018-2032 (en milliers de dollars)
TABLEAU 664 MARCHANDISES GÉNÉRÉES PAR LA THAILANDE DANS LE MARCHÉ DES TABLEAUX ELECTRIQUES STANDING GRATUIT, PAR TYPE, 2018-2032 (en milliers de dollars)
TABLEAU 665 BOIS SOLIDE DE LA THAÏLANDE DANS LE MARCHÉ DES TABLEAUX AJUSTABLES DE L'HAUTEUR LIBRE STANDING, PAR TYPE, 2018-2032 (en MILLEUR)
TABLEAU 666 THAÏLANDE PLASTIQUE/COMPOSITE DANS LE MARCHÉ DES TABLEAUX ELECTRIQUES STANDARD GRATUIT, PAR TYPE, 2018-2032
TABLEAU 667 THAÏLANDE MARCHÉ DES TABLEAUX ELECTRIQUES AJUSTABLES, PAR DEMANDE, 2018-2032
TABLEAU 668 BUREAUX DU CORPORAT DE LA THAÏLANDE DANS LE MARCHÉ DES TABLEAUX AJUSTABLES À L'HAUTE ÉLECTRIQUE, PAR TYPE, 2018-2032
TABLEAU 669 RESIDENTIEL DE LA THAÏLANDE DANS LE MARCHÉ DES TABLEAUX ELECTRIQUES STANDING LIBRE, PAR TYPE, 2018-2032 (MILLIERS USD)
TABLEAU 670 ÉDUCATION DE LA THAÏLANDE DANS LE MARCHÉ DES TABLEAUX ELECTRIQUES STANDING LIBRE, PAR TYPE, 2018-2032 (en milliers de dollars)
TABLEAU 671 SANTE DE LA THAILANDE DANS LE MARCHÉ DES TABLEAUX ELECTRIQUES STANDING LIBRE, PAR TYPE, 2018-2032 (en MILLIERS USD)
TABLEAU 672 THAÏLANDE MARCHÉ DES TABLEAUX ELECTRIQUES AJUSTABLES, PAR UTILISATEUR DE FIN 2018-2033
TABLEAU 673 THAÏLANDE MARCHÉ DES TABLEAUX ELECTRIQUES AJUSTABLES, PAR CHANEAU DE DISTRIBUTION, 2018-2033
TABLEAU 674 THAÏLANDE MARCHÉ DES TABLEAUX ELECTRIQUES AJUSTABLES, PAR CHANEAU DE DISTRIBUTION, 2018-2033
TABLEAU 675 THAÏLANDE VENTES INDIRECTES DANS LE MARCHÉ DES TABLEAUX ELECTRIQUES STANDING GRATUIT, PAR TYPE, 2018-2032 (MILLIERS USD)
TABLEAU 676 STOCKS DE DÉTAILLAGE DE LA THAÏLANDE DANS LE MARCHÉ DES TABLEAUX AJUSTABLES ÉLECTRIQUES STANDING LIBRE, PAR TYPE, 2018-2032 (en MILLIERS DE USD)
TABLEAU 677 THAÏLANDE COMMERCE-E DANS LE MARCHÉ DES TABLEAUX ELECTRIQUES STANDING LIBRE, PAR TYPE, 2018-2032 (en MILLIERS USD)
TABLEAU 678 MARCHÉ DES TABLEAUX AJUSTABLES À L'HAUTE ÉLECTRIQUE, PAR FORMULAIRE DE PRODUIT, 2018-2032 (en MILLEUR)
TABLEAU 679 MARCHÉ DES TABLEAUX ELECTRIQUES AJUSTABLES DE LA MALAISIE, PAR FORMULAIRE DE PRODUIT, 2018-2032
TABLEAU 680 MALAYSIA MOTEUR UNIQUE DANS LE MARCHÉ DES TABLEAUX AJUSTABLES ÉLECTRIQUES STANDARD GRATUIT, PAR TYPE DE CADRE, 2018-2032 (en MILLEUR)
TABLEAU 681 MOTEUR UNIQUE DE MALAISIE DANS LE MARCHÉ DES TABLEAUX AJUSTABLES ÉLECTRIQUES PERMANENTES, PAR AJUSTEMENT SPEED, 2018-2032 (en MILLEUR)
TABLEAU 682 MOTEUR UNIQUE DE MALAISIE DANS LE MARCHÉ DES TABLEAUX ELECTRIQUES STANDING LIBRE, PAR INTERFACE DE CONTRÔLE, 2018-2032
TABLEAU 683 MALAYSIA DUAL MOTOR DANS LE MARCHÉ DES TABLEAUX ELECTRIQUES PERMANENT LIBREMENT AJUSTABLES, PAR TYPE DE CADRE, 2018-2032
TABLEAU 684 MALAYSIA DUAL MOTOR DANS LE MARCHÉ DES TABLEAUX AJUSTABLES ELECTRIQUES PERMANENTES LIBREMENT, PAR AJUSTEMENT SPEED, 2018-2032 (en MILLEUR)
TABLEAU 685 MALAYSIA DUAL MOTOR DANS LE MARCHÉ DES TABLEAUX ELECTRIQUES PERMANENT LIBREMENT AJUSTABLES, PAR INTERFACE DE CONTRÔLE, 2018-2032
TABLEAU 686 MALAYSIA MULTI-MOTEUR DANS LE MARCHÉ DES TABLEAUX ELECTRIQUES STANDARD GRATUIT, PAR TYPE DE CADRE, 2018-2032 (en MILLEUR)
TABLEAU 687 MALAYSIE MULTI-MOTEUR DANS LE MARCHÉ DES TABLEAUX ELECTRIQUES PERMANENT LIBREMENT AJUSTABLES, PAR AJUSTEMENT SPEED, 2018-2032 (en MILLEUR)
TABLEAU 688 MALAYSIA MULTI-MOTEUR DANS LE MARCHÉ DES TABLEAUX ELECTRIQUES STANDING LIBRE, PAR INTERFACE DE CONTRÔLE, 2018-2032 (en MILLEUR)
TABLEAU 689 MALAYSIE LIBRE STANDING ELECTRICAL HEIGHT-ADJUSTABLE TABLES MARCHÉ, PAR MATÉRIEL, 2018-2032 (en MILLIERS)
TABLEAU 690 MALAYSIE MÉTAL DANS LE MARCHÉ DES TABLEAUX ELECTRIQUES STANDING LIBRE, PAR TYPE, 2018-2032 (en MILLEUR)
TABLEAU 691 ACIER MALAYSIE DANS LE MARCHÉ DES TABLEAUX ELECTRIQUES STANDING LIBRE, PAR TYPE, 2018-2032 (MILLIERS USD)
TABLEAU 692 MARCHANDISES DE LA MALAISIE DANS LE MARCHÉ DES TABLEAUX AJUSTABLES ÉLECTRIQUES PERSONNELS, PAR TYPE, 2018-2032
TABLEAU 693 MARCHANDISES MALAYSIE ENGINÉES DANS LE MARCHÉ DES TABLEAUX ÉLECTRIQUES STANDARDS LIBRE, PAR TYPE, 2018-2032 (en milliers de dollars)
TABLEAU 694 MARCHANDISES SOLIDES DE MALAYSIA DANS LE MARCHÉ DES TABLEAUX ELECTRIQUES STANDARD GRATUIT, PAR TYPE, 2018-2032
TABLEAU 695 MALAISIE PLASTIQUE/COMPOSITE DANS LE MARCHÉ DES TABLEAUX ELECTRIQUES STANDARD LIBRE, PAR TYPE, 2018-2032 (en milliers de dollars)
TABLEAU 696 MALAYSIE LIBRE STANDING ELECTRICAL HEIGHT-ADJUSTABLE market, PAR DEMANDE, 2018-2032 (en MILLEUR)
TABLEAU 697 BUREAUX CORPORATAIRES DE LA MALAISIE DANS LE MARCHÉ DES TABLEAUX ELECTRIQUES PERSONNELS, PAR TYPE, 2018-2032
TABLEAU 698 RÉSIDENTIE DE LA MALAISIE DANS LE MARCHÉ DES TABLEAUX AJUSTABLES À L'HAUTE LIBRE STANDING, PAR TYPE, 2018-2032 (en MILLEUR)
TABLEAU 699 ÉDUCATION DE LA MALAISIE DANS LE MARCHÉ DES TABLEAUX AJUSTABLES À LA HAUTE ÉLECTRIQUE LIBRE STANDING, PAR TYPE, 2018-2032
TABLEAU 700 MALAYSIA SANTÉ DANS LE MARCHÉ DES TABLEAUX ELECTRIQUES STANDING LIBRE, PAR TYPE, 2018-2032 (en MILLEUR)
TABLEAU 701 MALAYSIE LIBRE STANDING ELECTRICAL HEIGHT-ADJUSTABLE market, PAR UTILISATEUR FINAL, 2018-2033 (en MILLEUR)
TABLEAU 702 MALAYSIE LIBRE STANDING ELECTRICAL HEIGHT-ADJUSTABLE market, PAR CHANEAU DE DISTRIBUTION, 2018-2033 (en MILLEUR)
TABLEAU 703 MALAYSIE LIBRE STANDING ELECTRICAL HEIGHT-ADJUSTABLE TABLES MARCHANDISES, PAR CHANEAU DE DISTRIBUTION, 2018-2033
TABLEAU 704 MARCHANDISES INDIRECTES DE LA MALAISIE DANS LE MARCHÉ DES TABLEAUX ELECTRIQUES STANDING LIBRE, PAR TYPE, 2018-2032 (en MILLEUR)
TABLEAU 705 STOCKS DE STAIL DE MALAISIE DANS LE MARCHÉ DES TABLEAUX ELECTRIQUES STANDARDS LIBREMENT AJUSTABLES, PAR TYPE, 2018-2032
TABLEAU 706 MALAISIE COMMERCE-E DANS LE MARCHÉ DES TABLEAUX AJUSTABLES ÉLECTRIQUES PERMANENT LIBREMENT, PAR TYPE, 2018-2032 (en milliers de dollars)
TABLEAU 707 TABLEAUX AJUSTABLES ÉLECTRIQUES DE L'INDONÉSIE, PAR FORMULAIRE DE PRODUIT, 2018-2032 (en milliers de dollars)
TABLEAU 708 TABLEAUX AJUSTABLES ÉLECTRIQUES DE L'INDONÉSIE, PAR FORMULAIRE DE PRODUIT, 2018-2032 (milliers d'unités)
TABLEAU 709 MOTEUR UNIQUE DE L'INDONESIE DANS LE MARCHÉ DES TABLEAUX ELECTRIQUES STANDARDS LIBREMENT AJUSTABLES, PAR TYPE DE CADRE, 2018-2032
TABLEAU 710 INDONÉSIE UNIQUE MOTEUR DANS LE MARCHÉ DES TABLEAUX ÉLECTRIQUES STANDARD GRATUIT, PAR AJUSTEMENT SPEED, 2018-2032 (en MILLIERS DE USD)
TABLEAU 711 IMMOBILIER UNIQUE DE L'INDONESIE DANS LE MARCHÉ DES TABLEAUX AJUSTABLES ÉLECTRIQUES PERMANENT LIBREMENT, PAR INTERFACE DE CONTRÔLE, 2018-2032 (en MILLIERS DE USD)
TABLEAU 712 DOUANIER INDONÉSIE DANS LE MARCHÉ DES TABLEAUX AJUSTABLES ÉLECTRIQUES PERMANENTES, PAR TYPE DE CADRE, 2018-2032 (en MILLEUR DE USD)
TABLEAU 713 INDONÉSIE DUAL MOTOR DANS LE MARCHÉ DES TABLEAUX ELECTRIQUES PERMANENT LIBREMENT AJUSTABLES, PAR AJUSTEMENT SPEED, 2018-2032
TABLEAU 714 INDONÉSIE DUAL MOTEUR DANS LE MARCHÉ DES TABLEAUX ELECTRIQUES STANDING LIBRE, PAR INTERFACE DE CONTRÔLE, 2018-2032 (MILLIERS DE USD)
TABLEAU 715 INDONÉSIE MULTI-MOTEUR DANS LE MARCHÉ DES TABLEAUX ELECTRIQUES STANDARD GRATUIT, PAR TYPE DE CADRE, 2018-2032
TABLEAU 716 INDONÉSIE MULTI-MOTEUR DANS LE MARCHÉ DES TABLEAUX ÉLECTRIQUES PERMANENTES, PAR AJUSTEMENT PRÉVUE, 2018-2032 (en MILLEUR)
TABLEAU 717 INDONÉSIE MULTI-MOTEUR DANS LE MARCHÉ DES TABLEAUX ELECTRIQUES PERMANENT LIBREMENT AJUSTABLES, PAR INTERFACE DE CONTRÔLE, 2018-2032
TABLEAU 718 INDONÉSIE LIBRE STANDING ELECTRICAL HEIGHT-ADJUSTABLE TABLEAUX MARCHANDISES, PAR MATÉRIEL, 2018-2032
TABLEAU 719 MÉTAL INDONÉSIE DANS LE MARCHÉ DES TABLEAUX ELECTRIQUES STANDING LIBRE, PAR TYPE, 2018-2032
TABLEAU 720 ACIER INDONÉSIE DANS LE MARCHÉ DES TABLEAUX ÉLECTRIQUES STANDARD GRATUIT, PAR TYPE, 2018-2032
TABLEAU 721 INDONÉSIE DANS LE MARCHÉ DES TABLEAUX ELECTRIQUES STANDARD GRATUIT, PAR TYPE, 2018-2032
TABLEAU 722 BOIS ENGINÉES EN INDONÉSIE DANS LE MARCHÉ DES TABLEAUX AJUSTABLES ÉLECTRIQUES PERMANENT, PAR TYPE, 2018-2032
TABLEAU 723 BOIS SOLIDE DE L'INDONESIE DANS LE MARCHÉ DES TABLEAUX AJUSTABLES À L'HAUTE ÉLECTRIQUE PERMANENTE GRATUITE, PAR TYPE, 2018-2032
TABLEAU 724 PLASTIQUE/COMPOSITE INDONÉSIE DANS LE MARCHÉ DES TABLEAUX AJUSTABLES ÉLECTRIQUES PERSONNELS, PAR TYPE, 2018-2032 (en milliers de dollars É.-U.)
TABLEAU 725 INDONÉSIE LIBRE STANDING ELECTRICAL HEIGHT-ADJUSTABLE TABLEAU DU MARCHÉ, PAR DEMANDE, 2018-2032
TABLEAU 726 BUREAUX CORPORATIQUES DE L'INDONESIE DANS LE MARCHÉ DES TABLEAUX ELECTRIQUES PERMANENTES, PAR TYPE, 2018-2032
TABLEAU 727 RÉSIDENTIE DE L'INDONESIE DANS LE MARCHÉ DES TABLEAUX AJUSTABLES DE L'HAUTEUR LIBRE STANDING, PAR TYPE, 2018-2032
TABLEAU 728 ÉDUCATION DE L'INDONÉSIE DANS LE MARCHÉ DES TABLEAUX AJUSTABLES À LA HAUTE ÉLECTRIQUE LIBRE STANDING, PAR TYPE, 2018-2032
TABLEAU 729 SANTE DE L'INDONESIE DANS LE MARCHÉ DES TABLEAUX AJUSTABLES ÉLECTRIQUES STANDARD GRATUIT, PAR TYPE, 2018-2032
TABLEAU 730 MARCHÉ DES TABLEAUX AJUSTABLES DE L'HAUTE ÉLECTRIQUE EN INDONÉSIE LIBRE, PAR UTILISATEUR FINAL, 2018-2033 (en MILLEUR)
TABLEAU 731 TABLEAUX AJUSTABLES ÉLECTRIQUES DE L'INDONÉSIE, PAR CHANEAU DE DISTRIBUTION, 2018-2033 (en milliers de dollars)
TABLEAU 732 TABLEAUX AJUSTABLES ÉLECTRIQUES DE L'INDONESIE, PAR CHANEAU DE DISTRIBUTION, 2018-2033
TABLEAU 733 INDONÉSIE VENTES INDIRECTES DANS LE MARCHÉ DES TABLEAUX ELECTRIQUES STANDARD GRATUIT, PAR TYPE, 2018-2032
TABLEAU 734 STOCKS DE STAIL INDONÉSIE DANS LE MARCHÉ DES TABLEAUX ÉLECTRIQUES STANDARD GRATUIT, PAR TYPE, 2018-2032
TABLEAU 735 INDONÉSIE COMMERCE EN ÉLECTRIQUE LIBRE STANDING MARCHÉ DES TABLEAUX AJUSTABLES, PAR TYPE, 2018-2032
TABLEAU 736 TABLEAUX AJUSTABLES DE HAUTE ÉLECTRIQUE STANDARD GRATUITS DE SINGAPORE, PAR FORMULAIRE DE PRODUIT, 2018-2032 (MILLIERS USD)
TABLEAU 737 MARCHÉ DES TABLEAUX AJUSTABLES À L'HAUTE ÉLECTRIQUE, PAR FORMULAIRE DE PRODUIT, 2018-2032 (milliers d'unités)
TABLEAU 738 MOTEUR SINGAPORE UNIQUE DANS LE MARCHÉ DES TABLEAUX AJUSTABLES ÉLECTRIQUES STANDARD LIBRE, PAR TYPE DE CADRE, 2018-2032 (en MILLE USD)
TABLEAU 739 MOTEUR UNIQUE DE SINGAPORE DANS LE MARCHÉ DES TABLEAUX AJUSTABLES ÉLECTRIQUES STANDARD LIBRE, PAR AJUSTEMENT SPEED, 2018-2032 (MILLIERS DE USD)
TABLEAU 740 MOTEUR SINGAPORE UNIQUE DANS LE MARCHÉ DES TABLEAUX AJUSTABLES ÉLECTRIQUES STANDARD LIBRE, PAR INTERFACE DE CONTRÔLE, 2018-2032 (en MILLEUR USD)
TABLEAU 741 DUAL MOTEUR DU SINGAPORE DANS LE MARCHÉ DES TABLEAUX AJUSTABLES DE L'HAUTE LIBRE STANDING, PAR TYPE DE CADRE, 2018-2032 (MILLIERS DE USD)
TABLEAU 742 SINGAPORE DUAL MOTOR DANS LE MARCHÉ DES TABLEAUX AJUSTABLES ÉLECTRIQUES PERMANENT LIBRE, PAR AJUSTEMENT SPEED, 2018-2032 (MILLIERS DE USD)
TABLEAU 743 DUAL MOTEUR DU SINGAPORE DANS LE MARCHÉ DES TABLEAUX AJUSTABLES ÉLECTRIQUES PERSONNELS, PAR INTERFACE DE CONTRÔLE, 2018-2032 (en MILLEUR DE USD)
TABLEAU 744 SINGAPORE MULTI-MOTEUR DANS LE MARCHÉ DES TABLEAUX ÉLECTRIQUES STANDARD GRATUIT, PAR TYPE DE CADRE, 2018-2032 (MILLIERS DE USD)
TABLEAU 745 SINGAPORE MULTI-MOTEUR DANS LE MARCHÉ DES TABLEAUX AJUSTABLES ÉLECTRIQUES STANDARD GRATUIT, PAR AJUSTEMENT SPEED, 2018-2032 (en MILLEUR)
TABLEAU 746 SINGAPORE MULTI-MOTEUR DANS LE MARCHÉ DES TABLEAUX AJUSTABLES ÉLECTRIQUES PERMANENT LIBRE, PAR INTERFACE DE CONTRÔLE, 2018-2032 (en MILLEUR)
TABLEAU 747 MARCHÉ DES TABLEAUX ÉLECTRIQUES AJUSTABLES, PAR MATÉRIEL, 2018-2032 (en MILLE USD)
TABLEAU 748 MÉTAL DU SINGAPORE DANS LE MARCHÉ DES TABLEAUX AJUSTABLES À L'HAUTE ÉLECTRIQUE LIBRE STANDING, PAR TYPE, 2018-2032
TABLEAU 749 ACIER DE SINGAPORE DANS LE MARCHÉ DES TABLEAUX AJUSTABLES À L'HAUTEUR LIBRE STANDARD, PAR TYPE, 2018-2032
TABLEAU 750 BOIS DE SINGAPORE DANS LE MARCHÉ DES TABLEAUX ELECTRIQUES STANDING LIBRE, PAR TYPE, 2018-2032 (en milliers de dollars)
TABLEAU 751 BOIS SINGAPORE ENGINÉES DANS LE MARCHÉ DES TABLEAUX ELECTRIQUES STANDARD GRATUIT, PAR TYPE, 2018-2032
TABLEAU 752 BOIS SOLIDES DE SINGAPORE DANS LE MARCHÉ DES TABLEAUX AJUSTABLES À L'HAUTE LIBRE STANDING, PAR TYPE, 2018-2032
TABLEAU 753 PLASTIQUE DU SINGAPORE/COMPOSITE DANS LE MARCHÉ DES TABLEAUX AJUSTABLES ÉLECTRIQUES STANDARD GRATUIT, PAR TYPE, 2018-2032
TABLEAU 754 MARCHÉ DES TABLEAUX AJUSTABLES À L'HAUTE ÉLECTRIQUE, PAR DEMANDE, 2018-2032
TABLEAU 755 BUREAUX CORPORÉS DE SINGAPORE DANS LE MARCHÉ DES TABLEAUX AJUSTABLES À L'HAUTE ÉLECTRIQUE, PAR TYPE, 2018-2032 (MILLIERS USD)
TABLEAU 756 RÉSIDENTIEL DU SINGAPORE DANS LE MARCHÉ DES TABLEAUX AJUSTABLES À L'HAUTE LIBRE STANDING, PAR TYPE, 2018-2032 (en milliers de dollars)
TABLEAU 757 ÉDUCATION DU SINGAPORE DANS LE MARCHÉ DES TABLEAUX ELECTRIQUES STANDING LIBRE, PAR TYPE, 2018-2032
TABLEAU 758 SINGAPORE SANTE DANS LE MARCHÉ DES TABLEAUX ELECTRIQUES STANDING LIBRE, PAR TYPE, 2018-2032 (MILLIERS USD)
TABLEAU 759 MARCHÉ DES TABLEAUX AJUSTABLES À L'HAUTE ÉLECTRIQUE, PAR UTILISATEUR FINAL, 2018-2033
TABLEAU 760 PAR CHANEAU DE DISTRIBUTION, 2018-2033 (en MILLEUR)
TABLEAU 761 SINGAPORE STANDING LIBRE MARCHÉ DES TABLEAUX ELECTRIQUES AJUSTABLES, PAR CHANEAU DE DISTRIBUTION, 2018-2033
TABLEAU 762 VENTES INDIRECTES DE SINGAPORE DANS LE MARCHÉ DES TABLEAUX AJUSTABLES ÉLECTRIQUES DE STANDARD LIBRE, PAR TYPE, 2018-2032 (en MILLIERS USD)
TABLEAU 763 STOCKS DE STAIL DE SINGAPORE DANS LE MARCHÉ DES TABLEAUX ÉLECTRIQUES STANDARD GRATUIT, PAR TYPE, 2018-2032
TABLEAU 764 COMMERCE-E-SINGAPORE DANS LE MARCHÉ DES TABLEAUX ELECTRIQUES STANDING GRATUIT, PAR TYPE, 2018-2032
TABLEAU 765 RESTAURATION DU MARCHÉ DES TABLEAUX ELECTRIQUES AJUSTABLES ASIE-PACIFIQUE, PAR FORMULAIRE DE PRODUIT, 2018-2032 (MILLIERS DE USD)
TABLEAU 766 RESTAURATION DU MARCHÉ DES TABLEAUX ELECTRIQUES AJUSTABLES ASIE-PACIFIQUE, PAR FORMULAIRE DE PRODUIT, 2018-2032
TABLEAU 767 RESTAURATION DE MOTEUR UNIQUE ASIE-PACIFIQUE DANS LE MARCHÉ DES TABLEAUX AJUSTABLES DE L'HAUTEUR ÉLECTRIQUE, PAR TYPE DE CADRE, 2018-2032 (en MILLEUR)
TABLEAU 768 RESTAURATION D'UN MOTEUR UNIQUE ASIE-PACIFIQUE DANS LE MARCHÉ DES TABLEAUX AJUSTABLES ÉLECTRIQUES PERMANENTES, PAR AJUSTEMENT PRÉVUE, 2018-2032 (MILLIERS DE DOLLARS)
TABLEAU 769 RESTAURATION D'UN MOTEUR UNIQUE ASIE-PACIFIQUE DANS LE MARCHÉ DES TABLEAUX AJUSTABLES ÉLECTRIQUES PERMANENTES, PAR INTERFACE DE CONTRÔLE, 2018-2032
TABLEAU 770 RESTAURATION DE LA DOUANE ASIE-PACIFIQUE DANS LE MARCHÉ DES TABLEAUX AJUSTABLES ÉLECTRIQUES STANDING LIBRE, PAR TYPE DE CADRE, 2018-2032 (en millions de dollars)
TABLEAU 771 RESTAURATION DE L'ASIE-PACIFIQUE SUR LE MARCHÉ DES TABLEAUX ELECTRIQUES AJUSTABLES, PAR AJUSTEMENT PRÉVUE, 2018-2032 (en MILLIERS DE USD)
TABLEAU 772 RESTAURATION DE LA DOUANE ASIE-PACIFIQUE DANS LE MARCHÉ DES TABLEAUX ELECTRIQUES AJUSTABLES, PAR INTERFACE DE CONTRÔLE, 2018-2032
TABLEAU 773 RESTAURATION DU MULTI-MOTEUR ASIE-PACIFIQUE DANS LE MARCHÉ DES TABLEAUX ELECTRIQUES AJUSTABLES À L'ÉTRANGER LIBRE, PAR TYPE DE CADRE, 2018-2032 (en MILLEUR)
TABLEAU 774 RESTAURATION DE MULTI-MOTEUR ASIE-PACIFIQUE DANS LE MARCHÉ DES TABLEAUX ELECTRIQUES AJUSTABLES LIBREMENT STANDING, PAR AJUSTEMENT SPEED, 2018-2032 (MILLIERS DE USD)
TABLEAU 775 RESTAURATION DE L'ASIE-PACIFIQUE MULTI-MOTEUR DANS LE MARCHÉ DES TABLEAUX ELECTRIQUES AJUSTABLES À L'ÉTRANGER LIBRE, PAR INTERFACE DE CONTRÔLE, 2018-2032 (MILLIERS DE DOLLARS)
TABLEAU 776 RESTAURATION DU MARCHÉ DES TABLEAUX ELECTRIQUES AJUSTABLES ASIE-PACIFIQUE, PAR MATÉRIEL, 2018-2032
TABLEAU 777 RESTAURATION DES MÉTAUX ASIE-PACIFIQUES DANS LE MARCHÉ DES TABLEAUX ELECTRIQUES STANDING LIBRE, PAR TYPE, 2018-2032 (MILLIERS DE USD)
TABLEAU 778 RESTAURATION DE L'ACIER ASIE-PACIFIQUE DANS LE MARCHÉ DES TABLEAUX AJUSTABLES ÉLECTRIQUES D'ÉTABLISSEMENT LIBRE, PAR TYPE, 2018-2032 (en milliers de dollars)
TABLEAU 779 RESTAURATION DE LA BOIS ASIE-PACIFIQUE DANS LE MARCHÉ DES TABLEAUX AJUSTABLES ÉLECTRIQUES LIBREMENT STANDARD, PAR TYPE, 2018-2032 (MILLE US)
TABLEAU 780 RESTAURATION DE LA BOIS ENGINÉE ASIE-PACIFIQUE DANS LE MARCHÉ DES TABLEAUX AJUSTABLES ÉLECTRIQUES STANDING LIBRE, PAR TYPE, 2018-2032 (MILLIERS DE USD)
TABLEAU 781 RESTAURATION DE LA BOIS SOLIDE ASIE-PACIFIQUE DANS LE MARCHÉ DES TABLEAUX AJUSTABLES DE L'HAUTEUR ÉLECTRIQUE, PAR TYPE, 2018-2032 (en milliers de dollars)
TABLEAU 782 RESTAURATION DE LA PLASTIQUE ASIE-PACIFIQUE/COMPOSITE DANS LE MARCHÉ DES TABLEAUX ELECTRIQUES STANDING LIBRE, PAR TYPE, 2018-2032 (MILLIERS DE USD)
TABLEAU 783 RESTAURATION DU MARCHÉ DES TABLEAUX ÉLECTRIQUES AJUSTABLES ASIE-PACIFIQUE, PAR DEMANDE, 2018-2032 (en MILLIERS DE USD)
TABLEAU 784 RESTAURATION DES BUREAUX DU CORPORAT ASIE-PACIFIQUE DANS LE MARCHÉ DES TABLEAUX ELECTRIQUES STANDING GRATUIT, PAR TYPE, 2018-2032
TABLEAU 785 RESTAURATION DE LA RESIDENTIE ASIE-PACIFIQUE DANS LE MARCHÉ DES TABLEAUX AJUSTABLES ÉLECTRIQUES À L'ÉTAT LIBRE, PAR TYPE, 2018-2032 (en milliers de dollars)
TABLEAU 786 RESTAURATION DE L'ENSEIGNEMENT ASIE-PACIFIQUE DANS LE MARCHÉ DES TABLEAUX AJUSTABLES ÉLECTRIQUES À L'ÉTAT LIBRE, PAR TYPE, 2018-2032 (en millions de dollars)
TABLEAU 787 RESTAURATION DU SECTEUR DE LA SANTÉ ASIE-PACIFIQUE DANS LE MARCHÉ DES TABLEAUX AJUSTABLES ÉLECTRIQUES STANDING LIBRE, PAR TYPE, 2018-2032 (en milliers de dollars)
TABLEAU 788 RESTAURATION DU MARCHÉ DES TABLEAUX ELECTRIQUES AJUSTABLES ASIE-PACIFIQUE LIBRE STANDING, PAR UTILISATEUR FINAL, 2018-2033
TABLEAU 789 RESTAURATION DU MARCHÉ DES TABLEAUX ELECTRIQUES AJUSTABLES ASIE-PACIFIQUE, PAR CHANEAU DE DISTRIBUTION, 2018-2033
TABLEAU 790 RESTAURATION DU MARCHÉ DES TABLEAUX ELECTRIQUES AJUSTABLES ASIE-PACIFIQUE, PAR CHANEAU DE DISTRIBUTION, 2018-2033
TABLEAU 791 RESTAURATION DES SOLDES INDIRECTES ASIE-PACIFIQUES DANS LE MARCHÉ DES TABLEAUX ELECTRIQUES STANDING GRATUIT, PAR TYPE, 2018-2032
TABLEAU 792 RESTAURATION DES STOCKS DE DÉTAILLAGE ASIE-PACIFIQUE DANS LE MARCHÉ DES TABLEAUX ELECTRIQUES STANDING LIBRE, PAR TYPE, 2018-2032 (en MILLIERS DE USD)
TABLEAU 793 RESTAURATION DU COMMERCE électronique ASIE-PACIFIQUE DANS LE MARCHÉ DES TABLEAUX AJUSTABLES DE L'HAUTEUR ÉLECTRIQUE LIBRE, PAR TYPE, 2018-2032 (en MILLEUR)
TABLEAU 794 AMÉRIQUE DU SUD MARCHÉ DES TABLEAUX AJUSTABLES ELECTRIQUES STANDING LIBRE, PAR PAYS, 2018-2032 (MILLIERS USD)
TABLEAU 795 AMÉRIQUE DU SUD MARCHÉ DES TABLEAUX ÉLECTRIQUES AJUSTABLES À L'ÉTRANGER GRATUITEMENT, PAR PAYS, 2018-2032 (milliers d'unités)
TABLEAU 796 AMÉRIQUE DU SUD MARCHÉ DES TABLEAUX ELECTRIQUES AJUSTABLES, PAR FORMULAIRE DE PRODUIT, 2018-2032 (MILLIERS USD)
TABLEAU 797 AMÉRIQUE DU SUD MARCHÉ DES TABLEAUX ÉLECTRIQUES AJUSTABLES À L'ÉTRANGER GRATUITEMENT, PAR FORMULAIRE DE PRODUIT, 2018-2032 (EN MILLIERS)
TABLEAU 798 AMÉRIQUE DU SUD MOTEUR UNIQUE DANS LE MARCHÉ DES TABLEAUX AJUSTABLES ÉLECTRIQUES STANDARD LIBRE, PAR TYPE DE CADRE, 2018-2032 (en MILLE USD)
TABLEAU 799 AMÉRIQUE DU SUD MOTEUR UNIQUE DANS LE MARCHÉ DES TABLEAUX AJUSTABLES ÉLECTRIQUES STANDARD LIBRE, PAR AJUSTEMENT SPEED, 2018-2032 (en MILLIERS DE USD)
TABLEAU 800 AMÉRIQUE DU SUD MOTEUR UNIQUE DANS LE MARCHÉ DES TABLEAUX AJUSTABLES ÉLECTRIQUES STANDARD LIBRE, PAR INTERFACE DE CONTRÔLE, 2018-2032 (en MILLIERS USD)
TABLEAU 801 AMÉRIQUE DU SUD MOTEUR DUL DANS LE MARCHÉ DES TABLEAUX AJUSTABLES ÉLECTRIQUES STANDARD GRATUIT, PAR TYPE DE CADRE, 2018-2032
TABLEAU 802 AMÉRIQUE DU SUD DOUANIER SUR LE MARCHÉ DES TABLEAUX AJUSTABLES ÉLECTRIQUES PERMANENTES, PAR AJUSTEMENT SPEED, 2018-2032 (en MILLIERS DE USD)
TABLEAU 803 AMÉRIQUE DU SUD MOTEUR DUL DANS LE MARCHÉ DES TABLEAUX ELECTRIQUES STANDING LIBRE, PAR INTERFACE DE CONTRÔLE, 2018-2032 (MILLIERS USD)
TABLEAU 804 AMÉRIQUE DU SUD MULTI-MOTEUR DANS LE MARCHÉ DES TABLEAUX ÉLECTRIQUES STANDARD GRATUIT, PAR TYPE DE CADRE, 2018-2032 (MILLIERS DE USD)
TABLEAU 805 AMÉRIQUE DU SUD MULTI-MOTEUR DANS LE MARCHÉ DES TABLEAUX AJUSTABLES ÉLECTRIQUES STANDARD LIBRE, PAR AJUSTEMENT SPEED, 2018-2032 (en MILLEUR)
TABLEAU 806 AMÉRIQUE DU SUD MULTI-MOTEUR DANS LE MARCHÉ DES TABLEAUX ÉLECTRIQUES STANDARD GRATUIT, PAR INTERFACE DE CONTRÔLE, 2018-2032 (en MILLEUR)
TABLEAU 807 AMÉRIQUE DU SUD MARCHÉ DES TABLEAUX ELECTRIQUES AJUSTABLES, PAR MATÉRIEL, 2018-2032
TABLEAU 808 MÉTAL DE L'AMÉRIQUE DU SUD DANS LE MARCHÉ DES TABLEAUX AJUSTABLES DE L'HAUTEUR LIBRE STANDING, PAR TYPE, 2018-2032 (en MILLEUR)
TABLEAU 809 ACIER DE L'AMÉRIQUE DU SUD DANS LE MARCHÉ DES TABLEAUX AJUSTABLES ÉLECTRIQUES À L'ÉTRANGER GRATUITEMENT, PAR TYPE, 2018-2032 (en milliers de dollars)
TABLEAU 810 BOIS D'AMÉRIQUE DU SUD DANS LE MARCHÉ DES TABLEAUX AJUSTABLES ÉLECTRIQUES STANDARD GRATUIT, PAR TYPE, 2018-2032
TABLEAU 811 BOIS ENGINÉES EN AMÉRIQUE DU SUD DANS LE MARCHÉ DES TABLEAUX AJUSTABLES ÉLECTRIQUES STANDARD GRATUIT, PAR TYPE, 2018-2032 (en MILLEUR)
TABLEAU 812 BOIS SOLIDE DE L'AMÉRIQUE DU SUD DANS LE MARCHÉ DES TABLEAUX AJUSTABLES ÉLECTRIQUES À L'ÉTRANGER GRATUITEMENT, PAR TYPE, 2018-2032 (en MILLE USD)
TABLEAU 813 PLASTIQUE/COMPOSITE DE L'AMÉRIQUE DU SUD DANS LE MARCHÉ DES TABLEAUX AJUSTABLES ÉLECTRIQUES À L'ÉTAT LIBRE, PAR TYPE, 2018-2032 (en MILLOIS USD)
TABLEAU 814 AMÉRIQUE DU SUD MARCHÉ DES TABLEAUX ELECTRIQUES AJUSTABLES, PAR DEMANDE, 2018-2032
TABLEAU 815 BUREAUX CORPORATAIRES DE L'AMÉRIQUE DU SUD DANS LE MARCHÉ DES TABLEAUX AJUSTABLES ÉLECTRIQUES PERMANENTES, PAR TYPE, 2018-2032 (en MILLIERS DE USD)
TABLEAU 816 RÉSIDENTIEL DE L'AMÉRIQUE DU SUD DANS LE MARCHÉ DES TABLEAUX AJUSTABLES ÉLECTRIQUES PERMANENTES, PAR TYPE, 2018-2032 (en milliers de dollars É.-U.)
TABLEAU 817 ÉDUCATION DE L'AMÉRIQUE DU SUD DANS LE MARCHÉ DES TABLEAUX AJUSTABLES À L'HAUTE ÉLECTRIQUE LIBRE STANDING, PAR TYPE, 2018-2032
TABLEAU 818 BIENVENUE DE L'AMÉRIQUE DU SUD DANS LE MARCHÉ DES TABLEAUX AJUSTABLES ÉLECTRIQUES STANDARD GRATUIT, PAR TYPE, 2018-2032
TABLEAU 819 AMERIQUE DU SUD MARCHÉ DES TABLEAUX ELECTRIQUES AJUSTABLES, PAR UTILISATEUR DE FIN, 2018-2033 (en MILLEUR)
TABLEAU 820 AMÉRIQUE DU SUD MARCHÉ DES TABLEAUX AJUSTABLES DE L'HAUTEUR ÉLECTRIQUE, PAR CHANEAU DE DISTRIBUTION, 2018-2033 (en milliers de dollars)
TABLEAU 821 AMÉRIQUE DU SUD MARCHÉ DES TABLEAUX ELECTRIQUES AJUSTABLES, PAR CHANEAU DE DISTRIBUTION, 2018-2033
TABLEAU 822 VENTES INDIRECTES D'AMÉRIQUE DU SUD DANS LE MARCHÉ DES TABLEAUX AJUSTABLES ÉLECTRIQUES STANDING GRATUIT, PAR TYPE, 2018-2032
TABLEAU 823 STOCKS DE DÉTAILLAGE DE L'AMÉRIQUE DU SUD DANS LE MARCHÉ DES TABLEAUX AJUSTABLES ÉLECTRIQUES STANDARD GRATUIT, PAR TYPE, 2018-2032 (en MILLEUR DE USD)
TABLEAU 824 AMÉRIQUE DU SUD COMMERCE-E DANS LE MARCHÉ DES TABLEAUX ÉLECTRIQUES STANDARD GRATUIT, PAR TYPE, 2018-2032 (MILLIERS DE USD)
TABLEAU 825 MARCHÉ DES TABLEAUX ÉLECTRIQUES AJUSTABLES DU BRÉSIL, PAR FORMULAIRE DE PRODUIT, 2018-2032
TABLEAU 826 MARCHÉ DES TABLEAUX ELECTRIQUES AJUSTABLES DU BRÉSIL, PAR FORMULAIRE DE PRODUIT, 2018-2032
TABLEAU 827 MOTEUR UNIQUE BRÉSIL DANS LE MARCHÉ DES TABLEAUX AJUSTABLES ÉLECTRIQUES STANDARD LIBRE, PAR TYPE DE CADRE, 2018-2032 (MILLIERS DE USD)
TABLEAU 828 MOTEUR UNIQUE BRÉSIL DANS LE MARCHÉ DES TABLEAUX AJUSTABLES ÉLECTRIQUES PERMANENTES, PAR AJUSTEMENT SPEED, 2018-2032 (en MILLEUR USD)
TABLEAU 829 MOTEUR UNIQUE BRÉSIL DANS LE MARCHÉ DES TABLEAUX AJUSTABLES DE L'HAUTEUR LIBRE STANDARD, PAR INTERFACE DE CONTRÔLE, 2018-2032 (en MILLE USD)
TABLEAU 830 BRESIL DUAL MOTOR DANS LE MARCHÉ DES TABLEAUX ELECTRIQUES STANDING LIBRE, PAR TYPE DE CADRE, 2018-2032 (MILLIERS DE USD)
TABLEAU 831 DUAL MOTEUR BRÉSIL DANS LE MARCHÉ DES TABLEAUX ELECTRIQUES LIBREMENT STANDING, PAR AJUSTEMENT SPEED, 2018-2032 (en MILLEUR DE USD)
TABLEAU 832 DUAL MOTEUR BRÉSIL DANS LE MARCHÉ DES TABLEAUX AJUSTABLES ÉLECTRIQUES PERMANENTES, PAR INTERFACE DE CONTRÔLE, 2018-2032 (en MILLEUR USD)
TABLEAU 833 BRÉSIL MULTI-MOTEUR DANS LE MARCHÉ DES TABLEAUX ELECTRIQUES STANDING GRATUIT, PAR TYPE DE CADRE, 2018-2032
TABLEAU 834 BRÉSIL MULTI-MOTEUR DANS LE MARCHÉ DES TABLEAUX ELECTRIQUES STANDING LIBRE, PAR AJUSTEMENT PRÉVUE, 2018-2032 (MILLIERS DE USD)
TABLEAU 835 BRÉSIL MULTI-MOTEUR DANS LE MARCHÉ DES TABLEAUX ÉLECTRIQUES STANDARD GRATUIT, PAR INTERFACE DE CONTRÔLE, 2018-2032
TABLEAU 836 MARCHÉ DES TABLEAUX ELECTRIQUES AJUSTABLES DU BRÉSIL, PAR MATÉRIEL, 2018-2032
TABLEAU 837 MÉTAUX BRÉSILAUX DANS LE MARCHÉ DES TABLEAUX ELECTRIQUES STANDING LIBRE, PAR TYPE, 2018-2032 (en milliers de dollars)
TABLEAU 838 ACIER BRÉSIL DANS LE MARCHÉ DES TABLEAUX ÉLECTRIQUES STANDARD GRATUIT, PAR TYPE, 2018-2032
TABLEAU 839 BOIS BRÉSIL DANS LE MARCHÉ DES TABLEAUX AJUSTABLES À LA HAUTE ÉLECTRIQUE LIBRE STANDING, PAR TYPE, 2018-2032 (en milliers de dollars)
TABLEAU 840 BOIS ENGINÉES BRÉSIL DANS LE MARCHÉ DES TABLEAUX ÉLECTRIQUES STANDARD GRATUIT, PAR TYPE, 2018-2032
TABLEAU 841 BOIS SOLIDE BRÉSIL DANS LE MARCHÉ DES TABLEAUX ELECTRIQUES STANDARD GRATUIT, PAR TYPE, 2018-2032
TABLEAU 842 PLASTIQUE BRÉSIL/COMPOSITE DANS LE MARCHÉ DES TABLEAUX ÉLECTRIQUES STANDARD GRATUIT, PAR TYPE, 2018-2032
TABLEAU 843 MARCHÉ DES TABLEAUX AJUSTABLES À L'HAUTE ÉLECTRIQUE, PAR DEMANDE, 2018-2032 (en milliers de dollars)
TABLEAU 844 BUREAUX DU CORPORAT BRÉSIL DANS LE MARCHÉ DES TABLEAUX AJUSTABLES À L'HAUTE ÉLECTRIQUE LIBRE, PAR TYPE, 2018-2032 (en milliers de dollars)
TABLEAU 845 RESIDENTIEL BRÉSIL DANS LE MARCHÉ DES TABLEAUX ELECTRIQUES STANDING LIBRE, PAR TYPE, 2018-2032
TABLEAU 846 ÉDUCATION DU BRÉSIL DANS LE MARCHÉ DES TABLEAUX ELECTRIQUES STANDING LIBRE, PAR TYPE, 2018-2032 (MILLIERS DE USD)
TABLEAU 847 SANTE BRÉSILALE DANS LE MARCHÉ DES TABLEAUX ÉLECTRIQUES STANDING LIBRE, PAR TYPE, 2018-2032 (en MILLIERS USD)
TABLEAU 848 MARCHÉ DES TABLEAUX ELECTRIQUES AJUSTABLES BRÉSIL, PAR UTILISATEUR DE FIN, 2018-2033
TABLEAU 849 MARCHÉ DES TABLEAUX ELECTRIQUES AJUSTABLES DU BRÉSIL, PAR CHANEAU DE DISTRIBUTION, 2018-2033
TABLEAU 850 MARCHÉ DES TABLEAUX AJUSTABLES DE L'HAUTE ÉLECTRIQUE, PAR CHANEAU DE DISTRIBUTION, 2018-2033 (EN MILLIERS)
TABLEAU 851 VENTES INDIRECTES BRÉSILES DANS LE MARCHÉ DES TABLEAUX ELECTRIQUES STANDING GRATUITS, PAR TYPE, 2018-2032 (en MILLIERS USD)
TABLEAU 852 STOCKS DE STAIL BRÉSIL DANS LE MARCHÉ DES TABLEAUX ELECTRIQUES STANDING GRATUIT, PAR TYPE, 2018-2032
TABLEAU 853 COMMERCE-E BRÉSIL DANS LE MARCHÉ DES TABLEAUX AJUSTABLES ÉLECTRIQUES STANDARD GRATUIT, PAR TYPE, 2018-2032
TABLEAU 854 ARGENTINE MARCHÉ DES TABLEAUX ÉLECTRIQUES AJUSTABLES À L'ÉTRANGER GRATUITEMENT, PAR FORMULAIRE DE PRODUIT, 2018-2032 (en MILLIERS USD)
TABLEAU 855 ARGENTINE STANDING LIBRE MARCHÉ DES TABLEAUX AJUSTABLES DE HAUTE ÉLECTRIQUE, PAR FORMULAIRE DE PRODUIT, 2018-2032 (milliers d'unités)
TABLEAU 856 ARGENTINE SINGLE MOTEUR DANS LE MARCHÉ DES TABLEAUX AJUSTABLES ÉLECTRIQUES STANDARD GRATUIT, PAR TYPE DE CADRE, 2018-2032
TABLEAU 857 ARGENTINE SINGLE MOTEUR DANS LE MARCHÉ DES TABLEAUX AJUSTABLES ÉLECTRIQUES STANDARD GRATUIT, PAR AJUSTEMENT SPEED, 2018-2032 (en MILLEUR)
TABLEAU 858 ARGENTINE SINGLE MOTEUR DANS LE MARCHÉ DES TABLEAUX ÉLECTRIQUES STANDARD GRATUIT, PAR INTERFACE DE CONTRÔLE, 2018-2032 (en MILLEUR DE USD)
TABLEAU 859 ARGENTINE DUAL MOTOR DANS LE MARCHÉ DES TABLEAUX ÉLECTRIQUES PERMANENTES, PAR TYPE DE CADRE, 2018-2032 (MILLIERS DE USD)
TABLEAU 860 ARGENTINE DUAL MOTOR DANS LE MARCHÉ DES TABLEAUX AJUSTABLES ÉLECTRIQUES PERMANENT LIBRE, PAR AJUSTEMENT SPEED, 2018-2032 (en MILLIERS USD)
TABLEAU 861 ARGENTINE DUAL MOTOR DANS LE MARCHÉ DES TABLEAUX ELECTRIQUES STANDING LIBRE, PAR INTERFACE DE CONTRÔLE, 2018-2032 (en MILLIERS DE USD)
TABLEAU 862 ARGENTINE MULTI-MOTEUR DANS LE MARCHÉ DES TABLEAUX ÉLECTRIQUES STANDARD GRATUIT, PAR TYPE DE CADRE, 2018-2032 (MILLIERS DE USD)
TABLEAU 863 ARGENTINE MULTI-MOTEUR DANS LE MARCHÉ DES TABLEAUX ÉLECTRIQUES STANDARD GRATUIT, PAR AJUSTEMENT PRÉVUE, 2018-2032 (en MILLEUR)
TABLEAU 864 ARGENTINE MULTI-MOTEUR DANS LE MARCHÉ DES TABLEAUX ELECTRIQUES LIBREMENT STANDING, PAR INTERFACE DE CONTRÔLE, 2018-2032 (MILLIERS DE USD)
TABLEAU 865 ARGENTINE STANDING LIBRE MARCHÉ DES TABLEAUX ELECTRIQUES AJUSTABLES DE L'HAUTEUR, PAR MATÉRIEL, 2018-2032
TABLEAU 866 ARGENTINE MÉTALE DANS LE MARCHÉ DES TABLEAUX ELECTRIQUES STANDING LIBRE, PAR TYPE, 2018-2032
TABLEAU 867 ACIER D'ARGENTINE DANS LE MARCHÉ DES TABLEAUX ELECTRIQUES STANDING LIBRE, PAR TYPE, 2018-2032
TABLEAU 868 GRANDE ARGENTINE DANS LE MARCHÉ DES TABLEAUX ELECTRIQUES STANDING LIBRE, PAR TYPE, 2018-2032
TABLEAU 869 ARGENTINE ENGINEERED WOOD DANS LE MARCHÉ DES TABLEAUX AJUSTABLES ÉLECTRIQUES PERMANENT, PAR TYPE, 2018-2032
TABLEAU 870 BOIS SOLIDE D'ARGENTINE DANS LE MARCHÉ DES TABLEAUX AJUSTABLES À L'HAUTE ÉLECTRIQUE LIBRE STANDING, PAR TYPE, 2018-2032
TABLEAU 871 ARGENTINE PLASTIQUE/COMPOSITE DANS LE MARCHÉ DES TABLEAUX ÉLECTRIQUES STANDARD GRATUIT, PAR TYPE, 2018-2032 (MILLIERS DE USD)
TABLEAU 872 ARGENTINE STANDING LIBRE MARCHÉ DES TABLEAUX AJUSTABLES À LA HAUTE ÉLECTRIQUE, PAR DEMANDE, 2018-2032 (en MILLE USD)
TABLEAU 873 BUREAUX CORPORATIQUES DE L'ARGENTINE DANS LE MARCHÉ DES TABLEAUX AJUSTABLES ÉLECTRIQUES PERMANENTES, PAR TYPE, 2018-2032 (en MILLEUR DE USD)
TABLEAU 874 ARGENTINE RÉSIDENTIEL DU MARCHÉ DES TABLEAUX ELECTRIQUES STANDING LIBRE, PAR TYPE, 2018-2032 (MILLIERS USD)
TABLEAU 875 ARGENTINE ÉDUCATION DANS LE MARCHÉ DES TABLEAUX ELECTRIQUES STANDING LIBRE, PAR TYPE, 2018-2032 (en milliers de dollars)
TABLEAU 876 ARGENTINE SANTE DANS LE MARCHÉ DES TABLEAUX ELECTRIQUES STANDING LIBRE, PAR TYPE, 2018-2032
TABLEAU 877 ARGENTINE MARCHÉ DES TABLEAUX ELECTRIQUES AJUSTABLES, PAR UTILISATEUR FINAL, 2018-2033 (en MILLEUR)
TABLEAU 878 ARGENTINE LIBRE STANDING MARCHÉ DES TABLEAUX ELECTRIQUES AJUSTABLES, PAR CHANEAU DE DISTRIBUTION, 2018-2033 (en MILLIERS DE DOLLARS)
TABLEAU 879 ARGENTINE STANDING LIBRE MARCHÉ DES TABLEAUX ELECTRIQUES AJUSTABLES, PAR CHANEAU DE DISTRIBUTION, 2018-2033
TABLEAU 880 ARGENTINE VENTES INDIRECTES DANS LE MARCHÉ DES TABLEAUX ELECTRIQUES STANDING GRATUIT, PAR TYPE, 2018-2032 (MILLIERS DE USD)
TABLEAU 881 STOCKS DE STAIL ARGENTINE DANS LE MARCHÉ DES TABLEAUX ELECTRIQUES STANDARD GRATUIT, PAR TYPE, 2018-2032
TABLEAU 882 ARGENTINE E-COMMERCE DANS LE MARCHÉ DES TABLEAUX ELECTRIQUES STANDING GRATUIT, PAR TYPE, 2018-2032
TABLEAU 883 MARCHÉ DES TABLEAUX AJUSTABLES À L'HAUTE ÉLECTRIQUE DE LA COLOMBIE, PAR FORMULAIRE DE PRODUIT, 2018-2032
TABLEAU 884 GRANDE COLOMBIE STANDING ELECTRICAL TABLEAUX AJUSTABLES MARCHÉ, PAR FORMULAIRE DE PRODUIT, 2018-2032 (MILLIERS)
TABLEAU 885 MOTEUR UNIQUE DE LA COLOMBIE DANS LE MARCHÉ DES TABLEAUX AJUSTABLES ÉLECTRIQUES PERMANENTES, PAR TYPE DE CADRE, 2018-2032 (en MILLEUR DE USD)
TABLEAU 886 MOTEUR UNIQUE DE COLOMBIE DANS LE MARCHÉ DES TABLEAUX AJUSTABLES ÉLECTRIQUES STANDARD LIBRE, PAR AJUSTEMENT SPEED, 2018-2032 (en MILLEUR)
TABLEAU 887 MOTEUR UNIQUE COLOMBIE DANS LE MARCHÉ DES TABLEAUX AJUSTABLES ÉLECTRIQUES PERMANENT LIBRE, PAR INTERFACE DE CONTRÔLE, 2018-2032 (en MILLE USD)
TABLEAU 888 COLOMBIE DUAL MOTOR DANS LE MARCHÉ DES TABLEAUX ELECTRIQUES STANDING LIBRE, PAR TYPE DE CADRE, 2018-2032 (MILLIERS DE USD)
TABLEAU 889 COLOMBIE DUAL MOTOR DANS LE MARCHÉ DES TABLEAUX AJUSTABLES ÉLECTRIQUES STANDARD GRATUIT, PAR AJUSTEMENT SPEED, 2018-2032 (MILLIERS DE USD)
TABLEAU 890 COLOMBIE DUAL MOTOR DANS LE MARCHÉ DES TABLEAUX ELECTRIQUES STANDING LIBRE, PAR INTERFACE DE CONTRÔLE, 2018-2032 (MILLIERS DE USD)
TABLEAU 891 COLOMBIE MULTI-MOTEUR DANS LE MARCHÉ DES TABLEAUX ELECTRIQUES STANDING LIBRE, PAR TYPE DE CADRE, 2018-2032 (MILLIERS DE USD)
TABLEAU 892 COLOMBIE MULTI-MOTEUR DANS LE MARCHÉ DES TABLEAUX AJUSTABLES ÉLECTRIQUES STANDARD GRATUIT, PAR AJUSTEMENT SPEED, 2018-2032 (en MILLEUR)
TABLEAU 893 COLOMBIE MULTI-MOTEUR DANS LE MARCHÉ DES TABLEAUX ELECTRIQUES AJUSTABLES PERMANENT LIBRE, PAR INTERFACE DE CONTRÔLE, 2018-2032 (en MILLEUR)
TABLEAU 894 GRANDE COLOMBIE STANDING ELECTRICAL TABLES AJUSTABLES MARCHÉ, PAR MATÉRIEL, 2018-2032 (en milliers de dollars)
TABLEAU 895 MÉTAL COLOMBIQUE DANS LE MARCHÉ DES TABLEAUX ÉLECTRIQUES STANDING LIBRE, PAR TYPE, 2018-2032 (en milliers de dollars)
TABLEAU 896 ACIER COLOMBIE DANS LE MARCHÉ DES TABLEAUX AJUSTABLES ÉLECTRIQUES STANDARD GRATUIT, PAR TYPE, 2018-2032
TABLEAU 897 BOIS DE COLOMBIE DANS LE MARCHÉ DES TABLEAUX ELECTRIQUES STANDING LIBRE, PAR TYPE, 2018-2032
TABLEAU 898 BOIS GÉNÉRÉES DE LA COLOMBIE DANS LE MARCHÉ DES TABLEAUX AJUSTABLES ÉLECTRIQUES PERMANENT, PAR TYPE, 2018-2032
TABLEAU 899 BOIS SOLIDE DE LA COLOMBIE DANS LE MARCHÉ DES TABLEAUX AJUSTABLES DE HAUTE ÉLECTRIQUE PERMANENTE GRATUITE, PAR TYPE, 2018-2032 (en milliers de dollars)
TABLEAU 900 COLOMBIE PLASTIQUE/COMPOSITE DANS LE MARCHÉ DES TABLEAUX ELECTRIQUES STANDARD GRATUIT, PAR TYPE, 2018-2032
TABLEAU 901 MARCHÉ DES TABLEAUX AJUSTABLES À L'HAUTE ÉLECTRIQUE LIBRE DE LA COLOMBIE, PAR APPLICATION, 2018-2032 (en milliers de dollars)
TABLEAU 902 BUREAUX CORPORATIQUES DE COLOMBIE DANS LE MARCHÉ DES TABLEAUX AJUSTABLES ÉLECTRIQUES PERMANENTES, PAR TYPE, 2018-2032 (en MILLEUR)
TABLEAU 903 RESIDENTIEL DE LA COLOMBIE DANS LE MARCHÉ DES TABLEAUX AJUSTABLES DE L'HAUTEUR LIBRE STANDING, PAR TYPE, 2018-2032 (en MILLEUR)
TABLEAU 904 ÉDUCATION DE LA COLOMBIE DANS LE MARCHÉ DES TABLEAUX ELECTRIQUES STANDING LIBRE, PAR TYPE, 2018-2032
TABLEAU 905 SANTE COLOMBIE DANS LE MARCHÉ DES TABLEAUX ELECTRIQUES STANDING LIBRE, PAR TYPE, 2018-2032
TABLEAU 906 MARCHÉ DES TABLEAUX ELECTRIQUES AJUSTABLES, PAR UTILISATEUR DE LA COLOMBIE, 2018-2033
TABLEAU 907 GRANDE COLOMBIE STANDING ELECTRICAL TABLEAUX AJUSTABLES MARCHÉ, PAR CHANEAU DE DISTRIBUTION, 2018-2033 (en MILLIERS USD)
TABLEAU 908 GRANDE COLOMBIE STANDING ELECTRICAL TABLES AJUSTABLES MARCHÉ, PAR CHANEAU DE DISTRIBUTION, 2018-2033 (milliers d'unités)
TABLEAU 909 COLOMBIE VENTES INDIRECTES DANS LE MARCHÉ DES TABLEAUX ELECTRIQUES STANDING GRATUIT, PAR TYPE, 2018-2032 (en milliers de dollars)
TABLEAU 910 STOCKS DE DÉTAILLAGE DE COLOMBIE DANS LE MARCHÉ DES TABLEAUX ELECTRIQUES STANDARDS LIBRE, PAR TYPE, 2018-2032 (en milliers de dollars)
TABLEAU 911 COLOMBIE E-COMMERCE DANS LE MARCHÉ DES TABLEAUX ELECTRIQUES STANDING LIBRE, PAR TYPE, 2018-2032 (en MILLIERS USD)
TABLEAU 912 MARCHÉ DES TABLEAUX AJUSTABLES À L'HAUTE ÉLECTRIQUE, PAR FORMULAIRE DE PRODUIT, 2018-2032 (en MILLIERS USD)
TABLEAU 913 MARCHÉ DES TABLEAUX AJUSTABLES DE HAUTE ÉLECTRIQUE STANDING LIBRE DE CHILE, PAR FORMULAIRE DE PRODUIT, 2018-2032
TABLEAU 914 MOTEUR UNIQUE DE CHILE DANS LE MARCHÉ DES TABLEAUX ELECTRIQUES STANDING LIBRE, PAR TYPE DE CADRE, 2018-2032 (MILLIERS DE USD)
TABLEAU 915 MOTEUR UNIQUE DE CHILE DANS LE MARCHÉ DES TABLEAUX ELECTRIQUES STANDING LIBRE, PAR AJUSTEMENT SPEED, 2018-2032 (MILLIERS DE USD)
TABLEAU 916 MOTEUR UNIQUE DE CHILE DANS LE MARCHÉ DES TABLEAUX ELECTRIQUES STANDING LIBRE, PAR INTERFACE DE CONTRÔLE, 2018-2032 (MILLIERS DE USD)
TABLEAU 917 MOTEUR DUL DE CHILE DANS LE MARCHÉ DES TABLEAUX ELECTRIQUES STANDING LIBRE, PAR TYPE DE CADRE, 2018-2032 (MILLIERS USD)
TABLEAU 918 MOTEUR DU DUAL CHILE DANS LE MARCHÉ DES TABLEAUX AJUSTABLES ÉLECTRIQUES PERMANENTES LIBREMENT, PAR AJUSTEMENT SPEED, 2018-2032 (en MILLEUR DE USD)
TABLEAU 919 DUAL MOTEUR DE CHILE DANS LE MARCHÉ DES TABLEAUX ELECTRIQUES LIBREMENT STANDING, PAR INTERFACE DE CONTRÔLE, 2018-2032
TABLEAU 920 CHILI MULTI-MOTEUR DANS LE MARCHÉ DES TABLEAUX ELECTRIQUES STANDING LIBRE, PAR TYPE DE CADRE, 2018-2032 (MILLIERS DE USD)
TABLEAU 921 CHILI MULTI-MOTEUR DANS LE MARCHÉ DES TABLEAUX AJUSTABLES ÉLECTRIQUES STANDARD GRATUIT, PAR AJUSTEMENT SPEED, 2018-2032 (en MILLIERS DE USD)
TABLEAU 922 CHILI MULTI-MOTEUR DANS LE MARCHÉ DES TABLEAUX ELECTRIQUES LIBREMENT STANDING, PAR INTERFACE DE CONTRÔLE, 2018-2032
TABLEAU 923 MARCHÉ DES TABLEAUX ÉLECTRIQUES AJUSTABLES, PAR MATÉRIEL, 2018-2032
TABLEAU 924 MÉTAUX CHILIAUX DANS LE MARCHÉ DES TABLEAUX ELECTRIQUES STANDING LIBRE, PAR TYPE, 2018-2032 (en MILLIERS USD)
TABLEAU 925 ACIER À CHILE DANS LE MARCHÉ DES TABLEAUX ELECTRIQUES STANDING GRATUIT, PAR TYPE, 2018-2032
TABLEAU 926 BOIS À CHILE DANS LE MARCHÉ DES TABLEAUX ELECTRIQUES STANDING LIBRE, PAR TYPE, 2018-2032
TABLEAU 927 BOIS ENGINÉES EN CHILI DANS LE MARCHÉ DES TABLEAUX AJUSTABLES À L'HAUTEUR LIBRE, PAR TYPE, 2018-2032
TABLEAU 928 BOIS SOLIDES À CHILE DANS LE MARCHÉ DES TABLEAUX AJUSTABLES À L'HAUTEUR LIBRE, PAR TYPE, 2018-2032
TABLEAU 929 PLASTIQUE CHILE/COMPOSITE DANS LE MARCHÉ DES TABLEAUX ÉLECTRIQUES STANDARD GRATUIT, PAR TYPE, 2018-2032
TABLEAU 930 MARCHÉ DES TABLEAUX AJUSTABLES À L'HAUTE ÉLECTRIQUE, PAR DEMANDE, 2018-2032
TABLEAU 931 BUREAUX DU CORPORAT DE CHILI DANS LE MARCHÉ DES TABLEAUX AJUSTABLES À L'HAUTE ÉLECTRIQUE LIBRE, PAR TYPE, 2018-2032 (en milliers de dollars)
TABLEAU 932 RÉSIDENTIEL DU CHILI DANS LE MARCHÉ DES TABLEAUX ELECTRIQUES STANDING LIBRE, PAR TYPE, 2018-2032
TABLEAU 933 ÉDUCATION DU CHILI DANS LE MARCHÉ DES TABLEAUX ÉLECTRIQUES STANDING LIBRE, PAR TYPE, 2018-2032 (en milliers de dollars)
TABLEAU 934 SANTE DU CHILI DANS LE MARCHÉ DES TABLEAUX ÉLECTRIQUES STANDING LIBRE, PAR TYPE, 2018-2032 (en MILLIERS USD)
TABLEAU 935 MARCHÉ DES TABLEAUX AJUSTABLES DE L'HAUTEUR ÉLECTRIQUE, PAR UTILISATEUR DE CHILI, 2018-2033 (en milliers de dollars)
TABLEAU 936 MARCHÉ DES TABLEAUX AJUSTABLES À L'HAUTE ÉLECTRIQUE, PAR CHANEAU DE DISTRIBUTION, 2018-2033 (en MILLIERS USD)
TABLEAU 937 MARCHÉ DES TABLEAUX AJUSTABLES À L'HAUTE ÉLECTRIQUE, PAR CHANEAU DE DISTRIBUTION, 2018-2033
TABLEAU 938 VENTES INDIRECTES DE CHILI DANS LE MARCHÉ DES TABLEAUX AJUSTABLES À LA HAUTE ÉLECTRIQUE GRATUITE, PAR TYPE, 2018-2032 (en MILLEUR)
TABLEAU 939 STOCKS DE STAIL CHILE DANS LE MARCHÉ DES TABLEAUX ELECTRIQUES STANDING LIBRE, PAR TYPE, 2018-2032 (MILLIERS DE USD)
TABLEAU 940 COMMERCE ÉLECTRIQUE À CHILE DANS LE MARCHÉ DES TABLEAUX AJUSTABLES À L'HAUTE LIBRE STANDING, PAR TYPE, 2018-2032 (en MILLEUR)
TABLEAU 941 EST DE L'AMÉRIQUE DU SUD MARCHÉ DES TABLEAUX ÉLECTRIQUES AJUSTABLES, PAR FORMULAIRE DE PRODUIT, 2018-2032 (en MILLIERS USD)
TABLEAU 942 RESTAURATION DU MARCHÉ DES TABLEAUX ELECTRIQUES AJUSTABLES DE L'AMÉRIQUE DU SUD, PAR FORMULAIRE DE PRODUIT, 2018-2032
TABLEAU 943 EST DE L'AMÉRIQUE DU SUD MOTEUR UNIQUE DANS LE MARCHÉ DES TABLEAUX AJUSTABLES ÉLECTRIQUES STANDARD LIBRE, PAR TYPE DE CADRE, 2018-2032 (en MILLEUR)
TABLEAU 944 EST DE L'AMÉRIQUE DU SUD MOTEUR UNIQUE DANS LE MARCHÉ DES TABLEAUX AJUSTABLES ÉLECTRIQUES STANDING LIBRE, PAR AJUSTEMENT PRÉVUE, 2018-2032 (MILLIERS DE USD)
TABLEAU 945 EST DE L'AMÉRIQUE DU SUD MOTEUR UNIQUE DANS LE MARCHÉ DES TABLEAUX AJUSTABLES ÉLECTRIQUES STANDING LIBRE, PAR INTERFACE DE CONTRÔLE, 2018-2032 (MILLIERS DE DOLLARS)
TABLEAU 946 RESTAURATION DE L'AMÉRIQUE DU SUD DOUANIÈRE DANS LE MARCHÉ DES TABLEAUX ELECTRIQUES STANDING LIBRE, PAR TYPE DE CADRE, 2018-2032 (en MILLEUR)
TABLEAU 947 RESTAURATION DE L'AMÉRIQUE DU SUD DOUANIÈRE DANS LE MARCHÉ DES TABLEAUX ELECTRIQUES AJUSTABLES À L'ÉTAT LIBRE, PAR AJUSTEMENT PRÉVUE, 2018-2032 (en MILLIERS DE USD)
TABLEAU 948 RESTAURATION DE L'AMÉRIQUE DU SUD DOUANIÈRE DANS LE MARCHÉ DES TABLEAUX ELECTRIQUES AJUSTABLES, PAR INTERFACE DE CONTRÔLE, 2018-2032
TABLEAU 949 EST DE L'AMÉRIQUE DU SUD MULTI-MOTEUR DANS LE MARCHÉ DES TABLEAUX AJUSTABLES ÉLECTRIQUES STANDING LIBRE, PAR TYPE DE CADRE, 2018-2032 (MILLIERS DE USD)
TABLEAU 950 EST DE L'AMÉRIQUE DU SUD MULTI-MOTEUR DANS LE MARCHÉ DES TABLEAUX ELECTRIQUES AJUSTABLES À L'ÉTAT LIBRE, PAR AJUSTEMENT SPEED, 2018-2032 (MILLIERS DE USD)
TABLEAU 951 RESTAURATION DE L'AMÉRIQUE DU SUD MULTI-MOTEUR DANS LE MARCHÉ DES TABLEAUX ELECTRIQUES AJUSTABLES LIBREMENT STANDING, PAR INTERFACE DE CONTRÔLE, 2018-2032 (MILLIERS DE USD)
TABLEAU 952 RESTAURATION DU MARCHÉ DES TABLEAUX ELECTRIQUES AJUSTABLES DE L'AMÉRIQUE DU SUD, PAR MATÉRIEL, 2018-2032
TABLEAU 953 RESTAURATION DU MÉTAL DE L'AMÉRIQUE DU SUD DANS LE MARCHÉ DES TABLEAUX ELECTRIQUES STANDING LIBRE, PAR TYPE, 2018-2032
TABLEAU 954 RESTAURATION DE L'ACIER DE L'AMÉRIQUE DU SUD DANS LE MARCHÉ DES TABLEAUX AJUSTABLES À L'HAUTEUR LIBRE STANDARD, PAR TYPE, 2018-2032
TABLEAU 955 RESTAURATION DE LA BOIS D'AMÉRIQUE DU SUD DANS LE MARCHÉ DES TABLEAUX AJUSTABLES ÉLECTRIQUES À L'ÉTAT LIBRE, PAR TYPE, 2018-2032
TABLEAU 956 RESTAURATION DE BOIS ENGINÉES DE L'AMÉRIQUE DU SUD DANS LE MARCHÉ DES TABLEAUX AJUSTABLES ÉLECTRIQUES À L'ÉTAT LIBRE, PAR TYPE, 2018-2032 (en MILLE USD)
TABLEAU 957 EST DE LA BOIS SOLIDE D'AMÉRIQUE DU SUD DANS LE MARCHÉ DES TABLEAUX AJUSTABLES ÉLECTRIQUES STANDING GRATUIT, PAR TYPE, 2018-2032
TABLEAU 958 RESTAURATION DE PLASTIC/COMPOSITE DE L'AMÉRIQUE DU SUD DANS LE MARCHÉ DES TABLEAUX ELECTRIQUES AJUSTABLES À L'ÉTRANGER LIBREMENT, PAR TYPE, 2018-2032 (MILLIERS DE USD)
TABLEAU 959 RESTAURATION D'AMÉRIQUE DU SUD MARCHÉ DES TABLEAUX ELECTRIQUES AJUSTABLES, PAR DEMANDE, 2018-2032
TABLEAU 960 RESTAURATION DES BUREAUX CORPORATAIRES DE L'AMÉRIQUE DU SUD DANS LE MARCHÉ DES TABLEAUX ELECTRIQUES AJUSTABLES, PAR TYPE, 2018-2032 (en millions de dollars É.-U.)
TABLEAU 961 EST DE L'AMÉRIQUE DU SUD RESIDENTIEL DANS LE MARCHÉ DES TABLEAUX ELECTRIQUES STANDARDS, PAR TYPE, 2018-2032 (en MILLIERS USD)
TABLEAU 962 RESTAURATION DE L'ÉDUCATION DE L'AMÉRIQUE DU SUD DANS LE MARCHÉ DES TABLEAUX AJUSTABLES DE L'HAUTEUR LIBRE STANDARD, PAR TYPE, 2018-2032 (MILLIERS DE USD)
TABLEAU 963 RESTAURATION DU SECTEUR DE LA SANTÉ DE L'AMÉRIQUE DU SUD DANS LE MARCHÉ DES TABLEAUX AJUSTABLES ÉLECTRIQUES STANDARD GRATUIT, PAR TYPE, 2018-2032
TABLEAU 964 EST DE L'AMÉRIQUE DU SUD MARCHÉ DES TABLEAUX ELECTRIQUES AJUSTABLES, PAR UTILISATEUR FINAL, 2018-2033 (en MILLIERS USD)
TABLEAU 965 EST DE L'AMÉRIQUE DU SUD STANDING LIBRE MARCHÉ DES TABLEAUX ELECTRIQUES AJUSTABLES, PAR CHANEAU DE DISTRIBUTION, 2018-2033
TABLEAU 966 EST DE L'AMÉRIQUE DU SUD MARCHÉ DES TABLEAUX ELECTRIQUES AJUSTABLES, PAR CHANEAU DE DISTRIBUTION, 2018-2033
TABLEAU 967 EST DE L'AMÉRIQUE DU SUD VENTES INDIRECTES DANS LE MARCHÉ DES TABLEAUX ELECTRIQUES STANDING GRATUIT, PAR TYPE, 2018-2032 (MILLIERS USD)
TABLEAU 968 RESTAURATION DES STOCKS DE DÉTAILS DE L'AMÉRIQUE DU SUD DANS LE MARCHÉ DES TABLEAUX AJUSTABLES DE HAUTE ÉLECTRIQUE, PAR TYPE, 2018-2032
TABLEAU 969 EST DE L'AMÉRIQUE DU SUD E-COMMERCE DANS LE MARCHÉ DES TABLEAUX AJUSTABLES ÉLECTRIQUES STANDING LIBRE, PAR TYPE, 2018-2032 (MILLIERS USD)
TABLEAU 970 MOYEN-ORIENT ET AFRIQUE GRAND MARCHÉ DES TABLEAUX ELECTRIQUES AJUSTABLES, PAR PAYS, 2018-2032
TABLEAU 971 MOYEN-ORIENT ET AFRIQUE MARCHÉ DES TABLEAUX ÉLECTRIQUES AJUSTABLES, PAR PAYS, 2018-2032
TABLEAU 972 MOYEN-ORIENT ET AFRIQUE GRAND MARCHÉ DES TABLEAUX ÉLECTRIQUES AJUSTABLES, PAR FORMULAIRE DE PRODUIT, 2018-2032 (MILLIERS USD)
TABLEAU 973 MOYEN-ORIENT ET AFRIQUE MARCHÉ DES TABLEAUX AJUSTABLES ÉLECTRIQUES STANDARD GRATUIT, PAR FORMULAIRE DE PRODUIT, 2018-2032 (milliers d'unités)
TABLEAU 974 MOTEUR UNIQUE DU MOYEN-ORIENT ET DE L'AFRIQUE DANS LE MARCHÉ DES TABLEAUX AJUSTABLES ÉLECTRIQUES STANDARD LIBRE, PAR TYPE DE CADRE, 2018-2032 (MILLIERS DE USD)
TABLEAU 975 MOTEUR UNIQUE DU MOYEN-ORIENT ET DE L'AFRIQUE DANS LE MARCHÉ DES TABLEAUX AJUSTABLES ÉLECTRIQUES PERMANENTES, PAR AJUSTEMENT PRÉVUE, 2018-2032 (MILLEUR)
TABLEAU 976 MOTEUR UNIQUE DU MOYEN-ORIENT ET DE L'AFRIQUE DANS LE MARCHÉ DES TABLEAUX AJUSTABLES ÉLECTRIQUES PERMANENTES, PAR INTERFACE DE CONTRÔLE, 2018-2032 (en MILLEUR)
TABLEAU 977 MOYEN-ORIENT ET DOUANIER AFRICAIN DANS LE MARCHÉ DES TABLEAUX ELECTRIQUES STANDARD GRATUIT, PAR TYPE DE CADRE, 2018-2032 (MILLIERS USD)
TABLEAU 978 MOYEN-ORIENT ET DOUANIER AFRIQUE SUR LE MARCHÉ DES TABLEAUX ELECTRIQUES PERMANENTES, PAR AJUSTEMENT PRÉVUE, 2018-2032 (en MILLEUR)
TABLEAU 979 MOYEN-ORIENT ET DOUANIER AFRIQUE SUR LE MARCHÉ DES TABLEAUX ELECTRIQUES STANDARDS, PAR INTERFACE DE CONTRÔLE, 2018-2032
TABLEAU 980 MOYEN-ORIENT ET AFRIQUE MULTI-MOTEUR DANS LE MARCHÉ DES TABLEAUX ELECTRIQUES STANDARD GRATUIT, PAR TYPE DE CADRE, 2018-2032 (en MILLEUR)
TABLEAU 981 MOYEN-ORIENT ET AFRIQUE MULTI-MOTEUR DU MARCHÉ DES TABLEAUX ÉLECTRIQUES AJUSTABLES À L'ÉTABLISSEMENT LIBRE, PAR AJUSTEMENT PRÉVU, 2018-2032 (MILLIERS DE USD)
TABLEAU 982 MOYEN-ORIENT ET AFRIQUE MULTI-MOTEUR DANS LE MARCHÉ DES TABLEAUX ELECTRIQUES AJUSTABLES LIBREMENT STANDING, PAR INTERFACE DE CONTRÔLE, 2018-2032 (en MILLEUR)
TABLEAU 983 MOYEN-ORIENT ET AFRIQUE LIBRE STANDING ÉLECTRIQUE TABLEAUX AJUSTABLES, PAR MATÉRIEL, 2018-2032 (en MILLEUR)
TABLEAU 984 MOYEN-ORIENT ET MÉTAL AFRICAIN DANS LE MARCHÉ DES TABLEAUX AJUSTABLES ELECTRIQUES STANDARD LIBRE, PAR TYPE, 2018-2032 (en MILLEUR)
TABLEAU 985 ACIER DU MOYEN-ORIENT ET DE L'AFRIQUE DANS LE MARCHÉ DES TABLEAUX AJUSTABLES ÉLECTRIQUES PERMANENT, PAR TYPE, 2018-2032 (en milliers de dollars)
TABLEAU 986 MOYEN-ORIENT ET BIENVENUE AFRIQUE DANS LE MARCHÉ DES TABLEAUX AJUSTABLES ELECTRIQUES STANDARD GRATUIT, PAR TYPE, 2018-2032
TABLEAU 987 LE MOYEN-ORIENT ET L'AFRIQUE ENGINÉES DANS LE MARCHÉ DES TABLEAUX AJUSTABLES ÉLECTRIQUES STANDING LIBRE, PAR TYPE, 2018-2032 (en MILLEUR)
TABLEAU 988 BOIS SOLIDE DU MOYEN-ORIENT ET DE L'AFRIQUE DANS LE MARCHÉ DES TABLEAUX AJUSTABLES ÉLECTRIQUES STANDARD LIBRE, PAR TYPE, 2018-2032 (en MILLEUR)
TABLEAU 989 PLASTIQUE DU MOYEN-ORIENT ET DE L'AFRIQUE/COMPOSITE DU MARCHÉ DES TABLEAUX ELECTRIQUES STANDING LIBRE, PAR TYPE, 2018-2032 (en MILLEUR)
TABLEAU 990 MOYEN-ORIENT ET AFRIQUE LIBRE STANDING ELECTRICAL TABLEAUX AJUSTABLES MARCHÉ, PAR DEMANDE, 2018-2032 (MILLIERS DE USD)
TABLEAU 991 BUREAUX CORPORATIQUES DU MOYEN-ORIENT ET DE L'AFRIQUE, MARCHÉ DES TABLEAUX AJUSTABLES ÉLECTRIQUES, PAR TYPE, 2018-2032 (en MILLEUR)
TABLEAU 992 MOYEN-ORIENT ET AFRIQUE RÉSIDENTIEL DU MARCHÉ DES TABLEAUX ELECTRIQUES PERMANENT, PAR TYPE, 2018-2032
TABLEAU 993 ÉDUCATION DU MOYEN-ORIENT ET DE L'AFRIQUE DANS LE MARCHÉ DES TABLEAUX ÉLECTRIQUES STANDING LIBRE, PAR TYPE, 2018-2032
TABLEAU 994 LE MOYEN-ORIENT ET L'AFRIQUE DANS LE SECTEUR DE LA SANTÉ DANS LE MARCHÉ DES TABLEAUX AJUSTABLES ÉLECTRIQUES STANDARD LIBRE, PAR TYPE, 2018-2032 (en millions de dollars)
TABLEAU 995 MOYEN-ORIENT ET AFRIQUE MARCHÉ DES TABLEAUX AJUSTABLES ÉLECTRIQUES, PAR UTILISATEUR EN FIN, 2018-2033 (en MILLEUR)
TABLEAU 996 MOYEN-ORIENT ET AFRIQUE LIBRE STANDING ELECTRICAL HEIGHT-ADJUSTABLE TABLEAUX MARCHANDISES, PAR CHANEAU DE DISTRIBUTION, 2018-2033
TABLEAU 997 MOYEN-ORIENT ET AFRIQUE LIBRE STANDING ELECTRICAL HEIGHT-ADJUSTABLE TABLEAUX MARCHANDISES, PAR CHANEAU DE DISTRIBUTION, 2018-2033
TABLEAU 998 VENTES INDIRECTES DU MOYEN-ORIENT ET DE L'AFRIQUE DANS LE MARCHÉ DES TABLEAUX AJUSTABLES ÉLECTRIQUES STANDARD GRATUIT, PAR TYPE, 2018-2032 (MILLIERS DE USD)
TABLEAU 999 ÉTAT DU MOYEN-ORIENT ET DE L'AFRIQUE DANS LE MARCHÉ DES TABLEAUX AJUSTABLES ÉLECTRIQUES STANDING LIBRE, PAR TYPE, 2018-2032 (en MILLEUR)
TABLEAU 1000 LE MOYEN-ORIENT ET L'AFRIQUE E-COMMERCE DANS LE MARCHÉ DES TABLEAUX ELECTRIQUES STANDARD GRATUIT, PAR TYPE, 2018-2032
TABLEAU 1001 TABLEAUX AJUSTABLES ÉLECTRIQUES DE L'ARABIE SAUDIE, PAR FORMULAIRE DE PRODUIT, 2018-2032 (en MILLIERS USD)
TABLEAU 1002 TABLEAUX AJUSTABLES ÉLECTRIQUES DE L'ARABIE SAUDIE, PAR FORMULAIRE DE PRODUIT, 2018-2032
TABLEAU 1003 MOTEUR UNIQUE D'ARABIE SAUDIE DANS LE MARCHÉ DES TABLEAUX AJUSTABLES ÉLECTRIQUES STANDARD LIBRE, PAR TYPE DE CADRE, 2018-2032 (en MILLE USD)
TABLEAU 1004 MOTEUR UNIQUE DE L'ARABIE SAUDIE DANS LE MARCHÉ DES TABLEAUX AJUSTABLES ÉLECTRIQUES PERMANENT LIBRE, PAR AJUSTEMENT SPEED, 2018-2032 (MILLIERS DE USD)
TABLEAU 1005 ARABIE SAUDIE MOTEUR UNIQUE DANS LE MARCHÉ DES TABLEAUX ÉLECTRIQUES STANDARD LIBRE, PAR INTERFACE DE CONTRÔLE, 2018-2032 (MILLIERS USD)
TABLEAU 1006 ARABE SAUDI DUAL MOTOR DANS LE MARCHÉ DES TABLEAUX ÉLECTRIQUES STANDARD GRATUIT, PAR TYPE DE CADRE, 2018-2032 (en MILLE USD)
TABLEAU 1007 SAUTI ARABIA DUAL MOTOR DANS LE MARCHÉ DES TABLEAUX ELECTRIQUES PERMANENTES, PAR AJUSTEMENT PRÉVUE, 2018-2032 (MILLIERS DE DOLLARS)
TABLEAU 1008 ARABE SAUDI DUAL MOTOR DANS LE MARCHÉ DES TABLEAUX ELECTRIQUES STANDING LIBRE, PAR INTERFACE DE CONTRÔLE, 2018-2032 (MILLIERS USD)
TABLEAU 1009 SAUTI ARABIE MULTI-MOTEUR DANS LE MARCHÉ DES TABLEAUX ÉLECTRIQUES STANDARD GRATUIT, PAR TYPE DE CADRE, 2018-2032 (MILLIERS DE USD)
TABLEAU 1010 ARABIE SAUDIE MULTI-MOTEUR DANS LE MARCHÉ DES TABLEAUX ELECTRIQUES STANDING LIBRE, PAR AJUSTEMENT PRÉVUE, 2018-2032 (en MILLEUR)
TABLEAU 1011 ARABIE SAUDIE MULTI-MOTEUR DANS LE MARCHÉ DES TABLEAUX ELECTRIQUES STANDING LIBRE, PAR INTERFACE DE CONTRÔLE, 2018-2032 (en MILLEUR)
TABLEAU 1012 MARCHÉ DES TABLEAUX AJUSTABLES ÉLECTRIQUES D'ARABIE DE SAUDE, PAR MATÉRIEL, 2018-2032 (en MILLIERS DE USD)
TABLEAU 1013 MÉTAL DE L'ARABIE SAUDIE DANS LE MARCHÉ DES TABLEAUX D'AJUSTABLES ÉLECTRIQUES STANDING LIBRE, PAR TYPE, 2018-2032 (en MILLIERS USD)
TABLEAU 1014 ACIER D'ARABIE SAUDI DANS LE MARCHÉ DES TABLEAUX AJUSTABLES ÉLECTRIQUES STANDARD GRATUIT, PAR TYPE, 2018-2032 (en MILLIERS DE USD)
TABLEAU 1015 BOIS D'ARABIE SAUDE DANS LE MARCHÉ DES TABLEAUX AJUSTABLES ÉLECTRIQUES STANDARD GRATUIT, PAR TYPE, 2018-2032 (en milliers de dollars)
TABLEAU 1016 MARCHANDISES DE L'ARABIE SAUDIES ENGINÉES DANS LE MARCHÉ DES TABLEAUX ÉLECTRIQUES STANDING GRATUIT, PAR TYPE, 2018-2032 (MILLIERS USD)
TABLEAU 1017 MARCHANDISES SOLIDES D'ARABIE SAUDIES DANS LE MARCHÉ DES TABLEAUX AJUSTABLES ÉLECTRIQUES STANDARD GRATUIT, PAR TYPE, 2018-2032
TABLEAU 1018 PLASTIQUE/COMPOSITE DE L'ARABIE SAUDIE DANS LE MARCHÉ DES TABLEAUX AJUSTABLES ÉLECTRIQUES STANDARD GRATUIT, PAR TYPE, 2018-2032 (en MILLIERS DE USD)
TABLEAU 1019 MARCHÉ DES TABLEAUX AJUSTABLES ÉLECTRIQUES D'ARABIE SAUDIE, PAR APPLICATION, 2018-2032 (MILLIERS DE USD)
TABLEAU 1020 BUREAUX CORPORATAIRES D'ARABIE SAOUDIS DANS LE MARCHÉ DES TABLEAUX ELECTRIQUES STANDING LIBRE, PAR TYPE, 2018-2032 (MILLIERS DE USD)
TABLEAU 1021 RÉSIDENTIEL DE L'ARABIE SAUDIE DANS LE MARCHÉ DES TABLEAUX AJUSTABLES ÉLECTRIQUES PERMANENTES, PAR TYPE, 2018-2032 (MILLIERS DE USD)
TABLEAU 1022 ÉDUCATION DE L'ARABIE SAUDIE DANS LE MARCHÉ DES TABLEAUX AJUSTABLES ÉLECTRIQUES STANDING LIBRE, PAR TYPE, 2018-2032 (en MILLEUR)
TABLEAU 1023 SAUVETAGE DE L'ARABIE DANS LE MARCHÉ DES TABLEAUX AJUSTABLES ÉLECTRIQUES PERMANENT, PAR TYPE, 2018-2032
TABLEAU 1024 MARCHÉ DES TABLEAUX AJUSTABLES DE L'ARABIE DE SAUDE LIBRE STANDING ÉLECTRIQUE, PAR UTILISATEUR EN FIN, 2018-2033 (en MILLEUR)
TABLEAU 1025 MARCHÉ DES TABLEAUX AJUSTABLES ÉLECTRIQUES DE L'ARABIE DE SAUDE, PAR CHANEAU DE DISTRIBUTION, 2018-2033 (en MILLEUR DE USD)
TABLEAU 1026 MARCHÉ DES TABLEAUX AJUSTABLES ÉLECTRIQUES D'ARABIE DURABLE, PAR CHANEAU DE DISTRIBUTION, 2018-2033 (EN MILLIERS)
TABLEAU 1027 VENTES INDIRECTES D'ARABIE SAUDIES DANS LE MARCHÉ DES TABLEAUX ELECTRIQUES STANDARDS, PAR TYPE, 2018-2032
TABLEAU 1028 STOCKS DE STAIL DE L'ARABIE SAUDIE DANS LE MARCHÉ DES TABLEAUX AJUSTABLES ÉLECTRIQUES STANDING LIBRE, PAR TYPE, 2018-2032 (MILLIERS USD)
TABLEAU 1029 COMMERCE électronique DE L'ARABIE SAUDIE DANS LE MARCHÉ DES TABLEAUX AJUSTABLES ÉLECTRIQUES PERSONNELS, PAR TYPE, 2018-2032 (en MILLIERS USD)
TABLEAU 1030 EMIRATS ARABES UNIS LIBREMENT STANDING TABLEAUX ÉLECTRIQUES AJUSTABLES MARCHÉ, PAR FORMULAIRE DE PRODUIT, 2018-2032 (en MILLIERS USD)
TABLEAU 1031 EMIRATS ARABES-UNIS DE TABLEAUX ELECTRIQUES STANDING LIBRE, PAR FORMULAIRE DE PRODUIT, 2018-2032
TABLEAU 1032 EMIRATS ARABES UNIS MOTEUR UNIQUE DANS LE MARCHÉ DES TABLEAUX AJUSTABLES ÉLECTRIQUES STANDARD LIBRE, PAR TYPE DE CADRE, 2018-2032 (en MILLEUR USD)
TABLEAU 1033 EMIRATS ARABES UNIS DE MOTEUR UNIQUE DANS LE MARCHÉ DES TABLEAUX AJUSTABLES ÉLECTRIQUES PERMANENT LIBRE, PAR AJUSTEMENT SPEED, 2018-2032 (MILLIERS DE USD)
TABLEAU 1034 EMIRATS ARABES UNIS MOTEUR UNIQUE DANS LE MARCHÉ DES TABLEAUX AJUSTABLES ELECTRIQUES STANDARD LIBRE, PAR INTERFACE DE CONTRÔLE, 2018-2032
TABLEAU 1035 EMIRATS ARABES UNIS DUAL MOTOR DANS LE MARCHÉ DES TABLEAUX ÉLECTRIQUES STANDARD LIBRE, PAR TYPE DE CADRE, 2018-2032 (MILLIERS DE USD)
TABLEAU 1036 EMIRATS ARABES UNIS DUAL MOTOR DANS LE MARCHÉ DES TABLEAUX AJUSTABLES ELECTRIQUES PERMANENTES LIBREMENT, PAR AJUSTEMENT SPEED, 2018-2032 (en MILLIERS DE USD)
TABLEAU 1037 EMIRATS ARABES UNIS DUAL MOTOR DANS LE MARCHÉ DES TABLEAUX AJUSTABLES ÉLECTRIQUES PERMANENT LIBRE, PAR INTERFACE DE CONTRÔLE, 2018-2032 (en MILLEUR DE DOLLARS)
TABLEAU 1038 EMIRATS ARABES UNIS MULTI-MOTEUR DANS LE MARCHÉ DES TABLEAUX ÉLECTRIQUES STANDARD GRATUIT, PAR TYPE DE CADRE, 2018-2032 (en MILLEUR)
TABLEAU 1039 EMIRATS ARABES UNIS MULTI-MOTEUR DANS LE MARCHÉ DES TABLEAUX ELECTRIQUES PERMANENTES, PAR AJUSTEMENT PRÉVUE, 2018-2032 (en MILLEUR)
TABLEAU 1040 EMIRATS ARABES UNIS MULTI-MOTEUR DANS LE MARCHÉ DES TABLEAUX ELECTRIQUES STANDARD GRATUIT, PAR INTERFACE DE CONTRÔLE, 2018-2032 (en MILLEUR)
TABLEAU 1041 MARCHÉ DES TABLEAUX AJUSTABLES DE L'HAUTEUR ÉLECTRIQUE, PAR MATÉRIEL, 2018-2032
TABLEAU 1042 ÉMIRATS ARABES UNIS MÉTAL DANS LE MARCHÉ DES TABLEAUX AJUSTABLES ELECTRIQUES STANDARD LIBRE, PAR TYPE, 2018-2032 (en MILLEUR)
TABLEAU 1043 ACIER ARABE-UNI DANS LE MARCHÉ DES TABLEAUX AJUSTABLES ÉLECTRIQUES STANDARD LIBRE, PAR TYPE, 2018-2032 (en MILLIERS USD)
TABLEAU 1044 EMIRATS ARABES UNIS BOIS DANS LE MARCHÉ DES TABLEAUX ÉLECTRIQUES STANDARD GRATUIT, PAR TYPE, 2018-2032 (MILLIERS USD)
TABLEAU 1045 EMIRATS ARABES UNIS ENGINEERED WOOD DANS LE MARCHÉ DES TABLEAUX ELECTRIQUES STANDING GRATUIT, PAR TYPE, 2018-2032 (MILLIERS USD)
TABLEAU 1046 EMIRATS ARABES UNIS BOIS SOLIDES DANS LE MARCHÉ DES TABLEAUX ELECTRIQUES STANDARD GRATUIT, PAR TYPE, 2018-2032
TABLEAU 1047 ÉMIRATS ARABES UNIS PLASTIQUE/COMPOSITE DANS LE MARCHÉ DES TABLEAUX ELECTRIQUES STANDING GRATUIT, PAR TYPE, 2018-2032 (MILLIERS DE USD)
TABLEAU 1048 MARCHÉ DES TABLEAUX ELECTRIQUES AJUSTABLES, PAR DEMANDE, 2018-2032
TABLEAU 1049 BUREAUX CORPORATIQUES DES EMIRATS ARABES UNIS DANS LE MARCHÉ DES TABLEAUX ELECTRIQUES STANDING GRATUIT, PAR TYPE, 2018-2032
TABLEAU 1050 EMIRATS ARABES UNIS RÉSIDENTIELS DANS LE MARCHÉ DES TABLEAUX ELECTRIQUES PERMANENTES, PAR TYPE, 2018-2032 (MILLIERS USD)
TABLEAU 1051 ÉDUCATION DES EMIRATS ARABES UNIS DANS LE MARCHÉ DES TABLEAUX AJUSTABLES ÉLECTRIQUES STANDING GRATUIT, PAR TYPE, 2018-2032
TABLEAU 1052 UNITED ARAB Emirates Healthcare in LIBER STANDING ELECTRICAL HEIGHT-ADJUSTABLE TABLES MARCHANDISES, PAR TYPE, 2018-2032
TABLEAU 1053 MARCHÉ DES TABLEAUX ELECTRIQUES AJUSTABLES, PAR UTILISATEUR DE FIN 2018-2033
TABLEAU 1054 ÉMIRATS ARABES UNIS LIBREMENT STANDING MARCHÉ DES TABLEAUX ELECTRIQUES AJUSTABLES, PAR CHANEAU DE DISTRIBUTION, 2018-2033 (en MILLE USD)
TABLEAU 1055 ÉMIRATS ARABES UNIS LIBREMENT STANDING MARCHÉ DES TABLEAUX ELECTRIQUES AJUSTABLES, PAR CHANEAU DE DISTRIBUTION, 2018-2033 (T000)
TABLEAU 1056 ÉMIRATS ARABES UNIS VENTES INDIRECTES DANS LE MARCHÉ DES TABLEAUX ELECTRIQUES STANDING LIBRE, PAR TYPE, 2018-2032 (MILLIERS DE USD)
TABLEAU 1057 STOCKS DE STAIL DES EMIRATS ARABES UNIS DANS LE MARCHÉ DES TABLEAUX ELECTRIQUES STANDING LIBRE, PAR TYPE, 2018-2032 (MILLIERS DE USD)
TABLEAU 1058 EMIRATS ARABES UNIS E-COMMERCE DANS LE MARCHÉ DES TABLEAUX ELECTRIQUES STANDING LIBRE, PAR TYPE, 2018-2032 (MILLIERS USD)
TABLEAU 1059 AFRIQUE DU SUD MARCHÉ DES TABLEAUX ELECTRIQUES AJUSTABLES, PAR FORMULAIRE DE PRODUIT, 2018-2032 (MILLIERS USD)
TABLEAU 1060 AFRIQUE DU SUD MARCHÉ DES TABLEAUX ELECTRIQUES AJUSTABLES, PAR FORMULAIRE DE PRODUIT, 2018-2032
TABLEAU 1061 AFRIQUE DU SUD MOTEUR UNIQUE DANS LE MARCHÉ DES TABLEAUX AJUSTABLES ÉLECTRIQUES STANDARD LIBRE, PAR TYPE DE CADRE, 2018-2032 (en MILLEUR USD)
TABLEAU 1062 AFRIQUE DU SUD MOTEUR UNIQUE DANS LE MARCHÉ DES TABLEAUX AJUSTABLES ÉLECTRIQUES STANDARD LIBRE, PAR AJUSTEMENT SPEED, 2018-2032 (MILLIERS DE USD)
TABLEAU 1063 AFRIQUE DU SUD MOTEUR UNIQUE DANS LE MARCHÉ DES TABLEAUX AJUSTABLES ÉLECTRIQUES STANDARD LIBRE, PAR INTERFACE DE CONTRÔLE, 2018-2032 (en MILLEUR DE USD)
TABLEAU 1064 AFRIQUE DU DUAL MOTEUR DANS LE MARCHÉ DES TABLEAUX AJUSTABLES ÉLECTRIQUES STANDARD LIBRE, PAR TYPE DE CADRE, 2018-2032 (en milliers de dollars)
TABLEAU 1065 AFRIQUE DU DUAL MOTEUR DANS LE MARCHÉ DES TABLEAUX AJUSTABLES ELECTRIQUES PERMANENTES, PAR AJUSTEMENT PRÉVUE, 2018-2032 (en MILLIERS DE USD)
TABLEAU 1066 AFRIQUE DU SUD DOUANIER DANS LE MARCHÉ DES TABLEAUX ELECTRIQUES STANDARD GRATUIT, PAR INTERFACE DE CONTRÔLE, 2018-2032
TABLEAU 1067 AFRIQUE DU SUD MULTI-MOTEUR DANS LE MARCHÉ DES TABLEAUX ÉLECTRIQUES STANDARD GRATUIT, PAR TYPE DE CADRE, 2018-2032 (en MILLE USD)
TABLEAU 1068 AFRIQUE DU SUD MULTI-MOTEUR DANS LE MARCHÉ DES TABLEAUX ÉLECTRIQUES STANDARD GRATUIT, PAR AJUSTEMENT PRÉVUE, 2018-2032 (en MILLEUR)
TABLEAU 1069 AFRIQUE DU SUD MULTI-MOTEUR DANS LE MARCHÉ DES TABLEAUX AJUSTABLES ÉLECTRIQUES STANDARD LIBRE, PAR INTERFACE DE CONTRÔLE, 2018-2032 (MILLIERS DE USD)
TABLEAU 1070 AFRIQUE DU SUD MARCHÉ DES TABLEAUX ELECTRIQUES AJUSTABLES, PAR MATÉRIEL, 2018-2032
TABLEAU 1071 MÉTAL DE L'AFRIQUE DU SUD DANS LE MARCHÉ DES TABLEAUX AJUSTABLES ÉLECTRIQUES STANDING LIBRE, PAR TYPE, 2018-2032 (en MILLEUR)
TABLEAU 1072 ACIER DE L'AFRIQUE DU SUD DANS LE MARCHÉ DES TABLEAUX AJUSTABLES ÉLECTRIQUES STANDARD LIBRE, PAR TYPE, 2018-2032 (en milliers de dollars)
TABLEAU 1073 BOIS DE L'AFRIQUE DU SUD DANS LE MARCHÉ DES TABLEAUX AJUSTABLES ÉLECTRIQUES STANDARD GRATUIT, PAR TYPE, 2018-2032
TABLEAU 1074 BOIS DE L'AFRIQUE DU SUD ENGINÉE DANS LE MARCHÉ DES TABLEAUX AJUSTABLES ÉLECTRIQUES STANDING LIBRE, PAR TYPE, 2018-2032 (en MILLE USD)
TABLEAU 1075 BOIS SOLIDE D'AFRIQUE DU SUD DANS LE MARCHÉ DES TABLEAUX AJUSTABLES ÉLECTRIQUES STANDARD GRATUIT, PAR TYPE, 2018-2032 (en millions de dollars)
TABLEAU 1076 PLASTIQUE/COMPOSITE DE L'AFRIQUE DU SUD DANS LE MARCHÉ DES TABLEAUX AJUSTABLES ÉLECTRIQUES STANDARD LIBRE, PAR TYPE, 2018-2032 (en milliers de dollars)
TABLEAU 1077 AFRIQUE DU SUD MARCHÉ DES TABLEAUX ELECTRIQUES AJUSTABLES, PAR DEMANDE, 2018-2032
TABLEAU 1078 BUREAUX CORPORATAIRES DE L'AFRIQUE DU SUD DANS LE MARCHÉ DES TABLEAUX AJUSTABLES ÉLECTRIQUES PERMANENT LIBRE, PAR TYPE, 2018-2032 (MILLIERS DE USD)
TABLEAU 1079 RÉSIDENTIEL DE L'AFRIQUE DU SUD DANS LE MARCHÉ DES TABLEAUX AJUSTABLES ÉLECTRIQUES STANDARD LIBRE, PAR TYPE, 2018-2032 (en millions de dollars)
TABLEAU 1080 ÉDUCATION DE L'AFRIQUE DU SUD DANS LE MARCHÉ DES TABLEAUX AJUSTABLES ÉLECTRIQUES STANDING GRATUIT, PAR TYPE, 2018-2032
TABLEAU 1081 BIEN-ÊTRE DE L'AFRIQUE DU SUD DANS LE MARCHÉ DES TABLEAUX AJUSTABLES ÉLECTRIQUES STANDING LIBRE, PAR TYPE, 2018-2032 (en MILLIERS USD)
TABLEAU 1082 AFRIQUE DU SUD MARCHÉ DES TABLEAUX AJUSTABLES ÉLECTRIQUES STANDARD LIBRE, PAR UTILISATEUR FINAL, 2018-2033 (en MILLEUR)
TABLEAU 1083 AFRIQUE DU SUD STANDING LIBRE MARCHÉ DES TABLEAUX ELECTRIQUES AJUSTABLES, PAR CHANEAU DE DISTRIBUTION, 2018-2033
TABLEAU 1084 AFRIQUE DU SUD STANDING LIBRE STANDING ELECTRICAL HEIGHT-ADJUSTABLE TABLEAUX MARCHANDISES, PAR CHANEAU DE DISTRIBUTION, 2018-2033 (MILLIERS)
TABLEAU 1085 AFRIQUE DU SUD VENTES INDIRECTES DANS LE MARCHÉ DES TABLEAUX ELECTRIQUES STANDARD GRATUIT, PAR TYPE, 2018-2032 (en MILLIERS DE USD)
TABLEAU 1086 STOCKS DE STAIL AFRIQUE DU SUD DANS LE MARCHÉ DES TABLEAUX AJUSTABLES ÉLECTRIQUES STANDARD GRATUIT, PAR TYPE, 2018-2032
TABLEAU 1087 COMMERCE-E DE L'AFRIQUE DU SUD DANS LE MARCHÉ DES TABLEAUX AJUSTABLES ÉLECTRIQUES STANDING LIBRE, PAR TYPE, 2018-2032 (en MILLEUR)
TABLEAU 1088 MARCHÉ DES TABLEAUX AJUSTABLES ÉLECTRIQUES STANDING LIBRE ISRAEL, PAR FORMULAIRE DE PRODUIT, 2018-2032 (MILLIERS USD)
TABLEAU 1089 MARCHÉ DES TABLEAUX AJUSTABLES DE L'HAUTEUR ÉLECTRIQUE, PAR FORMULAIRE DE PRODUIT, 2018-2032
TABLEAU 1090 MOTEUR UNIQUE ISRAEL DANS LE MARCHÉ DES TABLEAUX AJUSTABLES ÉLECTRIQUES STANDARD LIBRE, PAR TYPE DE CADRE, 2018-2032 (en MILLE USD)
TABLEAU 1091 MOTEUR UNIQUE ISRAEL DANS LE MARCHÉ DES TABLEAUX AJUSTABLES ÉLECTRIQUES LIBREMENT STANDARD, PAR AJUSTEMENT SPEED, 2018-2032 (en MILLEUR DE USD)
TABLEAU 1092 MOTEUR UNIQUE ISRAEL DANS LE MARCHÉ DES TABLEAUX ELECTRIQUES STANDING LIBRE, PAR INTERFACE DE CONTRÔLE, 2018-2032
TABLEAU 1093 DUAL MOTEUR D'ISRAEL DANS LE MARCHÉ DES TABLEAUX ELECTRIQUES STANDARD GRATUIT, PAR TYPE DE CADRE, 2018-2032 (MILLIERS DE USD)
TABLEAU 1094 DUAL MOTOR ISRAEL DANS LE MARCHÉ DES TABLEAUX ÉLECTRIQUES LIBREMENT STANDING, PAR AJUSTEMENT SPEED, 2018-2032 (MILLIERS DE USD)
TABLEAU 1095 DUAL MOTEUR ISRAEL DANS LE MARCHÉ DES TABLEAUX ELECTRIQUES STANDING GRATUIT, PAR INTERFACE DE CONTRÔLE, 2018-2032
TABLEAU 1096 ISRAEL MULTI-MOTEUR DANS LE MARCHÉ DES TABLEAUX ELECTRIQUES STANDING LIBRE, PAR TYPE DE CADRE, 2018-2032 (en MILLIERS USD)
TABLEAU 1097 ISRAEL MULTI-MOTEUR DANS LE MARCHÉ DES TABLEAUX AJUSTABLES ÉLECTRIQUES STANDARD GRATUIT, PAR AJUSTEMENT SPEED, 2018-2032 (MILLIERS DE USD)
TABLEAU 1098 ISRAEL MULTI-MOTEUR DANS LE MARCHÉ DES TABLEAUX ELECTRIQUES STANDING LIBRE, PAR INTERFACE DE CONTRÔLE, 2018-2032 (MILLIERS DE USD)
TABLEAU 1099 MARCHÉ DES TABLEAUX ÉLECTRIQUES AJUSTABLES, PAR MATÉRIEL, 2018-2032
TABLEAU 1100 MÉTAL ISRAEL DANS LE MARCHÉ DES TABLEAUX ELECTRIQUES STANDING LIBRE, PAR TYPE, 2018-2032 (en milliers de dollars)
TABLEAU 1101 ACIER ISRAEL DANS LE MARCHÉ DES TABLEAUX AJUSTABLES ÉLECTRIQUES PERSONNELS, PAR TYPE, 2018-2032 (en MILLIERS USD)
TABLEAU 1102 BOIS D'ISRAEL DANS LE MARCHÉ DES TABLEAUX ELECTRIQUES STANDING LIBRE, PAR TYPE, 2018-2032
TABLEAU 1103 BOIS ENGINÉES ISRAEL DANS LE MARCHÉ DES TABLEAUX AJUSTABLES ÉLECTRIQUES PERSONNELS, PAR TYPE, 2018-2032
TABLEAU 1104 BOIS SOLIDE D'ISRAEL DANS LE MARCHÉ DES TABLEAUX AJUSTABLES DE L'HAUTEUR LIBRE STANDING, PAR TYPE, 2018-2032 (en milliers de dollars)
TABLEAU 1105 ISRAEL PLASTIQUE/COMPOSITE DANS LE MARCHÉ DES TABLEAUX ÉLECTRIQUES STANDARD GRATUIT, PAR TYPE, 2018-2032 (MILLIERS DE USD)
TABLEAU 1106 MARCHÉ DES TABLEAUX AJUSTABLES ÉLECTRIQUES, PAR DEMANDE, 2018-2032
TABLEAU 1107 BUREAUX DU CORPORAT D'ISRAEL DANS LE MARCHÉ DES TABLEAUX AJUSTABLES À L'HAUTE ÉLECTRIQUE, PAR TYPE, 2018-2032 (en millions de dollars)
TABLEAU 1108 RÉSIDENTIEL ISRAEL DANS LE MARCHÉ DES TABLEAUX ELECTRIQUES STANDING LIBRE, PAR TYPE, 2018-2032
TABLEAU 1109 ÉDUCATION D'ISRAEL DANS LE MARCHÉ DES TABLEAUX ELECTRIQUES STANDING LIBRE, PAR TYPE, 2018-2032
TABLEAU 1110 SANTE ISRAEL DANS LE MARCHÉ DES TABLEAUX ELECTRIQUES STANDING LIBRE, PAR TYPE, 2018-2032 (MILLIERS USD)
TABLEAU 1111 MARCHÉ DES TABLEAUX AJUSTABLES ÉLECTRIQUES, PAR UTILISATEUR DE FIN 2018-2033
TABLEAU 1112 MARCHÉ DES TABLEAUX ÉLECTRIQUES AJUSTABLES, PAR CHANEAU DE DISTRIBUTION, 2018-2033
TABLEAU 1113 MARCHÉ DES TABLEAUX AJUSTABLES DE L'HAUTEUR ÉLECTRIQUE, PAR CHANEAU DE DISTRIBUTION, 2018-2033 (MILLIERS)
TABLEAU 1114 VENTES INDIRECTES D'ISRAEL DANS LE MARCHÉ DES TABLEAUX AJUSTABLES À L'HAUTE LIBRE STANDING, PAR TYPE, 2018-2032 (en MILLEUR)
TABLEAU 1115 STOCKS DE STAIL ISRAEL DANS LE MARCHÉ DES TABLEAUX ELECTRIQUES STANDING GRATUIT, PAR TYPE, 2018-2032
TABLEAU 1116 E-COMMERCE ISRAEL DANS LE MARCHÉ DES TABLEAUX AJUSTABLES ÉLECTRIQUES PERSONNELS, PAR TYPE, 2018-2032
TABLEAU 1117 RESTAURATION DU MOYEN-ORIENT ET DE L'AFRIQUE DU MARCHÉ DES TABLEAUX ÉLECTRIQUES AJUSTABLES, PAR FORMULAIRE DE PRODUIT, 2018-2032 (MILLIERS DE USD)
TABLEAU 1118 RESTAURATION DU MOYEN-ORIENT ET DE L'AFRIQUE DU MARCHÉ DES TABLEAUX ELECTRIQUES AJUSTABLES, PAR FORMULAIRE DE PRODUIT, 2018-2032
TABLEAU 1119 EST DU MOYEN-ORIENT ET DE L'AFRIQUE MOTEUR UNIQUE DANS LE MARCHÉ DES TABLEAUX AJUSTABLES ÉLECTRIQUES PERMANENTES, PAR TYPE DE CADRE, 2018-2032 (MILLIERS DE DOLLARS)
TABLEAU 1120 RESTAURATION DU MOYEN-ORIENT ET DE L'AFRIQUE D'UN MOTEUR UNIQUE DANS LE MARCHÉ DES TABLEAUX ELECTRIQUES AJUSTABLES À L'ÉTAT LIBRE, PAR AJUSTEMENT SPEED, 2018-2032 (MILLIERS DE DOLLARS)
TABLEAU 1121 EST DU MOYEN-ORIENT ET AFRIQUE MOTEUR UNIQUE DANS LE MARCHÉ DES TABLEAUX AJUSTABLES ÉLECTRIQUES PERMANENTES, PAR INTERFACE DE CONTRÔLE, 2018-2032
TABLEAU 1122 RESTAUME DU MOYEN-ORIENT ET DE L'AFRIQUE DUAL MOTEUR DANS LE MARCHÉ DES TABLEAUX AJUSTABLES ÉLECTRIQUES STANDARD LIBRE, PAR TYPE DE CADRE, 2018-2032 (en MILLIERS DE USD)
TABLEAU 1123 EST DU MOYEN-ORIENT ET DE L'AFRIQUE DUAL MOTOR DANS LE MARCHÉ DES TABLEAUX AJUSTABLES ÉLECTRIQUES PERMANENTES, PAR AJUSTEMENT PRÉVUE, 2018-2032 (MILLIERS DE DOLLARS)
TABLEAU 1124 RESTAUME DU MOYEN-ORIENT ET DE L'AFRIQUE DUAL MOTEUR DANS LE MARCHÉ DES TABLEAUX ELECTRIQUES AJUSTABLES LIBREMENT STANDING, PAR INTERFACE DE CONTRÔLE, 2018-2032 (MILLIERS DE DOLLARS)
TABLEAU 1125 RESTAUME DU MOYEN-ORIENT ET DE L'AFRIQUE MULTI-MOTEUR DU MARCHÉ DES TABLEAUX ÉLECTRIQUES STANDING LIBRE, PAR TYPE DE CADRE, 2018-2032
TABLEAU 1126 RESTAURATION DU MOYEN-ORIENT ET DE L'AFRIQUE MULTI-MOTEUR DANS LE MARCHÉ DES TABLEAUX ELECTRIQUES AJUSTABLES LIBREMENT STANDING, PAR AJUSTEMENT SPEED, 2018-2032 (MILLIERS DE USD)
TABLEAU 1127 RESTAURATION DU MOYEN-ORIENT ET DE L'AFRIQUE MULTI-MOTEUR DANS LE MARCHÉ DES TABLEAUX ELECTRIQUES AJUSTABLES LIBREMENT STANDING, PAR INTERFACE DE CONTRÔLE, 2018-2032 (MILLIERS DE DOLLARS)
TABLEAU 1128 RESTAUME DU MOYEN-ORIENT ET DE L'AFRIQUE GRAND MARCHÉ DES TABLEAUX ELECTRIQUES AJUSTABLES, PAR MATÉRIEL, 2018-2032 (en MILLEUR)
TABLEAU 1129 RESTAUME DU MOYEN-ORIENT ET DU MÉTAL AFRICAIN DANS LE MARCHÉ DES TABLEAUX ÉLECTRIQUES STANDING LIBRE, PAR TYPE, 2018-2032 (en MILLEUR)
TABLEAU 1130 RESTAURATION DU MOYEN-ORIENT ET DE L'ACIER AFRIQUE DANS LE MARCHÉ DES TABLEAUX AJUSTABLES À L'HAUTE LIBRE STANDARD, PAR TYPE, 2018-2032 (en MILLEUR)
TABLEAU 1131 RESTAURATION DU MOYEN-ORIENT ET DE L'AFRIQUE DANS LE MARCHÉ DES TABLEAUX AJUSTABLES ÉLECTRIQUES STANDARD LIBRE, PAR TYPE, 2018-2032 (MILLIERS DE USD)
TABLEAU 1132 RESTAUME DU MOYEN-ORIENT ET DE L'AFRIQUE ENGINÉE DANS LE MARCHÉ DES TABLEAUX ÉLECTRIQUES STANDING LIBRE, PAR TYPE, 2018-2032 (en MILLEUR)
TABLEAU 1133 RESTAUME DU MOYEN-ORIENT ET DE L'AFRIQUE BOIS SOLIDE DANS LE MARCHÉ DES TABLEAUX AJUSTABLES ÉLECTRIQUES STANDARD LIBRE, PAR TYPE, 2018-2032 (en MILLEUR)
TABLEAU 1134 RESTAUME DU MOYEN-ORIENT ET DE L'AFRIQUE PLASTIQUE/COMPOSITE DU MARCHÉ DES TABLEAUX ELECTRIQUES STANDING LIBRE, PAR TYPE, 2018-2032 (MILLIERS DE DOLLARS)
TABLEAU 1135 RESTAURATION DU MOYEN-ORIENT ET DE L'AFRIQUE DU MARCHÉ DES TABLEAUX ÉLECTRIQUES AJUSTABLES, PAR DEMANDE, 2018-2032 (en MILLIERS DE USD)
TABLEAU 1136 RESTAURATION DES BUREAUX CORPORATIQUES DU MOYEN-ORIENT ET DE L'AFRIQUE DANS LE MARCHÉ DES TABLEAUX AJUSTABLES ÉLECTRIQUES PERMANENTES, PAR TYPE, 2018-2032 (MILLIERS DE USD)
TABLEAU 1137 RESTAURATION DU MOYEN-ORIENT ET DE L'AFRIQUE DANS LE MARCHÉ DES TABLEAUX AJUSTABLES ÉLECTRIQUES STANDARD LIBRE, PAR TYPE, 2018-2032 (MILLIERS DE USD)
TABLEAU 1138 RESTE DU MOYEN-ORIENT ET DE L'AFRIQUE DE L'ENSEIGNEMENT DANS LE MARCHÉ DES TABLEAUX ELECTRIQUES STANDING LIBRE, PAR TYPE, 2018-2032 (MILLIERS DE USD)
TABLEAU 1139 RESTAURATION DU MOYEN-ORIENT ET DE LA SANTÉ AFRIQUE DANS LE MARCHÉ DES TABLEAUX AJUSTABLES ÉLECTRIQUES STANDARD LIBRE, PAR TYPE, 2018-2032 (MILLIERS DE USD)
TABLEAU 1140 RESTAUME DU MOYEN-ORIENT ET DE L'AFRIQUE MARCHÉ DES TABLEAUX ELECTRIQUES AJUSTABLES, PAR UTILISATEUR FINAL, 2018-2033 (en milliers de dollars)
TABLEAU 1141 RESTAUME DU MOYEN-ORIENT ET DE L'AFRIQUE LIBRE STANDING MARCHÉ DES TABLEAUX ELECTRIQUES AJUSTABLES, PAR CHANEAU DE DISTRIBUTION, 2018-2033 (en MILLEUR)
TABLEAU 1142 RESTAUME DU MOYEN-ORIENT ET DE L'AFRIQUE LIBRE STANDING MARCHÉ DES TABLEAUX ELECTRIQUES AJUSTABLES, PAR CHANEAU DE DISTRIBUTION, 2018-2033
TABLEAU 1143 EST DU MOYEN-ORIENT ET DE L'AFRIQUE VENTES INDIRECTES DANS LE MARCHÉ DES TABLEAUX ELECTRIQUES STANDING GRATUIT, PAR TYPE, 2018-2032 (en MILLIERS DE USD)
TABLEAU 1144 RESTAUME DU MOYEN-ORIENT ET DE L'AFRIQUE CONTENU DANS LE MARCHÉ DES TABLEAUX ELECTRIQUES STANDING GRATUIT, PAR TYPE, 2018-2032
TABLEAU 1145 EST DU MOYEN-ORIENT ET DE L'AFRIQUE E-COMMERCE DANS LE MARCHÉ DES TABLEAUX ELECTRIQUES STANDING LIBRE, PAR TYPE, 2018-2032
Liste des figures
GRAPHIQUE 1 MARCHÉ DES TABLEAUX ELECTRIQUES À AJUSTABLES: SEGMENTATION
FIGURE 2 MARCHÉ DES TABLEAUX ÉLECTRIQUES À AJUSTABLES: TRIANGULATION DES DONNÉES
FIGURE 3 MARCHÉ DES TABLEAUX ÉLECTRIQUES À COMPOSITION AJUSTABLE: ANALYSE DROGUE
GRAPHIQUE 4 MARCHÉ DES TABLEAUX ELECTRIQUES À AJUSTABLE: ANALYSE MONDIALE DES MARCHÉS RÉGIONAUX
FIGURE 5 MARCHÉ DES TABLEAUX AJUSTABLES DE LA HAUTE ÉLECTRIQUE: ANALYSE DE LA RECHERCHE D'ENTREPRISE
GRAPHIQUE 6 MARCHÉ DES TABLEAUX ELECTRIQUES AJUSTABLES: DÉMOGRAPHIQUES INTERVIEW
FIGURE 7 MARCHÉ DES TABLEAUX AJUSTABLES À L'HAUTE ÉLECTRIQUE : GRID DE POSITION DU MARCHÉ DU DBMR
FIGURE 8 MARCHÉ DES TABLEAUX AJUSTABLES À L'HAUTE ÉLECTRIQUE: ANALYSE DU PARTAGE DES VENDEURS
GRAPHIQUE 9 MARCHÉ DES TABLEAUX ELECTRIQUES AJUSTABLES À L'HAUTE: MODÈLE MULTIVARIVÉ
FIGURE 10 MARCHÉ DES TABLEAUX AJUSTABLES DE L'HAUTEUR ÉLECTRIQUE: TYPE DE PRODUIT EN LIGNE DE VIE
FIGURE 11 MARCHÉ DES TABLEAUX AJUSTABLES À L'HAUTE ÉLECTRIQUE: COUVERTURE DE LA DEMANDE
FIGURE 12 MARCHÉ DES TABLEAUX AJUSTABLES DE LA HAUTE ÉLECTRIQUE: SEGMENTATION
GRAPHIQUE 13 QUATRE SEGMENTS COMPRIS LE MARCHÉ MONDIAL DES TABLEAUX ELECTRIQUES AJUSTABLES À LA HAUTE, PAR TYPE DE PRODUITS (2025)
FIGURE 14 DE L'AMÉRIQUE DU NORD EST EN VIGUEUR D'ÊTRE LA RÉGION DOMINANTE ET D'AVENIR DES FINS DU MARCHÉ MONDIAL DES TABLEAUX ELECTRIQUES AJUSTABLES POUR LA PÉRIODE PRÉCEDENTE DE 2026 À 2033
FIGURE 15 MARCHÉ DES TABLEAUX AJUSTABLES À L'HAUTE ÉLECTRIQUE: RÉSUMÉ
FIGURE 16 DÉCISIONS STRATÉGIQUES
FIGURE 17 ADOPTION DES NORMES DE TRAVAIL ERGONOMIQUES SUR LES PLANS DE TRAVAIL LES BUREAUX CORPORATAIRES DURANT LA PÉRIODE PRÉCÉDENTE DE 2026 À 2033
GRAPHIQUE 18 LE SEGMENT DE TYPE DE MOTEUR UNIQUE EST EXPLOITÉ À LA COMPTABILITÉ DE LA PLUS GRANDE PART DU MARCHÉ MONDIAL DES TABLEAUX ELECTRIQUES AJUSTABLES EN 2026 ET 2033
FIGURE 19 L'AMÉRIQUE DU NORD EST LA RÉGION DE LA CROISSANCE DES FINS POUR LE MARCHÉ DES TABLEAUX ÉLECTRIQUES D'HAUTE AJUSTABLE À LA PÉRIODE PRÉVUE DE 2026 À 2033
FIGURE 20 ANALYSE DES CINQ FORCES
FIGURE 21 CHAINE DE VALEUR DU MARCHÉ MONDIAL MAGNET-
FIGURE 22 MARCHÉ DES TABLEAUX AJUSTABLES À L'HAUTE ÉLECTRIQUE, 2018-2033, PRIX DE VENTE MOYEN (USD/unité)
FIGURE 23 DROGUES, RESTRINTS, POSSIBILITÉS ET DÉFIS DU MARCHÉ DES ERP ASIE-PACIFIQUE
FIGURE 24 MARCHÉ DES TABLEAUX ÉLECTRIQUES AJUSTABLES, PAR TYPE DE PRODUITS, 2018-2032
GRAPHIQUE 25 MARCHÉ DES TABLEAUX ELECTRIQUES AJUSTABLES, PAR MATÉRIEL, 2018-2032
FIGURE 26 MARCHÉ DES TABLEAUX ELECTRIQUES AJUSTABLES, PAR DEMANDE, 2018-2032
FIGURE 27 MARCHÉ DES TABLEAUX ELECTRIQUES AJUSTABLES À L'ÉTRANGER GRATUITEMENT, PAR UTILISATEUR EN FIN, 2018-2033 (en MILLEUR)
FIGURE 28 MARCHÉ DES TABLEAUX ELECTRIQUES AJUSTABLES À L'ÉTRANGER GRATUITEMENT, PAR CHANEAU DE DISTRIBUTION, 2018-2033 (en MILLIERS DE USD)
GRAPHIQUE 29 MARCHÉ DES TABLEAUX AJUSTABLES À L'HAUTE ÉLECTRIQUE: SNAPSHOT (2025)
FIGURE 30 MARCHÉ DES TABLEAUX AJUSTABLES DE L'AMÉRIQUE DU NORD STANDING LIBRE ÉLECTRIQUE: SNAPSHOT (2025)
FIGURE 31 EUROPE STANDING LIBRE HEIGHT-ADJUSTABLE TABLEAUX MARCHÉ: SNAPSHOT (2025)
GRAPHIQUE 32 MARCHÉ DES TABLEAUX ELECTRIQUES AJUSTABLES DE L'ASIE ET DU PACIFIQUE: SNAPSHOT (2025)
FIGURE 33 MARCHÉ DES TABLEAUX AJUSTABLES DE L'AMERIQUE DU SUD: SNAPSHOT (2025)
FIGURE 34 MOYEN-ORIENT ET AFRIQUE LIBRE STANDING ELECTRICAL HEIGHT-ADJUSTABLE TABLES MARCHÉ: SNAPSHOT (2025)
FIGURE 35 MARCHÉ DES TABLEAUX AJUSTABLES À L'HAUTE ÉLECTRIQUE : PARTAGE DE L'ENTREPRISE 2025 (%)
GRAPHIQUE 36 MARCHÉ DES TABLEAUX AJUSTABLES DE LA HAUTE ÉLECTRIQUE: PARTAGE D'ENTREPRISE 2025 (%)
FIGURE 37 NORTH AMÉRIQUE LIBRE STANDING ELECTRICAL HEIGHT-ADJUSTABLE TABLEAUX MARCHÉ: ENTREPRISE PARTAGE 2025 (%)
GRAPHIQUE 38 EUROPE STANDING LIBRE HEIGHT-ADJUSTABLE TABLEAUX MARCHÉ: ENTREPRISE PARTAGE 2025 (%)
GRAPHIQUE 39 MARCHÉ DES TABLEAUX ELECTRIQUES AJUSTABLES DE L'HAUTE, STAPSHOT (2025)
Méthodologie de recherche
La collecte de données et l'analyse de l'année de base sont effectuées à l'aide de modules de collecte de données avec des échantillons de grande taille. L'étape consiste à obtenir des informations sur le marché ou des données connexes via diverses sources et stratégies. Elle comprend l'examen et la planification à l'avance de toutes les données acquises dans le passé. Elle englobe également l'examen des incohérences d'informations observées dans différentes sources d'informations. Les données de marché sont analysées et estimées à l'aide de modèles statistiques et cohérents de marché. De plus, l'analyse des parts de marché et l'analyse des tendances clés sont les principaux facteurs de succès du rapport de marché. Pour en savoir plus, veuillez demander un appel d'analyste ou déposer votre demande.
La méthodologie de recherche clé utilisée par l'équipe de recherche DBMR est la triangulation des données qui implique l'exploration de données, l'analyse de l'impact des variables de données sur le marché et la validation primaire (expert du secteur). Les modèles de données incluent la grille de positionnement des fournisseurs, l'analyse de la chronologie du marché, l'aperçu et le guide du marché, la grille de positionnement des entreprises, l'analyse des brevets, l'analyse des prix, l'analyse des parts de marché des entreprises, les normes de mesure, l'analyse globale par rapport à l'analyse régionale et des parts des fournisseurs. Pour en savoir plus sur la méthodologie de recherche, envoyez une demande pour parler à nos experts du secteur.
Personnalisation disponible
Data Bridge Market Research est un leader de la recherche formative avancée. Nous sommes fiers de fournir à nos clients existants et nouveaux des données et des analyses qui correspondent à leurs objectifs. Le rapport peut être personnalisé pour inclure une analyse des tendances des prix des marques cibles, une compréhension du marché pour d'autres pays (demandez la liste des pays), des données sur les résultats des essais cliniques, une revue de la littérature, une analyse du marché des produits remis à neuf et de la base de produits. L'analyse du marché des concurrents cibles peut être analysée à partir d'une analyse basée sur la technologie jusqu'à des stratégies de portefeuille de marché. Nous pouvons ajouter autant de concurrents que vous le souhaitez, dans le format et le style de données que vous recherchez. Notre équipe d'analystes peut également vous fournir des données sous forme de fichiers Excel bruts, de tableaux croisés dynamiques (Fact book) ou peut vous aider à créer des présentations à partir des ensembles de données disponibles dans le rapport.

