Global Lyophilized Injectable Drugs Market
Taille du marché en milliards USD
TCAC :
% 
 USD
3.39 Billion
USD
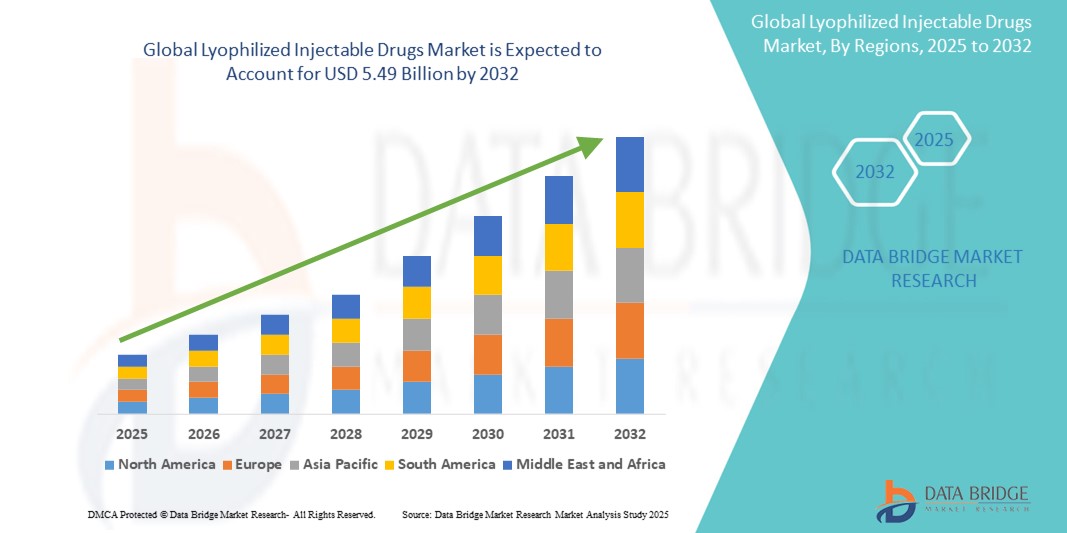
5.49 Billion
2024
2032
USD
3.39 Billion
USD
5.49 Billion
2024
2032
| 2025 –2032 | |
| USD 3.39 Billion | |
| USD 5.49 Billion | |
| % | |
|
Segmentation du marché mondial des médicaments injectables lyophilisés, par conditionnement (flacons, seringues à double chambre, cartouches à double chambre, conditionnements spécialisés, reconstitution au point de service, flacons à usage unique et autres), type d'administration (dispositifs à une seule étape, dispositifs à plusieurs étapes, seringues préremplies de diluant et dispositifs de reconstitution exclusifs), classe de médicaments (anti-infectieux, antinéoplasiques, diurétiques, inhibiteurs de la pompe à protons, anesthésiques, anticoagulants, AINS, corticostéroïdes et autres), forme (poudre et liquide), indication (oncologie, maladies auto-immunes, troubles hormonaux, troubles métaboliques, maladies respiratoires, troubles gastro-intestinaux, troubles dermatologiques, maladies ophtalmiques, maladies infectieuses et autres), voie d'administration (intraveineuse/perfusion, intramusculaire et autres), utilisateur final (Hôpital, cliniques, centres de chirurgie ambulatoire (CCA), soins à domicile et autres), canal de distribution (appel d'offres direct, vente au détail et autres) - Tendances et prévisions du secteur jusqu'en 2032
Taille du marché des médicaments injectables lyophilisés
- La taille du marché mondial des médicaments injectables lyophilisés était évaluée à 3,39 milliards USD en 2024 et devrait atteindre 5,49 milliards USD d'ici 2032, à un TCAC de 6,2 % au cours de la période de prévision.
- La croissance du marché est largement alimentée par l'adoption croissante de formulations pharmaceutiques avancées et par les progrès technologiques dans les techniques de lyophilisation, conduisant à une meilleure stabilité des médicaments, une durée de conservation plus longue et une meilleure transportabilité dans le contexte mondial des soins de santé.
- Par ailleurs, la demande croissante de formulations injectables plus stables et plus efficaces, notamment pour les produits biologiques, les vaccins et les traitements anti-infectieux, fait des médicaments injectables lyophilisés un choix privilégié des professionnels de santé. Ces facteurs convergents accélèrent l'adoption de ces solutions, stimulant ainsi considérablement la croissance du secteur.
Analyse du marché des médicaments injectables lyophilisés
- Les médicaments injectables lyophilisés, connus pour leur stabilité accrue, leur durée de conservation plus longue et leur facilité de transport, deviennent de plus en plus essentiels dans l'administration de produits biologiques, d'antibiotiques , de vaccins et de thérapies oncologiques dans les hôpitaux et les établissements de soins spécialisés en raison de leur facilité d'utilisation prolongée et de leur dépendance réduite à la chaîne du froid.
- La demande croissante de médicaments injectables lyophilisés est principalement alimentée par la prévalence croissante des maladies chroniques, le besoin croissant d'administration parentérale de produits biologiques complexes et le pipeline biopharmaceutique croissant ciblant les maladies infectieuses et auto-immunes.
- L'Amérique du Nord a dominé le marché des médicaments injectables lyophilisés avec la plus grande part de revenus de 38,7 % en 2024, caractérisée par la forte présence de pôles de fabrication pharmaceutique, une infrastructure de soins de santé avancée et l'adoption généralisée de nouvelles technologies d'administration de médicaments, en particulier aux États-Unis, ce qui conduit aux approbations de la FDA pour les formulations lyophilisées et aux investissements dans les alternatives logistiques de la chaîne du froid.
- L'Asie-Pacifique devrait être la région connaissant la croissance la plus rapide sur le marché des médicaments injectables lyophilisés, avec un TCAC prévu de 10,6 % entre 2025 et 2032, sous l'effet de l'urbanisation croissante, de la croissance rapide de l'externalisation pharmaceutique, de l'incidence croissante des maladies infectieuses et de l'amélioration de l'accès aux soins de santé dans les économies émergentes telles que la Chine et l'Inde.
- Le segment anti-infectieux a dominé le marché des médicaments injectables lyophilisés avec une part de marché de 41,3 % en 2024, sous l'effet de la charge croissante de la résistance aux antimicrobiens et de l'utilisation croissante des formulations lyophilisées dans les soins intensifs et les situations d'urgence en raison de leur longue durée de conservation et de leur facilité de reconstitution.
Portée du rapport et segmentation du marché des médicaments injectables lyophilisés
|
Attributs |
Informations clés sur le marché des médicaments injectables lyophilisés |
|
Segments couverts |
|
|
Pays couverts |
Amérique du Nord
Europe
Asie-Pacifique
Moyen-Orient et Afrique
Amérique du Sud
|
|
Principaux acteurs du marché |
|
|
Opportunités de marché |
|
|
Ensembles d'informations de données à valeur ajoutée |
Outre les informations sur les scénarios de marché tels que la valeur marchande, le taux de croissance, la segmentation, la couverture géographique et les principaux acteurs, les rapports de marché organisés par Data Bridge Market Research comprennent également une analyse approfondie des experts, une analyse des prix, une analyse de la part de marque, une enquête auprès des consommateurs, une analyse démographique, une analyse de la chaîne d'approvisionnement, une analyse de la chaîne de valeur, un aperçu des matières premières/consommables, des critères de sélection des fournisseurs, une analyse PESTLE, une analyse Porter et un cadre réglementaire. |
Tendances du marché des médicaments injectables lyophilisés
« Les progrès des technologies d'administration de médicaments stimulent la transformation du marché »
- Une tendance importante et croissante sur le marché mondial des médicaments injectables lyophilisés est l'intégration de technologies innovantes d'administration et de systèmes de reconstitution visant à améliorer le confort, l'observance et la stabilité des médicaments pour les patients. Cette évolution technologique transforme la manière dont les médicaments injectables sont stockés, manipulés et administrés, notamment en milieu clinique et à domicile.
- Par exemple, le développement de seringues et de cartouches à double chambre permet de stocker séparément le médicament lyophilisé et son diluant, puis de les mélanger juste avant administration. Cela garantit l'efficacité du médicament et simplifie la préparation pour les professionnels de santé comme pour les patients. Des entreprises comme SCHOTT et West Pharmaceutical Services sont pionnières dans le développement de systèmes de reconstitution conviviaux, réduisant ainsi les erreurs et rationalisant l'utilisation.
- Les dispositifs de reconstitution brevetés et en une seule étape gagnent en popularité dans les thérapies chroniques, offrant un dosage précis et minimisant les préparations manuelles complexes. Ces technologies sont particulièrement utiles dans les soins à domicile, permettant aux patients de s'auto-administrer leurs traitements avec une supervision minimale, réduisant ainsi les visites à l'hôpital.
- Les solutions d'emballage intelligentes, qui fournissent des indicateurs de reconstitution et de péremption, gagnent également du terrain, améliorant ainsi la sécurité des injectables lyophilisés. L'intégration de dispositifs de sécurité et de sécurité des aiguilles répond à l'importance croissante accordée à la sécurité des utilisateurs et à l'intégrité des produits.
- Par ailleurs, l'accent mis par l'industrie pharmaceutique sur l'allongement de la durée de conservation et l'amélioration de la stabilité thermique stimule la recherche sur les techniques avancées de lyophilisation. Des formulations améliorées, pouvant être stockées et transportées sans réfrigération, sont essentielles pour élargir l'accès aux médicaments essentiels dans les régions reculées ou défavorisées.
- Cette tendance vers des systèmes d'injection de médicaments plus intelligents, plus pratiques et hautement stables établit de nouvelles normes dans le secteur pharmaceutique. Par conséquent, les grandes entreprises investissent massivement en R&D pour lancer des médicaments injectables lyophilisés de nouvelle génération, dotés de mécanismes d'administration avancés, adaptés aux soins centrés sur le patient.
Dynamique du marché des médicaments injectables lyophilisés
Conducteur
« Besoin croissant dû à la demande croissante de thérapies injectables stables et à action prolongée »
- La charge mondiale croissante des maladies chroniques et infectieuses, ainsi que le besoin de formulations médicamenteuses stables à long terme, ont fortement stimulé la demande de médicaments injectables lyophilisés. Ces formulations offrent une stabilité accrue, une durée de conservation prolongée et une facilité de stockage et de transport, ce qui les rend idéales pour les établissements de santé, qu'ils soient cliniques ou à distance.
- Par exemple, en avril 2024, Baxter International Inc. a lancé une gamme élargie de médicaments anti-infectieux injectables lyophilisés, destinés aux patients ambulatoires et hospitaliers, en mettant l'accent sur une meilleure stabilité à long terme et de meilleurs résultats pour les patients. Ces initiatives devraient accélérer la croissance du marché au cours de la période de prévision.
- Les systèmes de santé du monde entier adoptent de plus en plus les produits injectables lyophilisés en raison de leur stabilité chimique et physique supérieure par rapport aux formulations liquides, en particulier dans les régions où l'infrastructure de la chaîne du froid est limitée.
- De plus, ces médicaments sont essentiels en oncologie, dans les maladies auto-immunes et en médecine d'urgence, où une reconstitution rapide et une administration immédiate sont essentielles.
- La préférence croissante pour les systèmes de reconstitution prêts à l'emploi ou au point de service, soutenue par les innovations dans les seringues et les flacons à double chambre, stimule davantage le marché, permettant une administration de médicaments plus sûre, plus rapide et plus efficace dans les hôpitaux et les soins à domicile.
- Alors que les fabricants de produits pharmaceutiques élargissent leurs gammes de produits pour inclure des versions lyophilisées de médicaments essentiels, et que les organisations de fabrication sous contrat (CMO) améliorent leurs capacités de lyophilisation, le marché connaît une forte croissance dans les pays développés et en développement.
Retenue/Défi
« Processus de fabrication complexe et coûts de production élevés »
- Malgré une forte croissance, le marché des médicaments injectables lyophilisés est confronté à des défis majeurs liés à la complexité et au coût élevé des procédés de lyophilisation. Des équipements spécialisés, des conditions aseptiques strictes et des délais de production prolongés contribuent à des coûts plus élevés que ceux des formulations traditionnelles.
- Par exemple, la mise en place d'une installation de lyophilisation à l'échelle commerciale nécessite un investissement en capital substantiel, ce qui peut dissuader les petites entreprises pharmaceutiques ou les startups d'entrer sur le marché.
- De plus, les exigences réglementaires pour les médicaments injectables stériles sont strictes, ajoutant des couches de contrôle de qualité, de documentation et de tests, des facteurs qui prolongent les délais de développement des produits et augmentent les frais généraux opérationnels.
- L'exigence de technologies d'emballage avancées, telles que les systèmes à double chambre, et la nécessité d'une logistique de la chaîne du froid dans certains cas malgré la lyophilisation, peuvent ajouter à la complexité de la chaîne d'approvisionnement et au coût global du produit.
- Pour surmonter ces obstacles, les fabricants investissent dans des technologies de lyophilisation continue et des systèmes de salles blanches modulaires afin de rationaliser leurs opérations et de réduire leurs coûts. Les collaborations avec les CDMO et les mesures gouvernementales incitatives pour développer les capacités de production locales contribuent également à atténuer ces difficultés.
- Néanmoins, surmonter ces contraintes grâce à l’innovation dans la fabrication, l’optimisation des processus et l’adoption de technologies évolutives est essentiel pour libérer le plein potentiel de croissance du marché des médicaments injectables lyophilisés à l’échelle mondiale.
Portée du marché des médicaments injectables lyophilisés
Le marché est segmenté en fonction de l’emballage, du type d’administration, de la classe de médicament, de la forme, de l’indication, de la voie d’administration, de l’utilisateur final et du canal de distribution.
• Par emballage
En termes de conditionnement, le marché des médicaments injectables lyophilisés est segmenté en flacons, seringues à double chambre, cartouches à double chambre, emballages spéciaux, reconstitution au point de service, flacons à usage unique, etc. En 2024, les flacons représentaient la plus grande part de marché, avec 36,5 %, en raison de leur rentabilité et de leur compatibilité avec toutes les classes de médicaments.
Les seringues à double chambre devraient connaître le TCAC le plus rapide de 9,8 % entre 2025 et 2032, grâce à la demande de systèmes d'administration stériles prêts à l'emploi.
• Par type de livraison
Selon le mode d'administration, le marché des médicaments injectables lyophilisés est segmenté en dispositifs à une seule étape, dispositifs à plusieurs étapes, seringues de diluant préremplies et dispositifs de reconstitution brevetés. Les dispositifs à une seule étape représentaient 34,7 % du marché en 2024, plébiscités pour leur simplicité et leur gain de temps.
Les dispositifs de reconstitution propriétaires devraient enregistrer le TCAC le plus rapide de 10,1 % entre 2025 et 2032, en raison de leur technologie avancée et de leurs caractéristiques de sécurité.
• Par classe de médicaments
Sur la base de la classe de médicaments, le marché des médicaments injectables lyophilisés est segmenté en anti-infectieux, antinéoplasiques, diurétiques, inhibiteurs de la pompe à protons, anesthésiques, anticoagulants, AINS, corticostéroïdes, etc. Les anti-infectieux dominaient le marché avec une part de 41,3 % en 2024, en raison de la prévalence mondiale des maladies infectieuses.
Les médicaments antinéoplasiques devraient croître à un TCAC de 9,6 % entre 2025 et 2032, en raison de l’augmentation de l’incidence du cancer et des besoins en formulation stable.
• Par formulaire
En termes de forme, le marché des médicaments injectables lyophilisés est segmenté en poudre et liquide. La poudre représentait la part majoritaire (65,4 %) en 2024, grâce à une durée de conservation plus longue et une meilleure stabilité au transport.
Le segment liquide devrait croître à un TCAC de 6,2 % entre 2025 et 2032, en raison de sa facilité d'utilisation et de sa préférence dans les soins d'urgence.
• Par indication
Sur la base des indications, le marché des médicaments injectables lyophilisés est segmenté en oncologie, maladies auto-immunes, troubles hormonaux, troubles métaboliques, maladies respiratoires, troubles gastro-intestinaux, troubles dermatologiques, maladies ophtalmiques, maladies infectieuses, etc. L'oncologie a dominé le marché avec une part de 26,9 % en 2024, en raison de la forte demande d'agents chimiothérapeutiques injectables.
Les maladies infectieuses devraient croître à un TCAC de 8,8 % entre 2025 et 2032, soutenues par l’utilisation croissante d’antimicrobiens lyophilisés.
• Par voie d'administration
En fonction de la classe de médicaments, le marché des médicaments injectables lyophilisés est segmenté en intraveineux/perfusion, intramusculaire et autres. En 2024, les médicaments intraveineux/perfusion représentaient la plus grande part de marché, avec 58,1 %, en raison de leur utilisation en soins intensifs.
La voie intramusculaire devrait croître à un TCAC de 6,4 % entre 2025 et 2032, sous l’effet des tendances en matière de soins à domicile et de soins ambulatoires.
• Par l'utilisateur final
En fonction de la classe de médicaments, le marché des médicaments injectables lyophilisés est segmenté entre hôpitaux, cliniques, centres de chirurgie ambulatoire (CVA), soins à domicile, etc. En 2024, les hôpitaux détenaient une part dominante de 42,7 %, grâce à un volume d'interventions élevé et à des infrastructures de pointe.
Les soins de santé à domicile devraient connaître une croissance annuelle composée (TCAC) rapide de 10,5 % entre 2025 et 2032, en raison de la préférence croissante des patients pour les traitements à domicile et l’auto-administration.
• Par canal de distribution
Sur la base de la classe de médicaments, le marché des médicaments injectables lyophilisés est segmenté en appels d'offres directs, ventes au détail et autres. Les appels d'offres directs étaient le principal canal avec une part de marché de 53,2 % en 2024, soutenu par les achats institutionnels auprès des hôpitaux publics et privés.
Les ventes au détail devraient croître à un TCAC de 9,1 % entre 2025 et 2032, à mesure que davantage de produits injectables seront disponibles dans les canaux ambulatoires et de commerce électronique.
Analyse régionale du marché des médicaments injectables lyophilisés
- L'Amérique du Nord a dominé le marché des médicaments injectables lyophilisés avec la plus grande part de revenus de 38,7 % en 2024, grâce à une solide base de fabrication pharmaceutique, à une prévalence croissante des maladies chroniques et à une infrastructure de soins de santé bien établie.
- La croissance de la région est soutenue par des investissements importants dans des systèmes avancés d'administration de médicaments et par un taux d'adoption élevé de formulations lyophilisées en raison de leur durée de conservation prolongée et de leur stabilité.
- De plus, les grandes sociétés pharmaceutiques opérant aux États-Unis et au Canada continuent de donner la priorité au développement de médicaments injectables lyophilisés pour l'oncologie, les maladies infectieuses et les maladies auto-immunes, contribuant ainsi à une expansion soutenue du marché.
Aperçu du marché américain des médicaments injectables lyophilisés
En 2024, le marché américain des médicaments injectables lyophilisés a représenté la plus grande part de chiffre d'affaires en Amérique du Nord, avec 80,1 %, grâce à un solide pipeline clinique, une infrastructure de fabrication de pointe et une préférence croissante pour les formulations stables et à longue durée de conservation. La prévalence croissante de maladies chroniques telles que le cancer et les maladies auto-immunes encourage l'utilisation de médicaments injectables lyophilisés, qui réduisent le besoin de réfrigération et garantissent la stabilité du produit. De plus, le soutien réglementaire solide de la FDA et la présence d'acteurs biopharmaceutiques de premier plan contribuent significativement à l'expansion du marché.
Aperçu du marché européen des médicaments injectables lyophilisés
Le marché européen des médicaments injectables lyophilisés devrait connaître une croissance substantielle de 8,9 % entre 2025 et 2032, soutenue par la demande croissante de formulations thermostables et stables à la conservation dans divers contextes de soins. L'accent mis sur l'optimisation de la logistique de la chaîne du froid et la satisfaction des besoins non satisfaits en oncologie et en maladies infectieuses accélère l'adoption de ces médicaments. Par ailleurs, l'essor du développement de biosimilaires et l'externalisation auprès de sociétés de fabrication sous contrat (CMO) renforcent la croissance régionale du marché des injectables lyophilisés.
Aperçu du marché britannique des médicaments injectables lyophilisés
Le marché britannique des médicaments injectables lyophilisés devrait connaître une croissance remarquable de 9,1 % au cours de la période de prévision, portée par la hausse des admissions hospitalières pour maladies chroniques et l'importance accrue accordée à l'innovation pharmaceutique. Le système de santé du pays, sous l'impulsion du NHS, privilégie de plus en plus des formulations rentables et stables, favorisant une administration et un stockage améliorés des médicaments. De plus, la multiplication des essais cliniques et l'expansion de la fabrication de médicaments spécialisés alimentent la dynamique du marché.
Aperçu du marché allemand des médicaments injectables lyophilisés
Le marché allemand des médicaments injectables lyophilisés devrait connaître une croissance considérable de 8,5 % grâce à son infrastructure pharmaceutique de pointe et à ses investissements croissants dans les produits biologiques et biosimilaires. Les hôpitaux et les centres de soins ambulatoires allemands adoptent activement les formulations lyophilisées pour une stabilité accrue, des besoins réduits en stockage à froid et une durée de conservation prolongée. Le marché bénéficie également de l'engagement du pays en faveur de la durabilité des soins de santé et de la médecine de précision .
Aperçu du marché des médicaments injectables lyophilisés en Asie-Pacifique
Le marché des médicaments injectables lyophilisés en Asie-Pacifique devrait connaître une croissance annuelle composée (TCAC) record de 10,6 % entre 2025 et 2032, portée par l'augmentation des dépenses de santé, l'urbanisation galopante et l'expansion de la production pharmaceutique dans des pays comme la Chine, l'Inde et le Japon. La volonté de la région de privilégier des thérapies injectables rentables et stables, notamment dans les pays à ressources limitées, accélère considérablement leur adoption. De plus, les initiatives gouvernementales soutenant la production pharmaceutique nationale et la recherche clinique stimulent la croissance du marché régional.
Aperçu du marché japonais des médicaments injectables lyophilisés
Le marché japonais des médicaments injectables lyophilisés prend de l'ampleur, représentant 18,2 % du chiffre d'affaires de la région Asie-Pacifique en 2024. Ce marché est porté par le vieillissement de la population, la forte prévalence des maladies chroniques et l'importance accordée à l'innovation dans le domaine des soins de santé. Les formulations lyophilisées sont de plus en plus adoptées pour leur durée de conservation plus longue et leur faible gaspillage. Le leadership du Japon en matière de R&D biopharmaceutique et les réglementations strictes en matière de qualité stimulent la demande de solutions injectables stables, notamment en oncologie et dans le traitement des maladies métaboliques.
Aperçu du marché chinois des médicaments injectables lyophilisés
En 2024, le marché chinois des médicaments injectables lyophilisés représentait la plus grande part de chiffre d'affaires de la région Asie-Pacifique, avec 44,5 %, grâce à une croissance rapide de la production pharmaceutique, une forte demande en oncologie et en thérapies anti-infectieuses, et de vastes réformes du système de santé. Figurant parmi les principaux marchés de la production biopharmaceutique et de la sous-traitance, la Chine connaît une forte demande de médicaments injectables lyophilisés dans les hôpitaux, les cliniques et les commerces de détail. Le soutien gouvernemental à l'innovation et l'amélioration de l'accès aux soins de santé dans les villes de moindre importance accélèrent encore la croissance du marché.
Part de marché des médicaments injectables lyophilisés
L’industrie des médicaments injectables lyophilisés est principalement dirigée par des entreprises bien établies, notamment :
- GENEX PHARMA (Inde)
- Aurobindo Pharma USA (États-Unis)
- Astellas Pharma Inc. (États-Unis)
- Pfizer Inc. (États-Unis)
- Viatris Inc. (États-Unis)
- Gilead Sciences, Inc. (États-Unis)
- Cirondrugs (Inde)
- Amneal Pharmaceuticals LLC (États-Unis)
- Jubilant Generics Limited (Inde)
- Novartis AG (Suisse)
- Otsuka America Pharmaceutical, Inc. (États-Unis)
- Groupe Zydus (Inde)
- Cipla Inc. (Inde)
- Merck & Co., Inc. (Allemagne)
- Fresenius Kabi AG (États-Unis)
- Sanofi (France)
- CELON LABS (Inde)
- Baxter (États-Unis)
Derniers développements sur le marché mondial des médicaments injectables lyophilisés
- En mai 2024, Pfizer Inc. a annoncé l'agrandissement de ses installations de lyophilisation dans son usine de Kalamazoo, dans le Michigan, afin de répondre à la demande croissante de produits biologiques injectables stables et de thérapies à base d'ARNm. Cet investissement vise à améliorer l'évolutivité de la production et à minimiser la dépendance à la chaîne du froid, renforçant ainsi le leadership de Pfizer dans les technologies innovantes d'administration de médicaments.
- En avril 2024, Recipharm AB, leader du développement et de la fabrication sous contrat (CDMO), a lancé une nouvelle ligne de lyophilisation de pointe dans son usine de Brescia, en Italie. Cette extension vise à répondre à la demande mondiale croissante de produits injectables lyophilisés, notamment dans les secteurs de l'oncologie et des maladies rares, et renforce la présence de Recipharm sur le marché européen de la fabrication sous contrat.
- En février 2024, Baxter International Inc. a collaboré avec la Biomedical Advanced Research and Development Authority (BARDA) des États-Unis afin d'améliorer la production nationale de lyophilisats injectables utilisés en situation d'urgence. Ce partenariat vise à améliorer la résilience de la chaîne d'approvisionnement et à accroître les stocks nationaux de médicaments essentiels thermostables.
- En janvier 2024, Aurobindo Pharma Limited a reçu l'approbation de la FDA américaine pour sa version générique lyophilisée du méropénème injectable, élargissant ainsi son portefeuille de produits injectables stériles destinés aux hôpitaux. Cette étape importante renforce la position de l'entreprise sur le marché concurrentiel des génériques injectables, en proposant des solutions rentables pour les soins intensifs.
- En décembre 2023, Cipla Limited a annoncé la commercialisation sur le marché indien de son médicament oncologique lyophilisé développé en interne, le Docétaxel Injection USP. Ce lancement vise à proposer des traitements de chimiothérapie abordables et de haute qualité, avec une durée de conservation et des avantages de stockage améliorés, renforçant ainsi l'engagement de Cipla en faveur de l'accessibilité des soins contre le cancer.
- En novembre 2023, Vetter Pharma-Fertigung GmbH & Co. KG, une société de fabrication et de fabrication de médicaments (CDMO) internationale, a démarré la construction d'une nouvelle usine en Autriche dédiée à la production à grande échelle de médicaments injectables lyophilisés. Cette usine offrira à ses partenaires biotechnologiques et pharmaceutiques des capacités de remplissage et de finition avancées pour les produits biologiques à forte valeur ajoutée et les composés sensibles.
- En octobre 2023, Hikma Pharmaceuticals PLC a élargi son offre de produits injectables lyophilisés aux États-Unis avec le lancement de nouveaux anti-infectieux et traitements cardiovasculaires génériques. Cette initiative aide les hôpitaux à gérer les pénuries de médicaments en leur fournissant des alternatives d'approvisionnement fiables à durée de conservation prolongée.
SKU-
Accédez en ligne au rapport sur le premier cloud mondial de veille économique

- Tableau de bord d'analyse de données interactif
- Tableau de bord d'analyse d'entreprise pour les opportunités à fort potentiel de croissance
- Accès d'analyste de recherche pour la personnalisation et les requêtes
- Analyse de la concurrence avec tableau de bord interactif
- Dernières actualités, mises à jour et analyse des tendances
- Exploitez la puissance de l'analyse comparative pour un suivi complet de la concurrence
Table des matières
- introduction
- OBJECTIFS DE L'ÉTUDE
- DÉFINITION DU MARCHÉ
- APERÇU DU MARCHÉ MONDIAL des médicaments injectables lyophilisés
- Limites
- MARCHÉS COUVERTS
- SEGMENTATION DU MARCHÉ
- MARCHÉS COUVERTS
- portée géographique
- années considérées pour l'étude
- monnaie et prix
- MODÈLE DE VALIDATION DES DONNÉES DU TRÉPIED DBMR
- MODÉLISATION MULTIVARIÉE
- emballage LIFELINE CURVE
- entretiens primaires avec des leaders d'opinion clés
- GRILLE DE POSITIONNEMENT DU MARCHÉ DBMR
- analyse des parts de marché des fournisseurs
- GRILLE DE COUVERTURE DU MARCHÉ utilisateur final
- sources secondaires
- hypothèses
- RÉSUMÉ EXÉCUTIF
- MARCHÉ MONDIAL DES MÉDICAMENTS INJECTABLES LYOPHILISÉS : CADRE RÉGLEMENTAIRE
- Épidémiologie
- Aperçu du marché
- conducteurs
- augmentation des maladies chroniques
- le transport et le stockage en toute sécurité de ces substances jusqu'à leur utilisation finale
- augmentation de la population gériatrique atteinte de maladies chroniques
- expansion du pipeline de médicaments injectables lyophilisés
- progrès technologiques
- Restrictions
- Risque de blessures par piqûre d'aiguille
- Augmentation du nombre de rappels de produits pour les médicaments lyophilisés et le type d'emballage
- OPPORTUNITÉS
- Augmentation des approbations réglementaires pour les médicaments lyophilisés
- INITIATIVES STRATÉGIQUES DES ACTEURS CLÉS DU MARCHÉ
- préoccupations en matière de qualité
- défis
- défis associés à la fabrication de flacons lyophilisés pour produits parentéraux
- Processus long et coût élevé
- IMPACT DU COVID-19 SUR LE MARCHÉ MONDIAL DES MÉDICAMENTS INJECTABLES LYOPHILISÉS
- IMPACT SUR LE PRIX
- IMPACT SUR LA DEMANDE
- IMPACT SUR L'OFFRE
- INITIATIVE STRATÉGIQUE
- CONCLUSION
- Marché mondial des médicaments injectables lyophilisés, par emballage
- aperçu
- flacons
- Seringues à double chambre
- Cartouches à double chambre
- Autres
- marché mondial des médicaments injectables lyophilisés, par classe de médicaments
- aperçu
- Anti-infectieux
- Antibiotiques
- Azithromycin
- Doxycycline
- Vancomycine
- Polymyxine B
- Pipéracilline
- Tazobactam
- Autres
- Antifongique
- Mycamine
- Acétate de caspofungine
- Sulfate d'isavuconazonium
- Amphotéricine
- Autres
- Antiviral
- Acyclovir
- Ganciclovir
- Remdesivir
- Autres
- Autres
- Antinéoplasique
- méthotrexate
- Gemcitabine
- Cytarabine
- Fludarabine
- Doxorubicine
- Oxaliplatine
- Acide zolédronique
- Autres
- Diurétiques
- Chlorothiazide
- Acide éthacrynique
- Acétazolamide
- Autres
- Inhibiteur de la pompe à protons
- Ésoméprazole sodique
- Pantoprazole sodique
- Oméprazole
- Autres
- Anesthésique
- Bromure de vécuronium
- Thiopental de sodium
- Lidocaïne
- Autres
- Anticoagulant
- Coumadin
- Urokinase
- Antithrombine (recombinante)
- Apixaban
- Rivaroxaban
- Autres
- AINS
- Indométacine
- Ibuprofène
- Diclofénac
- Kétorolac
- Autres
- Corticostéroïdes
- Hydrocortisone
- Méthylprednisolone
- Autres
- Autres
- marché mondial des médicaments injectables lyophilisés, par forme
- aperçu
- Poudre
- Liquide
- Marché mondial des médicaments injectables lyophilisés, par indication
- aperçu
- Oncologie
- Maladies auto-immunes
- Troubles hormonaux
- Maladies respiratoires
- Troubles gastro-intestinaux
- Troubles dermatologiques
- Maladies ophtalmiques
- Autres
- Marché mondial des médicaments injectables lyophilisés, par voie d'administration
- aperçu
- Intraveineuse/Perfusion
- Intramusculaire
- Autres
- Marché mondial des médicaments injectables lyophilisés, par utilisateur final
- aperçu
- Hôpital
- Cliniques
- Soins à domicile
- Autres
- marché mondial des médicaments injectables lyophilisés, par canal de distribution
- aperçu
- Appels d'offres directs
- Ventes au détail
- Autres
- Marché mondial des médicaments injectables lyophilisés, par région
- Aperçu
- Amérique du Nord
- nous
- Canada
- Mexique
- Europe
- Allemagne
- France
- ROYAUME-UNI
- ITALIE
- ESPAGNE
- PAYS-BAS
- RUSSIE
- SUISSE
- DINDE
- AUTRICHE
- NORVÈGE
- HONGRIE
- LITUANIE
- IRLANDE
- POLOGNE
- RESTE DE L'EUROPE
- Asie-Pacifique
- Japon
- Chine
- Corée du Sud
- Inde
- Australie
- Singapour
- Thaïlande
- Malaisie
- Indonésie
- Philippines
- Vietnam
- reste de l'Asie-Pacifique
- Amérique du Sud
- Brésil
- Argentine
- Pérou
- reste de l'Amérique du Sud
- MOYEN-ORIENT ET AFRIQUE
- Afrique du Sud
- Arabie Saoudite
- Émirats arabes unis
- EGYPTE
- KOWEIT
- ISRAËL
- RESTE DU MOYEN-ORIENT ET DE L'AFRIQUE
- Marché mondial des médicaments injectables lyophilisés : aperçu des entreprises
- analyse des actions de l'entreprise : mondiale
- analyse des actions de l'entreprise : Amérique du Nord
- analyse des actions des entreprises : Europe
- analyse des actions de l'entreprise : Asie-Pacifique
- Analyse SWOT
- Profil de l'entreprise
- pfizer Inc.
- INSTANTANÉ DE L'ENTREPRISE
- ANALYSE DES REVENUS
- ANALYSE DES ACTIONS DE L'ENTREPRISE
- PORTEFEUILLE DE PRODUITS
- RECENT DEVELOPMENT
- Fresenius Kabi USA (A subsidiary of Fresenius Kabi AG)
- COMPANY SNAPSHOT
- REVENUE ANALYSIS
- COMPANY SHARE ANALYSIS
- PRODUCT PORTFOLIO
- RECENT DEVELOPMENTS
- Cipla Inc.
- COMPANY SNAPSHOT
- REVENUE ANALYSIS
- COMPANY SHARE ANALYSIS
- PRODUCT PORTFOLIO
- RECENT DEVELOPMENT
- Novartis AG
- COMPANY SNAPSHOT
- REVENUE ANALYSIS
- COMPANY SHARE ANALYSIS
- PRODUCT PORTFOLIO
- RECENT DEVELOPMENT
- Merck Sharp & Dohme Corp., A subsidiary of Merck & Co., Inc.
- COMPANY SNAPSHOT
- REVENUE ANALYSIS
- PRODUCT PORTFOLIO
- RECENT DEVELOPMENT
- Baxter
- COMPANY SNAPSHOT
- REVENUE ANALYSIS
- PRODUCT PORTFOLIO
- RECENT DEVELOPMENTS
- zydus cadila
- COMPANY SNAPSHOT
- REVENUE ANALYSIS
- PRODUCT PORTFOLIO
- RECENT DEVELOPMENT
- Affy Pharma Pvt Ltd.
- COMPANY SNAPSHOT
- PRODUCT PORTFOLIO
- RECENT DEVELOPMENT
- Amneal Pharmaceuticals LLC
- COMPANY SNAPSHOT
- REVENUE ANALYSIS
- PRODUCT PORTFOLIO
- RECENT DEVELOPMENTS
- Aristopharma Ltd.
- COMPANY SNAPSHOT
- PRODUCT PORTFOLIO
- RECENT DEVELOPMENT
- Astellas Pharma US, Inc. (A subsidiary of Astellas Pharma Inc.)
- COMPANY SNAPSHOT
- REVENUE ANALYSIS
- PRODUCT PORTFOLIO
- RECENT DEVELOPMENTS
- AuroMedics Pharma LLC (A subsidiary of Aurobindo Pharma)
- COMPANY SNAPSHOT
- REVENUE ANALYSIS
- PRODUCT PORTFOLIO
- RECENT DEVELOPMENTS
- celon laboratories pvt.ltd.
- COMPANY SNAPSHOT
- PRODUCT PORTFOLIO
- RECENT DEVELOPMENT
- Cirondrugs
- COMPANY SNAPSHOT
- PRODUCT PORTFOLIO
- RECENT DEVELOPMENT
- Genex Pharma
- COMPANY SNAPSHOT
- PRODUCT PORTFOLIO
- RECENT DEVELOPMENT
- Gilead Sciences, Inc.
- COMPANY SNAPSHOT
- REVENUE ANALYSIS
- PRODUCT PORTFOLIO
- RECENT DEVELOPMENTS
- Jubilant Generics Limited – A Jubilant Pharma Company
- COMPANY SNAPSHOT
- REVENUE ANALYSIS
- PRODUCT PORTFOLIO
- RECENT DEVELOPMENTS
- Otsuka America Pharmaceutical, Inc
- COMPANY SNAPSHOT
- PRODUCT PORTFOLIO
- RECENT DEVELOPMENTS
- sanofi
- COMPANY SNAPSHOT
- REVENUE ANALYSIS
- PRODUCT PORTFOLIO
- RECENT DEVELOPMENT
- viatris Inc.
- COMPANY SNAPSHOT
- REVENUE ANALYSIS
- PRODUCT PORTFOLIO
- RECENT DEVELOPMENT
- questionnaire
- related reports
Liste des tableaux
TABLEAU 1 Pipeline de médicaments injectables lyophilisés
TABLEAU 2 Marché mondial des médicaments injectables lyophilisés, par conditionnement, 2019-2028 (en millions USD)
TABLEAU 3 Flacons sur le marché mondial des médicaments injectables lyophilisés, par région, 2019-2028 (en millions USD)
TABLEAU 4 Marché mondial des seringues à double chambre pour médicaments injectables lyophilisés, par région, 2019-2028 (en millions USD)
TABLEAU 5 Marché mondial des cartouches à double chambre pour médicaments injectables lyophilisés, par région, 2019-2028 (en millions USD)
TABLEAU 6 Autres acteurs mondiaux du marché des médicaments injectables lyophilisés, par région, 2019-2028 (en millions USD)
TABLEAU 7 Marché mondial des médicaments injectables lyophilisés, par classe de médicaments, 2019-2028 (en millions USD)
TABLEAU 8 Marché mondial des médicaments injectables lyophilisés, par classe de médicaments, 2019-2028 (unités)
TABLEAU 9 Anti-infectieux mondiaux sur le marché des médicaments injectables lyophilisés, par région, 2019-2028 (en millions USD)
TABLEAU 10 Marché mondial des anti-infectieux injectables lyophilisés, par classe de médicaments, 2019-2028 (en millions USD)
TABLEAU 11 Marché mondial des antibiotiques injectables lyophilisés, par classe de médicaments, 2019-2028 (en millions USD)
TABLEAU 12 Marché mondial des antifongiques injectables lyophilisés, par classe de médicaments, 2019-2028 (en millions USD)
TABLEAU 13 Marché mondial des antiviraux injectables lyophilisés, par classe de médicaments, 2019-2028 (en millions USD)
TABLEAU 14 Marché mondial des antinéoplasiques injectables lyophilisés, par région, 2019-2028 (en millions USD)
TABLEAU 15 Marché mondial des antinéoplasiques injectables lyophilisés, par classe de médicaments, 2019-2028 (en millions USD)
TABLEAU 16 Marché mondial des diurétiques injectables lyophilisés, par région, 2019-2028 (en millions USD)
TABLEAU 17 Marché mondial des diurétiques injectables lyophilisés, par classe de médicaments, 2019-2028 (en millions USD)
TABLEAU 18 Marché mondial des inhibiteurs de la pompe à protons dans les médicaments injectables lyophilisés, par région, 2019-2028 (en millions USD)
TABLEAU 19 Marché mondial des inhibiteurs de la pompe à protons dans les médicaments injectables lyophilisés, par classe de médicaments, 2019-2028 (en millions USD)
TABLEAU 20 Marché mondial des anesthésiques injectables lyophilisés, par région, 2019-2028 (en millions USD)
TABLEAU 21 Marché mondial des anesthésiques injectables lyophilisés, par classe de médicaments, 2019-2028 (en millions USD)
TABLEAU 22 Marché mondial des anticoagulants injectables lyophilisés, par région, 2019-2028 (en millions USD)
TABLEAU 23 Marché mondial des anticoagulants injectables lyophilisés, par classe de médicaments, 2019-2028 (en millions USD)
TABLEAU 24 Marché mondial des AINS injectables lyophilisés, par région, 2019-2028 (en millions USD)
TABLEAU 25 Marché mondial des AINS injectables lyophilisés, par classe de médicaments, 2019-2028 (en millions USD)
TABLEAU 26 Marché mondial des corticostéroïdes injectables lyophilisés, par région, 2019-2028 (en millions USD)
TABLEAU 27 Marché mondial des corticostéroïdes injectables lyophilisés, par classe de médicaments, 2019-2028 (en millions USD)
TABLEAU 28 Autres acteurs mondiaux du marché des médicaments injectables lyophilisés, par région, 2019-2028 (en millions USD)
TABLEAU 29 Marché mondial des médicaments injectables lyophilisés, par forme, 2019-2028 (en millions USD)
TABLEAU 30 Marché mondial des médicaments injectables lyophilisés en poudre, par région, 2019-2028 (en millions USD)
TABLEAU 31 Marché mondial des médicaments injectables lyophilisés, par région, 2019-2028 (en millions USD)
TABLEAU 32 Marché mondial des médicaments injectables lyophilisés, par indication, 2019-2028 (en millions USD)
TABLEAU 33 Marché mondial des médicaments injectables lyophilisés en oncologie, par région, 2019-2028 (en millions USD)
TABLEAU 34 Maladies auto-immunes mondiales sur le marché des médicaments injectables lyophilisés, par région, 2019-2028 (en millions USD)
TABLEAU 35 Troubles hormonaux mondiaux sur le marché des médicaments injectables lyophilisés, par région, 2019-2028 (en millions USD)
TABLEAU 36 Maladies respiratoires mondiales sur le marché des médicaments injectables lyophilisés, par région, 2019-2028 (en millions USD)
TABLEAU 37 Troubles gastro-intestinaux mondiaux sur le marché des médicaments injectables lyophilisés, par région, 2019-2028 (en millions USD)
TABLEAU 38 Troubles dermatologiques mondiaux sur le marché des médicaments injectables lyophilisés, par région, 2019-2028 (en millions USD)
TABLEAU 39 Maladies ophtalmiques mondiales sur le marché des médicaments injectables lyophilisés, par région, 2019-2028 (en millions USD)
TABLEAU 40 Autres acteurs mondiaux du marché des médicaments injectables lyophilisés, par région, 2019-2028 (en millions USD)
TABLEAU 41 Marché mondial des médicaments injectables lyophilisés, par voie d'administration, 2019-2028 (en millions USD)
TABLEAU 42 Marché mondial des médicaments injectables lyophilisés par voie intraveineuse/perfusion, par région, 2019-2028 (en millions USD)
TABLEAU 43 Marché mondial des médicaments injectables lyophilisés par voie intramusculaire, par région, 2019-2028 (en millions USD)
TABLEAU 44 Autres acteurs mondiaux du marché des médicaments injectables lyophilisés, par région, 2019-2028 (en millions USD)
TABLEAU 45 Marché mondial des médicaments injectables lyophilisés, par utilisateur final, 2019-2028 (en millions USD)
TABLEAU 46 Hôpital mondial sur le marché des médicaments injectables lyophilisés, par région, 2019-2028 (en millions USD)
TABLEAU 47 Cliniques mondiales sur le marché des médicaments injectables lyophilisés, par région, 2019-2028 (en millions USD)
TABLEAU 48 Marché mondial des soins de santé à domicile sous forme de médicaments injectables lyophilisés, par région, 2019-2028 (en millions USD)
TABLEAU 49 Autres acteurs mondiaux du marché des médicaments injectables lyophilisés, par région, 2019-2028 (en millions USD)
TABLEAU 50 Marché mondial des médicaments injectables lyophilisés, par canal de distribution, 2019-2028 (en millions USD)
TABLEAU 51 Marché mondial des médicaments injectables lyophilisés par appel d'offres direct, par région, 2019-2028 (en millions USD)
TABLEAU 52 Ventes au détail mondiales sur le marché des médicaments injectables lyophilisés, par région, 2019-2028 (en millions USD)
TABLEAU 53 Autres acteurs mondiaux du marché des médicaments injectables lyophilisés, par région, 2019-2028 (en millions USD)
TABLEAU 54 MARCHÉ MONDIAL DES MÉDICAMENTS INJECTABLES LYOPHILISÉS, PAR RÉGION, 2019-2028 (EN MILLIONS USD)
TABLEAU 55 Marché nord-américain des médicaments injectables lyophilisés, par pays, 2019-2028 (en millions USD)
TABLEAU 56 Marché nord-américain des médicaments injectables lyophilisés, par conditionnement, 2019-2028 (en millions USD)
TABLEAU 57 Marché nord-américain des médicaments injectables lyophilisés, par classe de médicaments, 2019-2028 (en millions USD)
TABLEAU 58 Marché nord-américain des médicaments injectables lyophilisés, par classe de médicaments, 2019-2028 (unités)
TABLEAU 59 Marché nord-américain des anti-infectieux injectables lyophilisés, par classe de médicaments, 2019-2028 (en millions USD)
TABLEAU 60 Marché nord-américain des antibiotiques injectables lyophilisés, par classe de médicaments, 2019-2028 (en millions USD)
TABLEAU 61 Marché nord-américain des antifongiques injectables lyophilisés, par classe de médicaments, 2019-2028 (en millions USD)
TABLEAU 62 Marché nord-américain des antiviraux injectables lyophilisés, par classe de médicaments, 2019-2028 (en millions USD)
TABLEAU 63 Marché nord-américain des antinéoplasiques injectables lyophilisés, par classe de médicaments, 2019-2028 (en millions USD)
TABLEAU 64 Marché nord-américain des diurétiques injectables lyophilisés, par classe de médicaments, 2019-2028 (en millions USD)
TABLEAU 65 Marché nord-américain des inhibiteurs de la pompe à protons dans les médicaments injectables lyophilisés, par classe de médicaments, 2019-2028 (en millions USD)
TABLEAU 66 Marché nord-américain des anesthésiques injectables lyophilisés, par classe de médicaments, 2019-2028 (en millions USD)
TABLEAU 67 Marché nord-américain des anticoagulants injectables lyophilisés, par classe de médicaments, 2019-2028 (en millions USD)
TABLEAU 68 Marché nord-américain des AINS injectables lyophilisés, par classe de médicaments, 2019-2028 (en millions USD)
TABLEAU 69 Marché nord-américain des corticostéroïdes injectables lyophilisés, par classe de médicaments, 2019-2028 (en millions USD)
TABLEAU 70 Marché nord-américain des médicaments injectables lyophilisés, par forme, 2019-2028 (en millions USD)
TABLEAU 71 Marché nord-américain des médicaments injectables lyophilisés, par indication, 2019-2028 (en millions USD)
TABLEAU 72 Marché nord-américain des médicaments injectables lyophilisés, par voie d'administration, 2019-2028 (en millions USD)
TABLEAU 73 Marché nord-américain des médicaments injectables lyophilisés, par utilisateur final, 2019-2028 (en millions USD)
TABLEAU 74 Marché nord-américain des médicaments injectables lyophilisés, par canal de distribution, 2019-2028 (en millions USD)
TABLEAU 75 Marché américain des médicaments injectables lyophilisés, par conditionnement, 2019-2028 (en millions USD)
TABLEAU 76 Marché américain des médicaments injectables lyophilisés, par classe de médicaments, 2019-2028 (en millions USD)
TABLEAU 77 Marché américain des médicaments injectables lyophilisés, par classe de médicaments, 2019-2028 (unités)
TABLEAU 78 Marché américain des anti-infectieux injectables lyophilisés, par classe de médicaments, 2019-2028 (en millions USD)
TABLEAU 79 Marché américain des antibiotiques injectables lyophilisés, par classe de médicaments, 2019-2028 (en millions USD)
TABLEAU 80 Marché américain des antifongiques injectables lyophilisés, par classe de médicaments, 2019-2028 (en millions USD)
TABLEAU 81 Marché américain des antiviraux injectables lyophilisés, par classe de médicaments, 2019-2028 (en millions USD)
TABLEAU 82 Marché américain des antinéoplasiques injectables lyophilisés, par classe de médicaments, 2019-2028 (en millions USD)
TABLEAU 83 Diurétiques sur le marché américain des médicaments injectables lyophilisés, par classe de médicaments, 2019-2028 (en millions USD)
TABLEAU 84 Marché américain des inhibiteurs de la pompe à protons sur le marché des médicaments injectables lyophilisés, par classe de médicaments, 2019-2028 (en millions USD)
TABLEAU 85 Marché américain des anesthésiques injectables lyophilisés, par classe de médicaments, 2019-2028 (en millions USD)
TABLEAU 86 Marché américain des anticoagulants injectables lyophilisés, par classe de médicaments, 2019-2028 (en millions USD)
TABLEAU 87 Marché américain des AINS injectables lyophilisés, par classe de médicaments, 2019-2028 (en millions USD)
TABLEAU 88 Corticostéroïdes sur le marché américain des médicaments injectables lyophilisés, par classe de médicaments, 2019-2028 (en millions USD)
TABLEAU 89 Marché américain des médicaments injectables lyophilisés, par forme, 2019-2028 (en millions USD)
TABLEAU 90 Marché américain des médicaments injectables lyophilisés, par indication, 2019-2028 (en millions USD)
TABLEAU 91 Marché américain des médicaments injectables lyophilisés, par voie d'administration, 2019-2028 (en millions USD)
TABLEAU 92 Marché américain des médicaments injectables lyophilisés, par utilisateur final, 2019-2028 (en millions USD)
TABLEAU 93 Marché américain des médicaments injectables lyophilisés, par canal de distribution, 2019-2028 (en millions USD)
TABLEAU 94 Marché canadien des médicaments injectables lyophilisés, par conditionnement, 2019-2028 (en millions USD)
TABLEAU 95 CANADA Marché des médicaments injectables lyophilisés, par classe de médicaments, 2019-2028 (en millions USD)
TABLEAU 96 CANADA Marché des médicaments injectables lyophilisés, par catégorie de médicaments, 2019-2028 (unités)
TABLEAU 97 CANADA Anti-infectieux sur le marché des médicaments injectables lyophilisés, par classe de médicaments, 2019-2028 (en millions USD)
TABLEAU 98 CANADA Marché des antibiotiques dans les médicaments injectables lyophilisés, par classe de médicaments, 2019-2028 (en millions USD)
TABLEAU 99 CANADA Marché des antifongiques injectables lyophilisés, par classe de médicaments, 2019-2028 (en millions USD)
TABLEAU 100 CANADA Marché des antiviraux injectables lyophilisés, par classe de médicaments, 2019-2028 (en millions USD)
TABLEAU 101 CANADA Marché des antinéoplasiques injectables lyophilisés, par classe de médicaments, 2019-2028 (en millions USD)
TABLEAU 102 CANADA Marché des diurétiques injectables lyophilisés, par classe de médicaments, 2019-2028 (en millions USD)
TABLEAU 103 CANADA Marché des inhibiteurs de la pompe à protons sur les médicaments injectables lyophilisés, par classe de médicaments, 2019-2028 (en millions USD)
TABLEAU 104 CANADA Marché des anesthésiques injectables lyophilisés, par classe de médicaments, 2019-2028 (en millions USD)
TABLEAU 105 CANADA Marché des anticoagulants injectables lyophilisés, par classe de médicaments, 2019-2028 (en millions USD)
TABLEAU 106 CANADA Marché des AINS injectables lyophilisés, par classe de médicaments, 2019-2028 (en millions USD)
TABLEAU 107 CANADA Corticostéroïdes sur le marché des médicaments injectables lyophilisés, par classe de médicaments, 2019-2028 (en millions USD)
TABLEAU 108 CANADA Marché des médicaments injectables lyophilisés, par forme, 2019-2028 (en millions USD)
TABLEAU 109 CANADA Marché des médicaments injectables lyophilisés, par indication, 2019-2028 (en millions USD)
TABLEAU 110 CANADA Marché des médicaments injectables lyophilisés, par voie d'administration, 2019-2028 (en millions USD)
TABLEAU 111 CANADA Marché des médicaments injectables lyophilisés, par utilisateur final, 2019-2028 (en millions USD)
TABLEAU 112 CANADA Marché des médicaments injectables lyophilisés, par canal de distribution, 2019-2028 (en millions USD)
TABLEAU 113 Marché mexicain des médicaments injectables lyophilisés, par conditionnement, 2019-2028 (en millions USD)
TABLEAU 114 Marché mexicain des médicaments injectables lyophilisés, par classe de médicaments, 2019-2028 (en millions USD)
TABLEAU 115 Marché des médicaments injectables lyophilisés au Mexique, par classe de médicaments, 2019-2028 (unités)
TABLEAU 116 MEXIQUE Marché des anti-infectieux injectables lyophilisés, par classe de médicaments, 2019-2028 (en millions USD)
TABLEAU 117 MEXIQUE Marché des antibiotiques injectables lyophilisés, par classe de médicaments, 2019-2028 (en millions USD)
TABLEAU 118 MEXIQUE Marché des antifongiques injectables lyophilisés, par classe de médicaments, 2019-2028 (en millions USD)
TABLEAU 119 MEXIQUE Marché des antiviraux injectables lyophilisés, par classe de médicaments, 2019-2028 (en millions USD)
TABLEAU 120 MEXIQUE Marché des antinéoplasiques injectables lyophilisés, par classe de médicaments, 2019-2028 (en millions USD)
TABLEAU 121 MEXIQUE Marché des diurétiques injectables lyophilisés, par classe de médicaments, 2019-2028 (en millions USD)
TABLEAU 122 MEXIQUE Marché des inhibiteurs de la pompe à protons dans les médicaments injectables lyophilisés, par classe de médicaments, 2019-2028 (en millions USD)
TABLEAU 123 MEXIQUE Marché des anesthésiques injectables lyophilisés, par classe de médicaments, 2019-2028 (en millions USD)
TABLEAU 124 MEXIQUE Marché des anticoagulants injectables lyophilisés, par classe de médicaments, 2019-2028 (en millions USD)
TABLEAU 125 MEXIQUE Marché des AINS injectables lyophilisés, par classe de médicaments, 2019-2028 (en millions USD)
TABLEAU 126 MEXIQUE Marché des corticostéroïdes injectables lyophilisés, par classe de médicaments, 2019-2028 (en millions USD)
TABLEAU 127 MEXIQUE Marché des médicaments injectables lyophilisés, par forme, 2019-2028 (en millions USD)
TABLEAU 128 MEXIQUE Marché des médicaments injectables lyophilisés, par indication, 2019-2028 (en millions USD)
TABLEAU 129 Marché mexicain des médicaments injectables lyophilisés, par voie d'administration, 2019-2028 (en millions USD)
TABLEAU 130 MEXIQUE Marché des médicaments injectables lyophilisés, par utilisateur final, 2019-2028 (en millions USD)
TABLEAU 131 Marché mexicain des médicaments injectables lyophilisés, par canal de distribution, 2019-2028 (en millions USD)
TABLEAU 132 MARCHÉ DES MÉDICAMENTS INJECTABLES LYOPHILISÉS EN EUROPE, PAR PAYS, 2019-2028 (EN MILLIONS USD)
TABLEAU 133 Marché européen des médicaments injectables lyophilisés, par conditionnement, 2019-2028 (en millions USD)
TABLEAU 134 Marché européen des médicaments injectables lyophilisés, par classe de médicaments, 2019-2028 (en millions USD)
TABLEAU 135 Marché européen des médicaments injectables lyophilisés, par classe de médicaments, 2019-2028 (unités)
TABLEAU 136 Marché européen des anti-infectieux injectables lyophilisés, par classe de médicaments, 2019-2028 (en millions USD)
TABLEAU 137 Marché européen des antibiotiques injectables lyophilisés, par classe de médicaments, 2019-2028 (en millions USD)
TABLEAU 138 Marché européen des antifongiques injectables lyophilisés, par classe de médicaments, 2019-2028 (en millions USD)
TABLEAU 139 Marché européen des antiviraux injectables lyophilisés, par classe de médicaments, 2019-2028 (en millions USD)
TABLEAU 140 Marché européen des antinéoplasiques injectables lyophilisés, par classe de médicaments, 2019-2028 (en millions USD)
TABLEAU 141 Marché européen des diurétiques injectables lyophilisés, par classe de médicaments, 2019-2028 (en millions USD)
TABLEAU 142 Marché européen des inhibiteurs de la pompe à protons sur le marché des médicaments injectables lyophilisés, par classe de médicaments, 2019-2028 (en millions USD)
TABLEAU 143 Marché européen des anesthésiques injectables lyophilisés, par classe de médicaments, 2019-2028 (en millions USD)
TABLEAU 144 Marché européen des anticoagulants injectables lyophilisés, par classe de médicaments, 2019-2028 (en millions USD)
TABLEAU 145 Marché européen des AINS injectables lyophilisés, par classe de médicaments, 2019-2028 (en millions USD)
TABLEAU 146 Marché européen des corticostéroïdes injectables lyophilisés, par classe de médicaments, 2019-2028 (en millions USD)
TABLEAU 147 Marché européen des médicaments injectables lyophilisés, par forme, 2019-2028 (en millions USD)
TABLEAU 148 Marché européen des médicaments injectables lyophilisés, par indication, 2019-2028 (en millions USD)
TABLEAU 149 Marché européen des médicaments injectables lyophilisés, par voie d'administration, 2019-2028 (en millions USD)
TABLEAU 150 Marché européen des médicaments injectables lyophilisés, par utilisateur final, 2019-2028 (en millions USD)
TABLEAU 151 Marché européen des médicaments injectables lyophilisés, par canal de distribution, 2019-2028 (en millions USD)
TABLEAU 152 Marché allemand des médicaments injectables lyophilisés, par conditionnement, 2019-2028 (en millions USD)
TABLEAU 153 Marché allemand des médicaments injectables lyophilisés, par classe de médicaments, 2019-2028 (en millions USD)
TABLEAU 154 Marché allemand des médicaments injectables lyophilisés, par classe de médicaments, 2019-2028 (unités)
TABLEAU 155 Marché allemand des anti-infectieux injectables lyophilisés, par classe de médicaments, 2019-2028 (en millions USD)
TABLEAU 156 Marché allemand des antibiotiques injectables lyophilisés, par classe de médicaments, 2019-2028 (en millions USD)
TABLEAU 157 Marché allemand des antifongiques injectables lyophilisés, par classe de médicaments, 2019-2028 (en millions USD)
TABLEAU 158 Marché allemand des antiviraux injectables lyophilisés, par classe de médicaments, 2019-2028 (en millions USD)
TABLEAU 159 Marché allemand des antinéoplasiques injectables lyophilisés, par classe de médicaments, 2019-2028 (en millions USD)
TABLEAU 160 Marché allemand des diurétiques injectables lyophilisés, par classe de médicaments, 2019-2028 (en millions USD)
TABLEAU 161 Marché allemand des inhibiteurs de la pompe à protons sur le marché des médicaments injectables lyophilisés, par classe de médicaments, 2019-2028 (en millions USD)
TABLEAU 162 Marché allemand des anesthésiques injectables lyophilisés, par classe de médicaments, 2019-2028 (en millions USD)
TABLEAU 163 Marché allemand des anticoagulants injectables lyophilisés, par classe de médicaments, 2019-2028 (en millions USD)
TABLEAU 164 Marché allemand des AINS injectables lyophilisés, par classe de médicaments, 2019-2028 (en millions USD)
TABLEAU 165 Marché allemand des corticostéroïdes injectables lyophilisés, par classe de médicaments, 2019-2028 (en millions USD)
TABLEAU 166 Marché allemand des médicaments injectables lyophilisés, par forme, 2019-2028 (en millions USD)
TABLEAU 167 Marché allemand des médicaments injectables lyophilisés, par indication, 2019-2028 (en millions USD)
TABLEAU 168 Marché allemand des médicaments injectables lyophilisés, par voie d'administration, 2019-2028 (en millions USD)
TABLEAU 169 Marché allemand des médicaments injectables lyophilisés, par utilisateur final, 2019-2028 (en millions USD)
TABLEAU 170 Marché allemand des médicaments injectables lyophilisés, par canal de distribution, 2019-2028 (en millions USD)
TABLEAU 171 Marché français des médicaments injectables lyophilisés, par conditionnement, 2019-2028 (en millions USD)
TABLEAU 172 Marché français des médicaments injectables lyophilisés, par classe de médicaments, 2019-2028 (en millions USD)
TABLEAU 173 Marché français des médicaments injectables lyophilisés, par classe de médicaments, 2019-2028 (unités)
TABLEAU 174 Marché français des anti-infectieux injectables lyophilisés, par classe de médicaments, 2019-2028 (en millions USD)
TABLEAU 175 Marché français des antibiotiques injectables lyophilisés, par classe de médicaments, 2019-2028 (en millions USD)
TABLEAU 176 Marché français des antifongiques injectables lyophilisés, par classe de médicaments, 2019-2028 (en millions USD)
TABLEAU 177 Marché français des antiviraux injectables lyophilisés, par classe de médicaments, 2019-2028 (en millions USD)
TABLEAU 178 Marché français des antinéoplasiques injectables lyophilisés, par classe de médicaments, 2019-2028 (en millions USD)
TABLEAU 179 Marché français des diurétiques injectables lyophilisés, par classe de médicaments, 2019-2028 (en millions USD)
TABLEAU 180 Marché français des inhibiteurs de la pompe à protons dans les médicaments injectables lyophilisés, par classe de médicaments, 2019-2028 (en millions USD)
TABLEAU 181 Marché français des anesthésiques injectables lyophilisés, par classe de médicaments, 2019-2028 (en millions USD)
TABLEAU 182 Marché français des anticoagulants injectables lyophilisés, par classe de médicaments, 2019-2028 (en millions USD)
TABLEAU 183 Marché français des AINS injectables lyophilisés, par classe de médicaments, 2019-2028 (en millions USD)
TABLEAU 184 Marché français des corticostéroïdes injectables lyophilisés, par classe de médicaments, 2019-2028 (en millions USD)
TABLEAU 185 Marché français des médicaments injectables lyophilisés, par forme, 2019-2028 (en millions USD)
TABLEAU 186 Marché français des médicaments injectables lyophilisés, par indication, 2019-2028 (en millions USD)
TABLEAU 187 Marché français des médicaments injectables lyophilisés, par voie d'administration, 2019-2028 (en millions USD)
TABLEAU 188 Marché français des médicaments injectables lyophilisés, par utilisateur final, 2019-2028 (en millions USD)
TABLEAU 189 Marché français des médicaments injectables lyophilisés, par canal de distribution, 2019-2028 (en millions USD)
TABLEAU 190 Marché britannique des médicaments injectables lyophilisés, par conditionnement, 2019-2028 (en millions USD)
TABLEAU 191 Marché britannique des médicaments injectables lyophilisés, par classe de médicaments, 2019-2028 (en millions USD)
TABLEAU 192 Marché britannique des médicaments injectables lyophilisés, par classe de médicaments, 2019-2028 (unités)
TABLEAU 193 Anti-infectieux sur le marché britannique des médicaments injectables lyophilisés, par classe de médicaments, 2019-2028 (en millions USD)
TABLEAU 194 Marché britannique des antibiotiques injectables lyophilisés, par classe de médicaments, 2019-2028 (en millions USD)
TABLEAU 195 Marché britannique des antifongiques injectables lyophilisés, par classe de médicaments, 2019-2028 (en millions USD)
TABLEAU 196 Marché britannique des antiviraux injectables lyophilisés, par classe de médicaments, 2019-2028 (en millions USD)
TABLEAU 197 Marché britannique des antinéoplasiques injectables lyophilisés, par classe de médicaments, 2019-2028 (en millions USD)
TABLEAU 198 Diurétiques sur le marché britannique des médicaments injectables lyophilisés, par classe de médicaments, 2019-2028 (en millions USD)
TABLEAU 199 Marché britannique des inhibiteurs de la pompe à protons sur le marché des médicaments injectables lyophilisés, par classe de médicaments, 2019-2028 (en millions USD)
TABLEAU 200 Marché britannique des anesthésiques injectables lyophilisés, par classe de médicaments, 2019-2028 (en millions USD)
TABLEAU 201 Marché britannique des anticoagulants injectables lyophilisés, par classe de médicaments, 2019-2028 (en millions USD)
TABLEAU 202 AINS sur le marché britannique des médicaments injectables lyophilisés, par classe de médicaments, 2019-2028 (en millions USD)
TABLEAU 203 Corticostéroïdes sur le marché britannique des médicaments injectables lyophilisés, par classe de médicaments, 2019-2028 (en millions USD)
TABLEAU 204 Marché britannique des médicaments injectables lyophilisés, par forme, 2019-2028 (en millions USD)
TABLEAU 205 Marché britannique des médicaments injectables lyophilisés, par indication, 2019-2028 (en millions USD)
TABLEAU 206 Marché britannique des médicaments injectables lyophilisés, par voie d'administration, 2019-2028 (en millions USD)
TABLEAU 207 Marché britannique des médicaments injectables lyophilisés, par utilisateur final, 2019-2028 (en millions USD)
TABLEAU 208 Marché britannique des médicaments injectables lyophilisés, par canal de distribution, 2019-2028 (en millions USD)
TABLEAU 209 Marché italien des médicaments injectables lyophilisés, par conditionnement, 2019-2028 (en millions USD)
TABLEAU 210 Marché italien des médicaments injectables lyophilisés, par classe de médicaments, 2019-2028 (en millions USD)
TABLEAU 211 Marché italien des médicaments injectables lyophilisés, par classe de médicaments, 2019-2028 (unités)
TABLEAU 212 ITALIE Anti-infectieux sur le marché des médicaments injectables lyophilisés, par classe de médicaments, 2019-2028 (en millions USD)
TABLEAU 213 ITALIE Marché des antibiotiques injectables lyophilisés, par classe de médicaments, 2019-2028 (en millions USD)
TABLEAU 214 ITALIE Marché des antifongiques injectables lyophilisés, par classe de médicaments, 2019-2028 (en millions USD)
TABLEAU 215 Marché italien des antiviraux injectables lyophilisés, par classe de médicaments, 2019-2028 (en millions USD)
TABLEAU 216 ITALIE Marché des antinéoplasiques injectables lyophilisés, par classe de médicaments, 2019-2028 (en millions USD)
TABLEAU 217 ITALIE Diurétiques sur le marché des médicaments injectables lyophilisés, par classe de médicaments, 2019-2028 (en millions USD)
TABLEAU 218 ITALIE Marché des inhibiteurs de la pompe à protons sur les médicaments injectables lyophilisés, par classe de médicaments, 2019-2028 (en millions USD)
TABLEAU 219 Marché italien des anesthésiques injectables lyophilisés, par classe de médicaments, 2019-2028 (en millions USD)
TABLEAU 220 ITALIE Marché des anticoagulants injectables lyophilisés, par classe de médicaments, 2019-2028 (en millions USD)
TABLEAU 221 ITALIE Marché des AINS injectables lyophilisés, par classe de médicaments, 2019-2028 (en millions USD)
TABLEAU 222 ITALIE Corticostéroïdes sur le marché des médicaments injectables lyophilisés, par classe de médicaments, 2019-2028 (en millions USD)
TABLEAU 223 Marché italien des médicaments injectables lyophilisés, par forme, 2019-2028 (en millions USD)
TABLEAU 224 Marché italien des médicaments injectables lyophilisés, par indication, 2019-2028 (en millions USD)
TABLEAU 225 Marché italien des médicaments injectables lyophilisés, par voie d'administration, 2019-2028 (en millions USD)
TABLEAU 226 Marché italien des médicaments injectables lyophilisés, par utilisateur final, 2019-2028 (en millions USD)
TABLEAU 227 Marché italien des médicaments injectables lyophilisés, par canal de distribution, 2019-2028 (en millions USD)
TABLEAU 228 Marché espagnol des médicaments injectables lyophilisés, par conditionnement, 2019-2028 (en millions USD)
TABLEAU 229 Marché des médicaments injectables lyophilisés en Espagne, par classe de médicaments, 2019-2028 (en millions USD)
TABLEAU 230 Marché des médicaments injectables lyophilisés en Espagne, par classe de médicaments, 2019-2028 (unités)
TABLEAU 231 ESPAGNE Anti-infectieux sur le marché des médicaments injectables lyophilisés, par classe de médicaments, 2019-2028 (en millions USD)
TABLEAU 232 ESPAGNE Marché des antibiotiques injectables lyophilisés, par classe de médicaments, 2019-2028 (en millions USD)
TABLEAU 233 ESPAGNE Marché des antifongiques injectables lyophilisés, par classe de médicaments, 2019-2028 (en millions USD)
TABLEAU 234 ESPAGNE Marché des antiviraux injectables lyophilisés, par classe de médicaments, 2019-2028 (en millions USD)
TABLEAU 235 ESPAGNE Marché des antinéoplasiques injectables lyophilisés, par classe de médicaments, 2019-2028 (en millions USD)
TABLEAU 236 ESPAGNE Diurétiques sur le marché des médicaments injectables lyophilisés, par classe de médicaments, 2019-2028 (en millions USD)
TABLEAU 237 ESPAGNE Marché des inhibiteurs de la pompe à protons sur les médicaments injectables lyophilisés, par classe de médicaments, 2019-2028 (en millions USD)
TABLEAU 238 Marché des anesthésiques injectables lyophilisés en Espagne, par classe de médicaments, 2019-2028 (en millions USD)
TABLEAU 239 ESPAGNE Marché des anticoagulants injectables lyophilisés, par classe de médicaments, 2019-2028 (en millions USD)
TABLEAU 240 ESPAGNE Marché des AINS injectables lyophilisés, par classe de médicaments, 2019-2028 (en millions USD)
TABLEAU 241 ESPAGNE Corticostéroïdes sur le marché des médicaments injectables lyophilisés, par classe de médicaments, 2019-2028 (en millions USD)
TABLEAU 242 Marché des médicaments injectables lyophilisés en Espagne, par forme, 2019-2028 (en millions USD)
TABLEAU 243 Marché des médicaments injectables lyophilisés en Espagne, par indication, 2019-2028 (en millions USD)
TABLEAU 244 Marché espagnol des médicaments injectables lyophilisés, par voie d'administration, 2019-2028 (en millions USD)
TABLEAU 245 Marché des médicaments injectables lyophilisés en Espagne, par utilisateur final, 2019-2028 (en millions USD)
TABLEAU 246 Marché des médicaments injectables lyophilisés en Espagne, par canal de distribution, 2019-2028 (en millions USD)
TABLEAU 247 PAYS-BAS Marché des médicaments injectables lyophilisés, par conditionnement, 2019-2028 (en millions USD)
TABLEAU 248 PAYS-BAS Marché des médicaments injectables lyophilisés, par classe de médicaments, 2019-2028 (en millions USD)
TABLEAU 249 PAYS-BAS Marché des médicaments injectables lyophilisés, par classe de médicaments, 2019-2028 (unités)
TABLEAU 250 PAYS-BAS Anti-infectieux sur le marché des médicaments injectables lyophilisés, par classe de médicaments, 2019-2028 (en millions USD)
TABLEAU 251 PAYS-BAS Marché des antibiotiques injectables lyophilisés, par classe de médicaments, 2019-2028 (en millions USD)
TABLEAU 252 PAYS-BAS Marché des antifongiques injectables lyophilisés, par classe de médicaments, 2019-2028 (en millions USD)
TABLEAU 253 PAYS-BAS Marché des antiviraux injectables lyophilisés, par classe de médicaments, 2019-2028 (en millions USD)
TABLEAU 254 PAYS-BAS Marché des antinéoplasiques injectables lyophilisés, par classe de médicaments, 2019-2028 (en millions USD)
TABLEAU 255 PAYS-BAS Diurétiques sur le marché des médicaments injectables lyophilisés, par classe de médicaments, 2019-2028 (en millions USD)
TABLEAU 256 PAYS-BAS Marché des inhibiteurs de la pompe à protons sur les médicaments injectables lyophilisés, par classe de médicaments, 2019-2028 (en millions USD)
TABLEAU 257 PAYS-BAS Marché des anesthésiques injectables lyophilisés, par classe de médicaments, 2019-2028 (en millions USD)
TABLEAU 258 PAYS-BAS Marché des anticoagulants injectables lyophilisés, par classe de médicaments, 2019-2028 (en millions USD)
TABLEAU 259 PAYS-BAS Marché des AINS injectables lyophilisés, par classe de médicaments, 2019-2028 (en millions USD)
TABLEAU 260 PAYS-BAS Corticostéroïdes sur le marché des médicaments injectables lyophilisés, par classe de médicaments, 2019-2028 (en millions USD)
TABLEAU 261 PAYS-BAS Marché des médicaments injectables lyophilisés, par forme, 2019-2028 (en millions USD)
TABLEAU 262 PAYS-BAS Marché des médicaments injectables lyophilisés, par indication, 2019-2028 (en millions USD)
TABLEAU 263 PAYS-BAS Marché des médicaments injectables lyophilisés, par voie d'administration, 2019-2028 (en millions USD)
TABLEAU 264 PAYS-BAS Marché des médicaments injectables lyophilisés, par utilisateur final, 2019-2028 (en millions USD)
TABLEAU 265 PAYS-BAS Marché des médicaments injectables lyophilisés, par canal de distribution, 2019-2028 (en millions USD)
TABLEAU 266 Marché russe des médicaments injectables lyophilisés, par conditionnement, 2019-2028 (en millions USD)
TABLEAU 267 Marché russe des médicaments injectables lyophilisés, par classe de médicaments, 2019-2028 (en millions USD)
TABLEAU 268 Marché russe des médicaments injectables lyophilisés, par classe de médicaments, 2019-2028 (unités)
TABLEAU 269 RUSSIE Anti-infectieux sur le marché des médicaments injectables lyophilisés, par classe de médicaments, 2019-2028 (en millions USD)
TABLEAU 270 RUSSIE Marché des antibiotiques injectables lyophilisés, par classe de médicaments, 2019-2028 (en millions USD)
TABLEAU 271 RUSSIE Marché des antifongiques injectables lyophilisés, par classe de médicaments, 2019-2028 (en millions USD)
TABLEAU 272 RUSSIE Marché des antiviraux injectables lyophilisés, par classe de médicaments, 2019-2028 (en millions USD)
TABLEAU 273 RUSSIE Marché des antinéoplasiques injectables lyophilisés, par classe de médicaments, 2019-2028 (en millions USD)
TABLEAU 274 RUSSIE Diurétiques sur le marché des médicaments injectables lyophilisés, par classe de médicaments, 2019-2028 (en millions USD)
TABLEAU 275 RUSSIE Marché des inhibiteurs de la pompe à protons sur les médicaments injectables lyophilisés, par classe de médicaments, 2019-2028 (en millions USD)
TABLEAU 276 RUSSIE Marché des anesthésiques injectables lyophilisés, par classe de médicaments, 2019-2028 (en millions USD)
TABLEAU 277 RUSSIE Marché des anticoagulants injectables lyophilisés, par classe de médicaments, 2019-2028 (en millions USD)
TABLEAU 278 RUSSIE Marché des AINS injectables lyophilisés, par classe de médicaments, 2019-2028 (en millions USD)
TABLEAU 279 RUSSIE Marché des corticostéroïdes injectables lyophilisés, par classe de médicaments, 2019-2028 (en millions USD)
TABLEAU 280 Marché russe des médicaments injectables lyophilisés, par forme, 2019-2028 (en millions USD)
TABLEAU 281 RUSSIE Marché des médicaments injectables lyophilisés, par indication, 2019-2028 (en millions USD)
TABLEAU 282 Marché russe des médicaments injectables lyophilisés, par voie d'administration, 2019-2028 (en millions USD)
TABLEAU 283 RUSSIE Marché des médicaments injectables lyophilisés, par utilisateur final, 2019-2028 (en millions USD)
TABLEAU 284 Marché russe des médicaments injectables lyophilisés, par canal de distribution, 2019-2028 (en millions USD)
TABLEAU 285 SUISSE Marché des médicaments injectables lyophilisés, par conditionnement, 2019-2028 (en millions USD)
TABLEAU 286 SUISSE Marché des médicaments injectables lyophilisés, par classe de médicaments, 2019-2028 (en millions USD)
TABLEAU 287 SUISSE Marché des médicaments injectables lyophilisés, par classe de médicaments, 2019-2028 (unités)
TABLEAU 288 SUISSE Anti-infectieux sur le marché des médicaments injectables lyophilisés, par classe de médicaments, 2019-2028 (en millions USD)
TABLEAU 289 SUISSE Marché des antibiotiques injectables lyophilisés, par classe de médicaments, 2019-2028 (en millions USD)
TABLEAU 290 SUISSE Marché des antifongiques injectables lyophilisés, par classe de médicaments, 2019-2028 (en millions USD)
TABLEAU 291 SUISSE Marché des antiviraux injectables lyophilisés, par classe de médicaments, 2019-2028 (en millions USD)
TABLEAU 292 SUISSE Marché des antinéoplasiques injectables lyophilisés, par classe de médicaments, 2019-2028 (en millions USD)
TABLEAU 293 SUISSE Marché des diurétiques injectables lyophilisés, par classe de médicaments, 2019-2028 (en millions USD)
TABLEAU 294 SUISSE Marché des inhibiteurs de la pompe à protons sur les médicaments injectables lyophilisés, par classe de médicaments, 2019-2028 (en millions USD)
TABLEAU 295 SUISSE Marché des anesthésiques injectables lyophilisés, par classe de médicaments, 2019-2028 (en millions USD)
TABLEAU 296 SUISSE Marché des anticoagulants injectables lyophilisés, par classe de médicaments, 2019-2028 (en millions USD)
TABLEAU 297 SUISSE Marché des AINS injectables lyophilisés, par classe de médicaments, 2019-2028 (en millions USD)
TABLEAU 298 SUISSE Corticostéroïdes sur le marché des médicaments injectables lyophilisés, par classe de médicaments, 2019-2028 (en millions USD)
TABLEAU 299 SUISSE Marché des médicaments injectables lyophilisés, par forme, 2019-2028 (en millions USD)
TABLEAU 300 SUISSE Marché des médicaments injectables lyophilisés, par indication, 2019-2028 (en millions USD)
TABLEAU 301 SUISSE Marché des médicaments injectables lyophilisés, par voie d'administration, 2019-2028 (en millions USD)
TABLEAU 302 SUISSE Marché des médicaments injectables lyophilisés, par utilisateur final, 2019-2028 (en millions USD)
TABLEAU 303 SUISSE Marché des médicaments injectables lyophilisés, par canal de distribution, 2019-2028 (en millions USD)
TABLEAU 304 Marché des médicaments injectables lyophilisés en Turquie, par conditionnement, 2019-2028 (en millions USD)
TABLEAU 305 Marché des médicaments injectables lyophilisés en Turquie, par classe de médicaments, 2019-2028 (en millions USD)
TABLEAU 306 Marché des médicaments injectables lyophilisés en Turquie, par classe de médicaments, 2019-2028 (unités)
TABLEAU 307 TURQUIE Anti-infectieux sur le marché des médicaments injectables lyophilisés, par classe de médicaments, 2019-2028 (en millions USD)
TABLEAU 308 TURQUIE Marché des antibiotiques injectables lyophilisés, par classe de médicaments, 2019-2028 (en millions USD)
TABLEAU 309 TURQUIE Marché des antifongiques injectables lyophilisés, par classe de médicaments, 2019-2028 (en millions USD)
TABLEAU 310 TURQUIE Marché des antiviraux injectables lyophilisés, par classe de médicaments, 2019-2028 (en millions USD)
TABLEAU 311 TURQUIE Marché des antinéoplasiques injectables lyophilisés, par classe de médicaments, 2019-2028 (en millions USD)
TABLEAU 312 TURQUIE Marché des diurétiques injectables lyophilisés, par classe de médicaments, 2019-2028 (en millions USD)
TABLEAU 313 TURQUIE Marché des inhibiteurs de la pompe à protons dans les médicaments injectables lyophilisés, par classe de médicaments, 2019-2028 (en millions USD)
TABLEAU 314 TURQUIE Marché des anesthésiques injectables lyophilisés, par classe de médicaments, 2019-2028 (en millions USD)
TABLEAU 315 TURQUIE Marché des anticoagulants injectables lyophilisés, par classe de médicaments, 2019-2028 (en millions USD)
TABLEAU 316 TURQUIE Marché des AINS injectables lyophilisés, par classe de médicaments, 2019-2028 (en millions USD)
TABLEAU 317 TURQUIE Corticostéroïdes sur le marché des médicaments injectables lyophilisés, par classe de médicaments, 2019-2028 (en millions USD)
TABLEAU 318 Marché des médicaments injectables lyophilisés en Turquie, par forme, 2019-2028 (en millions USD)
TABLEAU 319 Marché des médicaments injectables lyophilisés en Turquie, par indication, 2019-2028 (en millions USD)
TABLEAU 320 Marché des médicaments injectables lyophilisés en Turquie, par voie d'administration, 2019-2028 (en millions USD)
TABLEAU 321 Marché des médicaments injectables lyophilisés en Turquie, par utilisateur final, 2019-2028 (en millions USD)
TABLEAU 322 Marché des médicaments injectables lyophilisés en Turquie, par canal de distribution, 2019-2028 (en millions USD)
TABLEAU 323 AUTRICHE Marché des médicaments injectables lyophilisés, par conditionnement, 2019-2028 (en millions USD)
TABLEAU 324 AUTRICHE Marché des médicaments injectables lyophilisés, par classe de médicaments, 2019-2028 (en millions USD)
TABLEAU 325 AUTRICHE Marché des médicaments injectables lyophilisés, par classe de médicaments, 2019-2028 (unités)
TABLEAU 326 AUTRICHE Marché des anti-infectieux injectables lyophilisés, par classe de médicaments, 2019-2028 (en millions USD)
TABLEAU 327 AUTRICHE Marché des antibiotiques injectables lyophilisés, par classe de médicaments, 2019-2028 (en millions USD)
TABLEAU 328 AUTRICHE Marché des antifongiques injectables lyophilisés, par classe de médicaments, 2019-2028 (en millions USD)
TABLEAU 329 AUTRICHE Marché des antiviraux injectables lyophilisés, par classe de médicaments, 2019-2028 (en millions USD)
TABLEAU 330 AUTRICHE Marché des antinéoplasiques injectables lyophilisés, par classe de médicaments, 2019-2028 (en millions USD)
TABLEAU 331 AUTRICHE Marché des diurétiques injectables lyophilisés, par classe de médicaments, 2019-2028 (en millions USD)
TABLEAU 332 AUTRICHE Marché des inhibiteurs de la pompe à protons sur les médicaments injectables lyophilisés, par classe de médicaments, 2019-2028 (en millions USD)
TABLEAU 333 AUTRICHE Marché des anesthésiques injectables lyophilisés, par classe de médicaments, 2019-2028 (en millions USD)
TABLEAU 334 AUTRICHE Marché des anticoagulants injectables lyophilisés, par classe de médicaments, 2019-2028 (en millions USD)
TABLEAU 335 AUTRICHE Marché des AINS injectables lyophilisés, par classe de médicaments, 2019-2028 (en millions USD)
TABLEAU 336 AUTRICHE Corticostéroïdes sur le marché des médicaments injectables lyophilisés, par classe de médicaments, 2019-2028 (en millions USD)
TABLEAU 337 AUTRICHE Marché des médicaments injectables lyophilisés, par forme, 2019-2028 (en millions USD)
TABLEAU 338 AUTRICHE Marché des médicaments injectables lyophilisés, par indication, 2019-2028 (en millions USD)
TABLEAU 339 AUTRICHE Marché des médicaments injectables lyophilisés, par voie d'administration, 2019-2028 (en millions USD)
TABLEAU 340 AUTRICHE Marché des médicaments injectables lyophilisés, par utilisateur final, 2019-2028 (en millions USD)
TABLEAU 341 AUTRICHE Marché des médicaments injectables lyophilisés, par canal de distribution, 2019-2028 (en millions USD)
TABLEAU 342 Marché norvégien des médicaments injectables lyophilisés, par conditionnement, 2019-2028 (en millions USD)
TABLEAU 343 Marché norvégien des médicaments injectables lyophilisés, par classe de médicaments, 2019-2028 (en millions USD)
TABLEAU 344 Marché des médicaments injectables lyophilisés en NORVÈGE, par classe de médicaments, 2019-2028 (unités)
TABLEAU 345 NORVÈGE Anti-infectieux sur le marché des médicaments injectables lyophilisés, par classe de médicaments, 2019-2028 (en millions USD)
TABLEAU 346 NORVÈGE Marché des antibiotiques injectables lyophilisés, par classe de médicaments, 2019-2028 (en millions USD)
TABLEAU 347 NORVÈGE Marché des antifongiques injectables lyophilisés, par classe de médicaments, 2019-2028 (en millions USD)
TABLEAU 348 NORVÈGE Marché des antiviraux injectables lyophilisés, par classe de médicaments, 2019-2028 (en millions USD)
TABLEAU 349 NORVÈGE Marché des antinéoplasiques injectables lyophilisés, par classe de médicaments, 2019-2028 (en millions USD)
TABLEAU 350 NORVÈGE Marché des diurétiques injectables lyophilisés, par classe de médicaments, 2019-2028 (en millions USD)
TABLEAU 351 NORVÈGE Marché des inhibiteurs de la pompe à protons dans les médicaments injectables lyophilisés, par classe de médicaments, 2019-2028 (en millions USD)
TABLEAU 352 NORVÈGE Marché des anesthésiques injectables lyophilisés, par classe de médicaments, 2019-2028 (en millions USD)
TABLEAU 353 NORVÈGE Marché des anticoagulants injectables lyophilisés, par classe de médicaments, 2019-2028 (en millions USD)
TABLEAU 354 NORVÈGE Marché des AINS injectables lyophilisés, par classe de médicaments, 2019-2028 (en millions USD)
TABLEAU 355 NORVÈGE Marché des corticostéroïdes injectables lyophilisés, par classe de médicaments, 2019-2028 (en millions USD)
TABLEAU 356 NORVÈGE Marché des médicaments injectables lyophilisés, par forme, 2019-2028 (en millions USD)
TABLEAU 357 NORVÈGE Marché des médicaments injectables lyophilisés, par indication, 2019-2028 (en millions USD)
TABLEAU 358 Marché norvégien des médicaments injectables lyophilisés, par voie d'administration, 2019-2028 (en millions USD)
TABLEAU 359 NORVÈGE Marché des médicaments injectables lyophilisés, par utilisateur final, 2019-2028 (en millions USD)
TABLEAU 360 Marché norvégien des médicaments injectables lyophilisés, par canal de distribution, 2019-2028 (en millions USD)
TABLEAU 361 HONGRIE Marché des médicaments injectables lyophilisés, par conditionnement, 2019-2028 (en millions USD)
TABLEAU 362 HONGRIE Marché des médicaments injectables lyophilisés, par classe de médicaments, 2019-2028 (en millions USD)
TABLEAU 363 Marché des médicaments injectables lyophilisés en Hongrie, par classe de médicaments, 2019-2028 (unités)
TABLEAU 364 HONGRIE Marché des anti-infectieux injectables lyophilisés, par classe de médicaments, 2019-2028 (en millions USD)
TABLEAU 365 HONGRIE Marché des antibiotiques injectables lyophilisés, par classe de médicaments, 2019-2028 (en millions USD)
TABLEAU 366 HONGRIE Marché des antifongiques injectables lyophilisés, par classe de médicaments, 2019-2028 (en millions USD)
TABLEAU 367 HONGRIE Marché des antiviraux injectables lyophilisés, par classe de médicaments, 2019-2028 (en millions USD)
TABLEAU 368 HONGRIE Marché des antinéoplasiques injectables lyophilisés, par classe de médicaments, 2019-2028 (en millions USD)
TABLEAU 369 HONGRIE Marché des diurétiques injectables lyophilisés, par classe de médicaments, 2019-2028 (en millions USD)
TABLEAU 370 HONGRIE Marché des inhibiteurs de la pompe à protons sur les médicaments injectables lyophilisés, par classe de médicaments, 2019-2028 (en millions USD)
TABLEAU 371 HONGRIE Marché des anesthésiques injectables lyophilisés, par classe de médicaments, 2019-2028 (en millions USD)
TABLEAU 372 HONGRIE Marché des anticoagulants injectables lyophilisés, par classe de médicaments, 2019-2028 (en millions USD)
TABLEAU 373 HONGRIE Marché des AINS injectables lyophilisés, par classe de médicaments, 2019-2028 (en millions USD)
TABLEAU 374 HONGRIE Corticostéroïdes sur le marché des médicaments injectables lyophilisés, par classe de médicaments, 2019-2028 (en millions USD)
TABLEAU 375 HONGRIE Marché des médicaments injectables lyophilisés, par forme, 2019-2028 (en millions USD)
TABLEAU 376 HONGRIE Marché des médicaments injectables lyophilisés, par indication, 2019-2028 (en millions USD)
TABLEAU 377 HONGRIE Marché des médicaments injectables lyophilisés, par voie d'administration, 2019-2028 (en millions USD)
TABLEAU 378 HONGRIE Marché des médicaments injectables lyophilisés, par utilisateur final, 2019-2028 (en millions USD)
TABLEAU 379 HONGRIE Marché des médicaments injectables lyophilisés, par canal de distribution, 2019-2028 (en millions USD)
TABLEAU 380 LITUANIE Marché des médicaments injectables lyophilisés, par conditionnement, 2019-2028 (en millions USD)
TABLEAU 381 LITUANIE Marché des médicaments injectables lyophilisés, par classe de médicaments, 2019-2028 (en millions USD)
TABLEAU 382 LITUANIE Marché des médicaments injectables lyophilisés, par classe de médicaments, 2019-2028 (unités)
TABLEAU 383 LITUANIE Marché des anti-infectieux injectables lyophilisés, par classe de médicaments, 2019-2028 (en millions USD)
TABLEAU 384 LITUANIE Marché des antibiotiques injectables lyophilisés, par classe de médicaments, 2019-2028 (en millions USD)
TABLEAU 385 LITUANIE Marché des antifongiques injectables lyophilisés, par classe de médicaments, 2019-2028 (en millions USD)
TABLEAU 386 LITUANIE Marché des antiviraux injectables lyophilisés, par classe de médicaments, 2019-2028 (en millions USD)
TABLEAU 387 LITUANIE Marché des antinéoplasiques injectables lyophilisés, par classe de médicaments, 2019-2028 (en millions USD)
TABLEAU 388 LITUANIE Marché des diurétiques injectables lyophilisés, par classe de médicaments, 2019-2028 (en millions USD)
TABLEAU 389 LITUANIE Marché des inhibiteurs de la pompe à protons dans les médicaments injectables lyophilisés, par classe de médicaments, 2019-2028 (en millions USD)
TABLEAU 390 LITUANIE Marché des anesthésiques injectables lyophilisés, par classe de médicaments, 2019-2028 (en millions USD)
TABLEAU 391 LITUANIE Marché des anticoagulants injectables lyophilisés, par classe de médicaments, 2019-2028 (en millions USD)
TABLEAU 392 LITUANIE Marché des AINS injectables lyophilisés, par classe de médicaments, 2019-2028 (en millions USD)
TABLEAU 393 LITUANIE Marché des corticostéroïdes injectables lyophilisés, par classe de médicaments, 2019-2028 (en millions USD)
TABLEAU 394 LITUANIE Marché des médicaments injectables lyophilisés, par forme, 2019-2028 (en millions USD)
TABLEAU 395 LITUANIE Marché des médicaments injectables lyophilisés, par indication, 2019-2028 (en millions USD)
TABLEAU 396 LITUANIE Marché des médicaments injectables lyophilisés, par voie d'administration, 2019-2028 (en millions USD)
TABLEAU 397 LITUANIE Marché des médicaments injectables lyophilisés, par utilisateur final, 2019-2028 (en millions USD)
TABLEAU 398 LITUANIE Marché des médicaments injectables lyophilisés, par canal de distribution, 2019-2028 (en millions USD)
TABLEAU 399 IRLANDE Marché des médicaments injectables lyophilisés, par conditionnement, 2019-2028 (en millions USD)
TABLEAU 400 IRLANDE Marché des médicaments injectables lyophilisés, par classe de médicaments, 2019-2028 (en millions USD)
TABLEAU 401 IRLANDE Marché des médicaments injectables lyophilisés, par classe de médicaments, 2019-2028 (unités)
TABLEAU 402 IRLANDE Anti-infectieux sur le marché des médicaments injectables lyophilisés, par classe de médicaments, 2019-2028 (en millions USD)
TABLEAU 403 IRLANDE Marché des antibiotiques injectables lyophilisés, par classe de médicaments, 2019-2028 (en millions USD)
TABLEAU 404 IRLANDE Marché des antifongiques injectables lyophilisés, par classe de médicaments, 2019-2028 (en millions USD)
TABLEAU 405 IRLANDE Marché des antiviraux injectables lyophilisés, par classe de médicaments, 2019-2028 (en millions USD)
TABLEAU 406 IRLANDE Marché des antinéoplasiques injectables lyophilisés, par classe de médicaments, 2019-2028 (en millions USD)
TABLEAU 407 IRLANDE Diurétiques sur le marché des médicaments injectables lyophilisés, par classe de médicaments, 2019-2028 (en millions USD)
TABLEAU 408 IRLANDE Marché des inhibiteurs de la pompe à protons sur les médicaments injectables lyophilisés, par classe de médicaments, 2019-2028 (en millions USD)
TABLEAU 409 IRLANDE Marché des anesthésiques injectables lyophilisés, par classe de médicaments, 2019-2028 (en millions USD)
TABLEAU 410 IRLANDE Marché des anticoagulants injectables lyophilisés, par classe de médicaments, 2019-2028 (en millions USD)
TABLEAU 411 IRLANDE Marché des AINS injectables lyophilisés, par classe de médicaments, 2019-2028 (en millions USD)
TABLEAU 412 IRLANDE Corticostéroïdes sur le marché des médicaments injectables lyophilisés, par classe de médicaments, 2019-2028 (en millions USD)
TABLEAU 413 IRLANDE Marché des médicaments injectables lyophilisés, par forme, 2019-2028 (en millions USD)
TABLEAU 414 IRLANDE Marché des médicaments injectables lyophilisés, par indication, 2019-2028 (en millions USD)
TABLEAU 415 IRLANDE Marché des médicaments injectables lyophilisés, par voie d'administration, 2019-2028 (en millions USD)
TABLEAU 416 IRLANDE Marché des médicaments injectables lyophilisés, par utilisateur final, 2019-2028 (en millions USD)
TABLEAU 417 IRLANDE Marché des médicaments injectables lyophilisés, par canal de distribution, 2019-2028 (en millions USD)
TABLEAU 418 POLOGNE Marché des médicaments injectables lyophilisés, par conditionnement, 2019-2028 (en millions USD)
TABLEAU 419 POLOGNE Marché des médicaments injectables lyophilisés, par classe de médicaments, 2019-2028 (en millions USD)
TABLEAU 420 POLOGNE Marché des médicaments injectables lyophilisés, par classe de médicaments, 2019-2028 (unités)
TABLEAU 421 POLOGNE Anti-infectieux sur le marché des médicaments injectables lyophilisés, par classe de médicaments, 2019-2028 (en millions USD)
TABLEAU 422 POLOGNE Marché des antibiotiques injectables lyophilisés, par classe de médicaments, 2019-2028 (en millions USD)
TABLEAU 423 POLOGNE Marché des antifongiques injectables lyophilisés, par classe de médicaments, 2019-2028 (en millions USD)
TABLEAU 424 POLOGNE Marché des antiviraux injectables lyophilisés, par classe de médicaments, 2019-2028 (en millions USD)
TABLEAU 425 POLOGNE Marché des antinéoplasiques injectables lyophilisés, par classe de médicaments, 2019-2028 (en millions USD)
TABLEAU 426 POLOGNE Diurétiques sur le marché des médicaments injectables lyophilisés, par classe de médicaments, 2019-2028 (en millions USD)
TABLEAU 427 POLOGNE Marché des inhibiteurs de la pompe à protons sur les médicaments injectables lyophilisés, par classe de médicaments, 2019-2028 (en millions USD)
TABLEAU 428 POLOGNE Marché des anesthésiques injectables lyophilisés, par classe de médicaments, 2019-2028 (en millions USD)
TABLEAU 429 POLOGNE Marché des anticoagulants injectables lyophilisés, par classe de médicaments, 2019-2028 (en millions USD)
TABLEAU 430 POLOGNE Marché des AINS injectables lyophilisés, par classe de médicaments, 2019-2028 (en millions USD)
TABLEAU 431 POLOGNE Corticostéroïdes sur le marché des médicaments injectables lyophilisés, par classe de médicaments, 2019-2028 (en millions USD)
TABLEAU 432 POLOGNE Marché des médicaments injectables lyophilisés, par forme, 2019-2028 (en millions USD)
TABLEAU 433 POLOGNE Marché des médicaments injectables lyophilisés, par indication, 2019-2028 (en millions USD)
TABLEAU 434 POLOGNE Marché des médicaments injectables lyophilisés, par voie d'administration, 2019-2028 (en millions USD)
TABLEAU 435 POLOGNE Marché des médicaments injectables lyophilisés, par utilisateur final, 2019-2028 (en millions USD)
TABLEAU 436 POLOGNE Marché des médicaments injectables lyophilisés, par canal de distribution, 2019-2028 (en millions USD)
TABLEAU 437 RESTE DE L'EUROPE Marché des médicaments injectables lyophilisés, par conditionnement, 2019-2028 (en millions USD)
TABLEAU 438 Marché des médicaments injectables lyophilisés en Asie-Pacifique, par pays, 2019-2028 (en millions USD)
TABLEAU 439 Marché des médicaments injectables lyophilisés en Asie-Pacifique, par conditionnement, 2019-2028 (en millions USD)
TABLEAU 440 Marché des médicaments injectables lyophilisés en Asie-Pacifique, par classe de médicaments, 2019-2028 (en millions USD)
TABLEAU 441 Marché des médicaments injectables lyophilisés en Asie-Pacifique, par classe de médicaments, 2019-2028 (unités)
TABLEAU 442 Marché des anti-infectieux injectables lyophilisés en Asie-Pacifique, par classe de médicaments, 2019-2028 (en millions USD)
TABLEAU 443 Marché des antibiotiques injectables lyophilisés en Asie-Pacifique, par classe de médicaments, 2019-2028 (en millions USD)
TABLEAU 444 Marché des antifongiques injectables lyophilisés en Asie-Pacifique, par classe de médicaments, 2019-2028 (en millions USD)
TABLEAU 445 Marché des antiviraux injectables lyophilisés en Asie-Pacifique, par classe de médicaments, 2019-2028 (en millions USD)
TABLEAU 446 Marché des antinéoplasiques injectables lyophilisés en Asie-Pacifique, par classe de médicaments, 2019-2028 (en millions USD)
TABLEAU 447 Marché des diurétiques injectables lyophilisés en Asie-Pacifique, par classe de médicaments, 2019-2028 (en millions USD)
TABLEAU 448 Marché des inhibiteurs de la pompe à protons dans les médicaments injectables lyophilisés en Asie-Pacifique, par classe de médicaments, 2019-2028 (en millions USD)
TABLEAU 449 Marché des anesthésiques injectables lyophilisés en Asie-Pacifique, par classe de médicaments, 2019-2028 (en millions USD)
TABLEAU 450 Marché des anticoagulants injectables lyophilisés en Asie-Pacifique, par classe de médicaments, 2019-2028 (en millions USD)
TABLEAU 451 Marché des AINS injectables lyophilisés en Asie-Pacifique, par classe de médicaments, 2019-2028 (en millions USD)
TABLEAU 452 Marché des corticostéroïdes injectables lyophilisés en Asie-Pacifique, par classe de médicaments, 2019-2028 (en millions USD)
TABLEAU 453 Marché des médicaments injectables lyophilisés en Asie-Pacifique, par forme, 2019-2028 (en millions USD)
TABLEAU 454 Marché des médicaments injectables lyophilisés en Asie-Pacifique, par indication, 2019-2028 (en millions USD)
TABLEAU 455 Marché des médicaments injectables lyophilisés en Asie-Pacifique, par voie d'administration, 2019-2028 (en millions USD)
TABLEAU 456 Marché des médicaments injectables lyophilisés en Asie-Pacifique, par utilisateur final, 2019-2028 (en millions USD)
TABLEAU 457 Marché des médicaments injectables lyophilisés en Asie-Pacifique, par canal de distribution, 2019-2028 (en millions USD)
TABLEAU 458 Marché japonais des médicaments injectables lyophilisés, par conditionnement, 2019-2028 (en millions USD)
TABLEAU 459 Marché japonais des médicaments injectables lyophilisés, par classe de médicaments, 2019-2028 (en millions USD)
TABLEAU 460 Marché japonais des médicaments injectables lyophilisés, par classe de médicaments, 2019-2028 (unités)
TABLEAU 461 Marché japonais des anti-infectieux injectables lyophilisés, par classe de médicaments, 2019-2028 (en millions USD)
TABLEAU 462 Marché japonais des antibiotiques injectables lyophilisés, par classe de médicaments, 2019-2028 (en millions USD)
TABLEAU 463 Marché japonais des antifongiques injectables lyophilisés, par classe de médicaments, 2019-2028 (en millions USD)
TABLEAU 464 Marché japonais des antiviraux injectables lyophilisés, par classe de médicaments, 2019-2028 (en millions USD)
TABLEAU 465 Marché japonais des antinéoplasiques injectables lyophilisés, par classe de médicaments, 2019-2028 (en millions USD)
TABLEAU 466 Marché japonais des diurétiques injectables lyophilisés, par classe de médicaments, 2019-2028 (en millions USD)
TABLEAU 467 Marché japonais des inhibiteurs de la pompe à protons dans les médicaments injectables lyophilisés, par classe de médicaments, 2019-2028 (en millions USD)
TABLEAU 468 Marché japonais des anesthésiques injectables lyophilisés, par classe de médicaments, 2019-2028 (en millions USD)
TABLEAU 469 Marché japonais des anticoagulants injectables lyophilisés, par classe de médicaments, 2019-2028 (en millions USD)
TABLEAU 470 JAPON Marché des AINS injectables lyophilisés, par classe de médicaments, 2019-2028 (en millions USD)
TABLEAU 471 Marché japonais des corticostéroïdes injectables lyophilisés, par classe de médicaments, 2019-2028 (en millions USD)
TABLEAU 472 Marché japonais des médicaments injectables lyophilisés, par forme, 2019-2028 (en millions USD)
TABLEAU 473 Marché japonais des médicaments injectables lyophilisés, par indication, 2019-2028 (en millions USD)
TABLEAU 474 Marché japonais des médicaments injectables lyophilisés, par voie d'administration, 2019-2028 (en millions USD)
TABLEAU 475 Marché japonais des médicaments injectables lyophilisés, par utilisateur final, 2019-2028 (en millions USD)
TABLEAU 476 Marché japonais des médicaments injectables lyophilisés, par canal de distribution, 2019-2028 (en millions USD)
TABLEAU 477 Marché chinois des médicaments injectables lyophilisés, par conditionnement, 2019-2028 (en millions USD)
TABLEAU 478 Marché chinois des médicaments injectables lyophilisés, par classe de médicaments, 2019-2028 (en millions USD)
TABLEAU 479 Marché chinois des médicaments injectables lyophilisés, par classe de médicaments, 2019-2028 (unités)
TABLEAU 480 Marché chinois des anti-infectieux injectables lyophilisés, par classe de médicaments, 2019-2028 (en millions USD)
TABLEAU 481 Marché chinois des antibiotiques injectables lyophilisés, par classe de médicaments, 2019-2028 (en millions USD)
TABLEAU 482 Marché chinois des antifongiques injectables lyophilisés, par classe de médicaments, 2019-2028 (en millions USD)
TABLEAU 483 Marché chinois des antiviraux injectables lyophilisés, par classe de médicaments, 2019-2028 (en millions USD)
TABLEAU 484 Marché chinois des antinéoplasiques injectables lyophilisés, par classe de médicaments, 2019-2028 (en millions USD)
TABLEAU 485 Marché chinois des diurétiques injectables lyophilisés, par classe de médicaments, 2019-2028 (en millions USD)
TABLEAU 486 Marché chinois des inhibiteurs de la pompe à protons dans les médicaments injectables lyophilisés, par classe de médicaments, 2019-2028 (en millions USD)
TABLEAU 487 Marché chinois des anesthésiques injectables lyophilisés, par classe de médicaments, 2019-2028 (en millions USD)
TABLEAU 488 Marché chinois des anticoagulants injectables lyophilisés, par classe de médicaments, 2019-2028 (en millions USD)
TABLEAU 489 Marché chinois des AINS injectables lyophilisés, par classe de médicaments, 2019-2028 (en millions USD)
TABLEAU 490 Marché chinois des corticostéroïdes injectables lyophilisés, par classe de médicaments, 2019-2028 (en millions USD)
TABLEAU 491 Marché chinois des médicaments injectables lyophilisés, par forme, 2019-2028 (en millions USD)
TABLEAU 492 Marché chinois des médicaments injectables lyophilisés, par indication, 2019-2028 (en millions USD)
TABLEAU 493 Marché chinois des médicaments injectables lyophilisés, par voie d'administration, 2019-2028 (en millions USD)
TABLEAU 494 Marché chinois des médicaments injectables lyophilisés, par utilisateur final, 2019-2028 (en millions USD)
TABLEAU 495 Marché chinois des médicaments injectables lyophilisés, par canal de distribution, 2019-2028 (en millions USD)
TABLEAU 496 Marché des médicaments injectables lyophilisés en Corée du Sud, par conditionnement, 2019-2028 (en millions USD)
TABLEAU 497 CORÉE DU SUD Marché des médicaments injectables lyophilisés, par classe de médicaments, 2019-2028 (en millions USD)
TABLEAU 498 CORÉE DU SUD Marché des médicaments injectables lyophilisés, par classe de médicaments, 2019-2028 (unités)
TABLEAU 499 CORÉE DU SUD Marché des anti-infectieux injectables lyophilisés, par classe de médicaments, 2019-2028 (en millions USD)
TABLEAU 500 CORÉE DU SUD Marché des antibiotiques injectables lyophilisés, par classe de médicaments, 2019-2028 (en millions USD)
TABLEAU 501 CORÉE DU SUD Marché des antifongiques injectables lyophilisés, par classe de médicaments, 2019-2028 (en millions USD)
TABLEAU 502 CORÉE DU SUD Marché des antiviraux injectables lyophilisés, par classe de médicaments, 2019-2028 (en millions USD)
TABLEAU 503 CORÉE DU SUD Marché des antinéoplasiques injectables lyophilisés, par classe de médicaments, 2019-2028 (en millions USD)
TABLEAU 504 CORÉE DU SUD Marché des diurétiques injectables lyophilisés, par classe de médicaments, 2019-2028 (en millions USD)
TABLEAU 505 CORÉE DU SUD Marché des inhibiteurs de la pompe à protons sur les médicaments injectables lyophilisés, par classe de médicaments, 2019-2028 (en millions USD)
TABLEAU 506 CORÉE DU SUD Marché des anesthésiques injectables lyophilisés, par classe de médicaments, 2019-2028 (en millions USD)
TABLEAU 507 CORÉE DU SUD Marché des anticoagulants injectables lyophilisés, par classe de médicaments, 2019-2028 (en millions USD)
TABLEAU 508 CORÉE DU SUD Marché des AINS injectables lyophilisés, par classe de médicaments, 2019-2028 (en millions USD)
TABLEAU 509 CORÉE DU SUD Marché des corticostéroïdes injectables lyophilisés, par classe de médicaments, 2019-2028 (en millions USD)
TABLEAU 510 CORÉE DU SUD Marché des médicaments injectables lyophilisés, par forme, 2019-2028 (en millions USD)
TABLEAU 511 Marché des médicaments injectables lyophilisés en Corée du Sud, par indication, 2019-2028 (en millions USD)
TABLEAU 512 Marché des médicaments injectables lyophilisés en Corée du Sud, par voie d'administration, 2019-2028 (en millions USD)
TABLEAU 513 Marché des médicaments injectables lyophilisés en Corée du Sud, par utilisateur final, 2019-2028 (en millions USD)
TABLEAU 514 Marché des médicaments injectables lyophilisés en Corée du Sud, par canal de distribution, 2019-2028 (en millions USD)
TABLEAU 515 Marché indien des médicaments injectables lyophilisés, par conditionnement, 2019-2028 (en millions USD)
TABLEAU 516 Marché indien des médicaments injectables lyophilisés, par catégorie de médicaments, 2019-2028 (en millions USD)
TABLEAU 517 Marché des médicaments injectables lyophilisés en Inde, par classe de médicaments, 2019-2028 (unités)
TABLEAU 518 INDE Marché des anti-infectieux injectables lyophilisés, par classe de médicaments, 2019-2028 (en millions USD)
TABLEAU 519 INDE Marché des antibiotiques dans les médicaments injectables lyophilisés, par classe de médicaments, 2019-2028 (en millions USD)
TABLEAU 520 INDE Marché des antifongiques injectables lyophilisés, par classe de médicaments, 2019-2028 (en millions USD)
TABLEAU 521 INDE Marché des antiviraux injectables lyophilisés, par classe de médicaments, 2019-2028 (en millions USD)
TABLEAU 522 INDE Marché des antinéoplasiques injectables lyophilisés, par classe de médicaments, 2019-2028 (en millions USD)
TABLEAU 523 INDE Marché des diurétiques injectables lyophilisés, par classe de médicaments, 2019-2028 (en millions USD)
TABLEAU 524 INDE Marché des inhibiteurs de la pompe à protons dans les médicaments injectables lyophilisés, par classe de médicaments, 2019-2028 (en millions USD)
TABLEAU 525 Marché indien des anesthésiques injectables lyophilisés, par classe de médicaments, 2019-2028 (en millions USD)
TABLEAU 526 INDE Marché des anticoagulants injectables lyophilisés, par classe de médicaments, 2019-2028 (en millions USD)
TABLEAU 527 INDE Marché des AINS injectables lyophilisés, par classe de médicaments, 2019-2028 (en millions USD)
TABLEAU 528 INDE Corticostéroïdes sur le marché des médicaments injectables lyophilisés, par classe de médicaments, 2019-2028 (en millions USD)
TABLEAU 529 Marché indien des médicaments injectables lyophilisés, par forme, 2019-2028 (en millions USD)
TABLEAU 530 Marché des médicaments injectables lyophilisés en Inde, par indication, 2019-2028 (en millions USD)
TABLEAU 531 Marché indien des médicaments injectables lyophilisés, par voie d'administration, 2019-2028 (en millions USD)
TABLEAU 532 Marché des médicaments injectables lyophilisés en Inde, par utilisateur final, 2019-2028 (en millions USD)
TABLEAU 533 Marché des médicaments injectables lyophilisés en Inde, par canal de distribution, 2019-2028 (en millions USD)
TABLEAU 534 Marché australien des médicaments injectables lyophilisés, par conditionnement, 2019-2028 (en millions USD)
TABLEAU 535 Marché australien des médicaments injectables lyophilisés, par catégorie de médicaments, 2019-2028 (en millions USD)
TABLEAU 536 Marché australien des médicaments injectables lyophilisés, par classe de médicaments, 2019-2028 (unités)
TABLEAU 537 AUSTRALIE Marché des anti-infectieux injectables lyophilisés, par classe de médicaments, 2019-2028 (en millions USD)
TABLEAU 538 AUSTRALIE Marché des antibiotiques injectables lyophilisés, par classe de médicaments, 2019-2028 (en millions USD)
TABLEAU 539 Marché australien des antifongiques injectables lyophilisés, par classe de médicaments, 2019-2028 (en millions USD)
TABLEAU 540 AUSTRALIE Marché des antiviraux injectables lyophilisés, par classe de médicaments, 2019-2028 (en millions USD)
TABLEAU 541 AUSTRALIE Marché des antinéoplasiques injectables lyophilisés, par classe de médicaments, 2019-2028 (en millions USD)
TABLEAU 542 AUSTRALIE Marché des diurétiques injectables lyophilisés, par classe de médicaments, 2019-2028 (en millions USD)
TABLEAU 543 AUSTRALIE Marché des inhibiteurs de la pompe à protons sur les médicaments injectables lyophilisés, par classe de médicaments, 2019-2028 (en millions USD)
TABLEAU 544 Marché australien des anesthésiques injectables lyophilisés, par classe de médicaments, 2019-2028 (en millions USD)
TABLEAU 545 AUSTRALIE Marché des anticoagulants injectables lyophilisés, par classe de médicaments, 2019-2028 (en millions USD)
TABLEAU 546 AUSTRALIE Marché des AINS injectables lyophilisés, par classe de médicaments, 2019-2028 (en millions USD)
TABLEAU 547 AUSTRALIE Marché des corticostéroïdes injectables lyophilisés, par classe de médicaments, 2019-2028 (en millions USD)
TABLEAU 548 Marché australien des médicaments injectables lyophilisés, par forme, 2019-2028 (en millions USD)
TABLEAU 549 Marché australien des médicaments injectables lyophilisés, par indication, 2019-2028 (en millions USD)
TABLEAU 550 Marché australien des médicaments injectables lyophilisés, par voie d'administration, 2019-2028 (en millions USD)
TABLEAU 551 Marché australien des médicaments injectables lyophilisés, par utilisateur final, 2019-2028 (en millions USD)
TABLEAU 552 Marché australien des médicaments injectables lyophilisés, par canal de distribution, 2019-2028 (en millions USD)
TABLEAU 553 Marché des médicaments injectables lyophilisés à Singapour, par conditionnement, 2019-2028 (en millions USD)
TABLEAU 554 Marché des médicaments injectables lyophilisés à Singapour, par classe de médicaments, 2019-2028 (en millions USD)
TABLEAU 555 Marché des médicaments injectables lyophilisés à Singapour, par classe de médicaments, 2019-2028 (unités)
TABLEAU 556 Marché des anti-infectieux injectables lyophilisés à Singapour, par classe de médicaments, 2019-2028 (en millions USD)
TABLEAU 557 Marché des antibiotiques injectables lyophilisés à Singapour, par classe de médicaments, 2019-2028 (en millions USD)
TABLEAU 558 Marché des antifongiques injectables lyophilisés à Singapour, par classe de médicaments, 2019-2028 (en millions USD)
TABLEAU 559 Marché des antiviraux injectables lyophilisés à Singapour, par classe de médicaments, 2019-2028 (en millions USD)
TABLEAU 560 Marché des antinéoplasiques injectables lyophilisés à Singapour, par classe de médicaments, 2019-2028 (en millions USD)
TABLEAU 561 Marché des diurétiques injectables lyophilisés à Singapour, par classe de médicaments, 2019-2028 (en millions USD)
TABLEAU 562 Marché des inhibiteurs de la pompe à protons (IPP) à Singapour, par classe de médicaments, 2019-2028 (en millions USD)
TABLEAU 563 Marché des anesthésiques injectables lyophilisés à Singapour, par classe de médicaments, 2019-2028 (en millions USD)
TABLEAU 564 Marché des anticoagulants injectables lyophilisés à Singapour, par classe de médicaments, 2019-2028 (en millions USD)
TABLEAU 565 Marché des AINS lyophilisés injectables à Singapour, par classe de médicaments, 2019-2028 (en millions USD)
TABLEAU 566 Marché des corticostéroïdes injectables lyophilisés à Singapour, par classe de médicaments, 2019-2028 (en millions USD)
TABLEAU 567 Marché des médicaments injectables lyophilisés à Singapour, par forme, 2019-2028 (en millions USD)
TABLEAU 568 Marché des médicaments injectables lyophilisés à Singapour, par indication, 2019-2028 (en millions USD)
TABLEAU 569 Marché des médicaments injectables lyophilisés à Singapour, par voie d'administration, 2019-2028 (en millions USD)
TABLEAU 570 Marché des médicaments injectables lyophilisés à Singapour, par utilisateur final, 2019-2028 (en millions USD)
TABLEAU 571 Marché des médicaments injectables lyophilisés à Singapour, par canal de distribution, 2019-2028 (en millions USD)
TABLEAU 572 Marché thaïlandais des médicaments injectables lyophilisés, par conditionnement, 2019-2028 (en millions USD)
TABLEAU 573 Marché des médicaments injectables lyophilisés en THAÏLANDE, par classe de médicaments, 2019-2028 (en millions USD)
TABLEAU 574 Marché des médicaments injectables lyophilisés en THAÏLANDE, par classe de médicaments, 2019-2028 (unités)
TABLEAU 575 Marché des anti-infectieux injectables lyophilisés en Thaïlande, par classe de médicaments, 2019-2028 (en millions USD)
TABLEAU 576 Marché des antibiotiques injectables lyophilisés en Thaïlande, par classe de médicaments, 2019-2028 (en millions USD)
TABLEAU 577 Marché des antifongiques injectables lyophilisés en Thaïlande, par classe de médicaments, 2019-2028 (en millions USD)
TABLEAU 578 Marché des antiviraux injectables lyophilisés en Thaïlande, par classe de médicaments, 2019-2028 (en millions USD)
TABLEAU 579 Marché des antinéoplasiques injectables lyophilisés en Thaïlande, par classe de médicaments, 2019-2028 (en millions USD)
TABLEAU 580 THAÏLANDE Marché des diurétiques injectables lyophilisés, par classe de médicaments, 2019-2028 (en millions USD)
TABLEAU 581 Marché des inhibiteurs de la pompe à protons en Thaïlande, par classe de médicaments, 2019-2028 (en millions USD)
TABLEAU 582 Marché des anesthésiques injectables lyophilisés en Thaïlande, par classe de médicaments, 2019-2028 (en millions USD)
TABLEAU 583 Marché des anticoagulants injectables lyophilisés en THAÏLANDE, par classe de médicaments, 2019-2028 (en millions USD)
TABLEAU 584 Marché des AINS injectables lyophilisés en THAÏLANDE, par classe de médicaments, 2019-2028 (en millions USD)
TABLEAU 585 THAÏLANDE Corticostéroïdes sur le marché des médicaments injectables lyophilisés, par classe de médicaments, 2019-2028 (en millions USD)
TABLEAU 586 Marché des médicaments injectables lyophilisés en THAÏLANDE, par forme, 2019-2028 (en millions USD)
TABLEAU 587 Marché des médicaments injectables lyophilisés en THAÏLANDE, par indication, 2019-2028 (en millions USD)
TABLEAU 588 Marché des médicaments injectables lyophilisés en THAÏLANDE, par voie d'administration, 2019-2028 (en millions USD)
TABLEAU 589 Marché des médicaments injectables lyophilisés en THAÏLANDE, par utilisateur final, 2019-2028 (en millions USD)
TABLEAU 590 Marché des médicaments injectables lyophilisés en THAÏLANDE, par canal de distribution, 2019-2028 (en millions USD)
TABLEAU 591 Marché malaisien des médicaments injectables lyophilisés, par conditionnement, 2019-2028 (en millions USD)
TABLEAU 592 MALAISIE Marché des médicaments injectables lyophilisés, par classe de médicaments, 2019-2028 (en millions USD)
TABLEAU 593 MALAISIE Marché des médicaments injectables lyophilisés, par classe de médicaments, 2019-2028 (unités)
TABLEAU 594 MALAISIE Marché des anti-infectieux injectables lyophilisés, par classe de médicaments, 2019-2028 (en millions USD)
TABLEAU 595 MALAISIE Marché des antibiotiques injectables lyophilisés, par classe de médicaments, 2019-2028 (en millions USD)
TABLEAU 596 MALAISIE Marché des antifongiques injectables lyophilisés, par classe de médicaments, 2019-2028 (en millions USD)
TABLEAU 597 MALAISIE Marché des antiviraux injectables lyophilisés, par classe de médicaments, 2019-2028 (en millions USD)
TABLEAU 598 MALAISIE Marché des antinéoplasiques injectables lyophilisés, par classe de médicaments, 2019-2028 (en millions USD)
TABLEAU 599 MALAISIE Marché des diurétiques injectables lyophilisés, par classe de médicaments, 2019-2028 (en millions USD)
TABLEAU 600 MALAISIE Marché des inhibiteurs de la pompe à protons dans les médicaments injectables lyophilisés, par classe de médicaments, 2019-2028 (en millions USD)
TABLEAU 601 MALAISIE Marché des anesthésiques injectables lyophilisés, par classe de médicaments, 2019-2028 (en millions USD)
TABLEAU 602 MALAISIE Marché des anticoagulants injectables lyophilisés, par classe de médicaments, 2019-2028 (en millions USD)
TABLEAU 603 MALAISIE Marché des AINS injectables lyophilisés, par classe de médicaments, 2019-2028 (en millions USD)
TABLEAU 604 MALAISIE Corticostéroïdes sur le marché des médicaments injectables lyophilisés, par classe de médicaments, 2019-2028 (en millions USD)
TABLEAU 605 MALAISIE Marché des médicaments injectables lyophilisés, par forme, 2019-2028 (en millions USD)
TABLEAU 606 Marché des médicaments injectables lyophilisés en Malaisie, par indication, 2019-2028 (en millions USD)
TABLEAU 607 MALAISIE Marché des médicaments injectables lyophilisés, par voie d'administration, 2019-2028 (en millions USD)
TABLEAU 608 MALAISIE Marché des médicaments injectables lyophilisés, par utilisateur final, 2019-2028 (en millions USD)
TABLEAU 609 MALAISIE Marché des médicaments injectables lyophilisés, par canal de distribution, 2019-2028 (en millions USD)
TABLEAU 610 Marché indonésien des médicaments injectables lyophilisés, par conditionnement, 2019-2028 (en millions USD)
TABLEAU 611 Marché des médicaments injectables lyophilisés en Indonésie, par classe de médicaments, 2019-2028 (en millions USD)
TABLEAU 612 Marché des médicaments injectables lyophilisés en Indonésie, par classe de médicaments, 2019-2028 (unités)
TABLEAU 613 INDONÉSIE Marché des anti-infectieux injectables lyophilisés, par classe de médicaments, 2019-2028 (en millions USD)
TABLEAU 614 INDONÉSIE Marché des antibiotiques injectables lyophilisés, par classe de médicaments, 2019-2028 (en millions USD)
TABLEAU 615 INDONÉSIE Marché des antifongiques injectables lyophilisés, par classe de médicaments, 2019-2028 (en millions USD)
TABLEAU 616 INDONÉSIE Marché des antiviraux injectables lyophilisés, par classe de médicaments, 2019-2028 (en millions USD)
TABLEAU 617 INDONÉSIE Marché des antinéoplasiques injectables lyophilisés, par classe de médicaments, 2019-2028 (en millions USD)
TABLEAU 618 INDONÉSIE Marché des diurétiques injectables lyophilisés, par classe de médicaments, 2019-2028 (en millions USD)
TABLEAU 619 INDONÉSIE Marché des inhibiteurs de la pompe à protons sur les médicaments injectables lyophilisés, par classe de médicaments, 2019-2028 (en millions USD)
TABLEAU 620 INDONÉSIE Marché des anesthésiques injectables lyophilisés, par classe de médicaments, 2019-2028 (en millions USD)
TABLEAU 621 INDONÉSIE Marché des anticoagulants injectables lyophilisés, par classe de médicaments, 2019-2028 (en millions USD)
TABLEAU 622 INDONÉSIE Marché des AINS injectables lyophilisés, par classe de médicaments, 2019-2028 (en millions USD)
TABLEAU 623 INDONÉSIE Marché des corticostéroïdes injectables lyophilisés, par classe de médicaments, 2019-2028 (en millions USD)
TABLEAU 624 Marché des médicaments injectables lyophilisés en Indonésie, par forme, 2019-2028 (en millions USD)
TABLEAU 625 Marché des médicaments injectables lyophilisés en Indonésie, par indication, 2019-2028 (en millions USD)
TABLEAU 626 Marché des médicaments injectables lyophilisés en Indonésie, par voie d'administration, 2019-2028 (en millions USD)
TABLEAU 627 INDONÉSIE Marché des médicaments injectables lyophilisés, par utilisateur final, 2019-2028 (en millions USD)
TABLEAU 628 INDONÉSIE Marché des médicaments injectables lyophilisés, par canal de distribution, 2019-2028 (en millions USD)
TABLEAU 629 Marché des médicaments injectables lyophilisés aux Philippines, par conditionnement, 2019-2028 (en millions USD)
TABLEAU 630 PHILIPPINES Marché des médicaments injectables lyophilisés, par classe de médicaments, 2019-2028 (en millions USD)
TABLEAU 631 PHILIPPINES Marché des médicaments injectables lyophilisés, par classe de médicaments, 2019-2028 (unités)
TABLEAU 632 PHILIPPINES Marché des anti-infectieux injectables lyophilisés, par classe de médicaments, 2019-2028 (en millions USD)
TABLEAU 633 PHILIPPINES Marché des antibiotiques injectables lyophilisés, par classe de médicaments, 2019-2028 (en millions USD)
TABLEAU 634 PHILIPPINES Marché des antifongiques injectables lyophilisés, par classe de médicaments, 2019-2028 (en millions USD)
TABLEAU 635 PHILIPPINES Marché des antiviraux injectables lyophilisés, par classe de médicaments, 2019-2028 (en millions USD)
TABLEAU 636 PHILIPPINES Marché des antinéoplasiques injectables lyophilisés, par classe de médicaments, 2019-2028 (en millions USD)
TABLEAU 637 PHILIPPINES Marché des diurétiques injectables lyophilisés, par classe de médicaments, 2019-2028 (en millions USD)
TABLEAU 638 PHILIPPINES Marché des inhibiteurs de la pompe à protons sur les médicaments injectables lyophilisés, par classe de médicaments, 2019-2028 (en millions USD)
TABLEAU 639 PHILIPPINES Marché des anesthésiques injectables lyophilisés, par classe de médicaments, 2019-2028 (en millions USD)
TABLEAU 640 PHILIPPINES Marché des anticoagulants injectables lyophilisés, par classe de médicaments, 2019-2028 (en millions USD)
TABLEAU 641 PHILIPPINES Marché des AINS injectables lyophilisés, par classe de médicaments, 2019-2028 (en millions USD)
TABLEAU 642 PHILIPPINES Marché des corticostéroïdes injectables lyophilisés, par classe de médicaments, 2019-2028 (en millions USD)
TABLEAU 643 PHILIPPINES Marché des médicaments injectables lyophilisés, par forme, 2019-2028 (en millions USD)
TABLEAU 644 PHILIPPINES Marché des médicaments injectables lyophilisés, par indication, 2019-2028 (en millions USD)
TABLEAU 645 PHILIPPINES Marché des médicaments injectables lyophilisés, par voie d'administration, 2019-2028 (en millions USD)
TABLEAU 646 PHILIPPINES Marché des médicaments injectables lyophilisés, par utilisateur final, 2019-2028 (en millions USD)
TABLEAU 647 PHILIPPINES Marché des médicaments injectables lyophilisés, par canal de distribution, 2019-2028 (en millions USD)
TABLEAU 648 Marché vietnamien des médicaments injectables lyophilisés, par conditionnement, 2019-2028 (en millions USD)
TABLEAU 649 Marché vietnamien des médicaments injectables lyophilisés, par classe de médicaments, 2019-2028 (en millions USD)
TABLEAU 650 Marché vietnamien des médicaments injectables lyophilisés, par classe de médicaments, 2019-2028 (unités)
TABLEAU 651 VIETNAM Marché des anti-infectieux injectables lyophilisés, par classe de médicaments, 2019-2028 (en millions USD)
TABLEAU 652 VIETNAM Marché des antibiotiques injectables lyophilisés, par classe de médicaments, 2019-2028 (en millions USD)
TABLEAU 653 VIETNAM Marché des antifongiques injectables lyophilisés, par classe de médicaments, 2019-2028 (en millions USD)
TABLEAU 654 VIETNAM Marché des antiviraux injectables lyophilisés, par classe de médicaments, 2019-2028 (en millions USD)
TABLEAU 655 VIETNAM Marché des antinéoplasiques injectables lyophilisés, par classe de médicaments, 2019-2028 (en millions USD)
TABLEAU 656 VIETNAM Marché des diurétiques injectables lyophilisés, par classe de médicaments, 2019-2028 (en millions USD)
TABLEAU 657 VIETNAM Marché des inhibiteurs de la pompe à protons dans les médicaments injectables lyophilisés, par classe de médicaments, 2019-2028 (en millions USD)
TABLEAU 658 Marché vietnamien des anesthésiques injectables lyophilisés, par classe de médicaments, 2019-2028 (en millions USD)
TABLEAU 659 VIETNAM Marché des anticoagulants injectables lyophilisés, par classe de médicaments, 2019-2028 (en millions USD)
TABLEAU 660 VIETNAM Marché des AINS injectables lyophilisés, par classe de médicaments, 2019-2028 (en millions USD)
TABLEAU 661 VIETNAM Marché des corticostéroïdes injectables lyophilisés, par classe de médicaments, 2019-2028 (en millions USD)
TABLEAU 662 Marché vietnamien des médicaments injectables lyophilisés, par forme, 2019-2028 (en millions USD)
TABLEAU 663 Marché vietnamien des médicaments injectables lyophilisés, par indication, 2019-2028 (en millions USD)
TABLEAU 664 Marché vietnamien des médicaments injectables lyophilisés, par voie d'administration, 2019-2028 (en millions USD)
TABLEAU 665 Marché vietnamien des médicaments injectables lyophilisés, par utilisateur final, 2019-2028 (en millions USD)
TABLEAU 666 Marché vietnamien des médicaments injectables lyophilisés, par canal de distribution, 2019-2028 (en millions USD)
TABLEAU 667 Marché des médicaments injectables lyophilisés dans le reste de l'Asie-Pacifique, par conditionnement, 2019-2028 (en millions USD)
TABLEAU 668 Marché des médicaments injectables lyophilisés en Amérique du Sud, par pays, 2019-2028 (en millions USD)
TABLEAU 669 Marché des médicaments injectables lyophilisés en Amérique du Sud, par conditionnement, 2019-2028 (en millions USD)
TABLEAU 670 Marché des médicaments injectables lyophilisés en Amérique du Sud, par classe de médicaments, 2019-2028 (en millions USD)
TABLEAU 671 Marché des médicaments injectables lyophilisés en Amérique du Sud, par classe de médicaments, 2019-2028 (unités)
TABLEAU 672 Marché des anti-infectieux injectables lyophilisés en Amérique du Sud, par classe de médicaments, 2019-2028 (en millions USD)
TABLEAU 673 Marché des antibiotiques injectables lyophilisés en Amérique du Sud, par classe de médicaments, 2019-2028 (en millions USD)
TABLEAU 674 Marché des antifongiques injectables lyophilisés en Amérique du Sud, par classe de médicaments, 2019-2028 (en millions USD)
TABLEAU 675 Marché des antiviraux injectables lyophilisés en Amérique du Sud, par classe de médicaments, 2019-2028 (en millions USD)
TABLEAU 676 Marché des antinéoplasiques injectables lyophilisés en Amérique du Sud, par classe de médicaments, 2019-2028 (en millions USD)
TABLEAU 677 Marché des diurétiques injectables lyophilisés en Amérique du Sud, par classe de médicaments, 2019-2028 (en millions USD)
TABLEAU 678 Marché des inhibiteurs de la pompe à protons en Amérique du Sud, par classe de médicaments, 2019-2028 (en millions USD)
TABLEAU 679 Marché des anesthésiques injectables lyophilisés en Amérique du Sud, par classe de médicaments, 2019-2028 (en millions USD)
TABLEAU 680 Marché des anticoagulants injectables lyophilisés en Amérique du Sud, par classe de médicaments, 2019-2028 (en millions USD)
TABLEAU 681 Marché des AINS injectables lyophilisés en Amérique du Sud, par classe de médicaments, 2019-2028 (en millions USD)
TABLEAU 682 Marché des corticostéroïdes injectables lyophilisés en Amérique du Sud, par classe de médicaments, 2019-2028 (en millions USD)
TABLEAU 683 Marché des médicaments injectables lyophilisés en Amérique du Sud, par forme, 2019-2028 (en millions USD)
TABLEAU 684 Marché des médicaments injectables lyophilisés en Amérique du Sud, par indication, 2019-2028 (en millions USD)
TABLEAU 685 Marché des médicaments injectables lyophilisés en Amérique du Sud, par voie d'administration, 2019-2028 (en millions USD)
TABLEAU 686 Marché des médicaments injectables lyophilisés en Amérique du Sud, par utilisateur final, 2019-2028 (en millions USD)
TABLEAU 687 Marché des médicaments injectables lyophilisés en Amérique du Sud, par canal de distribution, 2019-2028 (en millions USD)
TABLEAU 688 Marché brésilien des médicaments injectables lyophilisés, par conditionnement, 2019-2028 (en millions USD)
TABLEAU 689 BRÉSIL Marché des médicaments injectables lyophilisés, par classe de médicaments, 2019-2028 (en millions USD)
TABLEAU 690 BRÉSIL Marché des médicaments injectables lyophilisés, par classe de médicaments, 2019-2028 (unités)
TABLEAU 691 BRÉSIL Marché des anti-infectieux injectables lyophilisés, par classe de médicaments, 2019-2028 (en millions USD)
TABLEAU 692 BRÉSIL Marché des antibiotiques injectables lyophilisés, par classe de médicaments, 2019-2028 (en millions USD)
TABLEAU 693 BRÉSIL Marché des antifongiques injectables lyophilisés, par classe de médicaments, 2019-2028 (en millions USD)
TABLEAU 694 BRÉSIL Marché des antiviraux injectables lyophilisés, par classe de médicaments, 2019-2028 (en millions USD)
TABLEAU 695 BRÉSIL Marché des antinéoplasiques injectables lyophilisés, par classe de médicaments, 2019-2028 (en millions USD)
TABLEAU 696 BRÉSIL Marché des diurétiques injectables lyophilisés, par classe de médicaments, 2019-2028 (en millions USD)
TABLEAU 697 BRÉSIL Marché des inhibiteurs de la pompe à protons dans les médicaments injectables lyophilisés, par classe de médicaments, 2019-2028 (en millions USD)
TABLEAU 698 BRÉSIL Marché des anesthésiques injectables lyophilisés, par classe de médicaments, 2019-2028 (en millions USD)
TABLEAU 699 BRÉSIL Marché des anticoagulants injectables lyophilisés, par classe de médicaments, 2019-2028 (en millions USD)
TABLEAU 700 BRÉSIL Marché des AINS injectables lyophilisés, par classe de médicaments, 2019-2028 (en millions USD)
TABLEAU 701 BRÉSIL Marché des corticostéroïdes injectables lyophilisés, par classe de médicaments, 2019-2028 (en millions USD)
TABLEAU 702 BRÉSIL Marché des médicaments injectables lyophilisés, par forme, 2019-2028 (en millions USD)
TABLEAU 703 BRÉSIL Marché des médicaments injectables lyophilisés, par indication, 2019-2028 (en millions USD)
TABLEAU 704 BRÉSIL Marché des médicaments injectables lyophilisés, par voie d'administration, 2019-2028 (en millions USD)
TABLEAU 705 BRÉSIL Marché des médicaments injectables lyophilisés, par utilisateur final, 2019-2028 (en millions USD)
TABLEAU 706 BRÉSIL Marché des médicaments injectables lyophilisés, par canal de distribution, 2019-2028 (en millions USD)
TABLEAU 707 Marché argentin des médicaments injectables lyophilisés, par conditionnement, 2019-2028 (en millions USD)
TABLEAU 708 Marché des médicaments injectables lyophilisés en Argentine, par classe de médicaments, 2019-2028 (en millions USD)
TABLEAU 709 Marché des médicaments injectables lyophilisés en Argentine, par classe de médicaments, 2019-2028 (unités)
TABLEAU 710 ARGENTINE Marché des anti-infectieux injectables lyophilisés, par classe de médicaments, 2019-2028 (en millions USD)
TABLEAU 711 ARGENTINE Marché des antibiotiques injectables lyophilisés, par classe de médicaments, 2019-2028 (en millions USD)
TABLEAU 712 Marché argentin des antifongiques injectables lyophilisés, par classe de médicaments, 2019-2028 (en millions USD)
TABLEAU 713 Marché argentin des antiviraux injectables lyophilisés, par classe de médicaments, 2019-2028 (en millions USD)
TABLEAU 714 ARGENTINE Marché des antinéoplasiques injectables lyophilisés, par classe de médicaments, 2019-2028 (en millions USD)
TABLEAU 715 ARGENTINE Marché des diurétiques injectables lyophilisés, par classe de médicaments, 2019-2028 (en millions USD)
TABLEAU 716 ARGENTINE Marché des inhibiteurs de la pompe à protons sur les médicaments injectables lyophilisés, par classe de médicaments, 2019-2028 (en millions USD)
TABLEAU 717 ARGENTINE Marché des anesthésiques injectables lyophilisés, par classe de médicaments, 2019-2028 (en millions USD)
TABLEAU 718 ARGENTINE Marché des anticoagulants injectables lyophilisés, par classe de médicaments, 2019-2028 (en millions USD)
TABLEAU 719 ARGENTINE Marché des AINS injectables lyophilisés, par classe de médicaments, 2019-2028 (en millions USD)
TABLEAU 720 ARGENTINE Corticostéroïdes sur le marché des médicaments injectables lyophilisés, par classe de médicaments, 2019-2028 (en millions USD)
TABLEAU 721 ARGENTINE Marché des médicaments injectables lyophilisés, par forme, 2019-2028 (en millions USD)
TABLEAU 722 Marché des médicaments injectables lyophilisés en Argentine, par indication, 2019-2028 (en millions USD)
TABLEAU 723 Marché des médicaments injectables lyophilisés en Argentine, par voie d'administration, 2019-2028 (en millions USD)
TABLEAU 724 Marché des médicaments injectables lyophilisés en Argentine, par utilisateur final, 2019-2028 (en millions USD)
TABLEAU 725 Marché des médicaments injectables lyophilisés en Argentine, par canal de distribution, 2019-2028 (en millions USD)
TABLEAU 726 Marché péruvien des médicaments injectables lyophilisés, par conditionnement, 2019-2028 (en millions USD)
TABLEAU 727 Marché des médicaments injectables lyophilisés au Pérou, par classe de médicaments, 2019-2028 (en millions USD)
TABLEAU 728 Marché des médicaments injectables lyophilisés au Pérou, par classe de médicaments, 2019-2028 (unités)
TABLEAU 729 PÉROU Marché des anti-infectieux injectables lyophilisés, par classe de médicaments, 2019-2028 (en millions USD)
TABLEAU 730 PÉROU Marché des antibiotiques injectables lyophilisés, par classe de médicaments, 2019-2028 (en millions USD)
TABLEAU 731 PÉROU Marché des antifongiques injectables lyophilisés, par classe de médicaments, 2019-2028 (en millions USD)
TABLEAU 732 PÉROU Marché des antiviraux injectables lyophilisés, par classe de médicaments, 2019-2028 (en millions USD)
TABLEAU 733 PÉROU Marché des antinéoplasiques injectables lyophilisés, par classe de médicaments, 2019-2028 (en millions USD)
TABLEAU 734 PÉROU Marché des diurétiques injectables lyophilisés, par classe de médicaments, 2019-2028 (en millions USD)
TABLEAU 735 PÉROU Marché des inhibiteurs de la pompe à protons sur les médicaments injectables lyophilisés, par classe de médicaments, 2019-2028 (en millions USD)
TABLEAU 736 Marché des anesthésiques injectables lyophilisés au Pérou, par classe de médicaments, 2019-2028 (en millions USD)
TABLEAU 737 PÉROU Marché des anticoagulants injectables lyophilisés, par classe de médicaments, 2019-2028 (en millions USD)
TABLEAU 738 PÉROU Marché des AINS injectables lyophilisés, par classe de médicaments, 2019-2028 (en millions USD)
TABLEAU 739 PÉROU Corticostéroïdes sur le marché des médicaments injectables lyophilisés, par classe de médicaments, 2019-2028 (en millions USD)
TABLEAU 740 Marché des médicaments injectables lyophilisés au Pérou, par forme, 2019-2028 (en millions USD)
TABLEAU 741 Marché des médicaments injectables lyophilisés au Pérou, par indication, 2019-2028 (en millions USD)
TABLEAU 742 Marché des médicaments injectables lyophilisés au Pérou, par voie d'administration, 2019-2028 (en millions USD)
TABLEAU 743 Marché des médicaments injectables lyophilisés au Pérou, par utilisateur final, 2019-2028 (en millions USD)
TABLEAU 744 Marché des médicaments injectables lyophilisés au Pérou, par canal de distribution, 2019-2028 (en millions USD)
TABLEAU 745 Marché des médicaments injectables lyophilisés dans le reste de l'Amérique du Sud, par conditionnement, 2019-2028 (en millions USD)
TABLEAU 746 MARCHÉ DES MÉDICAMENTS INJECTABLES LYOPHILISÉS AU MOYEN-ORIENT ET EN AFRIQUE, PAR PAYS, 2019-2028 (EN MILLIONS USD)
TABLEAU 747 Marché des médicaments injectables lyophilisés au Moyen-Orient et en Afrique, par conditionnement, 2019-2028 (en millions USD)
TABLEAU 748 Marché des médicaments injectables lyophilisés au Moyen-Orient et en Afrique, par classe de médicaments, 2019-2028 (en millions USD)
TABLEAU 749 Marché des médicaments injectables lyophilisés au Moyen-Orient et en Afrique, par classe de médicaments, 2019-2028 (unités)
TABLEAU 750 Marché des anti-infectieux injectables lyophilisés au Moyen-Orient et en Afrique, par classe de médicaments, 2019-2028 (en millions USD)
TABLEAU 751 Marché des antibiotiques injectables lyophilisés au Moyen-Orient et en Afrique, par classe de médicaments, 2019-2028 (en millions USD)
TABLEAU 752 Marché des antifongiques injectables lyophilisés au Moyen-Orient et en Afrique, par classe de médicaments, 2019-2028 (en millions USD)
TABLEAU 753 Marché des antiviraux injectables lyophilisés au Moyen-Orient et en Afrique, par classe de médicaments, 2019-2028 (en millions USD)
TABLEAU 754 Marché des antinéoplasiques injectables lyophilisés au Moyen-Orient et en Afrique, par classe de médicaments, 2019-2028 (en millions USD)
TABLEAU 755 Marché des diurétiques injectables lyophilisés au Moyen-Orient et en Afrique, par classe de médicaments, 2019-2028 (en millions USD)
TABLEAU 756 Marché des inhibiteurs de la pompe à protons dans les médicaments injectables lyophilisés au Moyen-Orient et en Afrique, par classe de médicaments, 2019-2028 (en millions USD)
TABLEAU 757 Marché des anesthésiques injectables lyophilisés au Moyen-Orient et en Afrique, par classe de médicaments, 2019-2028 (en millions USD)
TABLEAU 758 Marché des anticoagulants injectables lyophilisés au Moyen-Orient et en Afrique, par classe de médicaments, 2019-2028 (en millions USD)
TABLEAU 759 Marché des AINS injectables lyophilisés au Moyen-Orient et en Afrique, par classe de médicaments, 2019-2028 (en millions USD)
TABLEAU 760 Marché des corticostéroïdes injectables lyophilisés au Moyen-Orient et en Afrique, par classe de médicaments, 2019-2028 (en millions USD)
TABLEAU 761 Marché des médicaments injectables lyophilisés au Moyen-Orient et en Afrique, par forme, 2019-2028 (en millions USD)
TABLEAU 762 Marché des médicaments injectables lyophilisés au Moyen-Orient et en Afrique, par indication, 2019-2028 (en millions USD)
TABLEAU 763 Marché des médicaments injectables lyophilisés au Moyen-Orient et en Afrique, par voie d'administration, 2019-2028 (en millions USD)
TABLEAU 764 Marché des médicaments injectables lyophilisés au Moyen-Orient et en Afrique, par utilisateur final, 2019-2028 (en millions USD)
TABLEAU 765 Marché des médicaments injectables lyophilisés au Moyen-Orient et en Afrique, par canal de distribution, 2019-2028 (en millions USD)
TABLEAU 766 Marché des médicaments injectables lyophilisés en Afrique du Sud, par conditionnement, 2019-2028 (en millions USD)
TABLEAU 767 Marché des médicaments injectables lyophilisés en Afrique du Sud, par classe de médicaments, 2019-2028 (en millions USD)
TABLEAU 768 Marché des médicaments injectables lyophilisés en Afrique du Sud, par classe de médicaments, 2019-2028 (unités)
TABLEAU 769 Marché des anti-infectieux injectables lyophilisés en Afrique du Sud, par classe de médicaments, 2019-2028 (en millions USD)
TABLEAU 770 Marché des antibiotiques injectables lyophilisés en Afrique du Sud, par classe de médicaments, 2019-2028 (en millions USD)
TABLEAU 771 Marché des antifongiques injectables lyophilisés en Afrique du Sud, par classe de médicaments, 2019-2028 (en millions USD)
TABLEAU 772 Marché sud-africain des antiviraux injectables lyophilisés, par classe de médicaments, 2019-2028 (en millions USD)
TABLEAU 773 Marché des antinéoplasiques injectables lyophilisés en Afrique du Sud, par classe de médicaments, 2019-2028 (en millions USD)
TABLEAU 774 Marché des diurétiques injectables lyophilisés en Afrique du Sud, par classe de médicaments, 2019-2028 (en millions USD)
TABLEAU 775 Marché des inhibiteurs de la pompe à protons en Afrique du Sud, par classe de médicaments, 2019-2028 (en millions USD)
TABLEAU 776 Marché des anesthésiques injectables lyophilisés en Afrique du Sud, par classe de médicaments, 2019-2028 (en millions USD)
TABLEAU 777 Marché sud-africain des anticoagulants injectables lyophilisés, par classe de médicaments, 2019-2028 (en millions USD)
TABLEAU 778 Marché sud-africain des AINS injectables lyophilisés, par classe de médicaments, 2019-2028 (en millions USD)
TABLEAU 779 Marché des corticostéroïdes injectables lyophilisés en Afrique du Sud, par classe de médicaments, 2019-2028 (en millions USD)
TABLEAU 780 Marché des médicaments injectables lyophilisés en Afrique du Sud, par forme, 2019-2028 (en millions USD)
TABLEAU 781 Marché des médicaments injectables lyophilisés en Afrique du Sud, par indication, 2019-2028 (en millions USD)
TABLEAU 782 Marché des médicaments injectables lyophilisés en Afrique du Sud, par voie d'administration, 2019-2028 (en millions USD)
TABLEAU 783 Marché des médicaments injectables lyophilisés en Afrique du Sud, par utilisateur final, 2019-2028 (en millions USD)
TABLEAU 784 Marché des médicaments injectables lyophilisés en Afrique du Sud, par canal de distribution, 2019-2028 (en millions USD)
TABLEAU 785 Marché des médicaments injectables lyophilisés en Arabie saoudite, par conditionnement, 2019-2028 (en millions USD)
TABLEAU 786 Marché des médicaments injectables lyophilisés en Arabie saoudite, par catégorie de médicaments, 2019-2028 (en millions USD)
TABLEAU 787 Marché des médicaments injectables lyophilisés en Arabie saoudite, par classe de médicaments, 2019-2028 (unités)
TABLEAU 788 Marché des anti-infectieux injectables lyophilisés en Arabie saoudite, par classe de médicaments, 2019-2028 (en millions USD)
TABLEAU 789 Marché des antibiotiques injectables lyophilisés en Arabie saoudite, par classe de médicaments, 2019-2028 (en millions USD)
TABLEAU 790 Marché des antifongiques injectables lyophilisés en Arabie saoudite, par classe de médicaments, 2019-2028 (en millions USD)
TABLEAU 791 Marché des antiviraux injectables lyophilisés en Arabie saoudite, par classe de médicaments, 2019-2028 (en millions USD)
TABLEAU 792 Marché des antinéoplasiques injectables lyophilisés en Arabie saoudite, par classe de médicaments, 2019-2028 (en millions USD)
TABLEAU 793 Marché des diurétiques injectables lyophilisés en Arabie saoudite, par classe de médicaments, 2019-2028 (en millions USD)
TABLEAU 794 Marché des inhibiteurs de la pompe à protons en Arabie saoudite, par classe de médicaments, 2019-2028 (en millions USD)
TABLEAU 795 Marché des anesthésiques injectables lyophilisés en Arabie saoudite, par classe de médicaments, 2019-2028 (en millions USD)
TABLEAU 796 Marché des anticoagulants injectables lyophilisés en Arabie saoudite, par classe de médicaments, 2019-2028 (en millions USD)
TABLEAU 797 Marché des AINS lyophilisés injectables en Arabie saoudite, par classe de médicaments, 2019-2028 (en millions USD)
TABLEAU 798 Marché des corticostéroïdes injectables lyophilisés en Arabie saoudite, par classe de médicaments, 2019-2028 (en millions USD)
TABLEAU 799 Marché des médicaments injectables lyophilisés en Arabie saoudite, par forme, 2019-2028 (en millions USD)
TABLEAU 800 Marché des médicaments injectables lyophilisés en Arabie saoudite, par indication, 2019-2028 (en millions USD)
TABLEAU 801 Marché des médicaments injectables lyophilisés en Arabie saoudite, par voie d'administration, 2019-2028 (en millions USD)
TABLEAU 802 Marché des médicaments injectables lyophilisés en Arabie saoudite, par utilisateur final, 2019-2028 (en millions USD)
TABLEAU 803 Marché des médicaments injectables lyophilisés en Arabie saoudite, par canal de distribution, 2019-2028 (en millions USD)
TABLEAU 804 Marché des médicaments injectables lyophilisés aux Émirats arabes unis, par conditionnement, 2019-2028 (en millions USD)
TABLEAU 805 Marché des médicaments injectables lyophilisés aux Émirats arabes unis, par classe de médicaments, 2019-2028 (en millions USD)
TABLEAU 806 Marché des médicaments injectables lyophilisés aux Émirats arabes unis, par classe de médicaments, 2019-2028 (unités)
TABLEAU 807 Anti-infectieux sur le marché des médicaments injectables lyophilisés aux Émirats arabes unis, par classe de médicaments, 2019-2028 (en millions USD)
TABLEAU 808 Marché des antibiotiques injectables lyophilisés aux Émirats arabes unis, par classe de médicaments, 2019-2028 (en millions USD)
TABLEAU 809 Marché des antifongiques injectables lyophilisés aux Émirats arabes unis, par classe de médicaments, 2019-2028 (en millions USD)
TABLEAU 810 Marché des antiviraux injectables lyophilisés aux Émirats arabes unis, par classe de médicaments, 2019-2028 (en millions USD)
TABLEAU 811 Marché des antinéoplasiques injectables lyophilisés aux Émirats arabes unis, par classe de médicaments, 2019-2028 (en millions USD)
TABLEAU 812 Marché des diurétiques injectables lyophilisés aux Émirats arabes unis, par classe de médicaments, 2019-2028 (en millions USD)
TABLEAU 813 Marché des inhibiteurs de la pompe à protons sur le marché des médicaments injectables lyophilisés aux Émirats arabes unis, par classe de médicaments, 2019-2028 (en millions USD)
TABLEAU 814 Marché des anesthésiques injectables lyophilisés aux Émirats arabes unis, par classe de médicaments, 2019-2028 (en millions USD)
TABLEAU 815 Marché des anticoagulants injectables lyophilisés aux Émirats arabes unis, par classe de médicaments, 2019-2028 (en millions USD)
TABLEAU 816 Marché des AINS injectables lyophilisés aux Émirats arabes unis, par classe de médicaments, 2019-2028 (en millions USD)
TABLEAU 817 Marché des corticostéroïdes injectables lyophilisés aux Émirats arabes unis, par classe de médicaments, 2019-2028 (en millions USD)
TABLEAU 818 Marché des médicaments injectables lyophilisés aux Émirats arabes unis, par forme, 2019-2028 (en millions USD)
TABLEAU 819 Marché des médicaments injectables lyophilisés aux Émirats arabes unis, par indication, 2019-2028 (en millions USD)
TABLEAU 820 Marché des médicaments injectables lyophilisés aux Émirats arabes unis, par voie d'administration, 2019-2028 (en millions USD)
TABLEAU 821 Marché des médicaments injectables lyophilisés aux Émirats arabes unis, par utilisateur final, 2019-2028 (en millions USD)
TABLEAU 822 Marché des médicaments injectables lyophilisés aux Émirats arabes unis, par canal de distribution, 2019-2028 (en millions USD)
TABLEAU 823 ÉGYPTE Marché des médicaments injectables lyophilisés, par conditionnement, 2019-2028 (en millions USD)
TABLEAU 824 ÉGYPTE Marché des médicaments injectables lyophilisés, par classe de médicaments, 2019-2028 (en millions USD)
TABLEAU 825 ÉGYPTE Marché des médicaments injectables lyophilisés, par classe de médicaments, 2019-2028 (unités)
TABLEAU 826 ÉGYPTE Marché des anti-infectieux injectables lyophilisés, par classe de médicaments, 2019-2028 (en millions USD)
TABLEAU 827 ÉGYPTE Marché des antibiotiques injectables lyophilisés, par classe de médicaments, 2019-2028 (en millions USD)
TABLEAU 828 ÉGYPTE Marché des antifongiques injectables lyophilisés, par classe de médicaments, 2019-2028 (en millions USD)
TABLEAU 829 ÉGYPTE Marché des antiviraux injectables lyophilisés, par classe de médicaments, 2019-2028 (en millions USD)
TABLEAU 830 ÉGYPTE Marché des antinéoplasiques injectables lyophilisés, par classe de médicaments, 2019-2028 (en millions USD)
TABLEAU 831 ÉGYPTE Marché des diurétiques injectables lyophilisés, par classe de médicaments, 2019-2028 (en millions USD)
TABLEAU 832 ÉGYPTE Marché des inhibiteurs de la pompe à protons dans les médicaments injectables lyophilisés, par classe de médicaments, 2019-2028 (en millions USD)
TABLEAU 833 ÉGYPTE Marché des anesthésiques injectables lyophilisés, par classe de médicaments, 2019-2028 (en millions USD)
TABLEAU 834 ÉGYPTE Marché des anticoagulants injectables lyophilisés, par classe de médicaments, 2019-2028 (en millions USD)
TABLEAU 835 ÉGYPTE Marché des AINS injectables lyophilisés, par classe de médicaments, 2019-2028 (en millions USD)
TABLEAU 836 ÉGYPTE Marché des corticostéroïdes injectables lyophilisés, par classe de médicaments, 2019-2028 (en millions USD)
TABLEAU 837 ÉGYPTE Marché des médicaments injectables lyophilisés, par forme, 2019-2028 (en millions USD)
TABLEAU 838 ÉGYPTE Marché des médicaments injectables lyophilisés, par indication, 2019-2028 (en millions USD)
TABLEAU 839 ÉGYPTE Marché des médicaments injectables lyophilisés, par voie d'administration, 2019-2028 (en millions USD)
TABLEAU 840 ÉGYPTE Marché des médicaments injectables lyophilisés, par utilisateur final, 2019-2028 (en millions USD)
TABLEAU 841 ÉGYPTE Marché des médicaments injectables lyophilisés, par canal de distribution, 2019-2028 (en millions USD)
TABLEAU 842 KOWEÏT Marché des médicaments injectables lyophilisés, par conditionnement, 2019-2028 (en millions USD)
TABLEAU 843 Marché des médicaments injectables lyophilisés au KOWEÏT, par classe de médicaments, 2019-2028 (en millions USD)
TABLEAU 844 KOWEÏT Marché des médicaments injectables lyophilisés, par classe de médicaments, 2019-2028 (unités)
TABLEAU 845 KOWEÏT Marché des anti-infectieux injectables lyophilisés, par classe de médicaments, 2019-2028 (en millions USD)
TABLEAU 846 KOWEÏT Marché des antibiotiques injectables lyophilisés, par classe de médicaments, 2019-2028 (en millions USD)
TABLEAU 847 KOWEÏT Marché des antifongiques injectables lyophilisés, par classe de médicaments, 2019-2028 (en millions USD)
TABLEAU 848 KOWEÏT Marché des antiviraux injectables lyophilisés, par classe de médicaments, 2019-2028 (en millions USD)
TABLEAU 849 KOWEÏT Marché des antinéoplasiques injectables lyophilisés, par classe de médicaments, 2019-2028 (en millions USD)
TABLEAU 850 KOWEÏT Marché des diurétiques injectables lyophilisés, par classe de médicaments, 2019-2028 (en millions USD)
TABLEAU 851 KOWEÏT Marché des inhibiteurs de la pompe à protons dans les médicaments injectables lyophilisés, par classe de médicaments, 2019-2028 (en millions USD)
TABLEAU 852 KOWEÏT Marché des anesthésiques injectables lyophilisés, par classe de médicaments, 2019-2028 (en millions USD)
TABLEAU 853 KOWEÏT Marché des anticoagulants injectables lyophilisés, par classe de médicaments, 2019-2028 (en millions USD)
TABLEAU 854 KOWEÏT Marché des AINS injectables lyophilisés, par classe de médicaments, 2019-2028 (en millions USD)
TABLEAU 855 KOWEÏT Marché des corticostéroïdes injectables lyophilisés, par classe de médicaments, 2019-2028 (en millions USD)
TABLEAU 856 Marché des médicaments injectables lyophilisés au Koweït, par forme, 2019-2028 (en millions USD)
TABLEAU 857 Marché des médicaments injectables lyophilisés au Koweït, par indication, 2019-2028 (en millions USD)
TABLEAU 858 Marché des médicaments injectables lyophilisés au KOWEÏT, par voie d'administration, 2019-2028 (en millions USD)
TABLEAU 859 KOWEÏT Marché des médicaments injectables lyophilisés, par utilisateur final, 2019-2028 (en millions USD)
TABLEAU 860 Marché des médicaments injectables lyophilisés au KOWEÏT, par canal de distribution, 2019-2028 (en millions USD)
TABLEAU 861 Marché des médicaments injectables lyophilisés en Israël, par conditionnement, 2019-2028 (en millions USD)
TABLEAU 862 Marché des médicaments injectables lyophilisés en Israël, par classe de médicaments, 2019-2028 (en millions USD)
TABLEAU 863 Marché des médicaments injectables lyophilisés en Israël, par classe de médicaments, 2019-2028 (unités)
TABLEAU 864 Marché israélien des anti-infectieux injectables lyophilisés, par classe de médicaments, 2019-2028 (en millions USD)
TABLEAU 865 Marché des antibiotiques injectables lyophilisés en Israël, par classe de médicaments, 2019-2028 (en millions USD)
TABLEAU 866 Marché israélien des antifongiques injectables lyophilisés, par classe de médicaments, 2019-2028 (en millions USD)
TABLEAU 867 Marché israélien des antiviraux injectables lyophilisés, par classe de médicaments, 2019-2028 (en millions USD)
TABLEAU 868 ISRAËL Marché des antinéoplasiques injectables lyophilisés, par classe de médicaments, 2019-2028 (en millions USD)
TABLEAU 869 ISRAËL Marché des diurétiques injectables lyophilisés, par classe de médicaments, 2019-2028 (en millions USD)
TABLEAU 870 ISRAËL Marché des inhibiteurs de la pompe à protons sur les médicaments injectables lyophilisés, par classe de médicaments, 2019-2028 (en millions USD)
TABLEAU 871 Marché israélien des anesthésiques injectables lyophilisés, par classe de médicaments, 2019-2028 (en millions USD)
TABLEAU 872 Marché israélien des anticoagulants injectables lyophilisés, par classe de médicaments, 2019-2028 (en millions USD)
TABLEAU 873 ISRAËL Marché des AINS injectables lyophilisés, par classe de médicaments, 2019-2028 (en millions USD)
TABLEAU 874 ISRAËL Corticostéroïdes sur le marché des médicaments injectables lyophilisés, par classe de médicaments, 2019-2028 (en millions USD)
TABLEAU 875 Marché des médicaments injectables lyophilisés en Israël, par forme, 2019-2028 (en millions USD)
TABLEAU 876 Marché des médicaments injectables lyophilisés en Israël, par indication, 2019-2028 (en millions USD)
TABLEAU 877 Marché israélien des médicaments injectables lyophilisés, par voie d'administration, 2019-2028 (en millions USD)
TABLEAU 878 Marché des médicaments injectables lyophilisés en Israël, par utilisateur final, 2019-2028 (en millions USD)
TABLEAU 879 Marché des médicaments injectables lyophilisés en Israël, par canal de distribution, 2019-2028 (en millions USD)
TABLEAU 880 RESTE DU MOYEN-ORIENT ET DE L'AFRIQUE Marché des médicaments injectables lyophilisés, par conditionnement, 2019-2028 (en millions USD)
Liste des figures
FIGURE 1 MARCHÉ MONDIAL DES MÉDICAMENTS INJECTABLES LYOPHILISÉS : SEGMENTATION
FIGURE 2 MARCHÉ MONDIAL DES MÉDICAMENTS INJECTABLES LYOPHILISÉS : TRIANGULATION DES DONNÉES
FIGURE 3 Marché mondial des médicaments injectables lyophilisés : ANALYSE DROC
FIGURE 4 Marché mondial des médicaments injectables lyophilisés : ANALYSE DU MARCHÉ MONDIAL ET RÉGIONAL
FIGURE 5 Marché mondial des médicaments injectables lyophilisés : ANALYSE DE RECHERCHE DES ENTREPRISES
FIGURE 6 Marché mondial des médicaments injectables lyophilisés : MODÉLISATION MULTIVARIÉE
FIGURE 7 Marché mondial des médicaments injectables lyophilisés : DÉMOGRAPHIE DES ENTRETIENS
FIGURE 8 MARCHÉ MONDIAL DES MÉDICAMENTS INJECTABLES LYOPHILISÉS : GRILLE DE POSITIONNEMENT DU MARCHÉ DBMR
FIGURE 9 MARCHÉ MONDIAL DES MÉDICAMENTS INJECTABLES LYOPHILISÉS : ANALYSE DES PARTS DE FOURNISSEURS
FIGURE 10 Marché mondial des médicaments injectables lyophilisés : GRILLE DE COUVERTURE DU MARCHÉ par utilisateur final
FIGURE 11 Marché mondial des médicaments injectables lyophilisés : SEGMENTATION
FIGURE 12 L'AMÉRIQUE DU NORD devrait DOMINER LE MARCHÉ MONDIAL DES MÉDICAMENTS INJECTABLES LYOPHILISÉS ET L'ASIE-PACIFIQUE DEVRAIT CROÎTRE AVEC LE TCAC LE PLUS ÉLEVÉ AU COURS DE LA PÉRIODE DE PRÉVISION DE 2021 À 2028
FIGURE 13 L'augmentation des maladies chroniques devrait stimuler le marché mondial des médicaments injectables lyophilisés au cours de la période de prévision de 2021 à 2028
FIGURE 14 Le SEGMENT des flacons devrait représenter la plus grande part du MARCHÉ mondial des MÉDICAMENTS INJECTABLES LYOPHILISÉS en 2021 et 2028
FIGURE 15 L'ASIE-PACIFIQUE est le marché qui connaît la croissance la plus rapide pour les fabricants de médicaments injectables lyophilisés au cours de la période de prévision de 2021 à 2028
FIGURE 16 MOTEURS, CONTRAINTES, OPPORTUNITÉS ET DÉFIS DU MARCHÉ MONDIAL DES MÉDICAMENTS INJECTABLES LYOPHILISÉS
FIGURE 17 Marché mondial des médicaments injectables lyophilisés : par emballage, 2020
FIGURE 18 Marché mondial des médicaments injectables lyophilisés : par conditionnement, 2021-2028 (en millions USD)
FIGURE 19 Marché mondial des médicaments injectables lyophilisés : par emballage, TCAC (2021-2028)
FIGURE 20 Marché mondial des médicaments injectables lyophilisés : par conditionnement, COURBE DE VIE
FIGURE 21 Marché mondial des médicaments injectables lyophilisés : par classe de médicaments, 2020
FIGURE 22 Marché mondial des médicaments injectables lyophilisés : par classe de médicaments, 2021-2028 (en millions de dollars américains)
FIGURE 23 Marché mondial des médicaments injectables lyophilisés : par classe de médicaments, TCAC (2021-2028)
FIGURE 24 Marché mondial des médicaments injectables lyophilisés : par classe de médicaments, COURBE DE VIE
FIGURE 25 Marché mondial des médicaments injectables lyophilisés : par forme, 2020
FIGURE 26 Marché mondial des médicaments injectables lyophilisés : par forme, 2021-2028 (en millions de dollars américains)
FIGURE 27 Marché mondial des médicaments injectables lyophilisés : par forme, TCAC (2021-2028)
FIGURE 28 Marché mondial des médicaments injectables lyophilisés : par forme, COURBE DE VIE
FIGURE 29 Marché mondial des médicaments injectables lyophilisés : par indication, 2020
FIGURE 30 Marché mondial des médicaments injectables lyophilisés : par indication, 2021-2028 (en millions USD)
FIGURE 31 Marché mondial des médicaments injectables lyophilisés : par indication, TCAC (2021-2028)
FIGURE 32 Marché mondial des médicaments injectables lyophilisés : par indication, COURBE DE VIE
FIGURE 33 Marché mondial des médicaments injectables lyophilisés : par voie d'administration, 2020
FIGURE 34 Marché mondial des médicaments injectables lyophilisés : par voie d'administration, 2021-2028 (en millions de dollars américains)
FIGURE 35 Marché mondial des médicaments injectables lyophilisés : par voie d'administration, TCAC (2021-2028)
FIGURE 36 Marché mondial des médicaments injectables lyophilisés : par voie d'administration, COURBE DE VIE
FIGURE 37 Marché mondial des médicaments injectables lyophilisés : par utilisateur final, 2020
FIGURE 38 Marché mondial des médicaments injectables lyophilisés : par utilisateur final, 2021-2028 (en millions USD)
FIGURE 39 Marché mondial des médicaments injectables lyophilisés : par utilisateur final, TCAC (2021-2028)
FIGURE 40 Marché mondial des médicaments injectables lyophilisés : par utilisateur final, COURBE LIFELINE
FIGURE 41 Marché mondial des médicaments injectables lyophilisés : par canal de distribution, 2020
FIGURE 42 Marché mondial des médicaments injectables lyophilisés : par canal de distribution, 2021-2028 (en millions USD)
FIGURE 43 Marché mondial des médicaments injectables lyophilisés : par canal de distribution, TCAC (2021-2028)
FIGURE 44 Marché mondial des médicaments injectables lyophilisés : par canal de distribution, COURBE DE VIE
FIGURE 45 MARCHÉ mondial des médicaments injectables lyophilisés : INSTANTANÉ (2020)
FIGURE 46 MARCHÉ mondial des médicaments injectables lyophilisés : PAR RÉGION (2020)
FIGURE 47 MARCHÉ mondial des médicaments injectables lyophilisés : PAR RÉGION (2021 et 2028)
FIGURE 48 MARCHÉ mondial des médicaments injectables lyophilisés : PAR RÉGION (2020 et 2028)
FIGURE 49 MARCHÉ mondial des médicaments injectables lyophilisés : PAR conditionnement (2021-2028)
FIGURE 50 MARCHÉ des médicaments injectables lyophilisés en Amérique du Nord : INSTANTANÉ (2020)
FIGURE 51 MARCHÉ DES MÉDICAMENTS INJECTABLES LYOPHILISÉS EN AMÉRIQUE DU NORD : PAR PAYS (2020)
FIGURE 52 MARCHÉ DES MÉDICAMENTS INJECTABLES LYOPHILISÉS EN AMÉRIQUE DU NORD : PAR PAYS (2021 ET 2028)
FIGURE 53 MARCHÉ des médicaments injectables lyophilisés en Amérique du Nord : PAR PAYS (2020 et 2028)
FIGURE 54 MARCHÉ des médicaments injectables lyophilisés en Amérique du Nord : PAR conditionnement (2021-2028)
FIGURE 55 MARCHÉ EUROPÉEN DES MÉDICAMENTS INJECTABLES LYOPHILISÉS : INSTANTANÉ (2020)
FIGURE 56 MARCHÉ EUROPÉEN DES MÉDICAMENTS INJECTABLES LYOPHILISÉS : PAR PAYS (2020)
FIGURE 57 MARCHÉ EUROPÉEN DES MÉDICAMENTS INJECTABLES LYOPHILISÉS : PAR PAYS (2021 & 2028)
FIGURE 58 MARCHÉ EUROPÉEN DES MÉDICAMENTS INJECTABLES LYOPHILISÉS : PAR PAYS (2020 et 2028)
FIGURE 59 MARCHÉ EUROPÉEN DES MÉDICAMENTS INJECTABLES LYOPHILISÉS : PAR TYPE (2021-2028)
FIGURE 60 MARCHÉ DES MÉDICAMENTS INJECTABLES LYOPHILISÉS EN ASIE-PACIQUE : INSTANTANÉ (2020)
FIGURE 61 MARCHÉ des médicaments injectables lyophilisés en Asie-Pacifique : PAR PAYS (2020)
FIGURE 62 MARCHÉ des médicaments injectables lyophilisés en Asie-Pacifique : PAR PAYS (2021 et 2028)
FIGURE 63 MARCHÉ des médicaments injectables lyophilisés en Asie-Pacifique : PAR PAYS (2020 et 2028)
FIGURE 64 MARCHÉ des médicaments injectables lyophilisés en Asie-Pacifique : PAR conditionnement (2021-2028)
FIGURE 65 MARCHÉ des médicaments injectables lyophilisés en Amérique du Sud : INSTANTANÉ (2020)
FIGURE 66 MARCHÉ des médicaments injectables lyophilisés en Amérique du Sud : PAR PAYS (2020)
FIGURE 67 MARCHÉ des médicaments injectables lyophilisés en Amérique du Sud : PAR PAYS (2021 et 2028)
FIGURE 68 MARCHÉ des médicaments injectables lyophilisés en Amérique du Sud : PAR PAYS (2020 et 2028)
FIGURE 69 MARCHÉ des médicaments injectables lyophilisés en Amérique du Sud : PAR conditionnement (2021-2028)
FIGURE 70 MOYEN-ORIENT ET AFRIQUE Marché des médicaments injectables lyophilisés : INSTANTANÉ (2020)
FIGURE 71 MOYEN-ORIENT ET AFRIQUE Marché des médicaments injectables lyophilisés : PAR PAYS (2020)
FIGURE 72 MOYEN-ORIENT ET AFRIQUE Marché des médicaments injectables lyophilisés : PAR PAYS (2021 et 2028)
FIGURE 73 MOYEN-ORIENT ET AFRIQUE Marché des médicaments injectables lyophilisés : PAR PAYS (2020 et 2028)
FIGURE 74 MOYEN-ORIENT ET AFRIQUE Marché des médicaments injectables lyophilisés : PAR conditionnement (2021-2028)
FIGURE 75 Marché mondial des médicaments injectables lyophilisés : part des entreprises en 2020 (%)
FIGURE 76 Marché nord-américain des médicaments injectables lyophilisés : part des entreprises en 2020 (%)
FIGURE 77 Marché européen des médicaments injectables lyophilisés : part des entreprises en 2020 (%)
FIGURE 78 Marché des médicaments injectables lyophilisés en Asie-Pacifique : part des entreprises en 2020 (%)
Méthodologie de recherche
La collecte de données et l'analyse de l'année de base sont effectuées à l'aide de modules de collecte de données avec des échantillons de grande taille. L'étape consiste à obtenir des informations sur le marché ou des données connexes via diverses sources et stratégies. Elle comprend l'examen et la planification à l'avance de toutes les données acquises dans le passé. Elle englobe également l'examen des incohérences d'informations observées dans différentes sources d'informations. Les données de marché sont analysées et estimées à l'aide de modèles statistiques et cohérents de marché. De plus, l'analyse des parts de marché et l'analyse des tendances clés sont les principaux facteurs de succès du rapport de marché. Pour en savoir plus, veuillez demander un appel d'analyste ou déposer votre demande.
La méthodologie de recherche clé utilisée par l'équipe de recherche DBMR est la triangulation des données qui implique l'exploration de données, l'analyse de l'impact des variables de données sur le marché et la validation primaire (expert du secteur). Les modèles de données incluent la grille de positionnement des fournisseurs, l'analyse de la chronologie du marché, l'aperçu et le guide du marché, la grille de positionnement des entreprises, l'analyse des brevets, l'analyse des prix, l'analyse des parts de marché des entreprises, les normes de mesure, l'analyse globale par rapport à l'analyse régionale et des parts des fournisseurs. Pour en savoir plus sur la méthodologie de recherche, envoyez une demande pour parler à nos experts du secteur.
Personnalisation disponible
Data Bridge Market Research est un leader de la recherche formative avancée. Nous sommes fiers de fournir à nos clients existants et nouveaux des données et des analyses qui correspondent à leurs objectifs. Le rapport peut être personnalisé pour inclure une analyse des tendances des prix des marques cibles, une compréhension du marché pour d'autres pays (demandez la liste des pays), des données sur les résultats des essais cliniques, une revue de la littérature, une analyse du marché des produits remis à neuf et de la base de produits. L'analyse du marché des concurrents cibles peut être analysée à partir d'une analyse basée sur la technologie jusqu'à des stratégies de portefeuille de marché. Nous pouvons ajouter autant de concurrents que vous le souhaitez, dans le format et le style de données que vous recherchez. Notre équipe d'analystes peut également vous fournir des données sous forme de fichiers Excel bruts, de tableaux croisés dynamiques (Fact book) ou peut vous aider à créer des présentations à partir des ensembles de données disponibles dans le rapport.

