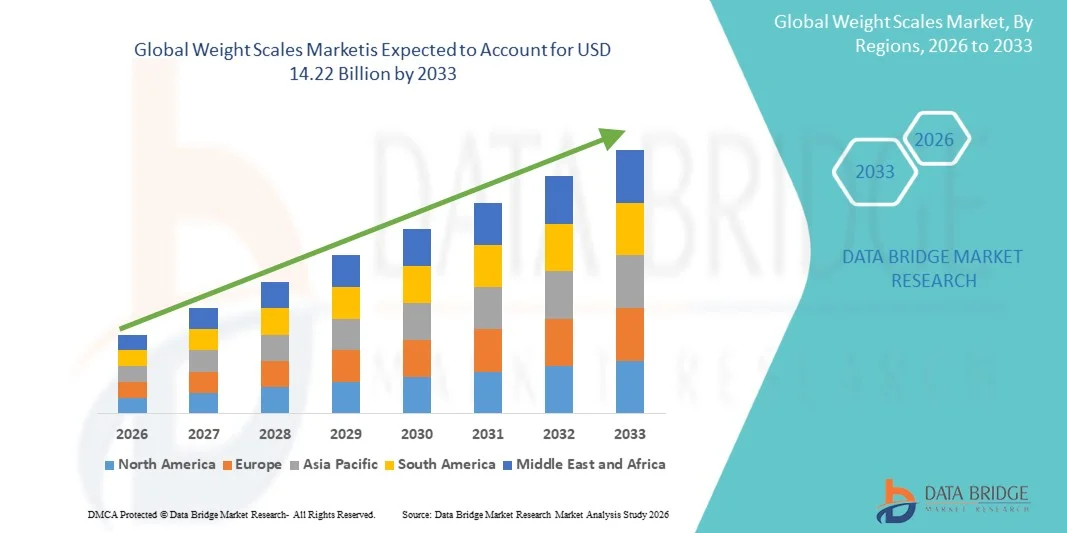
Global Weight Scales Market
Taille du marché en milliards USD
TCAC :
% 
 USD
10.00 Billion
USD
14.22 Billion
2025
2033
USD
10.00 Billion
USD
14.22 Billion
2025
2033
| 2026 –2033 | |
| USD 10.00 Billion | |
| USD 14.22 Billion | |
| % | |
|
Marché mondial des balances de poids, par type (échelles mécaniques et échelles électroniques), application (échelles de laboratoire, échelles de santé, échelles industrielles et échelles vétérinaires), plage de capacité (faible capacité, moyenne capacité et haute capacité), canal de distribution (en ligne et hors ligne)- Tendances et prévisions de l'industrie jusqu'en 2033
Échelles de poidsAperçu du marché
Le marché mondial des balances pondérales a été évalué à10,00 milliards de dollars en 2025et devrait atteindre14,22 milliards de dollars en 2033, croissance à unTCAC de 4,5 % de 2026 à 2033.- Le marché connaît une croissance régulière en raison de la sensibilisation accrue des consommateurs à la santé, de l'adoption croissante d'appareils de pesage numériques et intelligents et de la demande croissante dans les domaines des soins de santé, du commerce de détail, de l'industrie et des laboratoires.
La prévalence croissante de l'obésité et des troubles liés au mode de vie dans le monde, ainsi que les tendances croissantes de la surveillance de la condition physique, encouragent les consommateurs et les fournisseurs de soins de santé à adopter des solutions avancées de surveillance du poids corporel. Les balances numériques et IoT remplacent de plus en plus les appareils analogiques conventionnels en offrant une plus grande précision, une connectivité sans fil, un suivi en temps réel de la santé et une intégration aux applications mobiles de santé. En outre, l'utilisation croissante des systèmes de pesage industriels dans les opérations de logistique, de fabrication, de transformation des aliments et de vente au détail favorise une expansion soutenue du marché.
Principales tendances et perspectives du marché
- L'Amérique du Nord a dominé le marché mondial des balances de poids avec la plus grande part de revenus de 36,12 % en 2025, appuyée par une forte sensibilisation des consommateurs à la santé, une solide infrastructure de soins de santé et l'adoption généralisée de technologies de pesage intelligent.
- Le segment des balances électroniques a dominé le marché avec une part de 63,48 % en 2025, tirée par une plus grande précision, des lectures plus rapides et une intégration croissante aux technologies de surveillance intelligente de la santé.
- On s'attend à ce que l'Asie-Pacifique soit la région qui connaît la croissance la plus rapide avec un TCAC de 6,7 % de 2026 à 2033, alimenté par la hausse des revenus disponibles, l'élargissement de l'accès aux soins de santé et la demande croissante de dispositifs de bien-être des consommateurs en Chine, en Inde et au Japon.
- Les balances mécaniques sont le type qui connaît la croissance la plus rapide et devraient enregistrer un TCAC de 5,0 %, ce qui reflète la demande croissante de solutions de pesage durables, à faible entretien et indépendantes de l'électricité dans les régions en développement et les milieux industriels.
- Le segment des échelles de santé a dominé la catégorie des applications avec une part des revenus de 38,94 % en 2025, sous l'impulsion d'une sensibilisation accrue à la santé, d'une augmentation de la prévalence de l'obésité et de l'adoption croissante de dispositifs de bien-être personnels.
- La capacité moyenne représentait 42,16 % du marché, en raison de l'utilisation étendue des ménages, des magasins de détail, des établissements de soins de santé et des applications commerciales.
- Le segment des balances industrielles est la catégorie d'application qui connaît la croissance la plus rapide, avec un TCAC de 5,4 %, en raison de l'augmentation de la demande dans les secteurs de la logistique, de la fabrication, de la transformation des aliments et des entrepôts.
Taille du marché et prévisions
- Valeur marchande mondiale (2025): 10,00 milliards de dollars
- Valeur marchande prévue (2033) : 14,22 milliards de dollars
- Prévisions CAGR (2026-2033): 4,5%
- Région phare en 2025 : Amérique du Nord
- Région de croissance la plus rapide: Asie Pacifique
Portée du rapport et portée mondialeSegmentation du marché des balances de poids
|
Attributs |
Clé des balances de poidsPerspectives du marché |
|
Segments couverts |
|
|
Pays couverts |
Amérique du Nord · États-Unis · Canada · Mexique Europe · Allemagne · France · Royaume-Uni · Pays-Bas · Suisse · Belgique · Russie · Italie · Espagne · Turquie · Reste de l'Europe Asie-Pacifique · Chine · Japon · Inde · Corée du Sud · Singapour · Malaisie · Australie · Thaïlande · Indonésie · Philippines · Reste de l'Asie-Pacifique Moyen-Orient et Afrique · Arabie saoudite · U.A.E. · Afrique du Sud · Égypte · Israël · Reste du Moyen-Orient et de l'Afrique Amérique du Sud · Brésil · Argentine · Reste de l'Amérique du Sud |
|
Principaux acteurs du marché |
·Société A&D, Limitée(Japon) ·Avery Weigh-Tronix, LLC(États-Unis) ·B-TEK Scales, LLC(États-Unis) ·Cardinal Scale Manufacturing Co. (États-Unis) ·Contech Instruments Ltd. (Inde) · Detecto Scale Company (États-Unis) · Doran Scales, Inc. (États-Unis) · Essae-Teraoka Pvt. Ltd. (Inde) · Fairbanks Scales Inc. (États-Unis) · KERN & SOHN GmbH (Allemagne) · Mettler-Toledo International Inc. (États-Unis) · Systèmes de pesage du lac Rice (États-Unis) · Sartorius AG (Allemagne) · seca gmbh & co. kg. (Allemagne) · Société Shimadzu (Japon) · Tanita Corporation (Japon) · Thermo Fisher Scientific Inc. (États-Unis) · Universal Weighing Machine Co. Pvt. Ltd. (Inde) · ÉCHELLE DE POIDS DE WENSAR LIMITED (Inde) · Adam Equipment Co. Ltd. (Royaume-Uni) |
|
Possibilités de marché |
· L'adoption croissante d'écosystèmes de santé intelligents crée de fortes opportunités pour les balances de poids compatibles avec l'IA et les applications · Développer le commerce électronique et les canaux de distribution directe aux consommateurs · Augmentation de la demande de systèmes de pesage de précision dans les secteurs de la logistique, de la transformation des aliments et des produits pharmaceutiques |
|
Infos sur la valeur ajoutée |
En plus des renseignements sur les scénarios de marché comme la valeur marchande, le taux de croissance, la segmentation, la couverture géographique et les principaux intervenants, les rapports de marché établis par Data Bridge Market Research comprennent également une analyse approfondie des experts, l'épidémiologie des patients, l'analyse des pipelines, l'analyse des prix et le cadre réglementaire. |
Tendances du marché à l'échelle mondiale
Tendance: L'adoption croissante d'échelles de pesage intelligentes et connectées
Les consommateurs adoptent de plus en plus des balances de poids intelligentes intégrées avec Bluetooth, Wi-Fi et applications mobiles de santé pour surveiller le poids corporel, l'IMC, le pourcentage de graisse corporelle et d'autres mesures de fitness en temps réel. L'intégration de l'analyse assistée par l'IA et du suivi de la santé basé sur le cloud permet des perspectives de bien-être personnalisées, une surveillance à distance et une synchronisation transparente avec les écosystèmes de fitness. Les fournisseurs de soins de santé, les gymnases et les centres de bien-être tirent également parti des solutions de pesage connectées pour améliorer les soins préventifs et l'engagement des patients, tandis que les interfaces numériques compactes et les fonctions vocales améliorent la commodité et l'accessibilité des utilisateurs.
Dynamique du marché des balances de poids mondiales
Facteur clé du marché : sensibilisation accrue à la santé et adoption préventive de soins de santé
La prévalence croissante de l'obésité, du diabète et des troubles cardiovasculaires a considérablement accéléré la demande de solutions précises et conviviales de surveillance du poids dans les ménages, les établissements de santé et les centres de conditionnement physique. Les consommateurs sont de plus en plus proactifs en matière de gestion personnelle de la santé, encourageant l'adoption d'échelles numériques et intelligentes capables de suivre plusieurs paramètres de composition corporelle. Les établissements de santé et les programmes de bien-être déploient également des systèmes de pesage perfectionnés dans le cadre d'initiatives de soins de santé préventifs, améliorant la surveillance des patients et appuyant les stratégies de gestion à long terme des maladies.
Principales contraintes et difficultés : sensibilité aux prix et disponibilité des solutions de rechange à faible coût
L'une des principales restrictions sur le marché mondial des balances pondérales est l'intensité de la pression exercée sur les prix par la disponibilité généralisée de dispositifs de pesage à faible coût, en particulier dans les pays en développement. Les fabricants d'échelles intelligentes haut de gamme sont confrontés à des défis dans la différenciation des produits tout en maintenant l'abordabilité, car les consommateurs privilégient souvent le prix par rapport aux capacités de connectivité ou de surveillance sanitaire avancées. En outre, les fluctuations des coûts des composants électroniques, les dépenses d'intégration des logiciels et les exigences d'étalonnage des capteurs augmentent les coûts de production, limitent les marges bénéficiaires et ralentissent l'adoption chez les consommateurs soucieux du budget et les petits utilisateurs commerciaux.
Le lancement en janvier 2024 du dispositif multifonctionnel de surveillance de la santé BeamO de Withings, intégrant la gestion du poids et les capacités de suivi de la santé connectées, souligne l'investissement croissant requis pour les écosystèmes de santé intelligents avancés, reflétant des pressions concurrentielles et tarifaires plus larges sur le marché.
Principales possibilités de marché : expansion des écosystèmes de surveillance de la santé à distance et de mieux-être numérique
L'expansion des services de télésanté et des plates-formes de soins de santé connectées offre une importante opportunité de marché pour les balances de poids intelligentes. Les systèmes de pesage compatibles avec l'IA peuvent soutenir la surveillance à distance des patients, des recommandations de conditionnement physique personnalisées et l'intégration aux dossiers de soins de santé numériques, améliorant la gestion à long terme du bien-être. Le développement de systèmes de pesage commerciaux et industriels basés sur l'IoT, ainsi que l'adoption croissante de dispositifs de mieux-être reliés au cloud, élargissent les possibilités dans les secteurs des soins de santé, de la condition physique, de la logistique et du commerce de détail, en particulier dans les marchés de la numérisation rapide en Asie-Pacifique, en Amérique latine et au Moyen-Orient.
Échelles de poids mondiales Portée du marché
Le marché des balances de poids est segmenté en fonction du type, de l'application, de la gamme de capacités et du canal de distribution.
- Par type
Sur la base du type, le marché mondial des balances pondérales est segmenté en balances mécaniques et électroniques. Le segment des balances électroniques a dominé le marché avec une part de 63,48 % en 2025, en raison d'une plus grande précision, de lectures plus rapides et d'une intégration croissante aux technologies de surveillance de la santé intelligente. Ces échelles sont largement adoptées dans les établissements de santé, les laboratoires, les magasins de détail et les ménages en raison de leurs affichages numériques et de leur facilité d'exploitation. La préférence croissante des consommateurs pour les appareils connectés dotés de fonctionnalités Bluetooth et Wi-Fi renforce encore la demande. Les balances électroniques soutiennent également l'analyse de la composition corporelle avancée, permettant aux utilisateurs de surveiller l'IMC, le pourcentage de matières grasses et les niveaux d'hydratation. Les améliorations continues de la technologie des capteurs et de la conception de produits compacts augmentent leur facilité d'utilisation dans les applications commerciales et personnelles. Leur précision et leur compatibilité supérieures avec les écosystèmes numériques continuent de soutenir la domination du marché mondial.
Le segment des balances mécaniques devrait enregistrer la croissance la plus rapide à un TCAC de 5,0 % entre 2026 et 2033, en raison de l'augmentation de la demande de solutions de pesage durables, à faible entretien et indépendantes de l'électricité dans les régions en développement et les environnements industriels. Ces échelles sont largement préférées dans les centres de santé ruraux, les points de vente traditionnels et les applications commerciales lourdes où la fiabilité et la longue durée de vie opérationnelle sont essentielles. Les systèmes mécaniques offrent des avantages en termes de coûts et continuent de fonctionner efficacement dans des conditions environnementales difficiles sans dépendre des batteries ou de l'infrastructure numérique. L'adoption croissante dans les cliniques vétérinaires, les exploitations agricoles et les marchés locaux appuie l'expansion du segment. Les fabricants introduisent également des conceptions améliorées avec une meilleure lisibilité et des capacités de charge plus élevées. Leur accessibilité, leur durabilité et leur facilité d'utilisation continuent de créer des possibilités de croissance constante sur tous les marchés sensibles aux prix à l'échelle mondiale.
- Par demande
Sur la base de l'application, le marché mondial des balances de poids est segmenté en balances de laboratoire, balances de santé, balances industrielles et balances vétérinaires. Le segment Health Scales a dominé le marché avec une part de 38,94 % en 2025, en raison de l'augmentation de la conscience de la santé, de l'augmentation de la prévalence de l'obésité et de l'adoption croissante de dispositifs de bien-être personnels. Les consommateurs utilisent de plus en plus les échelles numériques de poids corporel pour la surveillance quotidienne de la condition physique et la gestion préventive des soins de santé. Les fournisseurs de soins de santé et les centres de conditionnement physique déploient également des échelles de santé avancées pour les programmes d'évaluation et de suivi du bien-être des patients. L'intégration croissante aux applications mobiles de la santé et aux écosystèmes portables accroît encore la demande de produits. Ce segment bénéficie d'une sensibilisation accrue à la prévention des maladies chroniques et à la gestion d'un mode de vie sain. L'innovation continue dans les fonctions de surveillance intelligente de la santé favorise l'adoption généralisée dans les marchés développés et émergents.
Le segment des balances industrielles devrait connaître la croissance la plus rapide à un TCAC de 5,4 % de 2026 à 2033, en raison de l'augmentation de la demande dans les secteurs de la logistique, de la fabrication, de la transformation des aliments et de l'entreposage. Des systèmes de pesage industriels sont de plus en plus adoptés pour améliorer la précision opérationnelle, la gestion des stocks et l'automatisation des processus. L'industrialisation rapide et la croissance des activités commerciales mondiales favorisent considérablement le déploiement d'équipements de pesage de précision. L'intégration de systèmes de surveillance compatibles avec l'IoT et de technologies numériques d'étalonnage améliore l'efficacité et réduit les erreurs opérationnelles. L'augmentation des investissements dans les installations de production automatisée et les infrastructures intelligentes de la chaîne d'approvisionnement accélère l'adoption. L'augmentation des exigences réglementaires liées à la qualité des produits et à l'exactitude des mesures renforce également la croissance à long terme du marché.
- Par gamme de capacités
Sur la base de la fourchette des capacités, le marché mondial des balances de pondération est segmenté en faible capacité, moyenne capacité et haute capacité. Le segment des capacités moyennes a dominé le marché avec une part de 42,16 % en 2025, en raison de son utilisation étendue dans les ménages, les magasins de détail, les établissements de soins de santé et les applications commerciales. Ces échelles offrent un équilibre optimal entre la plage de pesage, l'accessibilité et la flexibilité opérationnelle, ce qui les rend adaptés à un large éventail d'utilisateurs finaux. La demande croissante d'appareils multifonctionnels de pesage dans le domaine de la surveillance de la condition physique et du commerce favorise la croissance du segment. Les systèmes à capacité moyenne sont également largement utilisés dans les laboratoires et les services alimentaires où la précision de charge modérée est essentielle. Les progrès dans les technologies d'affichage numérique et la précision des capteurs améliorent la fiabilité et la commodité des utilisateurs. Leur capacité d'adaptation à la fois pour les consommateurs et pour les professionnels continue de maintenir un leadership segmentaire à l'échelle mondiale.
Le segment de la haute capacité devrait enregistrer la croissance la plus rapide à un TCAC de 5,6 % de 2026 à 2033, en raison de l'augmentation de la demande de l'industrie manufacturière, de la logistique, des transports et des activités commerciales de poids lourds. Ces balances sont de plus en plus utilisées pour la manutention de matériaux en vrac, la gestion du fret et l'automatisation des entrepôts. Le développement de l'infrastructure et les activités d'expansion industrielle augmentent considérablement la nécessité de systèmes de pesage à haute charge précis. L'intégration de capteurs intelligents, de la surveillance sans fil et des fonctions d'étalonnage automatisées améliore l'efficacité opérationnelle et la sécurité. Les investissements croissants dans les usines intelligentes et la numérisation industrielle favorisent davantage l'adoption. Une attention accrue accordée à la conformité commerciale et à la précision des mesures industrielles contribue également à l'expansion soutenue du marché.
- Par canal de distribution
Sur la base du canal de distribution, le marché mondial des balances de poids est segmenté en ligne et hors ligne. Le segment Offline a dominé le marché avec une part de 57,26 % en 2025, en raison de la forte préférence des consommateurs pour l'inspection physique des produits, les démonstrations en magasin et la disponibilité immédiate des produits. Les magasins de détail, les distributeurs d'équipement de santé et les points de vente d'électronique spécialisée continuent de jouer un rôle important dans les ventes de produits dans les catégories de consommateurs et de commerce. Les clients préfèrent souvent des achats hors ligne pour des équipements de pesage industriels et de santé de grande valeur qui nécessitent une consultation technique et un soutien après-vente. Les réseaux de détail établis et les concessionnaires autorisés par la marque contribuent également à accroître la confiance des consommateurs et la fiabilité des produits. Les chaînes hors ligne demeurent particulièrement importantes dans les pays en développement où la pénétration des achats numériques continue d'évoluer. Des relations de distribution et une infrastructure de services solides continuent de soutenir le leadership de ce segment du marché.
Le segment en ligne devrait connaître la croissance la plus rapide à un TCAC de 6,1 %, de 2026 à 2033, en raison de l'expansion rapide des plateformes de commerce électronique et de la préférence croissante des consommateurs pour des expériences d'achats numériques pratiques. Les canaux en ligne permettent d'accéder à des choix de produits plus larges, à des prix compétitifs, à des avis clients et à des services de livraison en porte. La pénétration croissante du smartphone et l'adoption du paiement numérique accélèrent considérablement le comportement d'achat en ligne à l'échelle mondiale. Les fabricants tirent de plus en plus parti des stratégies directes aux consommateurs et des campagnes de marketing numérique pour élargir la portée du marché. Les écosystèmes de bien-être basés sur l'abonnement et les produits de pesage reliés à l'application gagnent également en traction grâce aux plateformes en ligne. L'influence croissante des marchés du commerce électronique et des stratégies de vente au détail omnicanal continue de créer d'importantes possibilités de croissance à long terme pour ce segment.
Analyse régionale des balances de poids mondiales
L'Amérique du Nord a dominé le marché mondial des balances de poids avec la plus grande part de revenus de 36,12 % en 2025, appuyée par une forte sensibilisation des consommateurs à la santé, une solide infrastructure de soins de santé et l'adoption généralisée de technologies de pesage intelligent. La région bénéficie également de l'augmentation de la prévalence de l'obésité et des troubles liés au mode de vie, de la forte pénétration des appareils de conditionnement physique connectés et de la forte demande de systèmes de pesage de précision dans les domaines des soins de santé, du commerce de détail et des applications industrielles. L'intégration croissante des plateformes de surveillance de la santé grâce à l'IoT et l'utilisation croissante des analyseurs de composition corporelle intelligente dans les ménages, les gymnases et les installations médicales continuent de renforcer la position de leader nord-américain sur le marché mondial.
Échelles de poids américaines Aperçu du marché
Le marché américain des balances de poids connaît une forte croissance en raison de la sensibilisation accrue à la santé, de l'adoption croissante de dispositifs de conditionnement physique intelligents et de la demande croissante de solutions de surveillance de la santé connectées. L'infrastructure de soins de santé avancée du pays, la prévalence élevée de l'obésité et des troubles liés au mode de vie, et l'utilisation généralisée des technologies numériques de bien-être stimulent la demande dans les applications domestiques, médicales, commerciales et industrielles. De plus, l'intégration croissante de l'analyse assistée par l'IA, des systèmes de pesage Bluetooth et des applications mobiles de santé accélère l'adoption parmi les consommateurs, les fournisseurs de soins de santé et les centres de conditionnement physique.
Europe Balances de poids Aperçu du marché
Le marché européen des balances pondérales continue de contribuer de manière importante aux recettes mondiales, sous l'impulsion de solides normes de santé, d'innovation technologique et d'une plus grande attention à la gestion préventive du bien-être. L'adoption généralisée de systèmes de pesage numériques et intelligents dans les hôpitaux, les laboratoires, les magasins de détail et les installations de conditionnement physique favorise l'expansion du marché dans toute la région. L'augmentation des investissements dans les technologies de santé connectées, associée à des réglementations strictes en matière de qualité des produits et à une sensibilisation accrue des consommateurs aux modes de vie sains, continue de renforcer l'adoption d'échelles de poids avancées dans toute l'Europe.
U.K. Balances de poids Aperçu du marché
Le marché des balances de poids du Royaume-Uni connaît une croissance constante, soutenue par une concentration croissante des consommateurs sur le suivi de la condition physique, les soins de santé préventifs et les technologies de bien-être connectées. L'adoption croissante d'analyseurs de composition corporelle intelligente et de systèmes de pesage numérique dans les ménages, les gymnases et les établissements de soins contribue à l'expansion du marché. De plus, l'intégration des applications mobiles, des plateformes de surveillance de la santé basées sur le cloud et de l'analyse de la condition physique axée sur l'IA améliore l'expérience utilisateur et l'efficacité opérationnelle, plaçant le Royaume-Uni comme un important marché d'innovation dans l'industrie des balances de poids.
Allemagne Balances de poids Aperçu du marché
Le marché allemand des balances pondérales ne cesse de croître en raison des fortes capacités de fabrication du pays, des infrastructures de soins de santé avancées et de l'adoption croissante de technologies de mesure de précision. Les établissements de santé, les fabricants industriels et les détaillants utilisent de plus en plus des systèmes de pesage perfectionnés pour la surveillance, le contrôle de la qualité et l'efficacité opérationnelle. Les progrès continus de la technologie des capteurs numériques, des plates-formes de pesage compatibles avec l'IoT et des systèmes d'automatisation industrielle, ainsi que l'accent mis sur la précision des produits et les normes de sécurité, stimulent la croissance du marché en Allemagne.
Aperçu du marché des balances de poids Asie-Pacifique
Le marché des balances pondérales Asie-Pacifique devrait connaître une croissance rapide, stimulée par l'urbanisation croissante, l'augmentation des revenus disponibles et l'expansion des infrastructures de soins de santé dans des pays comme la Chine, l'Inde et le Japon. Une sensibilisation accrue à la gestion de l'obésité, aux soins de santé préventifs et au contrôle de la condition physique favorise l'expansion du marché régional. En outre, l'adoption croissante de technologies de pesage intelligente, la croissance rapide des plateformes de commerce électronique et l'expansion des secteurs industriel et logistique accélèrent la demande d'échelles de poids pour les applications tant commerciales que de consommation.
Japon Balances de poids Aperçu du marché
Le marché japonais des balances pondérales connaît une croissance constante en raison de l'augmentation des investissements dans la technologie de la santé, de l'adoption croissante de dispositifs de bien-être intelligents et de la forte concentration des consommateurs sur une vie saine. Les fournisseurs de soins de santé, les centres de conditionnement physique et les ménages adoptent de plus en plus des systèmes de pesage numériques et connectés pour l'analyse de la composition corporelle et la surveillance de la santé à long terme. De plus, l'intégration croissante des plateformes de santé compatibles avec l'IoT et l'accent mis sur les technologies de précision et les solutions de soins de santé préventifs contribuent davantage à la croissance du marché.
Chine Balances de poids Aperçu du marché
Le marché chinois des balances pondérales augmente rapidement, en raison de l'urbanisation croissante, de l'élargissement de l'accès aux soins de santé et de la demande croissante des consommateurs pour des dispositifs de surveillance de la santé numériques abordables. L'adoption croissante de systèmes de pesage intelligents et compatibles avec l'IA dans les domaines des soins de santé, de la vente au détail, de la logistique et des applications domestiques stimule considérablement la demande du marché. De plus, l'augmentation des investissements dans l'automatisation manufacturière, la sensibilisation accrue à la condition physique et au bien-être et les progrès technologiques continus placent la Chine comme l'un des marchés les plus dynamiques pour les balances de poids à l'échelle mondiale.
Part de marché des balances de poids mondiales
L'industrie des balances de poids est principalement dirigée par des entreprises bien établies, notamment :
- Société A&D, limitée (Japon)
- Avery Weigh-Tronix, LLC (États-Unis)
- B-TEK Scales, LLC (États-Unis)
- Cardinal Scale Manufacturing Co. (États-Unis)
- Contech Instruments Ltd. (Inde)
- Detecto Scale Company (États-Unis)
- Doran Scales, Inc. (États-Unis)
- Essae-Teraoka Pvt. Ltd. (Inde)
- Fairbanks Scales Inc. (États-Unis)
- KERN & SOHN GmbH (Allemagne)
- Mettler-Toledo International Inc. (États-Unis)
- Systèmes de pesage du lac Rice (États-Unis)
- Sartorius AG (Allemagne)
- (Allemagne)
- Shimadzu Corporation (Japon)
- Tanita Corporation (Japon)
- Thermo Fisher Scientific Inc. (États-Unis)
- Universal Weighing Machine Co. Pvt. Ltd. (Inde)
- ÉCHELLE DE POIDS DE WENSAR LIMITED (Inde)
- Société canadienne d'hypothèques et de logement
Les derniers développements du marché mondial des balances de poids
- En janvier 2026, Withings a dévoilé l'échelle intelligente Body Scan 2 au CES 2026, avec une surveillance cardiovasculaire avancée, des notifications de risque d'hypertension et plus de 60 mesures biomarqueurs pour l'analyse préventive de la santé. La nouvelle échelle intègre des technologies de cardiographie d'impédance et de spectroscopie de bioimpédance pour fournir des informations métaboliques et cardiovasculaires plus profondes. Ce lancement reflète la tendance croissante vers des systèmes multifonctionnels de pesage à l'IA capables de soutenir le bien-être à long terme et la surveillance des soins de santé à distance
- En janvier 2025, Withings a annoncé le lancement de son dispositif de surveillance de la santé connecté BPM Vision au CES 2025, en élargissant son écosystème de santé intelligent qui s'intègre aux plateformes de pesage et de composition corporelle connectées. L'appareil offre une surveillance clinique, une connectivité Wi-Fi et des capacités de suivi de la santé multi-utilisateurs, reflétant la convergence croissante des échelles intelligentes avec les écosystèmes de santé numériques. Le développement met en évidence la demande croissante des consommateurs de technologies intégrées de surveillance de la santé à domicile et de solutions personnalisées de gestion du bien-être
- En octobre 2025, Withings a introduit ses appareils d'analyse de santé connectés U-Scan Nutrio et U-Scan Calci, conçus pour s'intégrer à l'écosystème de santé intelligent plus large de l'entreprise, qui comprend des balances de pesage et des plateformes de bien-être connectées. Les appareils fournissent une surveillance biochimique de l'hydratation, des cétones et des niveaux de calcium tout en synchronisant avec l'application mobile Withings. Le développement démontre l'expansion croissante des écosystèmes de santé connectés centrés sur le bien-être numérique et les technologies de surveillance corporelle
- En mars 2024, Seca a élargi sa ligne de mise à l'échelle validée par l'EMR avec des échelles plates avancées avec des capacités d'intégration ID-DisplayTM et de dossiers médicaux électroniques directs. Les systèmes de pesée ont été conçus pour améliorer la précision de l'identification des patients, l'efficacité des processus et les normes d'hygiène dans les milieux de santé. Le développement met en évidence l'adoption croissante de technologies de pesage connectées dans les hôpitaux et les établissements de santé à la recherche de solutions d'intégration numérique et de surveillance de précision des patients
- En juin 2023, Seca a continué d'élargir son portefeuille de systèmes de pesage médicaux numériques et mécaniques, y compris des analyseurs de composition corporelle de pointe et des balances connectées EMR pour les applications de soins de santé. La société a mis l'accent sur les technologies de mesure de précision, la transmission de données sans fil et l'intégration avec l'infrastructure de soins de santé numériques pour soutenir les soins de santé préventifs et le diagnostic clinique. Cette expansion reflète la demande croissante de solutions de pesée médicale connectée dans les hôpitaux, les cliniques et les centres de bien-être à l'échelle mondiale
SKU-
Accédez en ligne au rapport sur le premier cloud mondial de veille économique

- Tableau de bord d'analyse de données interactif
- Tableau de bord d'analyse d'entreprise pour les opportunités à fort potentiel de croissance
- Accès d'analyste de recherche pour la personnalisation et les requêtes
- Analyse de la concurrence avec tableau de bord interactif
- Dernières actualités, mises à jour et analyse des tendances
- Exploitez la puissance de l'analyse comparative pour un suivi complet de la concurrence
Table des matières
1. INTRODUCTION
1.1 OBJECTIFS DE L'ÉTUDE
1.2 DÉFINITION DU MARCHÉ
1.3 APERÇU DU MARCHÉ MONDIAL DES BALANCES DE POIDS
1.4 MONNAIE ET TARIFS
1.5 LIMITATION
1.6 MARCHÉS COUVERTS
2. SEGMENTATION DU MARCHÉ
2.1 POINTS CLÉS À RETENIR
2.2 ATTEINDRE LA TAILLE DU MARCHÉ MONDIAL DES BALANCES DE POIDS
2.3 GRILLE DE POSITIONNEMENT DES FOURNISSEURS
2.4 MARCHÉS COUVERTS
2.5 PORTÉE GÉOGRAPHIQUE
2,6 ANS CONSIDÉRÉS POUR L'ÉTUDE
2.7 MÉTHODOLOGIE DE RECHERCHE
2.8 COURBE DE LA LIGNE DE VIE TECHNOLOGIQUE
2.9 MODÉLISATION MULTIVARIÉE
2.10 ENTRETIENS PRIMAIRES AVEC DES LEADERS D'OPINION CLÉS
2.11 GRILLE DE POSITIONNEMENT DU MARCHÉ DBMR
2.12 GRILLE DE COUVERTURE DES APPLICATIONS DU MARCHÉ
2.13 MATRICE DES DÉFIS DU MARCHÉ DBMR
2.14 SOURCES SECONDAIRES
2.15 MARCHÉ MONDIAL DES BALANCES DE POIDS : APERÇU DE LA RECHERCHE
2.16 HYPOTHÈSES
3. APERÇU DU MARCHÉ
3.1 PILOTES
3.2 RESTRICTIONS
3.3 OPPORTUNITÉS
3.4 DÉFIS
4. RÉSUMÉ EXÉCUTIF
5. INFORMATIONS PREMIUM
5.1 COMPORTEMENT D'ACHAT DES CONSOMMATEURS
5.2 FACTEURS AFFECTANT LA DÉCISION D'ACHAT
5.3 SCÉNARIO D'ADOPTION DU PRODUIT
5.4 LES CINQ FORCES DE PORTER
5.5 COUVERTURE RÉGLEMENTAIRE
5.6 ANALYSE DE L'APPROVISIONNEMENT EN MATIÈRES PREMIÈRES
5.7 SCÉNARIO D'IMPORTATION-EXPORTATION
6. PERSPECTIVES DE CAPACITÉ DE PRODUCTION
7. ANALYSE DES PRIX
8. PERSPECTIVES DE LA MARQUE
8.1 ANALYSE COMPARATIVE DES MARQUES
8.2 APERÇU PRODUIT VS MARQUE
9. IMPACT DU RALENTISSEMENT ÉCONOMIQUE
9.1 IMPACT SUR LES PRIX
9.2 IMPACT SUR LA CHAÎNE D'APPROVISIONNEMENT
9.3 IMPACT SUR L'EXPÉDITION
9.4 IMPACT SUR LA DEMANDE
9.5 IMPACT SUR LES DÉCISIONS STRATÉGIQUES
10. MARCHÉ MONDIAL DES BALANCES DE POIDS, PAR PRODUIT, 2021-2030 (EN MILLIONS USD) (UNITÉS)
REMARQUE - LA VALEUR MARCHANDE, LE VOLUME DU MARCHÉ ET LE PRIX DE VENTE MOYEN SERONT FOURNIS POUR CHAQUE PRODUIT
10.1 APERÇU
10.2 ÉCHELLE MÉDICALE
10.2.1 ÉCHELLE MÉDICALE, PAR TYPE
10.2.1.1. PÈSE-PERSONNEL
10.2.1.1.1. BALANCE AU SOL
10.2.1.1.1.1 ÉCHELLE DE GRAISSE CORPORELLE
10.2.1.1.1.1.1. ASP (USD)
10.2.1.1.1.1.2. VALEUR MARCHANDE (EN MILLIONS USD)
10.2.1.1.1.1.3. VOLUME DU MARCHÉ (UNITÉS)
10.2.1.1.1.2 BALANCE DE POIDS CORPOREL
10.2.1.1.1.3 AVEC ÉCHELLE DE FONCTION IMC
10.2.1.1.1.4 AVEC ÉCHELLE DE PLAGE D'OBÉSITÉ
10.2.1.1.1.5 AUTRES
10.2.1.1.2. ÉCHELLE À COLONNES
10.2.1.1.2.1 AVEC FONCTION IMC
10.2.1.1.2.2 SANS FONCTION IMC
10.2.1.1.3. ÉCHELLE À MAIN COURANTE STABLE
10.2.1.1.4. AUTRES
10.2.1.2. PÈSE-BÉBÉ
10.2.1.3. CHAISES-PESÉES
10.2.1.4. PLATEFORME DE PESÉE POUR CHARIOTS ROULANTS
10.2.1.5. PÈSE-LIT
10.2.1.6. ÉCHELLES PÉDIATRIQUES
10.2.1.7. AUTRES
10.2.2 ÉCHELLE MÉDICALE, PAR CATÉGORIE DE PRODUITS
10.2.2.1. BALANCES NUMÉRIQUES
10.2.2.2. BALANCES INTELLIGENTES
10.2.2.3. BALANCES ANALOGIQUES
10.2.2.4. BALANCES HYBRIDES
10.2.3 ÉCHELLE MÉDICALE, PAR TYPE D'ÉCHELLE
10.2.3.1. BALANCES ÉLECTRONIQUES
10.2.3.2. BALANCES MÉCANIQUES
10.2.4 ÉCHELLE MÉDICALE, PAR MODALITÉ
10.2.4.1. BALANCE DE TABLE / AUTONOME
10.2.4.2. BALANCE PORTABLE
10.2.4.3. ÉCHELLE DE PLATEFORME
10.2.4.4. AUTRES
10.3 ÉCHELLE DE LABORATOIRE
10.3.1 BALANCE DE LABORATOIRE, PAR TYPE DE BALANCE
10.3.1.1. BALANCE ANALYTIQUE
10.3.1.2. ÉQUILIBRE COMPACT
10.3.1.3. BALANCE DE PRÉCISION
10.3.1.4. MICROBALANCES
10.3.1.5. AUTRES
10.3.2 ÉCHELLE DE LABORATOIRE, PAR CATÉGORIE DE PRODUITS
10.3.2.1. BALANCES NUMÉRIQUES
10.3.2.2. BALANCES INTELLIGENTES
10.3.2.3. BALANCES ANALOGIQUES
10.3.2.4. BALANCES HYBRIDES
10.3.3 ÉCHELLE DE LABORATOIRE, PAR TYPE D'ÉCHELLE
10.3.3.1. BALANCES ÉLECTRONIQUES
10.3.3.2. BALANCES MÉCANIQUES
10.3.4 ÉCHELLE DE LABORATOIRE, PAR MODALITÉ
10.3.4.1. BALANCE DE TABLE / AUTONOME
10.3.4.2. BALANCE PORTABLE
10.3.4.3. ÉCHELLE DE PLATEFORME
10.3.4.4. AUTRES
10.4 ÉCHELLE INDUSTRIELLE
10.4.1 ÉCHELLE INDUSTRIELLE, PAR TYPE
10.4.1.1. BALANCES DE COMPTOIR
10.4.1.2. BALANCES AU SOL
10.4.1.3. PÈSE-PALETTES
10.4.1.4. BALANCES À PLATE-FORME
10.4.1.5. BASCULES DE RÉSERVOIR ET DE TRÉMIE
10.4.1.6. BASCULES POUR CHEMIN DE FER ET CAMIONS
10.4.1.7. PESEURS À GRUE
10.4.1.8. BALANCES DE COMPTAGE
10.4.1.9. BASCULES À BANDE TRANSPORTEUSE
10.4.1.10. TRANSPALETTES BASCULANTES
10.4.1.11. AUTRES
10.4.2 ÉCHELLE INDUSTRIELLE, PAR CATÉGORIE DE PRODUITS
10.4.2.1. BALANCES NUMÉRIQUES
10.4.2.2. BALANCES INTELLIGENTES
10.4.2.3. BALANCES ANALOGIQUES
10.4.2.4. BALANCES HYBRIDES
10.4.3 ÉCHELLE INDUSTRIELLE, PAR TYPE DE BALANCE
10.4.3.1. BALANCES ÉLECTRONIQUES
10.4.3.2. BALANCES MÉCANIQUES
10.4.4 ÉCHELLE INDUSTRIELLE, PAR MODALITÉ
10.4.4.1. BALANCE DE TABLE / AUTONOME
10.4.4.2. BALANCE PORTABLE
10.4.4.3. ÉCHELLE DE PLATEFORME
10.4.4.4. AUTRES
11. MARCHÉ MONDIAL DES BALANCES, PAR TYPE, 2021-2030 (EN MILLIONS USD)
11.1 APERÇU
11.2 BALANCES ÉLECTRONIQUES
11.2.1 BALANCES ÉLECTRONIQUES, PAR MODALITÉ
11.2.1.1. BALANCE DE TABLE / AUTONOME
11.2.1.2. BALANCE PORTABLE
11.2.1.3. ÉCHELLE DE PLATEFORME
11.2.1.4. AUTRES
11.3 BALANCES MÉCANIQUES
11.3.1 BALANCES MÉCANIQUES, PAR MODALITÉ
11.3.1.1. BALANCE DE TABLE / AUTONOME
11.3.1.2. BALANCE PORTABLE
11.3.1.3. ÉCHELLE DE PLATEFORME
11.3.1.4. AUTRES
12. MARCHÉ MONDIAL DES BALANCES, PAR CATÉGORIE DE PRODUITS, 2021-2030 (EN MILLIONS USD)
12.1 APERÇU
12.2 BALANCES NUMÉRIQUES
12.2.1 BALANCES NUMÉRIQUES, PAR MODALITÉ
12.2.1.1. BALANCE DE TABLE / AUTONOME
12.2.1.2. BALANCE PORTABLE
12.2.1.3. ÉCHELLE DE PLATEFORME
12.2.1.4. AUTRES
12.3 BALANCE DE POIDS INTELLIGENTE
12.3.1 BALANCES DE POIDS INTELLIGENTES, PAR MODALITÉ
12.3.1.1. BALANCE DE TABLE / AUTONOME
12.3.1.2. BALANCE PORTABLE
12.3.1.3. ÉCHELLE DE PLATEFORME
12.3.1.4. AUTRES
12.4 BALANCES DE POIDS ANALOGIQUES
12.4.1 BALANCES DE POIDS ANALOGIQUES, PAR MODALITÉ
12.4.1.1. BALANCE DE TABLE / AUTONOME
12.4.1.2. BALANCE PORTABLE
12.4.1.3. PLATEFORME ÉCHELLE
12.4.1.4. AUTRES
Balance hybride 12,5
12.5.1 BALANCES DE POIDS HYBRIDES, PAR MODALITÉ
12.5.1.1. BALANCE DE TABLE / AUTONOME
12.5.1.2. BALANCE PORTABLE
12.5.1.3. ÉCHELLE DE PLATEFORME
12.5.1.4. AUTRES
13. MARCHÉ MONDIAL DES BALANCES DE POIDS, PAR MODALITÉ, 2021-2030, (EN MILLIONS USD)
13.1 APERÇU
13.2 PLATEAU DE TABLE / AUTONOME
13.2.1 TABLE TOP / AUTONOME, PAR PRODUIT
13.2.1.1. ÉCHELLE MÉDICALE
13.2.1.2. ÉCHELLE DE LABORATOIRE
13.2.1.3. ÉCHELLE INDUSTRIELLE
13.3 PORTABLE
13.3.1 PORTABLE, PAR PRODUIT
13.3.1.1. ÉCHELLE MÉDICALE
13.3.1.2. ÉCHELLE DE LABORATOIRE
13.3.1.3. ÉCHELLE INDUSTRIELLE
13.4 BASÉ SUR LA PLATEFORME
13.4.1 BASÉ SUR LA PLATEFORME, PAR PRODUIT
13.4.1.1. ÉCHELLE MÉDICALE
13.4.1.2. ÉCHELLE DE LABORATOIRE
13.4.1.3. ÉCHELLE INDUSTRIELLE
13,5 AUTRES
13.5.1 AUTRES, PAR PRODUIT
13.5.1.1. ÉCHELLE MÉDICALE
13.5.1.2. ÉCHELLE DE LABORATOIRE
13.5.1.3. ÉCHELLE INDUSTRIELLE
14. MARCHÉ MONDIAL DES BALANCES DE POIDS, PAR CATÉGORIE DE BALANCES, 2021-2030 (EN MILLIONS USD)
14.1 APERÇU
14.2 CLASSE I
14.3 CLASSE II
14.4 CLASSE III
14.5 CLASSE IIIL
14.6 CLASSE IIII
15. MARCHÉ MONDIAL DES BALANCES DE POIDS, PAR UTILISATION FINALE, 2021-2030, (EN MILLIONS USD)
15.1 APERÇU
15.2 CONDITIONNEMENT PHYSIQUE ET SPORTS
15.2.1 SALLES DE SPORT ET SPA
15.2.2 CENTRES DE FITNESS
15.2.3 ACADÉMIE DU SPORT
15.2.4 AUTRES
15.3 AGRICULTURE
15.4 LOGISTIQUE ET TRANSPORT
15.5 ALIMENTS ET BOISSONS
15.6 SOINS DE SANTÉ
15.6.1 HÔPITAUX
15.6.2 CLINIQUES
15.6.3 INSTITUTS DE RECHERCHE ET UNIVERSITAIRES
15.6.4 LABORATOIRES
15.6.5 AUTRES
15.7 SOINS PERSONNELS / À DOMICILE
15.8 AUTRES
16. MARCHÉ MONDIAL DES BALANCES, PAR CANAL DE DISTRIBUTION, 2021-2030 (EN MILLIONS USD)
16.1 APERÇU
16.2 VENTES DIRECTES
16.3 VENTES INDIRECTES
16.3.1 VENTES EN LIGNE
16.3.1.1. SITES WEB APPARTENANT À L'ENTREPRISE
16.3.1.2. SITES WEB TIERS
16.3.2 VENTES HORS LIGNE
16.3.2.1. SUPERMARCHÉS / HYPERMARCHÉS
16.3.2.2. DÉPANNEURS
16.3.2.3. MAGASINS SPÉCIALISÉS
16.3.2.4. GROSSISTES / DISTRIBUTEURS
16.3.2.5. PHARMACIES
16.3.2.6. AUTRES
17. MARCHÉ MONDIAL DES BALANCES DE POIDS, PAR ZONE GÉOGRAPHIQUE, 2021-2030 (EN MILLIONS USD) (UNITÉS)
MARCHÉ MONDIAL DES BALANCES DE POIDS (TOUTES LES SEGMENTATIONS FOURNIES CI-DESSUS SONT REPRÉSENTÉES DANS CE CHAPITRE PAR PAYS)
17.1 AMÉRIQUE DU NORD
17.1.1 États-Unis
17.1.2 CANADA
17.1.3 MEXIQUE
17.2 EUROPE
17.2.1 ALLEMAGNE
17.2.2 FRANCE
17.2.3 Royaume-Uni
17.2.4 ITALIE
17.2.5 ESPAGNE
17.2.6 RUSSIE
17.2.7 TURQUIE
17.2.8 BELGIQUE
17.2.9 DANEMARK
17.2.10 PAYS-BAS
17.2.11 SUISSE
17.2.12 SUÈDE
17.2.13 POLOGNE
17.2.14 NORVÈGE
17.2.15 FINLAND
17.2.16 RESTE DE L'EUROPE
17.3 ASIE-PACIFIQUE
17.3.1 JAPON
17.3.2 CHINE
17.3.3 CORÉE DU SUD
17.3.4 INDE
17.3.5 AUSTRALIE
17.3.6 NOUVELLE-ZÉLANDE
17.3.7 SINGAPOUR
17.3.8 THAÏLANDE
17.3.9 MALAISIE
17.3.10 VIETNAM
17.3.11 TAÏWAN
17.3.12 INDONÉSIE
17.3.13 PHILIPPINES
17.3.14 RESTE DE L'ASIE-PACIFIQUE
17.4 AMÉRIQUE DU SUD
17.4.1 BRÉSIL
17.4.2 ARGENTINE
17.4.3 RESTE DE L'AMÉRIQUE DU SUD
17.5 MOYEN-ORIENT ET AFRIQUE
17.5.1 AFRIQUE DU SUD
17.5.2 ARABIE SAOUDITE
17.5.3 BAHREÏN
17.5.4 Émirats arabes unis
17.5.5 KOWEÏT
17.5.6 OMAN
17.5.7 QATAR
17.5.8 ÉGYPTE
17.5.9 ISRAËL
17.5.10 RESTE DU MOYEN-ORIENT ET DE L'AFRIQUE
17.6 PRINCIPALES INFORMATIONS : PAR PRINCIPAUX PAYS
18. MARCHÉ MONDIAL DES BALANCES DE POIDS, PAYSAGE DES ENTREPRISES
18.1 ANALYSE DES ACTIONS DE L'ENTREPRISE : MONDIALE
18.2 ANALYSE DES ACTIONS DE L'ENTREPRISE : AMÉRIQUE DU NORD
18.3 ANALYSE DES ACTIONS DE L'ENTREPRISE : EUROPE
18.4 ANALYSE DES ACTIONS DE L'ENTREPRISE : ASIE-PACIFIQUE
18.5 FUSIONS ET ACQUISITIONS
18.6 DÉVELOPPEMENT ET APPROBATIONS DE NOUVEAUX PRODUITS
18.7 EXTENSION
18.8 PARTENARIAT ET AUTRES DÉVELOPPEMENTS STRATÉGIQUES
19. MARCHÉ MONDIAL DES BALANCES DE POIDS, ANALYSE SWOT ET DBMR
20. MARCHÉ MONDIAL DES BALANCES – PROFIL DE L'ENTREPRISE
20.1 METTLER TOLEDO
20.1.1 PRÉSENTATION DE L'ENTREPRISE
20.1.2 ANALYSE DES REVENUS
20.1.3 PRÉSENCE GÉOGRAPHIQUE
20.1.4 PORTEFEUILLE DE PRODUITS
20.1.5 ÉVOLUTIONS RÉCENTES
20.2 BOSCHE GMBH & CO. KG
20.2.1 PRÉSENTATION DE L'ENTREPRISE
20.2.2 ANALYSE DES REVENUS
20.2.3 PRÉSENCE GÉOGRAPHIQUE
20.2.4 PORTEFEUILLE DE PRODUITS
20.2.5 ÉVOLUTIONS RÉCENTES
20.3 A&D COMPANY, LIMITÉE
20.3.1 PRÉSENTATION DE L'ENTREPRISE
20.3.2 ANALYSE DES REVENUS
20.3.3 PRÉSENCE GÉOGRAPHIQUE
20.3.4 PORTEFEUILLE DE PRODUITS
20.3.5 ÉVOLUTIONS RÉCENTES
20.4 ADAM EQUIPMENT CO. LTD.
20.4.1 PRÉSENTATION DE L'ENTREPRISE
20.4.2 ANALYSE DES REVENUS
20.4.3 PRÉSENCE GÉOGRAPHIQUE
20.4.4 PORTEFEUILLE DE PRODUITS
20.4.5 ÉVOLUTIONS RÉCENTES
20,5 AVERY WEIGH-TRONIX, LLC (FILIALE D'ILLINOIS TOOL WORKS)
20.5.1 PRÉSENTATION DE L'ENTREPRISE
20.5.2 ANALYSE DES REVENUS
20.5.3 PRÉSENCE GÉOGRAPHIQUE
20.5.4 PORTEFEUILLE DE PRODUITS
20.5.5 ÉVOLUTIONS RÉCENTES
20.6 ÉCHELLE CARDINALE
20.6.1 PRÉSENTATION DE L'ENTREPRISE
20.6.2 ANALYSE DES REVENUS
20.6.3 PRÉSENCE GÉOGRAPHIQUE
20.6.4 PORTEFEUILLE DE PRODUITS
20.6.5 ÉVOLUTIONS RÉCENTES
20.7 CONTECH INSTRUMENTS LTD
20.7.1 PRÉSENTATION DE L'ENTREPRISE
20.7.2 ANALYSE DES REVENUS
20.7.3 PRÉSENCE GÉOGRAPHIQUE
20.7.4 PORTEFEUILLE DE PRODUITS
20.7.5 ÉVOLUTIONS RÉCENTES
20.8 DORAN SCALES, INC
20.8.1 PRÉSENTATION DE L'ENTREPRISE
20.8.2 ANALYSE DES REVENUS
20.8.3 PRÉSENCE GÉOGRAPHIQUE
20.8.4 PORTEFEUILLE DE PRODUITS
20.8.5 ÉVOLUTIONS RÉCENTES
20.9 ESSAE
20.9.1 PRÉSENTATION DE L'ENTREPRISE
20.9.2 ANALYSE DES REVENUS
20.9.3 PRÉSENCE GÉOGRAPHIQUE
20.9.4 PORTEFEUILLE DE PRODUITS
20.9.5 ÉVOLUTIONS RÉCENTES
20.10 ÉCHELLES DE FAIRBANKS
20.10.1 PRÉSENTATION DE L'ENTREPRISE
20.10.2 ANALYSE DES REVENUS
20.10.3 PRÉSENCE GÉOGRAPHIQUE
20.10.4 PORTEFEUILLE DE PRODUITS
20.10.5 ÉVOLUTIONS RÉCENTES
20.11 KERN & SOHN
20.11.1 PRÉSENTATION DE L'ENTREPRISE
20.11.2 ANALYSE DES REVENUS
20.11.3 PRÉSENCE GÉOGRAPHIQUE
20.11.4 PORTEFEUILLE DE PRODUITS
20.11.5 ÉVOLUTIONS RÉCENTES
20.12 RICE LAKE WEIGHING SYSTEMS INDIA LTD
20.12.1 PRÉSENTATION DE L'ENTREPRISE
20.12.2 ANALYSE DES REVENUS
20.12.3 PRÉSENCE GÉOGRAPHIQUE
20.12.4 PORTEFEUILLE DE PRODUITS
20.12.5 ÉVOLUTIONS RÉCENTES
20.13 TANITA
20.13.1 PRÉSENTATION DE L'ENTREPRISE
20.13.2 ANALYSE DES REVENUS
20.13.3 PRÉSENCE GÉOGRAPHIQUE
20.13.4 PORTEFEUILLE DE PRODUITS
20.13.5 ÉVOLUTIONS RÉCENTES
20.14 SHINKO DENSHI (UNE SOCIÉTÉ DU GROUPE ISHIDA)
20.14.1 PRÉSENTATION DE L'ENTREPRISE
20.14.2 ANALYSE DES REVENUS
20.14.3 PRÉSENCE GÉOGRAPHIQUE
20.14.4 PORTEFEUILLE DE PRODUITS
20.14.5 ÉVOLUTIONS RÉCENTES
20h15 ACZET
20.15.1 PRÉSENTATION DE L'ENTREPRISE
20.15.2 ANALYSE DES REVENUS
20.15.3 PRÉSENCE GÉOGRAPHIQUE
20.15.4 PORTEFEUILLE DE PRODUITS
20.15.5 ÉVOLUTIONS RÉCENTES
20.16 SARTORIUS AG
20.16.1 PRÉSENTATION DE L'ENTREPRISE
20.16.2 ANALYSE DES REVENUS
20.16.3 PRÉSENCE GÉOGRAPHIQUE
20.16.4 PORTEFEUILLE DE PRODUITS
20.16.5 ÉVOLUTIONS RÉCENTES
20.17 SHIMADZU CORPORATION
20.17.1 PRÉSENTATION DE L'ENTREPRISE
20.17.2 ANALYSE DES REVENUS
20.17.3 PRÉSENCE GÉOGRAPHIQUE
20.17.4 PORTEFEUILLE DE PRODUITS
20.17.5 ÉVOLUTIONS RÉCENTES
20.18 BONSO ELECTRONICS INTERNATIONAL INC
20.18.1 PRÉSENTATION DE L'ENTREPRISE
20.18.2 ANALYSE DES REVENUS
20.18.3 PRÉSENCE GÉOGRAPHIQUE
20.18.4 PORTEFEUILLE DE PRODUITS
20.18.5 ÉVOLUTIONS RÉCENTES
20.19 TRUWEIGH LLC
20.19.1 PRÉSENTATION DE L'ENTREPRISE
20.19.2 ANALYSE DES REVENUS
20.19.3 PRÉSENCE GÉOGRAPHIQUE
20.19.4 PORTEFEUILLE DE PRODUITS
20.19.5 ÉVOLUTIONS RÉCENTES
20.20 OUI OUI TECHNOLOGIES
20.20.1 PRÉSENTATION DE L'ENTREPRISE
20.20.2 ANALYSE DES REVENUS
20.20.3 PRÉSENCE GÉOGRAPHIQUE
20.20.4 PORTEFEUILLE DE PRODUITS
20.20.5 ÉVOLUTIONS RÉCENTES
REMARQUE : LA LISTE DES ENTREPRISES PRÉSENTÉES N'EST PAS EXHAUSTIVE ET EST CONFORME AUX EXIGENCES DE NOS CLIENTS PRÉCÉDENTS. NOTRE ÉTUDE COMPREND PLUS DE 100 ENTREPRISES. LA LISTE PEUT ÊTRE MODIFIÉE OU REMPLACÉE SUR DEMANDE.
21. QUESTIONNAIRE
22. RAPPORTS CONNEXES
23. À PROPOS DE DATA BRIDGE MARKET RESEARCH
Méthodologie de recherche
La collecte de données et l'analyse de l'année de base sont effectuées à l'aide de modules de collecte de données avec des échantillons de grande taille. L'étape consiste à obtenir des informations sur le marché ou des données connexes via diverses sources et stratégies. Elle comprend l'examen et la planification à l'avance de toutes les données acquises dans le passé. Elle englobe également l'examen des incohérences d'informations observées dans différentes sources d'informations. Les données de marché sont analysées et estimées à l'aide de modèles statistiques et cohérents de marché. De plus, l'analyse des parts de marché et l'analyse des tendances clés sont les principaux facteurs de succès du rapport de marché. Pour en savoir plus, veuillez demander un appel d'analyste ou déposer votre demande.
La méthodologie de recherche clé utilisée par l'équipe de recherche DBMR est la triangulation des données qui implique l'exploration de données, l'analyse de l'impact des variables de données sur le marché et la validation primaire (expert du secteur). Les modèles de données incluent la grille de positionnement des fournisseurs, l'analyse de la chronologie du marché, l'aperçu et le guide du marché, la grille de positionnement des entreprises, l'analyse des brevets, l'analyse des prix, l'analyse des parts de marché des entreprises, les normes de mesure, l'analyse globale par rapport à l'analyse régionale et des parts des fournisseurs. Pour en savoir plus sur la méthodologie de recherche, envoyez une demande pour parler à nos experts du secteur.
Personnalisation disponible
Data Bridge Market Research est un leader de la recherche formative avancée. Nous sommes fiers de fournir à nos clients existants et nouveaux des données et des analyses qui correspondent à leurs objectifs. Le rapport peut être personnalisé pour inclure une analyse des tendances des prix des marques cibles, une compréhension du marché pour d'autres pays (demandez la liste des pays), des données sur les résultats des essais cliniques, une revue de la littérature, une analyse du marché des produits remis à neuf et de la base de produits. L'analyse du marché des concurrents cibles peut être analysée à partir d'une analyse basée sur la technologie jusqu'à des stratégies de portefeuille de marché. Nous pouvons ajouter autant de concurrents que vous le souhaitez, dans le format et le style de données que vous recherchez. Notre équipe d'analystes peut également vous fournir des données sous forme de fichiers Excel bruts, de tableaux croisés dynamiques (Fact book) ou peut vous aider à créer des présentations à partir des ensembles de données disponibles dans le rapport.

