Middle East and Africa Next Generation Sequencing (NGS) Market, By Product (Instruments, Consumables and Services), Applications (Diagnostics, Biomarker Discovery, Precision Medicine, Drug Discovery, Agriculture and Animal Research and Others), End User (Pharmaceutical & Biotechnology Companies, Research Centers & Academic and Government Institutes and Hospital & Clinics), Country (South Africa and Rest of Middle East And Africa) Industry Trends & Forecast to 2029.
Market Analysis and Insights : Middle East and Africa Next Generation Sequencing (NGS) Market
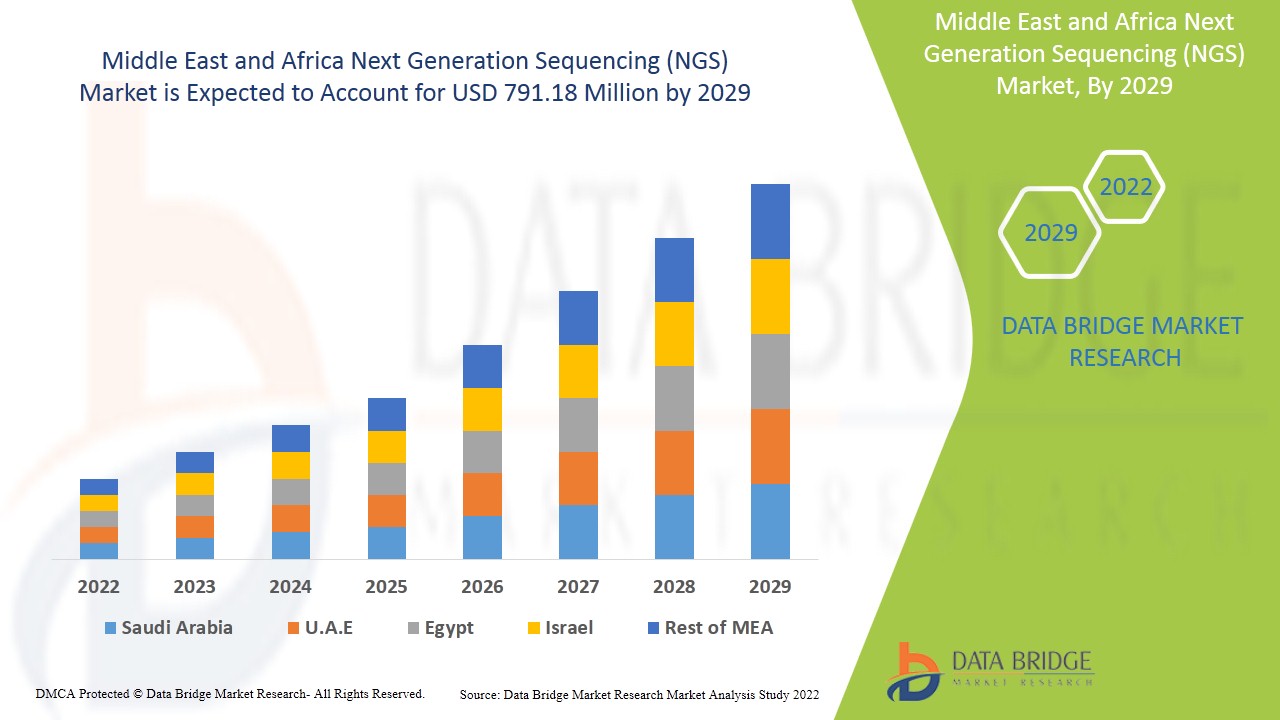
Middle East and Africa next generation sequencing (NGS) market is expected to gain market growth in the forecast period of 2022 to 2029. Data Bridge Market Research analyses that the market is growing with a CAGR of 12.7% in the forecast period of 2022 to 2029 and is expected to reach USD 791.18 million by 2029. Increasing research activities next generation sequencing (NGS) act as driver for the next generation sequencing (NGS) market growth.
High-throughput sequencing, most widely regarded as the "next-generation" sequencing (NGS), is now integrated into routine clinical practice due to the numerous technical and functional developments, while early protocols relied on samples harvested outside of typical workflows in clinical pathology, standard formalin-fixed, paraffin-embedded specimens which can be used more regularly as starting material for NGS. In addition, protocols are being amassed for the analysis and interpretation of NGS data, as well as knowledge bases, allowing clinicians to act more easily on genomic information at the patient care point. The presence of wide range of products of the next generation sequencing used in the diagnosis of chronic diseases is satisfying the need of the healthcare facilities. The increased technological advancement leads to development of highly efficient next generation sequencing (NGS) in the market.
Major factors driving the growth of next generation sequencing (NGS) market are use of next generation sequencing in drug development and wide portfolio offered by major player and the factor which hampers the growth of the next generation sequencing (NGS) market includes high cost of next generation sequencing products and product recall.
The next generation sequencing (NGS) market report provides details of market share, new developments, and product pipeline analysis, impact of domestic and localized market players, analyses opportunities in terms of emerging revenue pockets, changes in market regulations, product approvals, strategic decisions, product launches, geographic expansions, and technological innovations in the market. To understand the analysis and the next generation sequencing (NGS) market scenario contact Data Bridge Market Research for an Analyst Brief, our team will help you create a revenue impact solution to achieve your desired goal.
Next Generation Sequencing (NGS) Market Scope and Market Size
The next generation sequencing (NGS) market is segmented on basis of product, applications, end users. The growth among segments helps you analyze niche pockets of growth and strategies to approach the market and determine your core application areas and the difference in your target markets.
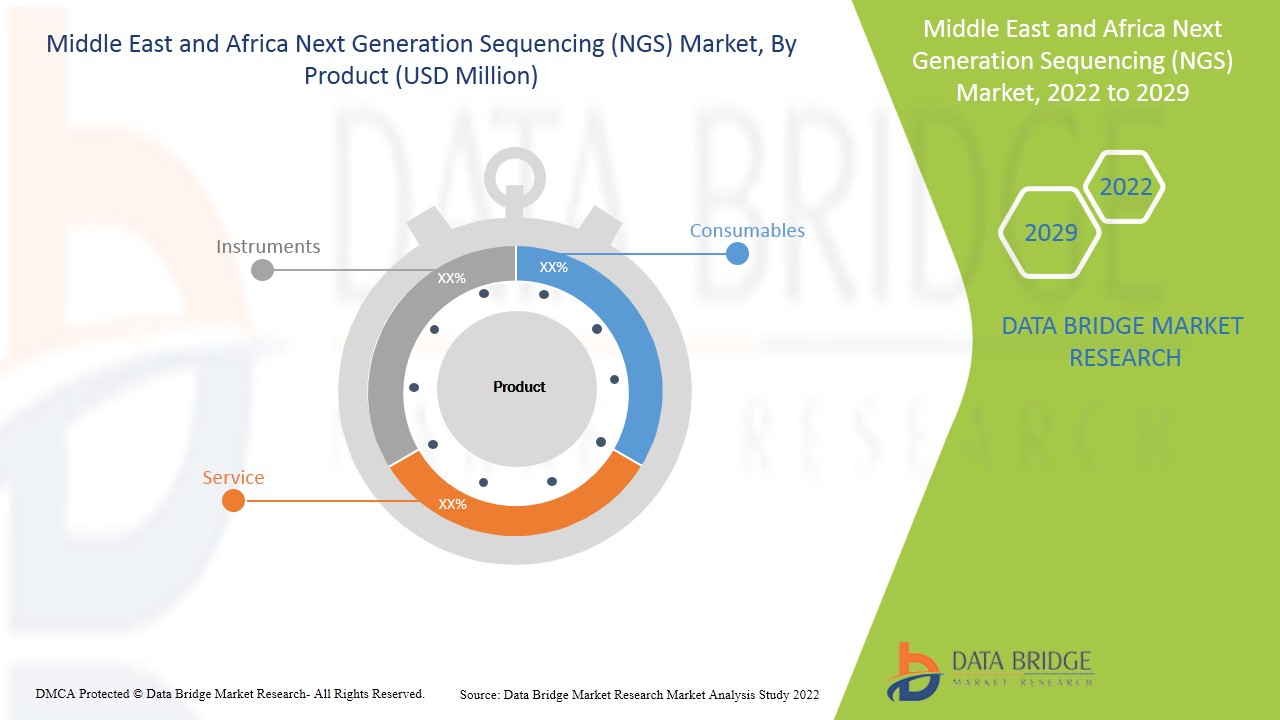
- On the basis of product, the Middle East and Africa next generation sequencing (NGS) market is segmented into instrument, consumables, and services. In 2022, instrument segment is dominating the next generation sequencing (NGS) market as the companies are trying to expand their business to through sales of products in these regions which is acting as the reason for dominance.
- On the basis of application, the Middle East and Africa next generation sequencing (NGS) market is segmented into diagnostic, drug discovery, biomarker discovery, precision medicine, agriculture and animal research. In 2022, the diagnostic segment is dominating the Middle East and Africa next generation sequencing (NGS) market due to the fact that the prevalence of disease is high in these regions and the use of NGS in diagnosis is low in these countries
- On the basis of end user, the Middle East and Africa next generation sequencing (NGS) market is segmented into hospitals & clinics, research centers and academic & government institutes, pharmaceutical & biotechnology companies. In 2022, research center and academic & government institutes is dominating in the Middle East and Africa next generation sequencing (NGS) market as the research on the companies has collaborated with African institutes which has knowledge of African gene which dominate the segment
Next Generation Sequencing (NGS) Market Country Level Analysis
The next generation sequencing (NGS) market is analyzed and market size information is provided by the country, product, application, and end user as referenced above.
The countries covered in the next generation sequencing (NGS) market report are South Africa and rest of Middle East and Africa.
Diagnostic segment in South Africa of the region is expected to grow with the highest growth rate in the forecast period of 2022 to 2029 because of use of next generation technology in hospitals and clinics.
The country section of the report also provides individual market impacting factors and changes in regulation in the market domestically that impacts the current and future trends of the market. Data points such as new sales, replacement sales, country demographics, regulatory acts and import-export tariffs are some of the major pointers used to forecast the market scenario for individual countries. Also, presence and availability of Middle East and Africa brands and their challenges faced due to large or scarce competition from local and domestic brands, impact of sales channels are considered while providing forecast analysis of the country data.
Growing Strategic Activities by Major Market Players to Enhance the Awareness for Next generation sequencing (NGS) Treatment, is Boosting the Market Growth of Next generation sequencing (NGS) market.
The next generation sequencing (NGS) market also provides you with detailed market analysis for every country growth in particular market. Additionally, it provides the detail information regarding the market players’ strategy and their geographical presence. The data is available for historic period 2011 to 2020.
Competitive Landscape and Next Generation Sequencing (NGS) Market Share Analysis
Next generation sequencing (NGS) market competitive landscape provides details by competitor. Details included are company overview, company financials, revenue generated, market potential, investment in research and development, new market initiatives, production sites and facilities, company strengths and weaknesses, product launch, product trials pipelines, product approvals, patents, product width and breadth, application dominance, technology lifeline curve. The above data points provided are only related to the company’s focus related to next generation sequencing (NGS) market.
Some of the major companies which are dealing in the next generation sequencing (NGS) are Agilent Technologies, Inc., ThermoFisher Scientific, Inc., QIAGEN, Illumina, Inc., Bio-Rad Laboratories, Inc., Roche Sequencing (A subsidiary of F. Hoffman La Roche), BGI (A subsidiary of BGI Group), Oxford Nanopore Technologies plc, MACROGEN CO., LTD., DNASTAR, Geneious, Partek, Incorporated, PerkinElmer Inc., Takara Bio Inc., bioMérieux SA, among other domestic players. DBMR analysts understand competitive strengths and provide competitive analysis for each competitor separately.
Many contract and agreement are also initiated by the companies’ worldwide which are also accelerating the next generation sequencing (NGS) market.
For instance,
- In February 2021, Thermo Fisher Scientific Inc. announced it has won six awards in the annual CMO Leadership Awards. The awards, presented by Life Science Leader and Outsourced Pharma, recognize top contract manufacturing partners as evaluated by biopharma and biotech companies. It is estimated that this recognition anticipated to strengthen company’s footprints in Middle East and Africa market and leading to upsurgecompany’s growth in the coming years.
Collaboration, product launch, business expansion, award and recognition, joint ventures and other strategies by the market player is enhancing the company footprints in the next generation sequencing (NGS) market which also provides the benefit for organization’s profit growth.
SKU-
Accédez en ligne au rapport sur le premier cloud mondial de veille économique

- Tableau de bord d'analyse de données interactif
- Tableau de bord d'analyse d'entreprise pour les opportunités à fort potentiel de croissance
- Accès d'analyste de recherche pour la personnalisation et les requêtes
- Analyse de la concurrence avec tableau de bord interactif
- Dernières actualités, mises à jour et analyse des tendances
- Exploitez la puissance de l'analyse comparative pour un suivi complet de la concurrence
Table des matières
1 INTRODUCTION
1.1 OBJECTIFS DE L'ÉTUDE
1.2 DÉFINITION DU MARCHÉ
1.3 APERÇU DU MARCHÉ DU SÉQUENÇAGE DE NOUVELLE GÉNÉRATION (NGS) AU MOYEN-ORIENT ET EN AFRIQUE
1.4 MONNAIE ET TARIFS
1.5 LIMITATIONS
1.6 MARCHÉS COUVERTS
2 SEGMENTATION DU MARCHÉ
2.1 MARCHÉS COUVERTS
2.2 PORTÉE GÉOGRAPHIQUE
2,3 ANS CONSIDÉRÉS POUR L'ÉTUDE
2.4 MODÈLE DE VALIDATION DES DONNÉES DU TRÉPIED DBMR
2.5 ENTRETIENS PRIMAIRES AVEC DES LEADERS D'OPINION CLÉS
2.6 MODÉLISATION MULTIVARIÉE
2.7 GRILLE DE COUVERTURE DES APPLICATIONS DU MARCHÉ
2.8 TYPE DE PRODUIT COURBE DE LIGNE DE VIE
2.9 GRILLE DE POSITIONNEMENT DU MARCHÉ DBMR
2.1 ANALYSE DE LA PART DES FOURNISSEURS
2.11 SOURCES SECONDAIRES
2.12 HYPOTHÈSES
3 RÉSUMÉ EXÉCUTIF
3.1 L'ANALYSE DE PESTEL
3.2 MODÈLE DES CINQ FORCES DE PORTER
4 RÉGLEMENTATIONS DU MARCHÉ DU SÉQUENÇAGE DE NOUVELLE GÉNÉRATION (NGS) AU MOYEN-ORIENT ET EN AFRIQUE
5 APERÇU DU MARCHÉ
5.1 PILOTES
5.1.1 DIMINUTION DU COÛT DU SÉQUENÇAGE GÉNÉTIQUE PAR BASE
5.1.2 AUGMENTATION DE L'ADOPTION DE LA PHARMACOLOGIE AXÉE SUR LE GÉNOMIQUE
5.1.3 LARGE PORTEFEUILLE DE PRODUITS OFFERT PAR UN ACTEUR MAJEUR
5.1.4 UTILISATION DU SÉQUENÇAGE DE NOUVELLE GÉNÉRATION DANS LE DÉVELOPPEMENT DE MÉDICAMENTS
5.1.5 TENDANCE ACCRUE VERS LA MÉDICATION PERSONNALISÉE
5.2 RESTRICTIONS
5.2.1 COÛT ÉLEVÉ DE L'INSTRUMENT
5.2.2 DIFFICULTÉ DANS L'ANALYSE DES DONNÉES CLINIQUES NGS
5.2.3 PRÉOCCUPATION DE LA CYBERSÉCURITÉ EN GÉNOMIQUE
5.3 OPPORTUNITÉS
5.3.1 INITIATIVES STRATÉGIQUES DE L'ACTEUR CLÉ DU MARCHÉ
5.3.2 APPROBATION DES PRODUITS AU COURS DES DERNIÈRES ANNÉES
5.3.3 PROGRESSION DE LA TECHNOLOGIE NGS
5.4 DÉFIS
5.4.1 MANQUE DE PROFESSIONNELS QUALIFIÉS POUR RÉALISER DES NGS
5.4.2 DÉFIS DE LA MISE EN ŒUVRE DU NGS EN LABORATOIRE CLINIQUE
6 IMPACT DE LA COVID-19 SUR LE SECTEUR DE LA SANTÉ DU SÉQUENÇAGE DE NOUVELLE GÉNÉRATION (NGS) AU MOYEN-ORIENT ET EN AFRIQUE
6.1 IMPACT SUR LE PRIX
6.2 IMPACT SUR LA DEMANDE
6.3 IMPACT SUR LA CHAÎNE D'APPROVISIONNEMENT
6.4 INITIATIVES CLÉS DES ACTEURS DU MARCHÉ PENDANT LA COVID-19
6.5 CONCLUSION
7 MIDDLE EAST AND AFRICA NEXT GENERATION SEQUENCING (NGS) MARKET, BY PRODUCT
7.1 OVERVIEW
7.2 INSTRUMENTS
7.2.1 HISEQ SERIES
7.2.2 MISEQ SERIES
7.2.3 ION TORRENT
7.2.4 PACBIO RS II
7.2.5 SEQUEL SYSTEM
7.2.6 SOLID
7.2.7 OTHERS
7.3 CONSUMABLE
7.3.1 LIBRARY PREPARATION & TARGET ENRICHMENT
7.3.2 SAMPLE PREPARATION CONSUMABLES
7.3.3 OTHERS
7.4 SERVICES
7.4.1 SEQUENCING SERVICES
7.4.2 DATA MANAGEMENT
8 MIDDLE EAST AND AFRICA NEXT GENERATION SEQUENCING (NGS) MARKET, BY APPLICATION
8.1 OVERVIEW
8.2 DIAGNOSTICS
8.3 BIOMARKER DISCOVERY
8.4 PRECISION MEDICINE
8.5 DRUG DISCOVERY
8.6 AGRICULTURE & ANIMAL RESEARCH
9 MIDDLE EAST AND AFRICA NEXT GENERATION SEQUENCING (NGS) MARKET, BY END USER
9.1 OVERVIEW
9.2 PHARMACEUTICAL AND BIOTECHNOLOGY COMPANIES
9.3 RESEARCH CENTERS & ACADEMIC AND GOVERNMENT INSTITUTES
9.4 HOSPITAL & CLINICS
10 MIDDLE EAST AND AFRICA NEXT GENERATION SEQUENCING (NGS) MARKET, BY REGION
10.1 MIDDLE EAST AND AFRICA
10.1.1 SOUTH AFRICA
10.1.2 REST OF MIDDLE EAST AND AFRICA
11 MIDDLE EAST AND AFRICA NEXT GENERATION SEQUENCING (NGS) MARKET: COMPANY LANDSCAPE
11.1 COMPANY SHARE ANALYSIS: MIDDLE EAST AND AFRICA
12 COMPANY PROFILING
12.1 ILLUMINA, INC.
12.1.1 COMPANY SNAPSHOT
12.1.2 REVENUE ANALYSIS
12.1.3 COMPANY SHARE ANALYSIS
12.1.4 SWOT ANALYSIS
12.1.5 PRODUCT PORTFOLIO
12.1.6 RECENT DEVELOPMENTS
12.2 BGI (A SUBSIDIAIRY OF BGI GROUP) (2021)
12.2.1 COMPANY SNAPSHOT
12.2.2 REVENUE ANALYSIS
12.2.3 COMPANY SHARE ANALYSIS
12.2.4 SWOT ANALYSIS
12.2.5 PRODUCT PORTFOLIO
12.2.6 RECENT DEVELOPMENT
12.3 THERMO FISHER SCIENTIFIC INC.
12.3.1 COMPANY SNAPSHOT
12.3.2 REVENUE ANALYSIS
12.3.3 COMPANY SHARE ANALYSIS
12.3.4 SWOT ANALYSIS
12.3.5 PRODUCT PORTFOLIO
12.3.6 RECENT DEVELOPMENTS
12.4 QIAGEN
12.4.1 COMPANY SNAPSHOT
12.4.2 REVENUE ANALYSIS
12.4.3 COMPANY SHARE ANALYSIS
12.4.4 SWOT ANALYSIS
12.4.5 PRODUCT PORTFOLIO
12.4.6 RECENT DEVELOPMENTS
12.5 AGILENT TECHNOLOGIES, INC.
12.5.1 COMPANY SNAPSHOT
12.5.2 REVENUE ANALYSIS
12.5.3 COMPANY SHARE ANALYSIS
12.5.4 SWOT ANALYSIS
12.5.5 PRODUCT PORTFOLIO
12.5.6 RECENT DEVELOPMENT
12.6 OXFORD NANOPORE TECHNOLOGIES
12.6.1 COMPANY SNAPSHOT
12.6.2 PRODUCT PORTFOLIO
12.6.3 RECENT DEVELOPMENTS
12.7 BIO-RAD LABORATORIES, INC.
12.7.1 COMPANY SNAPSHOT
12.7.2 REVENUE ANALYSIS
12.7.3 PRODUCT PORTFOLIO
12.7.4 RECENT DEVELOPMENTS
12.8X GENOMICS
12.8.1 COMPANY SNAPSHOT
12.8.2 REVENUE ANALYSIS
12.8.3 PRODUCT PORTFOLIO
12.8.4 RECENT DEVELOPMENTS
12.9 BIOMÉRIEUX SA
12.9.1 COMPANY SNAPSHOT
12.9.2 REVENUE ANALYSIS
12.9.3 PRODUCT PORTFOLIO
12.9.4 RECENT DEVELOPMENT
12.1 DNASTAR
12.10.1 COMPANY SNAPSHOT
12.10.2 PRODUCT PORTFOLIO
12.10.3 RECENT DEVELOPMENT
12.11 GENEIOUS
12.11.1 COMPANY SNAPSHOT
12.11.2 PRODUCT PORTFOLIO
12.11.3 RECENT DEVELOPMENTS
12.12 GENEWIZ, FROM AZENTA LIFE SCIENCES
12.12.1 COMPANY SNAPSHOT
12.12.2 REVENUE ANALYSIS
12.12.3 PRODUCT PORTFOLIO
12.12.4 RECENT DEVELOPMENTS
12.13 HAMILTON COMPANY
12.13.1 COMPANY SNAPSHOT
12.13.2 PRODUCT PORTFOLIO
12.13.3 RECENT DEVELOPMENT
12.14 MACROGEN, INC.
12.14.1 COMPANY SNAPSHOT
12.14.2 REVENUE ANALYSIS
12.14.3 PRODUCT PORTFOLIO
12.14.4 RECENT DEVELOPMENT
12h15 BIOLABS DE LA NOUVELLE-ANGLETERRE
12.15.1 INSTANTANÉ DE L'ENTREPRISE
12.15.2 PORTEFEUILLE DE PRODUITS
12.15.3 ÉVOLUTION RÉCENTE
12.16 PACIFIC BIOSCIENCES DE CALIFORNIE, INC.
12.16.1 INSTANTANÉ DE L'ENTREPRISE
12.16.2 ANALYSE DES REVENUS
12.16.3 PORTEFEUILLE DE PRODUITS
12.16.4 ÉVOLUTIONS RÉCENTES
12.17 PARTEK, INCORPORATED
12.17.1 INSTANTANÉ DE L'ENTREPRISE
12.17.2 PORTEFEUILLE DE PRODUITS
12.17.3 ÉVOLUTION RÉCENTE
12.18 PERKIN ELMER INC. (2021)
12.18.1 INSTANTANÉ DE L'ENTREPRISE
12.18.2 ANALYSE DES REVENUS
12.18.3 PORTEFEUILLE DE PRODUITS
12.18.4 ÉVOLUTIONS RÉCENTES
12.19 ROCHE SÉQUENCING (FILIALE DE F. HOFFMANN-LA ROCHE LTD)
12.19.1 INSTANTANÉ DE L'ENTREPRISE
12.19.2 ANALYSE DES CHIFFRES D'AFFAIRES (SOCIÉTÉ MÈRE)
12.19.3 PORTEFEUILLE DE PRODUITS
12.19.4 ÉVOLUTIONS RÉCENTES
12.2 TAKARA BIO INC.
12.20.1 INSTANTANÉ DE L'ENTREPRISE
12.20.2 ANALYSE DES REVENUS
12.20.3 PORTEFEUILLE DE PRODUITS
12.20.4 ÉVOLUTIONS RÉCENTES
13 QUESTIONNAIRE
14 RAPPORTS CONNEXES
Liste des tableaux
TABLEAU 1 COÛT DU SÉQUENÇAGE DE NOUVELLE GÉNÉRATION PAR ÉCHANTILLON
TABLEAU 2 MARCHÉ DU SÉQUENÇAGE DE NOUVELLE GÉNÉRATION (NGS) AU MOYEN-ORIENT ET EN AFRIQUE, PAR PRODUIT, 2020-2029 (EN MILLIONS USD)
TABLEAU 3 INSTRUMENTS DU MARCHÉ DU SÉQUENÇAGE DE NOUVELLE GÉNÉRATION (NGS) AU MOYEN-ORIENT ET EN AFRIQUE, PAR RÉGION, 2020-2029 (EN MILLIONS USD)
TABLEAU 4 INSTRUMENTS DU MARCHÉ DU SÉQUENÇAGE DE NOUVELLE GÉNÉRATION (NGS) AU MOYEN-ORIENT ET EN AFRIQUE, PAR PRODUIT, 2020-2029 (EN MILLIONS USD)
TABLEAU 5 CONSOMMABLES DU MARCHÉ DU SÉQUENÇAGE DE NOUVELLE GÉNÉRATION (NGS) AU MOYEN-ORIENT ET EN AFRIQUE, PAR RÉGION, 2020-2029 (EN MILLIONS USD)
TABLEAU 6 CONSOMMABLES DU MARCHÉ DU SÉQUENÇAGE DE NOUVELLE GÉNÉRATION (NGS) AU MOYEN-ORIENT ET EN AFRIQUE, PAR PRODUIT, 2020-2029 (EN MILLIONS USD)
TABLEAU 7 SERVICES DU MOYEN-ORIENT ET DE L'AFRIQUE SUR LE MARCHÉ DU SÉQUENÇAGE DE NOUVELLE GÉNÉRATION (NGS), PAR RÉGION, 2020-2029 (EN MILLIONS USD)
TABLEAU 8 SERVICES DU MOYEN-ORIENT ET DE L'AFRIQUE SUR LE MARCHÉ DU SÉQUENÇAGE DE NOUVELLE GÉNÉRATION (NGS), PAR PRODUIT, 2020-2029 (EN MILLIONS USD)
TABLEAU 9 MARCHÉ DU SÉQUENÇAGE DE NOUVELLE GÉNÉRATION (NGS) AU MOYEN-ORIENT ET EN AFRIQUE, PAR APPLICATION, 2020-2029 (EN MILLIONS USD)
TABLEAU 10 MARCHÉ DU DIAGNOSTIC DU SÉQUENÇAGE DE NOUVELLE GÉNÉRATION (NGS) AU MOYEN-ORIENT ET EN AFRIQUE, PAR RÉGION, 2020-2029 (EN MILLIONS USD)
TABLEAU 11 DÉCOUVERTE DE BIOMARQUEURS AU MOYEN-ORIENT ET EN AFRIQUE SUR LE MARCHÉ DU SÉQUENÇAGE DE NOUVELLE GÉNÉRATION (NGS), PAR RÉGION, 2020-2029 (EN MILLIONS USD)
TABLEAU 12 MÉDECINE DE PRÉCISION AU MOYEN-ORIENT ET EN AFRIQUE SUR LE MARCHÉ DU SÉQUENÇAGE DE NOUVELLE GÉNÉRATION (NGS), PAR RÉGION, 2020-2029 (EN MILLIONS USD)
TABLEAU 13 DÉCOUVERTE DE MÉDICAMENTS AU MOYEN-ORIENT ET EN AFRIQUE SUR LE MARCHÉ DU SÉQUENÇAGE DE NOUVELLE GÉNÉRATION (NGS), PAR RÉGION, 2020-2029 (EN MILLIONS USD)
TABLEAU 14 MARCHÉ DE L'AGRICULTURE ET DE LA RECHERCHE ANIMALE AU MOYEN-ORIENT ET EN AFRIQUE SUR LE SÉQUENÇAGE DE NOUVELLE GÉNÉRATION (NGS), PAR RÉGION, 2020-2029 (EN MILLIONS USD)
TABLEAU 15 MARCHÉ DU SÉQUENÇAGE DE NOUVELLE GÉNÉRATION (NGS) AU MOYEN-ORIENT ET EN AFRIQUE, PAR UTILISATEUR FINAL, 2020-2029 (EN MILLIONS USD)
TABLEAU 16 SOCIÉTÉS PHARMACEUTIQUES ET BIOTECHNOLOGIQUES DU MOYEN-ORIENT ET D'AFRIQUE SUR LE MARCHÉ DU SÉQUENÇAGE DE NOUVELLE GÉNÉRATION (NGS), PAR RÉGION, 2020-2029 (EN MILLIONS USD)
TABLEAU 17 CENTRES DE RECHERCHE ET INSTITUTS UNIVERSITAIRES ET GOUVERNEMENTAUX AU MOYEN-ORIENT ET EN AFRIQUE SUR LE MARCHÉ DU SÉQUENÇAGE DE NOUVELLE GÉNÉRATION (NGS), PAR RÉGION, 2020-2029 (EN MILLIONS USD)
TABLEAU 18 HÔPITAUX ET CLINIQUES DU MOYEN-ORIENT ET DE L'AFRIQUE SUR LE MARCHÉ DU SÉQUENÇAGE DE NOUVELLE GÉNÉRATION (NGS), PAR RÉGION, 2020-2029 (EN MILLIONS USD)
TABLEAU 19 MARCHÉ DU SÉQUENÇAGE DE NOUVELLE GÉNÉRATION (NGS) AU MOYEN-ORIENT ET EN AFRIQUE, PAR PAYS, 2020-2029 (EN MILLIONS USD)
TABLEAU 20 MARCHÉ DU SÉQUENÇAGE DE NOUVELLE GÉNÉRATION (NGS) AU MOYEN-ORIENT ET EN AFRIQUE, PAR PRODUIT, 2020-2029 (EN MILLIONS USD)
TABLEAU 21 INSTRUMENTS DU MARCHÉ DU SÉQUENÇAGE DE NOUVELLE GÉNÉRATION (NGS) AU MOYEN-ORIENT ET EN AFRIQUE, PAR PRODUIT, 2020-2029 (EN MILLIONS USD)
TABLEAU 22 CONSOMMABLES DU MARCHÉ DU SÉQUENÇAGE DE NOUVELLE GÉNÉRATION (NGS) AU MOYEN-ORIENT ET EN AFRIQUE, PAR PRODUIT, 2020-2029 (EN MILLIONS USD)
TABLEAU 23 SERVICES DU MOYEN-ORIENT ET DE L'AFRIQUE SUR LE MARCHÉ DU SÉQUENÇAGE DE NOUVELLE GÉNÉRATION (NGS), PAR PRODUIT, 2020-2029 (EN MILLIONS USD)
TABLEAU 24 MARCHÉ DU SÉQUENÇAGE DE NOUVELLE GÉNÉRATION (NGS) AU MOYEN-ORIENT ET EN AFRIQUE, PAR APPLICATION, 2020-2029 (EN MILLIONS USD)
TABLEAU 25 MARCHÉ DU SÉQUENÇAGE DE NOUVELLE GÉNÉRATION (NGS) AU MOYEN-ORIENT ET EN AFRIQUE, PAR UTILISATEUR FINAL, 2020-2029 (EN MILLIONS USD)
TABLEAU 26 MARCHÉ DU SÉQUENÇAGE DE NOUVELLE GÉNÉRATION (NGS) EN AFRIQUE DU SUD, PAR PRODUIT, 2020-2029 (EN MILLIONS USD)
TABLEAU 27 INSTRUMENTS DU MARCHÉ DU SÉQUENÇAGE DE NOUVELLE GÉNÉRATION (NGS) EN AFRIQUE DU SUD, PAR PRODUIT, 2020-2029 (EN MILLIONS USD)
TABLEAU 28 CONSOMMABLES SUR LE MARCHÉ DU SÉQUENÇAGE DE NOUVELLE GÉNÉRATION (NGS) EN AFRIQUE DU SUD, PAR PRODUIT, 2020-2029 (EN MILLIONS USD)
TABLEAU 29 SERVICES SUD-AFRIQUE SUR LE MARCHÉ DU SÉQUENÇAGE DE NOUVELLE GÉNÉRATION (NGS), PAR PRODUIT, 2020-2029 (EN MILLIONS USD)
TABLEAU 30 MARCHÉ DU SÉQUENÇAGE DE NOUVELLE GÉNÉRATION (NGS) EN AFRIQUE DU SUD, PAR APPLICATION, 2020-2029 (EN MILLIONS USD)
TABLEAU 31 MARCHÉ DU SÉQUENÇAGE DE NOUVELLE GÉNÉRATION (NGS) EN AFRIQUE DU SUD, PAR UTILISATEUR FINAL, 2020-2029 (EN MILLIONS USD)
TABLEAU 32 RESTE DU MOYEN-ORIENT ET DE L'AFRIQUE MARCHÉ DU SÉQUENÇAGE DE NOUVELLE GÉNÉRATION (NGS), PAR PRODUIT, 2020-2029 (EN MILLIONS USD)
Liste des figures
FIGURE 1 MARCHÉ DU SÉQUENÇAGE DE NOUVELLE GÉNÉRATION (NGS) AU MOYEN-ORIENT ET EN AFRIQUE : SEGMENTATION
FIGURE 2 MARCHÉ DU SÉQUENÇAGE DE NOUVELLE GÉNÉRATION (NGS) AU MOYEN-ORIENT ET EN AFRIQUE : TRIANGULATION DES DONNÉES
FIGURE 3 MARCHÉ DU SÉQUENÇAGE DE NOUVELLE GÉNÉRATION (NGS) AU MOYEN-ORIENT ET EN AFRIQUE : ANALYSE DROC
FIGURE 4 MARCHÉ DU SÉQUENÇAGE DE NOUVELLE GÉNÉRATION (NGS) AU MOYEN-ORIENT ET EN AFRIQUE : ANALYSE DU MARCHÉ RÉGIONAL ET NATIONAL
FIGURE 5 MARCHÉ DU SÉQUENÇAGE DE NOUVELLE GÉNÉRATION (NGS) AU MOYEN-ORIENT ET EN AFRIQUE : ANALYSE DE LA RECHERCHE DES ENTREPRISES
FIGURE 6 MARCHÉ DU SÉQUENÇAGE DE NOUVELLE GÉNÉRATION (NGS) AU MOYEN-ORIENT ET EN AFRIQUE : DÉMOGRAPHIE DES ENTRETIENS
FIGURE 7 MARCHÉ DU SÉQUENÇAGE DE NOUVELLE GÉNÉRATION (NGS) AU MOYEN-ORIENT ET EN AFRIQUE : GRILLE DE COUVERTURE DES APPLICATIONS DU MARCHÉ
FIGURE 8 MARCHÉ DU SÉQUENÇAGE DE NOUVELLE GÉNÉRATION (NGS) AU MOYEN-ORIENT ET EN AFRIQUE : GRILLE DE POSITIONNEMENT DU MARCHÉ DBMR
FIGURE 9 MARCHÉ DU SÉQUENÇAGE DE NOUVELLE GÉNÉRATION (NGS) AU MOYEN-ORIENT ET EN AFRIQUE : ANALYSE DES PARTS DE FOURNISSEURS
FIGURE 10 MARCHÉ DU SÉQUENÇAGE DE NOUVELLE GÉNÉRATION (NGS) AU MOYEN-ORIENT ET EN AFRIQUE : SEGMENTATION
FIGURE 11 LE PORTEFEUILLE WISE OFFERT PAR LES PRINCIPAUX ACTEURS ET L'UTILISATION DU SÉQUENÇAGE DE NOUVELLE GÉNÉRATION DANS LE DÉVELOPPEMENT DE MÉDICAMENTS DEVRAIENT DYNAMISER LE MARCHÉ DU SÉQUENÇAGE DE NOUVELLE GÉNÉRATION (NGS) AU MOYEN-ORIENT ET EN AFRIQUE AU COURS DE LA PÉRIODE DE PRÉVISION DE 2022 À 2029
FIGURE 12 LE SEGMENT DES INSTRUMENTS DEVRAIT REPRÉSENTER LA PLUS GRANDE PART DU MARCHÉ DU SÉQUENÇAGE DE NOUVELLE GÉNÉRATION (NGS) AU MOYEN-ORIENT ET EN AFRIQUE EN 2021 ET 2029
FIGURE 13 MOTEURS, CONTRAINTES, OPPORTUNITÉS ET DÉFIS DU MARCHÉ DU SÉQUENÇAGE DE NOUVELLE GÉNÉRATION (NGS) AU MOYEN-ORIENT ET EN AFRIQUE
FIGURE 14 DIMINUTION DU COÛT DU SÉQUENÇAGE PAR BASE
FIGURE 15 UTILISATION DU NSG DANS LE DÉVELOPPEMENT DE MÉDICAMENTS
FIGURE 16 CHIFFRE D'AFFAIRES DE LA SOCIÉTÉ AGILENT TECHNOLOGIES, INC.
FIGURE 17 MARCHÉ DU SÉQUENÇAGE DE NOUVELLE GÉNÉRATION (NGS) AU MOYEN-ORIENT ET EN AFRIQUE : PAR PRODUIT, 2021
FIGURE 18 MARCHÉ DU SÉQUENÇAGE DE NOUVELLE GÉNÉRATION (NGS) AU MOYEN-ORIENT ET EN AFRIQUE : PAR PRODUIT, 2020-2029 (EN MILLIONS USD)
FIGURE 19 MARCHÉ DU SÉQUENÇAGE DE NOUVELLE GÉNÉRATION (NGS) AU MOYEN-ORIENT ET EN AFRIQUE : PAR PRODUIT, TCAC (2022-2029)
FIGURE 20 MARCHÉ DU SÉQUENÇAGE DE NOUVELLE GÉNÉRATION (NGS) AU MOYEN-ORIENT ET EN AFRIQUE : PAR PRODUIT, COURBE DE LIGNE DE VIE
FIGURE 21 MARCHÉ DU SÉQUENÇAGE DE NOUVELLE GÉNÉRATION (NGS) AU MOYEN-ORIENT ET EN AFRIQUE : PAR APPLICATION, 2021
FIGURE 22 MARCHÉ DU SÉQUENÇAGE DE NOUVELLE GÉNÉRATION (NGS) AU MOYEN-ORIENT ET EN AFRIQUE : PAR APPLICATION, 2020-2029 (EN MILLIONS USD)
FIGURE 23 MARCHÉ DU SÉQUENÇAGE DE NOUVELLE GÉNÉRATION (NGS) AU MOYEN-ORIENT ET EN AFRIQUE : PAR APPLICATION, TCAC (2022-2029)
FIGURE 24 MARCHÉ DU SÉQUENÇAGE DE NOUVELLE GÉNÉRATION (NGS) AU MOYEN-ORIENT ET EN AFRIQUE : PAR APPLICATION, COURBE DE LIGNE DE VIE
FIGURE 25 MARCHÉ DU SÉQUENÇAGE DE NOUVELLE GÉNÉRATION (NGS) AU MOYEN-ORIENT ET EN AFRIQUE : PAR UTILISATEUR FINAL, 2021
FIGURE 26 MARCHÉ DU SÉQUENÇAGE DE NOUVELLE GÉNÉRATION (NGS) AU MOYEN-ORIENT ET EN AFRIQUE : PAR UTILISATEUR FINAL, 2020-2029 (EN MILLIONS USD)
FIGURE 27 MARCHÉ DU SÉQUENÇAGE DE NOUVELLE GÉNÉRATION (NGS) AU MOYEN-ORIENT ET EN AFRIQUE : PAR UTILISATEUR FINAL, TCAC (2022-2029)
FIGURE 28 MARCHÉ DU SÉQUENÇAGE DE NOUVELLE GÉNÉRATION (NGS) AU MOYEN-ORIENT ET EN AFRIQUE : PAR UTILISATEUR FINAL, COURBE DE LIGNE DE VIE
FIGURE 29 MARCHÉ DU SÉQUENÇAGE DE NOUVELLE GÉNÉRATION (NGS) AU MOYEN-ORIENT ET EN AFRIQUE : INSTANTANÉ (2021)
FIGURE 30 MARCHÉ DU SÉQUENÇAGE DE NOUVELLE GÉNÉRATION (NGS) AU MOYEN-ORIENT ET EN AFRIQUE : PAR PAYS (2021)
FIGURE 31 MARCHÉ DU SÉQUENÇAGE DE NOUVELLE GÉNÉRATION (NGS) AU MOYEN-ORIENT ET EN AFRIQUE : PAR PAYS (2022 et 2029)
FIGURE 32 MARCHÉ DU SÉQUENÇAGE DE NOUVELLE GÉNÉRATION (NGS) AU MOYEN-ORIENT ET EN AFRIQUE : PAR PAYS (2021 et 2029)
FIGURE 33 MARCHÉ DU SÉQUENÇAGE DE NOUVELLE GÉNÉRATION (NGS) AU MOYEN-ORIENT ET EN AFRIQUE : PAR PRODUIT (2022-2029)
FIGURE 34 MARCHÉ DU SÉQUENÇAGE DE NOUVELLE GÉNÉRATION (NGS) AU MOYEN-ORIENT ET EN AFRIQUE : PART DE L'ENTREPRISE EN 2021 (%)
Méthodologie de recherche
La collecte de données et l'analyse de l'année de base sont effectuées à l'aide de modules de collecte de données avec des échantillons de grande taille. L'étape consiste à obtenir des informations sur le marché ou des données connexes via diverses sources et stratégies. Elle comprend l'examen et la planification à l'avance de toutes les données acquises dans le passé. Elle englobe également l'examen des incohérences d'informations observées dans différentes sources d'informations. Les données de marché sont analysées et estimées à l'aide de modèles statistiques et cohérents de marché. De plus, l'analyse des parts de marché et l'analyse des tendances clés sont les principaux facteurs de succès du rapport de marché. Pour en savoir plus, veuillez demander un appel d'analyste ou déposer votre demande.
La méthodologie de recherche clé utilisée par l'équipe de recherche DBMR est la triangulation des données qui implique l'exploration de données, l'analyse de l'impact des variables de données sur le marché et la validation primaire (expert du secteur). Les modèles de données incluent la grille de positionnement des fournisseurs, l'analyse de la chronologie du marché, l'aperçu et le guide du marché, la grille de positionnement des entreprises, l'analyse des brevets, l'analyse des prix, l'analyse des parts de marché des entreprises, les normes de mesure, l'analyse globale par rapport à l'analyse régionale et des parts des fournisseurs. Pour en savoir plus sur la méthodologie de recherche, envoyez une demande pour parler à nos experts du secteur.
Personnalisation disponible
Data Bridge Market Research est un leader de la recherche formative avancée. Nous sommes fiers de fournir à nos clients existants et nouveaux des données et des analyses qui correspondent à leurs objectifs. Le rapport peut être personnalisé pour inclure une analyse des tendances des prix des marques cibles, une compréhension du marché pour d'autres pays (demandez la liste des pays), des données sur les résultats des essais cliniques, une revue de la littérature, une analyse du marché des produits remis à neuf et de la base de produits. L'analyse du marché des concurrents cibles peut être analysée à partir d'une analyse basée sur la technologie jusqu'à des stratégies de portefeuille de marché. Nous pouvons ajouter autant de concurrents que vous le souhaitez, dans le format et le style de données que vous recherchez. Notre équipe d'analystes peut également vous fournir des données sous forme de fichiers Excel bruts, de tableaux croisés dynamiques (Fact book) ou peut vous aider à créer des présentations à partir des ensembles de données disponibles dans le rapport.

