Middle East And Africa Orthodontic Supplies Market
Taille du marché en milliards USD
TCAC :
% 
 USD
360.22 Million
USD
633.26 Million
2024
2032
USD
360.22 Million
USD
633.26 Million
2024
2032
| 2025 –2032 | |
| USD 360.22 Million | |
| USD 633.26 Million | |
| % | |
|
Marché des fournitures orthodontiques au Moyen-Orient et en Afrique, par type de produit (appareils orthodontiques amovibles, appareils orthodontiques fixes, adhésifs et accessoires), type de patient (enfants, adolescents et adultes), type de matériau (broches, arcs, aligneurs et dispositifs de contention), application (traitement des malocclusions, orthodontie corrective et orthodontie préventive), utilisateur final (cliniques dentaires, hôpitaux, instituts universitaires et de recherche), canal de distribution (appels d'offres directs, vente au détail et autres) - Tendances et prévisions du secteur jusqu'en 2032
Analyse du marché des fournitures orthodontiques au Moyen-Orient et en Afrique
Au Moyen-Orient et en Afrique, le marché des fournitures orthodontiques est un secteur en pleine expansion du secteur dentaire, axé sur les produits utilisés pour corriger les malpositions dentaires et les problèmes de mâchoire. Les principaux produits de ce marché comprennent les appareils orthodontiques traditionnels, les aligneurs transparents, les brackets, les fils, les bagues et les adhésifs. Cette croissance est portée par des facteurs tels qu'une sensibilisation accrue à la santé bucco-dentaire, une demande croissante de traitements esthétiques et les avancées technologiques en orthodontie, telles que l'impression 3D et les aligneurs sur mesure. L'Amérique du Nord et l'Europe dominent le marché grâce à des revenus disponibles élevés et à un accès généralisé aux soins orthodontiques. Cependant, les marchés émergents d'Asie-Pacifique et d'Amérique latine connaissent une croissance significative, alimentée par une meilleure accessibilité aux soins dentaires et une classe moyenne en pleine expansion. La préférence croissante pour des traitements moins visibles, tels que les aligneurs transparents, remodèle la dynamique du marché. Alors que l'esthétique et la santé dentaires deviennent une priorité au Moyen-Orient et en Afrique, le marché des fournitures orthodontiques est appelé à poursuivre son expansion grâce aux innovations technologiques constantes.
Taille du marché des fournitures orthodontiques au Moyen-Orient et en Afrique
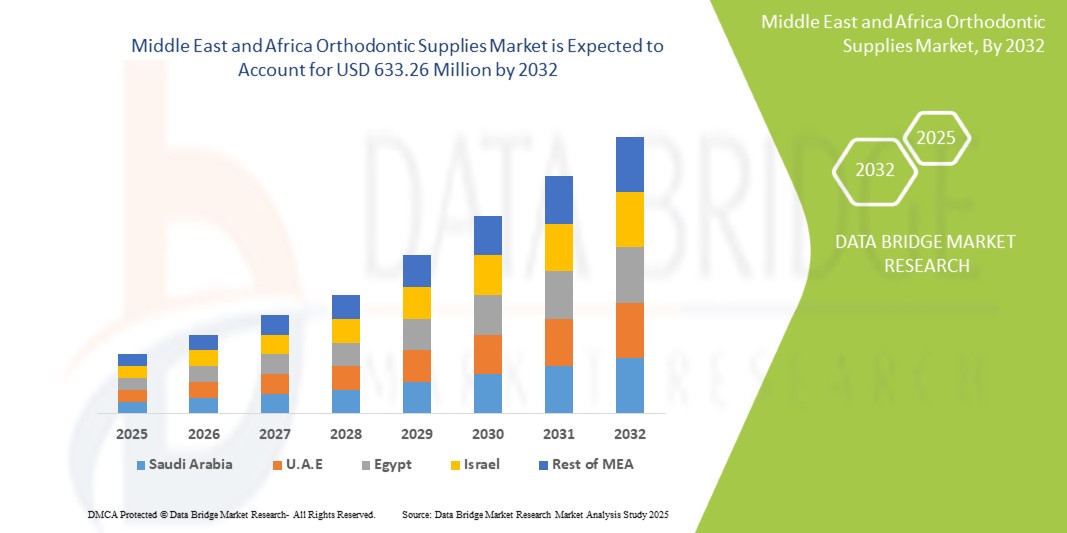
La taille du marché des fournitures orthodontiques au Moyen-Orient et en Afrique était évaluée à 360,22 millions USD en 2024 et devrait atteindre 633,26 millions USD d'ici 2032, avec un TCAC de 7,4 % au cours de la période de prévision de 2025 à 2032. Outre les informations sur les scénarios de marché tels que la valeur marchande, le taux de croissance, la segmentation, la couverture géographique et les principaux acteurs, les rapports de marché organisés par Data Bridge Market Research comprennent également une analyse des importations et des exportations, un aperçu de la capacité de production, une analyse de la consommation de production, une analyse des tendances des prix, un scénario de changement climatique, une analyse de la chaîne d'approvisionnement, une analyse de la chaîne de valeur, un aperçu des matières premières/consommables, des critères de sélection des fournisseurs, une analyse PESTLE, une analyse Porter et un cadre réglementaire.
Tendances du marché des fournitures orthodontiques au Moyen-Orient et en Afrique
« Demande croissante de traitements esthétiques »
Le marché de l'orthodontie au Moyen-Orient et en Afrique connaît une croissance soutenue, portée par les avancées technologiques, la demande croissante de solutions dentaires esthétiques et la sensibilisation croissante à la santé bucco-dentaire. Le marché devrait connaître une croissance significative, grâce à des innovations telles que les aligneurs transparents, les appareils orthodontiques autoligaturants et la planification de traitement basée sur l'IA qui gagnent en popularité. Ces avancées améliorent les résultats des traitements et renforcent la satisfaction des patients, en particulier chez les adultes en quête d'options discrètes. Au niveau régional, l'Asie-Pacifique connaît une forte croissance, les changements politiques dans des pays comme la Chine stimulant la demande. De plus, l'Amérique du Nord reste un acteur clé, bénéficiant d'une augmentation constante du nombre de patients et des progrès des matériaux orthodontiques. Cependant, des défis subsistent, tels que le coût élevé des traitements, les politiques de remboursement défavorables et le besoin d'innovation continue. Malgré ces obstacles, les perspectives globales du marché restent positives, car de plus en plus de consommateurs et de praticiens adoptent des solutions orthodontiques modernes.
Portée du rapport et segmentation du marché des fournitures orthodontiques au Moyen-Orient et en Afrique
|
Attributs |
Aperçu du marché des fournitures orthodontiques au Moyen-Orient et en Afrique |
|
Segments couverts |
|
|
Région couverte |
Afrique du Sud, Arabie saoudite, Émirats arabes unis, Égypte, Koweït, Israël, Qatar, Oman, Bahreïn et reste du Moyen-Orient et de l'Afrique |
|
Principaux acteurs du marché |
Ormco Corporation (États-Unis), 3M (États-Unis), American Orthodontics (États-Unis), Dentsply Sirona (États-Unis), Institut Straumann AG (Suisse), Aditek do Brasil SA (Brésil), DENTAURUM GmbH & Co. KG (Allemagne), FORESTADENT - Bernhard Foerster GmbH (Allemagne), G&H Orthodontics (États-Unis), Gestenco International AB (Suède), Great Lakes Dental Technologies (États-Unis), Henry Schein, Inc. (États-Unis), Leone SpA (Italie), LightForce (États-Unis), Modern Orthodontics (Inde), OrthoAmerica Holdings LLC. (États-Unis), Shinye Orthodontic Products Co., Ltd. (Chine) et TP Orthodontics, Inc (États-Unis). |
|
Opportunités de marché |
|
|
Ensembles d'informations de données à valeur ajoutée |
Outre les informations sur les scénarios de marché tels que la valeur marchande, le taux de croissance, la segmentation, la couverture géographique et les principaux acteurs, les rapports de marché organisés par Data Bridge Market Research comprennent également une analyse des importations et des exportations, un aperçu de la capacité de production, une analyse de la consommation de production, une analyse des tendances des prix, un scénario de changement climatique, une analyse de la chaîne d'approvisionnement, une analyse de la chaîne de valeur, un aperçu des matières premières/consommables, des critères de sélection des fournisseurs, une analyse PESTLE, une analyse Porter et un cadre réglementaire. |
Définition du marché des fournitures orthodontiques au Moyen-Orient et en Afrique
Les fournitures orthodontiques désignent les matériaux, outils et dispositifs utilisés lors des traitements orthodontiques pour diagnostiquer, prévenir et corriger les malpositions dentaires et les irrégularités de la mâchoire. Ces fournitures comprennent les appareils orthodontiques (en métal, en céramique, linguaux et transparents), les arcs, les bagues, les brackets, les appareils de contention, les adhésifs, les agents de liaison et les instruments orthodontiques. Elles jouent un rôle crucial dans l'efficacité et l'efficience des traitements orthodontiques, améliorant ainsi la fonction et l'esthétique des dents. Les fournitures orthodontiques sont largement utilisées par les orthodontistes et les professionnels dentaires dans les cliniques, les hôpitaux et les centres de soins dentaires spécialisés.
Dynamique du marché des fournitures orthodontiques au Moyen-Orient et en Afrique
Conducteurs
- Augmentation de l'incidence de la malocclusion
L'augmentation de la malocclusion au Moyen-Orient et en Afrique, une affection dentaire caractérisée par un mauvais alignement des dents, stimule considérablement la demande de traitements orthodontiques, notamment d'appareils dentaires et d'aligneurs transparents. Selon un récent rapport de Fact.MR, la prévalence croissante de la malocclusion est l'un des principaux facteurs de croissance du marché de l'orthodontie.
Alors que de plus en plus de personnes, notamment les enfants et les jeunes adultes, reçoivent un diagnostic de malocclusion, on prend de plus en plus conscience de son impact sur la santé bucco-dentaire et l'esthétique. Cette affection, qui peut entraîner des difficultés à mordre, à mastiquer et à parler, entraîne également des problèmes dentaires à long terme comme la carie et les maladies des gencives si elle n'est pas traitée. Ces complications, ainsi que l'importance croissante accordée à un sourire parfait, incitent de plus en plus de personnes à recourir à des traitements orthodontiques.
Ces dernières années, les préférences des consommateurs ont considérablement évolué, avec une préférence croissante pour des solutions orthodontiques plus discrètes, telles que les gouttières transparentes et les appareils dentaires en céramique. Grâce aux progrès technologiques, les traitements sont plus rapides, plus efficaces et moins visibles, ce qui a accru l'accessibilité des soins orthodontiques, stimulant ainsi la demande.
De plus, l'augmentation des revenus disponibles, notamment dans les économies émergentes, a rendu les traitements orthodontiques plus accessibles à une population plus large. Cette situation s'est accompagnée d'une multiplication des campagnes de sensibilisation à la santé bucco-dentaire dans divers pays, soulignant l'importance d'un diagnostic et d'un traitement précoces de la malocclusion.
Industry experts also point to innovations in orthodontic technology, such as 3D printing and AI-powered diagnostic tools, as factors enhancing the efficiency and affordability of orthodontic treatments. As orthodontic care becomes increasingly accessible and appealing, the demand for braces and aligners is set to continue its upward trajectory.
For instance,
- In July 2022, according to the article published by BioSpace, a rising incidence of malocclusion, contributing to higher demand for dental braces. As more individuals seek treatments to address misaligned teeth, this trend drives the orthodontic market, boosting the need for innovative dental braces and related products. Increased awareness and demand for corrective treatments support market growth
- In December 2024, according to the article published by MDPI, advancements in orthodontic treatments, particularly focusing on innovative approaches to improving patient care and outcomes. It highlights the role of new materials, technologies like 3D printing, and digital tools in enhancing the effectiveness of treatments. These innovations are expected to drive growth in the orthodontic market
The rising incidence of malocclusion is shaping the orthodontic market, driving demand for corrective treatments such as braces and clear aligners. With a growing focus on both health and aesthetics, this trend highlights a substantial opportunity for the Middle East & Africa dental industry, making orthodontic care more accessible to a wider population.
- Increasing Aesthetic Preferences
The growing focus on aesthetics, particularly among adults and adolescents, has significantly boosted the demand for orthodontic products. As societal norms continue to emphasize appearance, more individuals are seeking orthodontic treatments to achieve a more aesthetically pleasing smile. This heightened awareness has led to a surge in popularity for clear aligners, lingual braces, and ceramic options, all of which offer discreet and effective alternatives to traditional metal braces. Consumers are increasingly prioritizing treatments that are less visible and more aligned with their aesthetic preferences, prompting orthodontic manufacturers to innovate and expand their product offerings. This shift towards more visually appealing orthodontic solutions is reshaping the market, with greater emphasis on customization, comfort, and aesthetics. As a result, the demand for clear aligners and other cosmetic orthodontic products has escalated, creating new growth opportunities within the dental industry. Furthermore, the increasing availability of these options, alongside their effectiveness in providing optimal dental alignment, continues to drive the market forward, making orthodontic care more accessible and desirable for a broader range of individuals. This transformation is not only benefiting orthodontic practices but also accelerating the development of new technologies and materials, contributing to the overall expansion of the orthodontic products market.
For instance,
- In January 2023, according to the article published by BDJ, the growing awareness of aesthetics, especially among adults and adolescents, has led to an increased demand for orthodontic treatments. This shift is driving innovation in orthodontic supplies, particularly clear aligners and cosmetic braces, resulting in greater market diversification and expanding opportunities for dental professionals worldwide
- In August 2024, according to the article published by MDPI, the use of artificial intelligence (AI) to automate the aesthetic component (AC) of the Index of Orthodontic Treatment Need (IOTN). Analyzing 1,009 pre-treatment intraoral photos, the AI demonstrated 77% sensitivity and 82% accuracy in predicting treatment needs, indicating its potential to support clinical evaluations of dental aesthetics
The growing emphasis on aesthetics, particularly among adults and adolescents, has significantly influenced the demand for orthodontic treatments. As consumers prioritize appearance and seek more discreet and effective solutions, innovations in orthodontic products like clear aligners and cosmetic braces are becoming increasingly popular. This shift in consumer preferences not only shapes the development of new orthodontic technologies but also opens up opportunities for dental professionals to offer a wider range of personalized, aesthetically appealing treatments. The trend towards more visually acceptable options is expected to continue driving advancements in the orthodontic field
- Technological Advancements in Orthodontic Care
Recent innovations in orthodontic technologies are significantly reshaping the landscape of dental care, especially in the orthodontic sector. Technologies such as 3D printing, digital scanning, and improved materials have not only enhanced the accuracy and customization of treatments but also streamlined the entire process, making it more efficient. 3D printing allows for the precise creation of orthodontic appliances tailored to individual needs, reducing the time and cost involved in the production of traditional braces and aligners. Digital scanning has largely replaced traditional impressions, making the process more comfortable and accurate, while also providing faster results for treatment planning. Moreover, the development of advanced materials, such as high-performance ceramic brackets and more durable, flexible wires, has made treatments less visible, more comfortable, and quicker, ultimately improving the patient experience. These technological advancements are driving a surge in the demand for orthodontic care, as patients are increasingly attracted to the benefits of faster treatments, reduced discomfort, and more aesthetically pleasing options. The growing reliance on these innovations is not only attracting a wider audience, particularly among adults seeking cosmetic improvements, but also encouraging orthodontic professionals to adopt these technologies to remain competitive and provide optimal patient outcomes.
For instance,
- In February 2024, according to the article published by Momentum, article highlights five key advancements in dental technology for 2024, including AI-powered diagnostics, 3D printing, and innovative smart dental tools. It also discusses new product launches, such as advanced intraoral scanners and AI-based treatment planning systems, which are enhancing patient care by improving accuracy and overall dental experiences
- In January 2024, according to the article published by MDPI, 3D printing has become a key driver in clear aligner fabrication by enabling faster production, enhanced customization, and reduced costs. It allows for precise patient-specific aligners, improving comfort and treatment efficiency. This technology’s ability to streamline manufacturing and reduce material waste accelerates the growth of the orthodontics market
Technological innovations are playing a pivotal role in the evolution of orthodontic care. From enhanced treatment precision to reduced treatment time, advancements like 3D printing, digital scanning, and superior materials are elevating the quality and accessibility of orthodontic treatments. As these technologies continue to evolve, they are expected to further drive the demand for orthodontic services, making them more efficient, personalized, and appealing to a broader range of patients. This trend highlights the increasing importance of staying at the forefront of technological developments in the orthodontic industry.
Opportunity
- Growing Demand for Clear Aligners
The growing demand for clear aligners presents a substantial opportunity in the Middle East & Africa orthodontic supplies market, as these innovative devices continue to reshape the way orthodontic treatments are approached. Clear aligners, such as Invisalign, have witnessed a significant surge in popularity due to their aesthetic, comfort, and convenience advantages over traditional metal braces. The shift toward clear aligners is driven largely by patient preference for discreet, nearly invisible orthodontic solutions, particularly among adults and image-conscious teenagers who wish to undergo treatment without the visibility of metal brackets and wires. As a result, the market for clear aligners has expanded rapidly, creating a lucrative opportunity for manufacturers, suppliers, and orthodontic professionals to meet the increasing demand for these customized, transparent devices. Advancements in technology, particularly 3D scanning and digital treatment planning, have further fueled this growth, allowing for the creation of highly precise, personalized aligners that improve the overall treatment experience. The ability of clear aligners to be removed for eating, drinking, and oral hygiene is another key factor driving their popularity, as it provides patients with greater flexibility and convenience compared to traditional braces. In addition, as clear aligner technology evolves, it is becoming increasingly effective in treating a broader range of orthodontic issues, from mild to complex misalignments, which has expanded the target demographic and opened new avenues for growth. Clear aligners also offer the appeal of faster treatment times compared to traditional methods, another selling point for patients looking for quicker results. As the market for clear aligners continues to grow, there is a corresponding surge in demand for the supporting products and services that enable their successful use—such as 3D scanning devices, aligner production materials, treatment management software, and patient monitoring tools. This creates a robust market opportunity for orthodontic suppliers to not only focus on the aligners themselves but also develop and distribute complementary technologies and accessories that support clear aligner treatments. The rising popularity of direct-to-consumer clear aligner brands, alongside increasing awareness of the benefits of clear aligners, further strengthens the market, pushing for more investment in research, development, and distribution channels. The growing Middle East & Africa preference for clear aligners marks a dynamic shift in the orthodontic industry, positioning it for sustained growth, where innovative product offerings and advancements in treatment technology present substantial opportunities for key stakeholders in the Middle East & Africa orthodontic supplies market.
For instance,
- In April 2023, according to the article published by science direct the growing demand for clear aligners (CAT) in orthodontics stems from advancements in biomaterials, CAD/CAM technologies, and aggressive marketing strategies. Direct-to-consumer advertising and social media have raised awareness, particularly among adult patients seeking aesthetic alternatives to traditional fixed appliances, contributing to CAT's increasing popularity over the past decade
- In June 2020, according to the article published by ResearchGate, the growing demand for clear aligners is driven by advancements that enhance comfort and aesthetics in orthodontic treatment. As more manufacturers enter the market, patient interest in clear aligners rises. Success depends on clinicians' expertise, proper case selection, and patient adherence, creating an expanding opportunity in orthodontics
In conclusion, the growing demand for clear aligners presents a significant opportunity in the Middle East & Africa orthodontic supplies market. As patients seek discreet, comfortable, and effective treatments, clear aligners are increasingly favored over traditional braces. Technological advancements have expanded their applicability and appeal, driving further market growth. This trend creates opportunities for orthodontic suppliers to innovate and offer complementary products, positioning them to meet the rising Middle East & Africa demand for clear aligners and related technologies.
- Increased Insurance Coverage for Orthodontics
L'augmentation de la couverture d'assurance pour l'orthodontie représente une opportunité majeure pour le marché des fournitures orthodontiques au Moyen-Orient et en Afrique, car elle ouvre la voie à une clientèle plus large et plus diversifiée, qui peut désormais accéder à des traitements orthodontiques qu'elle n'aurait peut-être pas pu se permettre autrement. Ces dernières années, les assureurs ont de plus en plus tendance à étendre leur couverture pour les traitements orthodontiques, incluant les appareils orthodontiques traditionnels et les nouvelles options comme les aligneurs transparents. Cette évolution est largement due à une meilleure prise en compte des bienfaits à long terme de l'orthodontie pour la santé, tels qu'une meilleure hygiène bucco-dentaire, la prévention des caries et une meilleure fonction dentaire globale. Par conséquent, davantage de patients peuvent désormais se faire soigner, ce qui entraîne une forte demande d'appareils, d'outils et de produits orthodontiques. L'élargissement de la couverture d'assurance réduit non seulement les obstacles financiers pour les patients, mais augmente également le nombre de personnes souhaitant bénéficier de soins orthodontiques, créant ainsi un marché plus vaste pour les fournisseurs de produits orthodontiques. Cette tendance est particulièrement marquée dans les régions où les traitements orthodontiques étaient auparavant considérés comme un luxe ou inaccessibles pour beaucoup. Les assureurs prenant de plus en plus en charge une partie, voire la totalité, des traitements orthodontiques, de plus en plus de personnes sont susceptibles d'opter pour des solutions avancées telles que les aligneurs transparents, les appareils orthodontiques en céramique et autres technologies orthodontiques innovantes. Cette accessibilité croissante offre aux fabricants et aux fournisseurs une opportunité unique d'élargir leur offre et de s'adresser à une clientèle plus large et plus diversifiée. De plus, face à la demande croissante de traitements orthodontiques, les cabinets et les fournisseurs d'orthodontie devront s'adapter en proposant des solutions plus abordables et compatibles avec les assurances afin de répondre aux besoins des patients assurés. L'extension de la couverture d'assurance pour l'orthodontie constitue donc un facteur clé de croissance du marché des fournitures orthodontiques au Moyen-Orient et en Afrique, ce qui en fait un secteur clé pour l'investissement et l'innovation.
Par exemple,
- En août 2022, selon un article publié par le NCBI, faciliter l'accès aux soins et encourager les dépenses plus élevées. Des études révèlent que les assurances, comme Medicaid, augmentent la probabilité de visites chez le dentiste, en particulier chez les personnes à faibles revenus. L'élargissement de la couverture pourrait favoriser le recours aux services d'orthodontie et améliorer la santé bucco-dentaire.
- En mai 2021, selon un article publié par le NCBI, l'accès à l'orthodontie offre une opportunité d'améliorer l'accessibilité aux soins. Si les régimes d'assurance privés varient, une couverture plus élevée peut encourager davantage de consultations et des dépenses plus importantes. Des régimes comme Delta Dental, proposant des options allant du ticket modérateur à la couverture partielle, offrent une flexibilité accrue et améliorent les possibilités de traitement pour les personnes souhaitant bénéficier de services orthodontiques.
En conclusion, l'augmentation de la couverture d'assurance pour l'orthodontie crée d'importantes opportunités de croissance sur le marché des fournitures orthodontiques au Moyen-Orient et en Afrique. À mesure que de plus en plus de patients accèdent à des traitements abordables, la demande de solutions orthodontiques avancées, notamment d'aligneurs transparents et d'appareils sur mesure, augmente. Cette tendance encourage l'innovation et le développement, au bénéfice des fournisseurs comme des patients du monde entier.
Contraintes/Défi
- Exigences réglementaires en orthodontie
Les exigences réglementaires en orthodontie jouent un rôle essentiel pour garantir la sécurité des patients et l'efficacité des traitements, mais elles représentent également des défis importants pour les fabricants. Le respect de ces normes nécessite souvent des investissements importants dans les tests de produits, les processus d'assurance qualité, les certifications et les audits réguliers. Ces mesures de conformité peuvent être longues et coûteuses, en particulier pour les petites et moyennes entreprises, car elles peuvent devoir allouer des ressources pour mettre à jour la conception des produits, mener des essais et respecter des protocoles de sécurité spécifiques. De plus, les fabricants doivent s'adapter à l'évolution de la réglementation, ce qui peut entraîner des ajustements coûteux des processus de fabrication et des gammes de produits. Ces normes strictes peuvent également ralentir la mise sur le marché de nouvelles technologies, telles que des matériaux ou des dispositifs de traitement innovants. Dans certains cas, les retards réglementaires peuvent freiner l'adoption de traitements de pointe, affectant à la fois les patients et les orthodontistes en quête de solutions innovantes pour répondre à leurs besoins. Ainsi, si ces exigences réglementaires sont essentielles pour garantir les normes de soins les plus élevées, elles constituent également un frein à la croissance du marché et à l'innovation dans ce domaine.
Par exemple,
- En juin 2024, selon un article publié par Scientific Research, les exigences réglementaires en orthodontie peuvent freiner la croissance du marché en raison de la longueur des processus d'approbation, des évaluations de sécurité et des coûts de conformité élevés. Les disparités régionales en matière de réglementation constituent également des défis pour les fabricants. Ces obstacles peuvent freiner l'innovation et limiter l'accès aux produits orthodontiques avancés, tout en garantissant la sécurité des patients et l'efficacité des traitements.
- En juillet 2023, selon l'article publié par ResearchGate, l'étude souligne que les exigences réglementaires en orthodontie créent souvent des obstacles à l'adoption de technologies innovantes par les orthodontistes. Ces défis incluent des processus d'approbation longs, le respect de normes de sécurité strictes et la complexité de la gestion des réglementations locales et internationales. De tels obstacles peuvent retarder la disponibilité de nouveaux traitements et augmenter les coûts pour les praticiens comme pour les patients.
En conclusion, la conformité réglementaire, bien qu'essentielle au maintien de la sécurité et de l'efficacité, pose des défis importants aux fabricants du secteur orthodontique. Les coûts et les délais liés au respect des normes réglementaires peuvent freiner l'innovation, augmenter le coût des traitements et, à terme, limiter l'accès aux dernières technologies orthodontiques, tant pour les patients que pour les professionnels de santé.
- Manque de sensibilisation aux fournitures orthodontiques
Dans diverses régions, l'adoption de fournitures et de traitements orthodontiques peut être considérablement freinée par un manque de sensibilisation. Nombreux sont ceux qui ignorent les avantages des traitements orthodontiques, tels que l'amélioration de la santé bucco-dentaire, le renforcement de l'estime de soi et la prévention de problèmes dentaires plus graves. De plus, la compréhension des technologies orthodontiques modernes, telles que les gouttières transparentes, les dispositifs d'ancrage squelettique temporaires (TSAD) et les appareils orthodontiques avancés, est souvent limitée à quelques professionnels et patients déjà impliqués dans les soins orthodontiques. Sans une connaissance approfondie, les patients potentiels peuvent ne pas reconnaître la nécessité d'une intervention orthodontique, surtout s'ils ne présentent pas de problèmes dentaires évidents. Cette situation peut être aggravée par des idées fausses ou des informations erronées sur le processus de traitement, les coûts ou l'inconfort ressenti, ce qui conduit les patients à négliger complètement les soins orthodontiques.
De plus, les régions où l'accès aux professionnels dentaires ou aux soins spécialisés est plus limité sont plus susceptibles de connaître ce manque de sensibilisation. Dans ces régions, les soins dentaires peuvent se concentrer davantage sur les besoins urgents et immédiats plutôt que sur les traitements préventifs ou facultatifs comme l'orthodontie. De plus, des facteurs culturels et des contraintes financières peuvent contribuer à une faible demande pour ces services, les individus pouvant privilégier d'autres problèmes de santé aux procédures orthodontiques. Le manque d'information généralisée sur les bénéfices à long terme de l'orthodontie, comme la prévention des caries, des maladies des gencives et d'autres problèmes liés à l'occlusion, joue également un rôle important. Par conséquent, les patients potentiels de ces régions sont moins susceptibles de consulter un orthodontiste ou d'investir dans des produits orthodontiques.
Le manque de sensibilisation peut également nuire à la croissance du marché en limitant la demande de produits et services orthodontiques. Les entreprises qui fournissent des fournitures orthodontiques peuvent avoir du mal à se développer dans les régions où la demande est faible et peuvent avoir du mal à sensibiliser le public et les professionnels dentaires à l'importance d'investir dans les soins orthodontiques. Cela peut réduire le potentiel de vente global des fournitures orthodontiques, car le public peut ne pas se rendre compte de la valeur de ces produits pour une meilleure santé bucco-dentaire et une meilleure esthétique. Ce manque de sensibilisation freine finalement la croissance et le développement du marché orthodontique, en particulier dans les régions où les avantages des soins orthodontiques sont peu reconnus.
Par exemple,
- En juin 2024, selon un article publié par ResearchGate, l'étude souligne que la méconnaissance des applications orthodontiques pour smartphones par les patients freine leur adoption. Nombreux sont ceux qui ignorent la disponibilité et les avantages de ces applications, pourtant pratiques et efficaces pour les soins orthodontiques. Ce manque de connaissances réduit le marché potentiel et l'utilisation.
- En septembre 2024, un article publié par BDJ aborde les défis des soins orthodontiques, soulignant que la connaissance limitée des techniques et technologies avancées peut constituer un frein. Le manque de sensibilisation des patients et des praticiens aux nouvelles options thérapeutiques ou à leurs avantages peut freiner leur adoption, limitant ainsi les progrès et la croissance du secteur orthodontique.
En conclusion, le manque de sensibilisation aux avantages et à l'importance des fournitures orthodontiques limite considérablement le potentiel de croissance du marché, notamment dans les régions mal informées. En comblant ce manque de sensibilisation par l'éducation, des programmes de sensibilisation et des initiatives communautaires, il est possible d'accroître la demande de soins orthodontiques, stimulant ainsi l'adoption et la croissance du marché. Mieux faire comprendre au public les avantages à long terme de l'orthodontie est essentiel pour stimuler l'expansion du marché et garantir l'accès aux soins dont les individus de toutes les régions.
Portée du marché des fournitures orthodontiques au Moyen-Orient et en Afrique
Le marché des fournitures orthodontiques au Moyen-Orient et en Afrique est segmenté en six segments clés, selon le type de produit, le type de patient, le type de matériau, l'application, l'utilisateur final et le canal de distribution. La croissance de ces segments vous permettra d'analyser les segments à faible croissance du secteur et de fournir aux utilisateurs une vue d'ensemble et des informations précieuses sur le marché, facilitant ainsi la prise de décisions stratégiques pour identifier les applications clés du marché.
Type de produit
- Appareils orthodontiques amovibles
- Aligneurs transparents
- Dispositifs de retenue
- Dispositifs de retenue formés sous vide
- Dispositifs de retenue Hawley
- Appareils orthodontiques fixes
- Supports
- Par type
- supports métalliques
- Brackets en céramique
- Brackets autoligaturants
- Crochets linguaux
- Par type
- Supports
- Par type
- Bagues et tubes buccaux
- Mini-vis
- Par type
- Fils d'arc
- Arcs en acier inoxydable
- Arcs en titane bêta
- Arcs en nickel-titane
- Appareils d'ancrage
- Supports
- Adhésifs et accessoires
- Produits élastomères
- Par type de produit
- Ligatures élastomères
- Chaînes élastomères
- Par type de produit
- Adhésifs orthodontiques
- Autres
- Produits élastomères
Type de patient
- Enfants et adolescents
- Adultes
Type de matériau
- Supports
- Métal
- Céramique
- Plastique
- Composite
- Arc
- Arcs en acier inoxydable
- Arcs en titane bêta
- Arcs en nickel-titane
- Aligneur et dispositifs de retenue
- Thermoplastiques
- Polyuréthane
- Polyéthylène téréphtalate glycol
- Autres
Application
- Traitement de la malocclusion
- Malocclusion de classe I
- Malocclusion de classe II
- Malocclusion de classe III
- Orthodontie corrective
- Orthodontie préventive
Utilisateur final
- Cliniques dentaires
- Hôpitaux
- Instituts universitaires et de recherche
Canal de distribution
- Appels d'offres directs
- Ventes au détail
- Autres
Analyse régionale du marché des fournitures orthodontiques au Moyen-Orient et en Afrique
The Middle East & Africa orthodontic supplies market is analyzed and market size insights and trends are provided country, product type, patient type, material type, application, end user, and distribution channel as referenced above.
The countries covered in the market are South Africa, Saudi Arabia, U.A.E, Egypt, Kuwait, Israel, Qatar, Oman, Bahrain, and rest of Middle East & Africa.
South Africa is the dominating country in the Middle East & Africa Orthodontic Supplies market, owing to advanced healthcare infrastructure, rising awareness & demand for aesthetic dentistry, high prevalence of malocclusion, and availability of orthodontic products.
Saudi Arabia is the fastest growing country in the Middle East & Africa Orthodontic Supplies market, owing to several key factors. The rising awareness of orthodontic treatments has led to increased demand for braces, clear aligners, and other orthodontic solutions. The country has a growing young population, which is more likely to seek orthodontic treatments for both cosmetic and functional reasons. Additionally, increasing disposable income and an improving economy have made orthodontic care more affordable and accessible.
The country section of the report also provides individual market impacting factors and changes in regulation in the market domestically that impacts the current and future trends of the market. Data points like down-stream and upstream value chain analysis, technical trends and porter's five forces analysis, case studies are some of the pointers used to forecast the market scenario for individual countries. Also, the presence and availability of Middle East & Africa brands and their challenges faced due to large or scarce competition from local and domestic brands, impact of domestic tariffs and trade routes are considered while providing forecast analysis of the country data.
Middle East & Africa Orthodontic Supplies Market Share
The market competitive landscape provides details by competitor. Details included are company overview, company financials, revenue generated, market potential, investment in research and development, new market initiatives, Middle East & Africa presence, production sites and facilities, production capacities, company strengths and weaknesses, product launch, product width and breadth, application dominance. The above data points provided are only related to the companies' focus related to market.
Middle East & Africa Orthodontic Supplies Market Leaders Operating in the Market Are:
- Ormco Corporation (U.S.)
- 3M (U.S.)
- American Orthodontics (U.S.)
- Dentsply Sirona (U.S.)
- Institut Straumann AG (Switzerland)
- Aditek do Brasil S.A. (Brazil)
- DENTAURUM GmbH & Co. KG (Germany)
- FORESTADENT - Bernhard Foerster GmbH (Germany)
- G&H Orthodontics (U.S.)
- Gestenco International AB (Sweden)
- Great Lakes Dental Technologies (U.S.)
Latest Developments Middle East & Africa Orthodontic Supplies Market
- En mai 2022, le groupe Straumann a conclu un accord pour l'acquisition de PlusDental, fournisseur de solutions de traitement orthodontique en Europe. Cette acquisition renforcera l'expertise client du groupe et ouvrira de nouvelles perspectives de croissance. PlusDental a établi un vaste réseau de cliniques à travers l'Europe, ce qui contribuera à accélérer son expansion, notamment aux Pays-Bas, en Suède et au Royaume-Uni.
- En août 2022, Dentsply Sirona a lancé le moteur endodontique X-Smart Pro+ et la lime Reciproc Blue aux États-Unis, offrant ainsi une solution endodontique simplifiée à lime unique. Le moteur X-Smart Pro+ délivre un couple allant jusqu'à 7,5 N·cm et une vitesse de rotation de 3 000 tr/min. Il est équipé d'un localisateur d'apex intégré avec technologie Dynamic Accuracy pour une mesure précise de la longueur pendant la mise en forme active. La lime Reciproc Blue est conçue pour une utilisation universelle, permettant la préparation canalaire sans nécessiter de plan de glissement initial dans la plupart des cas. Cette combinaison simplifie les procédures endodontiques, améliorant ainsi l'efficacité et les résultats pour les patients.
- En août 2023, Ormco Corporation a lancé la version 14 de Spark Clear Aligners, améliorant la flexibilité des orthodontistes grâce au lancement de Spark Approver Web et à l'intégration transparente de DEXIS iOS, ainsi qu'aux mises à jour cliniques et de flux de travail. Spark Approver Web offre une plus grande commodité, permettant aux orthodontistes d'accéder aux dossiers à tout moment, ce qui leur fait gagner un temps précieux et améliore l'efficacité de leurs flux de travail.
- En mars 2023, FORESTADENT s'est associé à Graphy Inc. pour distribuer sa résine innovante Tera Harz TC-85 destinée à l'impression directe d'aligneurs. Cette collaboration permet la création d'aligneurs sur mesure, dotés de propriétés de mémoire de forme, améliorant ainsi les résultats du traitement grâce à des forces lumineuses constantes. Ce partenariat inclut également la technologie UNIZ pour les imprimantes 3D compatibles, faisant progresser l'orthodontie numérique au Moyen-Orient et en Afrique.
- En août 2024, Henry Schein Orthodontics a lancé l'appareil Carrierer Motion Pro Bite, conçu pour optimiser les traitements orthodontiques en améliorant la correction de l'occlusion et l'efficacité du mouvement dentaire. Cet appareil innovant offre des résultats plus prévisibles en délivrant une force optimale pour corriger les malpositions d'occlusion. Sa conception unique permet de raccourcir la durée du traitement, de réduire l'inconfort et d'améliorer l'observance du traitement. Le Carrierer Motion Pro Bite est un outil précieux pour les orthodontistes, offrant une précision et une efficacité accrues. Il offre également aux patients des traitements plus rapides et plus confortables, contribuant ainsi à une meilleure prise en charge orthodontique et à un taux de réussite plus élevé.
SKU-
Accédez en ligne au rapport sur le premier cloud mondial de veille économique

- Tableau de bord d'analyse de données interactif
- Tableau de bord d'analyse d'entreprise pour les opportunités à fort potentiel de croissance
- Accès d'analyste de recherche pour la personnalisation et les requêtes
- Analyse de la concurrence avec tableau de bord interactif
- Dernières actualités, mises à jour et analyse des tendances
- Exploitez la puissance de l'analyse comparative pour un suivi complet de la concurrence
Table des matières
1 INTRODUCTION
1.1 OBJECTIFS DE L'ÉTUDE
1.2 DÉFINITION DU MARCHÉ
1.3 APERÇU DU MARCHÉ DES FOURNITURES ORTHODONTIQUES AU MOYEN-ORIENT ET EN AFRIQUE
1.4 MONNAIE ET TARIFS
1.5 LIMITATIONS
1.6 MARCHÉS COUVERTS
2 SEGMENTATION DU MARCHÉ
2.1 MARCHÉS COUVERTS
2.2 PORTÉE GÉOGRAPHIQUE
2,3 ANS CONSIDÉRÉS POUR L'ÉTUDE
2.4 MODÈLE DE VALIDATION DES DONNÉES DU TRÉPIED DBMR
2.5 MODÉLISATION MULTIVARIÉE
2.6 COURBE DE LA LIGNE DE VIE
2.7 ENTRETIENS PRIMAIRES AVEC DES LEADERS D'OPINION CLÉS
2.8 GRILLE DE POSITIONNEMENT DU MARCHÉ DBMR
2.9 POSITIONNEMENT SUR LE MARCHÉ DBMR COUVERTURE DES UTILISATEURS FINAUX
2.1 ANALYSE DE LA PART DES FOURNISSEURS
2.11 SOURCES SECONDAIRES
2.12 HYPOTHÈSES
3 RÉSUMÉ EXÉCUTIF
4 INFORMATIONS PREMIUM
4.1 LES CINQ FORCES DE PORTER
4.2 ANALYSE PESTEL
4.3 ANALYSE DE LA CHAÎNE DE VALEUR
4.4 ANALYSE COMPARATIVE DES ENTREPRISES
4.5 ÉVALUATION DES MODÈLES DE VENTE AU DÉTAIL PAR RAPPORT AUX MODÈLES DE VENTE PAR DISTRIBUTEUR ET DES STRATÉGIES DE VENTE DIRECTE
5 MARCHÉ DES FOURNITURES ORTHODONTIQUES AU MOYEN-ORIENT ET EN AFRIQUE : RÉGLEMENTATION
5.1.1 AMÉRIQUE DU NORD (ÉTATS-UNIS ET CANADA)
5.1.2 UNION EUROPÉENNE (UE)
5.1.3 ASIE-PACIFIQUE
5.1.4 AMÉRIQUE LATINE
5.1.5 MOYEN-ORIENT ET AFRIQUE
5.2 DÉFIS ET STRATÉGIES RÉGLEMENTAIRES
6 APERÇU DU MARCHÉ
6.1 PILOTES
6.1.1 L'INCIDENCE AUGMENTANTE DE LA MALOCCLUSION PROVOQUE UNE HAUSSE DE LA DEMANDE D'APPAREILS DENTAIRES
6.1.2 L'AUGMENTATION DES PRÉFÉRENCES ESTHÉTIQUES STIMULE LA DEMANDE DE PRODUITS ORTHODONTIQUES
6.1.3 LES PROGRÈS TECHNOLOGIQUES FAVORISENT LA CROISSANCE DES SOINS ORTHODONTIQUES
6.1.4 AUGMENTATION DES DÉPENSES EN SOINS DENTAIRES
6.2 RESTRICTIONS
6.2.1 EXIGENCES RÉGLEMENTAIRES EN ORTHODONTIE
6.2.2 MANQUE DE SENSIBILISATION AUX FOURNITURES ORTHODONTIQUES
6.3 OPPORTUNITÉS
6.3.1 LA DEMANDE CROISSANTE D'ALIGNEURS TRANSPARENTS STIMULE LA CROISSANCE DES FOURNITURES ORTHODONTIQUES
6.3.2 L'AUGMENTATION DE LA COUVERTURE D'ASSURANCE POUR L'ORTHODONTIE ÉLARGIT LES OPPORTUNITÉS DANS LE DOMAINE DES FOURNITURES ORTHODONTIQUES
6.3.3 LA PERSONNALISATION ET LA PERSONNALISATION DES TRAITEMENTS AMÉLIORENT LA DEMANDE DU MARCHÉ DES FOURNITURES ORTHODONTIQUES
6.4 DÉFIS
6.4.1 LES EFFETS INDÉSIRABLES D'UN MAUVAISE TRAITEMENT ENTRAVENT LES PROGRÈS EN ORTHODONTIE
6.4.2 LA PÉNURIE DE PROFESSIONNELS QUALIFIÉS LIMITE LES PROGRÈS DANS LE DOMAINE DE L'ORTHODONTIQUE
7 MARCHÉ DES FOURNITURES ORTHODONTIQUES AU MOYEN-ORIENT ET EN AFRIQUE, PAR TYPE DE PRODUIT
7.1 APERÇU
7.2 APPAREILS ORTHODONTIQUES AMOVIBLES
7.2.1 ALIGNEURS TRANSPARENTS
7.2.2 RETENUES
7.2.2.1 RETENUES FORMÉES SOUS VIDE ET
7.2.2.2 RETENUES HAWLEY
7.3 APPAREILS ORTHODONTIQUES FIXES
7.3.1 SUPPORTS
7.3.1.1 SUPPORTS MÉTALLIQUES
7.3.1.2 SUPPORTS EN CÉRAMIQUE
7.3.1.3 BRACKETS AUTO-LIGATURANTS
7.3.1.4 PARENTHÈSES LINGUALES
7.3.1.4.1 BANDES ET TUBES BUCCAUX
7.3.1.4.2 MINIVIS
7.3.2 ARCS
7.3.2.1 ARCS EN ACIER INOXYDABLE
7.3.2.2 ARCHES EN TITANE BETA
7.3.2.3 ARCHES EN NICKEL-TITANE
7.3.3 APPAREILS D'ANCRAGE
7.3.4 AUTRES
7.4 ADHÉSIFS ET ACCESSOIRES
7.4.1 PRODUITS ÉLASTOMÈRES
7.4.1.1 LIGATURES ÉLASTOMÈRES
7.4.1.2 CHAÎNES ÉLASTOMÈRES
7.4.2 ADHÉSIFS ORTHODONTIQUES
7.4.3 AUTRES
8 MARCHÉ DES FOURNITURES ORTHODONTIQUES AU MOYEN-ORIENT ET EN AFRIQUE, PAR TYPE DE PATIENT
8.1 APERÇU
8.2 ENFANTS ET ADOLESCENTS
8.3 ADULTES
9 MARCHÉ DES FOURNITURES ORTHODONTIQUES AU MOYEN-ORIENT ET EN AFRIQUE, PAR TYPE DE MATÉRIAU
9.1 APERÇU
9.2 SUPPORTS
9.2.1 MÉTAL
9.2.2 CÉRAMIQUE
9.2.3 PLASTIQUE
9.2.4 COMPOSITE
9.3 ARC
9.3.1 ARCS EN ACIER INOXYDABLE
9.3.2 ARCS EN TITANE BÊTA
9.3.3 ARCHES EN NICKEL-TITANE
9.4 ALIGNEUR ET DISPOSITIFS DE RETENUE
9.4.1 THERMOPLASTIQUES
9.4.2 POLYURÉTHANE
9.4.3 POLYÉTHYLÈNE TÉRÉPHTALATE GLYCOL
9.4.4 AUTRES
10 MARCHÉS DES FOURNITURES ORTHODONTIQUES AU MOYEN-ORIENT ET EN AFRIQUE, PAR APPLICATION
10.1 APERÇU
10.2 TRAITEMENT DE LA MALOCCLUSION
10.2.1 MALOCCLUSION DE CLASSE I
10.2.2 MALOCCLUSION DE CLASSE II
10.2.3 MALOCCLUSION DE CLASSE III
10.3 ORTHODONTIE CORRECTRICE
10.4 ORTHODONTIE PRÉVENTIVE
11 MARCHÉ DES FOURNITURES ORTHODONTIQUES AU MOYEN-ORIENT ET EN AFRIQUE, PAR UTILISATEUR FINAL
11.1 APERÇU
11.2 CLINIQUES DENTAIRES
11.3 HÔPITAUX
11.4 INSTITUTS UNIVERSITAIRES ET DE RECHERCHE
12 MARCHÉ DES FOURNITURES ORTHODONTIQUES AU MOYEN-ORIENT ET EN AFRIQUE, PAR CANAL DE DISTRIBUTION
12.1 APERÇU
12.2 APPELS D'OFFRES DIRECTS
12.3 VENTES AU DÉTAIL
12.4 OTHERS
13 MIDDLE EAST AND AFRICA ORTHODONTIC SUPPLIES MARKET, BY REGION
13.1 MIDDLE EAST AND AFRICA
13.1.1 SOUTH AFRICA
13.1.2 SOUTH ARABIA
13.1.3 U.A.E
13.1.4 EGYPT
13.1.5 ISRAEL
13.1.6 KUWAIT
13.1.7 QATAR
13.1.8 OMAN
13.1.9 BAHRAIN
13.1.10 REST OF MIDDLE EAST AND AFRICA
14 MIDDLE EAST AND AFRICA ORTHODONTIC SUPPLIES MARKET: COMPANY LANDSCAPE
14.1 COMPANY SHARE ANALYSIS: MIDDLE EAST AND AFRICA
15 SWOT ANALYSIS
16 COMPANY PROFILE
16.1 INSTITUT STRAUMANN AG
16.1.1 COMPANY SNAPSHOT
16.1.2 REVENUE ANALYSIS
16.1.3 COMPANY SHARE ANALYSIS
16.1.4 PRODUCT PORTFOLIO
16.1.5 RECENT DEVELOPMENTS
16.2 3M
16.2.1 COMPANY SNAPSHOT
16.2.2 REVENUE ANALYSIS
16.2.3 COMPANY SHARE ANALYSIS
16.2.4 PRODUCT PORTFOLIO
16.2.5 RECENT DEVELOPMENT
16.3 DENTSPLY SIRONA
16.3.1 COMPANY SNAPSHOT
16.3.2 REVENUE ANALYSIS
16.3.3 COMPANY SHARE ANALYSIS
16.3.4 PRODUCT PORTFOLIO
16.3.5 RECENT DEVELOPMENT
16.4 ORMCO CORPORATION
16.4.1 COMPANY SNAPSHOT
16.4.2 COMPANY SHARE ANALYSIS
16.4.3 PRODUCT PORTFOLIO
16.4.4 RECENT DEVELOPMENTS
16.5 AMERICAN ORTHODONTICS
16.5.1 COMPANY SNAPSHOT
16.5.2 COMPANY SHARE ANALYSIS
16.5.3 PRODUCT PORTFOLIO
16.5.4 RECENT DEVELOPMENTS
16.6 ADITEK DO BRASIL S.A.
16.6.1 COMPANY SNAPSHOT
16.6.2 PRODUCT PORTFOLIO
16.6.3 RECENT DEVELOPMENT
16.7 DENTAURUM GMBH & CO. KG
16.7.1 COMPANY SNAPSHOT
16.7.2 PRODUCT PORTFOLIO
16.7.3 RECENT DEVELOPMENT
16.8 FORESTADENT BERNHARD FÖRSTER GM
16.8.1 COMPANY SNAPSHOT
16.8.2 PRODUCT PORTFOLIO
16.8.3 RECENT DEVELOPMENT
16.9 GESTENCO INTERNATIONAL AB
16.9.1 COMPANY SNAPSHOT
16.9.2 PRODUCT PORTFOLIO
16.9.3 RECENT DEVELOPMENT
16.1 G&H ORTHODONTICS
16.10.1 COMPANY SNAPSHOT
16.10.2 PRODUCT PORTFOLIO
16.10.3 RECENT DEVELOPMENT
16.11 GREAT LAKES DENTAL TECHNOLOGIES
16.11.1 COMPANY SNAPSHOT
16.11.2 PRODUCT PORTFOLIO
16.11.3 RECENT DEVELOPMENT
16.12 HENRY SCHEIN, INC
16.12.1 COMPANY SNAPSHOT
16.12.2 REVENUE ANALYSIS
16.12.3 PRODUCT PORTFOLIO
16.12.4 RECENT DEVELOPMENT
16.13 LEONE S.P.A
16.13.1 COMPANY SNAPSHOT
16.13.2 PRODUCT PORTFOLIO
16.13.3 RECENT DEVELOPMENT
16.14 LIGHTFORCE
16.14.1 COMPANY SNAPSHOT
16.14.2 PRODUCT PORTFOLIO
16.14.3 RECENT DEVELOPMENT
16.15 MODERN ORTHODONTICS
16.15.1 COMPANY SNAPSHOT
16.15.2 PRODUCT PORTFOLIO
16.15.3 RECENT DEVELOPMENT
16.16 ORTHOAMERICA HOLDINGS LLC
16.16.1 COMPANY SNAPSHOT
16.16.2 PRODUCT PORTFOLIO
16.16.3 RECENT DEVELOPMENT
16.17 SHINYE ORTHODONTIC PRODUCTS CO.,LTD.
16.17.1 COMPANY SNAPSHOT
16.17.2 PRODUCT PORTFOLIO
16.17.3 RECENT DEVELOPMENT
16.18 TP ORTHODONTICS, INC.
16.18.1 COMPANY SNAPSHOT
16.18.2 PRODUCT PORTFOLIO
16.18.3 RECENT DEVELOPMENT
17 QUESTIONNAIRE
18 RELATED REPORTS
Liste des tableaux
TABLEAU 1 INNOVATION TECHNOLOGIQUE ET PERSONNALISATION
TABLEAU 2 FORCES ET FAIBLESSES CONCURRENTIELLES
TABLEAU 3 OPPORTUNITÉS DE CROISSANCE PAR ENTREPRISE
TABLEAU 4 RÉPARTITION DES PRIX PAR CATÉGORIE DE PRODUITS
TABLEAU 5 COMPARAISON DES PRIX CONCURRENTIELS (ALIGNEURS TRANSPARENTS VS APPAREILS DENTAIRES)
TABLEAU 6 COMPARAISON DES MODÈLES DE VENTE AU DÉTAIL, DE DISTRIBUTION ET DE VENTE DIRECTE
TABLEAU 7 MARCHÉ DES FOURNITURES ORTHODONTIQUES AU MOYEN-ORIENT ET EN AFRIQUE, PAR TYPE DE PRODUIT, 2018-2032 (EN MILLIERS USD)
TABLEAU 8 APPAREILS ORTHODONTIQUES AMOVIBLES AU MOYEN-ORIENT ET EN AFRIQUE SUR LE MARCHÉ DES FOURNITURES ORTHODONTIQUES, PAR RÉGION, 2018-2032 (EN MILLIERS USD)
TABLEAU 9 APPAREILS ORTHODONTIQUES AMOVIBLES AU MOYEN-ORIENT ET EN AFRIQUE SUR LE MARCHÉ DES FOURNITURES ORTHODONTIQUES, PAR TYPE DE PRODUIT, 2018-2032 (EN MILLIERS USD)
TABLEAU 10 DISPOSITIFS DE RETENUE SUR LE MARCHÉ DES FOURNITURES ORTHODONTIQUES AU MOYEN-ORIENT ET EN AFRIQUE, PAR TYPE DE PRODUIT, 2018-2032 (EN MILLIERS USD)
TABLEAU 11 APPAREILS ORTHODONTIQUES FIXES AU MOYEN-ORIENT ET EN AFRIQUE SUR LE MARCHÉ DES FOURNITURES ORTHODONTIQUES, PAR RÉGION, 2018-2032 (EN MILLIERS USD)
TABLEAU 12 APPAREILS ORTHODONTIQUES FIXES AU MOYEN-ORIENT ET EN AFRIQUE SUR LE MARCHÉ DES FOURNITURES ORTHODONTIQUES, PAR TYPE DE PRODUIT, 2018-2032 (EN MILLIERS USD)
TABLEAU 13 BRACKETS AU MOYEN-ORIENT ET EN AFRIQUE SUR LE MARCHÉ DES FOURNITURES ORTHODONTIQUES, PAR TYPE, 2018-2032 (EN MILLIERS USD)
TABLEAU 14 BRACKETS AU MOYEN-ORIENT ET EN AFRIQUE SUR LE MARCHÉ DES FOURNITURES ORTHODONTIQUES, PAR COMPOSANT, 2018-2032 (EN MILLIERS USD)
TABLEAU 15 ARCS SUR LE MARCHÉ DES FOURNITURES ORTHODONTIQUES AU MOYEN-ORIENT ET EN AFRIQUE, PAR TYPE, 2018-2032 (EN MILLIERS USD)
TABLEAU 16 ADHÉSIFS ET ACCESSOIRES SUR LE MARCHÉ DES FOURNITURES ORTHODONTIQUES AU MOYEN-ORIENT ET EN AFRIQUE, PAR RÉGION, 2018-2032 (EN MILLIERS USD)
TABLEAU 17 ADHÉSIFS ET ACCESSOIRES SUR LE MARCHÉ DES FOURNITURES ORTHODONTIQUES AU MOYEN-ORIENT ET EN AFRIQUE, PAR PRODUIT, 2018-2032 (EN MILLIERS USD)
TABLEAU 18 ADHÉSIFS ET ACCESSOIRES SUR LE MARCHÉ DES FOURNITURES ORTHODONTIQUES AU MOYEN-ORIENT ET EN AFRIQUE, PAR PRODUIT, 2018-2032 (EN MILLIERS USD)
TABLEAU 19 MARCHÉ DES FOURNITURES ORTHODONTIQUES AU MOYEN-ORIENT ET EN AFRIQUE, PAR TYPE DE PATIENT, 2018-2032 (EN MILLIERS USD)
TABLEAU 20 ENFANTS ET ADOLESCENTS DU MOYEN-ORIENT ET D'AFRIQUE SUR LE MARCHÉ DES FOURNITURES ORTHODONTIQUES, PAR RÉGION, 2018-2032 (EN MILLIERS USD)
TABLEAU 21 ADULTES AU MOYEN-ORIENT ET EN AFRIQUE SUR LE MARCHÉ DES FOURNITURES ORTHODONTIQUES, PAR RÉGION, 2018-2032 (EN MILLIERS USD)
TABLEAU 22 MARCHÉ DES FOURNITURES ORTHODONTIQUES AU MOYEN-ORIENT ET EN AFRIQUE, PAR TYPE DE MATÉRIAU, 2018-2032 (EN MILLIERS USD)
TABLEAU 23 BRACKETS SUR LE MARCHÉ DES FOURNITURES ORTHODONTIQUES AU MOYEN-ORIENT ET EN AFRIQUE, PAR RÉGION, 2018-2032 (EN MILLIERS USD)
TABLEAU 24 BRACKETS AU MOYEN-ORIENT ET EN AFRIQUE SUR LE MARCHÉ DES FOURNITURES ORTHODONTIQUES, PAR TYPE, 2018-2032 (EN MILLIERS USD)
TABLEAU 25 MARCHÉ DES ARCS CHIRURGICAUX SUR LE MARCHÉ DES FOURNITURES ORTHODONTIQUES AU MOYEN-ORIENT ET EN AFRIQUE, PAR RÉGION, 2018-2032 (EN MILLIERS USD)
TABLEAU 26 MARCHÉ DES ARCS CHIRURGICAUX SUR LE MARCHÉ DES FOURNITURES ORTHODONTIQUES AU MOYEN-ORIENT ET EN AFRIQUE, PAR TYPE, 2018-2032 (EN MILLIERS USD)
TABLEAU 27 MARCHÉ DES ALIGNEURS ET DES DISPOSITIFS DE RETENUE SUR LE MARCHÉ DES FOURNITURES ORTHODONTIQUES AU MOYEN-ORIENT ET EN AFRIQUE, PAR RÉGION, 2018-2032 (EN MILLIERS USD)
TABLEAU 28 MARCHÉ DES ALIGNEURS ET DES DISPOSITIFS DE RETENUE SUR LE MARCHÉ DES FOURNITURES ORTHODONTIQUES AU MOYEN-ORIENT ET EN AFRIQUE, PAR TYPE, 2018-2032 (EN MILLIERS USD)
TABLEAU 29 MARCHÉ DES FOURNITURES ORTHODONTIQUES AU MOYEN-ORIENT ET EN AFRIQUE, PAR APPLICATION, 2018-2032 (EN MILLIERS USD)
TABLEAU 30 TRAITEMENT DES MALOCCLUSIONS SUR LE MARCHÉ DES FOURNITURES ORTHODONTIQUES AU MOYEN-ORIENT ET EN AFRIQUE, PAR RÉGION, 2018-2032 (EN MILLIERS USD)
TABLEAU 31 TRAITEMENT DES MALOCCLUSIONS AU MOYEN-ORIENT ET EN AFRIQUE SUR LE MARCHÉ DES FOURNITURES ORTHODONTIQUES, PAR APPLICATION, 2018-2032 (EN MILLIERS USD)
TABLEAU 32 ORTHODONTIE CORRECTRICE SUR LE MARCHÉ DES FOURNITURES ORTHODONTIQUES AU MOYEN-ORIENT ET EN AFRIQUE, PAR RÉGION, 2018-2032 (EN MILLIERS USD)
TABLE 33 MIDDLE EAST AND AFRICA PREVENTIVE ORTHODONTICS IN ORTHODONTIC SUPPLIES MARKET, BY REGION, 2018-2032 (USD THOUSAND)
TABLE 34 MIDDLE EAST AND AFRICA ORTHODONTIC SUPPLIES MARKET, BY END USER, 2018-2032 (USD THOUSAND)
TABLE 35 MIDDLE EAST AND AFRICA DENTAL CLINICS IN ORTHODONTIC SUPPLIES MARKET, BY REGION, 2018-2032 (USD THOUSAND)
TABLE 36 MIDDLE EAST AND AFRICA HOSPITALS IN ORTHODONTIC SUPPLIES MARKET, BY REGION, 2018-2032 (USD THOUSAND)
TABLE 37 MIDDLE EAST AND AFRICA ACADEMIC AND RESEARCH INSTITUTES IN ORTHODONTIC SUPPLIES MARKET, BY REGION, 2018-2032 (USD THOUSAND)
TABLE 38 MIDDLE EAST AND AFRICA ORTHODONTIC SUPPLIES MARKET, BY DISTRIBUTION CHANNEL, 2018-2032 (USD THOUSAND)
TABLE 39 MIDDLE EAST AND AFRICA DIRECT TENDERS IN ORTHODONTIC SUPPLIES MARKET, BY REGION, 2018-2032 (USD THOUSAND)
TABLE 40 MIDDLE EAST AND AFRICA RETAIL SALES IN ORTHODONTIC SUPPLIES MARKET, BY REGION, 2018-2032 (USD THOUSAND)
TABLE 41 MIDDLE EAST AND AFRICA OTHERS IN ORTHODONTIC SUPPLIES MARKET, BY REGION, 2018-2032 (USD THOUSAND)
TABLE 42 MIDDLE EAST OF AFRICA ORTHODONTIC SUPPLIES MARKET, BY COUNTRY, 2018-2032 (USD THOUSAND)
TABLE 43 MIDDLE EAST AND AFRICA ORTHODONTIC SUPPLIES MARKET, BY PRODUCT TYPE, 2018-2032 (USD THOUSAND)
TABLE 44 MIDDLE EAST AND AFRICA REMOVABLE ORTHODONTIC APPLIANCES IN ORTHODONTIC SUPPLIES MARKET, BY PRODUCT TYPE, 2018-2032 (USD THOUSAND)
TABLE 45 MIDDLE EAST AND AFRICA RETAINERS IN ORTHODONTIC SUPPLIES MARKET, BY PRODUCT TYPE, 2018-2032 (USD THOUSAND)
TABLE 46 MIDDLE EAST AND AFRICA FIXED ORTHODONTIC APPLIANCES IN ORTHODONTIC SUPPLIES MARKET, BY PRODUCT TYPE, 2018-2032 (USD THOUSAND)
TABLE 47 MIDDLE EAST AND AFRICA BRACKETS IN ORTHODONTIC SUPPLIES MARKET, BY TYPE, 2018-2032 (USD THOUSAND)
TABLE 48 MIDDLE EAST AND AFRICA BRACKETS IN ORTHODONTIC SUPPLIES MARKET, BY COMPONENT, 2018-2032 (USD THOUSAND)
TABLE 49 MIDDLE EAST AND AFRICA ARCHWIRES IN ORTHODONTIC SUPPLIES MARKET, BY TYPE, 2018-2032 (USD THOUSAND)
TABLE 50 MIDDLE EAST AND AFRICA ADHESIVES AND ACCESSORIES IN ORTHODONTIC SUPPLIES MARKET, BY PRODUCTS, 2018-2032 (USD THOUSAND)
TABLE 51 MIDDLE EAST AND AFRICA ELASTOMERIC PRODUCTS IN ORTHODONTIC SUPPLIES MARKET, BY PRODUCT TYPE, 2018-2032 (USD THOUSAND)
TABLE 52 MIDDLE EAST AND AFRICA ORTHODONTIC SUPPLIES MARKET, BY PATIENT TYPE, 2018-2032 (USD THOUSAND)
TABLE 53 MIDDLE EAST AND AFRICA ORTHODONTIC SUPPLIES MARKET, BY MATERIAL TYPE, 2018-2032 (USD THOUSAND)
TABLE 54 MIDDLE EAST AND AFRICA BRACKETS IN ORTHODONTIC SUPPLIES MARKET, BY TYPE, 2018-2032 (USD THOUSAND)
TABLE 55 MIDDLE EAST AND AFRICA ARCHWIRE IN ORTHODONTIC SUPPLIES MARKET, BY TYPE, 2018-2032 (USD THOUSAND)
TABLE 56 MIDDLE EAST AND AFRICA ALIGNER AND RETAINERS IN ORTHODONTIC SUPPLIES MARKET, BY TYPE, 2018-2032 (USD THOUSAND)
TABLE 57 MIDDLE EAST AND AFRICA ORTHODONTIC SUPPLIES MARKET, BY APPLICATION, 2018-2032 (USD THOUSAND)
TABLE 58 MIDDLE EAST AND AFRICA MALOCCLUSION TREATMENT IN ORTHODONTIC SUPPLIES MARKET, BY APPLICATION, 2018-2032 (USD THOUSAND)
TABLEAU 59 MARCHÉ DES FOURNITURES ORTHODONTIQUES AU MOYEN-ORIENT ET EN AFRIQUE, PAR UTILISATEUR FINAL, 2018-2032 (EN MILLIERS USD)
TABLEAU 60 MARCHÉ DES FOURNITURES ORTHODONTIQUES AU MOYEN-ORIENT ET EN AFRIQUE, PAR CANAL DE DISTRIBUTION, 2018-2032 (EN MILLIERS USD)
TABLEAU 61 MARCHÉ DES FOURNITURES ORTHODONTIQUES EN AFRIQUE DU SUD, PAR TYPE DE PRODUIT, 2018-2032 (EN MILLIERS USD)
TABLEAU 62 APPAREILS ORTHODONTIQUES AMOVIBLES SUR LE MARCHÉ DES FOURNITURES ORTHODONTIQUES EN AFRIQUE DU SUD, PAR TYPE DE PRODUIT, 2018-2032 (EN MILLIERS USD)
TABLEAU 63 DISPOSITIFS DE RETENUE SUR LE MARCHÉ DES FOURNITURES ORTHODONTIQUES EN AFRIQUE DU SUD, PAR TYPE DE PRODUIT, 2018-2032 (EN MILLIERS USD)
TABLEAU 64 APPAREILS ORTHODONTIQUES FIXES SUR LE MARCHÉ DES FOURNITURES ORTHODONTIQUES EN AFRIQUE DU SUD, PAR TYPE DE PRODUIT, 2018-2032 (EN MILLIERS USD)
TABLEAU 65 BRACKETS SUR LE MARCHÉ DES FOURNITURES ORTHODONTIQUES EN AFRIQUE DU SUD, PAR TYPE, 2018-2032 (EN MILLIERS USD)
TABLEAU 66 BRACKETS SUR LE MARCHÉ DES FOURNITURES ORTHODONTIQUES EN AFRIQUE DU SUD, PAR COMPOSANT, 2018-2032 (EN MILLIERS USD)
TABLEAU 67 ARCS SUR LE MARCHÉ DES FOURNITURES ORTHODONTIQUES EN AFRIQUE DU SUD, PAR TYPE, 2018-2032 (EN MILLIERS USD)
TABLEAU 68 AFRIQUE DU SUD - MARCHÉ DES ADHÉSIFS ET ACCESSOIRES SUR LE MARCHÉ DES FOURNITURES ORTHODONTIQUES, PAR PRODUIT, 2018-2032 (EN MILLIERS USD)
TABLEAU 69 PRODUITS ÉLASTOMÈRES SUR LE MARCHÉ DES FOURNITURES ORTHODONTIQUES EN AFRIQUE DU SUD, PAR TYPE DE PRODUIT, 2018-2032 (EN MILLIERS USD)
TABLEAU 70 MARCHÉ DES FOURNITURES ORTHODONTIQUES EN AFRIQUE DU SUD, PAR TYPE DE PATIENT, 2018-2032 (EN MILLIERS USD)
TABLEAU 71 MARCHÉ DES FOURNITURES ORTHODONTIQUES EN AFRIQUE DU SUD, PAR TYPE DE MATÉRIAU, 2018-2032 (EN MILLIERS USD)
TABLEAU 72 BRACKETS SUR LE MARCHÉ DES FOURNITURES ORTHODONTIQUES EN AFRIQUE DU SUD, PAR TYPE, 2018-2032 (EN MILLIERS USD)
TABLEAU 73 ARCS SUR LE MARCHÉ DES FOURNITURES ORTHODONTIQUES EN AFRIQUE DU SUD, PAR TYPE, 2018-2032 (EN MILLIERS USD)
TABLEAU 74 MARCHÉ DES ALIGNEURS ET DES DISPOSITIFS DE RETENUE SUR LE MARCHÉ DES FOURNITURES ORTHODONTIQUES EN AFRIQUE DU SUD, PAR TYPE, 2018-2032 (EN MILLIERS USD)
TABLEAU 75 MARCHÉ DES FOURNITURES ORTHODONTIQUES EN AFRIQUE DU SUD, PAR APPLICATION, 2018-2032 (EN MILLIERS USD)
TABLEAU 76 TRAITEMENT DES MALOCCLUSIONS SUR LE MARCHÉ DES FOURNITURES ORTHODONTIQUES EN AFRIQUE DU SUD, PAR APPLICATION, 2018-2032 (EN MILLIERS USD)
TABLEAU 77 MARCHÉ DES FOURNITURES ORTHODONTIQUES EN AFRIQUE DU SUD, PAR UTILISATEUR FINAL, 2018-2032 (EN MILLIERS USD)
TABLEAU 78 MARCHÉ DES FOURNITURES ORTHODONTIQUES EN AFRIQUE DU SUD, PAR CANAL DE DISTRIBUTION, 2018-2032 (EN MILLIERS USD)
TABLEAU 79 MARCHÉ DES FOURNITURES ORTHODONTIQUES EN ARABIE DU SUD, PAR TYPE DE PRODUIT, 2018-2032 (EN MILLIERS USD)
TABLEAU 80 APPAREILS ORTHODONTIQUES AMOVIBLES SUR LE MARCHÉ DES FOURNITURES ORTHODONTIQUES EN ARABIE DU SUD, PAR TYPE DE PRODUIT, 2018-2032 (EN MILLIERS USD)
TABLEAU 81 ARABIE DU SUD : DISPOSITIFS DE RETENUE SUR LE MARCHÉ DES FOURNITURES ORTHODONTIQUES, PAR TYPE DE PRODUIT, 2018-2032 (EN MILLIERS USD)
TABLEAU 82 APPAREILS ORTHODONTIQUES FIXES SUR LE MARCHÉ DES FOURNITURES ORTHODONTIQUES EN ARABIE DU SUD, PAR TYPE DE PRODUIT, 2018-2032 (EN MILLIERS USD)
TABLEAU 83 ARABIE DU SUD BRACKETS SUR LE MARCHÉ DES FOURNITURES ORTHODONTIQUES, PAR TYPE, 2018-2032 (EN MILLIERS USD)
TABLEAU 84 BRACKETS SUR LE MARCHÉ DES FOURNITURES ORTHODONTIQUES EN ARABIE DU SUD, PAR COMPOSANT, 2018-2032 (EN MILLIERS USD)
TABLEAU 85 ARCS SUR LE MARCHÉ DES FOURNITURES ORTHODONTIQUES EN ARABIE DU SUD, PAR TYPE, 2018-2032 (EN MILLIERS USD)
TABLEAU 86 ARABIE DU SUD - MARCHÉ DES ADHÉSIFS ET ACCESSOIRES SUR LE MARCHÉ DES FOURNITURES ORTHODONTIQUES, PAR PRODUIT, 2018-2032 (EN MILLIERS USD)
TABLEAU 87 PRODUITS ÉLASTOMÈRES SUR LE MARCHÉ DES FOURNITURES ORTHODONTIQUES EN ARABIE DU SUD, PAR TYPE DE PRODUIT, 2018-2032 (EN MILLIERS USD)
TABLEAU 88 MARCHÉ DES FOURNITURES ORTHODONTIQUES EN ARABIE DU SUD, PAR TYPE DE PATIENT, 2018-2032 (EN MILLIERS USD)
TABLEAU 89 MARCHÉ DES FOURNITURES ORTHODONTIQUES EN ARABIE DU SUD, PAR TYPE DE MATÉRIAU, 2018-2032 (EN MILLIERS USD)
TABLEAU 90 ARABIE DU SUD BRACKETS SUR LE MARCHÉ DES FOURNITURES ORTHODONTIQUES, PAR TYPE, 2018-2032 (EN MILLIERS USD)
TABLEAU 91 ARABIE DU SUD : MARCHÉ DES ARCS SUR LE MARCHÉ DES FOURNITURES ORTHODONTIQUES, PAR TYPE, 2018-2032 (EN MILLIERS USD)
TABLEAU 92 ARABIE DU SUD : ALIGNEURS ET DISPOSITIFS DE RETENUE SUR LE MARCHÉ DES FOURNITURES ORTHODONTIQUES, PAR TYPE, 2018-2032 (EN MILLIERS USD)
TABLEAU 93 MARCHÉ DES FOURNITURES ORTHODONTIQUES EN ARABIE DU SUD, PAR APPLICATION, 2018-2032 (EN MILLIERS USD)
TABLEAU 94 TRAITEMENT DES MALOCCLUSIONS SUR LE MARCHÉ DES FOURNITURES ORTHODONTIQUES EN ARABIE DU SUD, PAR APPLICATION, 2018-2032 (EN MILLIERS USD)
TABLEAU 95 MARCHÉ DES FOURNITURES ORTHODONTIQUES EN ARABIE DU SUD, PAR UTILISATEUR FINAL, 2018-2032 (EN MILLIERS USD)
TABLEAU 96 MARCHÉ DES FOURNITURES ORTHODONTIQUES EN ARABIE DU SUD, PAR CANAL DE DISTRIBUTION, 2018-2032 (EN MILLIERS USD)
TABLEAU 97 MARCHÉ DES FOURNITURES ORTHODONTIQUES AUX ÉMIRATS ARABES UNIS, PAR TYPE DE PRODUIT, 2018-2032 (EN MILLIERS USD)
TABLEAU 98 APPAREILS ORTHODONTIQUES AMOVIBLES SUR LE MARCHÉ DES FOURNITURES ORTHODONTIQUES AUX EAU, PAR TYPE DE PRODUIT, 2018-2032 (EN MILLIERS USD)
TABLEAU 99 DISPOSITIFS DE RETENUE SUR LE MARCHÉ DES FOURNITURES ORTHODONTIQUES AUX EAU, PAR TYPE DE PRODUIT, 2018-2032 (EN MILLIERS USD)
TABLEAU 100 APPAREILS ORTHODONTIQUES FIXES SUR LE MARCHÉ DES FOURNITURES ORTHODONTIQUES DES EAU, PAR TYPE DE PRODUIT, 2018-2032 (EN MILLIERS USD)
TABLEAU 101 BRACKETS DES EAU SUR LE MARCHÉ DES FOURNITURES ORTHODONTIQUES, PAR TYPE, 2018-2032 (EN MILLIERS USD)
TABLEAU 102 BRACKETS DES EAU SUR LE MARCHÉ DES FOURNITURES ORTHODONTIQUES, PAR COMPOSANT, 2018-2032 (EN MILLIERS USD)
TABLEAU 103 ARCS SUR LE MARCHÉ DES FOURNITURES ORTHODONTIQUES AUX ÉMIRATS ARABES UNIS, PAR TYPE, 2018-2032 (EN MILLIERS USD)
TABLEAU 104 ADHÉSIFS ET ACCESSOIRES SUR LE MARCHÉ DES FOURNITURES ORTHODONTIQUES AUX EAU, PAR PRODUIT, 2018-2032 (EN MILLIERS USD)
TABLEAU 105 PRODUITS ÉLASTOMÈRES SUR LE MARCHÉ DES FOURNITURES ORTHODONTIQUES AUX ÉMIRATS ARABES UNIS, PAR TYPE DE PRODUIT, 2018-2032 (EN MILLIERS USD)
TABLEAU 106 MARCHÉ DES FOURNITURES ORTHODONTIQUES AUX ÉMIRATS ARABES UNIS, PAR TYPE DE PATIENT, 2018-2032 (EN MILLIERS USD)
TABLEAU 107 MARCHÉ DES FOURNITURES ORTHODONTIQUES AUX ÉMIRATS ARABES UNIS, PAR TYPE DE MATÉRIAU, 2018-2032 (EN MILLIERS USD)
TABLEAU 108 BRACKETS DES EAU SUR LE MARCHÉ DES FOURNITURES ORTHODONTIQUES, PAR TYPE, 2018-2032 (EN MILLIERS USD)
TABLEAU 109 ARCS SUR LE MARCHÉ DES FOURNITURES ORTHODONTIQUES AUX EAU, PAR TYPE, 2018-2032 (EN MILLIERS USD)
TABLEAU 110 ALIGNEURS ET DISPOSITIFS DE RETENUE SUR LE MARCHÉ DES FOURNITURES ORTHODONTIQUES AUX ÉMIRATS ARABES UNIS, PAR TYPE, 2018-2032 (EN MILLIERS USD)
TABLEAU 111 MARCHÉ DES FOURNITURES ORTHODONTIQUES AUX ÉMIRATS ARABES UNIS, PAR APPLICATION, 2018-2032 (EN MILLIERS USD)
TABLEAU 112 TRAITEMENT DES MALOCCLUSIONS SUR LE MARCHÉ DES FOURNITURES ORTHODONTIQUES AUX EAU, PAR APPLICATION, 2018-2032 (EN MILLIERS USD)
TABLEAU 113 MARCHÉ DES FOURNITURES ORTHODONTIQUES AUX ÉMIRATS ARABES UNIS, PAR UTILISATEUR FINAL, 2018-2032 (EN MILLIERS USD)
TABLEAU 114 MARCHÉ DES FOURNITURES ORTHODONTIQUES AUX ÉMIRATS ARABES UNIS, PAR CANAL DE DISTRIBUTION, 2018-2032 (EN MILLIERS USD)
TABLEAU 115 MARCHÉ DES FOURNITURES ORTHODONTIQUES EN ÉGYPTE, PAR TYPE DE PRODUIT, 2018-2032 (EN MILLIERS USD)
TABLEAU 116 APPAREILS ORTHODONTIQUES AMOVIBLES SUR LE MARCHÉ DES FOURNITURES ORTHODONTIQUES EN ÉGYPTE, PAR TYPE DE PRODUIT, 2018-2032 (EN MILLIERS USD)
TABLEAU 117 ÉGYPTE : DISPOSITIFS DE RETENUE SUR LE MARCHÉ DES FOURNITURES ORTHODONTIQUES, PAR TYPE DE PRODUIT, 2018-2032 (EN MILLIERS USD)
TABLEAU 118 APPAREILS ORTHODONTIQUES FIXES EN ÉGYPTE SUR LE MARCHÉ DES FOURNITURES ORTHODONTIQUES, PAR TYPE DE PRODUIT, 2018-2032 (EN MILLIERS USD)
TABLEAU 119 BRACKETS ÉGYPTIENS SUR LE MARCHÉ DES FOURNITURES ORTHODONTIQUES, PAR TYPE, 2018-2032 (EN MILLIERS USD)
TABLEAU 120 BRACKETS ÉGYPTIENS SUR LE MARCHÉ DES FOURNITURES ORTHODONTIQUES, PAR COMPOSANT, 2018-2032 (EN MILLIERS USD)
TABLEAU 121 ARCS ÉGYPTIENS SUR LE MARCHÉ DES FOURNITURES ORTHODONTIQUES, PAR TYPE, 2018-2032 (EN MILLIERS USD)
TABLEAU 122 ÉGYPTE : MARCHÉ DES ADHÉSIFS ET ACCESSOIRES SUR LE MARCHÉ DES FOURNITURES ORTHODONTIQUES, PAR PRODUIT, 2018-2032 (EN MILLIERS USD)
TABLEAU 123 PRODUITS ÉLASTOMÈRES SUR LE MARCHÉ DES FOURNITURES ORTHODONTIQUES EN ÉGYPTE, PAR TYPE DE PRODUIT, 2018-2032 (EN MILLIERS USD)
TABLEAU 124 MARCHÉ DES FOURNITURES ORTHODONTIQUES EN ÉGYPTE, PAR TYPE DE PATIENT, 2018-2032 (EN MILLIERS USD)
TABLEAU 125 MARCHÉ DES FOURNITURES ORTHODONTIQUES EN ÉGYPTE, PAR TYPE DE MATÉRIAU, 2018-2032 (EN MILLIERS USD)
TABLEAU 126 BRACKETS ÉGYPTIENS SUR LE MARCHÉ DES FOURNITURES ORTHODONTIQUES, PAR TYPE, 2018-2032 (EN MILLIERS USD)
TABLEAU 127 ARCS ÉGYPTIENS SUR LE MARCHÉ DES FOURNITURES ORTHODONTIQUES, PAR TYPE, 2018-2032 (EN MILLIERS USD)
TABLEAU 128 ÉGYPTE : MARCHÉ DES ALIGNEURS ET DES DISPOSITIFS DE RETENUE SUR LE MARCHÉ DES FOURNITURES ORTHODONTIQUES, PAR TYPE, 2018-2032 (EN MILLIERS USD)
TABLEAU 129 MARCHÉ DES FOURNITURES ORTHODONTIQUES EN ÉGYPTE, PAR APPLICATION, 2018-2032 (EN MILLIERS USD)
TABLEAU 130 TRAITEMENT DES MALOCCLUSIONS SUR LE MARCHÉ DES FOURNITURES ORTHODONTIQUES EN ÉGYPTE, PAR APPLICATION, 2018-2032 (EN MILLIERS USD)
TABLEAU 131 MARCHÉ DES FOURNITURES ORTHODONTIQUES EN ÉGYPTE, PAR UTILISATEUR FINAL, 2018-2032 (EN MILLIERS USD)
TABLEAU 132 MARCHÉ DES FOURNITURES ORTHODONTIQUES EN ÉGYPTE, PAR CANAL DE DISTRIBUTION, 2018-2032 (EN MILLIERS USD)
TABLEAU 133 MARCHÉ ISRAÉLIEN DES FOURNITURES ORTHODONTIQUES, PAR TYPE DE PRODUIT, 2018-2032 (EN MILLIERS USD)
TABLEAU 134 APPAREILS ORTHODONTIQUES AMOVIBLES SUR LE MARCHÉ ISRAÉLIEN DES FOURNITURES ORTHODONTIQUES, PAR TYPE DE PRODUIT, 2018-2032 (EN MILLIERS USD)
TABLEAU 135 DISPOSITIFS DE RETENUE SUR LE MARCHÉ DES FOURNITURES ORTHODONTIQUES EN ISRAËL, PAR TYPE DE PRODUIT, 2018-2032 (EN MILLIERS USD)
TABLEAU 136 APPAREILS ORTHODONTIQUES FIXES SUR LE MARCHÉ DES FOURNITURES ORTHODONTIQUES EN ISRAËL, PAR TYPE DE PRODUIT, 2018-2032 (EN MILLIERS USD)
TABLEAU 137 BRACKETS ISRAÉLIENS SUR LE MARCHÉ DES FOURNITURES ORTHODONTIQUES, PAR TYPE, 2018-2032 (EN MILLIERS USD)
TABLEAU 138 BRACKETS ISRAÉLIENS SUR LE MARCHÉ DES FOURNITURES ORTHODONTIQUES, PAR COMPOSANT, 2018-2032 (EN MILLIERS USD)
TABLEAU 139 ARCS DENTAIRES ISRAÉLIENNES SUR LE MARCHÉ DES FOURNITURES ORTHODONTIQUES, PAR TYPE, 2018-2032 (EN MILLIERS USD)
TABLEAU 140 MARCHÉ ISRAÉLIEN DES ADHÉSIFS ET ACCESSOIRES SUR LE MARCHÉ DES FOURNITURES ORTHODONTIQUES, PAR PRODUIT, 2018-2032 (EN MILLIERS USD)
TABLEAU 141 PRODUITS ÉLASTOMÈRES ISRAÉLIENS SUR LE MARCHÉ DES FOURNITURES ORTHODONTIQUES, PAR TYPE DE PRODUIT, 2018-2032 (EN MILLIERS USD)
TABLEAU 142 MARCHÉ ISRAÉLIEN DES FOURNITURES ORTHODONTIQUES, PAR TYPE DE PATIENT, 2018-2032 (MILLIERS USD)
TABLEAU 143 MARCHÉ ISRAÉLIEN DES FOURNITURES ORTHODONTIQUES, PAR TYPE DE MATÉRIAU, 2018-2032 (EN MILLIERS USD)
TABLEAU 144 BRACKETS ISRAÉLIENS SUR LE MARCHÉ DES FOURNITURES ORTHODONTIQUES, PAR TYPE, 2018-2032 (EN MILLIERS USD)
TABLEAU 145 ARCS EN ISRAËL SUR LE MARCHÉ DES FOURNITURES ORTHODONTIQUES, PAR TYPE, 2018-2032 (EN MILLIERS USD)
TABLEAU 146 ALIGNEURS ET DISPOSITIFS DE RETENUE EN ISRAËL SUR LE MARCHÉ DES FOURNITURES ORTHODONTIQUES, PAR TYPE, 2018-2032 (EN MILLIERS USD)
TABLEAU 147 MARCHÉ ISRAÉLIEN DES FOURNITURES ORTHODONTIQUES, PAR APPLICATION, 2018-2032 (EN MILLIERS USD)
TABLEAU 148 TRAITEMENT DES MALOCCLUSIONS SUR LE MARCHÉ DES FOURNITURES ORTHODONTIQUES EN ISRAËL, PAR APPLICATION, 2018-2032 (EN MILLIERS USD)
TABLEAU 149 MARCHÉ ISRAÉLIEN DES FOURNITURES ORTHODONTIQUES, PAR UTILISATEUR FINAL, 2018-2032 (EN MILLIERS USD)
TABLEAU 150 MARCHÉ ISRAÉLIEN DES FOURNITURES ORTHODONTIQUES, PAR CANAL DE DISTRIBUTION, 2018-2032 (MILLIERS USD)
TABLEAU 151 MARCHÉ DES FOURNITURES ORTHODONTIQUES AU KOWEÏT, PAR TYPE DE PRODUIT, 2018-2032 (EN MILLIERS USD)
TABLEAU 152 APPAREILS ORTHODONTIQUES AMOVIBLES SUR LE MARCHÉ DES FOURNITURES ORTHODONTIQUES AU KOWEÏT, PAR TYPE DE PRODUIT, 2018-2032 (EN MILLIERS USD)
TABLEAU 153 KOWEÏT : DISPOSITIFS DE RETENUE SUR LE MARCHÉ DES FOURNITURES ORTHODONTIQUES, PAR TYPE DE PRODUIT, 2018-2032 (EN MILLIERS USD)
TABLEAU 154 APPAREILS ORTHODONTIQUES FIXES SUR LE MARCHÉ DES FOURNITURES ORTHODONTIQUES AU KOWEÏT, PAR TYPE DE PRODUIT, 2018-2032 (EN MILLIERS USD)
TABLEAU 155 BRACKETS KOWEÏTIENS SUR LE MARCHÉ DES FOURNITURES ORTHODONTIQUES, PAR TYPE, 2018-2032 (EN MILLIERS USD)
TABLEAU 156 BRACKETS KOWEÏTIENS SUR LE MARCHÉ DES FOURNITURES ORTHODONTIQUES, PAR COMPOSANT, 2018-2032 (MILLIERS USD)
TABLEAU 157 ARCS KOWEÏTIENS SUR LE MARCHÉ DES FOURNITURES ORTHODONTIQUES, PAR TYPE, 2018-2032 (EN MILLIERS USD)
TABLEAU 158 KOWEÏT ADHÉSIFS ET ACCESSOIRES SUR LE MARCHÉ DES FOURNITURES ORTHODONTIQUES, PAR PRODUIT, 2018-2032 (MILLIERS USD)
TABLEAU 159 PRODUITS ÉLASTOMÈRES SUR LE MARCHÉ DES FOURNITURES ORTHODONTIQUES AU KOWEÏT, PAR TYPE DE PRODUIT, 2018-2032 (EN MILLIERS USD)
TABLEAU 160 MARCHÉ DES FOURNITURES ORTHODONTIQUES AU KOWEÏT, PAR TYPE DE PATIENT, 2018-2032 (EN MILLIERS USD)
TABLEAU 161 MARCHÉ DES FOURNITURES ORTHODONTIQUES AU KOWEÏT, PAR TYPE DE MATÉRIAU, 2018-2032 (EN MILLIERS USD)
TABLEAU 162 BRACKETS KOWEÏTIENS SUR LE MARCHÉ DES FOURNITURES ORTHODONTIQUES, PAR TYPE, 2018-2032 (EN MILLIERS USD)
TABLEAU 163 ARCS KOWEÏTIENS SUR LE MARCHÉ DES FOURNITURES ORTHODONTIQUES, PAR TYPE, 2018-2032 (EN MILLIERS USD)
TABLEAU 164 ALIGNEURS ET DISPOSITIFS DE RETENUE SUR LE MARCHÉ DES FOURNITURES ORTHODONTIQUES AU KOWEÏT, PAR TYPE, 2018-2032 (EN MILLIERS USD)
TABLEAU 165 MARCHÉ DES FOURNITURES ORTHODONTIQUES AU KOWEÏT, PAR APPLICATION, 2018-2032 (EN MILLIERS USD)
TABLEAU 166 TRAITEMENT DES MALOCCLUSIONS SUR LE MARCHÉ DES FOURNITURES ORTHODONTIQUES AU KOWEÏT, PAR APPLICATION, 2018-2032 (EN MILLIERS USD)
TABLEAU 167 MARCHÉ DES FOURNITURES ORTHODONTIQUES AU KOWEÏT, PAR UTILISATEUR FINAL, 2018-2032 (EN MILLIERS USD)
TABLEAU 168 MARCHÉ DES FOURNITURES ORTHODONTIQUES AU KOWEÏT, PAR CANAL DE DISTRIBUTION, 2018-2032 (EN MILLIERS USD)
TABLEAU 169 MARCHÉ DES FOURNITURES ORTHODONTIQUES AU QATAR, PAR TYPE DE PRODUIT, 2018-2032 (EN MILLIERS USD)
TABLEAU 170 APPAREILS ORTHODONTIQUES AMOVIBLES AU QATAR SUR LE MARCHÉ DES FOURNITURES ORTHODONTIQUES, PAR TYPE DE PRODUIT, 2018-2032 (EN MILLIERS USD)
TABLEAU 171 DISPOSITIFS DE RETENUE SUR LE MARCHÉ DES FOURNITURES ORTHODONTIQUES AU QATAR, PAR TYPE DE PRODUIT, 2018-2032 (EN MILLIERS USD)
TABLEAU 172 APPAREILS ORTHODONTIQUES FIXES AU QATAR SUR LE MARCHÉ DES FOURNITURES ORTHODONTIQUES, PAR TYPE DE PRODUIT, 2018-2032 (EN MILLIERS USD)
TABLEAU 173 BRACKETS DU QATAR SUR LE MARCHÉ DES FOURNITURES ORTHODONTIQUES, PAR TYPE, 2018-2032 (EN MILLIERS USD)
TABLEAU 174 BRACKETS DU QATAR SUR LE MARCHÉ DES FOURNITURES ORTHODONTIQUES, PAR COMPOSANT, 2018-2032 (MILLIERS USD)
TABLEAU 175 ARCS SUR LE MARCHÉ DES FOURNITURES ORTHODONTIQUES AU QATAR, PAR TYPE, 2018-2032 (EN MILLIERS USD)
TABLEAU 176 ADHÉSIFS ET ACCESSOIRES SUR LE MARCHÉ DES FOURNITURES ORTHODONTIQUES AU QATAR, PAR PRODUIT, 2018-2032 (EN MILLIERS USD)
TABLE 177 QATAR ELASTOMERIC PRODUCTS IN ORTHODONTIC SUPPLIES MARKET, BY PRODUCT TYPE, 2018-2032 (USD THOUSAND)
TABLE 178 QATAR ORTHODONTIC SUPPLIES MARKET, BY PATIENT TYPE, 2018-2032 (USD THOUSAND)
TABLE 179 QATAR ORTHODONTIC SUPPLIES MARKET, BY MATERIAL TYPE, 2018-2032 (USD THOUSAND)
TABLE 180 QATAR BRACKETS IN ORTHODONTIC SUPPLIES MARKET, BY TYPE, 2018-2032 (USD THOUSAND)
TABLE 181 QATAR ARCHWIRE IN ORTHODONTIC SUPPLIES MARKET, BY TYPE, 2018-2032 (USD THOUSAND)
TABLE 182 QATAR ALIGNER AND RETAINERS IN ORTHODONTIC SUPPLIES MARKET, BY TYPE, 2018-2032 (USD THOUSAND)
TABLE 183 QATAR ORTHODONTIC SUPPLIES MARKET, BY APPLICATION, 2018-2032 (USD THOUSAND)
TABLE 184 QATAR MALOCCLUSION TREATMENT IN ORTHODONTIC SUPPLIES MARKET, BY APPLICATION, 2018-2032 (USD THOUSAND)
TABLE 185 QATAR ORTHODONTIC SUPPLIES MARKET, BY END USER, 2018-2032 (USD THOUSAND)
TABLE 186 QATAR ORTHODONTIC SUPPLIES MARKET, BY DISTRIBUTION CHANNEL, 2018-2032 (USD THOUSAND)
TABLE 187 OMAN ORTHODONTIC SUPPLIES MARKET, BY PRODUCT TYPE, 2018-2032 (USD THOUSAND)
TABLE 188 OMAN REMOVABLE ORTHODONTIC APPLIANCES IN ORTHODONTIC SUPPLIES MARKET, BY PRODUCT TYPE, 2018-2032 (USD THOUSAND)
TABLE 189 OMAN RETAINERS IN ORTHODONTIC SUPPLIES MARKET, BY PRODUCT TYPE, 2018-2032 (USD THOUSAND)
TABLE 190 OMAN FIXED ORTHODONTIC APPLIANCES IN ORTHODONTIC SUPPLIES MARKET, BY PRODUCT TYPE, 2018-2032 (USD THOUSAND)
TABLE 191 OMAN BRACKETS IN ORTHODONTIC SUPPLIES MARKET, BY TYPE, 2018-2032 (USD THOUSAND)
TABLE 192 OMAN BRACKETS IN ORTHODONTIC SUPPLIES MARKET, BY COMPONENT, 2018-2032 (USD THOUSAND)
TABLE 193 OMAN ARCHWIRES IN ORTHODONTIC SUPPLIES MARKET, BY TYPE, 2018-2032 (USD THOUSAND)
TABLE 194 OMAN ADHESIVES AND ACCESSORIES IN ORTHODONTIC SUPPLIES MARKET, BY PRODUCTS, 2018-2032 (USD THOUSAND)
TABLE 195 OMAN ELASTOMERIC PRODUCTS IN ORTHODONTIC SUPPLIES MARKET, BY PRODUCT TYPE, 2018-2032 (USD THOUSAND)
TABLE 196 OMAN ORTHODONTIC SUPPLIES MARKET, BY PATIENT TYPE, 2018-2032 (USD THOUSAND)
TABLE 197 OMAN ORTHODONTIC SUPPLIES MARKET, BY MATERIAL TYPE, 2018-2032 (USD THOUSAND)
TABLE 198 OMAN BRACKETS IN ORTHODONTIC SUPPLIES MARKET, BY TYPE, 2018-2032 (USD THOUSAND)
TABLE 199 OMAN ARCHWIRE IN ORTHODONTIC SUPPLIES MARKET, BY TYPE, 2018-2032 (USD THOUSAND)
TABLE 200 OMAN ALIGNER AND RETAINERS IN ORTHODONTIC SUPPLIES MARKET, BY TYPE, 2018-2032 (USD THOUSAND)
TABLE 201 OMAN ORTHODONTIC SUPPLIES MARKET, BY APPLICATION, 2018-2032 (USD THOUSAND)
TABLE 202 OMAN MALOCCLUSION TREATMENT IN ORTHODONTIC SUPPLIES MARKET, BY APPLICATION, 2018-2032 (USD THOUSAND)
TABLE 203 OMAN ORTHODONTIC SUPPLIES MARKET, BY END USER, 2018-2032 (USD THOUSAND)
TABLE 204 OMAN ORTHODONTIC SUPPLIES MARKET, BY DISTRIBUTION CHANNEL, 2018-2032 (USD THOUSAND)
TABLE 205 BAHRAIN ORTHODONTIC SUPPLIES MARKET, BY PRODUCT TYPE, 2018-2032 (USD THOUSAND)
TABLE 206 BAHRAIN REMOVABLE ORTHODONTIC APPLIANCES IN ORTHODONTIC SUPPLIES MARKET, BY PRODUCT TYPE, 2018-2032 (USD THOUSAND)
TABLE 207 BAHRAIN RETAINERS IN ORTHODONTIC SUPPLIES MARKET, BY PRODUCT TYPE, 2018-2032 (USD THOUSAND)
TABLE 208 BAHRAIN FIXED ORTHODONTIC APPLIANCES IN ORTHODONTIC SUPPLIES MARKET, BY PRODUCT TYPE, 2018-2032 (USD THOUSAND)
TABLE 209 BAHRAIN BRACKETS IN ORTHODONTIC SUPPLIES MARKET, BY TYPE, 2018-2032 (USD THOUSAND)
TABLE 210 BAHRAIN BRACKETS IN ORTHODONTIC SUPPLIES MARKET, BY COMPONENT, 2018-2032 (USD THOUSAND)
TABLE 211 BAHRAIN ARCHWIRES IN ORTHODONTIC SUPPLIES MARKET, BY TYPE, 2018-2032 (USD THOUSAND)
TABLE 212 BAHRAIN ADHESIVES AND ACCESSORIES IN ORTHODONTIC SUPPLIES MARKET, BY PRODUCTS, 2018-2032 (USD THOUSAND)
TABLE 213 BAHRAIN ELASTOMERIC PRODUCTS IN ORTHODONTIC SUPPLIES MARKET, BY PRODUCT TYPE, 2018-2032 (USD THOUSAND)
TABLE 214 BAHRAIN ORTHODONTIC SUPPLIES MARKET, BY PATIENT TYPE, 2018-2032 (USD THOUSAND)
TABLE 215 BAHRAIN ORTHODONTIC SUPPLIES MARKET, BY MATERIAL TYPE, 2018-2032 (USD THOUSAND)
TABLE 216 BAHRAIN BRACKETS IN ORTHODONTIC SUPPLIES MARKET, BY TYPE, 2018-2032 (USD THOUSAND)
TABLE 217 BAHRAIN ARCHWIRE IN ORTHODONTIC SUPPLIES MARKET, BY TYPE, 2018-2032 (USD THOUSAND)
TABLE 218 BAHRAIN ALIGNER AND RETAINERS IN ORTHODONTIC SUPPLIES MARKET, BY TYPE, 2018-2032 (USD THOUSAND)
TABLE 219 BAHRAIN ORTHODONTIC SUPPLIES MARKET, BY APPLICATION, 2018-2032 (USD THOUSAND)
TABLE 220 BAHRAIN MALOCCLUSION TREATMENT IN ORTHODONTIC SUPPLIES MARKET, BY APPLICATION, 2018-2032 (USD THOUSAND)
TABLE 221 BAHRAIN ORTHODONTIC SUPPLIES MARKET, BY END USER, 2018-2032 (USD THOUSAND)
TABLE 222 BAHRAIN ORTHODONTIC SUPPLIES MARKET, BY DISTRIBUTION CHANNEL, 2018-2032 (USD THOUSAND)
TABLE 223 REST OF MIDDLE EAST AND AFRICA ORTHODONTIC SUPPLIES MARKET, BY PRODUCT TYPE, 2018-2032 (USD THOUSAND)
Liste des figures
FIGURE 1 MIDDLE EAST AND AFRICA ORTHODONTIC SUPPLIES MARKET: SEGMENTATION
FIGURE 2 MIDDLE EAST AND AFRICA ORTHODONTIC SUPPLIES MARKET: DATA TRIANGULATION
FIGURE 3 MIDDLE EAST AND AFRICA ORTHODONTIC SUPPLIES MARKET: DROC ANALYSIS
FIGURE 4 MIDDLE EAST AND AFRICA ORTHODONTIC SUPPLIES MARKET: MIDDLE EAST AND AFRICA VS REGIONAL MARKET ANALYSIS
FIGURE 5 MIDDLE EAST AND AFRICA ORTHODONTIC SUPPLIES MARKET: COMPANY RESEARCH ANALYSIS
FIGURE 6 MIDDLE EAST AND AFRICA ORTHODONTIC SUPPLIES MARKET: INTERVIEW DEMOGRAPHICS
FIGURE 7 MIDDLE EAST AND AFRICA ORTHODONTIC SUPPLIES MARKET: DBMR MARKET POSITION GRID
FIGURE 8 MIDDLE EAST AND AFRICA ORTHODONTICS SUPPLIES MARKET: MARKET END USER COVERAGE GRID
FIGURE 9 MIDDLE EAST AND AFRICA ORTHODONTIC SUPPLIES MARKET: VENDOR SHARE ANALYSIS
FIGURE 10 MIDDLE EAST AND AFRICA ORTHODONTIC SUPPLIES MARKET: SEGMENTATION
FIGURE 11 THREE SEGMENTS COMPRISE THE MIDDLE EAST AND AFRICA ORTHODONTIC SUPPLIES MARKET, BY PRODUCT TYPE
FIGURE 12 MIDDLE EAST AND AFRICA ORTHODONTIC SUPPLIES MARKET EXECUTIVE SUMMARY
FIGURE 13 STRATEGIC DECISIONS
FIGURE 14 RISING INCIDENCE OF MALOCCLUSION DRIVING SURGE IN DENTAL BRACES DEMAND IS DRIVING THE GROWTH OF THE MIDDLE EAST AND AFRICA ORTHODONTIC SUPPLIES MARKET FROM 2025 TO 2032
FIGURE 15 REMOVABLE ORTHODONTIC APPLIANCES SEGMENT IS EXPECTED TO ACCOUNT FOR THE LARGEST MARKET SHARE OF THE MIDDLE EAST AND AFRICA ORTHODONTIC SUPPLIES MARKET IN 2025 AND 2032
FIGURE 16 MARCHÉ DES FOURNITURES ORTHODONTIQUES AU MOYEN-ORIENT ET EN AFRIQUE : PAR TYPE DE PRODUIT, 2024
FIGURE 17 MARCHÉ DES FOURNITURES ORTHODONTIQUES AU MOYEN-ORIENT ET EN AFRIQUE : PAR TYPE DE PRODUIT, 2025-2032 (EN MILLIERS USD)
FIGURE 18 MARCHÉ DES FOURNITURES ORTHODONTIQUES AU MOYEN-ORIENT ET EN AFRIQUE : PAR TYPE DE PRODUIT, TCAC (2025-2032)
FIGURE 19 MARCHÉ DES FOURNITURES ORTHODONTIQUES AU MOYEN-ORIENT ET EN AFRIQUE : PAR TYPE DE PRODUIT, COURBE DE LIGNE DE VIE
FIGURE 20 MARCHÉ DES MÉDICAMENTS VÉTÉRINAIRES AU MOYEN-ORIENT ET EN AFRIQUE : PAR TYPE DE PATIENT, 2024
FIGURE 21 MARCHÉ DES MÉDICAMENTS VÉTÉRINAIRES AU MOYEN-ORIENT ET EN AFRIQUE : PAR TYPE DE PATIENT, 2025-2032 (EN MILLIERS USD)
FIGURE 22 MARCHÉ DES MÉDICAMENTS VÉTÉRINAIRES AU MOYEN-ORIENT ET EN AFRIQUE : PAR TYPE DE PATIENT, TCAC (2025-2032)
FIGURE 23 MARCHÉ DES MÉDICAMENTS VÉTÉRINAIRES AU MOYEN-ORIENT ET EN AFRIQUE : PAR TYPE DE PATIENT, COURBE DE LIGNE DE VIE
FIGURE 24 MARCHÉ DES FOURNITURES ORTHODONTIQUES AU MOYEN-ORIENT ET EN AFRIQUE : PAR TYPE DE MATÉRIAU, 2024
FIGURE 25 MARCHÉ DES FOURNITURES ORTHODONTIQUES AU MOYEN-ORIENT ET EN AFRIQUE : PAR TYPE DE MATÉRIAU, 2025-2032 (EN MILLIERS USD)
FIGURE 26 MARCHÉ DES FOURNITURES ORTHODONTIQUES AU MOYEN-ORIENT ET EN AFRIQUE : PAR TYPE DE MATÉRIAU, TCAC (2025-2032)
FIGURE 27 MARCHÉ DES FOURNITURES ORTHODONTIQUES AU MOYEN-ORIENT ET EN AFRIQUE : PAR TYPE DE MATÉRIAU, COURBE DE LIGNE DE VIE
FIGURE 28 MARCHÉ DES FOURNITURES ORTHODONTIQUES AU MOYEN-ORIENT ET EN AFRIQUE : PAR APPLICATION, 2024
FIGURE 29 MARCHÉ DES FOURNITURES ORTHODONTIQUES AU MOYEN-ORIENT ET EN AFRIQUE : PAR APPLICATION, 2025-2032 (EN MILLIERS USD)
FIGURE 30 MARCHÉ DES FOURNITURES ORTHODONTIQUES AU MOYEN-ORIENT ET EN AFRIQUE : PAR APPLICATION, TCAC (2025-2032)
FIGURE 31 MARCHÉ DES FOURNITURES ORTHODONTIQUES AU MOYEN-ORIENT ET EN AFRIQUE : PAR APPLICATION, COURBE DE LIGNE DE VIE
FIGURE 32 MARCHÉ DES FOURNITURES ORTHODONTIQUES AU MOYEN-ORIENT ET EN AFRIQUE : PAR UTILISATEUR FINAL, 2024
FIGURE 33 MARCHÉ DES FOURNITURES ORTHODONTIQUES AU MOYEN-ORIENT ET EN AFRIQUE : PAR UTILISATEUR FINAL, 2025-2032 (EN MILLIERS USD)
FIGURE 34 MARCHÉ DES FOURNITURES ORTHODONTIQUES AU MOYEN-ORIENT ET EN AFRIQUE : PAR UTILISATEUR FINAL, TCAC (2025-2032)
FIGURE 35 MARCHÉ DES FOURNITURES ORTHODONTIQUES AU MOYEN-ORIENT ET EN AFRIQUE : PAR UTILISATEUR FINAL, COURBE DE LIGNE DE VIE
FIGURE 36 MARCHÉ DES FOURNITURES ORTHODONTIQUES AU MOYEN-ORIENT ET EN AFRIQUE : PAR CANAL DE DISTRIBUTION, 2024
FIGURE 37 MARCHÉ DES FOURNITURES ORTHODONTIQUES AU MOYEN-ORIENT ET EN AFRIQUE : PAR CANAL DE DISTRIBUTION, 2025-2032 (EN MILLIERS USD)
FIGURE 38 MARCHÉ DES FOURNITURES ORTHODONTIQUES AU MOYEN-ORIENT ET EN AFRIQUE : PAR CANAL DE DISTRIBUTION, TCAC (2025-2032)
FIGURE 39 MARCHÉ DES FOURNITURES ORTHODONTIQUES AU MOYEN-ORIENT ET EN AFRIQUE : PAR CANAL DE DISTRIBUTION, COURBE DE LIGNE DE VIE
FIGURE 40 MARCHÉ DES FOURNITURES ORTHODONTIQUES AU MOYEN-ORIENT ET EN AFRIQUE : INSTANTANÉ (2024)
FIGURE 41 MARCHÉ DES FOURNITURES ORTHODONTIQUES AU MOYEN-ORIENT ET EN AFRIQUE : PART DES ENTREPRISES 2024 (%)
Méthodologie de recherche
La collecte de données et l'analyse de l'année de base sont effectuées à l'aide de modules de collecte de données avec des échantillons de grande taille. L'étape consiste à obtenir des informations sur le marché ou des données connexes via diverses sources et stratégies. Elle comprend l'examen et la planification à l'avance de toutes les données acquises dans le passé. Elle englobe également l'examen des incohérences d'informations observées dans différentes sources d'informations. Les données de marché sont analysées et estimées à l'aide de modèles statistiques et cohérents de marché. De plus, l'analyse des parts de marché et l'analyse des tendances clés sont les principaux facteurs de succès du rapport de marché. Pour en savoir plus, veuillez demander un appel d'analyste ou déposer votre demande.
La méthodologie de recherche clé utilisée par l'équipe de recherche DBMR est la triangulation des données qui implique l'exploration de données, l'analyse de l'impact des variables de données sur le marché et la validation primaire (expert du secteur). Les modèles de données incluent la grille de positionnement des fournisseurs, l'analyse de la chronologie du marché, l'aperçu et le guide du marché, la grille de positionnement des entreprises, l'analyse des brevets, l'analyse des prix, l'analyse des parts de marché des entreprises, les normes de mesure, l'analyse globale par rapport à l'analyse régionale et des parts des fournisseurs. Pour en savoir plus sur la méthodologie de recherche, envoyez une demande pour parler à nos experts du secteur.
Personnalisation disponible
Data Bridge Market Research est un leader de la recherche formative avancée. Nous sommes fiers de fournir à nos clients existants et nouveaux des données et des analyses qui correspondent à leurs objectifs. Le rapport peut être personnalisé pour inclure une analyse des tendances des prix des marques cibles, une compréhension du marché pour d'autres pays (demandez la liste des pays), des données sur les résultats des essais cliniques, une revue de la littérature, une analyse du marché des produits remis à neuf et de la base de produits. L'analyse du marché des concurrents cibles peut être analysée à partir d'une analyse basée sur la technologie jusqu'à des stratégies de portefeuille de marché. Nous pouvons ajouter autant de concurrents que vous le souhaitez, dans le format et le style de données que vous recherchez. Notre équipe d'analystes peut également vous fournir des données sous forme de fichiers Excel bruts, de tableaux croisés dynamiques (Fact book) ou peut vous aider à créer des présentations à partir des ensembles de données disponibles dans le rapport.

