ヨーロッパの熱収縮チューブ市場、タイプ別(シングルウォールとデュアルウォール)、製品タイプ(スプール、プレカット長さ、その他)、電圧(低、中、高)、収縮率(2:01、3:01、4:01、6:01、その他)、材質(ポリオレフィン、パーフルオロアルコキシアルカン(PFA)、 ポリテトラフルオロ エチレン(PTFE)、エチレンテトラフルオロエチレン(ETFE)、フッ素化エチレンプロピレン(FEP)、ポリエーテルエーテルケトン(PEEK)など)、エンドユーザー(公共事業、ITおよび通信、自動車、電子機器、航空宇宙、ヘルスケア、石油およびガス、海洋、食品および飲料、建設、化学、その他)業界動向および2030年までの予測。
ヨーロッパの熱収縮チューブ市場の分析と規模
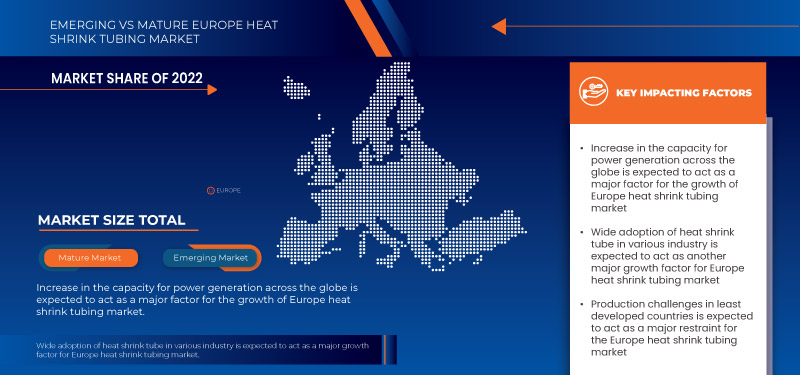
世界中で発電能力が増大したことで、ヨーロッパの熱収縮チューブ市場が牽引されています。しかし、既存の回廊に沿った送電線と変電所のアップグレードは、送電能力を増大させるコスト効率の高い方法です。既存の送電線を再配線することで、送電能力を増大させることができます (より高い電流を流すことができる複合導体などの材料を使用)。これらの材料は現在入手可能ですが、新しい材料を再配線するために使用中の送電線を撤去することが難しいため、広く使用されていません。さらに、気象条件が良好な場合、すべての架空送電線は公称定格よりも高い電流を流すことができ、継続的に調整できるリアルタイム定格により、利用可能な容量が増大します。
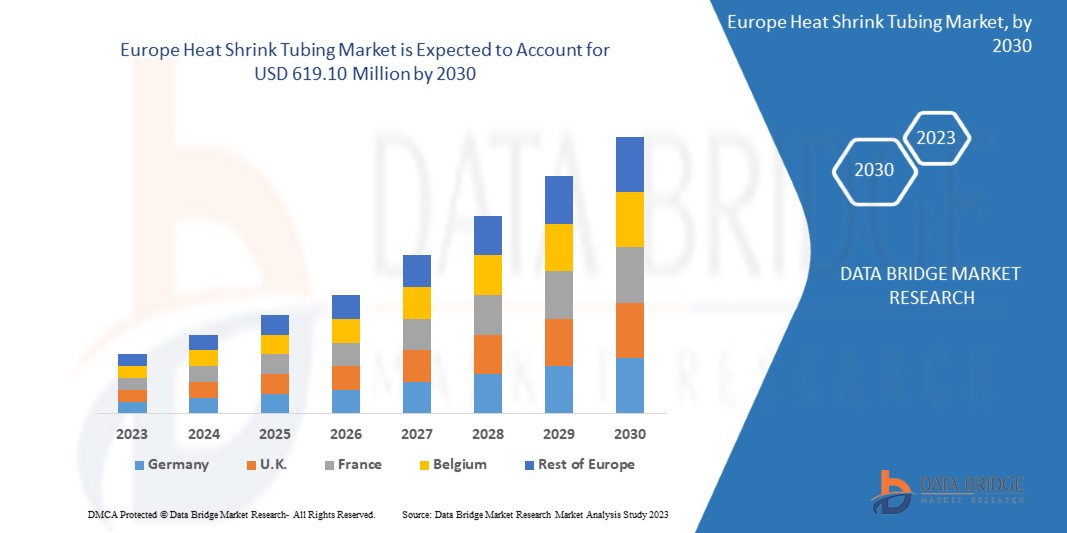
Data Bridge Market Research の分析によると、ヨーロッパの熱収縮チューブ市場は 2023 年から 2030 年の予測期間に 5.8% の CAGR で成長し、2030 年までに 6 億 1,910 万ドルに達すると予想されています。ヨーロッパの熱収縮チューブ市場レポートでは、価格分析、特許分析、技術の進歩についても包括的に取り上げています。
|
レポートメトリック |
詳細 |
|
予測期間 |
2023年から2030年 |
|
基準年 |
2022 |
|
歴史的な年 |
2021 (カスタマイズ可能 2015-2020) |
|
定量単位 |
収益(百万米ドル) |
|
対象セグメント |
タイプ (シングルウォールとデュアルウォール)、製品タイプ (スプール、プレカット長さ、その他)、電圧 (低、中、高)、収縮率 (2:01、3:01、4:01、6:01、その他)、材質 (ポリオレフィン、パーフルオロアルコキシアルカン (PFA)、ポリテトラフルオロエチレン (PTFE)、エチレンテトラフルオロエチレン (ETFE)、フッ素化エチレンプロピレン (FEP)、ポリエーテルエーテルケトン (PEEK)、その他)、エンドユーザー (公共事業、IT および通信、自動車、電子機器、航空宇宙、ヘルスケア、石油およびガス、海洋、食品および飲料、建設、化学、その他) |
|
対象国 |
ドイツ、フランス、イギリス、イタリア、スペイン、オランダ、ベルギー、ロシア、スイス、トルコ、その他のヨーロッパ諸国 |
|
対象となる市場プレーヤー |
ABB(スイス)、住友電気工業株式会社(日本)、TE Connectivity(スイス)、Thermosleeve USA(米国)、Techflex, Inc.(米国)、Dasheng Group(中国)、Shenzhen Woer Heat - Shrinkable Material Co., Ltd.(中国)、Huizhou Guanghai Electronic Insulation Materials Co.,Ltd.(中国)、Panduit(米国)、HellermannTyton(ドイツ)、Alpha Wire(米国)、3M(米国)、SHAWCOR(カナダ)、Zeus Industrial Products, Inc.(米国)、Molex(米国)、PEXCO(米国)、Prysmain Group(イタリア)、GREMCO GmbH(ドイツ)、Qualtek Electronics Corp.(米国)、Hilltop(英国)、Dunbar Products, LLC.(米国)、cygia、Changyuan Electronics(Dongguan)Co., Ltd.(中国)など |
市場の定義
熱収縮チューブは、電気工事の接続部、ジョイント、端子を備えた撚り線導体に耐摩耗性と環境保護性を提供し、電線を絶縁するために使用されます。一般に、収縮温度が低いチューブは収縮が速くなります。熱収縮チューブを電線アレイや電気部品に巻き付けると、機器の輪郭に合わせて放射状に収縮し、保護層を形成します。
さらに、これらのチューブは、パーフルオロアルコキシアルカン (PFA)、ポリテトラフルオロエチレン (PTFE)、フッ素化エチレンプロピレン (FEP) などのさまざまな材料を使用して熱収縮チューブを製造します。さまざまな材料を使用した熱収縮チューブは、個々のワイヤをカバーしたり、アレイ全体を包んだりすることで、摩耗、低衝撃、切断、湿気、ほこりに対するさまざまな保護機能を備えています。さらに、材料は、電子機器、自動車、航空宇宙などの最終用途に基づいて決定されます。プラスチック製造業者は、熱可塑性チューブを押し出して熱収縮チューブを作成することから始めます。熱収縮チューブの材料は、目的の用途によって異なります。
ヨーロッパの熱収縮チューブ市場の動向
このセクションでは、市場の推進要因、機会、制約、課題について理解します。これらはすべて、以下のように詳細に説明されます。
ドライバー
- 地域全体の熱収縮チューブ市場における送電・配電システムの支援と拡大における政府の役割
The role of electric power transmission and distribution (T&D) plays an important link between generating stations and customers. Growing loads and stress created by the aging equipment and increasing the risk of widespread blackouts are a few of the factors which help generates the need for heat shrink tubes. Electricity delivery that is both dependable and cost-effective is critical in today's society. The U.S. transmission and distribution (T&D) is comprised of numerous economic drivers, organizational structures, technologies, and forms of regulatory oversight. Federal, and municipal governments and state and customer-owned cooperatives are all part of these systems. However, about 80 percent of power transactions occur on lines owned by investor-owned regulated utilities (IOUs). These fully integrated utilities own both the generating plants and the transmission and distribution systems that deliver their customers' power. This was among the dominant model in the past but deregulation in some states has transformed the industry. Transmission, generation, and distribution may be handled by different entities in deregulated areas.
- Increase in the Capacity for Power Generation Across the Globe
A two-step process is used to create heat shrink tubing. The first step is standard extrusion followed by a secondary process that makes the tubing heat-shrinkable. Although this secondary process's specifics are kept confidential, heat and force are used to expand the tubing's diameter. While still expanded, the tubing is cooled to room temperature. If the tubing is rigid, it is going to shrink down to its original size. The up-gradation of transmission lines and substations along existing corridors is a cost-effective way to increase transmission capacity. Existing lines can be reconducted to increase transmission capacity (using materials such as composite conductors that can carry higher currents).
Opportunity
- Wide Adoption of Heat Shrink Tubes in Various Industries
AI The heat shrink tubing products are made from uniquely formulated materials that have been enhanced by radiation cross-linking, a technology with product design that provides a repeatable, reliable, and shrink-to-fit installation compatible with many manufacturing processes. These products are in service throughout the world in automotive, telecommunications, power distribution, aerospace, defense, industrial and commercial applications. The tubing application in under bonnet cable protection, hoses, brake pipes, air conditioning, diesel injection clusters, connectors, inline splice, wire bundles, ring terminals, seat belt stalks, gas springs, antennas, and others are further enhancing the application capabilities in the automobile industry. The tubing products are made from uniquely formulated materials that have been enhanced by radiation cross-linking, a technology. The easy-to-use products provide cost-effective, proven solutions in various automotive applications, from sealing and protecting electrical splices to providing mechanical protection for fluid management systems in harsh surroundings.
Restraints/Challenges
- Government Regulation On the Emission of Toxic Gases
The environmental significance of rapid industrialization has brought about uncountable air, land, and water resource sites being contaminated with toxic materials and other pollutants, threatening humans and ecosystems with serious health risks. More extensive and intensive use of materials and energy has created cumulative pressures on the quality of local, regional, and Europe ecosystems. Before there was a concerted effort to restrict the impact of pollution, environmental management extended little beyond laissez-faire tolerance, tempered by the disposal of wastes to avoid disruptive local nuisance conceived of in a short-term perspective. The need for remediation was recognized by exception in instances where damage was determined to be unacceptable. As the pace of industrial activity intensified and the understanding of cumulative effects grew, a pollution control paradigm became the dominant method of environmental management.
- Rising Prices of Raw Materials for Tubing
価格変動は、購入されるケーブル、電線、接続製品や材料に影響を与え、調達、財務、サプライチェーン管理、製品開発における予算予測の見通しにも影響を及ぼします。工業生産の増加と積極的な持続可能エネルギーイニシアチブのおかげで、中国は世界最大の銅消費国となっています。欧州、米国、中国は、より環境に優しい経済を維持するために積極的な再生可能エネルギーイニシアチブを追求しており、銅の高い熱伝導性と電気伝導性は、その実現に役立ちます。チリ、ペルー、中国、米国など最大の銅生産国は、各国が環境に優しい経済イニシアチブを満たすための高い需要を満たすのに苦労しており、銅価格の高騰の一因となっています。また、米ドルが他の欧州通貨に対して弱まるにつれて、他の通貨のユーザーが銅やその他の商品の購買力を高める機会が増えるとの憶測もあります。
最近の動向
- TE Connectivityは2023年4月、高電圧用途向けに特別に設計され、導電性部品とケーブルを安全に絶縁・保護する新しいEVシングルウォール(EVSW)チューブを発表しました。この製品は単層チューブで、電気自動車の高電圧部品に電気絶縁と保護を提供することを主な目的としています。これにより、同社は製品ポートフォリオを多様化し、EV用途特有の課題に対応できるようになります。
- 2023年2月、モレックスは小型化レポートを発表し、製品設計エンジニアリングと最先端の接続性に関する専門家の洞察と革新を述べました。この小型化により、同社は製品の有効性と安全性も向上させました。この開発により、同社の製品ラインが強化され、ヨーロッパの熱収縮チューブ市場の成長にプラスの影響を与えました。
ヨーロッパの熱収縮チューブ市場の範囲
ヨーロッパの熱収縮チューブ市場の範囲は、タイプ、製品タイプ、材料、電圧、収縮率、およびエンドユーザーに基づいて、6 つの主要なセグメントに分割されています。これらのセグメントの成長は、業界のわずかな成長セグメントを分析するのに役立ち、ユーザーに貴重な市場の概要と市場の洞察を提供し、コア市場アプリケーションを特定するための戦略的決定を下すのに役立ちます。
タイプ
- シングルウォール
- デュアルウォール
タイプに基づいて、ヨーロッパの熱収縮チューブ市場は単層と二重層に分類されます。
製品タイプ
- スプール
- あらかじめカットされた長さ
- その他
製品タイプに基づいて、ヨーロッパの熱収縮チューブ市場は、スプール、プレカット長さ、その他に分類されます。
電圧
- 低い
- 中くらい
- 高い
電圧に基づいて、ヨーロッパの熱収縮チューブ市場は低、中、高に分類されます。
収縮率
- 2:01
- 3:01
- 4:01
- 6:01
- その他
収縮率に基づいて、ヨーロッパの熱収縮チューブ市場は 2:01、3:01、4:01、6:01 などに分類されます。
材料
- ポリオレフィン
- パーフルオロアルコキシアルカン (PFA)
- ポリテトラフルオロエチレン(PTFE)
- エチレンテトラフルオロエチレン(ETFE)
- フッ素化エチレンプロピレン(FEP)
- ポリエーテルエーテルケトン(PEEK)
- その他
材料に基づいて、ヨーロッパの熱収縮チューブ市場は、ポリオレフィン、パーフルオロアルコキシアルカン(PFA)、ポリテトラフルオロエチレン(PTFE)、エチレンテトラフルオロエチレン(ETFE)、フッ素化エチレンプロピレン(FEP)、ポリエーテルエーテルケトン(PEEK)などに分類されます。
エンドユーザー
- ユーティリティ
- ITと通信
- 自動車
- エレクトロニクス
- 航空宇宙
- 健康管理
- 石油とガス
- 海洋
- 食品と飲料
- 工事
- 化学薬品
- その他
エンドユーザーに基づいて、ヨーロッパの熱収縮チューブ市場は、公共事業、ITおよび通信、自動車、電子機器、航空宇宙、ヘルスケア、石油およびガス、海洋、食品および飲料、建設、化学、その他に分類されます。
ヨーロッパの熱収縮チューブ市場の地域分析/洞察
ヨーロッパの熱収縮チューブ市場が分析され、上記のようにタイプ、製品タイプ、電圧、収縮率、材料、エンドユーザー別に市場規模の洞察と傾向が提供されます。
ヨーロッパの熱収縮チューブ市場レポートで取り上げられている国は、ドイツ、フランス、イギリス、イタリア、スペイン、オランダ、ベルギー、ロシア、スイス、トルコ、およびその他のヨーロッパ諸国です。
ドイツは、その地域の先進的なソフトウェア部門のおかげで、ヨーロッパ地域で優位に立っています。
レポートの地域セクションでは、市場の現在および将来の傾向に影響を与える個々の市場影響要因と市場規制の変更も提供しています。下流および上流のバリュー チェーン分析、技術動向、ポーターの 5 つの力の分析、ケース スタディなどのデータ ポイントは、個々の国の市場シナリオを予測するために使用される指標の一部です。また、地域データの予測分析を提供する際には、ヨーロッパ ブランドの存在と可用性、および地元および国内ブランドとの競争が激しいか少ないために直面する課題、国内関税の影響、貿易ルートも考慮されます。
競争環境とヨーロッパの熱収縮チューブ市場シェア分析
ヨーロッパの熱収縮チューブ市場の競争状況は、競合他社の詳細を提供します。含まれる詳細には、会社概要、会社の財務状況、収益、市場の可能性、研究開発への投資、新しい市場への取り組み、ヨーロッパでのプレゼンス、生産拠点と施設、生産能力、会社の長所と短所、製品の発売、製品の幅と広さ、アプリケーションの優位性などがあります。提供されている上記のデータ ポイントは、ヨーロッパの熱収縮チューブ市場に関連する会社の焦点にのみ関連しています。
ヨーロッパの熱収縮チューブ市場で活動している主要企業には、ABB(スイス)、住友電気工業(日本)、TE Connectivity(スイス)、Thermosleeve USA(米国)、Techflex, Inc.(米国)、Dasheng Group(中国)、Shenzhen Woer Heat - Shrinkable Material Co., Ltd.(中国)、Huizhou Guanghai Electronic Insulation Materials Co.,Ltd.(中国)、Panduit(米国)、HellermannTyton(ドイツ)、Alpha Wire(米国)、3M(米国)、SHAWCOR(カナダ)、Zeus Industrial Products, Inc.(米国)、Molex(米国)、PEXCO(米国)、Prysmain Group(イタリア)、GREMCO GmbH(ドイツ)、Qualtek Electronics Corp.(米国)、Hilltop(英国)、Dunbar Products, LLCなどがあります。 (米国)、cygia、Changyuan Electronics (Dongguan) Co., Ltd. (中国) など。
SKU-
世界初のマーケットインテリジェンスクラウドに関するレポートにオンラインでアクセスする

- インタラクティブなデータ分析ダッシュボード
- 成長の可能性が高い機会のための企業分析ダッシュボード
- カスタマイズとクエリのためのリサーチアナリストアクセス
- インタラクティブなダッシュボードによる競合分析
- 最新ニュース、更新情報、トレンド分析
- 包括的な競合追跡のためのベンチマーク分析のパワーを活用
目次
- 導入
- 研究の目的
- 市場の定義
- ヨーロッパの熱収縮チューブ市場の概要
- 通貨と価格
- 制限事項
- 対象市場
- 市場セグメンテーション
- 対象市場
- 地理的範囲
- 研究対象年数
- DBMR TRIPOD データ検証モデル
- 主要オピニオンリーダーとの主なインタビュー
- DBMR マーケットポジショングリッド
- ベンダーシェア分析
- 多変量モデリング
- タイムラインカーブを入力する
- 二次資料
- 仮定
- エグゼクティブサマリー
- プレミアムインサイト
- 市場概要
- ドライバー
- 地域全体の送電・配電システムの支援と拡張における政府の役割
- 世界中の発電能力の増加
- 高度なインフラとテクノロジーを備えた製品の使用の増加
- 電気自動車の台数と普及率
- 拘束具
- 有毒ガスの排出に関する政府の規制
- 後発開発途上国における生産の課題
- プラスチックの使用はコストと環境に直接影響を与える
- 機会
- 熱収縮チューブはさまざまな業界で幅広く採用されています
- 熱収縮チューブの簡単な製造
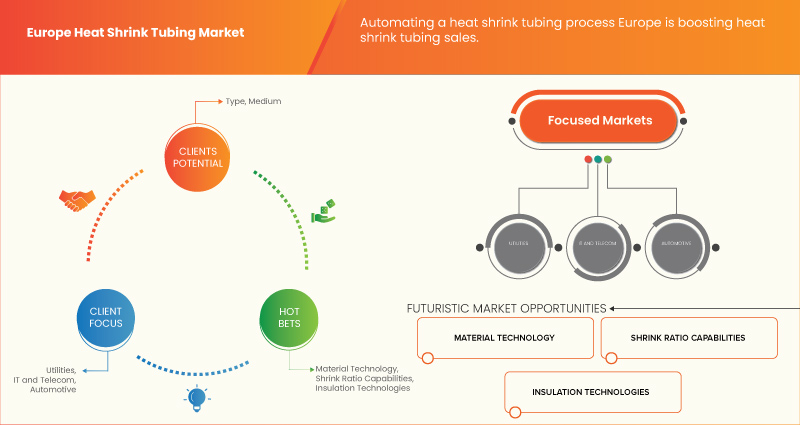
- 熱収縮チューブ製造工程の自動化
- 課題
- 銅、銀、管材原材料の価格上昇
- 熱収縮チューブの不適切な取り付け
- 市場には類似品や安価な製品が存在する
- COVID-19 が欧州の熱収縮チューブ市場に与える影響
- COVID-19が市場に与える影響の分析
- COVID-19後のメーカーが競争力のある市場シェアを獲得するための戦略的決定
- 価格への影響
- 需要に応じたインパクト
- サプライチェーンへの影響
- 結論
- ヨーロッパの熱収縮チューブ市場、タイプ別
- 概要
- シングルウォール
- 二重壁
- ヨーロッパの熱収縮チューブ市場、製品タイプ別
- 概要
- スプール
- カット済み長さ
- その他
- ヨーロッパの熱収縮チューブ市場、電圧別
- 概要
- 低い
- 中くらい
- 高い
- ヨーロッパの熱収縮チューブ市場、材質別
- 概要
- ポリオレフィン
- パーフルオロアルコキシアルカン(PFA)
- ポリテトラフルオロエチレン (PTFE)
- フッ素化エチレンプロピレン(FEP)
- エチレンテトラフルオロエチレン(ETFE)
- ポリエーテルエーテルケトン(PEEK)
- その他
- ヨーロッパの熱収縮チューブ市場、収縮率別
- 概要
- 2:1
- 3:1
- 4:1
- 6:1
- その他
- ヨーロッパの熱収縮チューブ市場、エンドユーザー別
- 概要
- ユーティリティ
- ITおよび通信
- 自動車
- エレクトロニクス
- 航空宇宙
- 健康管理
- 石油とガス
- マリン
- 食品および飲料
- 工事
- コマーシャル
- 居住の
- 化学薬品
- その他
- ヨーロッパの熱収縮チューブ市場(地域別)
- ヨーロッパ
- ドイツ
- フランス
- 英国
- イタリア
- スペイン
- オランダ
- ベルギー
- ロシア
- スイス
- 七面鳥
- その他のヨーロッパ
- ヨーロッパの熱収縮チューブ市場: 企業の状況
- 企業シェア分析: ヨーロッパ
- SWOT分析
- 会社概要
- TEコネクティビティ
- 会社概要
- 収益分析
- 企業株分析
- 製品ポートフォリオ
- 最近の動向
- 住友電気工業株式会社
- 会社概要
- 収益分析
- 企業株分析
- 製品ポートフォリオ
- 最近の動向
- プリスミアングループ
- 会社概要
- 収益分析
- 企業株分析
- 製品ポートフォリオ
- 最近の動向
- ABB社
- 会社概要
- 収益分析
- 企業株分析
- 製品ポートフォリオ
- 最近の動向
- 3M
- 会社概要
- 収益分析
- 企業株分析
- 製品ポートフォリオ
- 最近の開発
- アルファワイヤー
- 会社概要
- 製品ポートフォリオ
- 最近の開発
- アセンブリファスナー株式会社
- 会社概要
- 製品ポートフォリオ
- 最近の開発
- 長春IACテクノロジー株式会社
- 会社概要
- 製品ポートフォリオ
- 最近の開発
- 大勝グループ
- 会社概要
- 企業ポートフォリオ
- 最近の開発
- ヒルトップ
- 会社概要
- 製品ポートフォリオ
- 最近の動向
- 恵州広海電子絶縁材料有限公司
- 会社概要
- 製品ポートフォリオ
- 最近の開発
- グレムコ社
- 会社概要
- 製品ポートフォリオ
- 最近の動向
- ヘラーマンタイトン
- 会社概要
- 製品ポートフォリオ
- 最近の開発
- モレックス
- 会社概要
- 製品ポートフォリオ
- 最近の動向
- ペックスコ
- 会社概要
- 製品ポートフォリオ
- 最近の動向
- クアルテックエレクトロニクス株式会社
- 会社概要
- 製品ポートフォリオ
- 最近の開発
- ショーコール
- 会社概要
- 収益分析
- 製品ポートフォリオ
- 最近の動向
- 深セン WOER 熱収縮材料株式会社
- 会社概要
- 製品ポートフォリオ
- 最近の動向
- テックフレックス株式会社
- 会社概要
- 製品ポートフォリオ
- 最近の開発
- サーモスリーブ 米国
- 会社概要
- 製品ポートフォリオ
- 最近の動向
- ZEUS INDUSTRIAL PRODUCTS, INC.
- COMPANY SNAPSHOT
- PRODUCT PORTFOLIO
- RECENT DEVELOPMENTS
- questionnaire
- related reports
表のリスト
表1 ヨーロッパの熱収縮チューブ市場、タイプ別、2019年~2028年(百万米ドル)
表2 ヨーロッパのシングルウォール熱収縮チューブ市場、地域別、2019年~2028年(百万米ドル)
表3 ヨーロッパの二層熱収縮チューブ市場、地域別、2019年~2028年(百万米ドル)
表4 ヨーロッパの熱収縮チューブ市場、製品タイプ別、市場予測2019-2028(百万米ドル)
表5 ヨーロッパの自動車用マグネットワイヤ市場における単層、地域別、2019年~2028年(百万米ドル)
表6 ヨーロッパの熱収縮チューブ市場におけるプレカット長さ、地域別、2019年~2028年(百万米ドル)
表7 ヨーロッパの熱収縮チューブ市場、地域別、2019年~2028年(百万米ドル)
表8 ヨーロッパの熱収縮チューブ市場、電圧別、市場予測2019-2028(百万米ドル)
表9 ヨーロッパの熱収縮チューブ市場、地域別、2019年~2028年(百万米ドル)
表10 ヨーロッパの自動車用マグネットワイヤ市場中規模地域別、2019年~2028年(百万米ドル)
表11 ヨーロッパの熱収縮チューブ市場、地域別、2019年~2028年(百万米ドル)
表12 ヨーロッパの熱収縮チューブ市場、材質別、2019年~2028年(百万米ドル)
表13 ヨーロッパのポリオレフィン熱収縮チューブ市場、地域別、2019年~2028年、(百万米ドル)
表14 ヨーロッパの熱収縮チューブ市場におけるパーフルオロアルコキシアルカン(PFA)、地域別、2019年~2028年(百万米ドル)
表15 ヨーロッパのポリテトラフルオロエチレン(PTFE)熱収縮チューブ市場、地域別、2019年~2028年(百万米ドル)
表16 ヨーロッパのフッ素化エチレンプロピレン(FEP)熱収縮チューブ市場、地域別、2019年~2028年(百万米ドル)
表17 ヨーロッパのエチレンテトラフルオロエチレン(ETFE)熱収縮チューブ市場、地域別、2019年~2028年(百万米ドル)
表18 ヨーロッパのポリエーテルエーテルケトン(PEEK)熱収縮チューブ市場、地域別、2019年~2028年(百万米ドル)
表19 ヨーロッパの熱収縮チューブ市場、地域別、2019年~2028年(百万米ドル)
表20 ヨーロッパの熱収縮チューブ市場、収縮率別、2019年~2028年(百万米ドル)
表21 ヨーロッパ2:1熱収縮チューブ市場、地域別、2019年~2028年、(百万米ドル)
表22 ヨーロッパ3:1熱収縮チューブ市場、地域別、2019年~2028年、(百万米ドル)
表23 ヨーロッパ 4:1 熱収縮チューブ市場、地域別、2019-2028年、(百万米ドル)
表24 ヨーロッパ6:1熱収縮チューブ市場、地域別、2019年~2028年、(百万米ドル)
表25 ヨーロッパの熱収縮チューブ市場、地域別、2019年~2028年(百万米ドル)
表26 ヨーロッパの熱収縮チューブ市場、エンドユーザー別、2019年~2028年(百万米ドル)
表27 ヨーロッパの熱収縮チューブ市場におけるユーティリティ、地域別、2019年~2028年、(百万米ドル)
表28 ヨーロッパのITおよび通信向け熱収縮チューブ市場、地域別、2019年~2028年、(百万米ドル)
表29 ヨーロッパの自動車用熱収縮チューブ市場、地域別、2019年~2028年、(百万米ドル)
表30 ヨーロッパの電子機器向け熱収縮チューブ市場、地域別、2019年~2028年、(百万米ドル)
表31 ヨーロッパ航空宇宙産業の熱収縮チューブ市場、地域別、2019年~2028年、(百万米ドル)
表32 ヨーロッパのヘルスケア向け熱収縮チューブ市場、地域別、2019年~2028年、(百万米ドル)
表33 ヨーロッパの石油・ガス熱収縮チューブ市場、地域別、2019年~2028年、(百万米ドル)
表34 ヨーロッパの海洋用熱収縮チューブ市場、地域別、2019年~2028年、(百万米ドル)
表35 ヨーロッパの食品・飲料向け熱収縮チューブ市場、地域別、2019年~2028年(百万米ドル)
表36 ヨーロッパの熱収縮チューブ市場、地域別、2019年~2028年(百万米ドル)
表37 ヨーロッパの熱収縮チューブ市場、タイプ別、2019年~2028年(百万米ドル)
表38 ヨーロッパの熱収縮チューブ市場における化学薬品、地域別、2019年~2028年、(百万米ドル)
表 39 ヨーロッパの熱収縮チューブ市場、地域別、2019-2028 年 (百万米ドル)
表40 ヨーロッパの熱収縮チューブ市場、国別、2019年~2028年(百万米ドル)
表41 ヨーロッパの熱収縮チューブ市場、タイプ別、2019年~2028年(百万米ドル)
表42 ヨーロッパの熱収縮チューブ市場、製品タイプ別、2019年~2028年(百万米ドル)
表43 ヨーロッパの熱収縮チューブ市場、電圧別、2019年~2028年(百万米ドル)
表44 ヨーロッパの熱収縮チューブ市場、収縮率別、2019年~2028年(百万米ドル)
表45 ヨーロッパの熱収縮チューブ市場、材質別、2019年~2028年(百万米ドル)
表46 ヨーロッパの熱収縮チューブ市場、エンドユーザー別、2019年~2028年(百万米ドル)
表47 ヨーロッパの熱収縮チューブ市場、タイプ別、2019年~2028年(百万米ドル)
表48 ドイツ熱収縮チューブ市場、タイプ別、2019年~2028年(百万米ドル)
表49 ドイツの熱収縮チューブ市場、製品タイプ別、2019年~2028年(百万米ドル)
表50 ドイツの熱収縮チューブ市場、電圧別、2019年~2028年(百万米ドル)
表51 ドイツの熱収縮チューブ市場、収縮率別、2019年~2028年(百万米ドル)
表52 ドイツ熱収縮チューブ市場、材質別、2019年~2028年(百万米ドル)
表53 ドイツの熱収縮チューブ市場、エンドユーザー別、2019年~2028年(百万米ドル)
表54 ドイツの熱収縮チューブ市場、タイプ別、2019年~2028年(百万米ドル)
表55 フランスの熱収縮チューブ市場、タイプ別、2019年~2028年(百万米ドル)
表56 フランスの熱収縮チューブ市場、製品タイプ別、2019年~2028年(百万米ドル)
表57 フランスの熱収縮チューブ市場、電圧別、2019年~2028年(百万米ドル)
表58 フランスの熱収縮チューブ市場、収縮率別、2019年~2028年(百万米ドル)
表59 フランスの熱収縮チューブ市場、材質別、2019年~2028年(百万米ドル)
表60 フランスの熱収縮チューブ市場、エンドユーザー別、2019年~2028年(百万米ドル)
表61 フランスの熱収縮チューブ市場、タイプ別、2019年~2028年(百万米ドル)
表62 英国熱収縮チューブ市場、タイプ別、2019年~2028年(百万米ドル)
表63 英国熱収縮チューブ市場、製品タイプ別、2019年~2028年(百万米ドル)
表64 英国熱収縮チューブ市場、電圧別、2019年~2028年(百万米ドル)
表65 英国熱収縮チューブ市場、収縮率別、2019年~2028年(百万米ドル)
表66 英国熱収縮チューブ市場、材質別、2019年~2028年(百万米ドル)
表67 英国の熱収縮チューブ市場、エンドユーザー別、2019年~2028年(百万米ドル)
表68 英国建設業向け熱収縮チューブ市場、タイプ別、2019年~2028年(百万米ドル)
表69 イタリアの熱収縮チューブ市場、タイプ別、2019年~2028年(百万米ドル)
表70 イタリアの熱収縮チューブ市場、製品タイプ別、2019年~2028年(百万米ドル)
表71 イタリアの熱収縮チューブ市場、電圧別、2019年~2028年(百万米ドル)
表72 イタリアの熱収縮チューブ市場、収縮率別、2019年~2028年(百万米ドル)
表73 イタリアの熱収縮チューブ市場、材質別、2019年~2028年(百万米ドル)
表 74 イタリアの熱収縮チューブ市場、エンドユーザー別、2019-2028 (百万米ドル)
表75 イタリアの熱収縮チューブ市場、タイプ別、2019年~2028年(百万米ドル)
表76 スペインの熱収縮チューブ市場、タイプ別、2019年~2028年(百万米ドル)
表77 スペインの熱収縮チューブ市場、製品タイプ別、2019年~2028年(百万米ドル)
表 78 スペインの熱収縮チューブ市場、電圧別、2019-2028年(百万米ドル)
表 79 スペインの熱収縮チューブ市場、収縮率別、2019-2028年(百万米ドル)
表80 スペインの熱収縮チューブ市場、材質別、2019年~2028年(百万米ドル)
表81 スペインの熱収縮チューブ市場、エンドユーザー別、2019年~2028年(百万米ドル)
表82 スペインの熱収縮チューブ市場、タイプ別、2019年~2028年(百万米ドル)
表83 オランダの熱収縮チューブ市場、タイプ別、2019年~2028年(百万米ドル)
表84 オランダの熱収縮チューブ市場、製品タイプ別、2019年~2028年(百万米ドル)
表85 オランダの熱収縮チューブ市場、電圧別、2019年~2028年(百万米ドル)
表86 オランダの熱収縮チューブ市場、収縮率別、2019年~2028年(百万米ドル)
表87 オランダの熱収縮チューブ市場、材質別、2019年~2028年(百万米ドル)
表88 オランダの熱収縮チューブ市場、エンドユーザー別、2019年~2028年(百万米ドル)
表89 オランダの熱収縮チューブ市場、タイプ別、2019年~2028年(百万米ドル)
表90 ベルギーの熱収縮チューブ市場、タイプ別、2019年~2028年(百万米ドル)
表91 ベルギーの熱収縮チューブ市場、製品タイプ別、2019年~2028年(百万米ドル)
表92 ベルギーの熱収縮チューブ市場、電圧別、2019年~2028年(百万米ドル)
表93 ベルギーの熱収縮チューブ市場、収縮率別、2019年~2028年(百万米ドル)
表94 ベルギーの熱収縮チューブ市場、材質別、2019年~2028年(百万米ドル)
表95 ベルギーの熱収縮チューブ市場、エンドユーザー別、2019年~2028年(百万米ドル)
表96 ベルギーの建設用熱収縮チューブ市場、タイプ別、2019年~2028年(百万米ドル)
表97 ロシアの熱収縮チューブ市場、タイプ別、2019年~2028年(百万米ドル)
表98 ロシアの熱収縮チューブ市場、製品タイプ別、2019年~2028年(百万米ドル)
表99 ロシアの熱収縮チューブ市場、電圧別、2019年~2028年(百万米ドル)
表 100 ロシアの熱収縮チューブ市場、収縮率別、2019-2028年(百万米ドル)
表 101 ロシアの熱収縮チューブ市場、材質別、2019-2028 (百万米ドル)
表 102 ロシアの熱収縮チューブ市場、エンドユーザー別、2019-2028 年 (百万米ドル)
表103 ロシアの熱収縮チューブ市場、タイプ別、2019年~2028年(百万米ドル)
表 104 スイスの熱収縮チューブ市場、タイプ別、2019-2028 (百万米ドル)
表 105 スイスの熱収縮チューブ市場、製品タイプ別、2019-2028 (百万米ドル)
表 106 スイスの熱収縮チューブ市場、電圧別、2019-2028 年 (百万米ドル)
表 107 スイスの熱収縮チューブ市場、収縮率別、2019-2028年(百万米ドル)
表 108 スイスの熱収縮チューブ市場、材質別、2019-2028 (百万米ドル)
表 109 スイスの熱収縮チューブ市場、エンドユーザー別、2019-2028 年 (百万米ドル)
表110 スイスの熱収縮チューブ市場における建設、タイプ別、2019年~2028年(百万米ドル)
表111 トルコの熱収縮チューブ市場、タイプ別、2019年~2028年(百万米ドル)
表112 トルコの熱収縮チューブ市場、製品タイプ別、2019年~2028年(百万米ドル)
表 113 トルコの熱収縮チューブ市場、電圧別、2019-2028 年 (百万米ドル)
表114 トルコの熱収縮チューブ市場、収縮率別、2019年~2028年(百万米ドル)
表 115 トルコの熱収縮チューブ市場、材質別、2019-2028 (百万米ドル)
表 116 トルコの熱収縮チューブ市場、エンドユーザー別、2019-2028 (百万米ドル)
表117 トルコの熱収縮チューブ市場、タイプ別、2019年~2028年(百万米ドル)
表118 ヨーロッパのその他の地域の熱収縮チューブ市場、タイプ別、2019年~2028年(百万米ドル)
図表一覧
図1 ヨーロッパの熱収縮チューブ市場:セグメンテーション
図2 ヨーロッパの熱収縮チューブ市場:データの三角測量
図3 ヨーロッパの熱収縮チューブ市場: DROC分析
図4 ヨーロッパの熱収縮チューブ市場: ヨーロッパと地域別市場分析
図5 ヨーロッパの熱収縮チューブ市場:企業調査分析
図6 ヨーロッパの熱収縮チューブ市場:インタビュー人口統計
図7 ヨーロッパの熱収縮チューブ市場: DBMR市場ポジショングリッド
図8 ヨーロッパの熱収縮チューブ市場:ベンダーシェア分析
図9 ヨーロッパの熱収縮チューブ市場: セグメンテーション
図10 地域全体の送電・配電システムの支援と拡張における政府の役割の増大が、2021年から2028年の予測期間におけるヨーロッパの熱収縮チューブ市場の牽引役になると予想されます。
図11 単層セグメントは、2021年と2028年にヨーロッパの熱収縮チューブ市場で最大のシェアを占めると予想されています。
図12 ヨーロッパの熱収縮チューブ市場の推進要因、制約要因、機会、課題
図13 ヨーロッパの熱収縮チューブ市場:タイプ別、2020年
図14 ヨーロッパの熱収縮チューブ市場:製品タイプ別、2020年
図15 ヨーロッパの熱収縮チューブ市場:電圧別、2020年
図16 ヨーロッパの熱収縮チューブ市場:材質別、2020年
図17 ヨーロッパの熱収縮チューブ市場:収縮率別、2020年
図18 ヨーロッパの熱収縮チューブ市場:エンドユーザー別、2020年
図19 ヨーロッパの熱収縮チューブ市場:スナップショット(2020年)
図20 ヨーロッパの熱収縮チューブ市場:国別(2020年)
図21 ヨーロッパの熱収縮チューブ市場:国別(2021年および2028年)
図22 ヨーロッパの熱収縮チューブ市場:国別(2020年と2028年)
図23 ヨーロッパの熱収縮チューブ市場:タイプ別(2019-2028年)
図24 ヨーロッパの熱収縮チューブ市場:企業シェア2020(%)
調査方法
データ収集と基準年分析は、大規模なサンプル サイズのデータ収集モジュールを使用して行われます。この段階では、さまざまなソースと戦略を通じて市場情報または関連データを取得します。過去に取得したすべてのデータを事前に調査および計画することも含まれます。また、さまざまな情報ソース間で見られる情報の不一致の調査も含まれます。市場データは、市場統計モデルと一貫性モデルを使用して分析および推定されます。また、市場シェア分析と主要トレンド分析は、市場レポートの主要な成功要因です。詳細については、アナリストへの電話をリクエストするか、お問い合わせをドロップダウンしてください。
DBMR 調査チームが使用する主要な調査方法は、データ マイニング、データ変数が市場に与える影響の分析、および一次 (業界の専門家) 検証を含むデータ三角測量です。データ モデルには、ベンダー ポジショニング グリッド、市場タイムライン分析、市場概要とガイド、企業ポジショニング グリッド、特許分析、価格分析、企業市場シェア分析、測定基準、グローバルと地域、ベンダー シェア分析が含まれます。調査方法について詳しくは、お問い合わせフォームから当社の業界専門家にご相談ください。
カスタマイズ可能
Data Bridge Market Research は、高度な形成的調査のリーダーです。当社は、既存および新規のお客様に、お客様の目標に合致し、それに適したデータと分析を提供することに誇りを持っています。レポートは、対象ブランドの価格動向分析、追加国の市場理解 (国のリストをお問い合わせください)、臨床試験結果データ、文献レビュー、リファービッシュ市場および製品ベース分析を含めるようにカスタマイズできます。対象競合他社の市場分析は、技術ベースの分析から市場ポートフォリオ戦略まで分析できます。必要な競合他社のデータを、必要な形式とデータ スタイルでいくつでも追加できます。当社のアナリスト チームは、粗い生の Excel ファイル ピボット テーブル (ファクト ブック) でデータを提供したり、レポートで利用可能なデータ セットからプレゼンテーションを作成するお手伝いをしたりすることもできます。

