Global Optical Spectrum Analyzer Market Size, Share and Trends Analysis Report
Market Size in USD Billion
CAGR :
% 
 USD
9.98 Billion
USD
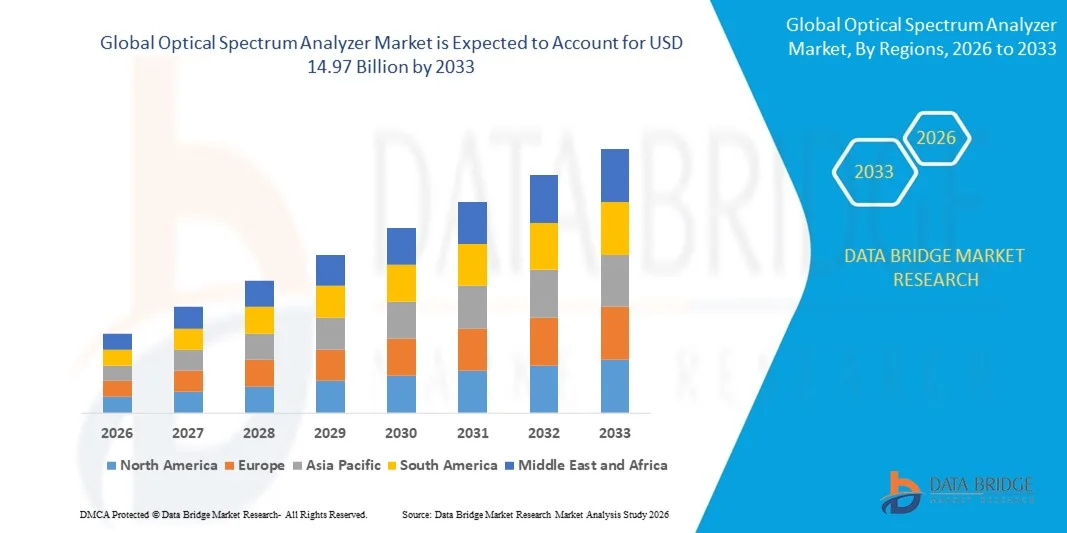
14.97 Billion
2025
2033
USD
9.98 Billion
USD
14.97 Billion
2025
2033
| 2026 –2033 | |
| USD 9.98 Billion | |
| USD 14.97 Billion | |
| % | |
|
Global Optical Spectrum Analyzer Market Segmentation, By Product Type (Portable, Benchtop, and Handheld), Mode Type (Spectrometer Mode and Wavelength Meter Mode), End Use (IT & Telecommunication, Medical & Healthcare, Energy & Utilities, Automotive, Institutions, Aerospace & Defence, and Semiconductors & Electronics) - Industry Trends and Forecast to 2033
What is the Global Optical Spectrum Analyzer Market Size and Growth Rate?
- The global optical spectrum analyzer market size was valued at USD 9.98 billion in 2025 and is expected to reach USD 14.97 billion by 2033, at a CAGR of5.20% during the forecast period
- The high demand from the telecom and manufacturing industry acts as one of the major factors driving the growth of optical spectrum analyzer market
- The rise in demand for connected environments, especially in the manufacturing sector and high need for faster and more reliable communication networks across various industry verticals accelerate the market growth
What are the Major Takeaways of Optical Spectrum Analyzer Market?
- The increase in use in industry for measuring the power of the spectrum of known and unknown signals, and high usage as a precision instrument used to measure optical spectra for further analysis and is highly required by the medical & healthcare industry further influence the market
- In addition, rapid urbanization, emergence of industry 4.0, increase in investments, rising digitization and expansion of end use industry positively affect the optical spectrum analyzer market. Furthermore, introduction of 5G and cloud communications services extend profitable opportunities to the market players
- North America dominated the optical spectrum analyzer market with a 43.2% revenue share in 2025, driven by strong presence of telecom equipment manufacturers, advanced semiconductor R&D, and rapid expansion of hyperscale data centers across the U.S. and Canada
- Asia-Pacific is projected to register the fastest CAGR of 11.4% from 2026 to 2033, driven by rapid fiber-optic network expansion, semiconductor manufacturing growth, and increasing adoption of high-speed broadband across China, Japan, India, and South Korea
- The Benchtop segment dominated the market with a 48.5% share in 2025, supported by its high resolution, superior wavelength accuracy, and wide dynamic range capabilities
Report Scope and Optical Spectrum Analyzer Market Segmentation
|
Attributes |
Optical Spectrum Analyzer Key Market Insights |
|
Segments Covered |
|
|
Countries Covered |
North America
Europe
Asia-Pacific
Middle East and Africa
South America
|
|
Key Market Players |
|
|
Market Opportunities |
|
|
Value Added Data Infosets |
In addition to the insights on market scenarios such as market value, growth rate, segmentation, geographical coverage, and major players, the market reports curated by the Data Bridge Market Research also include in-depth expert analysis, pricing analysis, brand share analysis, consumer survey, demography analysis, supply chain analysis, value chain analysis, raw material/consumables overview, vendor selection criteria, PESTLE Analysis, Porter Analysis, and regulatory framework. |
What is the Key Trend in the Optical Spectrum Analyzer Market?
Accelerating Shift Toward High-Resolution, Portable, and Coherent-Technology Optical Spectrum Analyzers
- The optical spectrum analyzer market is witnessing strong adoption of compact, high-resolution, and real-time analyzers designed to support coherent optical communication, DWDM systems, fiber characterization, and photonic device testing
- Manufacturers are introducing high-dynamic-range, wavelength-selective, and software-defined optical analyzers that offer enhanced resolution bandwidth, faster sweep speeds, and remote monitoring capabilities
- Growing demand for field-deployable and rack-mounted testing solutions is driving usage across telecom operators, data centers, research laboratories, and optical component manufacturers
- For instance, companies such as Keysight Technologies, Rohde & Schwarz, Anritsu, Yokogawa Test & Measurement, and VIAVI Solutions have expanded their optical analyzer portfolios with improved wavelength accuracy, OSNR measurement, and automated fiber testing features
- Increasing need for high-speed optical signal validation, 5G fronthaul/backhaul testing, and hyperscale data center optimization is accelerating the shift toward intelligent and portable OSAs
- As fiber networks become denser and transmission speeds exceed 400G and 800G, Optical Spectrum Analyzers will remain vital for precise wavelength monitoring, network optimization, and photonic R&D
What are the Key Drivers of Optical Spectrum Analyzer Market?
- Rising demand for high-capacity fiber-optic communication networks to support 5G, cloud computing, and high-speed broadband services is significantly boosting analyzer deployment
- For instance, in 2025, leading companies such as Anritsu, VIAVI Solutions, and Keysight Technologies enhanced their OSA solutions to support coherent optical modules, 800G transceivers, and advanced modulation formats
- Growing expansion of data centers, telecom infrastructure upgrades, and fiber-to-the-home (FTTH) installations across the U.S., Europe, and Asia-Pacific is increasing reliance on optical testing equipment
- Advancements in coherent detection technology, tunable lasers, high-speed photodiodes, and automated test software have improved measurement precision and operational efficiency
- Rising adoption of photonic integrated circuits (PICs), optical sensors, and quantum communication systems is creating demand for ultra-high-resolution spectrum analysis
- Supported by sustained investment in telecom modernization, smart connectivity, and optical component innovation, the Optical Spectrum Analyzer market is expected to witness strong long-term growth
Which Factor is Challenging the Growth of the Optical Spectrum Analyzer Market?
- High costs associated with high-resolution, wide-dynamic-range, and coherent-capable optical analyzers restrict adoption among small laboratories and budget-constrained institutions
- For instance, during 2024–2025, fluctuations in photonic component pricing, precision optics supply constraints, and semiconductor shortages increased production costs for several global vendors
- Complexity in analyzing dense wavelength-division multiplexing (DWDM) systems, advanced modulation formats, and high-speed optical signals increases the need for skilled technicians and specialized training
- Limited awareness and technical expertise in emerging markets regarding advanced optical testing methodologies slows broader market penetration
- Competition from integrated optical monitoring modules and multifunctional test platforms creates pricing pressure and reduces standalone OSA differentiation
- To address these challenges, companies are focusing on cost-optimized portable designs, cloud-based analytics integration, modular upgrades, and enhanced training support to accelerate global adoption of optical spectrum analyzers
How is the Optical Spectrum Analyzer Market Segmented?
The market is segmented on the basis of product type, mode type, and end use.
- By Product Type
On the basis of product type, the optical spectrum analyzer market is segmented into Portable, Benchtop, and Handheld. The Benchtop segment dominated the market with a 48.5% share in 2025, supported by its high resolution, superior wavelength accuracy, and wide dynamic range capabilities. Benchtop OSAs are extensively used in research laboratories, telecom equipment manufacturing, and photonic component testing where precise optical signal characterization is critical. Their ability to support DWDM analysis, coherent signal testing, and high-speed transceiver validation makes them ideal for advanced R&D and production environments.
The Portable segment is projected to grow at the fastest CAGR from 2026 to 2033, driven by increasing demand for field testing, fiber network maintenance, and on-site troubleshooting. Rising deployment of 5G infrastructure and fiber-optic networks is accelerating adoption of compact and transportable OSA solutions globally.
- By Mode Type
On the basis of mode type, the market is segmented into Spectrometer Mode and Wavelength Meter Mode. The Spectrometer Mode segment dominated the market with a 57.2% share in 2025, owing to its broad application in analyzing optical signal power distribution across wavelengths. It is widely used for DWDM channel analysis, OSNR measurement, and optical amplifier testing. High spectral resolution and dynamic measurement range make spectrometer mode essential for telecom and semiconductor photonics applications.
The Wavelength Meter Mode segment is expected to grow at the fastest CAGR from 2026 to 2033, supported by increasing demand for ultra-precise wavelength monitoring in coherent optical systems, tunable lasers, and photonic integrated circuits. Growth in high-speed optical communication and laser-based industrial systems is further boosting demand for accurate wavelength measurement solutions.
- By End Use
On the basis of end use, the optical spectrum analyzer market is segmented into IT & Telecommunication, Medical & Healthcare, Energy & Utilities, Automotive, Institutions, Aerospace & Defence, and Semiconductors & Electronics. The IT & Telecommunication segment dominated the market with a 39.8% share in 2025, driven by large-scale fiber network deployments, 5G rollouts, hyperscale data center expansion, and coherent optical transmission upgrades. Telecom operators and network equipment providers rely heavily on OSAs for installation, validation, and maintenance of high-speed fiber links.
The Semiconductors & Electronics segment is projected to grow at the fastest CAGR from 2026 to 2033, propelled by increasing development of photonic integrated circuits, optical sensors, and high-speed optical modules. Expanding investment in optical R&D and advanced chip-scale photonics continues to accelerate demand for high-resolution optical spectrum analysis solutions globally.
Which Region Holds the Largest Share of the Optical Spectrum Analyzer Market?
- North America dominated the optical spectrum analyzer market with a 43.2% revenue share in 2025, driven by strong presence of telecom equipment manufacturers, advanced semiconductor R&D, and rapid expansion of hyperscale data centers across the U.S. and Canada. High deployment of 5G infrastructure, coherent optical transmission systems, and fiber-optic network upgrades continues to fuel demand for high-resolution optical testing solutions across telecom operators and research institutions
- Leading companies in North America are introducing advanced optical spectrum analyzers with higher wavelength accuracy, improved OSNR measurement, coherent signal analysis, and cloud-enabled remote diagnostics, strengthening the region’s technological advantage. Continuous investment in photonics innovation and next-generation broadband infrastructure drives long-term market expansion
- Strong collaboration between telecom providers, optical component manufacturers, and research laboratories further reinforces regional leadership in high-performance optical measurement solutions
U.S. Optical Spectrum Analyzer Market Insight
The U.S. is the largest contributor in North America, supported by rapid 5G deployment, expansion of data centers, and strong photonics research ecosystems. Increasing development of 400G and 800G optical modules, quantum communication research, and high-speed fiber networks intensifies demand for advanced optical spectrum analyzers. Presence of leading test and measurement companies and strong innovation capabilities further accelerates market growth.
Canada Optical Spectrum Analyzer Market Insight
Canada contributes significantly to regional growth, driven by telecom modernization initiatives, expansion of broadband connectivity, and rising investment in optical R&D. Universities and network operators increasingly deploy optical spectrum analyzers for fiber characterization, wavelength monitoring, and infrastructure optimization.
Asia-Pacific Optical Spectrum Analyzer Market
Asia-Pacific is projected to register the fastest CAGR of 11.4% from 2026 to 2033, driven by rapid fiber-optic network expansion, semiconductor manufacturing growth, and increasing adoption of high-speed broadband across China, Japan, India, and South Korea. Strong electronics manufacturing ecosystems and large-scale 5G rollouts significantly boost demand for optical testing solutions. Growing investments in photonic integrated circuits and advanced optical components further accelerate regional market expansion.
China Optical Spectrum Analyzer Market Insight
China is the largest contributor to Asia-Pacific due to large-scale telecom deployments, strong optical component production, and government-supported digital infrastructure projects. Rising adoption of DWDM systems and high-capacity fiber networks drives substantial analyzer demand.
Japan Optical Spectrum Analyzer Market Insight
Japan shows steady growth supported by advanced telecom technology, precision optical manufacturing, and strong research in photonics and laser systems. Increasing deployment of coherent communication systems supports sustained demand.
India Optical Spectrum Analyzer Market Insight
India is emerging as a high-growth market due to expanding fiber-to-the-home (FTTH) projects, 5G rollouts, and growing data center infrastructure. Increasing demand for network validation tools accelerates adoption.
South Korea Optical Spectrum Analyzer Market Insight
South Korea contributes significantly owing to advanced broadband infrastructure, semiconductor leadership, and rapid deployment of next-generation communication technologies. Continuous innovation in optical transmission systems supports long-term market growth.
Which are the Top Companies in Optical Spectrum Analyzer Market?
The optical spectrum analyzer industry is primarily led by well-established companies, including:
- Keysight Technologies (U.S.)
- Rohde & Schwarz (Germany)
- Anritsu (Japan)
- Advantest Corporation (Japan)
- VIAVI Solutions Inc. (U.S.)
- Giga-tronics Incorporated (U.S.)
- Yokogawa Test & Measurement Corporation (Japan)
- National Instruments (U.S.)
- LP Technologies (U.S.)
- Teledyne LeCroy (U.S.)
- AVCOM (U.S.)
- B&K Precision Corporation (U.S.)
- Stanford Research Systems (U.S.)
- GSAS Micro Systems Private Limited (India)
- Aaronia AG (Germany)
- SAF Tehnika (Latvia)
- Rajshree Electro Systems (India)
What are the Recent Developments in Global Optical Spectrum Analyzer Market?
- In April 2025, Yokogawa Test & Measurement Corporation introduced the AQ6380 Optical Spectrum Analyzer featuring an extended dynamic range to improve precision in high-performance optical measurements, strengthening its portfolio for advanced telecom and photonics testing applications
- In April 2025, Anritsu launched the MS9740B Optical Spectrum Analyzer with enhanced sweep speeds, enabling faster and more efficient analysis of high-capacity optical communication systems, thereby supporting next-generation network validation requirements
- In March 2025, Teradyne acquired Quantifi Photonics to integrate a grating-based Optical Spectrum Analyzer platform offering up to 5.5 µm wavelength reach, expanding its photonics test capabilities and reinforcing its position in optical component validation markets
- In March 2025, Ciena unveiled the 8192 coherent router equipped with WaveLogic 6 Nano 800G optics, increasing the need for high-bandwidth Optical Spectrum Analyzers to validate ultra-high-speed coherent transmission systems across modern data networks
- In March 2025, Coherent Corp. launched advanced pluggable transceivers optimized for AI-driven data center networks, accelerating demand for high-resolution Optical Spectrum Analyzers to support testing of high-speed optical interconnects
SKU-
世界初のマーケットインテリジェンスクラウドに関するレポートにオンラインでアクセスする

- インタラクティブなデータ分析ダッシュボード
- 成長の可能性が高い機会のための企業分析ダッシュボード
- カスタマイズとクエリのためのリサーチアナリストアクセス
- インタラクティブなダッシュボードによる競合分析
- 最新ニュース、更新情報、トレンド分析
- 包括的な競合追跡のためのベンチマーク分析のパワーを活用
調査方法
データ収集と基準年分析は、大規模なサンプル サイズのデータ収集モジュールを使用して行われます。この段階では、さまざまなソースと戦略を通じて市場情報または関連データを取得します。過去に取得したすべてのデータを事前に調査および計画することも含まれます。また、さまざまな情報ソース間で見られる情報の不一致の調査も含まれます。市場データは、市場統計モデルと一貫性モデルを使用して分析および推定されます。また、市場シェア分析と主要トレンド分析は、市場レポートの主要な成功要因です。詳細については、アナリストへの電話をリクエストするか、お問い合わせをドロップダウンしてください。
DBMR 調査チームが使用する主要な調査方法は、データ マイニング、データ変数が市場に与える影響の分析、および一次 (業界の専門家) 検証を含むデータ三角測量です。データ モデルには、ベンダー ポジショニング グリッド、市場タイムライン分析、市場概要とガイド、企業ポジショニング グリッド、特許分析、価格分析、企業市場シェア分析、測定基準、グローバルと地域、ベンダー シェア分析が含まれます。調査方法について詳しくは、お問い合わせフォームから当社の業界専門家にご相談ください。
カスタマイズ可能
Data Bridge Market Research は、高度な形成的調査のリーダーです。当社は、既存および新規のお客様に、お客様の目標に合致し、それに適したデータと分析を提供することに誇りを持っています。レポートは、対象ブランドの価格動向分析、追加国の市場理解 (国のリストをお問い合わせください)、臨床試験結果データ、文献レビュー、リファービッシュ市場および製品ベース分析を含めるようにカスタマイズできます。対象競合他社の市場分析は、技術ベースの分析から市場ポートフォリオ戦略まで分析できます。必要な競合他社のデータを、必要な形式とデータ スタイルでいくつでも追加できます。当社のアナリスト チームは、粗い生の Excel ファイル ピボット テーブル (ファクト ブック) でデータを提供したり、レポートで利用可能なデータ セットからプレゼンテーションを作成するお手伝いをしたりすることもできます。

