Asia Pacific Green Bio Polyols Market
시장 규모 (USD 10억)
연평균 성장률 :
% 
 USD
342.34 Million
USD
597.66 Million
2024
2032
USD
342.34 Million
USD
597.66 Million
2024
2032
| 2025 –2032 | |
| USD 342.34 Million | |
| USD 597.66 Million | |
| % | |
Asia Pacific Green and Bio Polyols Market Segmentation, By Type (Polyether Polyols and Polyester Polyols), Application (Foam, Coatings, Adhesives, Sealants, Elastomers, and Others)– Industry Trends and Forecast to 2032
Green and Bio Polyols Market Analysis
Asia Pacific green and bio polyols market has an increasing demand for rigid and flexible polyurethane in various applications like sports and athletic footwear, as consumers are increasingly seek eco-friendly alternatives that minimize environmental impact while ensuring sustainable practices and less environmental effect, thereby driving market growth.
Green and Bio Polyols Market Size
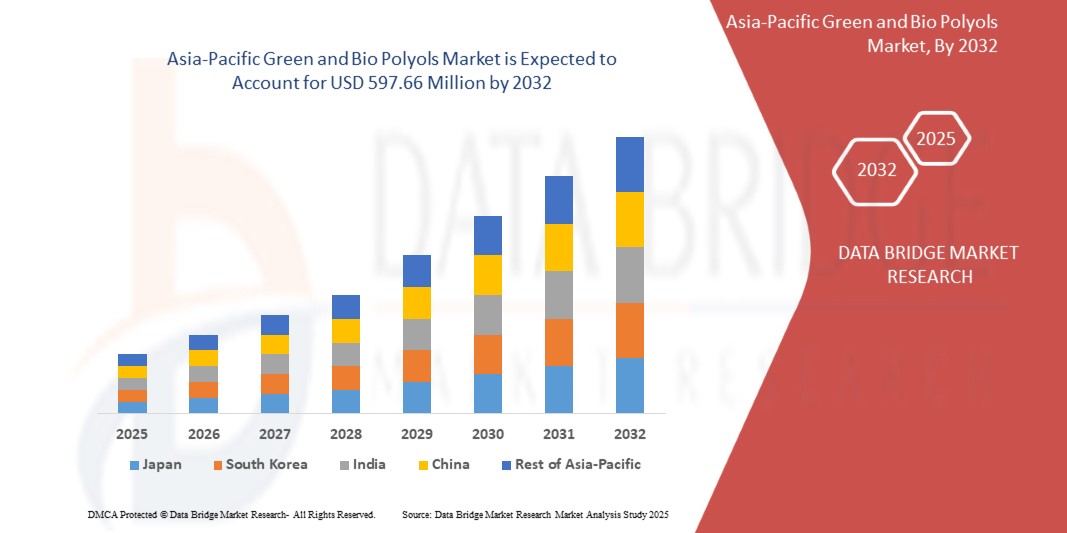
Asia Pacific green and bio polyols market is expected to reach USD 597.66 million by 2032 from USD 342.34 million in 2024, growing with a substantial CAGR of 7.3% in the forecast period of 2025 to 2032. In addition to the insights on market scenarios such as market value, growth rate, segmentation, geographical coverage, and major players, the market reports curated by the Data Bridge Market Research also include in-depth expert analysis, pricing analysis, brand share analysis, consumer survey, demography analysis, supply chain analysis, value chain analysis, raw material/consumables overview, vendor selection criteria, PESTLE Analysis, Porter Analysis, and regulatory framework.
Green and Bio Polyols Market Trends
“Rising Awareness of Sustainable Materials ”
The growing Asia-Pacific emphasis on sustainability is significantly influencing the demand for green and bio-based polyols, reshaping the market landscape. With increased awareness of the environmental consequences of fossil fuel-derived products, consumers and industries alike are shifting toward sustainable materials. This paradigm shift has catalyzed innovation and adoption of green and bio polyols, which are derived from renewable resources like plant-based oils and recycled materials.
Key industries such as construction, automotive, and packaging are embracing these eco-friendly polyols to align with stricter regulatory frameworks and evolving consumer preferences. Governments across regions are introducing incentives and mandates to curb carbon footprints, which further propels the demand for bio-based alternatives. In the automotive industry, rising consumer preference for vehicles with reduced environmental impact is driving the adoption of bio-polyurethane foams, which are widely used in seating, interiors, and insulation. Similarly, the construction sector is leveraging green polyols for energy-efficient insulation materials, meeting the growing demand for green building certifications such as LEED.
Moreover, multinational corporations are increasingly integrating sustainability into their branding strategies, opting for eco-friendly raw materials to enhance their market reputation. This shift not only addresses corporate social responsibility (CSR) goals but also positions these companies as innovators in an eco-conscious marketplace. In addition to it, heightened consumer awareness, driven by education campaigns and media coverage, has transformed sustainability from a niche concern into a mainstream market driver. This rising consciousness is reshaping buying patterns across sectors, creating robust demand for sustainable solutions like green and bio polyols.
Report Scope and Market Segmentation
|
Attributes |
Green and Bio Polyols Market Key Market Insights |
|
Segments Covered |
|
|
Countries Covered |
China, Japan, South Korea, India, Australia and New Zealand, Singapore, Malaysia, Thailand, Indonesia, Philippines, Rest of Asia-Pacific |
|
Key Market Players |
Cargill, Incorporated (U.S.), BASF SE (Germany), Emery Oleochemicals (U.S.), Stepan Company (U.S.), Wanhua (China), ALBERDINGK BOLEY GmbH (Germany), and Aurorium (U.S.) |
|
Market Opportunities |
|
|
Value Added Data Infosets |
In addition to the insights on market scenarios such as market value, growth rate, segmentation, geographical coverage, and major players, the market reports curated by the Data Bridge Market Research also include in-depth expert analysis, pricing analysis, brand share analysis, consumer survey, demography analysis, supply chain analysis, value chain analysis, raw material/consumables overview, vendor selection criteria, PESTLE Analysis, Porter Analysis, and regulatory framework. |
Green and Bio Polyols Market Definition
Green and bio polyols are environmentally friendly alternatives to conventional polyols used in the production of polyurethane foams, coatings, adhesives, and elastomers. These polyols are derived from renewable resources such as vegetable oils (e.g., soy, castor, or palm oil), natural sugars, or another biomass. They help reduce reliance on petroleum-based feedstock and contribute to lower greenhouse gas emissions during production. Green polyols emphasize sustainable production methods with minimal environmental impact, whereas bio polyols specifically highlight their biological or renewable origin. Both types retain comparable chemical and physical properties to traditional polyols, making them suitable for diverse industrial applications. Additionally, they support circular economy principles, with some being recyclable or biodegradable. The use of green and bio polyols aligns with growing Asia-Pacific demands for sustainable materials in sectors like automotive, construction, and packaging, as industries transition toward eco-friendly manufacturing solutions.
Green and Bio Polyols Market Dynamics
Drivers
- Increasing Demand for Rigid and Flexible Polyurethane in Various Applications Like Sports and Athletic Footwear
The growing demand for rigid and flexible polyurethane in diverse applications, particularly in sports and athletic footwear, is a key driver accelerating the growth of the Asia-Pacific green and bio polyols market. As industries increasingly prioritize sustainability, the adoption of bio-based polyols for polyurethane production is gaining momentum, especially in high-demand sectors such as footwear. In the sports and athletic footwear industry, polyurethane plays a crucial role due to its lightweight, durable, and versatile properties. Rigid polyurethanes are widely used for structural components, while flexible variants are integral in cushioning and midsole applications. With rising consumer preference for eco-friendly products, footwear manufacturers are shifting toward bio-based polyurethanes to meet market demands and align with sustainability goals. Leading sportswear brands like Adidas, Nike, and Puma are at the forefront of this transformation. For instance, Adidas’ Futurecraft. Footprint sneakers incorporate bio-based polyurethane derived from renewable materials, reflecting the brand's commitment to reducing its environmental impact. Similarly, Nike is integrating bio-polyols in its product lines to create performance footwear that balances sustainability and functionality. The market for bio-polyols is further propelled by increasing awareness among consumers regarding the environmental impact of conventional polyurethane. As customers demand greener alternatives, companies are leveraging bio-based polyols to differentiate their products and strengthen their market positioning. Additionally, the rise of athleisure as a lifestyle trend is expanding the application scope of polyurethane, driving higher production volumes of bio-based variants. The ability of green and bio polyols to reduce greenhouse gas emissions and reliance on fossil fuels aligns seamlessly with Asia-Pacific environmental targets, attracting investments from industry players. For Instance, Allbirds utilizes bio-based polyurethane derived from sugarcane in its footwear. The company’s SweetFoam innovation has become a benchmark in the industry for sustainable midsole production, further driving demand for green polyols
- Circular Economy Focuses on Maximizing Resource Efficiency by Minimizing Waste and Promoting the Reuse
The concept of a circular economy is rapidly gaining traction across industries, and its focus on maximizing resource efficiency by minimizing waste and promoting the reuse of materials is becoming a key driver of the Asia-Pacific green and bio polyols market. This economic model encourages manufacturers to adopt sustainable practices, such as using renewable resources, reducing energy consumption, and recycling materials, which aligns seamlessly with the growing demand for environmentally friendly solutions in the production of polyurethane products. In a circular economy, the emphasis is on reducing the reliance on virgin, petroleum-based resources and instead utilizing bio-based alternatives, such as green and bio polyols. These renewable polyols are derived from plant-based feedstocks or waste materials, contributing to a reduction in greenhouse gas emissions and supporting sustainable production processes. This shift is particularly important in industries such as automotive, construction, and consumer goods, where the use of traditional, non-renewable materials is being increasingly scrutinized. Leading companies are embracing circular economy principles by incorporating bio-based polyols into their product offerings. For example, BASF’s PolyTHF products, used in various applications, are now produced with a focus on sustainability and renewable feedstocks, contributing to a circular economy. Likewise, Covestro’s commitment to circularity is evident in its development of polyurethanes based on recycled CO2 and bio-based polyols, reducing reliance on fossil fuels and promoting a more sustainable supply chain
Opportunities
- Increased Construction Activities, Particularly in Emerging Economies
Regulatory push for eco-friendly products is creating a significant opportunity for the Asia-Pacific Green and Bio Polyols Market. As governments worldwide implement stricter environmental regulations and sustainability targets, there is a growing demand for products made from renewable and biodegradable materials. Bio-based polyols, which are used in the production of sustainable foams, coatings, and adhesives, align with these regulatory requirements, offering an alternative to petroleum-based products. This shift is further supported by green building certifications and energy-efficient standards, encouraging manufacturers to adopt eco-friendly materials in their products. Consequently, these regulatory trends drive the market for green and bio polyols, fostering innovation and expansion in various industries, including construction, automotive, and packaging. he regulatory push for eco-friendly products will create substantial opportunities for the Asia-Pacific green and bio polyols market by encouraging the transition to more sustainable, renewable alternatives. As governments implement stricter environmental regulations and set ambitious sustainability goals, companies will be driven to adopt bio-based and circular solutions to meet these requirements. This regulatory shift will foster innovation, improve the availability of sustainable polyols, and align with the growing consumer preference for environmentally conscious products.
- Regulatory Push for Eco-Friendly Products
Regulatory push for eco-friendly products is creating a significant opportunity for the global Green and Bio Polyols Market. As governments worldwide implement stricter environmental regulations and sustainability targets, there is a growing demand for products made from renewable and biodegradable materials. Bio-based polyols, which are used in the production of sustainable foams, coatings, and adhesives, align with these regulatory requirements, offering an alternative to petroleum-based products. This shift is further supported by green building certifications and energy-efficient standards, encouraging manufacturers to adopt eco-friendly materials in their products. Consequently, these regulatory trends drive the market for green and bio polyols, fostering innovation and expansion in various industries, including construction, automotive, and packaging. In conclusion, the regulatory push for eco-friendly products will create substantial opportunities for the global green and bio polyols market by encouraging the transition to more sustainable, renewable alternatives. As governments implement stricter environmental regulations and set ambitious sustainability goals, companies will be driven to adopt bio-based and circular solutions to meet these requirements. This regulatory shift will foster innovation, improve the availability of sustainable polyols, and align with the growing consumer preference for environmentally conscious products.
Restraints/Challenges
- Stringent regulations regarding use of Green and Bio Polyols
The high production cost associated with bio-based polyols remains a critical restraint for their widespread adoption in the Asia-Pacific market. Unlike conventional polyols, which benefit from mature, cost-efficient manufacturing processes and established supply chains, bio-based polyols rely on renewable raw materials such as plant oils, agricultural waste, or other biomass. These feedstocks often involve complex extraction, refining, and processing steps that significantly increase production costs. One of the primary drivers of these elevated costs is the dependency on advanced technologies and infrastructure to convert bio-based feedstocks into high-quality polyols. These technologies, including enzymatic processing or fermentation, require substantial capital investments and operational expenditures. Additionally, economies of scale are yet to be achieved in the bio-based polyol segment, further exacerbating the cost disparity with petroleum-based alternatives. The variability and limited availability of feedstocks also contribute to high costs. Factors such as fluctuating agricultural yields, seasonal constraints, and competition from other industries using the same biomass resources can drive up raw material prices. For instance, soybean or castor oil, commonly used in bio-polyol production, often face pricing pressures due to demand from the food and biofuel sectors. These cost factors make bio-based polyols less attractive for price-sensitive industries, such as packaging, automotive, and consumer goods. Companies may hesitate to transition from conventional polyols, particularly in markets where sustainability certifications do not provide significant competitive advantage or consumer willingness to pay a premium is limited.
- Stringent Regulation for Polyols (Polyurethane) Production
Stringent regulations for polyols (polyurethane) production present significant challenges for the Asia-Pacific Green and Bio Polyols Market by increasing compliance costs and operational complexities. Regulations such as the NESHAP in the U.S., REACH in Europe, and various national laws around the world require companies to invest in advanced technologies to reduce emissions, ensure chemical safety, and meet environmental standards. These regulations often demand extensive testing, documentation, and adjustments in manufacturing processes, which can slow production, increase operational costs, and create barriers to market entry, particularly for companies transitioning to sustainable and bio-based production methods. For instance
United States
National Emission Standards for Hazardous Air Pollutants (NESHAP) Rules for new and existing plant facilities to reduce hazardous air pollutant emissions by ~70%, leading to higher compliance costs and potential operational delays.
Europe
REACH (Registration, Evaluation, Authorization and Restriction of Chemicals) Comprehensive regulations requiring safety testing and documentation for chemicals, impacting the production process and increasing R&D costs for compliance.
India
Environmental Protection Act, 1986 Regulations to control pollution and ensure safe manufacturing practices, necessitating adherence to environmental safety protocols, which may increase production costs.
Impact and Current Market Scenario of Raw Material Shortage and Shipping Delays
Data Bridge Market Research offers a high-level analysis of the market and delivers information by keeping in account the impact and current market environment of raw material shortage and shipping delays. This translates into assessing strategic possibilities, creating effective action plans, and assisting businesses in making important decisions.
Apart from the standard report, we also offer in-depth analysis of the procurement level from forecasted shipping delays, distributor mapping by region, commodity analysis, production analysis, price mapping trends, sourcing, category performance analysis, supply chain risk management solutions, advanced benchmarking, and other services for procurement and strategic support.
Expected Impact of Economic Slowdown on the Pricing and Availability of Products
When economic activity slows, industries begin to suffer. The forecasted effects of the economic downturn on the pricing and accessibility of the products are taken into account in the market insight reports and intelligence services provided by DBMR. With this, our clients can typically keep one step ahead of their competitors, project their sales and revenue, and estimate their profit and loss expenditures.
Asia-Pacific Green and Bio Polyols Market Scope
The market is segmented on the basis of type and application. The growth amongst these segments will help you analyze meagre growth segments in the industries and provide the users with a valuable market overview and market insights to help them make strategic decisions for identifying core market applications.
Type
- Polyether Polyols
- Polyester Polyols
Application
- Foam
- Coatings
- Adhesives
- Sealants
- Elastomers
- Others
Asia-Pacific Green and Bio Polyols Market Regional Analysis
The market is analyzed and market size insights and trends are provided by country, type, and application as referenced above.
The countries covered in the market are China, Japan, South Korea, India, Australia and New Zealand, Singapore, Malaysia, Thailand, Indonesia, Philippines, Rest of Asia-Pacific.
China is dominating the Asia Pacific green and bio polyols market due to its large-scale manufacturing capabilities and strong government support for sustainable and eco-friendly initiatives. The country is a major producer of bio-based raw materials, providing a solid foundation for the production of green and bio polyols.
China is also expected to be the fastest-growing country in the Asia Pacific green and bio polyols market because of increasing demand for environmentally friendly products in industries like automotive, construction, and furniture.
The country section of the report also provides individual market impacting factors and changes in regulation in the market domestically that impacts the current and future trends of the market. Data points like down-stream and upstream value chain analysis, technical trends and porter's five forces analysis, case studies are some of the pointers used to forecast the market scenario for individual countries. Also, the presence and availability of Asia-Pacific brands and their challenges faced due to large or scarce competition from local and domestic brands, impact of domestic tariffs and trade routes are considered while providing forecast analysis of the country data.
Asia-Pacific Green and Bio Polyols Market Share
The market competitive landscape provides details by competitors. Details included are company overview, company financials, revenue generated, market potential, investment in research and development, new market initiatives, Asia-Pacific presence, production sites and facilities, production capacities, company strengths and weaknesses, product launch, product width and breadth, application dominance. The above data points provided are only related to the companies' focus related to market.
Green and Bio Polyols Market Leaders Operating in the Market Are:
- Cargill, Incorporated (U.S.)
- BASF SE (Germany)
- Emery Oleochemicals (U.S.)
- Stepan Company (U.S.)
- Wanhua (China)
- ALBERDINGK BOLEY GmbH (Germany)
- Aurorium (U.S.)
Latest Developments in Green and Bio Polyols Market
- In November 2024, Krishna Enterprise and Alberdingk Boley announced their collaboration in water-based acrylic dispersions for the Indian market. Since 1985, Krishna Enterprise has provided innovative solutions in coatings, and Gaurang Goradia visited Alberdingk in October to sign the partnership agreement
- In October 2024, Cargill has been awarded the INDI 4.0 2024 Smart Factory award by Indonesia’s Ministry of Industry for successfully implementing Industry 4.0 technologies at its cocoa processing facility in Gresik. This recognition highlights Cargill’s commitment to advanced manufacturing practices, including automation, real-time data monitoring, and energy management, aimed at enhancing efficiency and sustainability
- In July 2023, Stepan received the World Finance Sustainability Award 2023, recognizing their commitment to sustainability and eco-friendly practices. The award highlights Stepan's efforts in creating innovative, environmentally responsible solutions across industries, reinforcing their leadership in sustainable business practices
- In June 2024, Aurorium, a specialty ingredients manufacturer, announced the launch of Haelium Pharmaceutical Solutions, reflecting its long-term commitment to healthcare. Built on decades of innovation, the Haelium product line established Aurorium as a Asia-Pacific leader in pharmaceutical ingredients, embodying a unique approach to excellence
- In June 2024, BASF has expanded its portfolio by introducing biomass-balanced (BMB) ecoflex, a certified compostable biopolymer for the packaging industry. This ecoflexF Blend C1200 BMB uses renewable feedstock from organic waste, reducing fossil resource consumption and offering a 60% lower carbon footprint
SKU-
세계 최초의 시장 정보 클라우드 보고서에 온라인으로 접속하세요

- 대화형 데이터 분석 대시보드
- 높은 성장 잠재력 기회를 위한 회사 분석 대시보드
- 사용자 정의 및 질의를 위한 리서치 분석가 액세스
- 대화형 대시보드를 통한 경쟁자 분석
- 최신 뉴스, 업데이트 및 추세 분석
- 포괄적인 경쟁자 추적을 위한 벤치마크 분석의 힘 활용
목차
1 서론
1.1 연구 목적
1.2 시장 정의
1.3 개요
1.4 제한 사항
1.5 대상 시장
2 시장 세분화
2.1 대상 시장
2.2 지리적 범위
연구에 2.3년이 고려됨
2.4 통화 및 가격
2.5 DBMR TRIPOD 데이터 검증 모델
2.6 다변량 모델링
2.7 주요 여론 선도자와의 1차 인터뷰
2.8 DBMR 시장 위치 그리드
2.9 DBMR 공급업체 점유율 분석
2.1 시장 적용 범위 그리드
2.11 2차 소스
2.12 가정
3 요약
4가지 프리미엄 인사이트
4.1 PESTEL 분석
4.1.1 정치적 요인
4.1.2 경제적 요인
4.1.3 사회적 요인
4.1.4 기술적 요인
4.1.5 환경 요인
4.1.6 법적 요소
4.1.7 결론
4.2 포터의 5가지 힘
4.2.1 신규 진입자의 위협
4.2.2 대체품의 위협
4.2.3 공급업체의 협상력
4.2.4 구매자의 협상력
4.2.5 경쟁적 경쟁
4.3 수입 수출 시나리오
4.4 가격 지수
4.5 생산 소비 분석
4.6 공급업체 선택 기준
4.6.1 품질 및 일관성
4.6.2 기술 전문성
4.6.3 공급망 신뢰성
4.6.4 규정 준수 및 지속 가능성
4.6.5 비용 및 가격 구조
4.6.6 재정 안정성
4.6.7 유연성 및 사용자 정의
4.6.8 위험 관리 및 비상 계획
4.7 기후 변화 시나리오
4.7.1 환경 문제
4.7.2 업계의 대응
4.7.3 정부의 역할
4.7.4 분석가 권장 사항
4.8 생산 능력 개요
4.8.1 현재 생산 용량
4.8.2 생산능력의 지역적 분포
4.8.3 기술적 진보와 혁신
4.8.4 용량 확장 및 미래 예측
4.9 원자재 적용 범위
4.9.1 식물성 오일
4.9.1.1 피마자유
4.9.1.2 대두유
4.9.1.3 팜 오일
4.9.2 농업 잔류물 및 폐기물 바이오매스
4.9.2.1 옥수수대
4.9.2.2 밀짚과 벼 껍질
4.9.3 설탕 기반 원료
4.9.3.1 당알코올
4.9.4 조류 및 기타 새로운 출처
4.9.4.1 조류
4.9.5 폐유 및 부산물
4.9.5.1 사용된 식용유
4.9.6 결론
4.1 공급망 분석
4.10.1 개요
4.10.2 물류 비용 시나리오
4.10.2.1 운송 비용
4.10.2.2 보관 및 재고 관리
4.10.2.3 아시아 태평양 공급망 중단
4.10.3 물류 서비스 제공자의 중요성
4.10.3.1 원자재 조달 및 운송
4.10.3.2 물류의 지속 가능성
4.10.3.3 아시아 태평양 유통 및 공급망 조정
4.10.3.4 기술적 통합
4.10.4 결론
4.11 제조업체의 기술 발전
4.11.1 원료 혁신 및 원자재 최적화
4.11.1.1 고급 촉매 및 녹색 화학
4.11.1.2 원료 다각화
4.11.2 고급 생산 기술
4.11.2.1 생촉매 및 효소 공정
4.11.2.2 친환경 용매 및 무용매 공정
4.11.2.3 연속 및 유동 화학
4.11.3 프로세스 통합 및 에너지 효율성
4.11.3.1 열 통합 및 에너지 회수
4.11.3.2 프로세스 강화
4.11.4 성능 및 제품 혁신
4.11.4.1 특정 응용 분야를 위한 맞춤형 바이오 폴리올
4.11.4.2 향상된 내구성 및 안정성
4.11.5 순환 경제 및 폐기물 감소
4.11.5.1 생물 기반 폴리올의 재활용
4.11.5.2 제로 웨이스트 제조
4.11.6 결론
5 규정 적용 범위
5.1 환경 규정 및 표준
5.1.1 탄소발자국 및 온실 가스 배출
5.1.2 지속 가능성 및 생분해성
5.1.3 REACH 및 화학 물질 안전 규정
5.2 원료 조달 및 농업 규정
5.2.1 원자재의 지속 가능한 조달
5.2.2 농업 환경 규정
5.2.3 추적성 및 인증
5.3 제품 안전 및 규정 준수
5.3.1 안전 및 독성 규정
5.3.2 인화성 표준
5.4 순환 경제 및 폐기물 관리 규정
5.4.1 확장 생산자 책임(EPR)
5.4.2 플라스틱 폐기물 및 포장 규정
5.5 지역 규정 및 표준
5.6 결론
6 시장 개요
6.1 드라이버
6.1.1 지속 가능한 재료에 대한 인식 증가
6.1.2 스포츠 및 운동화와 같은 다양한 응용 분야에서 강성 및 유연성 폴리우레탄에 대한 수요 증가
6.1.3 순환경제는 폐기물을 최소화하고 재사용을 촉진하여 자원 효율성을 극대화하는 데 중점을 둡니다.
6.2 제약
6.2.1 기존 폴리올과 비교한 성능 한계
6.2.2 생물 기반 폴리올의 높은 생산 비용
6.3 기회
6.3.1 특히 신흥 경제권에서의 건설 활동 증가
6.3.2 친환경 제품에 대한 규제 강화
6.3.3 생산의 기술적 발전
6.4 도전
6.4.1 폴리올(폴리우레탄) 생산에 대한 엄격한 규제
7 아시아 태평양 녹색 및 바이오 폴리올 시장, 유형별
7.1 개요
7.2 폴리에테르 폴리올
7.3 폴리에스터 폴리올
8 아시아 태평양 녹색 및 바이오 폴리올 시장, 응용 분야별
8.1 개요
8.2 폼
8.3 코팅
8.4 접착제
8.5 실런트
8.6 엘라스토머
8.7 기타
9 아시아 태평양 녹색 및 바이오 폴리올 시장, 지역별
9.1 아시아 태평양
9.1.1 중국
9.1.2 일본
9.1.3 대한민국
9.1.4 인도
9.1.5 호주 및 뉴질랜드
9.1.6 싱가포르
9.1.7 말레이시아
9.1.8 태국
9.1.9 인도네시아
9.1.10 필리핀
9.1.11 아시아 태평양의 나머지 지역
10 아시아 태평양 녹색 및 바이오 폴리올 시장: 회사 환경
10.1 회사 점유율 분석: 아시아 태평양
11 SWOT 분석
12 회사 프로필
12.1 카길 주식회사
12.1.1 회사 스냅샷
12.1.2 회사 점유율 분석
12.1.3 제품 포트폴리오
12.1.4 최근 개발
12.2 바스프
12.2.1 회사 스냅샷
12.2.2 수익 분석
12.2.3 회사 점유율 분석
12.2.4 제품 포트폴리오
12.2.5 최근 개발
12.3 에머리 올레오케미컬
12.3.1 회사 스냅샷
12.3.2 회사 점유율 분석
12.3.3 제품 포트폴리오
12.3.4 최근 개발
12.4 스테판 회사
12.4.1 회사 스냅샷
12.4.2 수익 분석
12.4.3 회사 점유율 분석
12.4.4 제품 포트폴리오
12.4.5 최근 개발
12.5 폴리랩스 TM.
12.5.1 회사 스냅샷
12.5.2 회사 점유율 분석
12.5.3 제품 포트폴리오
12.5.4 최근 개발
12.6 알베르딩크 볼레이 GMBH
12.6.1 회사 스냅샷
12.6.2 제품 포트폴리오
12.6.3 최근 개발
12.7 오로리움
12.7.1 회사 스냅샷
12.7.2 제품 포트폴리오
12.7.3 최근 개발
12.8 생물 기반 기술
12.8.1 회사 스냅샷
12.8.2 제품 포트폴리오
12.8.3 최근 개발
12.9 완화
12.9.1 회사 스냅샷
12.9.2 수익 분석
12.9.3 제품 포트폴리오
12.9.4 최근 개발
13 설문지
14 관련 보고서
표 목록
표 1 폴리올(폴리우레탄) 생산에 대한 국가별 규정
표 2 아시아 태평양 녹색 및 바이오 폴리올 시장, 유형별, 2018-2032 (USD 천)
표 3 아시아 태평양 녹색 및 바이오 폴리올 시장, 유형별, 2018-2032 (킬로톤)
표 4 아시아 태평양 폴리에테르 폴리올의 녹색 및 바이오 폴리올 시장, 세그먼트별, 2018-2032 (USD 천)
표 5 아시아 태평양 폴리에테르 폴리올의 녹색 및 바이오 폴리올 시장, 범주별, 2018-2032 (USD 천)
표 6 아시아 태평양 폴리에스터 폴리올, 녹색 및 바이오 폴리올 시장, 세그먼트별, 2018-2032 (USD 천)
표 7 아시아 태평양 폴리에스터 폴리올의 녹색 및 바이오 폴리올 시장, 범주별, 2018-2032 (USD 천)
표 8 아시아 태평양 녹색 및 바이오 폴리올 시장, 응용 분야별, 2018-2032 (USD 천)
표 9 아시아 태평양 지역 녹색 및 바이오 폴리올 시장, 세그먼트별, 2018-2032 (USD 천)
표 10 아시아 태평양 녹색 및 바이오 폴리올 시장, 국가별, 2018-2032 (USD 천)
표 11 아시아 태평양 녹색 및 바이오 폴리올 시장, 국가별, 2018-2032 (킬로톤)
표 12 아시아 태평양 녹색 및 바이오 폴리올 시장, 유형별, 2018-2032 (USD 천)
표 13 아시아 태평양 녹색 및 바이오 폴리올 시장, 유형별, 2018-2032 (킬로톤)
표 14 아시아 태평양 폴리에테르 폴리올의 녹색 및 바이오 폴리올 시장, 세그먼트별, 2018-2032 (USD 천)
표 15 아시아 태평양 폴리에테르 폴리올의 녹색 및 바이오 폴리올 시장, 범주별, 2018-2032 (USD 천)
표 16 아시아 태평양 폴리에스터 폴리올, 녹색 및 바이오 폴리올 시장, 세그먼트별, 2018-2032 (USD 천)
표 17 아시아 태평양 폴리에스터 폴리올의 녹색 및 바이오 폴리올 시장, 카테고리별, 2018-2032 (USD 천)
표 18 아시아 태평양 녹색 및 바이오 폴리올 시장, 응용 분야별, 2018-2032 (USD 천)
표 19 아시아 태평양 지역 폴리에스터 폴리올의 폼, 녹색 및 바이오 폴리올 시장, 세그먼트별, 2018-2032 (USD 천)
표 20 중국 녹색 및 바이오 폴리올 시장, 유형별, 2018-2032 (USD 천)
표 21 중국 녹색 및 바이오 폴리올 시장, 유형별, 2018-2032 (킬로톤)
표 22 중국 폴리에테르 폴리올 녹색 및 바이오 폴리올 시장, 세그먼트별, 2018-2032 (USD 천)
표 23 중국 폴리에테르 폴리올 녹색 및 바이오 폴리올 시장, 범주별, 2018-2032 (USD 천)
표 24 중국 폴리에스터 폴리올 시장(세그먼트별), 2018-2032 (USD 천 달러)
표 25 중국 폴리에스터 폴리올 녹색 및 바이오 폴리올 시장, 카테고리별, 2018-2032 (USD 천)
표 26 중국 녹색 및 바이오 폴리올 시장, 응용 분야별, 2018-2032 (USD 천)
표 27 중국 폴리에스터 폴리올의 녹색 및 바이오 폴리올 시장, 세그먼트별, 2018-2032 (USD 천)
표 28 일본 녹색 및 바이오 폴리올 시장, 유형별, 2018-2032 (USD 천 달러)
표 29 일본 녹색 및 바이오 폴리올 시장, 유형별, 2018-2032 (킬로톤)
표 30 2018-2032년 세그먼트별 녹색 및 바이오 폴리올 시장에서의 일본 폴리에테르 폴리올(USD 천)
표 31 2018-2032년 범주별 녹색 및 바이오 폴리올 시장에서의 일본 폴리에테르 폴리올(USD 천 달러)
표 32 2018-2032년 세그먼트별 녹색 및 바이오 폴리올 시장의 일본 폴리에스터 폴리올(USD 천 달러)
표 33 2018-2032년 카테고리별 녹색 및 바이오 폴리올 시장의 일본 폴리에스터 폴리올(USD 천 달러)
표 34 일본 녹색 및 바이오 폴리올 시장, 응용 분야별, 2018-2032 (USD 천)
표 35 2018-2032년 세그먼트별 녹색 및 바이오 폴리올 시장에서의 폴리에스터 폴리올의 일본 폼(USD 천 달러)
표 36 한국 녹색 및 바이오 폴리올 시장, 유형별, 2018-2032 (USD 천)
표 37 한국 녹색 및 바이오 폴리올 시장, 유형별, 2018-2032 (킬로톤)
표 38 한국 폴리에테르 폴리올 녹색 및 바이오 폴리올 시장, 세그먼트별, 2018-2032 (USD 천)
표 39 한국 폴리에테르 폴리올 녹색 및 바이오 폴리올 시장, 범주별, 2018-2032 (USD 천)
표 40 한국 폴리에스터 폴리올 시장(세그먼트별) 2018-2032 (USD 천)
표 41 한국 폴리에스터 폴리올의 녹색 및 바이오 폴리올 시장, 카테고리별, 2018-2032 (USD 천)
표 42 한국 녹색 및 바이오 폴리올 시장, 응용 분야별, 2018-2032 (USD 천)
표 43 한국 내 폴리에스터 폴리올의 폼, 녹색 및 바이오 폴리올 시장, 세그먼트별, 2018-2032 (USD 천)
표 44 인도 녹색 및 바이오 폴리올 시장, 유형별, 2018-2032 (USD 천)
표 45 인도 녹색 및 바이오 폴리올 시장, 유형별, 2018-2032(킬로톤)
표 46 인도 폴리에테르 폴리올 녹색 및 바이오 폴리올 시장, 세그먼트별, 2018-2032 (USD 천)
표 47 인도 폴리에테르 폴리올 녹색 및 바이오 폴리올 시장, 범주별, 2018-2032 (USD 천)
표 48 인도 폴리에스터 폴리올, 녹색 및 바이오 폴리올 시장, 세그먼트별, 2018-2032 (USD 천)
표 49 인도 폴리에스터 폴리올, 녹색 및 바이오 폴리올 시장, 범주별, 2018-2032 (USD 천)
표 50 인도 녹색 및 바이오 폴리올 시장, 응용 분야별, 2018-2032 (USD 천)
표 51 인도의 녹색 및 바이오 폴리올 시장에서의 폴리에스터 폴리올의 폼, 세그먼트별, 2018-2032 (USD 천)
표 52 호주 및 뉴질랜드 녹색 및 바이오 폴리올 시장, 유형별, 2018-2032 (USD 천 달러)
표 53 호주 및 뉴질랜드 녹색 및 바이오 폴리올 시장, 유형별, 2018-2032(킬로톤)
표 54 호주 및 뉴질랜드의 녹색 및 바이오 폴리올 시장에서의 폴리에테르 폴리올, 세그먼트별, 2018-2032 (USD 천)
표 55 호주 및 뉴질랜드의 녹색 및 바이오 폴리올 시장에서의 폴리에테르 폴리올, 범주별, 2018-2032 (USD 천)
표 56 호주 및 뉴질랜드의 녹색 및 바이오 폴리올 시장에서의 폴리에스터 폴리올, 세그먼트별, 2018-2032 (USD 천)
표 57 2018-2032년 범주별 녹색 및 바이오 폴리올 시장에서의 호주 및 뉴질랜드 폴리에스터 폴리올(USD 천 달러)
표 58 호주 및 뉴질랜드 녹색 및 바이오 폴리올 시장, 응용 분야별, 2018-2032 (USD 천)
표 59 호주 및 뉴질랜드의 녹색 및 바이오 폴리올 시장에서의 폴리에스터 폴리올 폼, 세그먼트별, 2018-2032 (USD 천)
표 60 싱가포르 녹색 및 바이오 폴리올 시장, 유형별, 2018-2032 (USD 천)
표 61 싱가포르 녹색 및 바이오 폴리올 시장, 유형별, 2018-2032 (킬로톤)
표 62 세그먼트별 싱가포르 폴리에테르 폴리올 녹색 및 바이오 폴리올 시장, 2018-2032 (USD 천)
표 63 싱가포르 폴리에테르 폴리올의 녹색 및 바이오 폴리올 시장, 범주별, 2018-2032 (USD 천)
표 64 싱가포르 폴리에스터 폴리올, 녹색 및 바이오 폴리올 시장, 세그먼트별, 2018-2032 (USD 천)
표 65 싱가포르 폴리에스터 폴리올의 녹색 및 바이오 폴리올 시장, 카테고리별, 2018-2032 (USD 천)
표 66 싱가포르 녹색 및 바이오 폴리올 시장, 응용 분야별, 2018-2032 (USD 천)
표 67 2018-2032년 세그먼트별 녹색 및 바이오 폴리올 시장에서의 싱가포르 폼 폴리에스터 폴리올(USD 천)
표 68 말레이시아 녹색 및 바이오 폴리올 시장, 유형별, 2018-2032 (USD 천)
표 69 말레이시아 녹색 및 바이오 폴리올 시장, 유형별, 2018-2032(킬로톤)
표 70 말레이시아 폴리에테르 폴리올 녹색 및 바이오 폴리올 시장, 세그먼트별, 2018-2032 (USD 천)
표 71 말레이시아 폴리에테르 폴리올의 녹색 및 바이오 폴리올 시장, 범주별, 2018-2032 (USD 천)
표 72 말레이시아 폴리에스터 폴리올, 녹색 및 바이오 폴리올 시장, 세그먼트별, 2018-2032 (USD 천)
표 73 말레이시아 폴리에스터 폴리올의 녹색 및 바이오 폴리올 시장, 범주별, 2018-2032 (USD 천)
표 74 말레이시아 녹색 및 바이오 폴리올 시장, 응용 분야별, 2018-2032 (USD 천)
표 75 말레이시아의 녹색 및 바이오 폴리올 시장에서의 폴리에스터 폴리올 폼, 세그먼트별, 2018-2032 (USD 천)
표 76 태국 녹색 및 바이오 폴리올 시장, 유형별, 2018-2032 (USD 천)
표 77 태국 녹색 및 바이오 폴리올 시장, 유형별, 2018-2032 (킬로톤)
표 78 태국 폴리에테르 폴리올, 녹색 및 바이오 폴리올 시장, 세그먼트별, 2018-2032 (USD 천)
표 79 태국 폴리에테르 폴리올 녹색 및 바이오 폴리올 시장, 범주별, 2018-2032 (USD 천)
표 80 태국 폴리에스터 폴리올, 녹색 및 바이오 폴리올 시장, 세그먼트별, 2018-2032 (USD 천)
표 81 태국 폴리에스터 폴리올의 녹색 및 바이오 폴리올 시장, 범주별, 2018-2032 (USD 천)
표 82 태국 녹색 및 바이오 폴리올 시장, 응용 분야별, 2018-2032 (USD 천)
표 83 2018-2032년 세그먼트별 녹색 및 바이오 폴리올 시장에서의 태국 폼 폴리에스터 폴리올(USD 천)
표 84 인도네시아 녹색 및 바이오 폴리올 시장, 유형별, 2018-2032 (USD 천)
표 85 인도네시아 녹색 및 바이오 폴리올 시장, 유형별, 2018-2032 (킬로톤)
표 86 세그먼트별 인도네시아 폴리에테르 폴리올 녹색 및 바이오 폴리올 시장, 2018-2032 (USD 천)
표 87 인도네시아 폴리에테르 폴리올의 녹색 및 바이오 폴리올 시장, 범주별, 2018-2032 (USD 천)
표 88 인도네시아 폴리에스터 폴리올 시장, 세그먼트별 녹색 및 바이오 폴리올 시장, 2018-2032 (USD 천)
표 89 인도네시아 폴리에스터 폴리올, 녹색 및 바이오 폴리올 시장, 범주별, 2018-2032 (USD 천)
표 90 인도네시아 녹색 및 바이오 폴리올 시장, 응용 분야별, 2018-2032 (USD 천)
표 91 인도네시아의 녹색 및 바이오 폴리올 시장에서의 폴리에스터 폴리올 폼, 세그먼트별, 2018-2032 (USD 천)
표 92 필리핀 녹색 및 바이오 폴리올 시장, 유형별, 2018-2032 (USD 천)
표 93 필리핀 녹색 및 바이오 폴리올 시장, 유형별, 2018-2032 (킬로톤)
표 94 필리핀 폴리에테르 폴리올 녹색 및 바이오 폴리올 시장, 세그먼트별, 2018-2032 (USD 천)
표 95 필리핀 폴리에테르 폴리올 녹색 및 바이오 폴리올 시장, 범주별, 2018-2032 (USD 천)
표 96 필리핀 폴리에스터 폴리올, 녹색 및 바이오 폴리올 시장, 세그먼트별, 2018-2032 (USD 천)
표 97 필리핀 폴리에스터 폴리올, 녹색 및 바이오 폴리올 시장, 범주별, 2018-2032 (USD 천)
표 98 필리핀 녹색 및 바이오 폴리올 시장, 응용 분야별, 2018-2032 (USD 천)
표 99 필리핀의 녹색 및 바이오 폴리올 시장에서의 폴리에스터 폴리올 폼, 세그먼트별, 2018-2032 (USD 천)
표 100 아시아 태평양 지역 녹색 및 바이오 폴리올 시장 나머지 지역, 유형별, 2018-2032 (USD 천 달러)
표 101 아시아 태평양 지역 녹색 및 바이오 폴리올 시장 나머지 지역, 유형별, 2018-2032 (킬로톤)
그림 목록
그림 1 아시아 태평양 녹색 및 바이오 폴리올 시장
그림 2 아시아 태평양 녹색 및 바이오 폴리올 시장: 데이터 삼각 측량
그림 3 아시아 태평양 녹색 및 바이오 폴리올 시장: DROC 분석
그림 4 아시아 태평양 녹색 및 바이오 폴리올 시장: 아시아 태평양 대 지역 시장 분석
그림 5 아시아 태평양 녹색 및 바이오 폴리올 시장: 회사 연구 분석
그림 6 아시아 태평양 녹색 및 바이오 폴리올 시장: 다변량 모델링
그림 7 아시아 태평양 녹색 및 바이오 폴리올 시장: 인터뷰 인구 통계
그림 8 아시아 태평양 녹색 및 바이오 폴리올 시장: DBMR 시장 위치 그리드
그림 9 아시아 태평양 녹색 및 바이오 폴리올 시장: 공급업체 점유율 분석
그림 10 아시아 태평양 녹색 및 바이오 폴리올 시장: 응용 프로그램 범위 그리드
그림 11 아시아 태평양 녹색 및 바이오 폴리올 시장: 세분화
그림 12 아시아 태평양 녹색 및 바이오 폴리올 시장, 유형별, 2024
그림 13 아시아 태평양 녹색 및 바이오 폴리올 시장의 요약
그림 14 전략적 결정
그림 15 지속 가능한 재료에 대한 인식 증가는 예측 기간 동안 아시아 태평양 녹색 및 바이오 폴리올 시장을 주도할 것으로 예상됩니다.
그림 16 폴리에테르 폴리올 세그먼트는 2025년과 2032년에 아시아 태평양 녹색 및 바이오 폴리올 시장에서 가장 큰 점유율을 차지할 것으로 예상됩니다.
그림 17 PESTEL 분석
그림 18 포터의 5가지 힘
그림 19 수입 수출 시나리오 (USD 천)
그림 20 아시아 태평양 녹색 및 바이오 폴리올 시장, 2023-2032, 평균 판매 가격(USD/톤)
그림 21 생산 소비 분석
그림 22 공급업체 선택 기준
그림 23 아시아 태평양 녹색 및 바이오 폴리올 시장의 동인, 제약, 기회 및 과제
그림 24 인도의 국립 고속도로 총 길이(km) (2014-2023)
그림 25 인도의 공항 수(2014-2024)
그림 26 아시아 태평양 녹색 및 바이오 폴리올 시장: 유형별, 2024
그림 27 아시아 태평양 녹색 및 바이오 폴리올 시장: 응용 분야별, 2024년
그림 28 아시아 태평양 녹색 및 바이오 폴리올 시장: 스냅샷(2024)
그림 29 아시아 태평양 녹색 및 바이오 폴리올 시장: 회사 점유율 2024(%)
연구 방법론
데이터 수집 및 기준 연도 분석은 대규모 샘플 크기의 데이터 수집 모듈을 사용하여 수행됩니다. 이 단계에는 다양한 소스와 전략을 통해 시장 정보 또는 관련 데이터를 얻는 것이 포함됩니다. 여기에는 과거에 수집한 모든 데이터를 미리 검토하고 계획하는 것이 포함됩니다. 또한 다양한 정보 소스에서 발견되는 정보 불일치를 검토하는 것도 포함됩니다. 시장 데이터는 시장 통계 및 일관된 모델을 사용하여 분석하고 추정합니다. 또한 시장 점유율 분석 및 주요 추세 분석은 시장 보고서의 주요 성공 요인입니다. 자세한 내용은 분석가에게 전화를 요청하거나 문의 사항을 드롭하세요.
DBMR 연구팀에서 사용하는 주요 연구 방법론은 데이터 마이닝, 시장에 대한 데이터 변수의 영향 분석 및 주요(산업 전문가) 검증을 포함하는 데이터 삼각 측량입니다. 데이터 모델에는 공급업체 포지셔닝 그리드, 시장 타임라인 분석, 시장 개요 및 가이드, 회사 포지셔닝 그리드, 특허 분석, 가격 분석, 회사 시장 점유율 분석, 측정 기준, 글로벌 대 지역 및 공급업체 점유율 분석이 포함됩니다. 연구 방법론에 대해 자세히 알아보려면 문의를 통해 업계 전문가에게 문의하세요.
사용자 정의 가능
Data Bridge Market Research는 고급 형성 연구 분야의 선두 주자입니다. 저희는 기존 및 신규 고객에게 목표에 맞는 데이터와 분석을 제공하는 데 자부심을 느낍니다. 보고서는 추가 국가에 대한 시장 이해(국가 목록 요청), 임상 시험 결과 데이터, 문헌 검토, 재생 시장 및 제품 기반 분석을 포함하도록 사용자 정의할 수 있습니다. 기술 기반 분석에서 시장 포트폴리오 전략에 이르기까지 타겟 경쟁업체의 시장 분석을 분석할 수 있습니다. 귀하가 원하는 형식과 데이터 스타일로 필요한 만큼 많은 경쟁자를 추가할 수 있습니다. 저희 분석가 팀은 또한 원시 엑셀 파일 피벗 테이블(팩트북)로 데이터를 제공하거나 보고서에서 사용 가능한 데이터 세트에서 프레젠테이션을 만드는 데 도움을 줄 수 있습니다.

