Europe Specialty CropMarket, By Crop Type (Fruits, Vegetables, Tree Nuts, Herbs, Spices, and Others), Nature (Organic and Conventional), Application (Dairy Products, Bakery, Juices, Nectars & Fruit-Based Drinks, Confectionery, Soups, Sauces & Dressings and Others) - Industry Trends and Forecast to 2029.
Europe Specialty Crop Market Analysis and Size
Fruits and vegetables, tree nuts, dried fruits, horticulture, and nursery crops are examples of specialty crops (including floriculture). They also contain exotic plants grown in a particular area due to topographical and climatic characteristics. A paradigm shift in consumer eating behaviors has been documented due to population growth and an increase in per capita disposable income, directly affecting the demand for wholesome food. Other factors boosting the market for specialized crops include increased urbanization, ethnic diversity, health concerns, and changes in demographic characteristics. The primary drivers of the specialty crops industry include the expanding application range of specialty crops, encouraging government initiatives, and free trade policies. However, expansion is constrained by trade and environmental constraints.
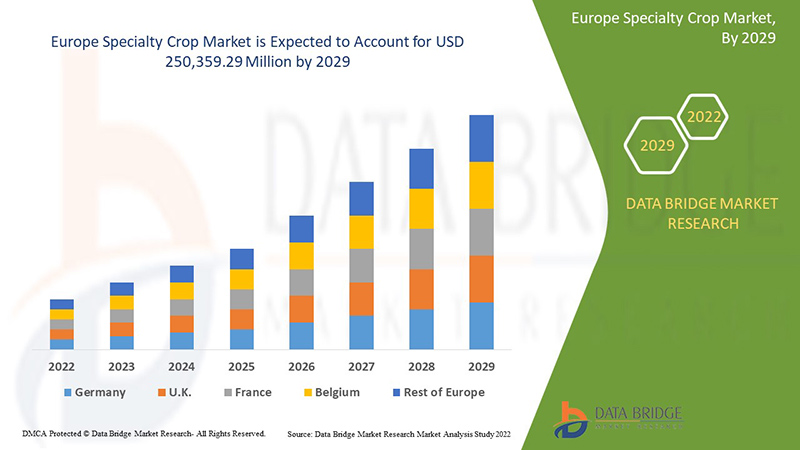
Data Bridge Market Research analyses that the specialty crop market is expected to reach the value of USD 250,359.29 million by 2029, at a CAGR of 4.3% during the forecast period.
|
Report Metric |
Details |
|
Forecast Period |
2022 to 2029 |
|
Base Year |
2021 |
|
Historic Year |
2020 (Customisable to 2019-2014) |
|
Quantitative Units |
Revenue in USD Million, Volumes in Million Units, Pricing in USD |
|
Segments Covered |
By Crop Type (Fruits, Vegetables, Tree Nuts, Herbs, Spices, and Others), Nature (Organic and Conventional), Application (Dairy Products, Bakery, Juices, Nectars & Fruit-Based Drinks, Confectionery, Soups, Sauces & Dressings and Others) |
|
Countries Covered |
Germany, Italy, France, U.K., Spain, Russia, Netherlands, Switzerland, Belgium, Turkey, and rest of Europe |
|
Market Players Covered |
Olam Group, AGT Food and Ingredients, Lamex Food Group Limited, Herbs N Spices International, Banabay, Fisher Nut Company, SVZ Industrial Fruit & Vegetable Ingredients, Golden Peanut and Tree Nuts, Barnes Williams, Fruit+ Veg, FARMER DIRECT ORGANIC, andNatural Specialty Crops, ULC among others |
Market Definition
Fruits and vegetables, tree nuts, dried fruits, horticulture, and nursery crops are examples of specialty crops (including floriculture). They also contain exotic plants grown in a particular area due to topographical and climatic characteristics. A paradigm shift in consumer eating behaviors has been documented due to population growth and an increase in per capita disposable income, directly affecting the demand for wholesome food. Other factors boosting the market for specialized crops include increased urbanization, ethnic diversity, health concerns, and changes in demographic characteristics.
Europe Specialty Crop Market Dynamics
This section deals with understanding the market drivers, advantages, opportunities, restraints, and challenges. All of this is discussed in detail below:
Drivers:
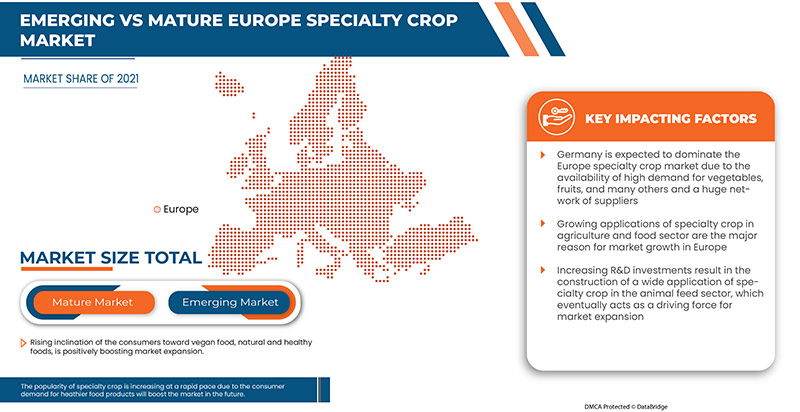
- Rising inclination of consumers toward vegan food, natural and healthy foods
As a conscious consumer, it is a particularly beneficial way of life because turning vegan would entirely isolate oneself from dangerous antibiotics, hormones, and adulteration, which is widespread culture to ensure prolonged shelf life for most animal goods. As exports grow and the world shrinks, more preservatives and chemical compositions are used to ensure that the food survives the journey. Veganism is also a non-violent lifestyle choice. People's increased health consciousness leads them to include more healthful items in their diets, such as medicinal herbs, spices, and nuts.
Thus, the rising inclination towards vegan and healthy food due to the rise in awareness of nutritional and medicinal benefits is expected to as a driver for specialty crop market growth.
- The increased focus of consumers on healthy living
The Europe market for specialty crops is being driven by a growing desire for a healthy lifestyle among people. The growing consumer preference for healthy lifestyles has become a driver for the creation of demand for specialty crops. Regardless of industry, many pioneers have considered this driver and are actively investing in specialty crop-based companies. An important aspect of leading a healthy lifestyle is eating healthy foods such as food made from specialized crops. A nutritious diet is critical for optimal health and nutrition. It protects against a wide range of chronic diseases, including heart disease, diabetes, and cancer. A healthy diet includes eating a variety of foods and consuming less salt, sugar, saturated fat, and industrially generated trans fats. Also, increased knowledge of the advantages of a healthy lifestyle causes consumers to select the best healthy food products, which include foods manufactured with specialty crops such as nuts, spices, herbs, and so on.
Thus, the increasing awareness and knowledge of the advantages of a healthy lifestyle cause consumers to select the best healthy food products, such as specialty crop products, eventually becoming a major driving force for specialty crop market growth.
Restraints
- Strict regulations for food products
For a number of reasons, specialty crops are particularly vulnerable to the prevalence of foodborne illnesses. It might be challenging to completely clean or sanitize specialized crops because they are frequently consumed raw or with little preparation, depending on the particular fruit or vegetable. As technology advances, issues such as responsibility and laws are becoming more crucial. To reduce the dangers of foodborne illnesses as much as possible, specialty crop producers must be aware of the rules that may impact their business. Due to these reasons, food regulatory bodies such as Food and Drug Administration ("FDA") and the Food Safety and Inspection Service ("FSIS") kept strict rules and regulations for these crop production.
Thus, these regulations will create a barrier for many entrepreneurs to start and continue the market of specialty crops, which may act as a major restrain for the market growth.
- Limited crop growing facilities for specialty crops
Producers of specialty crops rely largely on seasonal labor inputs. A country's food supply, especially its fresh fruit and vegetable supply, may be in jeopardy if there is insufficient labor to meet agricultural and animal demands. Farmers are forced to sell their produce at low prices to local money lenders due to inadequate transportation. Farmers are unable to keep their food when prices are low since there aren't enough warehouses available. Therefore, these account greatly for the low production of specialty crops. This many lacks of facilities from production to marketing become a major barrier to market growth.
Thus, the lack of various crop cultivation facilities such as irrigation, seeds, fertilizers, transport, and others function may act as a restraint to the market's growth.
Opportunity
- Government initiatives and free trade policies
Positive government measures, such as sales and marketing efforts, plant pest and disease prevention, and research & development, all contribute to the expansion of specialty crops. Access to international markets helps the specialty crop business grow while also supporting the livelihoods of those working on farms and in related industries. Agricultural Marketing Service (AMS) administers initiatives to open up domestic and worldwide markets for American producers of food, fiber, and specialty crops. In order to guarantee the availability and quality of healthy food for customers across the nation, the government has taken several initiatives. The government also provided a food assistance program to help specialized crop producers. This help was provided to encourage the development of specialist crops, such as horticulture, tree nuts, fruits, vegetables, and indigo.
Challenges
- Allergies associated with tree nuts crops
Nuts are among the number one cause of food allergy. There appear to be differences in the frequency of nut allergy between countries because of other dietary habits and cooking procedures. Allergic reactions to nuts can be severe, sometimes even life-threatening. Food allergy and oral challenges are diagnosed due to the presence of allergens in nuts. People are allergic to nuts, especially children & adults, and this population is increasing daily. Sales growth has been lowering since people are conscious about their health.
Furthermore, nuts allergies can be life-threatening, and tree nuts and seeds are some of the most common food triggers for life-threatening severe allergic reactions. In the Europe region, tree nut allergies are common, with a hazelnut allergy being the most prevalent tree nut allergy. Cashews are the second most allergic nut and a significant health problem in the Europe region. There is no treatment for nut allergies other than avoiding nuts and foods containing them. As a result, this has had a significant impact on recent expansion in the nuts industry and is predicted to continue in the future.
Thus, the growth of the market is hindered due to the allergies caused by nuts. People are now more conscious about their health and taking care to avoid allergies causing nuts and products. This may challenge the growth of the Europe specialty crop market.
Post-COVID-19 Impact on Europe Specialty Crop Market
Post the pandemic, the demand for specialty crops has increased as there won't be any restrictions on movement; hence, the supply of products would be easy. The persistence of COVID-19 for a longer period has affected the supply chain as it got disrupted, and it became difficult to supply food products to consumers, initially increasing the demand for products. However, post-COVID, the demand for specialty crops has increased significantly owing to good protein content and other nutrients available.
Recent Developments
- In July 2022, SVZ Industrial Fruit & Vegetable Ingredients announced an investment plan for its Belgian processing plant in Rijkevorsel. This expansion will help the company to fulfill the growing demand for fruit and vegetable products from consumers by increasing the facility's capacity.
- In September 2020, The Fisher Nut Company introduced a new case packaging line due to increased demand for products during COVID-19.
Europe Specialty Crop Market Scope
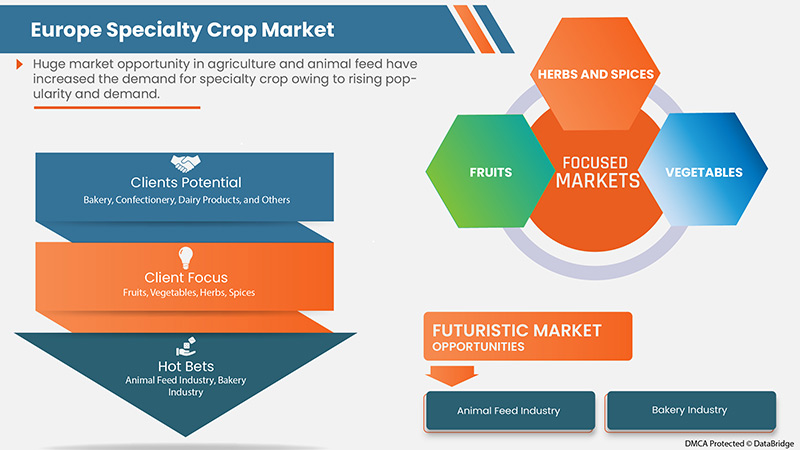
Europe specialty crop market is segmented on the basis of crop type, nature, and application. The growth amongst these segments will help you analyze major growth segments in the industries and provide the users with a valuable market overview and market insights to help them make strategic decisions for identifying core market applications.
Crop Type
- Vegetables
- Fruits
- Tree Nuts
- Herbs
- Spices
- Others
On the basis of crop type, the Europe specialty crop market is segmented into fruits, vegetables, tree nuts, herbs, spices, and others.
Nature
- Conventional
- Organic
On the basis of product type, the Europe specialty crop market is segmented into organic and conventional.
Application
- Dairy Products
- Bakery
- Juices
- Nectars & Fruit-Based Drinks
- Confectionery
- Soups
- Sauces & Dressings
- Others
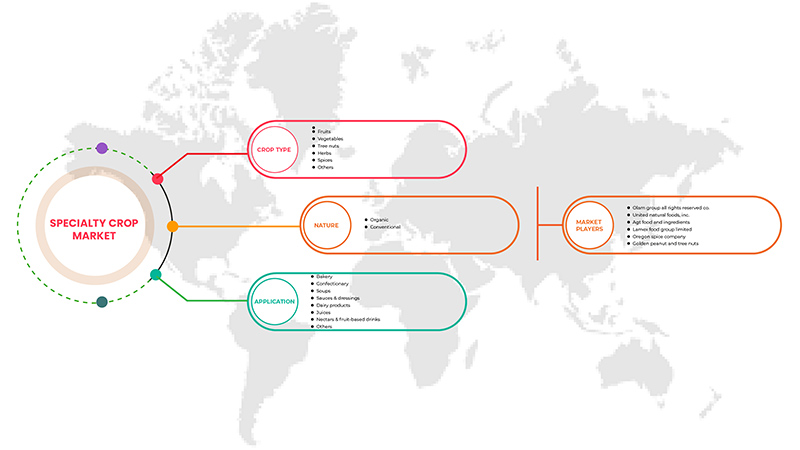
On the basis of end user, the Europe specialty crop market is segmented into dairy products, bakery, juices, nectars & fruit-based drinks, confectionery, soups, sauces & dressings, and others.
Europe Specialty Crop Market Regional Analysis/Insights
The Europe specialty crop market is analyzed, and market size insights and trends are provided by country, crop type, nature, and application.
The countries covered in the Europe specialty crop market report are Germany, Italy, France, U.K., Spain, Russia, Netherlands, Switzerland, Belgium, Turkey, and rest of Europe.
In 2022, Germany is expected to dominate the Europe specialty crop market with a CAGR of around 4.3%. Germany is the largest market for specialty crops. Growing demand for a healthy lifestyle and rising consumption of crops is the major reason for the growth of the specialty crop market in Europe. Moreover, the beverages market is growing progressively in the Europe region. The growth of this market will directly impact the growth of the specialty crop market.
The country section of the report also provides individual market-impacting factors and changes in market regulation that impact the current and future trends of the market. Data points like downstream and upstream value chain analysis, technical trends, porter's five forces analysis, and case studies are some of the pointers used to forecast the market scenario for individual countries. Also, the presence and availability of Europe brands and the challenges faced due to large or scarce competition from local and domestic brands, the impact of domestic tariffs, and trade routes are considered while providing forecast analysis of the country data.
Competitive Landscape and Specialty Crop Market Share Analysis
The specialty crop market competitive landscape provides details by competitor. Details included are company overview, company financials, revenue generated, market potential, investment in research and development, new market initiatives, Europe presence, production sites and facilities, production capacities, company strengths and weaknesses, product launch, product width and breadth, and application dominance. The above data points provided are only related to the companies focus on the specialty crop market.
Some of the major players operating in the specialty crop market are Olam Group, AGT Food and Ingredients, Lamex Food Group Limited, Herbs N Spices International, Banabay, Fisher Nut Company, SVZ Industrial Fruit & Vegetable Ingredients, Golden Peanut and Tree Nuts, Barnes Williams, Fruit+ Veg, FARMER DIRECT ORGANIC, and natural Specialty Crops, ULC among others
SKU-
세계 최초의 시장 정보 클라우드 보고서에 온라인으로 접속하세요

- 대화형 데이터 분석 대시보드
- 높은 성장 잠재력 기회를 위한 회사 분석 대시보드
- 사용자 정의 및 질의를 위한 리서치 분석가 액세스
- 대화형 대시보드를 통한 경쟁자 분석
- 최신 뉴스, 업데이트 및 추세 분석
- 포괄적인 경쟁자 추적을 위한 벤치마크 분석의 힘 활용
목차
1 서론
1.1 연구 목적
1.2 유럽 특수 작물 시장 개요
1.3 제한 사항
1.4 대상 시장
2 시장 세분화
2.1 대상 시장
2.2 지리적 범위
연구에 2.3년이 고려됨
2.4 통화 및 가격
2.5 DBMR TRIPOD 데이터 검증 모델
2.6 다변량 모델링
2.7 작물 유형 수명선 곡선
2.8 주요 여론 선도자와의 1차 인터뷰
2.9 DBMR 시장 위치 그리드
2.1 공급업체 점유율 분석
2.11 2차 소스
2.12 가정
3 요약
4가지 프리미엄 인사이트
4.1 유럽 특수작물 시장의 구매 결정에 영향을 미치는 요인
4.2 주요 시장 참여자들이 채택한 성장 전략
4.3 유럽 특수 작물 시장의 산업 동향 및 미래 전망
4.3.1 건강한 라이프스타일 트렌드의 증가로 인해 특수 작물 제품에 대한 더 많은 옵션을 제공하는 회사
4.3.2 상품구매 편의성 추세에 따른 온라인 및 방문 배송 서비스 제공 기업
4.4 기술 동향
4.5 유럽 특산작물 시장의 공급망
4.5.1 원자재 조달
4.5.2 처리
4.5.3 마케팅 및 유통
4.5.4 최종 사용자
4.6 가치 사슬 분석: 유럽 특수 작물 시장
5 시장 개요
5.1 드라이버
5.1.1 소비자들의 채식주의 음식, 천연 건강식품에 대한 선호도 증가
5.1.2 건강한 생활에 대한 소비자들의 관심 증가
5.1.3 특수 작물의 건강상의 이점에 대한 대중의 지식 증진
5.2 제약
5.2.1 식품에 대한 엄격한 규정
5.2.2 특수 작물을 위한 제한된 작물 재배 시설
5.3 기회
5.3.1 정부 이니셔티브 및 자유 무역 정책
5.3.2 농업 기술의 발전
5.4 과제
5.4.1 불리한 기후 조건
5.4.2 견과류 작물과 관련된 알레르기
6 유럽 특산 작물 시장, 본질별
6.1 개요
6.2 기존
6.3 유기농
7 유럽 특수 작물 시장, 응용 분야별
7.1 개요
7.2 유제품
7.2.1 아이스크림
7.2.2 치즈
7.2.3 분유
7.2.4 스프레드
7.2.5 기타
7.3 베이커리
7.3.1 빵
7.3.2 케이크 및 페이스트리
7.3.3 비스킷 & 쿠키
7.3.4 머핀
7.3.5 기타
7.4 주스
7.4.1 파인애플
7.4.2 오렌지
7.4.3 모삼비
7.4.4 구아바
7.4.5 애플
7.4.6 딸기
7.4.7 기타
7.5 넥타 & 과일 기반 음료
7.6 과자류
7.6.1 초콜릿
7.6.2 크림 감정
7.6.3 하드 캔디 & 소프트 캔디
7.6.4 껌 & 젤리
7.6.5 기타
7.7 수프
7.8 소스 및 드레싱
7.9 기타
8 유럽 특산 작물 시장, 유형별
8.1 개요
8.2 과일
8.2.1 커피
8.2.2 바나나
8.2.3 망고
8.2.4 애플
8.2.5 감귤류
8.2.6 포도
8.2.7 구아바
8.2.8 딸기
8.2.9 리치
8.2.10 코코넛
8.2.11 아보카도
8.2.12 키위
8.2.13 구스베리
8.2.14 체리
8.2.15 블랙베리
8.2.16 블루베리
8.2.17 크랜베리
8.2.18 현재
8.2.19 아로니아
8.2.20 날짜
8.2.21도
8.2.22 올리브
8.2.23 빵과일
8.2.24 카카오
8.2.25 체리모야
8.2.26 마카다미아
8.2.27 페이조아 과일
8.2.28 넥타린
8.3 야채
8.3.1 렌즈콩
8.3.2 토마토
8.3.3 오이
8.3.4 마늘
8.3.5 마늘
8.3.6 가지
8.3.7 당근
8.3.8 고추
8.3.9 콜리플라워
8.3.10 완두콩(정원, 건조, 식용)
8.3.11 비트
8.3.12 브로콜리
8.3.13 상추
8.3.14 아스파라거스
8.3.15 셀러리
8.3.16 차이브
8.3.17 콜라드
8.3.18 아티초크
8.3.19 셀러리악
8.3.20 에다마메
8.3.21 엔다이브
8.3.22 양파
8.3.23 콜라비
8.3.24 부추
8.4 견과류
8.4.1 아몬드
8.4.2 캐슈
8.4.3 헤이즐넛
8.4.4 마카다미아 너트
8.4.5 소나무 열매
8.4.6 밤
8.4.7 히코리 너트
8.4.8 브라질너트
8.4.9 피칸
8.4.10 도토리
8.5 허브
8.5.1 고수
8.5.2 민트
8.5.3 바질
8.5.4 알로에베라
8.5.5 파슬리
8.5.6 라벤더
8.5.7 로즈마리
8.5.8 타임
8.5.9 딜
8.5.10 재스민
8.5.11 파
8.5.12 캣닙
8.5.13 기타
8.6 향신료
8.6.1 으깬 붉은 고추
8.6.2 마늘
8.6.3 생강
8.6.4 강황
8.6.5 고수 씨앗
8.6.6 커민
8.6.7 검은 후추
8.6.8 카다멈
8.6.9 정향
8.6.10 호로파
8.6.11 겨자씨
8.6.12 카레가루
8.6.13 육두구
8.6.14 셀러리 씨앗
8.6.15 카시아 나무껍질
8.6.16 메이스
8.6.17 기타
8.7 기타
9 유럽 특산 작물 시장, 지역별
9.1 유럽
9.1.1 독일
9.1.2 프랑스
9.1.3 이탈리아
9.1.4 영국
9.1.5 스위스
9.1.6 스페인
9.1.7 네덜란드
9.1.8 벨기에
9.1.9 터키
9.1.10 러시아
9.1.11 유럽의 나머지 지역
10 회사 풍경
10.1 회사 점유율 분석: 유럽
11 SWOT 분석
12 회사 프로필
12.1 OLAM GROUP 모든 권리 보유.
12.1.1 회사 스냅샷
12.1.2 회사 점유율 분석
12.1.3 제품 포트폴리오
12.1.4 최근 개발 사항
12.2 유나이티드 내추럴 푸드 주식회사
12.2.1 회사 스냅샷
12.2.2 수익 분석
12.2.3 회사 점유율 분석
12.2.4 제품 포트폴리오
12.2.5 최근 개발 사항
12.3 AGT 식품 및 재료
12.3.1 회사 스냅샷
12.3.2 회사 점유율 분석
12.3.3 제품 포트폴리오
12.3.4 최근 개발
12.4 라멕스푸드그룹 유한회사
12.4.1 회사 스냅샷
12.4.2 회사 점유율 분석
12.4.3 제품 포트폴리오
12.4.4 최근 개발
12.5 골든 땅콩과 견과류
12.5.1 회사 스냅샷
12.5.2 회사 점유율 분석
12.5.3 제품 포트폴리오
12.5.4 최근 개발
12.6 오레곤 스파이스 컴퍼니
12.6.1 회사 스냅샷
12.6.2 회사 점유율 분석
12.6.3 제품 포트폴리오
12.6.4 최근 개발
12.7 바나바이
12.7.1 회사 스냅샷
12.7.2 제품 포트폴리오
12.7.3 최근 개발 사항
12.8 바네스 윌리엄스
12.8.1 회사 스냅샷
12.8.2 제품 포트폴리오
12.8.3 최근 개발
12.9 FARMER DIRECT 유기농
12.9.1 회사 스냅샷
12.9.2 제품 포트폴리오
12.9.3 최근 개발 사항
12.1 피셔너트 회사
12.10.1 회사 스냅샷
12.10.2 제품 포트폴리오
12.10.3 최근 개발 사항
12.11 과일+채소
12.11.1 회사 스냅샷
12.11.2 제품 포트폴리오
12.11.3 최근 개발 사항
12.12 하버 스파이스 주식회사
12.12.1 회사 스냅샷
12.12.2 제품 포트폴리오
12.12.3 최근 개발 사항
12.13 허브 앤 스파이스 인터내셔널
12.13.1 회사 스냅샷
12.13.2 제품 포트폴리오
12.13.3 최근 개발
12.14 천연 특산 작물, ULC
12.14.1 회사 스냅샷
12.14.2 제품 포트폴리오
12.14.3 최근 개발 사항
12.15 너트스코
12.15.1 회사 스냅샷
12.15.2 제품 포트폴리오
12.15.3 최근 개발
12.16 쌀과일회사
12.16.1 회사 스냅샷
12.16.2 제품 포트폴리오
12.16.3 최근 개발
12.17 심페드 푸드 주식회사
12.17.1 회사 스냅샷
12.17.2 제품 포트폴리오
12.17.3 최근 개발 사항
12.18 특수 작물 회사 주식회사
12.18.1 회사 스냅샷
12.18.2 제품 포트폴리오
12.18.3 최근 개발 사항
12.19 SVZ 산업용 과일 및 채소 성분
12.19.1 회사 스냅샷
12.19.2 제품 포트폴리오
12.19.3 최근 개발
13 설문지
14 관련 보고서
표 목록
표 1 유럽 특산 작물 시장, 자연별, 2020-2029 (백만 달러)
표 2 유럽 특산 작물 시장, 자연별, 2020-2029 (킬로톤)
표 3 지역별 특수 작물 시장의 유럽 재래종, 2020-2029 (백만 달러)
표 4 지역별 특수 작물 시장에서의 유럽 재래종, 2020-2029 (킬로톤)
표 5 지역별 특수 작물 시장의 유럽 유기농, 2020-2029년 (백만 달러)
표 6 지역별 특수 작물 시장의 유럽 유기농, 2020-2029 (킬로톤)
표 7 유럽 특수 작물 시장, 응용 분야별, 2020-2029년(백만 달러)
표 8 유럽 특수 작물 시장, 응용 분야별, 2020-2029(킬로톤)
표 9 지역별 특수 작물 시장의 유럽 유제품, 2020-2029년 (백만 달러)
표 10 지역별 특수 작물 시장의 유럽 유제품, 2020-2029년(킬로톤)
표 11 특수 작물 시장의 유럽 유제품, 유형별, 2020-2029년 (백만 달러)
표 12 특수 작물 시장에서의 유럽 유제품 종류별, 2020-2029 (킬로톤)
표 13 지역별 특수 작물 시장에서의 유럽 제빵소, 2020-2029년 (백만 달러)
표 14 지역별 특수 작물 시장에서의 유럽 제빵소, 2020-2029 (킬로톤)
표 15 특수 작물 시장에서의 유럽 제빵업, 유형별, 2020-2029 (백만 달러)
표 16 특수 작물 시장에서의 유럽 제빵업체, 유형별, 2020-2029 (킬로톤)
표 17 지역별 특수 작물 시장의 유럽 주스, 2020-2029년 (백만 달러)
표 18 지역별 특수 작물 시장의 유럽 주스, 2020-2029년(킬로톤)
표 19 2020-2029년 유형별 특수 작물 시장의 유럽 주스(백만 달러)
표 20 유럽 주스의 특수 작물 시장, 유형별, 2020-2029 (킬로톤)
표 21 유럽 특산 작물 시장의 넥타 및 과일 기반 음료, 지역별, 2020-2029년(백만 달러)
표 22 지역별 특수 작물 시장에서의 유럽 넥타 및 과일 기반 음료, 2020-2029(킬로톤)
표 23 지역별 특수 작물 시장에서의 유럽 제과, 2020-2029 (백만 달러)
표 24 지역별 특수 작물 시장에서의 유럽 과자류, 2020-2029 (킬로톤)
표 25 특수 작물 시장에서의 유럽 제과류, 유형별, 2020-2029 (백만 달러)
표 26 특수 작물 시장에서의 유럽 과자류, 유형별, 2020-2029 (킬로톤)
표 27 지역별 특수 작물 시장의 유럽 수프, 2020-2029년(백만 달러)
표 28 지역별 특수 작물 시장의 유럽 수프, 2020-2029 (킬로톤)
표 29 지역별 특수 작물 시장의 유럽 소스 및 드레싱, 2020-2029 (백만 달러)
표 30 지역별 특수 작물 시장의 유럽 소스 및 드레싱, 2020-2029 (킬로톤)
표 31 2020-2029년 지역별 특수 작물 시장의 유럽 기타 국가(백만 달러)
표 32 지역별 특수 작물 시장의 유럽 기타 국가, 2020-2029 (킬로톤)
표 33 유럽 특수 작물 시장, 유형별, 2020-2029 (백만 달러)
표 34 유럽 특수 작물 시장, 유형별, 2020-2029 (킬로톤)
표 35 유럽 특수 작물 시장의 과일, 유형별, 2020-2029 (백만 달러)
표 36 2020-2029년 유형별 유럽 특산작물 시장의 과일(킬로톤)
표 37 2020-2029년 유형별 특수 작물 시장의 유럽 야채(백만 달러)
표 38 2020-2029년 유형별 특수 작물 시장의 유럽 야채(킬로톤)
표 39 특수 작물 시장에서의 유럽 견과류, 유형별, 2020-2029 (백만 달러)
표 40 유럽 특수 작물 시장의 견과류 종류별, 2020-2029 (킬로톤)
표 41 2020-2029년 유형별 특수 작물 시장의 유럽 허브(백만 달러)
표 42 특수 작물 시장에서의 유럽 허브, 유형별, 2020-2029 (킬로톤)
표 43 2020-2029년 유형별 특수 작물 시장의 유럽 향신료(백만 달러)
표 44 2020-2029년 유형별 특수 작물 시장의 유럽 향신료(킬로톤)
표 45 지역별 특수 작물 시장의 유럽 기타 국가, 2020-2029 (백만 달러)
표 46 지역별 특수 작물 시장의 유럽 기타 국가, 2020-2029 (킬로톤)
표 47 국가별 유럽 특산 작물 시장, 2020-2029년(백만 달러)
표 48 국가별 유럽 특산 작물 시장, 2020-2029(킬로톤)
표 49 유럽 특수 작물 시장, 유형별, 2020-2029 (백만 달러)
표 50 유럽 특산 작물 시장, 유형별, 2020-2029 (킬로톤)
표 51 2020-2029년 유형별 유럽 과일 특산 작물 시장(백만 달러)
표 52 2020-2029년 유형별 유럽 특산작물 시장의 과일(킬로톤)
표 53 2020-2029년 유형별 특수 작물 시장의 유럽 야채(백만 달러)
표 54 2020-2029년 유형별 특수 작물 시장의 유럽 야채(킬로톤)
표 55 유럽 특수 작물 시장의 견과류, 유형별, 2020-2029 (백만 달러)
표 56 특수 작물 시장에서의 유럽 견과류, 유형별, 2020-2029 (킬로톤)
표 57 2020-2029년 유형별 특수 작물 시장의 유럽 허브(백만 달러)
표 58 특수 작물 시장에서의 유럽 허브, 유형별, 2020-2029 (킬로톤)
표 59 2020-2029년 유형별 특수 작물 시장의 유럽 향신료(백만 달러)
표 60 특수 작물 시장에서의 유럽 향신료, 유형별, 2020-2029 (킬로톤)
표 61 유럽 특산 작물 시장, 자연별, 2020-2029 (백만 달러)
표 62 유럽 특산 작물 시장, 자연별, 2020-2029 (킬로톤)
표 63 유럽 특수 작물 시장, 응용 분야별, 2020-2029년(백만 달러)
표 64 유럽 특수 작물 시장, 응용 분야별, 2020-2029 (킬로톤)
표 65 유럽 제빵업체의 특수 작물 시장, 유형별, 2020-2029년(백만 달러)
표 66 2020-2029년 유형별 특수 작물 시장에서의 유럽 제빵업체(킬로톤)
표 67 특수 작물 시장에서의 유럽 제과류, 유형별, 2020-2029 (백만 달러)
표 68 특수 작물 시장에서의 유럽 과자류, 유형별, 2020-2029 (킬로톤)
표 69 특수 작물 시장의 유럽 유제품, 유형별, 2020-2029 (백만 달러)
표 70 특수 작물 시장에서의 유럽 유제품, 유형별, 2020-2029 (킬로톤)
표 71 2020-2029년 유형별 특수 작물 시장의 유럽 주스(백만 달러)
표 72 2020-2029년 유형별 특수 작물 시장의 유럽 주스(킬로톤)
표 73 독일 특산 작물 시장, 유형별, 2020-2029 (백만 달러)
표 74 독일 특산 작물 시장, 유형별, 2020-2029(킬로톤)
표 75 독일의 특수 작물 시장에서의 과일, 유형별, 2020-2029 (백만 달러)
표 76 독일의 특수 작물 시장에서의 과일 종류별, 2020-2029년(킬로톤)
표 77 독일 특수 작물 시장의 야채, 유형별, 2020-2029 (백만 달러)
표 78 독일 특수 작물 시장의 야채, 유형별, 2020-2029 (킬로톤)
표 79 독일 특수 작물 시장의 견과류, 유형별, 2020-2029 (백만 달러)
표 80 독일 특수 작물 시장의 견과류 종류별, 2020-2029 (킬로톤)
표 81 2020-2029년 유형별 특수 작물 시장에서의 독일 허브(백만 달러)
표 82 독일 허브의 특수 작물 시장, 유형별, 2020-2029 (킬로톤)
표 83 2020-2029년 유형별 특수 작물 시장에서의 독일 향신료(백만 달러)
표 84 독일 향신료, 유형별 특수 작물 시장, 2020-2029 (킬로톤)
표 85 독일 특산 작물 시장, 자연별, 2020-2029 (백만 달러)
표 86 독일 특산 작물 시장, 자연별, 2020-2029(킬로톤)
표 87 독일 특수 작물 시장, 응용 분야별, 2020-2029 (백만 달러)
표 88 독일 특산작물 시장, 응용 분야별, 2020-2029(킬로톤)
표 89 2020-2029년 유형별 특수 작물 시장에서의 독일 제빵소(백만 달러)
표 90 독일 제빵업체의 특수 작물 시장, 유형별, 2020-2029(킬로톤)
표 91 2020-2029년 유형별 특수 작물 시장에서의 독일 제과(백만 달러)
표 92 독일 제과류의 특수 작물 시장, 유형별, 2020-2029 (킬로톤)
표 93 독일 특수 작물 시장의 유제품 종류별, 2020-2029년 (백만 달러)
표 94 독일 특수 작물 시장에서의 유제품 종류별, 2020-2029 (킬로톤)
표 95 독일 특수 작물 시장에서의 주스, 유형별, 2020-2029 (백만 달러)
표 96 독일 주스의 특수 작물 시장, 유형별, 2020-2029 (킬로톤)
표 97 프랑스 특수 작물 시장, 유형별, 2020-2029 (백만 달러)
표 98 프랑스 특산 작물 시장, 유형별, 2020-2029(킬로톤)
표 99 프랑스 특수 작물 시장의 과일, 유형별, 2020-2029 (백만 달러)
표 100 프랑스 특수 작물 시장의 과일, 유형별, 2020-2029 (킬로톤)
표 101 2020-2029년 유형별 특수 작물 시장의 프랑스 야채(백만 달러)
표 102 2020-2029년 유형별 특수 작물 시장의 프랑스 야채(킬로톤)
표 103 2020-2029년 유형별 특수 작물 시장에서의 프랑스 견과류(백만 달러)
표 104 특수 작물 시장에서의 프랑스 견과류, 유형별, 2020-2029 (킬로톤)
표 105 2020-2029년 유형별 특수 작물 시장의 프랑스 허브(백만 달러)
표 106 2020-2029년 유형별 특수 작물 시장에서의 프랑스 허브(킬로톤)
표 107 2020-2029년 유형별 특수 작물 시장에서의 프랑스 향신료(백만 달러)
표 108 2020-2029년 유형별 특수 작물 시장에서의 프랑스 향신료(킬로톤)
표 109 프랑스 특산 작물 시장, 자연별, 2020-2029 (백만 달러)
표 110 프랑스 특산 작물 시장, 자연별, 2020-2029 (킬로톤)
표 111 프랑스 특수 작물 시장, 응용 분야별, 2020-2029 (백만 달러)
표 112 프랑스 특수 작물 시장, 응용 분야별, 2020-2029 (킬로톤)
표 113 2020-2029년 유형별 특수 작물 시장에서의 프랑스 제빵소(백만 달러)
표 114 2020-2029년 유형별 특수 작물 시장에서의 프랑스 제빵소(킬로톤)
표 115 특수 작물 시장에서의 프랑스 과자류, 유형별, 2020-2029 (백만 달러)
표 116 특수 작물 시장에서의 프랑스 과자류, 유형별, 2020-2029 (킬로톤)
표 117 2020-2029년 유형별 특수 작물 시장의 프랑스 유제품(백만 달러)
표 118 2020-2029년 유형별 특수 작물 시장의 프랑스 유제품(킬로톤)
표 119 2020-2029년 유형별 프랑스 주스의 특수 작물 시장(백만 달러)
표 120 프랑스 특수 작물 시장에서의 주스 종류별, 2020-2029 (킬로톤)
표 121 이탈리아 특산 작물 시장, 유형별, 2020-2029 (백만 달러)
표 122 이탈리아 특산 작물 시장, 유형별, 2020-2029(킬로톤)
표 123 이탈리아 특수 작물 시장의 과일, 유형별, 2020-2029 (백만 달러)
표 124 이탈리아 특수 작물 시장의 과일 종류별, 2020-2029 (킬로톤)
표 125 이탈리아 특수 작물 시장의 야채, 유형별, 2020-2029 (백만 달러)
표 126 이탈리아 특수 작물 시장의 야채, 유형별, 2020-2029 (킬로톤)
표 127 이탈리아 특수 작물 시장의 견과류, 유형별, 2020-2029 (백만 달러)
표 128 이탈리아 특수 작물 시장의 견과류 종류별, 2020-2029 (킬로톤)
표 129 이탈리아 특수 작물 시장의 허브, 유형별, 2020-2029 (백만 달러)
표 130 이탈리아 허브, 유형별 특수 작물 시장, 2020-2029 (킬로톤)
표 131 2020-2029년 유형별 특수 작물 시장의 이탈리아 향신료(백만 달러)
표 132 2020-2029년 유형별 특수 작물 시장의 이탈리아 향신료(킬로톤)
표 133 이탈리아 특산 작물 시장, 자연별, 2020-2029 (백만 달러)
표 134 이탈리아 특산 작물 시장, 자연별, 2020-2029(킬로톤)
표 135 이탈리아 특산 작물 시장, 응용 분야별, 2020-2029년(백만 달러)
표 136 이탈리아 특산 작물 시장, 응용 분야별, 2020-2029(킬로톤)
표 137 2020-2029년 유형별 특수 작물 시장에서의 이탈리아 제빵소(백만 달러)
표 138 이탈리아 제빵업체의 특수 작물 시장, 유형별, 2020-2029(킬로톤)
표 139 2020-2029년 유형별 특수 작물 시장에서의 이탈리아 과자류(백만 달러)
표 140 이탈리아 과자류, 특수 작물 시장별, 2020-2029년 유형별(킬로톤)
표 141 2020-2029년 유형별 특수 작물 시장의 이탈리아 유제품(백만 달러)
표 142 이탈리아 특수 작물 시장의 유제품 종류별, 2020-2029 (킬로톤)
표 143 이탈리아 주스의 특수 작물 시장, 유형별, 2020-2029 (백만 달러)
표 144 이탈리아 주스의 특수 작물 시장, 유형별, 2020-2029 (킬로톤)
표 145 영국 특수 작물 시장, 유형별, 2020-2029 (백만 달러)
표 146 영국 특수 작물 시장, 유형별, 2020-2029(킬로톤)
표 147 영국 특수 작물 시장의 과일, 유형별, 2020-2029 (백만 달러)
표 148 영국 특수 작물 시장의 과일, 유형별, 2020-2029 (킬로톤)
표 149 영국 특수 작물 시장의 야채, 유형별, 2020-2029 (백만 달러)
표 150 영국 특수 작물 시장의 야채, 유형별, 2020-2029 (킬로톤)
표 151 영국 특수 작물 시장의 견과류, 유형별, 2020-2029년(백만 달러)
표 152 영국 특수 작물 시장의 견과류, 유형별, 2020-2029 (킬로톤)
표 153 영국 특수 작물 시장의 허브, 유형별, 2020-2029 (백만 달러)
표 154 영국 특수 작물 시장의 허브, 유형별, 2020-2029 (킬로톤)
표 155 영국 향신료, 유형별 특수 작물 시장, 2020-2029 (백만 달러)
표 156 영국 향신료, 종류별 특수 작물 시장, 2020-2029 (킬로톤)
표 157 영국 특산 작물 시장, 자연별, 2020-2029 (백만 달러)
표 158 영국 특산 작물 시장, 자연별, 2020-2029(킬로톤)
표 159 영국 특수 작물 시장, 응용 분야별, 2020-2029 (백만 달러)
표 160 영국 특수 작물 시장, 응용 분야별, 2020-2029(킬로톤)
표 161 영국 제빵업체의 특수 작물 시장, 유형별, 2020-2029년(백만 달러)
표 162 영국 제빵업체의 특수 작물 시장, 유형별, 2020-2029(킬로톤)
표 163 영국 제과류의 특수 작물 시장, 유형별, 2020-2029년(백만 달러)
표 164 영국 제과류의 특수 작물 시장, 유형별, 2020-2029 (킬로톤)
표 165 영국 유제품, 유형별 특수 작물 시장, 2020-2029 (백만 달러)
표 166 영국 유제품, 특수 작물 시장별, 2020-2029년 유형별(킬로톤)
표 167 영국 특수 작물 시장의 주스, 유형별, 2020-2029년(백만 달러)
표 168 영국 특수 작물 시장의 주스, 유형별, 2020-2029 (킬로톤)
표 169 스위스 특산 작물 시장, 유형별, 2020-2029 (백만 달러)
표 170 스위스 특산 작물 시장, 유형별, 2020-2029(킬로톤)
표 171 스위스의 특수 작물 시장에서의 과일 종류별, 2020-2029년 (백만 달러)
표 172 스위스의 특수 작물 시장에서의 과일 종류별, 2020-2029년(킬로톤)
표 173 2020-2029년 유형별 특수 작물 시장의 스위스 야채(백만 달러)
표 174 2020-2029년 유형별 특수 작물 시장에서의 스위스 야채(킬로톤)
표 175 스위스 견과류, 유형별 특수 작물 시장, 2020-2029 (백만 달러)
표 176 스위스 견과류, 유형별 특수 작물 시장, 2020-2029 (킬로톤)
표 177 2020-2029년 유형별 특수 작물 시장의 스위스 허브(백만 달러)
표 178 2020-2029년 유형별 특수 작물 시장에서의 스위스 허브(킬로톤)
표 179 2020-2029년 유형별 특수 작물 시장에서의 스위스 향신료(백만 달러)
표 180 스위스 향신료, 유형별 특수 작물 시장, 2020-2029 (킬로톤)
표 181 스위스 특산 작물 시장, 자연별, 2020-2029 (백만 달러)
표 182 스위스 특산 작물 시장, 자연별, 2020-2029(킬로톤)
표 183 스위스 특수 작물 시장, 응용 분야별, 2020-2029 (백만 달러)
표 184 스위스 특산 작물 시장, 응용 분야별, 2020-2029(킬로톤)
표 185 스위스 제빵업체의 특수 작물 시장, 유형별, 2020-2029년(백만 달러)
표 186 스위스 제빵업체의 특수 작물 시장, 유형별, 2020-2029 (킬로톤)
표 187 2020-2029년 유형별 특수 작물 시장에서의 스위스 제과(백만 달러)
표 188 스위스 제과류의 특수 작물 시장, 유형별, 2020-2029 (킬로톤)
표 189 2020-2029년 유형별 특수 작물 시장의 스위스 유제품(백만 달러)
표 190 특수 작물 시장에서의 스위스 유제품, 유형별, 2020-2029 (킬로톤)
표 191 2020-2029년 유형별 특수 작물 시장에서의 스위스 주스(백만 달러)
표 192 2020-2029년 유형별 특수 작물 시장에서의 스위스 주스(킬로톤)
표 193 스페인 특산 작물 시장, 유형별, 2020-2029 (백만 달러)
표 194 스페인 특산 작물 시장, 유형별, 2020-2029(킬로톤)
표 195 스페인 특수 작물 시장의 과일, 유형별, 2020-2029 (백만 달러)
표 196 스페인 특수 작물 시장의 과일, 유형별, 2020-2029 (킬로톤)
표 197 2020-2029년 유형별 특수 작물 시장의 스페인 야채(백만 달러)
표 198 스페인 특수 작물 시장의 야채, 유형별, 2020-2029 (킬로톤)
표 199 스페인 특수 작물 시장의 견과류, 유형별, 2020-2029 (백만 달러)
표 200 특수 작물 시장에서의 스페인 견과류, 유형별, 2020-2029 (킬로톤)
표 201 스페인 허브, 유형별 특수 작물 시장, 2020-2029 (백만 달러)
표 202 스페인 허브, 유형별 특수 작물 시장, 2020-2029 (킬로톤)
표 203 스페인 향신료, 유형별 특수 작물 시장, 2020-2029 (백만 달러)
표 204 2020-2029년 유형별 특수 작물 시장의 스페인 향신료(킬로톤)
표 205 스페인 특산 작물 시장, 자연별, 2020-2029 (백만 달러)
표 206 스페인 특산 작물 시장, 자연별, 2020-2029(킬로톤)
표 207 스페인 특산 작물 시장, 응용 분야별, 2020-2029 (백만 달러)
표 208 스페인 특산 작물 시장, 응용 분야별, 2020-2029(킬로톤)
표 209 스페인 제빵업체의 특수 작물 시장, 유형별, 2020-2029 (백만 달러)
표 210 스페인 제빵소의 특수 작물 시장, 유형별, 2020-2029 (킬로톤)
표 211 스페인 제과류, 유형별 특수 작물 시장, 2020-2029 (백만 달러)
표 212 스페인 제과류, 유형별 특수 작물 시장, 2020-2029 (킬로톤)
표 213 스페인 특수 작물 시장의 유제품 종류별, 2020-2029년 (백만 달러)
표 214 스페인 특수 작물 시장의 유제품 종류별, 2020-2029 (킬로톤)
표 215 스페인 주스의 특수 작물 시장, 유형별, 2020-2029 (백만 달러)
표 216 스페인 주스의 특수 작물 시장, 유형별, 2020-2029 (킬로톤)
표 217 네덜란드 특산 작물 시장, 유형별, 2020-2029 (백만 달러)
표 218 네덜란드 특산 작물 시장, 유형별, 2020-2029(킬로톤)
표 219 2020-2029년 유형별 네덜란드 과일 시장(백만 달러)
표 220 2020-2029년 유형별 네덜란드 과일 시장(킬로톤)
표 221 2020-2029년 유형별 특수 작물 시장의 네덜란드 야채(백만 달러)
표 222 2020-2029년 유형별 특수 작물 시장의 네덜란드 야채(킬로톤)
표 223 2020-2029년 유형별 특수 작물 시장에서의 네덜란드 견과류(백만 달러)
표 224 2020-2029년 유형별 특수 작물 시장에서의 네덜란드 견과류(킬로톤)
표 225 2020-2029년 유형별 특수 작물 시장의 네덜란드 허브(백만 달러)
표 226 2020-2029년 유형별 특수 작물 시장에서의 네덜란드 허브(킬로톤)
표 227 2020-2029년 유형별 특수 작물 시장에서의 네덜란드 향신료(백만 달러)
표 228 2020-2029년 유형별 특수 작물 시장에서의 네덜란드 향신료(킬로톤)
표 229 네덜란드 특산 작물 시장, 자연별, 2020-2029 (백만 달러)
표 230 네덜란드 특산 작물 시장, 자연별, 2020-2029(킬로톤)
표 231 네덜란드 특산 작물 시장, 응용 분야별, 2020-2029 (백만 달러)
표 232 네덜란드 특산 작물 시장, 응용 분야별, 2020-2029(킬로톤)
표 233 2020-2029년 유형별 특수 작물 시장에서의 네덜란드 제빵소(백만 달러)
표 234 2020-2029년 유형별 특수 작물 시장에서의 네덜란드 제빵소(킬로톤)
표 235 2020-2029년 유형별 특수 작물 시장에서의 네덜란드 제과(백만 달러)
표 236 2020-2029년 유형별 특수 작물 시장에서의 네덜란드 과자류(킬로톤)
표 237 2020-2029년 유형별 특수 작물 시장의 네덜란드 유제품(백만 달러)
표 238 2020-2029년 유형별 특수 작물 시장의 네덜란드 유제품(킬로톤)
표 239 2020-2029년 유형별 특수 작물 시장에서의 네덜란드 주스(백만 달러)
표 240 2020-2029년 유형별 특수 작물 시장에서의 네덜란드 주스(킬로톤)
표 241 벨기에 특산 작물 시장, 유형별, 2020-2029 (백만 달러)
표 242 벨기에 특산 작물 시장, 유형별, 2020-2029(킬로톤)
표 243 벨기에 과일, 유형별 특수 작물 시장, 2020-2029 (백만 달러)
표 244 벨기에 과일, 유형별, 2020-2029(킬로톤)
표 245 벨기에 야채, 유형별 특수 작물 시장, 2020-2029 (백만 달러)
표 246 벨기에 야채, 종류별 특수 작물 시장, 2020-2029 (킬로톤)
표 247 벨기에 견과류, 유형별 특수 작물 시장, 2020-2029 (백만 달러)
표 248 벨기에 견과류, 유형별 특수 작물 시장, 2020-2029 (킬로톤)
표 249 특수 작물 시장에서의 벨기에 허브, 유형별, 2020-2029 (백만 달러)
표 250 벨기에 허브, 유형별 특수 작물 시장, 2020-2029 (킬로톤)
표 251 특수 작물 시장에서의 벨기에 향신료, 유형별, 2020-2029 (백만 달러)
표 252 특수 작물 시장에서의 벨기에 향신료, 유형별, 2020-2029 (킬로톤)
표 253 벨기에 특산 작물 시장, 자연별, 2020-2029 (백만 달러)
표 254 벨기에 특산 작물 시장, 자연별, 2020-2029(킬로톤)
표 255 벨기에 특산 작물 시장, 응용 분야별, 2020-2029 (백만 달러)
표 256 벨기에 특산 작물 시장, 응용 분야별, 2020-2029(킬로톤)
표 257 벨기에 제빵업체의 특수 작물 시장, 유형별, 2020-2029년(백만 달러)
표 258 벨기에 제빵업체의 특수 작물 시장, 유형별, 2020-2029(킬로톤)
표 259 특수 작물 시장에서의 벨기에 제과, 유형별, 2020-2029 (백만 달러)
표 260 특수 작물 시장에서의 벨기에 과자류, 유형별, 2020-2029 (킬로톤)
표 261 특수 작물 시장에서의 벨기에 유제품, 유형별, 2020-2029 (백만 달러)
표 262 벨기에 유제품, 유형별 특수 작물 시장, 2020-2029 (킬로톤)
표 263 2020-2029년 유형별 특수 작물 시장에서의 벨기에 주스(백만 달러)
표 264 벨기에 주스의 특수 작물 시장, 유형별, 2020-2029 (킬로톤)
표 265 터키 특산 작물 시장, 유형별, 2020-2029 (백만 달러)
표 266 터키 특산 작물 시장, 유형별, 2020-2029(킬로톤)
표 267 2020-2029년 유형별 특수 작물 시장의 칠면조 과일(백만 달러)
표 268 특수 작물 시장에서의 칠면조 과일, 유형별, 2020-2029 (킬로톤)
표 269 2020-2029년 유형별 특수 작물 시장의 칠면조 야채(백만 달러)
표 270 특수 작물 시장에서의 칠면조 야채, 유형별, 2020-2029 (킬로톤)
표 271 특수 작물 시장에서의 칠면조 나무 견과류, 유형별, 2020-2029년(백만 달러)
표 272 특수 작물 시장에서의 터키나무열매, 유형별, 2020-2029 (킬로톤)
표 273 특수 작물 시장에서의 칠면조 허브, 유형별, 2020-2029년 (백만 달러)
표 274 특수 작물 시장에서의 칠면조 허브, 유형별, 2020-2029 (킬로톤)
표 275 2020-2029년 유형별 특수 작물 시장의 터키 향신료(백만 달러)
표 276 2020-2029년 유형별 특수 작물 시장의 터키 향신료(킬로톤)
표 277 터키 특산 작물 시장, 자연별, 2020-2029 (백만 달러)
표 278 터키 특산 작물 시장, 자연별, 2020-2029(킬로톤)
표 279 터키 특산 작물 시장, 응용 분야별, 2020-2029 (백만 달러)
표 280 터키 특산 작물 시장, 응용 분야별, 2020-2029(킬로톤)
표 281 특수 작물 시장에서의 터키 베이커리, 유형별, 2020-2029 (백만 달러)
표 282 특수 작물 시장에서의 터키 베이커리, 유형별, 2020-2029 (킬로톤)
표 283 특수 작물 시장에서의 칠면조 과자, 유형별, 2020-2029년(백만 달러)
표 284 특수 작물 시장에서의 칠면조 과자류, 유형별, 2020-2029 (킬로톤)
표 285 특수 작물 시장에서의 칠면조 유제품, 유형별, 2020-2029년 (백만 달러)
표 286 특수 작물 시장에서의 칠면조 유제품, 유형별, 2020-2029년(킬로톤)
표 287 특수 작물 시장에서의 칠면조 주스, 유형별, 2020-2029년(백만 달러)
표 288 특수 작물 시장에서의 칠면조 주스, 유형별, 2020-2029 (킬로톤)
표 289 러시아 특산 작물 시장, 유형별, 2020-2029 (백만 달러)
표 290 러시아 특산 작물 시장, 유형별, 2020-2029(킬로톤)
표 291 러시아 특수 작물 시장의 과일, 유형별, 2020-2029 (백만 달러)
표 292 러시아 과일, 유형별 특수 작물 시장, 2020-2029 (킬로톤)
표 293 2020-2029년 유형별 특수 작물 시장의 러시아 야채(백만 달러)
표 294 러시아 특수 작물 시장의 야채, 유형별, 2020-2029 (킬로톤)
표 295 러시아 특수 작물 시장의 견과류, 유형별, 2020-2029 (백만 달러)
표 296 러시아 견과류, 유형별 특수 작물 시장, 2020-2029 (킬로톤)
표 297 러시아 허브의 특수 작물 시장, 유형별, 2020-2029 (백만 달러)
표 298 러시아 허브의 특수 작물 시장, 유형별, 2020-2029 (킬로톤)
표 299 러시아 향신료, 유형별 특수 작물 시장, 2020-2029 (백만 달러)
표 300 러시아 향신료의 특수 작물 시장, 유형별, 2020-2029 (킬로톤)
표 301 러시아 특산 작물 시장, 자연별, 2020-2029 (백만 달러)
표 302 러시아 특산 작물 시장, 자연별, 2020-2029(킬로톤)
표 303 러시아 특수 작물 시장, 응용 분야별, 2020-2029 (백만 달러)
표 304 러시아 특수 작물 시장, 응용 분야별, 2020-2029(킬로톤)
표 305 러시아 제빵업체의 특수 작물 시장, 유형별, 2020-2029년(백만 달러)
표 306 러시아 제빵류의 특수 작물 시장, 유형별, 2020-2029 (킬로톤)
표 307 러시아 제과류의 특수 작물 시장, 유형별, 2020-2029 (백만 달러)
표 308 러시아 제과류, 특수 작물 시장, 유형별, 2020-2029 (킬로톤)
표 309 러시아 유제품 시장, 유형별, 2020-2029 (백만 달러)
표 310 러시아 특수 작물 시장의 유제품 종류별, 2020-2029 (킬로톤)
표 311 러시아 주스의 특수 작물 시장, 유형별, 2020-2029 (백만 달러)
표 312 러시아 주스의 특수 작물 시장, 유형별, 2020-2029 (킬로톤)
표 313 유럽 기타 지역 특산 작물 시장, 유형별, 2020-2029년(백만 달러)
표 314 유럽 기타 지역 특산 작물 시장, 유형별, 2020-2029 (킬로톤)
그림 목록
그림 1 유럽 특수 작물 시장: 세분화
그림 2 유럽 특수 작물 시장: 데이터 삼각 측량
그림 3 유럽 특수 작물 시장: DROC 분석
그림 4 유럽 특수 작물 시장: 유럽 대 지역 분석
그림 5 유럽 특수 작물 시장: 회사 연구 분석
그림 6 유럽 특수 작물 시장: 인터뷰 인구 통계
그림 7 유럽 특수 작물 시장: DBMR 위치 그리드
그림 8 유럽 특수 작물 시장: 공급업체 점유율 분석
그림 9 유럽 특수 작물 시장: 세분화
그림 10 밀레니얼 세대의 이국적인 풍미의 증가 추세가 2022년에서 2029년 예측 기간 동안 유럽 특수 작물 시장을 주도할 것으로 예상됨
그림 11 야채 부문은 2022년부터 2029년까지의 예측 기간 동안 유럽 특수 작물 시장에서 가장 큰 점유율을 차지할 것으로 예상됩니다.
그림 12 인도 식품 성분의 공급망
그림 13 특수작물의 가치 사슬
그림 14 유럽 특수 작물 시장의 동인, 제약, 기회 및 과제
그림 15 유럽 특산 작물 시장, 자연별, 2021
그림 16 유럽 특수 작물 시장, 응용 분야별, 2021
그림 17 유럽 특수 작물 시장, 유형별, 2020-2029 (백만 달러)
그림 18 유럽 특수 작물 시장: 스냅샷(2021)
그림 19 유럽 특산 작물 시장: 국가별(2021년)
그림 20 유럽 특수 작물 시장: 국가별(2022년 및 2029년)
그림 21 유럽 특수 작물 시장: 국가별(2021년 및 2029년)
그림 22 유럽 특수 작물 시장: 유형별(2022년 및 2029년)
그림 23 유럽 특수 작물 시장: 회사 점유율 2021(%)
연구 방법론
데이터 수집 및 기준 연도 분석은 대규모 샘플 크기의 데이터 수집 모듈을 사용하여 수행됩니다. 이 단계에는 다양한 소스와 전략을 통해 시장 정보 또는 관련 데이터를 얻는 것이 포함됩니다. 여기에는 과거에 수집한 모든 데이터를 미리 검토하고 계획하는 것이 포함됩니다. 또한 다양한 정보 소스에서 발견되는 정보 불일치를 검토하는 것도 포함됩니다. 시장 데이터는 시장 통계 및 일관된 모델을 사용하여 분석하고 추정합니다. 또한 시장 점유율 분석 및 주요 추세 분석은 시장 보고서의 주요 성공 요인입니다. 자세한 내용은 분석가에게 전화를 요청하거나 문의 사항을 드롭하세요.
DBMR 연구팀에서 사용하는 주요 연구 방법론은 데이터 마이닝, 시장에 대한 데이터 변수의 영향 분석 및 주요(산업 전문가) 검증을 포함하는 데이터 삼각 측량입니다. 데이터 모델에는 공급업체 포지셔닝 그리드, 시장 타임라인 분석, 시장 개요 및 가이드, 회사 포지셔닝 그리드, 특허 분석, 가격 분석, 회사 시장 점유율 분석, 측정 기준, 글로벌 대 지역 및 공급업체 점유율 분석이 포함됩니다. 연구 방법론에 대해 자세히 알아보려면 문의를 통해 업계 전문가에게 문의하세요.
사용자 정의 가능
Data Bridge Market Research는 고급 형성 연구 분야의 선두 주자입니다. 저희는 기존 및 신규 고객에게 목표에 맞는 데이터와 분석을 제공하는 데 자부심을 느낍니다. 보고서는 추가 국가에 대한 시장 이해(국가 목록 요청), 임상 시험 결과 데이터, 문헌 검토, 재생 시장 및 제품 기반 분석을 포함하도록 사용자 정의할 수 있습니다. 기술 기반 분석에서 시장 포트폴리오 전략에 이르기까지 타겟 경쟁업체의 시장 분석을 분석할 수 있습니다. 귀하가 원하는 형식과 데이터 스타일로 필요한 만큼 많은 경쟁자를 추가할 수 있습니다. 저희 분석가 팀은 또한 원시 엑셀 파일 피벗 테이블(팩트북)로 데이터를 제공하거나 보고서에서 사용 가능한 데이터 세트에서 프레젠테이션을 만드는 데 도움을 줄 수 있습니다.

