Global Bladder Disorders Market
시장 규모 (USD 10억)
연평균 성장률 :
% 
 USD
16.16 Billion
USD
38.32 Billion
2025
2033
USD
16.16 Billion
USD
38.32 Billion
2025
2033
| 2026 –2033 | |
| USD 16.16 Billion | |
| USD 38.32 Billion | |
| % | |
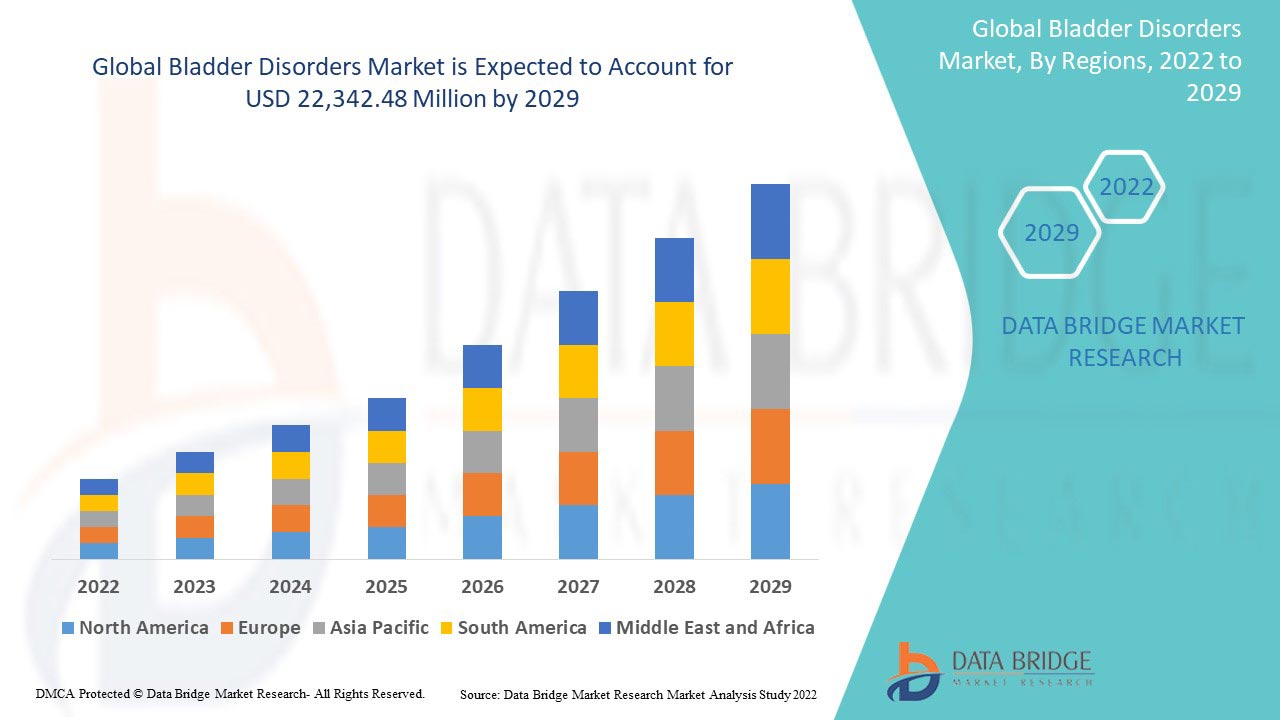
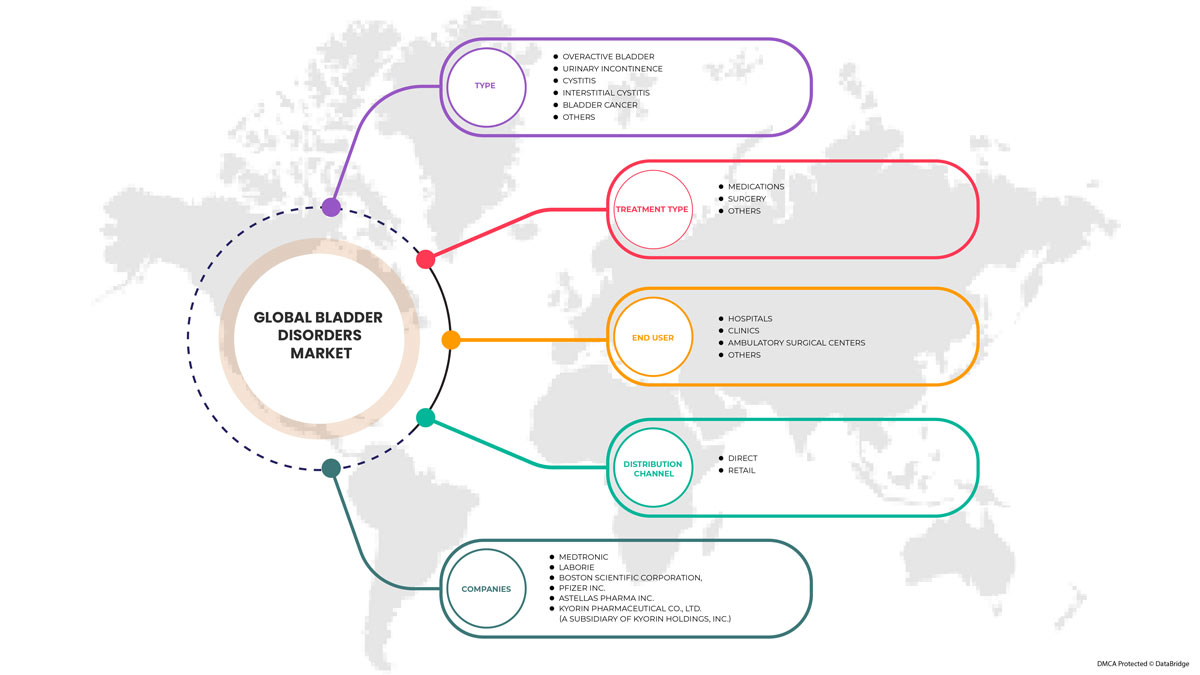
Global Bladder Disorders Market, By Type (Cystitis, Urinary Incontinence, Overactive Bladder, Interstitial Cystitis, Bladder Cancer), Treatment Type (Surgery, Medication, Non-surgical), End User (Hospitals, Clinics, Ambulatory Surgery Centers, Others), Distribution Channel (Direct, Retail) - Industry Trends and Forecast to 2029.
Bladder Disorders Market Analysis and Insights
Bladder disorders are a group of disorders that can affect human life's daily activity. Some of the most common bladder disorders are cystitis- in which the bladder is infected and causes inflammation. Urinary incontinence- loss of bladder control, interstitial cystitis- bladder pain and frequent, urgent urination, and the overactive bladder- a condition in which the bladder squeezes urine. Bladder disorders can affect the quality of life and cause other health problems. Health changes and issues, including nervous system and lifestyle factors, can cause or contribute to UI in men and women.
The most common bladder disorders are overactive bladder and UI. These problems are associated with the nervous system. Nerves carry messages from the brain to the bladder, indicating muscles contract or release.
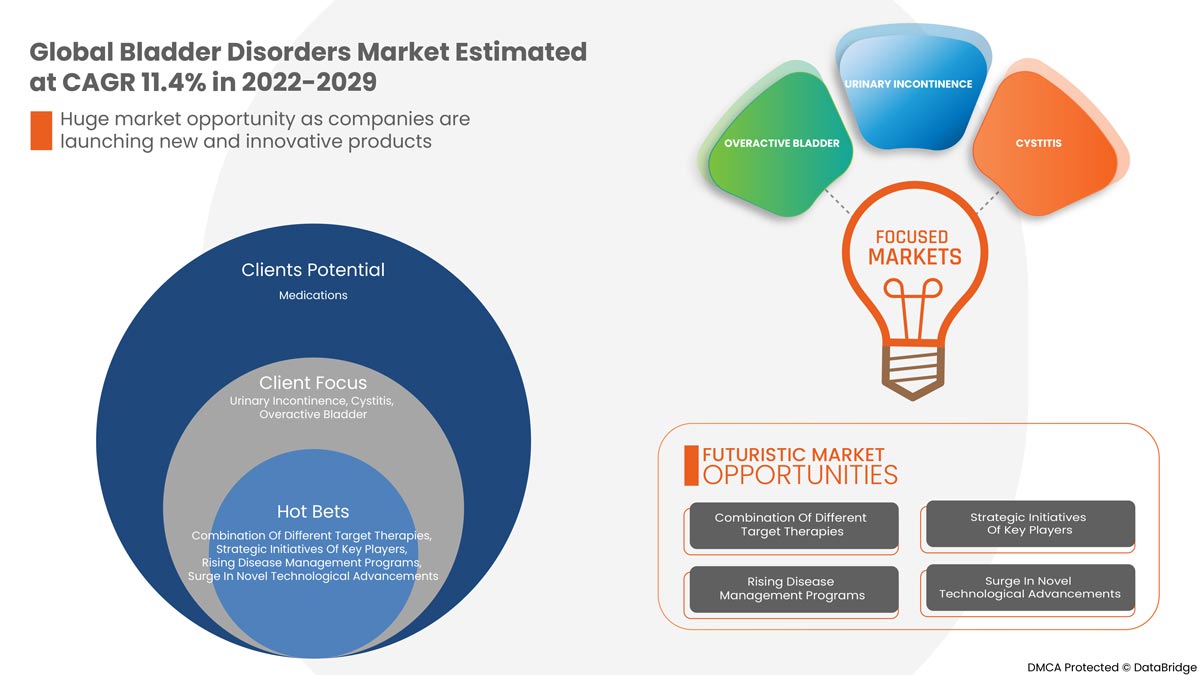
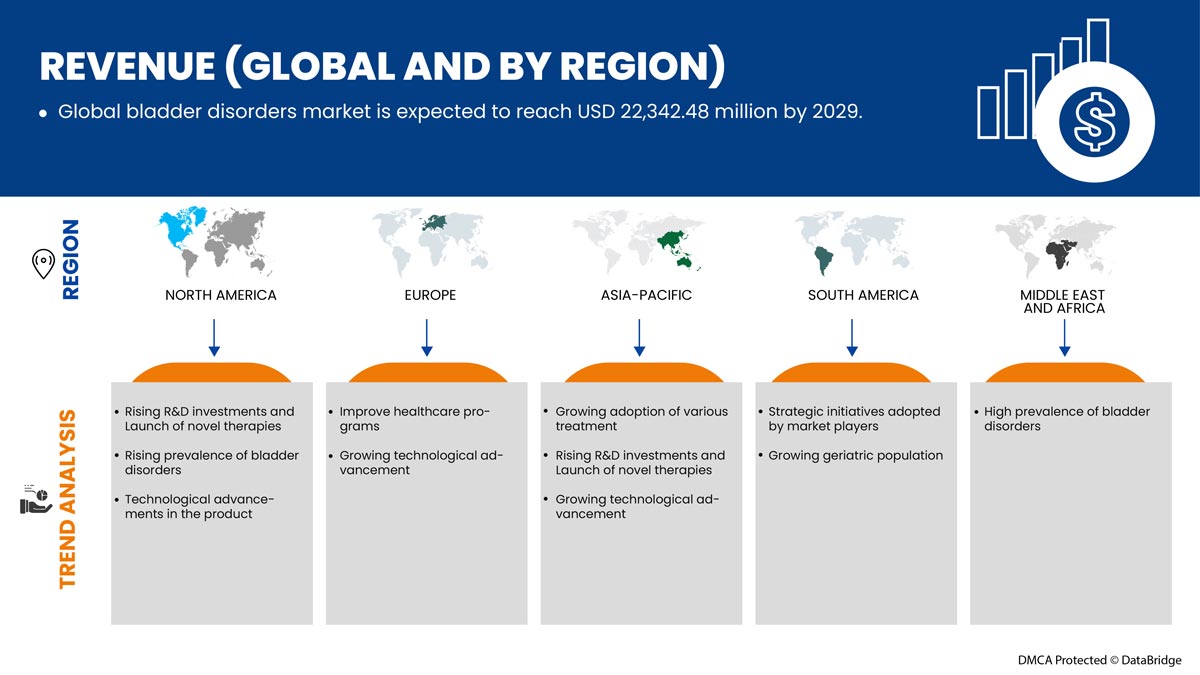
Global bladder disorders market is expected to grow in the forecast period of 2022 to 2029. Data Bridge Market Research analyses that the market is growing with a CAGR of 11.4% in the forecast period of 2022 to 2029 and is expected to reach USD 22,342.48 million by 2029.
|
Report Metric |
Details |
|
Forecast Period |
2022 to 2029 |
|
Base Year |
2021 |
|
Historic Years |
2020 (Customisable 2019-2014) |
|
Quantitative Units |
Revenue in USD Million |
|
Segments Covered |
By Type (Cystitis, Urinary Incontinence, Overactive Bladder, Interstitial Cystitis, Bladder Cancer), Treatment Type (Surgery, Medication, Non-surgical), End User (Hospitals, Clinics, Ambulatory Surgery Centers, Others), Distribution Channel (Direct, Retail) |
|
Countries Covered |
U.S., Canada, Mexico, Germany, U.K., France, Italy, Spain, Turkey, Russia, Netherlands, Switzerland, Blegium and Rest of Europe, China, Japan, India, South Korea, Australia, Singapore, Thailand, Malaysia, Indonesia, Philippines, Vietnam, Rest of Asia-Pacific, Brazil, Argentina, Peru, Rest of South America, South Africa, Saudi Arabia, U.A.E, Egypt, Israel, Rest of the Middle East and Africa |
|
Market Players Covered |
The major companies which are dealing in the market are Medtronic, Laborie, Boston Scientific Corporation, Pfizer Inc., Astellas Pharma Inc., KYORIN Pharmaceutical Co., Ltd. (A subsidiary of KYORIN Holdings, Inc.), Bristol-Myers Squibb Company, Johnson & Johnson Services, Inc., Axonics, Inc., Merck & Co., Inc., Viatris Inc., Blue Wind Medical, Valencia Technologies, Gaylord Chemical Company, L.L.C., Coloplast Corp, AbbVie Inc., Sun Pharmaceutical Industries Ltd., Zydus Group, Swati Spentose, Urovant Sciences among others. |
Market Definition of Global Bladder Disorders Market
Bladder related disorders include cystitis - inflammation of the bladder, often from an infection, Urinary incontinence - loss of bladder control, Overactive bladder - a condition in which the bladder squeezes urine out at the wrong time, Interstitial cystitis - a chronic problem that causes bladder pain and frequent, urgent urination and bladder cancer.
Different tests are performed by the doctors to diagnose the bladder disorder that includes x-rays, urine tests, and a bladder wall examination by scope called cystoscope. The treatment of the disorder depends on the cause of the problem and the treatment includes medication, surgeries (in severe cases), and non-surgical procedures.
Anticholinergic medications are the first-line of pharmacotherapy in Overactive Bladder (OAB) syndrome. OAB is a clinical symptom characterized by urgency of desire to urine pass, which is difficult to defer, generally frequency to pass urine more than eight times per day are consider into OAB. Anticholinergic drugs inhibit the muscarinic receptors at the detrusor muscle that reduce the bladder contractility. To reduce the side effects, new medications with improved bladder selectivity and extended-release formulations are being developed. The majority of the more recent medications are equally effective at reducing the symptoms of an overactive bladder.
Global Bladder Disorders Market Dynamics
Drivers
-
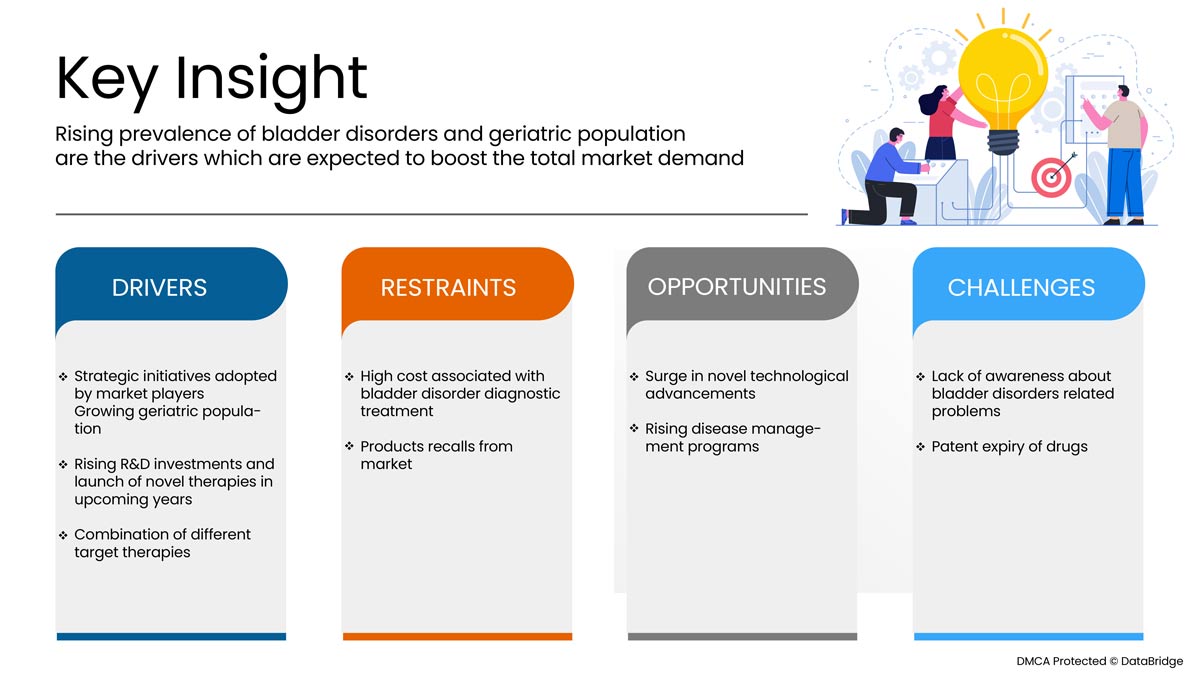
STRATEGIC INITIATIVES ADOPTED BY MARKET PLAYERS
Bladder disorders are a number of bladder issues that can affect daily physical activities. The most common bladder disorders are cystitis, interstitial cystitis, overactive bladder, urinary incontinence, and bladder cancer. Most bladder issues are caused by a bacterial infection that enters the urinary tract.
Various strategic initiatives by the market players in terms of collaboration, acquisition, partnership, and others, allow them to increase their company's product portfolio, leading to market expansion and hence enhancing the product demand among customers, which ultimately provides the market players to earn maximum revenue.
-
GROWING GERIATRIC POPULATION
Aging is a strong risk factor that can associate with bladder-related disorders. Aging prompts neurologic, anatomic, and biochemical changes in bladder function, which can result in the development of OAB. Overactive bladder is the most common problem among the geriatric population. Aging population is suffering from various bladder-associated problems and disorders due to which they are the predominant users of chronic health management services and solutions.
According to the noble study, the prevalence rate of overactive bladder is approximately 16.9 in women and men, around 16.0%, and the prevalence of OAB is growing with age. However, treatment guidelines specify the preferred first-, second-, and third-line OAB therapy strategies. Bladder disorders are associated with Neurologic disorders such as dementia, and in this age group, OAB is very challenging for the senior population. Over the last few decades, the old age population has been drastically growing worldwide.
-
RISING R&D INVESTMENTS AND LAUNCH OF NOVEL THERAPIES IN UPCOMING YEARS
Various treatment options and innovative therapies are available for OAB and other bladder disorders. Many biopharmaceutical and pharmaceutical companies are investing in various unconventional therapies for bladder disorders, which are expected to launch during the forecast period.
-
COMBINATION OF DIFFERENT TARGET THERAPIES
Combination Therapies are much more effective than monotherapy, without additional side effects. Combination Therapies are a safe and effective alternative for individuals with refractory bladder conditions. Combining different target therapy strategies is the best approach to relieve patients of bladder disorders. Oral medication and behavioral therapy should be considered for the patients' refractory treatment. Various advanced target therapies are available such as sacral neuromodulation, intradetrusor injection of a botulinum toxin A and percutaneous tibial nerve stimulation. These are advanced treatments and more effective as compared to oral agents.
Opportunities
-
SURGE IN NOVEL TECHNOLOGICAL ADVANCEMENTS
Chronic diseases are considered one of the major leading causes of death in developing countries worldwide. Therefore, the importance of healthcare management of chronic management is increased among public health practitioners.
Bladder disorder management now places a strong emphasis on assisting patients with a range of alternatives for self-care and a range of consultation services to educate patients about their illness state and move forward. These therapies also assist patients in getting over emotional trauma and anxiety, which may act as a counter-protective mechanism.
Rising technical breakthroughs allow healthcare organizations to explore innovative services and solutions for managing chronic bladder disorders. Since they are not required to stay in the hospital for an extended period of time, they have also decreased costs and patient volume. Furthermore, lowering hospital visits and stays makes this development convenient for older adults. Considering the favorable aspects, many organizations and businesses are developing and implementing the most recent technologies in managing chronic diseases to enhance patient outcomes.
-
RISING DISEASE MANAGEMENT PROGRAMS
People with bladder-related problems typically need more medical services, such as hospital stays, doctor visits, and prescription medications. The rise in the number of people living longer with many chronic problems and increasing healthcare expenditures has encouraged better healthcare plans.
Disease management is one strategy that tries to improve care while lowering the expense of caring for the chronically ill. Programs for managing diseases aim to enhance the health of people with certain chronic disorders such as bladder disorders while lowering the demand for medical services and associated expenses for consequences that can be avoided, such as hospital stays and emergency visits. These programs also include information regarding chronic disease management services and solutions. These are becoming very popular owing to the rising prevalence of chronic diseases worldwide. Government and healthcare organizations have organized and implemented these chronic diseases with multiple disease management programs such as bladder cancer, interstitial cystitis, and overactive bladder management programs. Since disease management programs can significantly improve self-care practices and reduce hospital visits and staying periods to a more excellent extent, they receive more attention among people.
Restraints/Challenges
However, the difficulty in diagnosing the disease and the cost of the treatments and diagnostics are high due to the procedure of various checkpoints along with the high-tech technologies and modalities to perform the procedures. The cost of the procedure generally gets elevated because of the high cost of the advanced technological devices used in the treatment, which is expected to restrain the market growth.
This bladder disorders market report provides details of new recent developments, trade regulations, import-export analysis, production analysis, value chain optimization, market share, the impact of domestic and localized market players, analyses opportunities in terms of emerging revenue pockets, changes in market regulations, strategic market growth analysis, market size, category market growths, application niches and dominance, product approvals, product launches, geographic expansions, technological innovations in the market. To gain more info on the Global bladder disorders market, contact Data Bridge Market Research for an Analyst Brief. Our team will help you make an informed market decision to achieve market growth.
Post COVID-19 Impact on Global Bladder Disorders Market
COVID-19 has positively affected the market. Lockdowns and isolation during pandemics complicate disease management and medication adherence. Hence the use of various treatment drugs has widely increased in the world's population. Hence, the pandemic has effected positively on this market
Recent Development
- In June 2022, Valencia Technologies Corporation announced the implantable neuromodulation technology product eCoin®, which is reshaping the delivery of long-term therapy for bladder control, is a tibial implant for Urge Urinary Incontinence (UUI). eCoin® received premarket approval (PMA) from the U.S. Food and Drug Administration (FDA) in March 2022, making it the first and only FDA-approved implantable tibial neurostimulator indicated for the treatment of urge urinary incontinence (UUI). This new product has helped the company to increase its portfolio
Global Bladder Disorders Market Scope
Global bladder disorders market is segmented into treatment, end user, and distribution channel types. The growth amongst these segments will help you analyze meager growth segments in the industries and provide the users with a valuable market overview and market insights to make strategic decisions to identify core market applications.
Type
- Cystitis
- Urinary Incontinence
- Overactive Bladder
- Interstitial Cystitis
- Bladder Cancer
On the basis of type, the global bladder disorders market is segmented into cystitis, urinary incontinence, overactive bladder, interstitial cystitis, bladder cancer.
Treatment type
- Surgery
- Medications
- Others
On the basis of product, the global bladder disorders market is segmented into surgery, medication, and others.
End User
- Hospital
- Clinics
- Ambulatory Surgery centers
- Others
On the basis of end users, the global bladder disorders market is segmented into hospitals, clinics, ambulatory surgery centers, and others.
Distribution Channel
- Direct
- Retail
On the basis of distribution channel, the global bladder disorders market is segmented into direct and retail.
Global Bladder Disorders Market Regional Analysis/Insights
The global bladder disorders market is analyzed, and market size insights and trends are provided by country, type, treatment type, end user, and distribution channel, as referenced above.
Countries covered in this market are U.S., Canada, Mexico, Germany, U.K., France, Italy, Spain, Turkey, Russia, Netherlands, Switzerland, Belgium and Rest of Europe, China, Japan, India, South Korea, Australia, Singapore, Thailand, Malaysia, Indonesia, Philippines, Vietnam, Rest of Asia-Pacific, Brazil, Argentina, Peru, Rest of South America, South Africa, Saudi Arabia, U.A.E, Egypt, Israel, Rest of the Middle East and Africa.
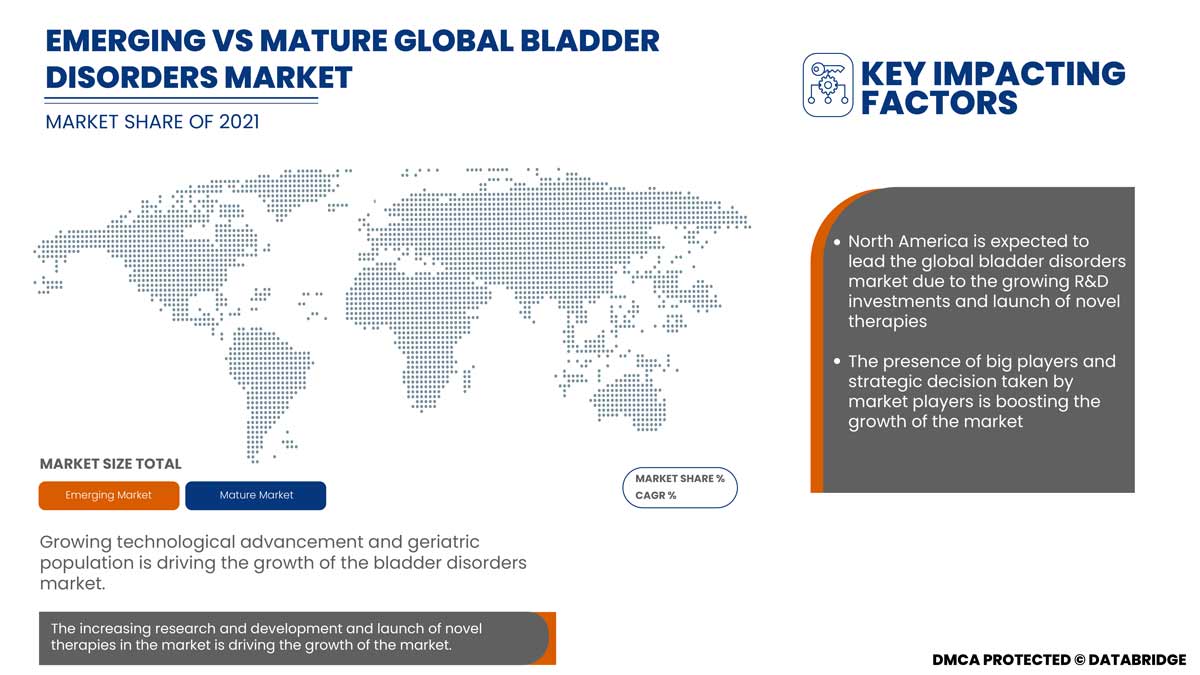
North America dominates the global bladder disorders market in terms of market share and revenue and will continue to flourish its dominance during the forecast period. This is due to the high prevalence of overactive bladder disorder in the region, and growing R&D investments and the launch of novel therapies are boosting the market
The country section of the report also provides individual market impacting factors and changes in regulations in the market that impact the current and future trends of the market. Data points, such as new and replacement sales, country demographics, disease epidemiology, and import-export tariffs, are some of the major pointers used to forecast the market scenario for individual countries. In addition, the presence and availability of global brands and their challenges faced due to high competition from local and domestic brands and the impact of sales channels are considered while providing forecast analysis of the country data.
Competitive Landscape and Global Bladder Disorders Market Share Analysis
The global bladder disorders market competitive landscape provides details about the competitors. Details include company overview, company financials, revenue generated, market potential, investment in research and development, new market initiatives, global presence, production sites and facilities, production capacities, company strengths and weaknesses, product launch, product width and breadth, and application dominance. The above data points are only related to the company’s focus on the global bladder disorders market.
Some of the major players operating in the global bladder disorders market are Medtronic, Laborie, Boston Scientific Corporation, Pfizer Inc., Astellas Pharma Inc., KYORIN Pharmaceutical Co., Ltd. (A subsidiary of KYORIN Holdings, Inc.), Bristol-Myers Squibb Company, Johnson & Johnson Services, Inc., Axonics, Inc., Merck & Co., Inc., Viatris Inc., Blue Wind Medical, Valencia Technologies, Gaylord Chemical Company, L.L.C., Coloplast Corp, AbbVie Inc., Sun Pharmaceutical Industries Ltd., Zydus Group, Swati Spentose, Urovant Sciences among others.
Research Methodology
Data collection and base year analysis are done using data collection modules with large sample sizes. The market data is analyzed and estimated using market statistical and coherent models. In addition, market share analysis and key trend analysis are the major success factors in the market report. The key research methodology used by the DBMR research team is data triangulation which involves data mining, analysis of the impact of data variables on the market, and primary (industry expert) validation. Data models include Vendor Positioning Grid, Market Time Line Analysis, Market Overview and Guide, Company Positioning Grid, Company Market Share Analysis, Standards of Measurement, Global vs. Regional, and Vendor Share Analysis. Please request an analyst call in case of further inquiry.
SKU-
세계 최초의 시장 정보 클라우드 보고서에 온라인으로 접속하세요

- 대화형 데이터 분석 대시보드
- 높은 성장 잠재력 기회를 위한 회사 분석 대시보드
- 사용자 정의 및 질의를 위한 리서치 분석가 액세스
- 대화형 대시보드를 통한 경쟁자 분석
- 최신 뉴스, 업데이트 및 추세 분석
- 포괄적인 경쟁자 추적을 위한 벤치마크 분석의 힘 활용
목차
1 서론
1.1 연구 목적
1.2 시장 정의
1.3 글로벌 방광 장애 시장 개요
1.4 제한 사항
1.5 대상 시장
2 시장 세분화
2.1 대상 시장
2.2 지리적 범위
연구에 2.3년이 고려됨
2.4 통화 및 가격
2.5 DBMR TRIPOD 데이터 검증 모델
2.6 다변량 모델링
2.7 유형 라이프라인 곡선
2.8 주요 여론 선도자와의 1차 인터뷰
2.9 DBMR 시장 위치 그리드
2.1 시장 최종 사용자 범위 그리드
2.11 공급업체 점유율 분석
2.12 2차 소스
2.13 가정
3 요약
4가지 프리미엄 인사이트
4.1 PESTEL 분석
4.2 포터의 5가지 힘
4.3 글로벌 방광 질환 시장, 파이프라인 분석
5 글로벌 방광 장애 시장: 규정
5.1 방광 장애 치료제에 대한 미국 규제 프레임워크
5.2 방광 장애 약물에 대한 유럽 규제 프레임워크
5.3 방광 장애 약물에 대한 일본 규제 지침
6 글로벌 방광 장애 시장 개요
6.1 드라이버
6.1.1 시장 참여자들이 채택한 전략적 이니셔티브
6.1.2 노령 인구 증가
6.1.3 향후 몇 년 동안 증가하는 R&D 투자와 새로운 치료법 출시
6.1.4 다양한 표적 치료의 조합
6.2 제약
6.2.1 방광 장애 진단 치료와 관련된 높은 비용
6.2.2 시장에서의 제품 리콜
6.3 기회
6.3.1 새로운 기술 발전의 급증
6.3.2 신흥 질병 관리 프로그램
6.4 과제
6.4.1 방광 장애 관련 문제에 대한 인식 부족
6.4.2 약물의 특허 만료
7 글로벌 방광 장애 시장, 유형별
7.1 개요
7.2 과활성 방광
7.3 요실금
7.4 방광염
7.5 간질성 방광염
7.6 방광암
7.7 기타
8 치료 유형별 글로벌 방광 장애 시장
8.1 개요
8.2 약물
8.2.1 톨테로딘
8.2.2 미라베그론
8.2.3 페소테로딘
8.2.4 옥시부티닌
8.2.5 솔리페나신
8.2.6 다리페나신
8.2.7 트로스퓸
8.2.8 기타
8.3 수술
8.3.1 방광 용량을 늘리기 위한 수술
8.3.2 방광 제거
8.3.3 기타
8.4 기타
9 글로벌 방광 장애 시장, 유통 채널별
9.1 개요
9.2 직접
9.3 소매
10 글로벌 방광 장애 시장, 최종 사용자별
10.1 개요
10.2 병원
10.3 클리닉
10.4 외래 수술 센터
10.5 기타
11 글로벌 방광 장애 시장, 지역별
11.1 개요
11.2 북미
11.2.1 미국
11.2.2 캐나다
11.2.3 멕시코
11.3 유럽
11.3.1 독일
11.3.2 영국
11.3.3 프랑스
11.3.4 이탈리아
11.3.5 스페인
11.3.6 터키
11.3.7 러시아
11.3.8 네덜란드
11.3.9 스위스
11.3.10 벨기에
11.3.11 유럽의 나머지 지역
11.4 아시아 태평양
11.4.1 중국
11.4.2 일본
11.4.3 인도
11.4.4 호주
11.4.5 대한민국
11.4.6 태국
11.4.7 싱가포르
11.4.8 인도네시아
11.4.9 말레이시아
11.4.10 베트남
11.4.11 필리핀
11.4.12 아시아 태평양의 나머지 지역
11.5 남미
11.5.1 브라질
11.5.2 아르헨티나
11.5.3 남미의 나머지 지역
11.6 중동 및 아프리카
11.6.1 사우디 아라비아
11.6.2 남아프리카 공화국
11.6.3 아랍에미리트
11.6.4 이집트
11.6.5 이스라엘
11.6.6 중동 및 아프리카의 나머지 지역
12 글로벌 방광 장애 시장: 회사 환경
12.1 회사 점유율 분석: 글로벌
12.2 회사 점유율 분석: 북미
12.3 회사 점유율 분석: 유럽
12.4 회사 점유율 분석: 아시아 태평양
13 SWOT 분석
14 회사 프로필
14.1 MERCK AND CO. INC. (2021)
14.1.1 회사 스냅샷
14.1.2 수익 분석
14.1.3 회사 점유율 분석
14.1.4 제품 포트폴리오
14.1.5 최근 개발
14.2 아스텔라스 파마(2021)
14.2.1 회사 스냅샷
14.2.2 수익 분석
14.2.3 회사 점유율 분석
14.2.4 제품 포트폴리오
14.2.5 최근 개발 사항
14.3 브리스톨-마이어스 스퀴브 컴퍼니(2021)
14.3.1 회사 스냅샷
14.3.2 수익 분석
14.3.3 회사 점유율 분석
14.3.4 제품 포트폴리오
14.3.5 최근 개발
14.4 보스턴 사이언티픽 코퍼레이션(2021)
14.4.1 회사 스냅샷
14.4.2 수익 분석
14.4.3 회사 점유율 분석
14.4.4 제품 포트폴리오
14.4.5 최근 개발
14.5 비아트리스 주식회사 (2021)
14.5.1 회사 스냅샷
14.5.2 수익 분석
14.5.3 회사 점유율 분석
14.5.4 제품 포트폴리오
14.5.5 최근 개발
14.6 애브비(2021)
14.6.1 회사 스냅샷
14.6.2 수익 분석
14.6.3 제품 포트폴리오
14.6.4 최근 개발
14.7 액소닉스 주식회사 (2021)
14.7.1 회사 스냅샷
14.7.2 수익 분석
14.7.3 제품 포트폴리오
14.7.4 최근 개발
14.8 블루윈드메디컬(2021)
14.8.1 회사 스냅샷
14.8.2 제품 포트폴리오
14.8.3 최근 개발
14.9 콜로플라스트 주식회사 (2021)
14.9.1 회사 스냅샷
14.9.2 수익 분석
14.9.3 제품 포트폴리오
14.1 게일로드 케미컬 컴퍼니, LLC (2021)
14.10.1 회사 스냅샷
14.10.2 제품 포트폴리오
14.10.3 최근 개발
14.11 존슨앤존슨서비스 주식회사(2021)
14.11.1 회사 스냅샷
14.11.2 수익 분석
14.11.3 제품 포트폴리오
14.11.4 최근 개발
14.12 교린제약 주식회사(교린홀딩스 주식회사의 자회사) (2021)
14.12.1 회사 스냅샷
14.12.2 제품 포트폴리오
14.12.3 최근 개발 사항
14.13 라보리(2021)
14.13.1 회사 스냅샷
14.13.2 제품 포트폴리오
14.13.3 최근 개발
14.14 메드트로닉(2021)
14.14.1 회사 스냅샷
14.14.2 수익 분석
14.14.3 제품 포트폴리오
14.14.4 최근 개발 사항
14.15 파이저 주식회사 (2021)
14.15.1 회사 스냅샷
14.15.2 수익 분석
14.15.3 제품 포트폴리오
14.15.4 최근 개발 사항
14.16 발렌시아 테크놀로지(2021)
14.16.1 회사 스냅샷
14.16.2 제품 포트폴리오
14.16.3 최근 개발
14.17 SUN PHAMACEUTICAL INDUSTRIES LTD. (2021)
14.17.1 회사 스냅샷
14.17.2 수익 분석
14.17.3 제품 포트폴리오
14.17.4 최근 개발
14.18 스와티 스펜토세(2021)
14.18.1 회사 스냅샷
14.18.2 제품 포트폴리오
14.18.3 최근 개발
14.19 UROVANT 과학(2021)
14.19.1 회사 스냅샷
14.19.2 제품 포트폴리오
14.19.3 최근 개발
14.2 지두스 그룹(2021)
14.20.1 회사 스냅샷
14.20.2 제품 포트폴리오
14.20.3 최근 개발
15 설문지
16 관련 보고서
표 목록
표 1 유형별 글로벌 방광 장애 시장, 2020-2029년(백만 달러)
표 2 지역별 방광 장애 시장의 글로벌 과민성 방광, 2020-2029년(백만 달러)
표 3 지역별 방광 장애의 글로벌 요실금 시장, 2020-2029년(백만 달러)
표 4 지역별 글로벌 방광염 질환 시장, 2020-2029년(백만 달러)
표 5 지역별 글로벌 방광 질환 간질성 방광염 시장, 2020-2029년(백만 달러)
표 6 지역별 방광 질환의 글로벌 방광암 시장, 2020-2029년(백만 달러)
표 7 지역별 글로벌 기타 방광 질환 시장, 2020-2029년(백만 달러)
표 8 치료 유형별 글로벌 방광 장애 시장, 2020-2029년(백만 달러)
표 9 지역별 방광 질환 치료제 시장(2020-2029년) (백만 달러)
표 10 치료 유형별 방광 장애 치료제 시장 글로벌 약물, 2020-2029년(백만 달러)
표 11 지역별 방광 질환 수술 시장(2020-2029년) (백만 달러)
표 12 치료 유형별 방광 장애 수술 시장 글로벌 시장, 2020-2029년(백만 달러)
표 13 지역별 글로벌 기타 방광 질환 시장, 2020-2029년(백만 달러)
표 14 유통 채널별 글로벌 방광 장애 시장, 2020-2029년(백만 달러)
표 15 지역별 방광 질환 시장 직접 판매(USD 백만)
표 16 지역별 방광 장애 시장의 글로벌 소매 시장, 2020-2029년(백만 달러)
표 17 최종 사용자별 글로벌 방광 장애 시장, 2020-2029년(백만 달러)
표 18 지역별 방광 장애 시장의 글로벌 병원, 2020-2029년(백만 달러)
표 19 지역별 방광 질환 시장의 글로벌 클리닉, 2020-2029년(백만 달러)
표 20 지역별 방광 장애 시장의 글로벌 외래 수술 센터, 2020-2029년(백만 달러)
표 21 지역별 방광 장애 시장의 글로벌 기타, 2020-2029년(백만 달러)
표 22 지역별 글로벌 방광 장애 시장, 2020-2029년(백만 달러)
표 23 북미 방광 장애 시장, 국가별, 2020-2029년(백만 달러)
표 24 북미 방광 장애 시장, 유형별, 2020-2029년(백만 달러)
표 25 북미 방광 장애 시장, 치료 유형별, 2020-2029년(백만 달러)
표 26 북미 방광 질환 치료제 시장, 치료 유형별, 2020-2029년(백만 달러)
표 27 북미 방광 질환 수술 시장, 치료 유형별, 2020-2029년(백만 달러)
표 28 북미 방광 장애 시장, 최종 사용자별, 2020-2029년(백만 달러)
표 29 북미 방광 장애 시장, 유통 채널별, 2020-2029년(백만 달러)
표 30 미국 방광 장애 시장, 유형별, 2020-2029년(백만 달러)
표 31 치료 유형별 미국 방광 장애 시장, 2020-2029년(백만 달러)
표 32 치료 유형별 방광 장애 치료제 시장, 2020-2029년(백만 달러)
표 33 치료 유형별 미국 방광 질환 수술 시장, 2020-2029년(백만 달러)
표 34 미국 방광 장애 시장, 최종 사용자별, 2020-2029년(백만 달러)
표 35 미국 방광 장애 시장, 유통 채널별, 2020-2029년(백만 달러)
표 36 캐나다 방광 장애 시장, 유형별, 2020-2029년(백만 달러)
표 37 캐나다 방광 장애 시장, 치료 유형별, 2020-2029년(백만 달러)
표 38 캐나다 방광 장애 치료제 시장, 치료 유형별, 2020-2029년(백만 달러)
표 39 캐나다 방광 질환 수술 시장, 치료 유형별, 2020-2029(백만 달러)
표 40 캐나다 방광 장애 시장, 최종 사용자별, 2020-2029(백만 달러)
표 41 캐나다 방광 장애 시장, 유통 채널별, 2020-2029년(백만 달러)
표 42 멕시코 방광 장애 시장, 유형별, 2020-2029(백만 달러)
표 43 멕시코 방광 장애 시장, 치료 유형별, 2020-2029년(백만 달러)
표 44 멕시코 방광 장애 치료제 시장, 치료 유형별, 2020-2029년(백만 달러)
표 45 멕시코 방광 장애 수술 시장, 치료 유형별, 2020-2029년(백만 달러)
표 46 멕시코 방광 장애 시장, 최종 사용자별, 2020-2029년(백만 달러)
표 47 멕시코 방광 장애 시장, 유통 채널별, 2020-2029년(백만 달러)
표 48 국가별 유럽 방광 장애 시장, 2020-2029년(백만 달러)
표 49 유럽 방광 장애 시장, 유형별, 2020-2029(백만 달러)
표 50 유럽 방광 장애 시장, 치료 유형별, 2020-2029년(백만 달러)
표 51 치료 유형별 유럽 방광 질환 약물 시장, 2020-2029년(백만 달러)
표 52 치료 유형별 유럽 방광 질환 수술 시장, 2020-2029년(백만 달러)
표 53 최종 사용자별 유럽 방광 장애 시장, 2020-2029년(백만 달러)
표 54 유럽 방광 장애 시장, 유통 채널별, 2020-2029년(백만 달러)
표 55 독일 방광 장애 시장, 유형별, 2020-2029년(백만 달러)
표 56 독일 방광 장애 시장, 치료 유형별, 2020-2029년(백만 달러)
표 57 치료 유형별 독일 방광 장애 약물 시장, 2020-2029년(백만 달러)
표 58 독일 방광 질환 수술 시장, 치료 유형별, 2020-2029(백만 달러)
표 59 독일 방광 장애 시장, 최종 사용자별, 2020-2029(백만 달러)
표 60 독일 방광 장애 시장, 유통 채널별, 2020-2029년(백만 달러)
표 61 영국 방광 장애 시장, 유형별, 2020-2029년(백만 달러)
표 62 영국 방광 장애 시장, 치료 유형별, 2020-2029년(백만 달러)
표 63 치료 유형별 영국 방광 장애 약물 시장, 2020-2029년(백만 달러)
표 64 영국 방광 질환 수술 시장, 치료 유형별, 2020-2029년(백만 달러)
표 65 최종 사용자별 영국 방광 장애 시장, 2020-2029년(백만 달러)
표 66 유통 채널별 영국 방광 장애 시장, 2020-2029년(백만 달러)
표 67 프랑스 방광 장애 시장, 유형별, 2020-2029 (백만 달러)
표 68 프랑스 방광 장애 시장, 치료 유형별, 2020-2029년(백만 달러)
표 69 프랑스 방광 장애 치료제 시장, 치료 유형별, 2020-2029년(백만 달러)
표 70 프랑스 방광 장애 수술 시장, 치료 유형별, 2020-2029(백만 달러)
표 71 최종 사용자별 프랑스 방광 장애 시장, 2020-2029년(백만 달러)
표 72 프랑스 방광 장애 시장, 유통 채널별, 2020-2029년(백만 달러)
표 73 이탈리아 방광 장애 시장, 유형별, 2020-2029(백만 달러)
표 74 이탈리아 방광 장애 시장, 치료 유형별, 2020-2029년(백만 달러)
표 75 치료 유형별 이탈리아 방광 장애 약물 시장, 2020-2029년(백만 달러)
표 76 이탈리아 방광 장애 수술 시장, 치료 유형별, 2020-2029년(백만 달러)
표 77 최종 사용자별 이탈리아 방광 장애 시장, 2020-2029년(백만 달러)
표 78 이탈리아 방광 장애 시장, 유통 채널별, 2020-2029년(백만 달러)
표 79 스페인 방광 장애 시장, 유형별, 2020-2029(백만 달러)
표 80 스페인 방광 장애 시장, 치료 유형별, 2020-2029년(백만 달러)
표 81 스페인 방광 장애 치료제 시장, 치료 유형별, 2020-2029년(백만 달러)
표 82 스페인. 방광 장애 수술 시장, 치료 유형별, 2020-2029(백만 달러)
표 83 스페인 방광 장애 시장, 최종 사용자별, 2020-2029년(백만 달러)
표 84 스페인 방광 장애 시장, 유통 채널별, 2020-2029년(백만 달러)
표 85 터키 방광 장애 시장, 유형별, 2020-2029년(백만 달러)
표 86 치료 유형별 터키 방광 장애 시장, 2020-2029년(백만 달러)
표 87 방광 장애 시장에서의 터키 약물, 치료 유형별, 2020-2029년(백만 달러)
표 88 방광 장애 시장에서의 터키 수술, 치료 유형별, 2020-2029년(백만 달러)
표 89 터키 방광 장애 시장, 최종 사용자별, 2020-2029(백만 달러)
표 90 유통 채널별 터키 방광 장애 시장, 2020-2029년(백만 달러)
표 91 러시아 방광 장애 시장, 유형별, 2020-2029(백만 달러)
표 92 러시아 방광 장애 시장, 치료 유형별, 2020-2029년(백만 달러)
표 93 러시아 방광 장애 치료제 시장, 치료 유형별, 2020-2029년(백만 달러)
표 94 러시아 방광 질환 수술 시장, 치료 유형별, 2020-2029년(백만 달러)
표 95 러시아 방광 장애 시장, 최종 사용자별, 2020-2029(백만 달러)
표 96 러시아 방광 장애 시장, 유통 채널별, 2020-2029년(백만 달러)
표 97 네덜란드 방광 장애 시장, 유형별, 2020-2029년(백만 달러)
표 98 네덜란드 방광 장애 시장, 치료 유형별, 2020-2029년(백만 달러)
표 99 네덜란드 방광 장애 치료제 시장, 치료 유형별, 2020-2029년(백만 달러)
표 100 네덜란드 방광 질환 수술 시장, 치료 유형별, 2020-2029년(백만 달러)
표 101 최종 사용자별 네덜란드 방광 장애 시장, 2020-2029년(백만 달러)
표 102 네덜란드 방광 장애 시장, 유통 채널별, 2020-2029년(백만 달러)
표 103 스위스 방광 장애 시장, 유형별, 2020-2029년(백만 달러)
표 104 스위스 방광 장애 시장, 치료 유형별, 2020-2029년(백만 달러)
표 105 스위스 방광 장애 치료제 시장, 치료 유형별, 2020-2029년(백만 달러)
표 106 스위스 방광 장애 수술 시장, 치료 유형별, 2020-2029년(백만 달러)
표 107 최종 사용자별 스위스 방광 장애 시장, 2020-2029년(백만 달러)
표 108 스위스 방광 장애 시장, 유통 채널별, 2020-2029년(백만 달러)
표 109 벨기에 방광 장애 시장, 유형별, 2020-2029(백만 달러)
표 110 벨기에 방광 장애 시장, 치료 유형별, 2020-2029년(백만 달러)
표 111 벨기에 방광 질환 약물 시장, 치료 유형별, 2020-2029 (백만 달러)
표 112 벨기에 방광 질환 수술 시장, 치료 유형별, 2020-2029년(백만 달러)
표 113 벨기에 방광 장애 시장, 최종 사용자별, 2020-2029(백만 달러)
표 114 벨기에 방광 장애 시장, 유통 채널별, 2020-2029년(백만 달러)
표 115 유럽 기타 지역 방광 장애 시장, 유형별, 2020-2029년(백만 달러)
표 116 아시아 태평양 방광 장애 시장, 국가별, 2020-2029년(백만 달러)
표 117 아시아 태평양 방광 장애 시장, 유형별, 2020-2029년(백만 달러)
표 118 아시아 태평양 방광 장애 시장, 치료 유형별, 2020-2029년(백만 달러)
표 119 아시아 태평양 방광 장애 약물 시장, 치료 유형별, 2020-2029 (백만 달러)
표 120 아시아 태평양 방광 질환 수술 시장, 치료 유형별, 2020-2029년(백만 달러)
표 121 아시아 태평양 방광 장애 시장, 최종 사용자별, 2020-2029년(백만 달러)
표 122 아시아 태평양 방광 장애 시장, 유통 채널별, 2020-2029년(백만 달러)
표 123 중국 방광 장애 시장, 유형별, 2020-2029 (백만 달러)
표 124 중국 방광 장애 시장, 치료 유형별, 2020-2029년(백만 달러)
표 125 중국 방광 질환 약물 시장, 치료 유형별, 2020-2029 (백만 달러)
표 126 중국 방광 질환 수술 시장, 치료 유형별, 2020-2029년(백만 달러)
표 127 중국 방광 장애 시장, 최종 사용자별, 2020-2029년(백만 달러)
표 128 중국 방광 장애 시장, 유통 채널별, 2020-2029년(백만 달러)
표 129 일본 방광 장애 시장, 유형별, 2020-2029(백만 달러)
표 130 치료 유형별 일본 방광 장애 시장, 2020-2029년(백만 달러)
표 131 치료 유형별 방광 장애 시장의 일본 약물, 2020-2029년(백만 달러)
표 132 치료 유형별 방광 장애 수술 시장, 2020-2029년(백만 달러)
표 133 최종 사용자별 일본 방광 장애 시장, 2020-2029년(백만 달러)
표 134 유통 채널별 일본 방광 장애 시장, 2020-2029년(백만 달러)
표 135 인도 방광 장애 시장, 유형별, 2020-2029(백만 달러)
표 136 인도 방광 장애 시장, 치료 유형별, 2020-2029년(백만 달러)
표 137 인도 방광 장애 치료제 시장, 치료 유형별, 2020-2029년(백만 달러)
표 138 인도 방광 장애 수술 시장, 치료 유형별, 2020-2029년(백만 달러)
표 139 최종 사용자별 인도 방광 장애 시장, 2020-2029년(백만 달러)
표 140 인도 방광 장애 시장, 유통 채널별, 2020-2029년(백만 달러)
표 141 호주 방광 장애 시장, 유형별, 2020-2029(백만 달러)
표 142 호주 방광 장애 시장, 치료 유형별, 2020-2029(백만 달러)
표 143 치료 유형별 호주 방광 장애 약물 시장, 2020-2029년(백만 달러)
표 144 호주 방광 질환 수술 시장, 치료 유형별, 2020-2029(백만 달러)
표 145 최종 사용자별 호주 방광 장애 시장, 2020-2029년(백만 달러)
표 146 호주 방광 장애 시장, 유통 채널별, 2020-2029년(백만 달러)
표 147 한국 방광 장애 시장, 유형별, 2020-2029 (백만 달러)
표 148 한국 방광 장애 시장, 치료 유형별, 2020-2029 (백만 달러)
표 149 2020-2029년 치료 유형별 방광 장애 치료제 시장(백만 달러)
표 150 한국 방광 질환 수술 시장, 치료 유형별, 2020-2029 (백만 달러)
표 151 최종 사용자별 한국 방광 장애 시장, 2020-2029년(백만 달러)
표 152 유통 채널별 한국 방광 장애 시장, 2020-2029년(백만 달러)
표 153 태국 방광 장애 시장, 유형별, 2020-2029(백만 달러)
표 154 태국 방광 장애 시장, 치료 유형별, 2020-2029(백만 달러)
표 155 태국 방광 장애 치료제 시장, 치료 유형별, 2020-2029 (백만 달러)
표 156 태국 방광 질환 수술 시장, 치료 유형별, 2020-2029 (백만 달러)
표 157 태국 방광 장애 시장, 최종 사용자별, 2020-2029(백만 달러)
표 158 태국 방광 장애 시장, 유통 채널별, 2020-2029년(백만 달러)
표 159 싱가포르 방광 장애 시장, 유형별, 2020-2029(백만 달러)
표 160 싱가포르 방광 장애 시장, 치료 유형별, 2020-2029년(백만 달러)
표 161 싱가포르 방광 장애 치료제 시장, 치료 유형별, 2020-2029년(백만 달러)
표 162 싱가포르 방광 질환 수술 시장, 치료 유형별, 2020-2029 (백만 달러)
표 163 최종 사용자별 싱가포르 방광 장애 시장, 2020-2029년(백만 달러)
표 164 싱가포르 방광 장애 시장, 유통 채널별, 2020-2029년(백만 달러)
표 165 인도네시아 방광 장애 시장, 유형별, 2020-2029 (백만 달러)
표 166 인도네시아 방광 장애 시장, 치료 유형별, 2020-2029년(백만 달러)
표 167 인도네시아 방광 장애 치료제 시장, 치료 유형별, 2020-2029년(백만 달러)
표 168 인도네시아. 치료 유형별 방광 장애 수술 시장, 2020-2029년(백만 달러)
표 169 인도네시아 방광 장애 시장, 최종 사용자별, 2020-2029(백만 달러)
표 170 인도네시아 방광 장애 시장, 유통 채널별, 2020-2029년(백만 달러)
표 171 말레이시아 방광 장애 시장, 유형별, 2020-2029(백만 달러)
표 172 말레이시아 방광 장애 시장, 치료 유형별, 2020-2029년(백만 달러)
표 173 말레이시아 방광 장애 치료제 시장, 치료 유형별, 2020-2029년(백만 달러)
표 174 말레이시아 방광 장애 수술 시장, 치료 유형별, 2020-2029(백만 달러)
표 175 말레이시아 방광 장애 시장, 최종 사용자별, 2020-2029(백만 달러)
표 176 말레이시아 방광 장애 시장, 유통 채널별, 2020-2029년(백만 달러)
표 177 베트남 방광 장애 시장, 유형별, 2020-2029 (백만 달러)
표 178 베트남 방광 장애 시장, 치료 유형별, 2020-2029년(백만 달러)
표 179 치료 유형별 방광 장애 시장에서 베트남 약물, 2020-2029 (백만 달러)
표 180 베트남 방광 질환 수술 시장, 치료 유형별, 2020-2029 (백만 달러)
표 181 베트남 방광 장애 시장, 최종 사용자별, 2020-2029(백만 달러)
표 182 베트남 방광 장애 시장, 유통 채널별, 2020-2029년(백만 달러)
표 183 필리핀 방광 장애 시장, 유형별, 2020-2029 (백만 달러)
표 184 필리핀 방광 장애 시장, 치료 유형별, 2020-2029년(백만 달러)
표 185 필리핀 방광 장애 치료제 시장, 치료 유형별, 2020-2029 (백만 달러)
표 186 필리핀 방광 장애 수술 시장, 치료 유형별, 2020-2029 (백만 달러)
표 187 필리핀 방광 장애 시장, 최종 사용자별, 2020-2029(백만 달러)
표 188 필리핀 방광 장애 시장, 유통 채널별, 2020-2029년(백만 달러)
표 189 아시아 태평양 방광 장애 시장의 나머지 지역, 유형별, 2020-2029년(백만 달러)
표 190 남미 방광 장애 시장, 국가별, 2020-2029년(백만 달러)
표 191 남미 방광 장애 시장, 유형별, 2020-2029년(백만 달러)
표 192 남미 방광 장애 시장, 치료 유형별, 2020-2029년(백만 달러)
표 193 남미 방광 장애 치료제 시장, 치료 유형별, 2020-2029년(백만 달러)
표 194 남미 방광 질환 수술 시장, 치료 유형별, 2020-2029년(백만 달러)
표 195 남미 방광 장애 시장, 최종 사용자별, 2020-2029년(백만 달러)
표 196 남미 방광 장애 시장, 유통 채널별, 2020-2029년(백만 달러)
표 197 브라질 방광 장애 시장, 유형별, 2020-2029(백만 달러)
표 198 브라질 방광 장애 시장, 치료 유형별, 2020-2029년(백만 달러)
표 199 브라질 방광 장애 치료제 시장, 치료 유형별, 2020-2029년(백만 달러)
표 200 브라질 방광 장애 수술 시장, 치료 유형별, 2020-2029(백만 달러)
표 201 브라질 방광 장애 시장, 최종 사용자별, 2020-2029(백만 달러)
표 202 브라질 방광 장애 시장, 유통 채널별, 2020-2029년(백만 달러)
표 203 아르헨티나 방광 장애 시장, 유형별, 2020-2029(백만 달러)
표 204 아르헨티나 방광 장애 시장, 치료 유형별, 2020-2029(백만 달러)
표 205 아르헨티나 방광 장애 치료제 시장, 치료 유형별, 2020-2029 (백만 달러)
표 206 아르헨티나 방광 질환 수술 시장, 치료 유형별, 2020-2029(백만 달러)
표 207 아르헨티나 방광 장애 시장, 최종 사용자별, 2020-2029(백만 달러)
표 208 유통 채널별 아르헨티나 방광 장애 시장, 2020-2029년(백만 달러)
표 209 남미 나머지 지역 방광 장애 시장, 유형별, 2020-2029년(백만 달러)
표 210 중동 및 아프리카 방광 장애 시장, 국가별, 2020-2029년(백만 달러)
표 211 중동 및 아프리카 방광 장애 시장, 유형별, 2020-2029(백만 달러)
표 212 중동 및 아프리카 방광 장애 시장, 치료 유형별, 2020-2029년(백만 달러)
표 213 중동 및 아프리카 방광 장애 치료제 시장, 치료 유형별, 2020-2029년(백만 달러)
표 214 중동 및 아프리카 방광 장애 수술 시장, 치료 유형별, 2020-2029년(백만 달러)
표 215 중동 및 아프리카 방광 장애 시장, 최종 사용자별, 2020-2029(백만 달러)
표 216 중동 및 아프리카 방광 장애 시장, 유통 채널별, 2020-2029년(백만 달러)
표 217 사우디 아라비아 방광 장애 시장, 유형별, 2020-2029(백만 달러)
표 218 사우디 아라비아 방광 장애 시장, 치료 유형별, 2020-2029년(백만 달러)
표 219 사우디 아라비아 방광 장애 치료제 시장, 치료 유형별, 2020-2029(백만 달러)
표 220 사우디 아라비아 방광 장애 수술 시장, 치료 유형별, 2020-2029(백만 달러)
표 221 사우디 아라비아 방광 장애 시장, 최종 사용자별, 2020-2029(백만 달러)
표 222 사우디 아라비아 방광 장애 시장, 유통 채널별, 2020-2029년(백만 달러)
표 223 남아프리카 방광 장애 시장, 유형별, 2020-2029(백만 달러)
표 224 남아프리카 방광 장애 시장, 치료 유형별, 2020-2029(백만 달러)
표 225 남아프리카 방광 장애 치료제 시장, 치료 유형별, 2020-2029년(백만 달러)
표 226 남아프리카 공화국 방광 질환 수술 시장, 치료 유형별, 2020-2029년(백만 달러)
표 227 최종 사용자별 남아프리카 방광 장애 시장, 2020-2029년(백만 달러)
표 228 남아프리카 방광 장애 시장, 유통 채널별, 2020-2029년(백만 달러)
표 229 UAE 방광 장애 시장, 유형별, 2020-2029(백만 달러)
표 230 UAE 방광 장애 시장, 치료 유형별, 2020-2029(백만 달러)
표 231 2020-2029년 치료 유형별 UAE 방광 장애 약물 시장(백만 달러)
표 232 UAE 방광 장애 수술 시장, 치료 유형별, 2020-2029(백만 달러)
표 233 최종 사용자별 UAE 방광 장애 시장, 2020-2029년(백만 달러)
표 234 유통 채널별 UAE 방광 장애 시장, 2020-2029년(백만 달러)
표 235 이집트 방광 장애 시장, 유형별, 2020-2029(백만 달러)
표 236 이집트 방광 장애 시장, 치료 유형별, 2020-2029년(백만 달러)
표 237 치료 유형별 방광 장애 시장에서의 이집트 약물, 2020-2029년(백만 달러)
표 238 이집트 방광 장애 수술 시장, 치료 유형별, 2020-2029(백만 달러)
표 239 이집트 방광 장애 시장, 최종 사용자별, 2020-2029(백만 달러)
표 240 이집트 방광 장애 시장, 유통 채널별, 2020-2029(백만 달러)
표 241 이스라엘 방광 장애 시장, 유형별, 2020-2029(백만 달러)
표 242 이스라엘 방광 장애 시장, 치료 유형별, 2020-2029(백만 달러)
표 243 이스라엘 방광 장애 치료제 시장, 치료 유형별, 2020-2029년(백만 달러)
표 244 이스라엘 방광 장애 수술 시장, 치료 유형별, 2020-2029(백만 달러)
표 245 이스라엘 방광 장애 시장, 최종 사용자별, 2020-2029(백만 달러)
표 246 이스라엘 방광 장애 시장, 유통 채널별, 2020-2029년(백만 달러)
표 247 중동 및 아프리카 방광 장애 시장 유형별 시장, 2020-2029년(백만 달러)
그림 목록
그림 1 글로벌 방광 장애 시장: 세분화
그림 2 글로벌 방광 질환 시장: 데이터 삼각 측량
그림 3 글로벌 방광 질환 시장: DROC 분석
그림 4 글로벌 방광 장애 시장: 글로벌 대 지역 시장 분석
그림 5 글로벌 방광 장애 시장: 회사 연구 분석
그림 6 글로벌 방광 장애 시장: 인터뷰 인구 통계
그림 7 글로벌 방광 질환 시장: DBMR 시장 위치 그리드
그림 8 글로벌 방광 장애 시장: 시장 최종 사용자 범위 그리드
그림 9 글로벌 방광 장애 시장: 공급업체 점유율 분석
그림 10 글로벌 방광 장애 시장: 세분화
그림 11 2022년에서 2029년 예측 기간 동안 전 세계 방광 장애 시장을 주도할 것으로 예상되는 전염병 및 팬데믹 발생 증가와 방광 장애 유병률 증가
그림 12 과활성 방광 세그먼트는 2022년 및 2029년에 글로벌 방광 장애 시장에서 가장 큰 점유율을 차지할 것으로 예상됩니다.
그림 13 북미는 글로벌 방광 장애 시장을 지배할 것으로 예상되며 아시아 태평양 지역은 2022년에서 2029년 예측 기간 동안 가장 높은 CAGR로 성장할 것으로 예상됩니다.
그림 14 아시아 태평양 지역은 2022년~2029년 예측 기간 동안 방광 장애 제조업체의 가장 빠르게 성장하는 시장입니다.
그림 15 글로벌 방광 장애 시장의 동인, 제약, 기회 및 과제
그림 16 글로벌 방광 장애 시장: 유형별, 2021
그림 17 글로벌 방광 장애 시장: 유형별, 2022-2029(백만 달러)
그림 18 글로벌 방광 장애 시장: 유형별, CAGR(2022-2029)
그림 19 글로벌 방광 장애 시장: 유형별, 수명선 곡선
그림 20 글로벌 방광 장애 시장: 치료 유형별, 2021
그림 21 글로벌 방광 장애 시장: 치료 유형별, 2022-2029년(백만 달러)
그림 22 글로벌 방광 장애 시장: 치료 유형별, CAGR(2022-2029)
그림 23 글로벌 방광 장애 시장: 치료 유형별, 수명선 곡선
그림 24 글로벌 방광 장애 시장: 유통 채널별, 2021
그림 25 글로벌 방광 장애 시장: 유통 채널별, 2022-2029년(백만 달러)
그림 26 글로벌 방광 장애 시장: 유통 채널별, CAGR(2022-2029)
그림 27 글로벌 방광 장애 시장: 유통 채널별, 수명선 곡선
그림 28 글로벌 방광 장애 시장: 최종 사용자별, 2021
그림 29 글로벌 방광 장애 시장: 최종 사용자별, 2022-2029(백만 달러)
그림 30 글로벌 방광 장애 시장: 최종 사용자별, CAGR(2022-2029)
그림 31 글로벌 방광 장애 시장: 최종 사용자별, 수명선 곡선
그림 32 글로벌 방광 장애 시장: 스냅샷(2021)
그림 33 글로벌 방광 장애 시장: 지역별(2021)
그림 34 글로벌 방광 장애 시장: 지역별(2022년 및 2029년)
그림 35 글로벌 방광 장애 시장: 지역별(2021년 및 2029년)
그림 36 글로벌 방광 장애 시장: 유형별(2022-2029)
그림 37 북미 방광 장애 시장: 스냅샷(2021)
그림 38 북미 방광 장애 시장: 국가별(2021년)
그림 39 북미 방광 장애 시장: 국가별(2022년 및 2029년)
그림 40 북미 방광 장애 시장: 국가별(2021년 및 2029년)
그림 41 북미 방광 장애 시장: 유형별(2022-2029)
그림 42 유럽 방광 장애 시장: 스냅샷(2021)
그림 43 유럽 방광 장애 시장: 국가별(2021년)
그림 44 유럽 방광 장애 시장: 국가별(2022년 및 2029년)
그림 45 유럽 방광 장애 시장: 국가별(2021년 및 2029년)
그림 46 유럽 방광 장애 시장: 유형별(2022-2029)
그림 47 아시아 태평양 방광 장애 시장: 스냅샷(2021)
그림 48 아시아 태평양 방광 장애 시장: 국가별(2021년)
그림 49 아시아 태평양 방광 장애 시장: 국가별(2022년 및 2029년)
그림 50 아시아 태평양 방광 장애 시장: 국가별(2021년 및 2029년)
그림 51 아시아 태평양 방광 장애 시장: 유형별(2022-2029)
그림 52 남미 방광 장애 시장: 스냅샷(2021)
그림 53 남미 방광 장애 시장: 국가별(2021년)
그림 54 남미 방광 장애 시장: 국가별(2022년 및 2029년)
그림 55 남미 방광 장애 시장: 국가별(2021년 및 2029년)
그림 56 남미 방광 장애 시장: 유형별(2022-2029)
그림 57 중동 및 아프리카 방광 장애 시장: 스냅샷(2021)
그림 58 중동 및 아프리카 방광 장애 시장: 국가별(2021년)
그림 59 중동 및 아프리카 방광 장애 시장: 국가별(2022년 및 2029년)
그림 60 중동 및 아프리카 방광 장애 시장: 국가별(2021년 및 2029년)
그림 61 중동 및 아프리카 방광 장애 시장: 유형별(2022-2029)
그림 62 글로벌 방광 장애 시장: 회사 점유율 2021(%)
그림 63 북미 방광 장애 시장: 회사 점유율 2021(%)
그림 64 유럽 방광 장애 시장: 회사 점유율 2021(%)
그림 65 아시아 태평양 방광 장애 시장: 회사 점유율 2021(%)
연구 방법론
데이터 수집 및 기준 연도 분석은 대규모 샘플 크기의 데이터 수집 모듈을 사용하여 수행됩니다. 이 단계에는 다양한 소스와 전략을 통해 시장 정보 또는 관련 데이터를 얻는 것이 포함됩니다. 여기에는 과거에 수집한 모든 데이터를 미리 검토하고 계획하는 것이 포함됩니다. 또한 다양한 정보 소스에서 발견되는 정보 불일치를 검토하는 것도 포함됩니다. 시장 데이터는 시장 통계 및 일관된 모델을 사용하여 분석하고 추정합니다. 또한 시장 점유율 분석 및 주요 추세 분석은 시장 보고서의 주요 성공 요인입니다. 자세한 내용은 분석가에게 전화를 요청하거나 문의 사항을 드롭하세요.
DBMR 연구팀에서 사용하는 주요 연구 방법론은 데이터 마이닝, 시장에 대한 데이터 변수의 영향 분석 및 주요(산업 전문가) 검증을 포함하는 데이터 삼각 측량입니다. 데이터 모델에는 공급업체 포지셔닝 그리드, 시장 타임라인 분석, 시장 개요 및 가이드, 회사 포지셔닝 그리드, 특허 분석, 가격 분석, 회사 시장 점유율 분석, 측정 기준, 글로벌 대 지역 및 공급업체 점유율 분석이 포함됩니다. 연구 방법론에 대해 자세히 알아보려면 문의를 통해 업계 전문가에게 문의하세요.
사용자 정의 가능
Data Bridge Market Research는 고급 형성 연구 분야의 선두 주자입니다. 저희는 기존 및 신규 고객에게 목표에 맞는 데이터와 분석을 제공하는 데 자부심을 느낍니다. 보고서는 추가 국가에 대한 시장 이해(국가 목록 요청), 임상 시험 결과 데이터, 문헌 검토, 재생 시장 및 제품 기반 분석을 포함하도록 사용자 정의할 수 있습니다. 기술 기반 분석에서 시장 포트폴리오 전략에 이르기까지 타겟 경쟁업체의 시장 분석을 분석할 수 있습니다. 귀하가 원하는 형식과 데이터 스타일로 필요한 만큼 많은 경쟁자를 추가할 수 있습니다. 저희 분석가 팀은 또한 원시 엑셀 파일 피벗 테이블(팩트북)로 데이터를 제공하거나 보고서에서 사용 가능한 데이터 세트에서 프레젠테이션을 만드는 데 도움을 줄 수 있습니다.

