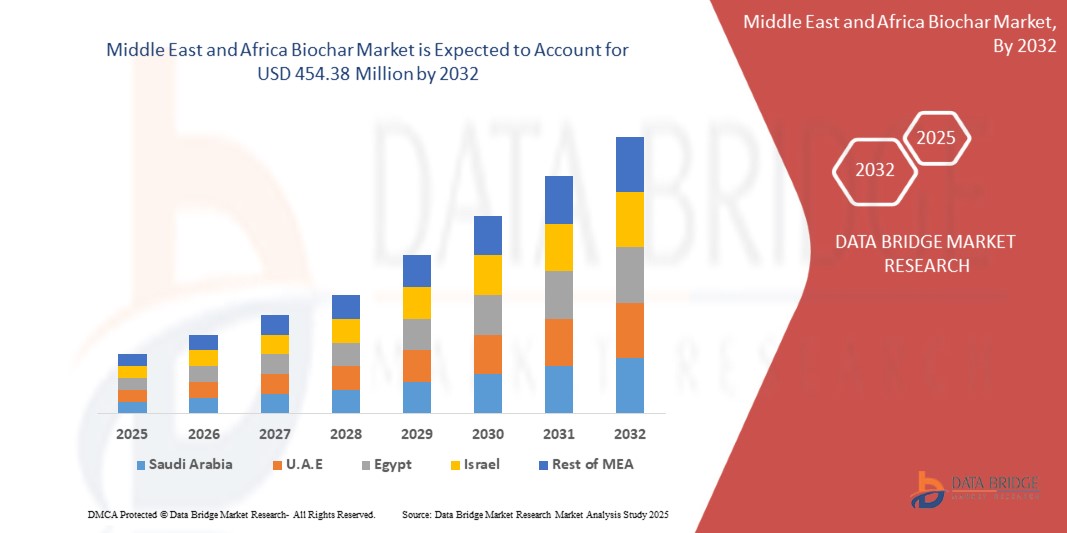
Middle East And Africa Biochar Market
시장 규모 (USD 10억)
연평균 성장률 :
% 
 USD
89.60 Million
USD
454.38 Million
2024
2032
USD
89.60 Million
USD
454.38 Million
2024
2032
| 2025 –2032 | |
| USD 89.60 Million | |
| USD 454.38 Million | |
| % | |
Middle East and Africa Biochar Market Segmentation, Technology (Pyrolysis, Gasification, and Hydrothermal Carbonization) Feedstock (Agricultural Residues, Forestry and Wood Waste, Animal Manure, Biomass Plantation, and Others), End Use (Soil Conditioner, Animal Farming, Electricity Generation, Heat Generation, Water Treatment, Building, Household, Textiles, and Others) – Industry Trends and Forecast to 2032
Middle East and Africa Biochar Market Analysis
The biochar market is experiencing significant growth, driven by increasing awareness of its environmental benefits and its role in sustainable agriculture. Biochar, a form of charcoal produced by pyrolyzing organic material, enhances soil fertility, reduces greenhouse gas emissions, and helps with waste management. The market is fueled by demand in agriculture, where biochar is used to improve soil quality and boost crop yields. In addition, biochar is gaining traction in carbon sequestration efforts, as it stores carbon for long periods. Government initiatives supporting climate change mitigation and rising interest in renewable energy further contribute to the market's expansion.
Biochar Market Size
Middle East and Africa biochar market is expected to reach USD 454.38 million by 2032 from USD 89.60 million in 2024, growing with a substantial CAGR of 23.8% in the forecast period of 2025 to 2032. In addition to the insights on market scenarios such as market value, growth rate, segmentation, geographical coverage, and major players, the market reports curated by the Data Bridge Market Research also include import export analysis, production capacity overview, production consumption analysis, price trend analysis, climate change scenario, supply chain analysis, value chain analysis, raw material/consumables overview, vendor selection criteria, PESTLE Analysis, Porter Analysis, and regulatory framework.
Biochar Market Trends
“Increasing Awareness of its Environmental Benefits”
Increasing awareness of biochar's environmental benefits is driving its adoption Middle East and Africaly. Biochar, produced by pyrolyzing organic waste, helps reduce carbon emissions by sequestering carbon in the soil for long periods. It also improves soil health, enhancing fertility and water retention, which supports sustainable agriculture. Furthermore, biochar aids in waste management by converting agricultural residues into a valuable product. As awareness grows, more industries and farmers are recognizing its potential to mitigate climate change, improve food security, and promote sustainable farming practices. Educational campaigns and government initiatives are helping accelerate the adoption of biochar as an eco-friendly solution.
Report Scope and Market Segmentation
|
Attributes |
Biochar Ingredients Key Market Insights |
|
Segments Covered |
|
|
Countries Covered |
South Africa, Saudi Arabia, U.A.E., Egypt, Israel and Rest of Middle East and Africa |
|
Key Market Players |
PYROPOWER (Switzerland), Terra Char (U.S.), and Zhengzhou kelin water purification material co.,ltd (China) |
|
Market Opportunities |
|
|
Value Added Data Infosets |
In addition to the insights on market scenarios such as market value, growth rate, segmentation, geographical coverage, and major players, the market reports curated by the Data Bridge Market Research also include import export analysis, production capacity overview, production consumption analysis, price trend analysis, climate change scenario, supply chain analysis, value chain analysis, raw material/consumables overview, vendor selection criteria, PESTLE Analysis, Porter Analysis, and regulatory framework. |
Biochar Market Definition
Biochar is a form of charcoal produced by heating organic material, such as agricultural waste, in the absence of oxygen through a process called pyrolysis. This results in a stable, carbon-rich substance that can be used to improve soil quality, enhance crop yields, and sequester carbon. Biochar is valued for its ability to retain nutrients, improve water retention, and reduce soil acidity, making it beneficial for sustainable agriculture. Additionally, it helps mitigate climate change by storing carbon in the soil for long periods, preventing the release of carbon dioxide into the atmosphere. Biochar also aids in waste management.
Biochar Market Dynamics
Drivers
- Rising Demand For Sustainable Agricultural Practices
The rising demand for sustainable agricultural practices is a key driver behind the growing adoption of biochar in agriculture. As the Middle East and Africa population increases and the effects of climate change intensify, there is an urgent need for farming practices that can improve crop yields, enhance soil health, and reduce environmental impact. Traditional farming methods often rely heavily on chemical fertilizers and intensive irrigation, leading to soil degradation, reduced biodiversity, and higher greenhouse gas emissions. In contrast, biochar offers a promising alternative by promoting long-term soil fertility while addressing several environmental concerns.
Biochar, a stable form of carbon produced by heating organic material in a low-oxygen environment (pyrolysis), has shown multiple benefits for agricultural soils. When applied to soil, biochar enhances its structure, improves water retention, and increases nutrient availability. This results in healthier crops and reduced need for synthetic fertilizers, which are costly and contribute to soil acidification and pollution. Moreover, biochar can sequester carbon in the soil for centuries, mitigating the effects of greenhouse gas emissions.
The growing awareness of the environmental and economic benefits of biochar has spurred its adoption in sustainable farming practices. Governments, environmental organizations, and agricultural stakeholders are increasingly promoting biochar as a tool for climate-smart agriculture. Additionally, biochar production from agricultural and forestry waste offers a value-added solution to waste management, making it a versatile and circular solution for farmers. The increasing demand for organic and eco-friendly food products further reinforces the market potential for biochar in agriculture, as it aligns with consumers' preferences for sustainably grown food. Consequently, biochar is becoming an essential component of modern, sustainable farming systems aimed at boosting productivity while minimizing ecological footprints.
- Government Policies Promoting Carbon Sequestration and Climate Mitigation
Government policies promoting carbon sequestration and climate mitigation play a crucial role in the growth of the biochar market. As nations increasingly recognize the urgency of addressing climate change, there is a strong push for policies that incentivize carbon capture and reduce greenhouse gas emissions. Biochar, a key carbon sequestration method, fits squarely into these efforts due to its ability to store carbon in the soil for long periods, potentially offsetting a significant portion of Middle East and Africa CO2 emissions.
Governments around the world have begun to incorporate carbon sequestration strategies into their climate action plans, with biochar often featured as a promising solution. For example, in the European Union and the United States, policies that promote sustainable agricultural practices and carbon storage through soil amendments are gaining traction. These policies may include tax incentives, grants, and subsidies for farmers and landowners who adopt carbon sequestration technologies such as biochar application.
In addition to financial incentives, carbon pricing mechanisms, such as carbon taxes or cap-and-trade systems, encourage industries to reduce their carbon footprints. By assigning a cost to carbon emissions, these policies indirectly create demand for carbon removal technologies like biochar, which can be used to offset emissions and earn carbon credits. This has led to the development of carbon markets where biochar producers can potentially generate revenue by selling carbon credits, further supporting the economic viability of biochar production.
International climate agreements, such as the Paris Agreement, have also set ambitious targets for reducing Middle East and Africa emissions, prompting governments to explore and fund innovative solutions for carbon capture. As these policies evolve, the biochar market is expected to benefit from increased research funding, regulatory support, and a growing emphasis on climate mitigation strategies.
Opportunities
- Expanding Agricultural Applications For Improved Soil Fertility And Productivity
The expanding agricultural applications for biochar to improve soil fertility and productivity are significant drivers of growth for the Middle East and Africa biochar market. As farmers and agricultural businesses face challenges related to soil degradation, declining fertility, and environmental sustainability, biochar has emerged as a highly effective, eco-friendly solution. Biochar, when added to soil, helps enhance its structure and nutrient content. The porous nature of biochar increases the soil’s water retention capacity, making it particularly beneficial in regions with arid or water-scarce conditions. This enhanced water retention also helps mitigate drought effects, improving crop yields during dry periods. Furthermore, biochar acts as a reservoir for nutrients like nitrogen, phosphorus, and potassium, which are essential for plant growth. By improving nutrient retention, biochar reduces the need for chemical fertilizers, which can be both costly and harmful to the environment.
Biochar’s alkaline nature can also help neutralize acidic soils, improving the availability of nutrients and creating a more favorable environment for plant growth. This makes it especially useful for soils that are overly acidic due to heavy rainfall or overuse of synthetic fertilizers. As a soil amendment, biochar has been shown to improve crop productivity by increasing nutrient cycling, microbial activity, and root development. The increased microbial activity helps break down organic matter and release nutrients more efficiently, ensuring plants have access to a balanced supply of nutrients. Additionally, biochar’s impact on soil structure encourages deeper root penetration, allowing plants to access nutrients and water from a larger volume of soil.
In agriculture, the growing focus on sustainability and carbon sequestration has also driven biochar’s adoption. Biochar acts as a carbon sink, storing carbon in the soil for hundreds to thousands of years, thus contributing to climate change mitigation. This dual benefit—improving soil fertility while sequestering carbon—aligns with Middle East and Africa efforts to reduce greenhouse gas emissions.
- Innovations In Biochar Applications
Beyond its well-known agricultural applications, biochar is increasingly being recognized for its diverse potential in various industries, driving the growth of the Middle East and Africa biochar market. These innovations extend biochar’s benefits into environmental remediation, energy production, water treatment, and even construction materials, positioning it as a versatile and sustainable solution to pressing Middle East and Africa challenges. Biochar’s high surface area and porous structure make it an excellent adsorbent for pollutants. It has been successfully used in the treatment of wastewater, removing heavy metals, organic compounds, and toxins. Biochar's ability to trap harmful chemicals and improve water quality has led to its adoption in both industrial and municipal wastewater treatment facilities, helping mitigate water contamination issues.
Biochar's carbon-rich composition makes it an effective tool for long-term carbon storage. As a stable form of carbon, biochar can sequester carbon in soils for hundreds or even thousands of years, contributing to climate change mitigation efforts. This has increased its appeal in carbon credit markets, where it can be used to offset greenhouse gas emissions, thus driving investment in biochar production. Biochar can be integrated into bioenergy systems, particularly in the form of biochar pellets or briquettes for heat generation. When produced through pyrolysis, biochar itself can be used as a renewable energy source for heating or electricity generation, offering an alternative to fossil fuels. It also improves the energy efficiency of biomass combustion by reducing smoke emissions, making biochar-based fuels cleaner than traditional wood or coal.
Recent innovations have explored using biochar as an additive in concrete, bricks, and other construction materials. Incorporating biochar into these materials can enhance their insulation properties, reduce their carbon footprint, and improve their overall strength. The use of biochar in construction supports the trend towards sustainable building practices and green construction technologies.
Restraints/Challenges
- Limited Awareness and Education on Biochar Benefits
Limited awareness and education about biochar's benefits are significant challenges hindering its widespread adoption across various sectors, including agriculture, environmental management, and climate change mitigation. Despite its potential to improve soil health, sequester carbon, and reduce waste, many stakeholders—such as farmers, landowners, policymakers, and the general public—remain unfamiliar with biochar or its advantages. This lack of awareness can slow the transition to more sustainable practices and prevent biochar from reaching its full potential.
In the agricultural sector, biochar is recognized for its ability to enhance soil fertility, improve water retention, and increase crop yields, particularly in nutrient-poor or degraded soils. However, many farmers are unaware of its potential benefits and may be hesitant to adopt biochar due to unfamiliarity or concerns about its effectiveness. The lack of information about proper application methods and the long-term advantages of biochar often results in a reluctance to invest in its use, especially given the financial constraints faced by smallholders and rural communities.
Similarly, policymakers and environmental professionals may not fully understand the role biochar can play in carbon sequestration. Biochar’s ability to lock carbon in a stable form for hundreds to thousands of years presents a cost-effective means of mitigating climate change, but this message has not been widely communicated or integrated into national and international climate policies. As a result, biochar is often overlooked in favor of other carbon removal technologies.
To address these challenges, increased education and outreach are essential. This can include training programs, workshops, and informational campaigns targeted at farmers, environmentalists, policymakers, and the public. Universities, research institutions, and industry groups can collaborate to conduct studies and share data that demonstrate the effectiveness of biochar. Raising awareness and educating stakeholders about the long-term economic and environmental benefits of biochar will be critical to its broader adoption.
- Lack of standardization and quality control in biochar production processes
The lack of standardization and quality control in biochar production processes presents a significant challenge to the Middle East and Africa biochar market. Biochar, a form of charcoal produced through the pyrolysis of organic materials, has gained attention for its potential in carbon sequestration, soil enhancement, and waste management. However, the variability in production methods and the absence of uniform quality standards hinder its widespread adoption and market growth.
One of the key issues is the diversity of feedstocks used to produce biochar. Different organic materials, such as agricultural waste, forestry residues, and even municipal waste, result in biochar with varying chemical properties, physical characteristics, and effectiveness in applications. This inconsistency complicates the ability to evaluate and compare the performance of biochar products, especially in critical sectors like agriculture, where biochar’s soil health benefits are highly dependent on its composition.
Without clear industry standards, producers may prioritize cost-efficiency over quality, leading to biochar that fails to meet the expected performance for specific uses, such as soil amendment or carbon sequestration. Additionally, the lack of standardized testing methods and certifications makes it difficult for consumers to assess the quality and environmental impact of biochar products. This uncertainty undermines consumer confidence and limits large-scale investments. The absence of regulatory frameworks also complicates the scaling of biochar as a climate change mitigation tool. Governments and environmental agencies require standardized metrics to evaluate the carbon sequestration potential of biochar, ensuring that it can be integrated into carbon credit programs or sustainability initiatives. Without these frameworks, biochar production remains fragmented, impeding the market’s growth and its contribution to Middle East and Africa sustainability efforts.
Impact and Current Market Scenario of Raw Material Shortage and Shipping Delays
Data Bridge Market Research offers a high-level analysis of the market and delivers information by keeping in account the impact and current market environment of raw material shortage and shipping delays. This translates into assessing strategic possibilities, creating effective action plans, and assisting businesses in making important decisions.
Apart from the standard report, we also offer in-depth analysis of the procurement level from forecasted shipping delays, distributor mapping by region, commodity analysis, production analysis, price mapping trends, sourcing, category performance analysis, supply chain risk management solutions, advanced benchmarking, and other services for procurement and strategic support.
Expected Impact of Economic Slowdown on the Pricing and Availability of Products
When economic activity slows, industries begin to suffer. The forecasted effects of the economic downturn on the pricing and accessibility of the products are taken into account in the market insight reports and intelligence services provided by DBMR. With this, our clients can typically keep one step ahead of their competitors, project their sales and revenue, and estimate their profit and loss expenditures.
Middle East and Africa Biochar Market Scope
The market is segmented on the basis of technology, feedstock, end use. The growth amongst these segments will help you analyze meagre growth segments in the industries and provide the users with a valuable market overview and market insights to help them make strategic decisions for identifying core market applications.
Technology
- Pyrolysis
- Gasification
- Hydrothermal Carbonization
Feedstock
- Agricultural Residues
- Forestry and Wood Waste
- Animal Manure
- Biomass Plantation
- Others
End Use
- Soil Conditioner
- Animal Farming
- Electricity Generation
- Heat Generation
- Water Treatment
- Building
- Household
- Textiles
- Others
Middle East and Africa Biochar Market Regional Analysis
The market is analyzed and market size insights and trends are provided by country, technology, feedstock, and end use as referenced.
The countries covered in the market are South Africa, Saudi Arabia, U.A.E., Egypt, Israel and rest of Middle East and Africa.
South Africa dominates the Middle East and Africa biochar market due to strong environmental regulations, government incentives, advanced agricultural practices, and growing awareness of biochar's benefits in carbon sequestration and sustainable farming.
Saudi Arabia is emerging in the Middle East and Africa biochar market due to increasing agricultural demand, government support for sustainable farming, rising environmental awareness, and the need for waste management solutions in rapidly growing economies.
The country section of the report also provides individual market impacting factors and changes in regulation in the market domestically that impacts the current and future trends of the market. Data points like down-stream and upstream value chain analysis, technical trends and porter's five forces analysis, case studies are some of the pointers used to forecast the market scenario for individual countries. Also, the presence and availability of Middle East and Africa brands and their challenges faced due to large or scarce competition from local and domestic brands, impact of domestic tariffs and trade routes are considered while providing forecast analysis of the country data.
Middle East and Africa Biochar Market Share
The market competitive landscape provides details by competitors. Details included are company overview, company financials, revenue generated, market potential, investment in research and development, new market initiatives, Middle East and Africa presence, production sites and facilities, production capacities, company strengths and weaknesses, product launch, product width and breadth, application dominance. The above data points provided are only related to the companies' focus related to market.
Middle East and Africa Biochar Market Leaders Operating in the Market Are:
- PYROPOWER (Switzerland)
- Terra Char (U.S.)
- Zhengzhou kelin water purification material co.,ltd (China)
SKU-
세계 최초의 시장 정보 클라우드 보고서에 온라인으로 접속하세요

- 대화형 데이터 분석 대시보드
- 높은 성장 잠재력 기회를 위한 회사 분석 대시보드
- 사용자 정의 및 질의를 위한 리서치 분석가 액세스
- 대화형 대시보드를 통한 경쟁자 분석
- 최신 뉴스, 업데이트 및 추세 분석
- 포괄적인 경쟁자 추적을 위한 벤치마크 분석의 힘 활용
목차
1 서론
1.1 연구 목적
1.2 시장 정의
1.3 개요
1.4 제한 사항
1.5 대상 시장
2 시장 세분화
2.1 대상 시장
2.2 지리적 범위
연구에 2.3년이 고려됨
2.4 통화 및 가격
2.5 DBMR TRIPOD 데이터 검증 모델
2.6 다변량 모델링
2.7 주요 여론 선도자와의 1차 인터뷰
2.8 DBMR 시장 위치 그리드
2.9 시장 적용 범위 그리드
2.1 DBMR 공급업체 점유율 분석
2.11 2차 소스
2.12 가정
3 요약
4가지 프리미엄 인사이트
4.1 PESTEL 분석
4.1.1 정치적 요인
4.1.2 경제적 요인
4.1.3 사회적 요인
4.1.4 기술적 요인
4.1.5 환경 요인
4.1.6 법적 요소
4.2 포터의 5가지 힘 분석
4.2.1 신규 진입자의 위협
4.2.2 공급업체의 협상력
4.2.3 구매자의 협상력
4.2.4 대체품 위협
4.2.5 내부 경쟁
4.3 기후 변화 시나리오
4.3.1 탄소 격리 및 기후 완화
4.3.2 토양 건강 및 농업 회복력
4.3.3 중동 및 아프리카 시장 성장
4.4 중동 및 아프리카 바이오차 시장의 생산 및 소비
4.5 원자재 적용 범위
4.5.1 농업 잔류물
4.5.2 동물 분뇨
4.5.3 도시 고형 폐기물(MSW) 및 기타 유기 폐기물
4.5.4 기타 신흥 원료
4.5.5 결론
4.6 공급망 분석
4.6.1 개요
4.6.2 물류 비용 시나리오
4.6.3 물류 서비스 제공자의 중요성
4.7 제조업체의 기술적 발전
4.7.1 개선된 열분해 기술
4.7.2 원료 최적화
4.7.3 고품질 바이오차 개발
4.7.4 농업에서의 향상된 응용
4.7.5 탄소 포집 및 환경 정화
4.7.6 결론
4.8 공급업체 선택 기준
4.8.1 제품 품질 및 일관성
4.8.2 생산 기술 및 혁신
4.8.3 지속 가능성 및 환경 영향
4.8.4 비용 효율성 및 가격 구조
4.8.5 평판 및 신뢰성
4.8.6 준수 및 규제 표준
4.8.7 결론
5 규정 적용 범위
5.1 탄소 격리 및 환경 규정
5.2 농업 규정
5.3 폐기물 관리 규정
6 시장 개요
6.1 드라이버
6.1.1 지속 가능한 농업 관행에 대한 수요 증가
6.1.2 탄소 격리 및 기후 완화를 촉진하는 정부 정책
6.1.3 바이오차의 환경적, 경제적 이점에 대한 인식 증가
6.1.4 바이오차 생산 기술 및 공정의 발전
6.2 제약
6.2.1 높은 생산 비용으로 인한 바이오차의 광범위한 채택 제한
6.2.2 바이오차의 이점에 대한 인식 및 교육 부족
6.3 기회
6.3.1 토양 비옥도 및 생산성 향상을 위한 농업 응용 분야 확대
6.3.2 바이오차 응용 분야의 혁신
6.3.3 지속 가능한 폐기물 관리 솔루션으로의 초점 전환 중동 및 아프리카 LY
6.4 과제
6.4.1 바이오차 생산 공정의 표준화 및 품질 관리 부족
6.4.2 대규모 바이오차 생산 및 유통을 위한 제한된 인프라
7 중동 및 아프리카 바이오차 시장, 기술별
7.1 개요
7.2 열분해
7.2.1 제품 유형별 열분해
7.3 가스화
7.4 수열탄화
8 중동 및 아프리카 바이오차 시장, 원료별
8.1 개요
8.2 농업 잔류물
8.3 임업 및 목재 폐기물
8.4 동물 분뇨
8.5 바이오매스 재배
8.6 기타
9 중동 및 아프리카 바이오차 시장, 최종 용도별
9.1 개요
9.2 토양 개량제
9.2.1 토양 개량제, 적용별
9.2.2 기술에 따른 토양 개량제
9.3 축산업
9.4 응용 분야별 동물 사육
9.4.1 기술에 따른 축산
9.5 전기 생산
9.5.1 기술에 따른 전기 생산
9.6 열 생성
9.6.1 기술에 따른 열 생성
9.7 물 처리
9.7.1 기술을 이용한 물 처리
9.8 건물
9.8.1 응용 프로그램별 빌딩
9.8.2 기술에 따른 건물
9.9 가구
9.9.1 기술별 가구
9.1 직물
9.10.1 기술에 따른 섬유
9.11 기타
9.12 기타, 기술별
10 중동 및 아프리카 바이오차 시장, 지역별
10.1 중동 및 아프리카
10.1.1 남아프리카 공화국
10.1.2 사우디 아라비아
10.1.3 아랍에미리트
10.1.4 이집트
10.1.5 이스라엘
10.1.6 중동 및 아프리카의 나머지 지역
11 바이오차 시장: 회사 환경
11.1 회사 점유율 분석: 중동 및 아프리카
12 SWOT 분석
13 회사 프로필
13.1 바이오차나우
13.1.1 회사 스냅샷
13.1.2 회사 점유율 분석
13.1.3 제품 포트폴리오
13.1.4 최근 개발
13.2 오레곤 바이오차 솔루션
13.2.1 회사 스냅샷
13.2.2 회사 점유율 분석
13.2.3 제품 포트폴리오
13.2.4 최근 개발
13.3 퍼시픽 바이오차 베네핏 코퍼레이션
13.3.1 회사 스냅샷
13.3.2 회사 점유율 분석
13.3.3 제품 포트폴리오
13.3.4 최근 개발
13.4 카본 골드 유한회사
13.4.1 회사 스냅샷
13.4.2 회사 점유율 분석
13.4.3 제품 포트폴리오
13.4.4 최근 개발
13.5 스위스 바이오차
13.5.1 회사 스냅샷
13.5.2 회사 점유율 분석
13.5.3 제품 포트폴리오
13.5.4 최근 개발
13.6 아메리칸 바이오차 컴퍼니
13.6.1 회사 스냅샷
13.6.2 제품 포트폴리오
13.6.3 최근 개발
13.7 아르스테코.
13.7.1 회사 스냅샷
13.7.2 제품 포트폴리오
13.7.3 최근 개발
13.8 예술
13.8.1 회사 스냅샷
13.8.2 제품 포트폴리오
13.8.3 최근 개발
13.9 바이오포스텍 주식회사
13.9.1 회사 스냅샷
13.9.2 제품 포트폴리오
13.9.3 최근 개발
13.1 블랙올 바이오차.
13.10.1 회사 스냅샷
13.10.2 제품 포트폴리오
13.10.3 최근 개발
13.11 카르보니스
13.11.1 회사 스냅샷
13.11.2 제품 포트폴리오
13.11.3 최근 개발
13.12 제네시스 엔터프라이즈 주식회사
13.12.1 회사 스냅샷
13.12.2 제품 포트폴리오
13.12.3 최근 개발
13.13 그린맨 CHAR
13.13.1 회사 스냅샷
13.13.2 제품 포트폴리오
13.13.3 최근 개발
13.14 매시 메이크.
13.14.1 회사 스냅샷
13.14.2 제품 포트폴리오
13.14.3 최근 개발
13.15 태평양 연안 탄소 유한회사
13.15.1 회사 스냅샷
13.15.2 제품 포트폴리오
13.15.3 최근 개발
13.16 화력
13.16.1 회사 스냅샷
13.16.2 제품 포트폴리오
13.16.3 최근 개발
13.17 스탠다드 바이오카본 코퍼레이션
13.17.1 회사 스냅샷
13.17.2 제품 포트폴리오
13.17.3 최근 개발
13.18 테라 샤르
13.18.1 회사 스냅샷
13.18.2 제품 포트폴리오
13.18.3 최근 개발
13.19 웨이크필드 바이오차
13.19.1 회사 스냅샷
13.19.2 제품 포트폴리오
13.19.3 최근 개발
13.2 정저우 케린 정수재료유한공사
13.20.1 회사 스냅샷
13.20.2 제품 포트폴리오
13.20.3 최근 개발
14 설문지
15 관련 보고서
표 목록
표 1 다양한 지역 및 국가의 규정
표 2 중동 및 아프리카 바이오차 시장, 기술별, 2018-2032 (USD 천)
표 3 중동 및 아프리카 바이오차 시장, 기술별, 2018-2032(톤)
표 4 중동 및 아프리카 바이오차 시장, 기술별, 2018-2032 (가격(USD/KG)
표 5 중동 및 아프리카 바이오차 시장의 열분해, 지역별, 2018-2032 (USD 천)
표 6 중동 및 아프리카 바이오차 시장의 열분해, 유형별, 2018-2032 (USD 천)
표 7 중동 및 아프리카 바이오차 시장의 가스화, 지역별, 2018-2032 (USD 천)
표 8 중동 및 아프리카 바이오차 시장의 수열탄화, 지역별, 2018-2032 (USD 천)
표 9 중동 및 아프리카 바이오차 시장, 원료별, 2018-2032 (USD 천)
표 10 중동 및 아프리카 지역별 바이오차 시장의 농업 잔류물, 2018-2032년 (USD 천 달러)
표 11 중동 및 아프리카 임업 및 목재 폐기물 바이오차 시장, 지역별, 2018-2032 (USD 천)
표 12 중동 및 아프리카 지역별 바이오차 시장의 동물성 분뇨, 2018-2032년 (USD 천 달러)
표 13 중동 및 아프리카 바이오매스 재배지, 바이오차 시장, 지역별, 2018-2032 (USD 천)
표 14 중동 및 아프리카 기타 지역별 바이오차 시장, 2018-2032 (USD 천)
표 15 중동 및 아프리카 바이오차 시장, 최종 용도별, 2018-2032 (USD 천)
표 16 중동 및 아프리카 바이오차 시장의 토양 개량제, 지역별, 2018-2032 (USD 천)
표 17 중동 및 아프리카 바이오차 시장의 토양 개량제, 적용 분야별, 2018-2032 (USD 천)
표 18 중동 및 아프리카 바이오차 시장의 토양 개량제, 기술별, 2018-2032 (USD 천)
표 19 중동 및 아프리카 지역별 바이오차 시장의 축산 시장, 2018-2032 (USD 천 달러)
표 20 중동 및 아프리카 동물 농업 바이오차 시장, 응용 분야별, 2018-2032 (USD 천)
표 21 중동 및 아프리카 바이오차 시장의 토양 개량제, 기술별, 2018-2032 (USD 천)
표 22 중동 및 아프리카 바이오차 시장의 전기 생산, 지역별, 2018-2032 (USD 천)
표 23 중동 및 아프리카 바이오차 시장의 전기 생산, 기술별, 2018-2032 (USD 천)
표 24 중동 및 아프리카 바이오차 시장의 열 생산, 지역별, 2018-2032 (USD 천)
표 25 중동 및 아프리카 바이오차 시장의 열 생산, 기술별, 2018-2032 (USD 천)
표 26 중동 및 아프리카 바이오차 시장의 수처리, 지역별, 2018-2032 (USD 천)
표 27 중동 및 아프리카 바이오차 시장의 물 처리, 기술별, 2018-2032 (USD 천)
표 28 중동 및 아프리카 바이오차 시장 규모, 지역별, 2018-2032 (USD 천 달러)
표 29 중동 및 아프리카 바이오차 시장 규모, 응용 분야별, 2018-2032 (USD 천 달러)
표 30 중동 및 아프리카 바이오차 시장 규모, 기술별, 2018-2032 (USD 천 달러)
표 31 중동 및 아프리카 가구의 바이오차 시장, 지역별, 2018-2032 (USD 천)
표 32 중동 및 아프리카 가구 바이오차 시장, 기술별, 2018-2032 (USD 천)
표 33 지역별 바이오차 시장의 중동 및 아프리카 섬유, 2018-2032 (USD 천)
표 34 중동 및 아프리카 섬유 바이오차 시장, 기술별, 2018-2032 (USD 천)
표 35 중동 및 아프리카 기타 지역별 바이오차 시장, 2018-2032 (USD 천)
표 36 중동 및 아프리카 기타 지역 바이오차 시장, 기술별, 2018-2032 (USD 천)
표 37 중동 및 아프리카 바이오차 시장, 국가별, 2018-2032 (USD 천)
표 38 중동 및 아프리카 바이오차 시장, 국가별, 2018-2032(톤)
표 39 중동 및 아프리카 바이오차 시장, 기술별, 2018-2032 (USD 천)
표 40 중동 및 아프리카 바이오차 시장, 기술별, 2018-2032(톤)
표 41 완만한 열분해(PL)
표 42 중동 및 아프리카 바이오차 시장, 원료별, 2018-2032 (USD 천)
표 43 중동 및 아프리카 바이오차 시장, 최종 용도별, 2018-2032 (USD 천)
표 44 중동 및 아프리카 바이오차 시장의 토양 개량제, 적용 분야별, 2018-2032 (USD 천)
표 45 중동 및 아프리카 바이오차 시장의 토양 개량제, 기술별, 2018-2032 (USD 천)
표 46 중동 및 아프리카 동물 농업 바이오차 시장, 응용 분야별, 2018-2032 (USD 천)
표 47 중동 및 아프리카의 바이오차 시장에서의 축산, 기술별, 2018-2032 (USD 천)
표 48 중동 및 아프리카 바이오차 시장의 전기 생산, 기술별, 2018-2032 (USD 천)
표 49 중동 및 아프리카 바이오차 시장의 열 생산, 기술별, 2018-2032 (USD 천)
표 50 중동 및 아프리카 바이오차 시장의 물 처리, 기술별, 2018-2032 (USD 천)
표 51 중동 및 아프리카 바이오차 시장 규모, 응용 분야별, 2018-2032 (USD 천 달러)
표 52 중동 및 아프리카 바이오차 시장 규모, 기술별, 2018-2032 (USD 천 달러)
표 53 중동 및 아프리카 가구 바이오차 시장, 기술별, 2018-2032 (USD 천)
표 54 중동 및 아프리카 섬유 바이오차 시장, 기술별, 2018-2032 (USD 천)
표 55 중동 및 아프리카 기타 지역 바이오차 시장, 기술별, 2018-2032 (USD 천)
표 56 기술별 남아프리카 바이오차 시장, 2018-2032 (USD 천)
표 57 기술별 남아프리카 바이오차 시장, 2018-2032(톤)
표 58 남아프리카 바이오차 시장의 열분해, 제품 유형별, 2018-2032 (USD 천)
표 59 남아프리카 바이오차 시장, 원료별, 2018-2032 (USD 천)
표 60 남아프리카 바이오차 시장, 최종 용도별, 2018-2032 (USD 천)
표 61 2018-2032년 바이오차 시장에서의 남아프리카 토양 개량제 용도별 (USD 천 달러)
표 62 남아프리카 공화국 바이오차 시장의 토양 개량제, 기술별, 2018-2032 (USD 천)
표 63 2018-2032년 바이오차 시장의 남아프리카 축산 농장, 용도별 (USD 천)
표 64 기술별 바이오차 시장의 남아프리카 축산 농장, 2018-2032 (USD 천)
표 65 기술별 바이오차 시장에서의 남아프리카 전기 생산, 2018-2032 (USD 천)
표 66 기술별 바이오차 시장에서의 남아프리카 열 생산, 2018-2032 (USD 천)
표 67 기술별 바이오차 시장의 남아프리카 물 처리, 2018-2032 (USD 천)
표 68 남아프리카 공화국 바이오차 시장 규모, 응용 분야별, 2018-2032 (USD 천 달러)
표 69 기술별 바이오차 시장에서의 남아프리카 건물, 2018-2032 (USD 천)
표 70 기술별 바이오차 시장에서 남아프리카 가구, 2018-2032 (USD 천)
표 71 기술별 바이오차 시장의 남아프리카 섬유, 2018-2032 (USD 천)
표 72 기술별 바이오차 시장의 남아프리카 기타 국가, 2018-2032 (USD 천)
표 73 사우디 아라비아 바이오차 시장, 기술별, 2018-2032 (USD 천)
표 74 사우디 아라비아 바이오차 시장, 기술별, 2018-2032(톤)
표 75 사우디 아라비아 바이오차 시장의 열분해, 제품 유형별, 2018-2032 (USD 천)
표 76 사우디 아라비아 바이오차 시장, 원료별, 2018-2032 (USD 천)
표 77 사우디 아라비아 바이오차 시장, 최종 용도별, 2018-2032 (USD 천)
표 78 사우디 아라비아 바이오차 시장에서의 토양 개량제, 적용 분야별, 2018-2032 (USD 천)
표 79 사우디 아라비아 바이오차 시장의 토양 개량제, 기술별, 2018-2032 (USD 천)
표 80 사우디 아라비아의 바이오차 시장에서의 축산, 응용 분야별, 2018-2032 (USD 천)
표 81 사우디 아라비아 바이오차 시장의 축산, 기술별, 2018-2032 (USD 천)
표 82 사우디 아라비아 바이오차 시장에서의 발전량, 기술별, 2018-2032 (USD 천)
표 83 사우디 아라비아 바이오차 시장에서의 열 생산, 기술별, 2018-2032 (USD 천)
표 84 사우디 아라비아 바이오차 시장의 물 처리, 기술별, 2018-2032 (USD 천)
표 85 사우디 아라비아 바이오차 시장 건물, 응용 분야별, 2018-2032 (USD 천)
표 86 사우디 아라비아 바이오차 시장 규모, 기술별, 2018-2032 (USD 천 달러)
표 87 기술별 바이오차 시장에서 사우디 아라비아 가구, 2018-2032 (USD 천)
표 88 기술별 바이오차 시장의 사우디 아라비아 섬유, 2018-2032 (USD 천)
표 89 사우디 아라비아 기타 바이오차 시장, 기술별, 2018-2032 (USD 천)
표 90 기술별 UAE 바이오차 시장, 2018-2032 (USD 천)
표 91 기술별 UAE 바이오차 시장, 2018-2032(톤)
표 92 바이오차 시장의 UAE 열분해, 제품 유형별, 2018-2032 (USD 천)
표 93 UAE 바이오차 시장, 원료별, 2018-2032 (USD 천)
표 94 최종 용도별 UAE 바이오차 시장, 2018-2032 (USD 천)
표 95 바이오차 시장에서의 UAE 토양 개량제, 적용 분야별, 2018-2032 (USD 천)
표 96 바이오차 시장의 UAE 토양 개량제, 기술별, 2018-2032 (USD 천)
표 97 바이오차 시장의 UAE 동물 농업, 응용 분야별, 2018-2032 (USD 천)
표 98 기술별 바이오차 시장의 UAE 동물 농업, 2018-2032 (USD 천)
표 99 바이오차 시장에서의 UAE 전기 생산, 기술별, 2018-2032 (USD 천)
표 100 바이오차 시장에서의 UAE 열 생산, 기술별, 2018-2032 (USD 천)
표 101 기술별 바이오차 시장의 UAE 수처리, 2018-2032 (USD 천)
표 102 2018-2032년 바이오차 시장에서의 UAE 건물(USD 천)
표 103 기술별 바이오차 시장에서의 UAE 건물, 2018-2032 (USD 천)
표 104 기술별 바이오차 시장의 UAE 가구, 2018-2032 (USD 천)
표 105 바이오차 시장의 UAE 섬유, 기술별, 2018-2032 (USD 천)
표 106 바이오차 시장의 UAE 기타 국가, 기술별, 2018-2032 (USD 천)
표 107 이집트 바이오차 시장, 기술별, 2018-2032 (USD 천)
표 108 이집트 바이오차 시장, 기술별, 2018-2032(톤)
표 109 바이오차 시장에서의 이집트 열분해, 제품 유형별, 2018-2032 (USD 천)
표 110 이집트 바이오차 시장, 원료별, 2018-2032 (USD 천)
표 111 이집트 바이오차 시장, 최종 용도별, 2018-2032 (USD 천)
표 112 바이오차 시장에서의 이집트 토양 개량제, 적용 분야별, 2018-2032 (USD 천)
표 113 바이오차 시장의 이집트 토양 개량제, 기술별, 2018-2032 (USD 천)
표 114 바이오차 시장에서의 이집트 가축 사육, 응용 분야별, 2018-2032 (USD 천)
표 115 바이오차 시장에서의 이집트 가축 사육, 기술별, 2018-2032 (USD 천)
표 116 이집트 바이오차 시장에서의 전기 생산, 기술별, 2018-2032 (USD 천)
표 117 이집트 바이오차 시장에서의 열 생산, 기술별, 2018-2032 (USD 천)
표 118 이집트 바이오차 시장의 물 처리, 기술별, 2018-2032 (USD 천)
표 119 바이오차 시장에서의 이집트 건물, 응용 분야별, 2018-2032 (USD 천)
표 120 바이오차 시장에서 이집트의 건설, 기술별, 2018-2032 (USD 천)
표 121 바이오차 시장에서 이집트 가구, 기술별, 2018-2032 (USD 천)
표 122 바이오차 시장에서의 이집트 섬유, 기술별, 2018-2032 (USD 천)
표 123 바이오차 시장의 이집트 기타 국가, 기술별, 2018-2032 (USD 천)
표 124 이스라엘 바이오차 시장, 기술별, 2018-2032 (USD 천)
표 125 이스라엘 바이오차 시장, 기술별, 2018-2032(톤)
표 126 이스라엘 바이오차 시장의 열분해, 제품 유형별, 2018-2032 (USD 천)
표 127 이스라엘 바이오차 시장, 원료별, 2018-2032 (USD 천)
표 128 이스라엘 바이오차 시장, 최종 용도별, 2018-2032 (USD 천)
표 129 이스라엘 바이오차 시장의 토양 개량제, 적용 분야별, 2018-2032 (USD 천)
표 130 이스라엘 바이오차 시장의 토양 개량제, 기술별, 2018-2032 (USD 천)
표 131 이스라엘의 바이오차 시장에서의 축산, 응용 분야별, 2018-2032 (USD 천)
표 132 이스라엘의 바이오차 시장에서의 축산, 기술별, 2018-2032 (USD 천)
표 133 이스라엘 바이오차 시장의 발전량, 기술별, 2018-2032 (USD 천)
표 134 이스라엘 바이오차 시장의 열 생산, 기술별, 2018-2032 (USD 천)
표 135 이스라엘 바이오차 시장의 물 처리, 기술별, 2018-2032 (USD 천)
표 136 이스라엘의 바이오차 시장 규모, 응용 분야별, 2018-2032 (USD 천 달러)
표 137 이스라엘의 바이오차 시장 규모, 기술별, 2018-2032 (USD 천 달러)
표 138 이스라엘 가구의 바이오차 시장, 기술별, 2018-2032 (USD 천)
표 139 이스라엘 섬유 바이오차 시장, 기술별, 2018-2032 (USD 천)
표 140 이스라엘 기타 바이오차 시장, 기술별, 2018-2032 (USD 천)
표 141 중동 및 아프리카 바이오차 시장 나머지 지역, 기술별, 2018-2032 (USD 천)
표 142 중동 및 아프리카 바이오차 시장 나머지 지역, 기술별, 2018-2032(톤)
그림 목록
그림 1 중동 및 아프리카 바이오차 시장
그림 2 중동 및 아프리카 바이오차 시장: 데이터 삼각 측량
그림 3 중동 및 아프리카 바이오차 시장: DROC 분석
그림 4 중동 및 아프리카 바이오차 시장: 중동 및 아프리카 대 지역 시장 분석
그림 5 중동 및 아프리카 바이오차 시장: 회사 연구 분석
그림 6 중동 및 아프리카 바이오차 시장: 다변량 모델링
그림 7 중동 및 아프리카 바이오차 시장: 인터뷰 인구 통계
그림 8 중동 및 아프리카 바이오차 시장: DBMR 시장 위치 그리드
그림 9 중동 및 아프리카 바이오차 시장: 시장 적용 범위 그리드
그림 10 중동 및 아프리카 바이오차 시장: 공급업체 점유율 분석
그림 11 중동 및 아프리카 바이오차 시장: 세분화
그림 12 아시아 태평양 지역은 중동 및 아프리카 바이오차 시장을 주도할 것으로 예상되며 예측 기간 동안 가장 높은 CAGR로 성장할 것으로 예상됩니다.
그림 13 중동 및 아프리카 바이오차 시장은 기술별로 3개 세그먼트로 구성됩니다.
그림 14 전략적 결정
그림 15 요약:- 중동 및 아프리카 바이오차 시장
그림 16 지속 가능한 농업 관행에 대한 수요 증가가 예측 기간 동안 중동 및 아프리카 바이오차 시장을 주도할 것으로 예상됨
그림 17 열분해 부문은 2025년과 2032년에 중동 및 아프리카 바이오차 시장에서 가장 큰 점유율을 차지할 것으로 예상됩니다.
그림 18 아시아 태평양 지역은 예측 기간 동안 바이오차 시장에서 가장 빠르게 성장하는 시장입니다.
그림 19 PESTEL 분석
그림 20 포터의 5가지 힘 분석
그림 21 중동 및 아프리카 바이오차 시장의 동인, 제약, 기회 및 과제
그림 22 중동 및 아프리카 바이오차 시장: 기술별, 2024년
그림 23 중동 및 아프리카 바이오차 시장: 원료별, 2023년
그림 24 중동 및 아프리카 바이오차 시장: 최종 사용 기준, 2023년
그림 25 중동 및 아프리카 바이오차 시장: 스냅샷
그림 26 중동 및 아프리카 바이오차 시장: 회사 점유율 2024(%)
연구 방법론
데이터 수집 및 기준 연도 분석은 대규모 샘플 크기의 데이터 수집 모듈을 사용하여 수행됩니다. 이 단계에는 다양한 소스와 전략을 통해 시장 정보 또는 관련 데이터를 얻는 것이 포함됩니다. 여기에는 과거에 수집한 모든 데이터를 미리 검토하고 계획하는 것이 포함됩니다. 또한 다양한 정보 소스에서 발견되는 정보 불일치를 검토하는 것도 포함됩니다. 시장 데이터는 시장 통계 및 일관된 모델을 사용하여 분석하고 추정합니다. 또한 시장 점유율 분석 및 주요 추세 분석은 시장 보고서의 주요 성공 요인입니다. 자세한 내용은 분석가에게 전화를 요청하거나 문의 사항을 드롭하세요.
DBMR 연구팀에서 사용하는 주요 연구 방법론은 데이터 마이닝, 시장에 대한 데이터 변수의 영향 분석 및 주요(산업 전문가) 검증을 포함하는 데이터 삼각 측량입니다. 데이터 모델에는 공급업체 포지셔닝 그리드, 시장 타임라인 분석, 시장 개요 및 가이드, 회사 포지셔닝 그리드, 특허 분석, 가격 분석, 회사 시장 점유율 분석, 측정 기준, 글로벌 대 지역 및 공급업체 점유율 분석이 포함됩니다. 연구 방법론에 대해 자세히 알아보려면 문의를 통해 업계 전문가에게 문의하세요.
사용자 정의 가능
Data Bridge Market Research는 고급 형성 연구 분야의 선두 주자입니다. 저희는 기존 및 신규 고객에게 목표에 맞는 데이터와 분석을 제공하는 데 자부심을 느낍니다. 보고서는 추가 국가에 대한 시장 이해(국가 목록 요청), 임상 시험 결과 데이터, 문헌 검토, 재생 시장 및 제품 기반 분석을 포함하도록 사용자 정의할 수 있습니다. 기술 기반 분석에서 시장 포트폴리오 전략에 이르기까지 타겟 경쟁업체의 시장 분석을 분석할 수 있습니다. 귀하가 원하는 형식과 데이터 스타일로 필요한 만큼 많은 경쟁자를 추가할 수 있습니다. 저희 분석가 팀은 또한 원시 엑셀 파일 피벗 테이블(팩트북)로 데이터를 제공하거나 보고서에서 사용 가능한 데이터 세트에서 프레젠테이션을 만드는 데 도움을 줄 수 있습니다.

