South Africa Safety Shoes Market
시장 규모 (USD 10억)
연평균 성장률 :
% 
 USD
131.13 Million
USD
227.37 Million
2024
2032
USD
131.13 Million
USD
227.37 Million
2024
2032
| 2025 –2032 | |
| USD 131.13 Million | |
| USD 227.37 Million | |
| % | |
South Africa Safety Shoes Market Segmentation, By Product (Steel-Toe Safety Shoes, Composite Toe Footwear, Metatarsal Guards, Slip-Resistant Footwear, Industrial Safety Shoes, Chemical-Resistant Shoes, Electrical Hazard (EH) Rated Shoes, Heat Resistant Safety Boots, Lightweight Work Boots, Wellingtons/PVC Boots/Gumboots, Fiber Toe Safety Shoes, and Sport Safety Shoes), Shoe Material (Leather, Rubber, Plastic, and Others), Sole Material (Rubber and Plastic), Distribution Channel (B2B and B2C), Gender (Men and Women), Industry (Mining, Oil and Gas, Construction/Civil, Agriculture, Transportation, Chemical, Metal, Pharmaceutical, Food & Beverages, Electronic, Retail DIY, and Security/Utility) – Industry Trends and Forecast to 2032
Safety Shoes Market Analysis
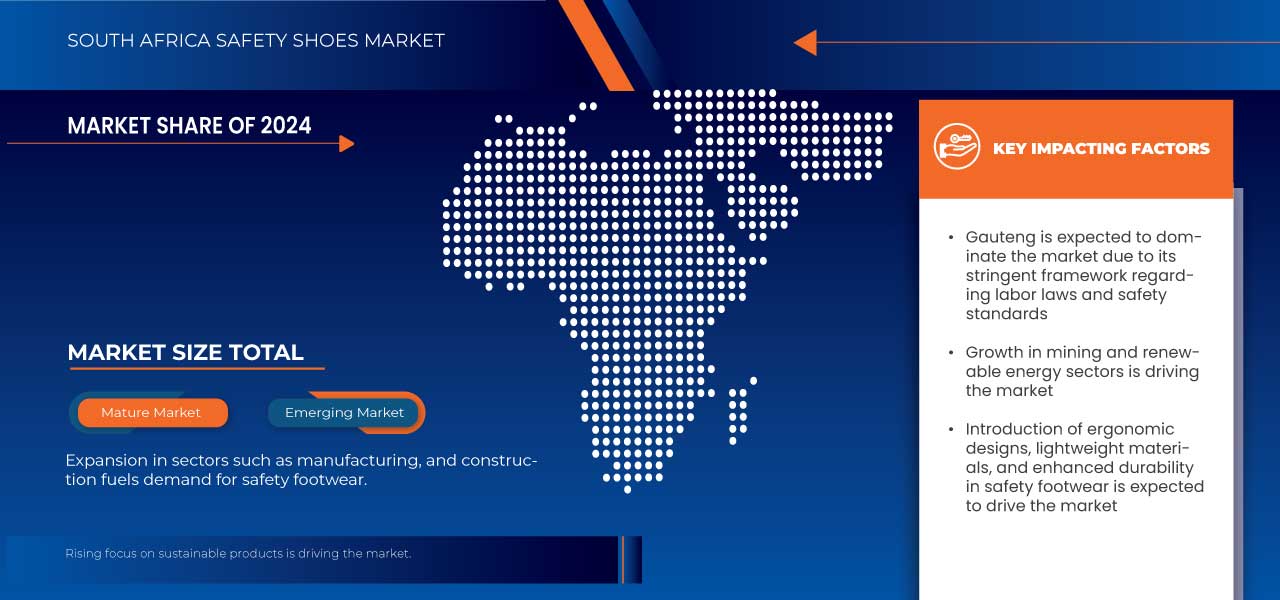
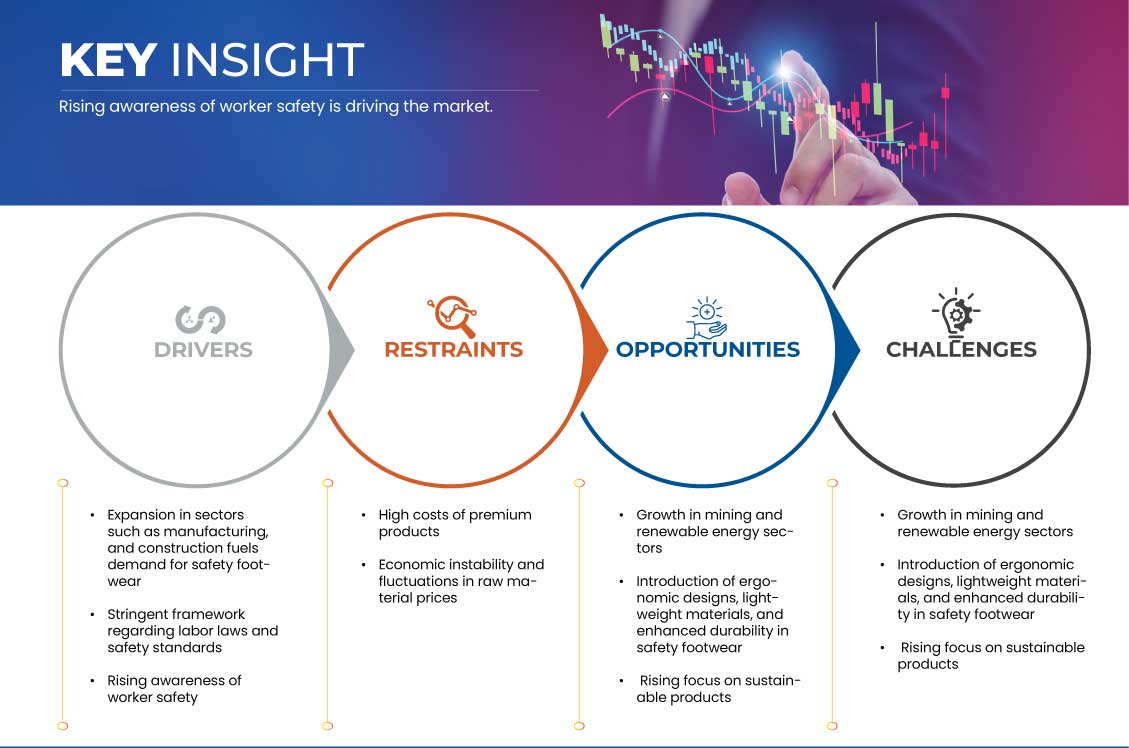
Expansion in sectors such as manufacturing, and construction fuels demand for safety footwear and stringent framework regarding labor laws and safety standards and rising awareness of worker safety. Some of the major restraints that may negatively impact the market growth are high costs of premium products and economic instability and fluctuations in raw material prices. Growth in mining and renewable energy sectors and introduction of ergonomic designs, lightweight materials, and enhanced durability in safety footwear and rising focus on sustainable products. Limited local manufacturing capabilities and availability of low-cost counterfeit products, thereby driving market growth in South Africa.
Safety Shoes Market Size
South Africa safety shoes market is expected to reach USD 227.37 million by 2032 from USD 131.13 million in 2024, growing with a substantial CAGR of 7.26% in the forecast period of 2025 to 2032.
Safety Shoes Market Trends
“Expansion in Sectors Such As Manufacturing and Construction Fuels Demand for Safety Footwear”
The expansion of sectors such as manufacturing and construction in South Africa significantly fuels the demand for safety footwear. Both industries are inherently high-risk, with workers exposed to potential hazards such as falling objects, sharp product, heavy machinery, and slippery surfaces. As a result, safety footwear has become essential in ensuring worker protection and compliance with stringent occupational health and safety regulations.
In the manufacturing sector, rapid growth and technological advancements have led to an increase in the workforce and a higher demand for Personal Protective Equipment (PPE), including safety shoes. Workers in manufacturing plants, especially those involved in heavy machinery operations or handling raw product, are highly vulnerable to foot injuries. Consequently, there is a rising trend for shoes that offer features like steel-toe caps, puncture-resistant soles, and slip-resistance to reduce injuries and accidents. With a growing number of factories and production units in South Africa, the demand for safety footwear continues to expand.
Report Scope and Market Segmentation
|
Attributes |
Safety Shoes Market Key Market Insights |
|
Segments Covered |
By Product: Steel-Toe Safety Shoes, Composite Toe Footwear, Metatarsal Guards, Slip-Resistant Footwear, Industrial Safety Shoes, Chemical-Resistant Shoes, Electrical Hazard (EH) Rated Shoes, Heat Resistant Safety Boots, Lightweight Work Boots, Wellingtons/PVC Boots/Gumboots, Fiber Toe Safety Shoes, and Sport Safety Shoes By Shoe Material: Leather, Rubber, Plastic, and Others By Sole Material: Rubber and Plastic By Distribution Channel : B2B and B2C By Gender: Men and Women By Industry: Mining, Oil and Gas, Construction/Civil, Agriculture, Transportation, Chemical, Metal, Pharmaceutical, Food & Beverages, Electronic, Retail DIY, and Security/Utility |
|
Provinces Covered |
Gauteng, Kwazulu-Natal, Western Cape, Eastern Cape, Limpopo, Mpumalanga, North West, Free State, and Northern Cape |
|
Key Market Players |
Kaliber Footwear (South Africa), Honeywell International Inc (U.S.), BBF Safety Group (South Africa), SHEQ SAFETY (South Africa), Neptun Boot (South Africa), Bata Industrials (South Africa), Claw Boots International (South Africa), uvex group (Germany), and JCB Workwear (U.K.) among others |
|
Market Opportunities |
|
|
Value Added Data Infosets |
In addition to the insights on market scenarios such as market value, growth rate, segmentation, geographical coverage, and major players, the market reports curated by the Data Bridge Market Research also include in-depth expert analysis, pricing analysis, brand share analysis, consumer survey, demography analysis, supply chain analysis, value chain analysis, raw material/consumables overview, vendor selection criteria, PESTLE Analysis, Porter Analysis, and regulatory framework. |
Safety Shoes Market Definition
Safety shoes are specialized footwear designed to protect the feet from various workplace hazards, such as falling objects, sharp product, slippery surfaces, electrical risks, and heavy machinery. They typically feature reinforced toes, often with steel or composite material, to prevent injury from impacts. Additionally, safety shoes may include slip-resistant soles, cushioning, arch support, and anti-static properties to enhance comfort and reduce fatigue.
Safety Shoes Market Dynamics
Drivers
- Stringent Framework Regarding Labor Laws and Safety Standards
South Africa has implemented a stringent framework regarding labor laws and safety standards, which plays a pivotal role in driving the demand for safety footwear across industries like manufacturing, construction, and mining. The country’s regulatory environment emphasizes worker protection and sets high standards for workplace safety, ensuring that businesses comply with regulations designed to minimize workplace injuries and fatalities.
The Occupational Health and Safety Act (OHSA) of South Africa mandates that employers must provide a safe working environment, including the provision of appropriate Personal Protective Equipment (PPE) for employees. Safety footwear is a key component of this PPE, particularly in hazardous work environments where workers face risks such as falling objects, electrical hazards, and exposure to sharp or heavy product. The law requires that employers ensure workers wear suitable safety footwear to prevent injuries, such as fractures or punctures, which could result from accidents in industries like construction and manufacturing.
South Africa's stringent labor laws and safety standards, including the Occupational Health and Safety Act, require employers to provide protective footwear in high-risk industries like construction and manufacturing. Compliance with these regulations, along with growing awareness of workplace safety, drives the demand for high-quality, protective safety footwear.
- Rising Awareness of Worker Safety
Rising awareness of worker safety in South Africa has become a significant driver for the increased demand for safety footwear across various industries. Over the years, there has been a notable shift in attitudes toward workplace safety, with both employers and employees recognizing the critical importance of protecting workers from potential injuries. This shift is influenced by a combination of stricter regulations, improved safety training programs, and a greater societal focus on occupational health.
As industries like manufacturing, construction, and mining continue to grow, the awareness surrounding the risks faced by workers in these environments has also heightened. Workers are more informed about the hazards they face daily, such as heavy machinery, electrical risks, sharp objects, and falling debris. This heightened awareness has led to increased demand for Personal Protective Equipment (PPE), including safety shoes, as workers understand their role in preventing injuries and accidents.
- In September 2023, according to an article published by WorkFoxx, rising awareness of worker safety is crucial in preventing injuries. Employers should educate employees on the importance of wearing proper safety footwear, ensuring comfort, and complying with industry regulations. By fostering a culture of safety, companies can reduce risks, enhance productivity, and demonstrate their commitment to employee well-being
Rising awareness of worker safety in South Africa has significantly increased the demand for safety footwear across industries. Both employers and employees recognize the importance of protective gear to prevent injuries. Stricter regulations, improved safety training, and employee advocacy contribute to a greater focus on safety, driving demand for high-quality footwear.
Opportunities
- Growth in Mining and Renewable Energy Sectors
The growth in South Africa’s mining and renewable energy sectors has significantly contributed to the increasing demand for safety footwear. Both industries involve high-risk environments where worker safety is a priority, driving the need for protective equipment, including specialized safety shoes. As these sectors continue to expand, the demand for quality safety footwear is expected to rise, ensuring that workers are protected from potential hazards.
The mining sector, a cornerstone of South Africa's economy, is known for its challenging and dangerous working conditions. Workers in mines are exposed to risks such as falling rocks, heavy machinery, electrical hazards, and extreme environmental conditions. This has led to a heightened focus on safety, with mining companies investing heavily in Personal Protective Equipment (PPE), including high-quality safety footwear. Footwear with features such as steel-toe protection, slip resistance, and puncture-resistant soles is essential in mitigating injuries in these high-risk environments. As mining operations increase and new projects are developed, the demand for such safety footwear will continue to grow.
For instance,
- In September 2023, according to a study published by Acme Safety Shoes, the growth in the mining and renewable energy sectors is driving increased demand for sustainable safety footwear. Eco-friendly safety shoes, made from recycled material, bioplastics, and innovative composites, are gaining popularity. Advanced manufacturing processes, energy efficiency, and waste reduction further enhance sustainability, benefiting both workers and the environment
Introduction of Ergonomic Designs, Lightweight Material, and Enhanced Durability in Safety Footwear
- The introduction of ergonomic designs, lightweight material, and enhanced durability in safety footwear has revolutionized the South African safety footwear market, making protective shoes more comfortable and functional for workers in high-risk industries. As industries like manufacturing, construction, and mining continue to grow, there is a rising demand for safety footwear that not only provides protection but also enhances comfort and performance throughout long work hours throughout long work hours. The integration of innovative material and designs addresses the evolving needs of workers who require reliable footwear without compromising on comfort
Ergonomic designs have become a key feature in modern safety footwear, as they are specifically tailored to reduce foot fatigue and improve overall comfort. These shoes are designed to fit the natural contours of the foot, providing better support and cushioning, which is crucial for workers who stand or walk for long periods. The ergonomic designs also help distribute pressure evenly, reducing the risk of foot pain, blisters, and long-term musculoskeletal issues. This improvement in comfort encourages workers to wear their safety shoes consistently, ensuring better protection and reducing the likelihood of foot-related injuries.
- Restrains/Challenges
Limited Local Manufacturing Capabilities
- Limited local manufacturing capabilities present a significant challenge to the growth of the South African safety footwear market. While the demand for high-quality safety footwear is increasing across industries such as construction, mining, and manufacturing, local manufacturers face constraints in meeting this demand due to limited production capacity, lack of advanced technology, and reliance on imported material.
- One of the key limitations is the relatively small scale of local manufacturers compared to global competitors. Many South African manufacturers struggle to achieve economies of scale, which results in higher production costs. As a result, they may find it difficult to compete with international brands that benefit from larger production volumes and lower costs. This creates a challenge in producing footwear that is both affordable and of high quality, a critical consideration in a market where price sensitivity is prevalent, especially among Small to Medium-Sized Businesses (SMEs).
For instance,
- In February 2024, according to a blog published by SHKL, local and international manufacturers are vying for market share, focusing on product quality, innovation, and pricing strategies. The competition is intensifying as companies strive to meet evolving consumer demands and adapt to emerging market trends in the shower enclosure industry
Availability of Low-Cost Counterfeit Products
- The availability of low-cost counterfeit products is a significant challenge for the South African safety footwear market, posing risks to both consumers and manufacturers. Counterfeit safety footwear, often produced with substandard material and lacking proper safety certifications, can undermine the growth of the industry by offering cheaper, yet less reliable, alternatives to genuine products. This issue is especially prevalent in price-sensitive markets, where companies and individuals may prioritize cost over quality and safety.
- One of the primary concerns with counterfeit safety footwear is its inability to provide adequate protection. Genuine safety shoes are designed to meet strict safety standards and regulations, with features such as steel-toe protection, puncture-resistant soles, slip resistance, and electrical hazard protection. Counterfeit products, however, often lack these essential features or use inferior materials that do not provide the same level of safety, increasing the risk of injuries in hazardous work environments. In industries like construction, mining, and manufacturing, where workers are exposed to constant dangers, this can result in serious accidents and even fatalities.
Impact and Current Market Scenario of Raw Material Shortage and Shipping Delays
Data Bridge Market Research offers a high-level analysis of the market and delivers information by keeping in account the impact and current market environment of raw material shortage and shipping delays. This translates into assessing strategic possibilities, creating effective action plans, and assisting businesses in making important decisions.
Apart from the standard report, we also offer in-depth analysis of the procurement level from forecasted shipping delays, distributor mapping by region, commodity analysis, production analysis, price mapping trends, sourcing, category performance analysis, supply chain risk management solutions, advanced benchmarking, and other services for procurement and strategic support.
Expected Impact of Economic Slowdown on the Pricing and Availability of Products
When economic activity slows, industries begin to suffer. The forecasted effects of the economic downturn on the pricing and accessibility of the products are taken into account in the market insight reports and intelligence services provided by DBMR. With this, our clients can typically keep one step ahead of their competitors, project their sales and revenue, and estimate their profit and loss expenditures.
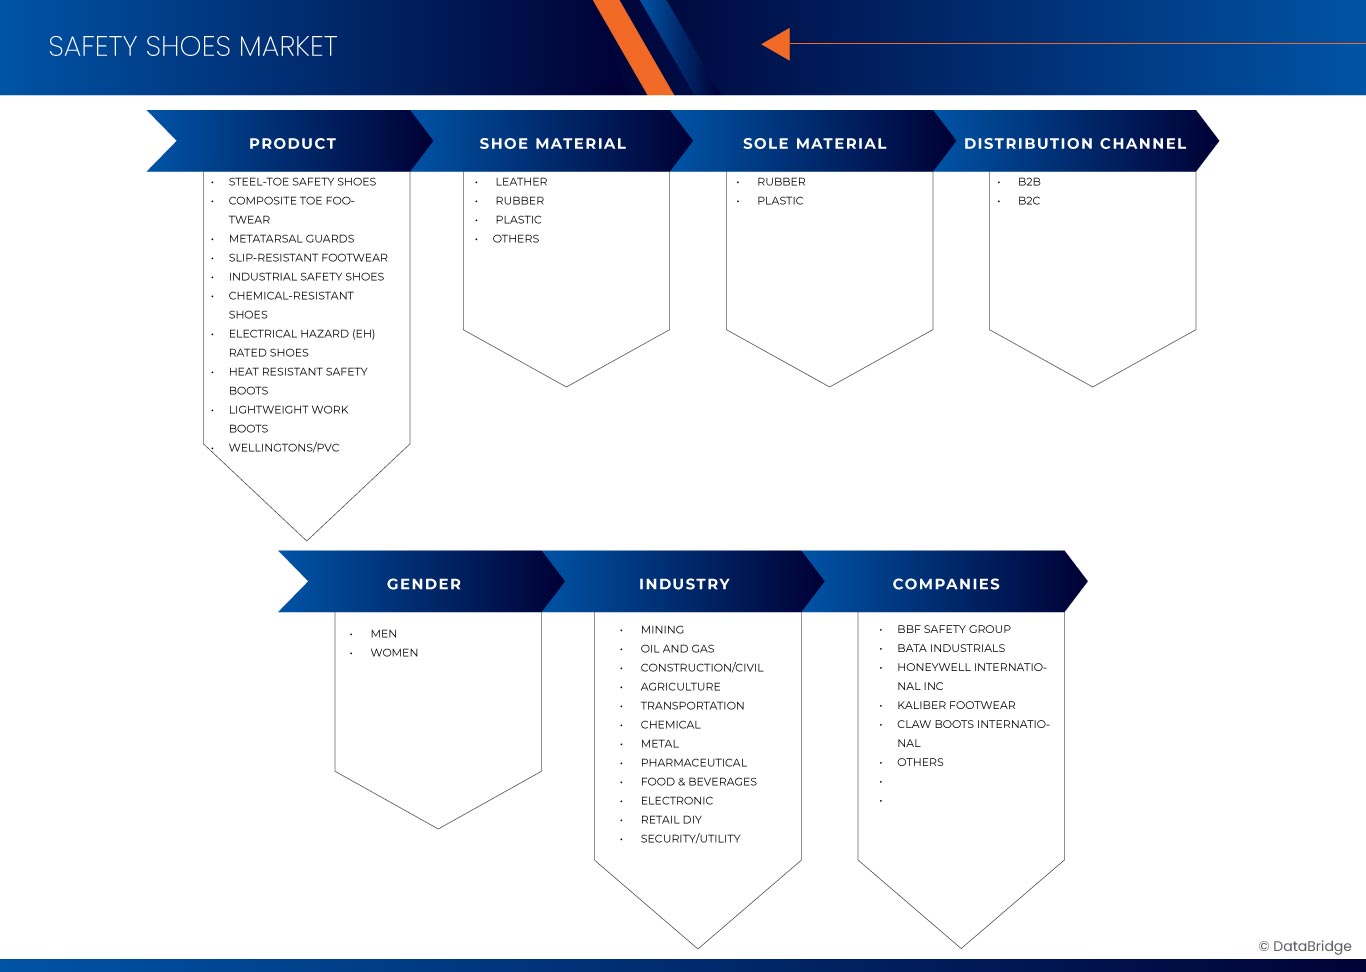
South Africa Safety Shoes Market Scope
The market is segmented on the basis of product, shoe material, sole material, distribution channel, gender, and industry. The growth amongst these segments will help you analyze meagre growth segments in the industries and provide the users with a valuable market overview and market insights to help them make strategic decisions for identifying core market applications.
Product
- Steel-Toe Safety Shoes
- Composite Toe Footwear
- Metatarsal Guards
- Slip-Resistant Footwear
- Industrial Safety Shoes
- Chemical-Resistant Shoes
- Electrical Hazard (EH) Rated Shoes
- Heat Resistant Safety Boots
- Lightweight Work Boots
- Wellingtons/PVC Boots/Gumboots
- Fiber Toe Safety Shoes
- Sport Safety Shoes
Shoe Material
- Leather
- Rubber
- Plastic
- Others
- Leather, By Type
- Suede Leather
- Genuine Leather
- Tan Genuine Leather
- Synthetic Leather
- Others
- Leather, By Leather Print
- Barton Print Leather
- CG Print Leather
- Rubber, By Type
- Synthetic Rubber
- Natural Rubber
- Plastic, By Type
- Polyurethane (PU) and Polyurethane Foam
- Ethylene-Vinyl Acetate (EVA)
- Polyester
- Polyvinyl Chloride (PVC)
- Polyurethane (PU) and Polyurethane Foam, By Process
- Direct Injection Process
- Pouring Process
- Leather, By Type
Sole Material
- Rubber
- Plastic
- Rubber, By Type
- Thermoplastic Rubber
- Vulcanized Rubber
- Crepe Rubber
- Resin Rubber
- Plastic, By Type
- Polyurethane
- Thermoplastic Polyurethane
- PVC
- EVA
- Rubber, By Type
Distribution Channel
- B2B
- B2C
- B2C, By Distribution Channel
- Offline
- Online
- Offline, By Sales Channel
- Retail Stores
- Department Stores
- Branded Stores
- Hypermarket/Supermarket
- Departmental Stores, By Type
- Retail Stores
- Department Stores
- Branded Stores
- Hypermarket/Supermarket
- Online, By Sales Channel
- Third Party Websites
- Company Own Websites
- B2C, By Distribution Channel
Gender
- Men
- Women
Industry
- Mining,
- Mining, By Product
- Heat Resistant Safety Boots
- Steel-Toe Safety Shoes
- Composite Toe Footwear
- Metatarsal Guards
- Slip-Resistant Footwear
- Industrial Safety Shoes
- Chemical-Resistant Shoes
- Electrical Hazard (EH) Rated Shoes
- Lightweight Work Boots
- Wellingtons/PVC Boots/Gumboots
- Fiber Toe Safety Shoes
- Sport Safety Shoes
- Mining, By Application
- On Shore
- Off Shore
- Mining, By Product
- Oil and Gas
- Construction/Civil
- Agriculture
- Transportation
- Chemical
- Metal
- Pharmaceutical
- Food & Beverages
- Electronic
- Retail DIY
- Security/Utility
- Oil and Gas, By Product
- Metatarsal Guards
- Slip-Resistant Footwear
- Chemical-Resistant Shoes
- Heat Resistant Safety Boots
- Steel-Toe Safety Shoes
- Composite Toe Footwear
- Industrial Safety Shoes
- Electrical Hazard (EH) Rated Shoes
- Lightweight Work Boots
- Wellingtons/PVC Boots/Gumboots
- Fiber Toe Safety Shoes
- Sport Safety Shoes
- Construction/Civil, By Application
- Engineering Construction
- Residential Construction
- Commercial Construction
- Engineering Construction, By Type
- Tunnels and Dams
- Roadways
- Pipelines
- Bridges
- Railways
- Airport Construction
- Others
- Commercial Construction, By Type
- Warehouses
- Healthcare Facilities
- Offices
- Hotels
- Research Laboratories
- Education Institutions
- Restaurants & Bars
- Others
- Construction/Civil, By Product
- Steel-Toe Safety Shoes
- Composite Toe Footwear
- Metatarsal Guards
- Slip-Resistant Footwear
- Industrial Safety Shoes
- Chemical-Resistant Shoes
- Electrical Hazard (EH) Rated Shoes
- Heat Resistant Safety Boots
- Lightweight Work Boots
- Wellingtons/PVC Boots/Gumboots
- Fiber Toe Safety Shoes
- Sport Safety Shoes
- Agriculture, By Product
- Steel-Toe Safety Shoes
- Composite Toe Footwear
- Metatarsal Guards
- Slip-Resistant Footwear
- Industrial Safety Shoes
- Chemical-Resistant Shoes
- Electrical Hazard (EH) Rated Shoes
- Heat Resistant Safety Boots
- Lightweight Work Boots
- Wellingtons/PVC Boots/Gumboots
- Fiber Toe Safety Shoes
- Sport Safety Shoes
- Transportation, By Product
- Steel-Toe Safety Shoes
- Composite Toe Footwear
- Metatarsal Guards
- Slip-Resistant Footwear
- Industrial Safety Shoes
- Chemical-Resistant Shoes
- Electrical Hazard (EH) Rated Shoes
- Heat Resistant Safety Boots
- Lightweight Work Boots
- Wellingtons/PVC Boots/Gumboots
- Fiber Toe Safety Shoes
- Sport Safety Shoes
- Chemical, By Product
- Chemical-Resistant Shoes
- Slip-Resistant Footwear
- Steel-Toe Safety Shoes
- Composite Toe Footwear
- Metatarsal Guards
- Industrial Safety Shoes
- Electrical Hazard (EH) Rated Shoes
- Heat Resistant Safety Boots
- Lightweight Work Boots
- Wellingtons/PVC Boots/Gumboots
- Fiber Toe Safety Shoes
- Sport Safety Shoes
- Metal, By Product
- Heat Resistant Safety Boots
- Steel-Toe Safety Shoes
- Composite Toe Footwear
- Metatarsal Guards
- Slip-Resistant Footwear
- Industrial Safety Shoes
- Chemical-Resistant Shoes
- Electrical Hazard (EH) Rated Shoes
- Lightweight Work Boots
- Wellingtons/PVC Boots/Gumboots
- Fiber Toe Safety Shoes
- Sport Safety Shoes
- Pharmaceutical, By Product
- Slip-Resistant Footwear
- Chemical-Resistant Shoes
- Steel-Toe Safety Shoes
- Composite Toe Footwear
- Metatarsal Guards
- Industrial Safety Shoes
- Electrical Hazard (EH) Rated Shoes
- Heat Resistant Safety Boots
- Lightweight Work Boots
- Wellingtons/PVC Boots/Gumboots
- Fiber Toe Safety Shoes
- Sport Safety Shoes
- Food & Beverages, By Category
- Food
- Beverages
- Food, By Type
- Meat and Alternatives
- Grain Products
- Milk and Milk Products
- Fruits and Vegetables
- Others
- Beverages, By Type
- Alcoholic
- Non - Alcoholic
- Alcoholic, By Type
- Beer
- Spirits
- Wines
- Champagne
- Tequila & Cocktails
- Non - Alcoholic, By Type
- Carbonated Soft Drinks (CSD)
- Bottled Water
- Functional Beverages
- Sports Drinks
- Fruit Beverages
- Others
- Food & Beverages, By Product
- Steel-Toe Safety Shoes
- Composite Toe Footwear
- Metatarsal Guards
- Slip-Resistant Footwear
- Industrial Safety Shoes
- Chemical-Resistant Shoes
- Electrical Hazard (EH) Rated Shoes
- Heat Resistant Safety Boots
- Lightweight Work Boots
- Wellingtons/PVC Boots/Gumboots
- Fiber Toe Safety Shoes
- Sport Safety Shoes
- Electronic, By Product
- Composite Toe Footwear
- Electrical Hazard (EH) Rated Shoes
- Fiber Toe Safety Shoes
- Steel-Toe Safety Shoes
- Metatarsal Guards
- Slip-Resistant Footwear
- Industrial Safety Shoes
- Chemical-Resistant Shoes
- Heat Resistant Safety Boots
- Lightweight Work Boots
- Wellingtons/PVC Boots/Gumboots
- Sport Safety Shoes
- Retail DIY, By Product
- Steel-Toe Safety Shoes
- Composite Toe Footwear
- Metatarsal Guards
- Slip-Resistant Footwear
- Industrial Safety Shoes
- Chemical-Resistant Shoes
- Electrical Hazard (EH) Rated Shoes
- Heat Resistant Safety Boots
- Lightweight Work Boots
- Wellingtons/PVC Boots/Gumboots
- Fiber Toe Safety Shoes
- Sport Safety Shoes
- Security/Utility, By Product
- Steel-Toe Safety Shoes
- Composite Toe Footwear
- Metatarsal Guards
- Slip-Resistant Footwear
- Industrial Safety Shoes
- Chemical-Resistant Shoes
- Electrical Hazard (EH) Rated Shoes
- Heat Resistant Safety Boots
- Lightweight Work Boots
- Wellingtons/PVC Boots/Gumboots
- Fiber Toe Safety Shoes
- Sport Safety Shoes
- Oil and Gas, By Product
South Africa Safety Shoes Market Regional Analysis
The market is analyzed and market size insights and trends are provided by country, product, shoe material, sole material, distribution channel, gender, industry as referenced above.
The Provinces covered in the market are Gauteng, Kwazulu-Natal, Western Cape, Eastern Cape, Limpopo, Mpumalanga, North West, Free State, and Northern Cape.
Gauteng is expected to dominate the market due to advanced mining, agricultural practices, and high demand for innovative solutions.
The country section of the report also provides individual market impacting factors and changes in regulation in the market domestically that impacts the current and future trends of the market. Data points like down-stream and upstream value chain analysis, technical trends and porter's five forces analysis, case studies are some of the pointers used to forecast the market scenario for individual Provinces. Also, the presence and availability of country brands and their challenges faced due to large or scarce competition from local and domestic brands, impact of domestic tariffs and trade routes are considered while providing forecast analysis of the country data.
South Africa Safety Shoes Market Share
The market competitive landscape provides details by competitors. Details included are company overview, company financials, revenue generated, market potential, investment in research and development, new market initiatives, country presence, production sites and facilities, production capacities, company strengths and weaknesses, product launch, product width and breadth, application dominance. The above data points provided are only related to the companies' focus related to market.
Safety Shoes Market Leaders Operating in the Market Are:
- Kaliber Footwear (South Africa)
- Honeywell International Inc (U.S.)
- BBF Safety Group (South Africa)
- SHEQ SAFETY (South Africa)
- Neptun Boot (South Africa)
- Bata Industrials (South Africa)
- Claw Boots International (South Africa)
- uvex group (Germany)
- JCB Workwear (South Africa) (U.K.)
Latest Developments in South Africa Safety Shoes Market
- In June 2024, uvex group product Uvex 1 X-Craft safety shoe won the prestigious Red Dot Award for its innovative design and superior functionality. The shoe features advanced technology, offering exceptional comfort, durability, and protection. Its modern, stylish look combined with cutting-edge features makes it a standout in personal protective footwear for professionals
- In November 2024, Honeywell International Inc announced its agreement to sell its Personal Protective Equipment (PPE) business to Protective Industrial Products (PIP) for USD 1.325 billion in cash. This move aligns with Honeywell's strategy to streamline its portfolio and focus on three megatrends: automation, aviation, and energy transition. The sale is part of Honeywell’s broader strategy to divest non-core operations while reinforcing its core business areas. The transaction, which involves 20 manufacturing sites and 17 distribution centers globally, is expected to close in the first half of 2025
- In April 2023, Bata South Africa has partnered with Lion Match to launch a school shoe drive aimed at supporting disadvantaged children. The initiative seeks to provide quality school shoes to those in need, promoting education and giving back to the community. This collaboration reflects Bata's commitment to social responsibility
- In August 2022, Bata South Africa was honored with a special award for its quick and effective response in safeguarding its factory during the KZN looting. The company's commitment to protecting its employees, products, and facilities during the crisis highlighted its resilience and dedication to the local community
SKU-
세계 최초의 시장 정보 클라우드 보고서에 온라인으로 접속하세요

- 대화형 데이터 분석 대시보드
- 높은 성장 잠재력 기회를 위한 회사 분석 대시보드
- 사용자 정의 및 질의를 위한 리서치 분석가 액세스
- 대화형 대시보드를 통한 경쟁자 분석
- 최신 뉴스, 업데이트 및 추세 분석
- 포괄적인 경쟁자 추적을 위한 벤치마크 분석의 힘 활용
목차
1 서론
1.1 연구 목적
1.2 시장 정의
1.3 개요
1.4 제한 사항
1.5 대상 시장
2 시장 세분화
2.1 대상 시장
2.2 지리적 범위
연구에 2.3년이 고려됨
2.4 통화 및 가격
2.5 DBMR TRIPOD 데이터 검증 모델
2.6 다변량 모델링
2.7 주요 여론 선도자와의 1차 인터뷰
2.8 DBMR 시장 위치 그리드
2.9 시장 산업 범위 그리드
2.1 DBMR 공급업체 점유율 분석
2.11 2차 소스
2.12 가정
3 요약
4가지 프리미엄 인사이트
4.1 PESTEL 분석
4.1.1 정치적 요인
4.1.2 경제적 요인
4.1.3 사회적 요인
4.1.4 기술적 요인
4.1.5 환경 요인
4.1.6 법적 요소
4.2 포터의 5가지 힘
4.2.1 신규 진입자의 위협
4.2.2 대체품의 위협
4.2.3 공급업체의 협상력
4.2.4 구매자의 협상력
4.2.5 경쟁적 경쟁
4.3 공급업체 선택 기준
4.3.1 품질 및 일관성
4.3.2 기술 전문성
4.3.3 공급망 신뢰성
4.3.4 규정 준수 및 지속 가능성
4.3.5 비용 및 가격 구조
4.3.6 유연성 및 사용자 정의
4.4 BATA 시장 침투 시나리오
4.5 브랜드 전망
4.6 고객(기술자/구매 관리자)이 직면한 과제 BATA INDUSTRIALS가 해결할 수 있는 과제
4.6.1 내구성 문제
4.6.2 장시간 사용 시의 편안함
4.6.3 규정 준수
4.6.4 비용 효율성 및 가격 대비 가치
4.6.5 가용성 및 공급망 안정성
4.6.6 결론
4.7 소비자 행동에 영향을 미치는 요인
4.7.1 안전 규정 및 준수
4.7.2 내구성 및 수명
4.7.3 브랜드 평판 및 신뢰
4.7.4 가격 민감도 및 가격 대비 가치
4.7.5 편의성 및 가용성
4.7.6 결론
4.8 경기 침체의 영향
4.8.1 가격에 미치는 영향
4.8.2 공급망에 미치는 영향
4.8.3 선적에 대한 영향
4.8.4 수요에 따른 영향
4.8.5 전략적 결정에 대한 영향
4.9 산업 개요 및 미래 전망 분석
4.9.1 시장의 주요 동인:
4.9.2 시장이 직면한 과제:
4.9.3 남아프리카 안전화 시장의 미래 전망
4.9.4 결론
4.1 독점 고객 목록
4.11 경쟁자를 위한 미디어 배치 통찰력
4.11.1 산업별 잡지 및 출판물
4.11.2 디지털 미디어(웹사이트 및 소셜 미디어)
4.11.3 이벤트 및 무역 박람회
4.11.4 라디오 및 옥외 광고
4.12 생산능력 전망
4.12.1 생산능력의 현재 상태
4.12.2 미래 생산 능력에 영향을 미치는 요인
4.12.3 생산 능력에 영향을 미치는 시장 동향
4.12.4 생산능력 전망
4.13 원자재 조달 분석
4.13.1 가죽 및 합성 소재
4.13.2 고무 및 밑창
4.13.3 강철 및 복합소재 발가락 보호대
4.13.4 직물 및 안감
4.13.5 환경 및 지속 가능성 문제
4.13.6 공급망 및 물류 과제
4.13.7 결론
4.14 공급망 분석
4.14.1 개요
4.14.2 물류 비용 시나리오
4.14.3 물류 서비스 제공자의 중요성
4.15 제조업체의 기술적 발전
4.15.1 스마트 안전화
4.15.2 고급 소재 및 경량 설계
4.15.3 인체공학 및 편안함 향상
4.15.4 지속 가능성 및 친환경 제조
4.15.5 사용자 정의 및 개인화된 솔루션
4.15.6 결론
5 시장 개요
5.1 드라이버
5.1.1 제조 및 건설과 같은 부문의 확장으로 안전화에 대한 수요가 증가
5.1.2 노동법 및 안전 기준에 관한 엄격한 프레임워크
5.1.3 근로자 안전에 대한 인식 증가
5.2 제약
5.2.1 프리미엄 제품의 높은 비용
5.2.2 경제 불안정 및 원자재 가격 변동
5.3 기회
5.3.1 광업 및 재생 에너지 부문의 성장
5.3.2 안전화의 인체공학적 디자인, 경량 소재, 향상된 내구성 도입
5.3.3 지속 가능한 제품에 대한 관심 증가
5.4 과제
5.4.1 제한된 현지 제조 능력
5.4.2 저렴한 위조 제품의 가용성
6 남아프리카 공화국 안전화 시장, 제품별
6.1 개요
6.2 강철 발가락 안전화
6.3 합성 발가락 신발
6.4 중족골 보호대
6.5 미끄럼 방지 신발
6.6 산업용 안전화
6.7 내화학성 신발
6.8 전기 위험(EH) 정격 신발
6.9 내열 안전화
6.1 가벼운 작업화
6.11 웰링턴 부츠/PVC 부츠/고무 부츠
6.12 섬유 발가락 안전화
6.13 스포츠 안전화
7 남아프리카 공화국 안전화 시장, 신발 소재별
7.1 개요
7.2 가죽
7.3 고무
7.4 플라스틱
7.5 기타
8 남아프리카 공화국 안전화 시장, 밑창 소재별
8.1 개요
8.2 고무
8.3 플라스틱
9 남아프리카 공화국 안전화 시장, 유통 채널별
9.1 개요
9.2 B2B
9.3 B2C
10 남아프리카 공화국 안전화 시장, 성별별
10.1 개요
10.2 남자
10.3 여성
11 남아프리카 공화국 안전화 시장, 산업별
11.1 개요
11.2 채굴
11.3 석유 및 가스
11.4 건설/토목
11.5 농업
11.6 운송
11.7 화학
11.8 금속
11.9 제약
11.1 음식 및 음료
11.11 전자
11.12 리테일 DIY
11.13 보안/유틸리티
12 남아프리카 공화국 안전화 시장, 지방별
12.1 남아프리카 공화국
12.1.1 하우텡
12.1.2 콰줄루나탈
12.1.3 서부 케이프
12.1.4 동부 케이프
12.1.5 림포포
12.1.6 음푸말랑가
12.1.7 북서쪽
12.1.8 자유 국가
12.1.9 북부 케이프
13 남아프리카 공화국 안전화 시장: 회사 환경
13.1 회사 점유율 분석: 남아프리카 공화국
14 SWOT 분석
15개 회사 프로필
15.1 BBF 안전 그룹
15.1.1 회사 스냅샷
15.1.2 제품 포트폴리오
15.1.3 최근 개발
15.1.4 SWOT
15.1.5 시장 포지셔닝
15.1.6 가치 제안
15.2 바타산업
15.2.1 회사 스냅샷
15.2.2 제품 포트폴리오
15.2.3 최근 개발
15.2.4 SWOT
15.2.5 시장 포지셔닝
15.2.6 가치 제안
15.3 허니웰 인터내셔널 주식회사
15.3.1 회사 스냅샷
15.3.2 수익 분석
15.3.3 제품 포트폴리오
15.3.4 최근 개발
15.3.5 SWOT
15.3.6 시장 포지셔닝
15.3.7 가치 제안
15.4 칼리버 신발
15.4.1 회사 스냅샷
15.4.2 제품 포트폴리오
15.4.3 최근 개발
15.4.4 SWOT
15.4.5 시장 포지셔닝
15.4.6 가치 제안
15.5 클로우 부츠 인터내셔널
15.5.1 회사 스냅샷
15.5.2 제품 포트폴리오
15.5.3 최근 개발
15.5.4 SWOT
15.5.5 시장 포지셔닝
15.5.6 가치 제안
15.6 JCB 작업복
15.6.1 회사 스냅샷
15.6.2 제품 포트폴리오
15.6.3 최근 개발
15.6.4 SWOT
15.6.5 시장 포지셔닝
15.6.6 가치 제안
15.7 넵툰 부츠
15.7.1 회사 스냅샷
15.7.2 제품 포트폴리오
15.7.3 최근 개발
15.7.4 SWOT
15.7.5 시장 포지셔닝
15.7.6 가치 제안
15.8 SHEQ 안전
15.8.1 회사 스냅샷
15.8.2 제품 포트폴리오
15.8.3 최근 개발
15.8.4 SWOT
15.8.5 시장 포지셔닝
15.8.6 가치 제안
15.9 UVEX 그룹
15.9.1 회사 스냅샷
15.9.2 제품 포트폴리오
15.9.3 최근 개발
15.9.4 SWOT
15.9.5 시장 포지셔닝
15.9.6 가치 제안
16 설문지
17 관련 보고서
표 목록
표 1 남아프리카 안전화 시장의 브랜드 전망 그리드
표 2 독점 고객 목록
표 3 남아프리카 공화국 안전화 시장, 제품별, 2018-2032 (USD 천)
표 4 남아프리카 공화국 안전화 시장, 제품별, 2018-2032 (천 개)
표 5 남아프리카 공화국 안전화 시장, 신발 소재별, 2018-2032 (USD 천)
표 6 안전화 시장에서의 남아프리카 가죽, 유형별, 2018-2032 (USD 천)
표 7 안전화 시장에서의 남아프리카 가죽, 가죽 프린트별, 2018-2032 (USD 천)
표 8 안전화 시장에서의 남아프리카 고무, 유형별, 2018-2032 (USD 천)
표 9 남아프리카 공화국 안전화 시장에서의 플라스틱 종류별 시장, 2018-2032 (USD 천)
표 10 남아프리카 공화국 안전화 시장에서의 폴리우레탄(PU) 및 폴리우레탄 폼, 공정별, 2018-2032 (USD 천)
표 11 밑창 소재별 남아프리카 안전화 시장, 2018-2032년(USD 천 달러)
표 12 안전화 시장에서의 남아프리카 고무, 유형별, 2018-2032 (USD 천)
표 13 남아프리카 공화국 안전화 시장에서의 플라스틱 종류별 시장, 2018-2032 (USD 천 달러)
표 14 남아프리카 공화국 안전화 시장, 유통 채널별, 2018-2032 (USD 천)
표 15 남아프리카 공화국 B2C 안전화 시장, 유통 채널별, 2018-2032 (USD 천)
표 16 남아프리카 공화국 안전화 시장에서 오프라인 판매 채널별, 2018-2032 (USD 천)
표 17 안전화 시장의 남아프리카 백화점, 유형별, 2018-2032 (USD 천)
표 18 남아프리카 공화국 안전화 시장 온라인, 판매 채널별, 2018-2032 (USD 천)
표 19 남아프리카 공화국 안전화 시장, 성별별, 2018-2032 (USD 천 달러)
표 20 남아프리카 공화국 안전화 시장, 산업별, 2018-2032 (USD 천)
표 21 남아프리카 공화국 안전화 시장 광업, 제품별, 2018-2032 (USD 천)
표 22 남아프리카 공화국 안전화 시장, 용도별, 2018-2032 (USD 천)
표 23 남아프리카 공화국 안전화 시장 석유 및 가스, 제품별, 2018-2032 (USD 천)
표 24 남아프리카 공화국 신발 시장의 건설/시민 안전, 적용 분야별, 2018-2032 (USD 천)
표 25 안전화 시장에서 남아프리카 엔지니어링 건설, 유형별, 2018-2032 (USD 천)
표 26 안전화 시장에서 남아프리카 상업용 건설, 유형별, 2018-2032 (USD 천)
표 27 남아프리카 공화국 건설/토목 안전화 시장, 제품별, 2018-2032 (USD 천)
표 28 남아프리카 공화국 안전화 시장에서의 농업, 제품별, 2018-2032 (USD 천)
표 29 남아프리카 공화국 안전화 시장 운송, 제품별, 2018-2032 (USD 천)
표 30 남아프리카 공화국 안전화 시장 화학 제품별, 2018-2032 (USD 천)
표 31 남아프리카 공화국 안전화 시장의 금속, 제품별, 2018-2032 (USD 천)
표 32 남아프리카 공화국 안전화 시장 제약품, 제품별, 2018-2032 (USD 천)
표 33 2018-2032년 카테고리별 안전화 시장의 남아프리카 식품 및 음료(USD 천)
표 34 남아프리카 공화국 안전화 시장, 유형별, 2018-2032 (USD 천)
표 35 안전화 시장에서의 남아프리카 음료, 유형별, 2018-2032 (USD 천)
표 36 남아프리카 공화국 안전화 시장 알코올성, 유형별, 2018-2032 (USD 천)
표 37 안전화 시장 내 남아프리카 비알코올성 제품, 유형별, 2018-2032 (USD 천 달러)
표 38 남아프리카 공화국 안전화 시장의 식품 및 음료, 제품별, 2018-2032 (USD 천)
표 39 남아프리카 공화국 안전화 시장 전자제품, 제품별, 2018-2032 (USD 천)
표 40 남아프리카 공화국 소매 DIY 안전화 시장, 제품별, 2018-2032 (USD 천)
표 41 남아프리카 공화국 안전화 시장 보안/유틸리티, 제품별, 2018-2032 (USD 천)
표 42 남아프리카 공화국 안전화 시장, 지방별, 2018-2032 (USD 천)
표 43 남아프리카 공화국 안전화 시장, 지방별, 2018-2032 (천 대)
표 44 2018-2032년 제품별 하우텡 안전화 시장(USD 천)
표 45 2018-2032년 제품별 하우텡 안전화 시장(천 대)
표 46 2018-2032년 신발 소재별 하우텡 안전화 시장(USD 천)
표 47 안전화 시장에서의 하우텡 가죽, 유형별, 2018-2032 (USD 천)
표 48 2018-2032년 가죽 프린트별 안전화 시장에서의 하우텡 가죽(USD 천)
표 49 2018-2032년 유형별 안전화 시장에서의 하우텡 고무(USD 천 달러)
표 50 2018-2032년 유형별 안전화 시장에서의 GAUTENG 플라스틱(천 달러)
표 51 2018-2032년 공정별 안전화 시장에서의 GAUTENG 폴리우레탄(PU) 및 폴리우레탄 폼(USD 천 달러)
표 52 밑창 소재별 GAUTENG 안전화 시장, 2018-2032 (USD 천)
표 53 2018-2032년 유형별 안전화 시장에서의 하우텡 고무(USD 천 달러)
표 54 2018-2032년 유형별 안전화 시장에서의 GAUTENG 플라스틱(천 달러)
표 55 2018-2032년 유통 채널별 하우텡 안전화 시장(USD 천 달러)
표 56 2018-2032년 유통 채널별 안전화 시장에서의 GAUTENG B2C(USD 천 달러)
표 57 2018-2032년 판매 채널별 안전화 시장에서의 GAUTENG 오프라인 매출(USD 천 달러)
표 58 2018-2032년 유형별 안전화 시장의 하우텡 백화점(USD 천)
표 59 2018-2032년 판매 채널별 안전화 시장에서의 GAUTENG ONLINE(천 달러)
표 60 2018-2032년 성별별 하우텡 안전화 시장(USD 천 달러)
표 61 2018-2032년 산업별 하우텡 안전화 시장(USD 천 달러)
표 62 2018-2032년 제품별 안전화 시장에서의 하우텡 광업(USD 천)
표 63 2018-2032년 응용 분야별 하우텡 석유 및 가스 안전화 시장(USD 천 달러)
표 64 2018-2032년 제품별 하우텡 석유 및 가스 안전화 시장(USD 천)
표 65 2018-2032년 응용 분야별 하우텡 건설/토목 안전화 시장(USD 천 달러)
표 66 2018-2032년 유형별 안전화 시장에서의 GAUTENG 엔지니어링 건설(USD 천 달러)
표 67 2018-2032년 유형별 안전화 시장에서의 하우텡 상업용 건설(USD 천)
표 68 2018-2032년 제품별 하우텡 건설/토목 안전화 시장(USD 천 달러)
표 69 2018-2032년 제품별 안전화 시장에서의 하우텡 농업(USD 천 달러)
표 70 2018-2032년 제품별 안전화 시장의 하우텡 운송(USD 천)
표 71 2018-2032년 제품별 안전화 시장에서의 GAUTENG CHEMICAL(천 달러)
표 72 2018-2032년 제품별 신발 시장의 하우텡 금속 안전성(USD 천)
표 73 2018-2032년 제품별 안전화 시장에서의 GAUTENG PHARMACEUTICAL(천 달러)
표 74 2018-2032년 카테고리별 안전화 시장의 하우텡 식품 및 음료(USD 천)
표 75 2018-2032년 유형별 하우텡 식품 안전화 시장(USD 천 달러)
표 76 2018-2032년 유형별 안전화 시장의 하우텡 음료(USD 천 달러)
표 77 2018-2032년 유형별 하우텡 알코올성 안전화 시장(USD 천 달러)
표 78 2018-2032년 유형별 GAUTENG 비알코올 안전화 시장(USD 천 달러)
표 79 2018-2032년 제품별 하우텡 식품 안전화 시장(USD 천 달러)
표 80 2018-2032년 제품별 안전화 시장에서의 GAUTENG ELECTRONIC(USD 천 달러)
표 81 2018-2032년 제품별 하우텡 소매 DIY 안전화 시장(USD 천 달러)
표 82 2018-2032년 제품별 GAUTENG 보안/안전화 시장의 유틸리티(USD 천 달러)
표 83 콰줄루나탈 안전화 시장, 제품별, 2018-2032 (USD 천)
표 84 콰줄루나탈 안전화 시장, 제품별, 2018-2032 (천대)
표 85 콰줄루나탈 안전화 시장, 신발 소재별, 2018-2032 (USD 천)
표 86 안전화 시장에서 콰줄루나탈 가죽의 종류별 시장, 2018-2032 (USD 천 달러)
표 87 안전화 시장에서의 콰줄루나탈 가죽, 가죽 프린트별, 2018-2032 (USD 천)
표 88 안전화 시장에서의 콰줄루나탈 고무, 유형별, 2018-2032 (USD 천)
표 89 2018-2032년 유형별 안전화 시장에서의 콰줄루나탈 플라스틱(USD 천 달러)
표 90 2018-2032년 공정별 안전화 시장에서의 콰줄루나탈 폴리우레탄(PU) 및 폴리우레탄 폼(USD 천 달러)
표 91 콰줄루나탈 안전화 시장, 밑창 소재별, 2018-2032년(USD 천 달러)
표 92 안전화 시장에서의 콰줄루나탈 고무, 유형별, 2018-2032 (USD 천)
표 93 2018-2032년 유형별 안전화 시장에서의 콰줄루나탈 플라스틱(USD 천 달러)
표 94 콰줄루나탈 안전화 시장, 유통 채널별, 2018-2032 (USD 천)
표 95 2018-2032년 유통 채널별 콰줄루나탈 B2C 안전화 시장(USD 천 달러)
표 96 2018-2032년 판매 채널별 안전화 시장에서의 콰줄루나탈 오프라인 시장(USD 천 달러)
표 97 안전화 시장의 콰줄루나탈 백화점, 유형별, 2018-2032 (USD 천)
표 98 2018-2032년 판매 채널별 안전화 시장에서의 KWAZULU-NATAL ONLINE(USD 천 달러)
표 99 콰줄루나탈 안전화 시장, 성별별, 2018-2032 (USD 천 달러)
표 100 콰줄루나탈 안전화 시장, 산업별, 2018-2032 (USD 천)
표 101 안전화 시장에서의 콰줄루나탈 광업, 제품별, 2018-2032 (USD 천)
표 102 2018-2032년 응용 분야별 콰줄루나탈 석유 및 가스 안전화 시장(USD 천 달러)
표 103 2018-2032년 제품별 콰줄루나탈 석유 및 가스 안전화 시장(USD 천 달러)
표 104 2018-2032년 응용 분야별 콰줄루-나탈 건설/토목 안전화 시장(USD 천 달러)
표 105 안전화 시장에서 콰줄루나탈 엔지니어링 건설, 유형별, 2018-2032 (USD 천)
표 106 2018-2032년 유형별 안전화 시장에서의 콰줄루-나탈 상업용 건설(USD 천 달러)
표 107 2018-2032년 제품별 콰줄루-나탈 건설/토목 안전화 시장(USD 천 달러)
표 108 콰줄루나탈 농업 안전화 시장, 제품별, 2018-2032 (USD 천)
표 109 2018-2032년 제품별 안전화 시장의 콰줄루-나탈 운송(USD 천)
표 110 2018-2032년 제품별 KWAZULU-NATAL 안전화 시장 화학제품(USD 천 달러)
표 111 2018-2032년 제품별 콰줄루나탈 신발 시장의 금속 안전성(USD 천)
표 112 2018-2032년 제품별 안전화 시장에서의 KWAZULU-NATAL 제약품(USD 천 달러)
표 113 2018-2032년 카테고리별 안전화 시장의 콰줄루나탈 식품 및 음료(USD 천)
표 114 2018-2032년 유형별 안전화 시장의 콰줄루나탈 식품(USD 천 달러)
표 115 안전화 시장에서 KWAZULU-NATAL 음료, 유형별, 2018-2032 (USD 천)
표 116 2018-2032년 유형별 콰줄루나탈 알코올 안전화 시장(USD 천 달러)
표 117 2018-2032년 유형별 콰줄루나탈 비알코올 안전화 시장(USD 천 달러)
표 118 2018-2032년 제품별 콰줄루나탈 안전화 식품 시장(USD 천 달러)
표 119 KWAZULU-NATAL ELECTRONIC IN SAFETY SHOES 시장, 제품별, 2018-2032 (USD 천)
표 120 콰줄루나탈 소매 DIY 안전화 시장, 제품별, 2018-2032 (USD 천)
표 121 2018-2032년 제품별 콰줄루나탈 안전화 시장 보안/유틸리티(USD 천 달러)
표 122 서부 케이프 안전화 시장, 제품별, 2018-2032 (USD 천)
표 123 서부 케이프 안전화 시장, 제품별, 2018-2032(천 개)
표 124 서부 케이프 안전화 시장, 신발 소재별, 2018-2032년(USD 천)
표 125 안전화 시장에서의 서부 케이프 가죽, 유형별, 2018-2032 (USD 천)
표 126 안전화 시장에서의 서부 케이프 가죽, 가죽 프린트별, 2018-2032 (USD 천)
표 127 안전화 시장에서 서부 케이프 고무의 종류별 시장, 2018-2032 (USD 천)
표 128 서부 케이프 플라스틱 안전화 시장, 유형별, 2018-2032 (USD 천)
표 129 서부 케이프 폴리우레탄(PU) 및 안전화 시장에서의 폴리우레탄 폼, 공정별, 2018-2032(USD 천)
표 130 서부 케이프 안전화 시장, 밑창 소재별, 2018-2032년(USD 천 달러)
표 131 안전화 시장에서 서부 케이프 고무의 종류별 시장, 2018-2032 (USD 천)
표 132 서부 케이프 플라스틱 안전화 시장, 유형별, 2018-2032 (USD 천)
표 133 서부 케이프 안전화 시장, 유통 채널별, 2018-2032 (USD 천)
표 134 서부 케이프 B2C 안전화 시장, 유통 채널별, 2018-2032 (USD 천)
표 135 서부 케이프 오프라인 안전화 시장, 판매 채널별, 2018-2032 (USD 천)
표 136 서부 케이프 백화점 안전화 시장, 유형별, 2018-2032 (USD 천)
표 137 서부 케이프 온라인 안전화 시장, 판매 채널별, 2018-2032 (USD 천)
표 138 서부 케이프 안전화 시장, 성별별, 2018-2032 (USD 천)
표 139 서부 케이프 안전화 시장, 산업별, 2018-2032 (USD 천)
표 140 서부 케이프 광산 안전화 시장, 제품별, 2018-2032 (USD 천)
표 141 서부 케이프 석유 및 가스 안전화 시장, 용도별, 2018-2032 (USD 천)
표 142 서부 케이프 석유 및 가스 안전화 시장, 제품별, 2018-2032 (USD 천)
표 143 서부 케이프 건설/토목 안전화 시장, 적용 분야별, 2018-2032 (USD 천 달러)
표 144 서부 케이프 엔지니어링 건설 안전화 시장, 유형별, 2018-2032 (USD 천)
표 145 서부 케이프주 안전화 시장의 상업용 건설, 유형별, 2018-2032 (USD 천 달러)
표 146 서부 케이프 건설/토목 안전화 시장, 제품별, 2018-2032 (USD 천)
표 147 서부 케이프 농업 안전화 시장, 제품별, 2018-2032 (USD 천)
표 148 서부 케이프 안전화 시장의 운송, 제품별, 2018-2032 (USD 천)
표 149 서부 케이프 화학 안전화 시장, 제품별, 2018-2032 (USD 천)
표 150 서부 케이프 신발 시장의 금속 안전성, 제품별, 2018-2032 (USD 천)
표 151 서부 케이프 제약 안전화 시장, 제품별, 2018-2032 (USD 천)
표 152 서부 케이프주 안전화 시장의 식품 및 음료, 카테고리별, 2018-2032 (USD 천 달러)
표 153 서부 케이프주 안전화 시장 식품 유형별, 2018-2032 (USD 천 달러)
표 154 서부 케이프 음료 안전화 시장, 유형별, 2018-2032 (USD 천)
표 155 서부 케이프주 안전화 시장 알코올성 약물, 유형별, 2018-2032 (USD 천 달러)
표 156 서부 케이프 비알코올 안전화 시장, 유형별, 2018-2032 (USD 천)
표 157 서부 케이프주 안전화 시장 식품, 제품별, 2018-2032 (USD 천)
표 158 서부 케이프 전자 안전화 시장, 제품별, 2018-2032 (USD 천)
표 159 서부 케이프 소매 DIY 안전화 시장, 제품별, 2018-2032(USD 천 달러)
표 160 서부 케이프주 안전화 시장 보안/유틸리티, 제품별, 2018-2032 (USD 천 달러)
표 161 동부 케이프 안전화 시장, 제품별, 2018-2032 (USD 천)
표 162 동부 케이프 안전화 시장, 제품별, 2018-2032(천 개)
표 163 신발 소재별 동부 케이프 안전화 시장, 2018-2032년(USD 천 달러)
표 164 안전화 시장에서의 이스턴 케이프 가죽, 유형별, 2018-2032 (USD 천)
표 165 안전화 시장에서의 이스턴 케이프 가죽, 가죽 프린트별, 2018-2032년(USD 천)
표 166 안전화 시장에서의 동부 케이프 고무, 유형별, 2018-2032 (USD 천)
표 167 안전화 시장에서의 이스턴 케이프 플라스틱, 유형별, 2018-2032 (USD 천)
표 168 안전화 시장에서의 이스턴 케이프 폴리우레탄(PU) 및 폴리우레탄 폼, 공정별, 2018-2032(USD 천)
표 169 2018-2032년 밑창 소재별 동부 케이프 안전화 시장(USD 천 달러)
표 170 안전화 시장에서의 동부 케이프 고무, 유형별, 2018-2032 (USD 천)
표 171 안전화 시장에서의 이스턴 케이프 플라스틱, 유형별, 2018-2032 (USD 천)
표 172 유통 채널별 동부 케이프 안전화 시장, 2018-2032년(USD 천 달러)
표 173 2018-2032년 유통 채널별 안전화 시장에서의 동부 케이프 B2C(USD 천 달러)
표 174 2018-2032년 판매 채널별 안전화 시장에서의 동부 케이프 오프라인(USD 천)
표 175 안전화 시장의 동부 케이프 백화점, 유형별, 2018-2032 (USD 천)
표 176 2018-2032년 판매 채널별 안전화 시장에서의 EASTERN CAPE ONLINE(천 달러)
표 177 동부 케이프 안전화 시장, 성별별, 2018-2032 (USD 천 달러)
표 178 동부 케이프 안전화 시장, 산업별, 2018-2032 (USD 천)
표 179 동부 케이프 광업 안전화 시장, 제품별, 2018-2032 (USD 천)
표 180 2018-2032년 응용 분야별 안전화 시장에서의 동부 케이프 석유 및 가스 시장(USD 천 달러)
표 181 동부 케이프 석유 및 가스 안전화 시장, 제품별, 2018-2032 (USD 천)
표 182 안전화 시장에서 동부 케이프 건설/토목, 적용 분야별, 2018-2032 (USD 천)
표 183 안전화 시장에서 동부 케이프 엔지니어링 건설, 유형별, 2018-2032 (USD 천)
표 184 안전화 시장에서 동부 케이프 상업용 건설, 유형별, 2018-2032 (USD 천)
표 185 동부 케이프 건설/토목 안전화 시장, 제품별, 2018-2032 (USD 천)
표 186 동부 케이프 농업 안전화 시장, 제품별, 2018-2032 (USD 천)
표 187 안전화 시장에서 동부 케이프 운송, 제품별, 2018-2032 (USD 천)
표 188 2018-2032년 제품별 안전화 시장에서의 이스턴 케이프 케미컬(USD 천)
표 189 동부 케이프 신발 시장의 금속 안전성, 제품별, 2018-2032 (USD 천)
표 190 동부 케이프 제약 안전화 시장, 제품별, 2018-2032 (USD 천)
표 191 동부 케이프 식품 및 음료 안전화 시장, 범주별, 2018-2032 (USD 천)
표 192 동부 케이프 식품 안전화 시장, 유형별, 2018-2032 (USD 천)
표 193 안전화 시장에서 동부 케이프 음료, 유형별, 2018-2032 (USD 천)
표 194 동부 케이프 알코올 안전화 시장, 유형별, 2018-2032 (USD 천)
표 195 동부 케이프 비알코올 안전화 시장, 유형별, 2018-2032 (USD 천)
표 196 동부 케이프 식품 안전화 시장, 제품별, 2018-2032 (USD 천)
표 197 동부 케이프 전자 안전화 시장, 제품별, 2018-2032 (USD 천)
표 198 동부 케이프 소매 DIY 안전화 시장, 제품별, 2018-2032(USD 천)
표 199 동부 케이프 안전화 시장의 보안/유틸리티, 제품별, 2018-2032 (USD 천)
표 200 LIMPOPO 안전화 시장, 제품별, 2018-2032 (USD 천)
표 201 LIMPOPO 안전화 시장, 제품별, 2018-2032 (천대)
표 202 2018-2032년 신발 소재별 LIMPOPO 안전화 시장(USD 천)
표 203 안전화 시장에서의 LIMPOPO 가죽, 유형별, 2018-2032 (USD 천)
표 204 안전화 시장에서의 LIMPOPO 가죽, 가죽 프린트별, 2018-2032 (USD 천)
표 205 안전화 시장에서의 LIMPOPO 고무, 유형별, 2018-2032 (USD 천)
표 206 안전화 시장에서의 LIMPOPO PLASTIC, 유형별, 2018-2032 (USD 천)
표 207 안전화 시장에서의 LIMPOPO 폴리우레탄(PU) 및 폴리우레탄 폼, 공정별, 2018-2032(USD 천)
표 208 밑창 소재별 LIMPOPO 안전화 시장, 2018-2032년(USD 천 달러)
표 209 안전화 시장에서의 LIMPOPO 고무, 유형별, 2018-2032 (USD 천)
표 210 안전화 시장에서의 LIMPOPO PLASTIC, 유형별, 2018-2032 (USD 천)
표 211 LIMPOPO 안전화 시장, 유통 채널별, 2018-2032 (USD 천)
표 212 LIMPOPO B2C 안전화 시장, 유통 채널별, 2018-2032 (USD 천)
표 213 LIMPOPO 오프라인 안전화 시장, 판매 채널별, 2018-2032 (USD 천)
표 214 2018-2032년 유형별 안전화 시장의 LIMPOPO 백화점(USD 천 달러)
표 215 안전화 시장에서의 LIMPOPO ONLINE, 판매 채널별, 2018-2032 (USD 천)
표 216 2018-2032년 성별별 림포포 안전화 시장(USD 천 달러)
표 217 산업별 림포포 안전화 시장, 2018-2032 (USD 천)
표 218 안전화 시장에서의 림포포 광업, 제품별, 2018-2032 (USD 천)
표 219 2018-2032년 응용 분야별 LIMPOPO OIL AND GAS 안전화 시장(USD 천 달러)
표 220 2018-2032년 제품별 LIMPOPO 석유 및 가스 안전화 시장(USD 천 달러)
표 221 2018-2032년 응용 분야별 안전화 시장의 림포포 건설/토목(USD 천)
표 222 안전화 시장에서의 LIMPOPO 엔지니어링 건설, 유형별, 2018-2032 (USD 천)
표 223 안전화 시장에서의 LIMPOPO 상업용 건설, 유형별, 2018-2032 (USD 천)
표 224 2018-2032년 제품별 LIMPOPO 건설/토목 안전화 시장(USD 천 달러)
표 225 림포포 농업 안전화 시장, 제품별, 2018-2032 (USD 천)
표 226 2018-2032년 제품별 안전화 시장의 림포포 운송(USD 천)
표 227 LIMPOPO CHEMICAL의 안전화 시장, 제품별, 2018-2032 (USD 천)
표 228 2018-2032년 제품별 신발 시장의 LIMPOPO 금속 안전성(USD 천)
표 229 안전화 시장에서의 LIMPOPO PHARMACEUTICAL, 제품별, 2018-2032 (USD 천)
표 230 2018-2032년 카테고리별 안전화 시장에서의 림포포 식품 및 음료(USD 천)
표 231 2018-2032년 유형별 안전화 시장에서의 LIMPOPO 식품(USD 천 달러)
표 232 안전화 시장에서의 LIMPOPO 음료, 유형별, 2018-2032 (USD 천)
표 233 2018-2032년 유형별 안전화 시장 내 림포포 알코올성 약물(USD 천 달러)
표 234 LIMPOPO 무알콜 안전화 시장, 유형별, 2018-2032 (USD 천)
표 235 2018-2032년 제품별 안전화 시장에서의 LIMPOPO 식품(USD 천 달러)
표 236 LIMPOPO ELECTRONIC의 안전화 시장, 제품별, 2018-2032 (USD 천)
표 237 LIMPOPO 소매 DIY 안전화 시장, 제품별, 2018-2032 (USD 천)
표 238 2018-2032년 제품별 LIMPOPO 보안/안전화 유틸리티 시장(USD 천 달러)
표 239 MPUMALANGA 안전화 시장, 제품별, 2018-2032 (USD 천)
표 240 MPUMALANGA 안전화 시장, 제품별, 2018-2032(천 개)
표 241 신발 소재별 MPUMALANGA 안전화 시장, 2018-2032 (USD 천)
표 242 안전화 시장에서의 MPUMALANGA 가죽, 유형별, 2018-2032 (USD 천)
표 243 안전화 시장에서의 MPUMALANGA 가죽, 가죽 프린트별, 2018-2032 (USD 천)
표 244 안전화 시장에서의 MPUMALANGA 고무, 유형별, 2018-2032 (USD 천)
표 245 MPUMALANGA 플라스틱 안전화 시장, 유형별, 2018-2032 (USD 천)
표 246 MPUMALANGA 폴리우레탄(PU) 및 안전화 시장에서의 폴리우레탄 폼, 공정별, 2018-2032(USD 천)
표 247 밑창 소재별 MPUMALANGA 안전화 시장, 2018-2032 (USD 천)
표 248 안전화 시장에서의 MPUMALANGA 고무, 유형별, 2018-2032 (USD 천)
표 249 MPUMALANGA 플라스틱 안전화 시장, 유형별, 2018-2032 (USD 천)
표 250 MPUMALANGA 안전화 시장, 유통 채널별, 2018-2032 (USD 천)
표 251 MPUMALANGA B2C 안전화 시장, 유통 채널별, 2018-2032 (USD 천)
표 252 MPUMALANGA 오프라인 안전화 시장, 판매 채널별, 2018-2032 (USD 천)
표 253 안전화 시장의 MPUMALANGA 백화점, 유형별, 2018-2032 (USD 천)
표 254 MPUMALANGA ONLINE 안전화 시장, 판매 채널별, 2018-2032 (USD 천)
표 255 성별별 MPUMALANGA 안전화 시장, 2018-2032 (USD 천 달러)
표 256 산업별 MPUMALANGA 안전화 시장, 2018-2032 (USD 천)
표 257 안전화 시장에서의 MPUMALANGA 광업, 제품별, 2018-2032 (USD 천)
표 258 2018-2032년 응용 분야별 MPUMALANGA 석유 및 가스 안전화 시장(USD 천 달러)
표 259 MPUMALANGA 석유 및 가스 안전화 시장, 제품별, 2018-2032 (USD 천)
표 260 MPUMALANGA 건설/토목 안전화 시장, 적용 분야별, 2018-2032 (USD 천)
표 261 안전화 시장에서 MPUMALANGA 엔지니어링 건설, 유형별, 2018-2032 (USD 천)
표 262 안전화 시장에서의 MPUMALANGA 상업용 건설, 유형별, 2018-2032 (USD 천)
표 263 MPUMALANGA 건설/토목 안전화 시장, 제품별, 2018-2032 (USD 천)
표 264 MPUMALANGA 농업 안전화 시장, 제품별, 2018-2032 (USD 천)
표 265 안전화 시장(MPUMALANGA) 운송, 제품별, 2018-2032(USD 천)
표 266 MPUMALANGA CHEMICAL 안전화 시장, 제품별, 2018-2032 (USD 천)
표 267 MPUMALANGA 신발 시장의 금속 안전성, 제품별, 2018-2032 (USD 천)
표 268 MPUMALANGA 제약 안전화 시장, 제품별, 2018-2032 (USD 천)
표 269 MPUMALANGA 안전화 시장의 식품 및 음료, 카테고리별, 2018-2032 (USD 천)
표 270 MPUMALANGA 식품 안전화 시장, 유형별, 2018-2032 (USD 천)
표 271 안전화 시장에서의 MPUMALANGA 음료, 유형별, 2018-2032 (USD 천)
표 272 MPUMALANGA 알코올성 안전화 시장, 유형별, 2018-2032 (USD 천)
표 273 MPUMALANGA 안전화 비알코올 시장, 유형별, 2018-2032 (USD 천)
표 274 MPUMALANGA 식품 안전화 시장, 제품별, 2018-2032 (USD 천)
표 275 MPUMALANGA ELECTRONIC 안전화 시장, 제품별, 2018-2032 (USD 천)
표 276 MPUMALANGA 소매 DIY 안전화 시장, 제품별, 2018-2032(USD 천)
표 277 MPUMALANGA 안전화 시장 보안/유틸리티, 제품별, 2018-2032 (USD 천)
표 278 북서부 안전화 시장, 제품별, 2018-2032 (USD 천)
표 279 북서부 안전화 시장, 제품별, 2018-2032(천 개)
표 280 북서부 안전화 시장, 신발 소재별, 2018-2032년(USD 천)
표 281 안전화 시장에서 북서 가죽의 종류별 시장, 2018-2032년(USD 천 달러)
표 282 안전화 시장에서 북서부 가죽, 가죽 프린트별, 2018-2032 (USD 천)
표 283 안전화 시장에서 북서부 고무의 종류별 시장, 2018-2032 (USD 천)
표 284 안전화 시장에서 북서 플라스틱의 종류별 시장, 2018-2032 (USD 천 달러)
표 285 북서부 폴리우레탄(PU) 및 폴리우레탄 폼의 안전화 시장, 공정별, 2018-2032(USD 천)
표 286 2018-2032년 밑창 소재별 북서부 안전화 시장(USD 천 달러)
표 287 안전화 시장에서 북서부 고무의 종류별 시장, 2018-2032 (USD 천)
표 288 안전화 시장에서 북서 플라스틱의 종류별 시장, 2018-2032 (USD 천)
표 289 북서부 안전화 시장, 유통 채널별, 2018-2032 (USD 천)
표 290 2018-2032년 유통 채널별 안전화 시장의 북서부 B2C 시장(USD 천 달러)
표 291 안전화 시장에서 북서부 오프라인, 판매 채널별, 2018-2032 (USD 천)
표 292 안전화 시장의 북서부 백화점, 유형별, 2018-2032 (USD 천)
표 293 안전화 시장에서 북서부 온라인 판매 채널별, 2018-2032년(USD 천 달러)
표 294 북서부 안전화 시장, 성별별, 2018-2032 (USD 천 달러)
표 295 북서부 안전화 시장, 산업별, 2018-2032 (USD 천)
표 296 안전화 시장에서 북서부 광업, 제품별, 2018-2032 (USD 천)
표 297 2018-2032년 응용 분야별 북서부 석유 및 가스 안전화 시장(USD 천 달러)
표 298 북서부 석유 및 가스 안전화 시장, 제품별, 2018-2032 (USD 천)
표 299 안전화 시장의 북서부 건설/토목, 용도별, 2018-2032 (USD 천)
표 300 안전화 시장에서 북서부 엔지니어링 건설, 유형별, 2018-2032 (USD 천)
표 301 안전화 시장에서 북서부 상업용 건설, 유형별, 2018-2032 (USD 천)
표 302 북서부 건설/토목 안전화 시장, 제품별, 2018-2032 (USD 천)
표 303 북서부 농업 안전화 시장, 제품별, 2018-2032 (USD 천)
표 304 안전화 시장의 북서부 운송, 제품별, 2018-2032 (USD 천)
표 305 NORTH WEST CHEMICAL의 안전화 시장, 제품별, 2018-2032 (USD 천)
표 306 신발 시장에서의 북서부 금속 안전도, 제품별, 2018-2032 (USD 천)
표 307 안전화 시장에서의 북서부 제약 회사, 제품별, 2018-2032 (USD 천)
표 308 안전화 시장에서 북서부 식품 및 음료, 카테고리별, 2018-2032 (USD 천)
표 309 안전화 시장에서 북서부 식품, 유형별, 2018-2032 (USD 천)
표 310 안전화 시장에서 북서부 음료의 종류별 시장, 2018-2032 (USD 천 달러)
표 311 안전화 시장 내 북서부 알코올 중독자 유형별, 2018-2032년(USD 천 달러)
표 312 북서부 비알코올 안전화 시장, 유형별, 2018-2032 (USD 천)
표 313 북서부 식품 안전화 시장, 제품별, 2018-2032 (USD 천)
표 314 안전화 시장에서의 북서 전자 제품 시장, 제품별, 2018-2032 (USD 천)
표 315 북서부 소매 DIY 안전화 시장, 제품별, 2018-2032(USD 천)
표 316 북서부 안전화 시장 보안/유틸리티, 제품별, 2018-2032 (USD 천)
표 317 자유주 안전화 시장, 제품별, 2018-2032 (USD 천)
표 318 자유 주 안전화 시장, 제품별, 2018-2032(천 개)
표 319 신발 소재별 자유 주 안전화 시장, 2018-2032년(USD 천)
표 320 안전화 시장에서의 자유 가죽(Free State LEATHER) 유형별, 2018-2032(USD 천)
표 321 안전화 시장에서의 자유주 가죽, 가죽 프린트별, 2018-2032 (USD 천)
표 322 안전화 시장에서의 자유 국가 고무, 유형별, 2018-2032 (USD 천)
표 323 안전화 시장에서의 자유 주 플라스틱, 유형별, 2018-2032 (USD 천)
표 324 안전화 시장에서의 자유 상태 폴리우레탄(PU) 및 폴리우레탄 폼, 공정별, 2018-2032(USD 천)
표 325 자유 주 안전화 시장, 밑창 소재별, 2018-2032년(USD 천)
표 326 안전화 시장에서의 자유 국가 고무, 유형별, 2018-2032 (USD 천)
표 327 안전화 시장에서의 자유 주 플라스틱, 유형별, 2018-2032 (USD 천)
표 328 유통 채널별 자유 주 안전화 시장, 2018-2032 (USD 천)
표 329 안전화 시장에서의 자유 주 B2C, 유통 채널별, 2018-2032 (USD 천)
표 330 안전화 시장에서 무료 상태 오프라인, 판매 채널별, 2018-2032 (USD 천)
표 331 안전화 시장의 무료 주정부 백화점 매장, 유형별, 2018-2032 (USD 천)
표 332 안전화 시장에서의 무료 주 온라인 판매 채널별, 2018-2032 (USD 천)
표 333 자유주 안전화 시장, 성별별, 2018-2032 (USD 천)
표 334 자유주 안전화 시장, 산업별, 2018-2032 (USD 천)
표 335 안전화 시장에서의 자유 주 채굴, 제품별, 2018-2032 (USD 천)
표 336 안전화 시장에서의 자유 주 석유 및 가스 시장, 용도별, 2018-2032 (USD 천)
표 337 안전화 시장에서의 자유 주 석유 및 가스, 제품별, 2018-2032 (USD 천)
표 338 안전화 시장의 자유주 건설/토목, 용도별, 2018-2032 (USD 천)
표 339 안전화 시장에서의 자유 주 엔지니어링 건설, 유형별, 2018-2032 (USD 천)
표 340 안전화 시장에서의 자유 주 상업 건설, 유형별, 2018-2032 (USD 천)
표 341 안전화 시장의 자유 주 건설/토목, 제품별, 2018-2032 (USD 천)
표 342 자유주 농업 안전화 시장, 제품별, 2018-2032 (USD 천)
표 343 안전화 시장의 무료 주정부 운송, 제품별, 2018-2032 (USD 천)
표 344 안전화 시장의 자유 주 화학물질, 제품별, 2018-2032 (USD 천)
표 345 신발 시장의 자유 주 금속 안전성, 제품별, 2018-2032 (USD 천)
표 346 안전화 시장에서의 자유주 제약품, 제품별, 2018-2032 (USD 천)
표 347 안전화 시장의 자유 주 식품 및 음료, 범주별, 2018-2032 (USD 천)
표 348 안전화 시장의 무료 주 식품, 유형별, 2018-2032 (USD 천)
표 349 안전화 시장에서의 무료 주 음료, 유형별, 2018-2032 (USD 천)
표 350 안전화 시장의 자유주 알코올 중독자, 유형별, 2018-2032 (USD 천)
표 351 안전화의 자유주 비알코올 시장, 유형별, 2018-2032 (USD 천)
표 352 안전화 시장의 무료 주 식품, 제품별, 2018-2032 (USD 천)
표 353 안전화 시장에서의 자유 국가 전자 제품, 제품별, 2018-2032 (USD 천)
표 354 안전화 시장에서의 자유 주 소매 DIY 시장, 제품별, 2018-2032 (USD 천)
표 355 안전화 시장의 자유 주 보안/유틸리티, 제품별, 2018-2032 (USD 천)
표 356 북부 케이프 안전화 시장, 제품별, 2018-2032 (USD 천)
표 357 북부 케이프 안전화 시장, 제품별, 2018-2032(천 개)
표 358 북부 케이프 안전화 시장, 신발 소재별, 2018-2032년(USD 천 달러)
표 359 안전화 시장에서의 북부 케이프 가죽, 유형별, 2018-2032 (USD 천)
표 360 안전화 시장에서의 북부 케이프 가죽, 가죽 프린트별, 2018-2032년(USD 천)
표 361 안전화 시장에서 북부 케이프 고무의 종류별 시장, 2018-2032 (USD 천)
표 362 안전화 시장에서 북부 케이프 플라스틱의 종류별 시장, 2018-2032 (USD 천 달러)
표 363 안전화 시장에서의 북부 케이프 폴리우레탄(PU) 및 폴리우레탄 폼, 공정별, 2018-2032(USD 천)
표 364 북부 케이프 안전화 시장, 밑창 소재별, 2018-2032년(USD 천 달러)
표 365 안전화 시장에서 북부 케이프 고무의 종류별 시장, 2018-2032 (USD 천)
표 366 안전화 시장에서 북부 케이프 플라스틱의 종류별 시장, 2018-2032 (USD 천 달러)
표 367 북부 케이프 안전화 시장, 유통 채널별, 2018-2032 (USD 천)
표 368 북부 케이프 B2C 안전화 시장, 유통 채널별, 2018-2032 (USD 천)
표 369 안전화 시장에서 북부 케이프 오프라인, 판매 채널별, 2018-2032 (USD 천)
표 370 안전화 시장의 북부 케이프 백화점, 유형별, 2018-2032 (USD 천)
표 371 안전화 시장에서의 북부 케이프 온라인, 판매 채널별, 2018-2032 (USD 천)
표 372 북부 케이프 안전화 시장, 성별별, 2018-2032 (USD 천)
표 373 북부 케이프 안전화 시장, 산업별, 2018-2032 (USD 천)
표 374 안전화 시장에서 북부 케이프 광업, 제품별, 2018-2032 (USD 천)
표 375 안전화 시장에서 북부 케이프 석유 및 가스, 용도별, 2018-2032 (USD 천)
표 376 북부 케이프 석유 및 가스 안전화 시장, 제품별, 2018-2032 (USD 천)
표 377 안전화 시장에서 북부 케이프 건설/토목, 적용 분야별, 2018-2032 (USD 천)
표 378 안전화 시장에서 북부 케이프 엔지니어링 건설, 유형별, 2018-2032 (USD 천)
표 379 안전화 시장에서 북부 케이프 상업용 건설, 유형별, 2018-2032 (USD 천)
표 380 북부 케이프 건설/토목 안전화 시장, 제품별, 2018-2032 (USD 천)
표 381 북부 케이프 농업 안전화 시장, 제품별, 2018-2032 (USD 천)
표 382 안전화 시장에서 북부 케이프 운송, 제품별, 2018-2032 (USD 천)
표 383 북부 케이프 케미컬의 안전화 시장, 제품별, 2018-2032 (USD 천)
표 384 북부 케이프 신발 시장의 금속 안전성, 제품별, 2018-2032 (USD 천)
표 385 북부 케이프 제약 안전화 시장, 제품별, 2018-2032 (USD 천)
표 386 북부 케이프 식품 및 음료 안전화 시장, 범주별, 2018-2032 (USD 천)
표 387 북부 케이프 식품 안전화 시장, 유형별, 2018-2032 (USD 천)
표 388 안전화 시장에서 북부 케이프 음료, 유형별, 2018-2032 (USD 천)
표 389 북부 케이프 알코올 안전화 시장, 유형별, 2018-2032 (USD 천)
표 390 북부 케이프 비알코올 안전화 시장, 유형별, 2018-2032 (USD 천)
표 391 북부 케이프 식품 안전화 시장, 제품별, 2018-2032 (USD 천)
표 392 북부 케이프 전자 안전화 시장, 제품별, 2018-2032 (USD 천)
표 393 북부 케이프 소매 DIY 안전화 시장, 제품별, 2018-2032(USD 천)
표 394 북부 케이프 안전화 시장의 보안/유틸리티, 제품별, 2018-2032 (USD 천)
그림 목록
그림 1 남아프리카 공화국 안전화 시장
그림 2 남아프리카 공화국 안전화 시장: 데이터 삼각 측량
그림 3 남아프리카 공화국 안전화 시장: DROC 분석
그림 4 남아프리카 공화국 안전화 시장: 국가별 시장 분석
그림 5 남아프리카 공화국 안전화 시장: 회사 연구 분석
그림 6 남아프리카 공화국 안전화 시장: 다변량 모델링
그림 7 남아프리카 공화국 안전화 시장: 인터뷰 인구 통계
그림 8 남아프리카 공화국 안전화 시장: DBMR 시장 위치 그리드
그림 9 남아프리카 공화국 안전화 시장: 시장 산업 범위 그리드
그림 10 남아프리카 공화국 안전화 시장: 공급업체 점유율 분석
그림 11 남아프리카 공화국 안전화 시장: 세분화
그림 12 요약
그림 13 남아프리카 안전화 시장은 제품별로 12개 세그먼트로 구성되어 있습니다.
그림 14 전략적 결정
그림 15 제조 및 건설과 같은 부문의 확장은 안전화에 대한 수요를 촉진하여 예측 기간 동안 남아프리카 안전화 시장을 견인할 것으로 예상됩니다.
그림 16 강철 발가락 안전화 부문은 2025년과 2032년에 남아프리카 안전화 시장에서 가장 큰 점유율을 차지할 것으로 예상됩니다.
그림 17 PESTEL 분석
그림 18 포터의 5가지 힘
그림 19 공급업체 선택 기준
그림 20 남아프리카 안전화 시장의 동인, 제약, 기회 및 과제
그림 21 남아프리카 공화국 안전화 시장: 제품별, 2024
그림 22 남아프리카 공화국 안전화 시장: 신발 소재별, 2024년
그림 23 남아프리카 공화국 안전화 시장: 밑창 소재별, 2024년
그림 24 남아프리카 공화국 안전화 시장: 유통 채널별, 2024
그림 25 남아프리카 공화국 안전화 시장: 성별별, 2024
그림 26 남아프리카 공화국 안전화 시장: 산업별, 2024
그림 27 남아프리카 공화국 안전화 시장: 회사 점유율 2024(%)
연구 방법론
데이터 수집 및 기준 연도 분석은 대규모 샘플 크기의 데이터 수집 모듈을 사용하여 수행됩니다. 이 단계에는 다양한 소스와 전략을 통해 시장 정보 또는 관련 데이터를 얻는 것이 포함됩니다. 여기에는 과거에 수집한 모든 데이터를 미리 검토하고 계획하는 것이 포함됩니다. 또한 다양한 정보 소스에서 발견되는 정보 불일치를 검토하는 것도 포함됩니다. 시장 데이터는 시장 통계 및 일관된 모델을 사용하여 분석하고 추정합니다. 또한 시장 점유율 분석 및 주요 추세 분석은 시장 보고서의 주요 성공 요인입니다. 자세한 내용은 분석가에게 전화를 요청하거나 문의 사항을 드롭하세요.
DBMR 연구팀에서 사용하는 주요 연구 방법론은 데이터 마이닝, 시장에 대한 데이터 변수의 영향 분석 및 주요(산업 전문가) 검증을 포함하는 데이터 삼각 측량입니다. 데이터 모델에는 공급업체 포지셔닝 그리드, 시장 타임라인 분석, 시장 개요 및 가이드, 회사 포지셔닝 그리드, 특허 분석, 가격 분석, 회사 시장 점유율 분석, 측정 기준, 글로벌 대 지역 및 공급업체 점유율 분석이 포함됩니다. 연구 방법론에 대해 자세히 알아보려면 문의를 통해 업계 전문가에게 문의하세요.
사용자 정의 가능
Data Bridge Market Research는 고급 형성 연구 분야의 선두 주자입니다. 저희는 기존 및 신규 고객에게 목표에 맞는 데이터와 분석을 제공하는 데 자부심을 느낍니다. 보고서는 추가 국가에 대한 시장 이해(국가 목록 요청), 임상 시험 결과 데이터, 문헌 검토, 재생 시장 및 제품 기반 분석을 포함하도록 사용자 정의할 수 있습니다. 기술 기반 분석에서 시장 포트폴리오 전략에 이르기까지 타겟 경쟁업체의 시장 분석을 분석할 수 있습니다. 귀하가 원하는 형식과 데이터 스타일로 필요한 만큼 많은 경쟁자를 추가할 수 있습니다. 저희 분석가 팀은 또한 원시 엑셀 파일 피벗 테이블(팩트북)로 데이터를 제공하거나 보고서에서 사용 가능한 데이터 세트에서 프레젠테이션을 만드는 데 도움을 줄 수 있습니다.

