Asia Pacific Cereals Market
Tamanho do mercado em biliões de dólares
CAGR :
% 
 USD
28.94 Billion
USD
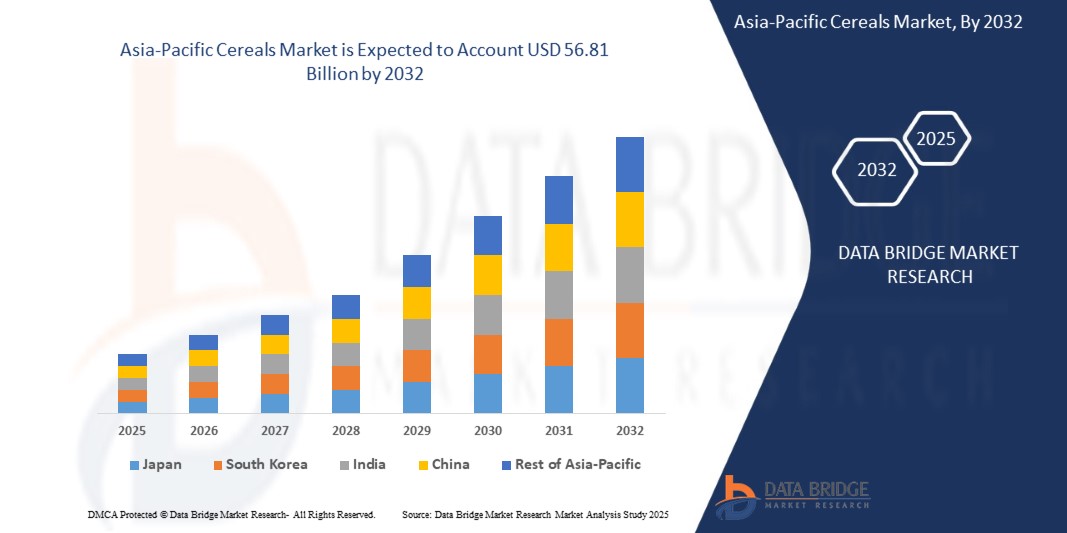
56.81 Billion
2024
2032
USD
28.94 Billion
USD
56.81 Billion
2024
2032
| 2025 –2032 | |
| USD 28.94 Billion | |
| USD 56.81 Billion | |
| % | |
|
Segmentação do mercado de cereais da Ásia-Pacífico, por tipo de produto (trigo, arroz, milho, cevada, aveia, centeio, sorgo, painço, quinoa, trigo sarraceno, triticale, fonio, teff, amaranto, kamut e outros), forma do produto (grãos integrais, farinha, grãos em flocos, grãos laminados, grãos tufados, farinha moída, grãos quebrados, amido, farelo, gérmen e outros), nível de processamento (fortificado, descascado, polido, pré-cozido, misturado, instantâneo, germinado, torrado, extrusado, parcialmente cozido, micronizado, cru, totalmente cozido, cozido no vapor, temperado, adoçado, revestido e outros), formato de consumo (consumido com colher com leite/iogurte, barras para viagem, mingau, lanche seco, pacotes de lanche, pronto para cozinhar, pronto para aquecer, para misturar Ingrediente, Infusão de Bebida e Outros), Categoria do Produto (Ingredientes de Panificação (Misturas de Farinha/Grãos), Cereais Maternos, Matéria-Prima/Ração Animal, Snacks de Cereais, Misturas Instantâneas de Cereais, Cereais Infantis, Kits de Refeição à Base de Cereais, Insumos para Cervejaria/Destilaria e Outros), Natureza (Convencional e Orgânico), Categoria (À BASE DE OGM e Certificado NÃO OGM), Benefícios Funcionais (Fortificado com Vitaminas, Rico em Fibras, Baixo/Sem Açúcar, Rico em Proteínas, Sem Glúten, Saudável para o Coração, Enriquecido com Probióticos/Prebióticos, Redutor de Colesterol, Baixo Índice Glicêmico, Enriquecido com Ômega-3, Baixo em Gordura, Livre de Alérgenos, Rico em Ferro, Baixo/Sem Sal, Adequado para Paleolíticos, Adequado para Cetogênicos, Certificado Vegano e Outros) Validade (Longo Prazo (Estável em Temperatura Ambiente), Médio e Curto Prazo (Perecíveis)), Embalagem (Caixa, Bolsa, Saco, Sachê/Pacote Stick, Saco (A Granel), Pote, Tetra Pack/Caixa Asséptica, Lata, Tambor, Eco-Embalagem e Outros), Tamanho da Embalagem (Pacotes Pequenos (51G–250G), Pacotes Médios (251G–500G), Pacotes Grandes (501G–1KG), Pacotes Individuais (ABAIXO DE 50G), Pacotes Extra Grandes (1,1KG–2,5KG) e Pacotes a Granel (ACIMA DE 2,5KG)), Faixa de Preço (Econômica (ATÉ US$ 2,49), Média (US$ 2,50-6,99) e Premium (US$ 7,00 e ACIMA)), Canal de Distribuição (B2B e B2C) – Tendências e Previsão do Setor até 2032
Tamanho do mercado de cereais
- O tamanho do mercado de cereais da Ásia-Pacífico foi avaliado em US$ 28,94 bilhões em 2024 e deve atingir US$ 56,81 bilhões até 2032 , com um CAGR de 8,9% durante o período previsto.
- O crescimento do mercado é impulsionado por fatores como a crescente demanda por opções de café da manhã convenientes e nutritivas, a crescente conscientização sobre saúde entre os consumidores, a inovação em formulações de cereais e a expansão da disponibilidade por meio de canais de varejo online.
- Além disso, a evolução das preferências dos consumidores por alimentos nutritivos e funcionais, juntamente com a expansão da urbanização e a crescente penetração do varejo online, estão acelerando a adoção de produtos de cereais, impulsionando significativamente o crescimento da indústria.
Análise de Mercado de Cereais
- O mercado de cereais representa um segmento-chave na indústria de alimentos e agricultura da Ásia-Pacífico, abrangendo produtos de cereais prontos para consumo e quentes. Esses produtos são amplamente consumidos como opções práticas e nutritivas para o café da manhã, adequadas ao estilo de vida moderno e agitado. O mercado inclui uma gama diversificada de produtos feitos de trigo, aveia, milho, arroz e cevada, adaptados às diversas necessidades dos consumidores, incluindo preferências por alimentos saudáveis, orgânicos e sem glúten.
- Os fabricantes de cereais estão inovando cada vez mais com variantes ricas em proteínas, fortificadas e à base de plantas para se alinharem às tendências de saúde e às mudanças alimentares da região Ásia-Pacífico. Esses desenvolvimentos estão expandindo o alcance do mercado de cereais para categorias de alimentos funcionais, especialmente em regiões desenvolvidas, onde os consumidores priorizam rótulos limpos e valor nutricional. A tendência crescente de substituição de refeições e lanches para viagem impulsiona ainda mais o crescimento do mercado.
- A China dominou o mercado de cereais em 2024 e prevê-se que seja o país com crescimento mais rápido no mercado, devido aos fortes padrões de consumo, à fidelidade à marca e à presença de empresas consolidadas do setor, como Kellogg's, General Mills e Post Holdings. A região também se beneficia de uma infraestrutura de varejo consolidada e de uma alta conscientização do consumidor em relação à saúde e ao bem-estar.
- O segmento de trigo dominou o mercado de cereais com a maior participação em 2024, devido à sua conveniência, estabilidade na prateleira e ampla disponibilidade. Este segmento desempenha um papel crucial na formação dos hábitos de café da manhã dos consumidores e oferece valor por meio de opções fortificadas, ricas em sabor e específicas para cada dieta, que atendem a diversas necessidades nutricionais.
Escopo do Relatório e Segmentação do Mercado de Cereais
|
Atributos |
Principais insights do mercado de cereais |
|
Segmentos abrangidos |
|
|
Países abrangidos |
Ásia-Pacífico
|
|
Principais participantes do mercado |
|
|
Oportunidades de mercado |
|
|
Conjuntos de informações de dados de valor agregado |
Além dos insights sobre cenários de mercado, como valor de mercado, taxa de crescimento, segmentação, cobertura geográfica e principais participantes, os relatórios de mercado selecionados pela Data Bridge Market Research também incluem análises aprofundadas de especialistas, produção e capacidade de empresas representadas geograficamente, layouts de rede de distribuidores e parceiros, análises detalhadas e atualizadas de tendências de preços e análises de déficit da cadeia de suprimentos e demanda. |
Tendências do Mercado de Cereais
“Inovação em Cereais Funcionais e Nutrição Personalizada”
- O mercado de cereais da Ásia-Pacífico está passando por uma mudança crucial com a crescente demanda por cereais funcionais e nutrição personalizada, adaptada às metas de saúde e preferências alimentares do consumidor.
- Essa tendência está levando os fabricantes a reformular os cereais tradicionais, incorporando ingredientes com benefícios específicos para a saúde, como alto teor de fibras, suporte à imunidade, saúde cardíaca e melhor digestão.
- Por exemplo, as principais marcas de cereais estão a introduzir produtos enriquecidos com superalimentos (sementes de chia, sementes de linhaça), probióticos, prebióticos e adaptógenos, como ashwagandha e maca, para atrair consumidores preocupados com o bem-estar.
- Esta mudança reflete a crescente conscientização em torno da saúde preventiva e a preferência por alimentos ricos em nutrientes e com rótulos limpos, posicionando os cereais funcionais como componentes essenciais das dietas modernas.
Dinâmica do Mercado de Cereais
Motorista
Aumento da demanda por opções alimentares convenientes e nutritivas
- Os estilos de vida urbanos estão se tornando cada vez mais agitados, gerando um aumento na demanda por soluções de café da manhã rápidas, nutritivas e fáceis de preparar.
- Os produtos de cereais atendem efetivamente a essa necessidade devido à sua conveniência, longa vida útil, diversos perfis nutricionais e ampla disponibilidade em canais de varejo modernos e tradicionais.
- As opções de cereais prontos para consumo e instantâneos permitem que os consumidores economizem tempo, garantindo uma ingestão equilibrada de nutrientes essenciais, como fibras, vitaminas e minerais
- Essa crescente preferência por opções alimentares práticas e saudáveis está impulsionando uma demanda constante por cereais em vários grupos demográficos, especialmente profissionais, estudantes e famílias preocupadas com a saúde.
- Em abril de 2024, de acordo com um relatório da FoodNavigator, a Kellogg's firmou parceria com uma empresa líder em ciência nutricional para alavancar dados de saúde do consumidor e ferramentas de IA para o desenvolvimento de misturas de cereais personalizadas. Ao analisar milhões de pontos de dados relacionados a hábitos alimentares, preferências e condições de saúde, a Kellogg's lançou uma linha de cereais personalizados, desenvolvidos para promover a saúde intestinal, o bem-estar cardíaco e os níveis de energia. Essa iniciativa reflete a crescente demanda por soluções de cereais funcionais e baseadas em dados, projetadas para nutrição personalizada.
- Essas inovações destacam como as marcas estão adotando a transformação digital e a análise de saúde para impulsionar a inovação de produtos e melhorar o envolvimento do consumidor, alimentando, em última análise, o crescimento sustentado do mercado nas categorias de cereais da Ásia-Pacífico.
Restrição/Desafio
Preocupações com a saúde devido ao teor de açúcar em cereais matinais
- O custo substancial de aquisição de matérias-primas premium e desenvolvimento de cereais funcionais, orgânicos ou personalizados representa desafios significativos, especialmente para pequenos e médios fabricantes (PMEs)
- Esses custos incluem a aquisição de ingredientes especializados (como superalimentos e probióticos), tecnologias avançadas de processamento, conformidade com padrões de rótulo limpo ou certificação de saúde e marketing para segmentos de saúde de nicho. Muitos produtores menores de cereais não têm recursos financeiros ou capacidade de P&D para competir com marcas estabelecidas da Ásia-Pacífico, o que leva a uma inovação mais lenta e a um alcance de mercado limitado.
- Em outubro de 2023, um relatório da AgriBusiness Review destacou que o custo de lançamento de linhas de produtos de cereais funcionais ou orgânicos vai muito além da obtenção de matérias-primas. Inclui investimentos em maquinário especializado, P&D para aprimoramento nutricional, inovação em embalagens, certificação (como orgânico ou sem glúten) e educação do consumidor. Essas despesas cumulativas costumam ser incontroláveis para pequenas marcas que buscam ingressar em segmentos de cereais voltados para a saúde.
- A capacidade financeira limitada e a infraestrutura tecnológica forçam muitos pequenos e médios produtores de cereais a adiar ou renunciar ao desenvolvimento desses produtos, restringindo sua capacidade de competir em categorias premium e funcionais. Esse obstáculo financeiro retarda significativamente a diversificação de mercado e a inovação em toda a indústria de cereais.
Âmbito do mercado de cereais
O mercado é segmentado em treze segmentos notáveis com base no tipo de produto, forma do produto, nível de processamento, formato de consumo, categoria do produto, natureza, categoria, benefícios funcionais, prazo de validade, embalagem, tamanho da embalagem, faixa de preço, canal de distribuição
- Por tipo de produto
Com base no tipo de produto, o mercado de cereais é segmentado em trigo, arroz, milho, cevada, aveia, centeio, sorgo, milheto, quinoa, trigo sarraceno, triticale, fônio, teff, amaranto, kamut e outros. Espera-se que o trigo domine a participação de mercado em 2025 e seja o segmento de crescimento mais rápido devido à sua disponibilidade na região Ásia-Pacífico, preço acessível e ampla utilização nas indústrias de alimentos e rações. A crescente demanda por grãos ancestrais, como quinoa e amaranto, deverá impulsionar o crescimento nos segmentos de cereais especiais e saudáveis durante o período previsto.
- Por forma de produto
Com base no formato do produto, o mercado de cereais é segmentado em grãos integrais, farinha, grãos em flocos, grãos laminados, grãos tufados, farinha moída, grãos quebrados, amido, farelo, gérmen e outros. Os grãos integrais detinham a maior participação em 2025 e prevê-se que sejam o segmento de crescimento mais rápido no mercado, impulsionado pela crescente conscientização sobre dietas ricas em fibras e preferências por rótulos limpos.
Espera-se que a farinha e o farelo apresentem o CAGR mais rápido entre 2025 e 2032, devido ao seu uso em panificação e alimentos saudáveis.
- Por nível de processamento
Com base no nível de processamento, o mercado de cereais é segmentado em fortificados, descascados, polidos, pré-cozidos, misturados, instantâneos, germinados, torrados, extrusados, parcialmente cozidos, micronizados, crus, totalmente cozidos, cozidos no vapor, temperados, adoçados, revestidos e outros. Os fortificados dominaram a participação de mercado em 2024 e devem ser o segmento de crescimento mais rápido devido aos seus benefícios nutricionais adicionais, enquanto os formatos instantâneos e pré-cozidos estão impulsionando a demanda entre as populações urbanas por soluções de refeições que economizem tempo.
- Por formato de consumo
Com base no formato de consumo, o mercado de cereais é segmentado em: cereais para consumo com leite/iogurte, barras para viagem, mingaus, lanches secos, pacotes de lanche, prontos para cozinhar, prontos para aquecer, ingredientes para misturar, com infusão em bebidas, entre outros. Espera-se que os cereais para consumo com colher dominem a fatia de mercado em 2025 e sejam o segmento de crescimento mais rápido devido ao seu uso convencional, enquanto os cereais prontos para cozinhar e os pacotes de lanche devem apresentar rápido crescimento devido à sua portabilidade e conveniência.
- Por categoria de produto
Com base na categoria de produto, o mercado de cereais é segmentado em ingredientes para panificação (misturas de farinha/grãos), cereais matinais, matérias-primas/rações animais, snacks de cereais, misturas instantâneas para cereais, cereais infantis, kits de refeição à base de cereais, insumos para cervejaria/destilaria, entre outros. Os cereais matinais detinham a maior participação em 2025 e prevê-se que sejam o segmento de crescimento mais rápido no mercado devido ao seu amplo consumo, enquanto os snacks de cereais e os cereais infantis devem crescer rapidamente devido às mudanças nos padrões alimentares e à parentalidade focada na saúde.
- Por natureza
Com base na natureza, o mercado de cereais é segmentado em convencionais e orgânicos. Os cereais convencionais dominaram o mercado em 2024, devido à acessibilidade e às cadeias de suprimentos estabelecidas.
A projeção é que os cereais orgânicos apresentem o crescimento mais rápido entre 2025 e 2032, impulsionados pela crescente demanda dos consumidores por produtos sem pesticidas e com rótulos limpos.
- Por categoria
Com base na categoria, o mercado de cereais é segmentado em cereais à base de OGM e cereais com certificação não OGM. O segmento com certificação não OGM dominou o mercado em 2024 e espera-se que cresça rapidamente devido à crescente conscientização e preferência do consumidor por grãos de origem natural, especialmente na região da Ásia-Pacífico.
- Por Benefícios Funcionais
Com base nos benefícios funcionais, o mercado de cereais é segmentado em: enriquecidos com vitaminas, ricos em fibras, com baixo ou nenhum teor de açúcar, ricos em proteínas, sem glúten, saudáveis para o coração, enriquecidos com probióticos/prebióticos, redutores de colesterol, com baixo índice glicêmico, enriquecidos com ômega-3, com baixo teor de gordura, sem alérgenos, ricos em ferro, com baixo ou nenhum teor de sal, adequados para a dieta paleolítica, adequados para a dieta cetogênica, com certificação vegana, entre outros. Cereais ricos em fibras e saudáveis para o coração dominam e devem ser o segmento de crescimento mais rápido no mercado devido ao foco crescente em saúde preventiva e controle de peso.
- Por prazo de validade
Com base na vida útil, o mercado de cereais é segmentado em longo prazo (estáveis em temperatura ambiente), médio prazo e curto prazo (perecíveis). Os cereais com longa vida útil lideram o mercado e devem ser o segmento de crescimento mais rápido devido à sua durabilidade e vantagens logísticas, especialmente nos mercados varejista e de exportação.
- Por embalagem
Com base na embalagem, o mercado de cereais é segmentado em caixa, bolsa, saco, sachê/stick pack, saco (a granel), pote, Tetra Pack/cartão asséptico, lata, tambor, embalagens ecológicas e outros. Caixas e bolsas detinham a maior participação em 2025 e prevê-se que sejam o segmento de crescimento mais rápido no mercado varejista, enquanto as embalagens ecológicas devem apresentar rápido crescimento devido a soluções de embalagem sustentáveis e econômicas. A preferência do consumidor por formatos resseláveis, leves e ecológicos impulsiona o crescimento, especialmente nos setores de alimentos, cuidados pessoais e comércio eletrônico, com foco em frescor e redução de desperdício.
- Por tamanho da embalagem
Com base no tamanho da embalagem, o mercado de cereais é segmentado em embalagens pequenas (51 g a 250 g), embalagens médias (251 g a 500 g), embalagens grandes (501 g a 1 kg), embalagens individuais (abaixo de 50 g), embalagens extragrandes (1,1 kg a 2,5 kg) e embalagens a granel (acima de 2,5 kg). As embalagens pequenas e médias detinham a maior participação em 2025 e devem ser o segmento de crescimento mais rápido no mercado devido à sua acessibilidade e adequação a domicílios individuais, enquanto as embalagens a granel são comuns em vendas B2B e institucionais.
- Por faixa de preço
Com base na faixa de preço, o mercado de cereais é segmentado em econômico (até US$ 2,49), médio (US$ 2,50 a US$ 6,99) e premium (US$ 7,00 ou mais). O segmento médio deteve a maior participação em 2025 e prevê-se que seja o de crescimento mais rápido no mercado devido ao seu equilíbrio entre preço acessível e qualidade, enquanto os cereais premium estão ganhando força nos mercados urbanos com o aumento da renda disponível.
- Por canal de distribuição
Com base no canal de distribuição, o mercado de cereais é segmentado em B2B e B2C. O B2C detinha a maior participação em 2025 e deverá ser o segmento de crescimento mais rápido do mercado, devido à maioria das vendas serem feitas por meio de supermercados, lojas de conveniência e plataformas online, enquanto o segmento B2B é impulsionado por serviços de alimentação, fornecimento institucional e uso industrial.
Análise Regional do Mercado de Cereais
- O mercado de cereais da Ásia-Pacífico teve uma participação de receita de 22,36% em 2024, impulsionado pelo alto consumo de cereais prontos para consumo, forte presença da marca e ampla disponibilidade em formatos de varejo modernos.
- A região se beneficia de uma indústria de processamento de alimentos madura, da crescente demanda por cereais orgânicos e fortificados e da inovação contínua de empresas importantes como Kellogg's, General Mills e Post Holdings. Além disso, a crescente preferência do consumidor por opções de café da manhã práticas e saudáveis consolida ainda mais a liderança de mercado na Ásia-Pacífico.
Visão do mercado de cereais da China
O mercado de cereais da China, que capturou a maior fatia da receita na região Ásia-Pacífico, com mais de 14,44% em 2024, deve crescer de forma constante durante o período previsto, impulsionado pelo alto consumo per capita de cereais, fidelidade à marca e uma rede de varejo bem estabelecida. Grandes players como General Mills, Kellogg's, Post Holdings e Quaker (PepsiCo) dominam o mercado com uma ampla gama de cereais prontos para consumo e funcionais. A demanda por cereais orgânicos, ricos em fibras e proteínas continua crescendo, refletindo as tendências em evolução de saúde e bem-estar.
Visão do mercado de cereais da Índia
O mercado indiano de cereais, que capturou a maior fatia da receita na região Ásia-Pacífico, com mais de 13,38% em 2024, projeta um crescimento constante durante o período previsto, impulsionado pela crescente conscientização sobre saúde, urbanização e crescente demanda por opções alimentares práticas e nutritivas. O crescimento é sustentado pela expansão dos canais de varejo, programas governamentais de nutrição e inovações em cereais integrais, orgânicos e prontos para consumo.
Participação no Mercado de Cereais
O mercado de cereais é liderado principalmente por empresas bem estabelecidas, incluindo:
- Bagrry's (Índia)
- KWALITY (Índia)
- Marico (Índia)
- Sanatório (Austrália)
Últimos desenvolvimentos no mercado de cereais da Ásia-Pacífico
- Em março de 2025 , a General Mills lançou uma nova linha de cereais matinais ricos em proteína sob a marca "Nature Valley", voltada para consumidores preocupados com a saúde e entusiastas do fitness. O produto inclui variantes fortificadas com proteína de soro de leite, fibras e zero adição de açúcar, em linha com a crescente demanda por alimentos funcionais.
- Em janeiro de 2025 , a Kellogg's anunciou sua expansão estratégica para o Sudeste Asiático com uma nova unidade fabril no Vietnã para atender à crescente demanda regional por soluções práticas para o café da manhã. A fábrica produzirá uma variedade de cereais adaptados às preferências locais, incluindo opções com baixo teor de açúcar e à base de plantas.
- Em outubro de 2024 , a Nestlé firmou parceria com a Danone e uma startup de tecnologia da saúde para desenvolver em conjunto uma plataforma de nutrição personalizada. A plataforma utiliza dados alimentares dos consumidores para recomendar cereais ricos em nutrientes específicos, como ômega-3, fibras e ferro, inaugurando uma nova era de nutrição de precisão na categoria de café da manhã.
- Em abril de 2025 , a Post Holdings lançou embalagens sustentáveis para sua linha de cereais "Honey Bunches of Oats". As novas embalagens recicláveis e biodegradáveis reforçam o compromisso da empresa de reduzir o uso de plástico em 50% até 2030 e atender consumidores ecoconscientes.
- Em fevereiro de 2025 , a marca “Saffola” da Marico lançou cereais à base de milheto na linha “Healthy Crunch” na Índia. O lançamento está alinhado à iniciativa do Ano Internacional do Milheto e aborda a crescente popularidade de grãos ancestrais em fórmulas modernas de café da manhã.
SKU-
Obtenha acesso online ao relatório sobre a primeira nuvem de inteligência de mercado do mundo

- Painel interativo de análise de dados
- Painel de análise da empresa para oportunidades de elevado potencial de crescimento
- Acesso de analista de pesquisa para personalização e customização. consultas
- Análise da concorrência com painel interativo
- Últimas notícias, atualizações e atualizações Análise de tendências
- Aproveite o poder da análise de benchmark para um rastreio abrangente da concorrência
Índice
1 INTRODUÇÃO
1.1 OBJETIVOS DO ESTUDO
1.2 DEFINIÇÃO DE MERCADO
1.3 VISÃO GERAL
1.4 LIMITAÇÕES
1,5 MERCADOS COBERTOS
2 SEGMENTAÇÃO DE MERCADO
2.1 MERCADOS COBERTOS
2.2 ÂMBITO GEOGRÁFICO
2,3 ANOS CONSIDERADOS PARA O ESTUDO
2.4 MOEDA E PREÇOS
2.5 MODELO DE VALIDAÇÃO DE DADOS TRIPÉ DBMR
2.6 MODELAGEM MULTIVARIADA
2.7 ENTREVISTAS PRINCIPAIS COM PRINCIPAIS LÍDERES DE OPINIÃO
2.8 GRADE DE POSIÇÃO DE MERCADO DBMR
2.9 ANÁLISE DE PARTICIPAÇÃO DE FORNECEDORES DBMR
2.1 FONTES SECUNDÁRIAS
2.11 PREMISSAS
3 RESUMO EXECUTIVO
4 INSIGHTS PREMIUM
4.1 CINCO FORÇAS DE PORTERS:-
4.1.1 INTENSIDADE DA RIVALIDADE COMPETITIVA (ALTA)
4.1.2 PODER DE BARGANHA DOS COMPRADORES/CONSUMIDORES (ALTO)
4.1.3 AMEAÇA DE NOVOS ENTRADANTES (BAIXA A MODERADA)
4.1.4 AMEAÇA DE PRODUTOS SUBSTITUTOS (MODERADA A ALTA)
4.1.5 PODER DE BARGANHA DOS FORNECEDORES (MODERADO)
4.2 PERSPECTIVA DA MARCA
4.2.1 ANÁLISE COMPARATIVA DE MARCAS
4.2.2 VISÃO GERAL DO PRODUTO E DA MARCA
4.3 ESTRATÉGIAS DE CRESCIMENTO ADOTADAS PELOS PRINCIPAIS ATORES DO MERCADO:
4.4 FATORES QUE INFLUENCIAM A DECISÃO DE COMPRA DOS USUÁRIOS FINAIS
4.5 IMPACTO DA DESACELERAÇÃO ECONÔMICA NO MERCADO
4.5.1 IMPACTO NO PREÇO
4.5.2 IMPACTO NA CADEIA DE SUPRIMENTOS
4.5.3 IMPACTO NA REMESSA
4.5.4 IMPACTO NAS DECISÕES ESTRATÉGICAS DA EMPRESA
4.6 QUADRO REGULAMENTAR E DIRETRIZES
4.7 CADEIA DE VALOR
4.7.1 CADEIA DE VALOR DO MERCADO DE CEREAIS DA ÁSIA-PACÍFICO
4.7.2 PRODUÇÃO:
4.7.3 PROCESSAMENTO:
4.7.4 MARKETING/DISTRIBUIÇÃO:
4.7.5 COMPRADORES:
4.8 ANÁLISE DA CADEIA DE SUPRIMENTOS
4.9 DETALHAMENTO DA ANÁLISE DE CUSTOS
4.1 CENÁRIO DE MARGENS DE LUCRO
4.11 RASTREADOR DE INOVAÇÃO E ANÁLISE ESTRATÉGICA
4.11.1 ANÁLISE DE GRANDES NEGÓCIOS E ALIANÇAS ESTRATÉGICAS
4.11.1.1 JOINT VENTURES
4.11.1.2 FUSÕES E AQUISIÇÕES
4.11.1.3 LICENCIAMENTO E PARCERIA
4.11.1.4 COLABORAÇÕES DE TECNOLOGIA
4.11.1.5 DESINVESTIMENTOS ESTRATÉGICOS
4.12 ANÁLISE DE PREÇOS
4.13 ANÁLISE DE PATENTES
4.13.1 QUALIDADE E RESISTÊNCIA DA PATENTE
4.13.2 FAMÍLIAS DE PATENTES
4.13.3 NÚMERO DE FAMÍLIAS DE PATENTES INTERNACIONAIS POR ANO DE PUBLICAÇÃO
4.13.4 LICENCIAMENTO E COLABORAÇÕES
4.13.5 CENÁRIO DE PATENTES DA EMPRESA
4.13.6 CENÁRIO DE PATENTES DA REGIÃO
4.14 ESTRATÉGIA E GESTÃO DE PI
4.14.1 ANÁLISE DE PATENTES
4.14.2 CENÁRIO DE MARGENS DE LUCRO
4.15 IMPACTO DA DESACELERAÇÃO ECONÔMICA NO MERCADO DE CEREAIS DA ÁSIA-PACÍFICO
4.15.1 IMPACTO NOS PREÇOS
4.15.2 IMPACTO NA CADEIA DE SUPRIMENTOS
4.15.3 IMPACTO NA REMESSA
4.15.4 IMPACTO NA DEMANDA
4.15.5 IMPACTO NAS DECISÕES ESTRATÉGICAS
4.16 ANÁLISE DA CADEIA DE SUPRIMENTOS
4.16.1 VISÃO GERAL
4.16.2 TIPOS DE CUSTOS LOGÍSTICOS ENVOLVIDOS
4.16.3 FATORES QUE INFLUENCIAM CADA TIPO DE CUSTO
4.16.4 ESTRATÉGIAS PARA MINIMIZAR CUSTOS LOGÍSTICOS
4.16.5 IMPORTÂNCIA DOS PRESTADORES DE SERVIÇOS LOGÍSTICOS
4.17 ANÁLISE DE ECOSSISTEMAS DA INDÚSTRIA
4.17.1 EMPRESAS DESTACADAS
4.17.2 PEQUENAS E MÉDIAS EMPRESAS
4.17.3 USUÁRIOS FINAIS
4.18 ANÁLISE DE PRODUÇÃO E CONSUMO
4.19 ANÁLISE DE FORNECIMENTO DE MATÉRIA-PRIMA (MERCADO DE CEREAIS DA ÁSIA-PACÍFICO)
4.2 VISÃO GERAL DAS INOVAÇÕES TECNOLÓGICAS
4.20.1 VISÃO GERAL:
4.21 TARIFAS E IMPACTO NO MERCADO
4.21.1 TARIFA(S) ATUAL(AIS) NOS 5 PRINCIPAIS MERCADOS DO PAÍS
4.21.2 PERSPECTIVAS: PRODUÇÃO LOCAL V/S DEPENDÊNCIA DE IMPORTAÇÕES
4.21.3 DINÂMICA DOS CRITÉRIOS DE SELEÇÃO DE FORNECEDORES
4.21.4 IMPACTO NA CADEIA DE SUPRIMENTOS
4.21.4.1 AQUISIÇÃO DE MATÉRIA-PRIMA
4.21.4.2 FABRICAÇÃO E PRODUÇÃO
4.21.4.3 LOGÍSTICA E DISTRIBUIÇÃO
4.21.4.4 PREÇO DE APRESENTAÇÃO E POSICIONAMENTO DE MERCADO
4.21.5 PARTICIPANTES DA INDÚSTRIA: MOVIMENTOS PROATIVOS
4.21.5.1 OTIMIZAÇÃO DA CADEIA DE SUPRIMENTOS
4.21.5.2 ESTABELECIMENTOS DE JOINT VENTURE
4.21.6 IMPACTO NOS PREÇOS
4.21.7 INCLINAÇÃO REGULAMENTAR
4.21.7.1 SITUAÇÃO GEOPOLÍTICA
4.21.7.2 PARCERIAS COMERCIAIS ENTRE OS PAÍSES
4.21.8 ACORDOS DE LIVRE COMÉRCIO
4.21.9 ESTABELECIMENTOS DE ALIANÇAS
4.21.10 ACREDITAÇÃO DE STATUS (INCLUINDO MFTN)
4.21.11 CURSO CORRETIVO DOMÉSTICO
4.21.12 PLANOS DE INCENTIVO PARA AUMENTAR A PRODUÇÃO
4.21.13 CRIAÇÃO DE ZONAS ECONÔMICAS ESPECIAIS/PARQUES INDUSTRIAIS
5 VISÃO GERAL DO MERCADO
5.1 MOTORISTAS
5.1.1 CRESCENTE DEMANDA POR ALIMENTOS NUTRICIONAIS E FUNCIONAIS
5.1.2 URBANIZAÇÃO E MUDANÇA DE ESTILOS DE VIDA IMPULSIONANDO CEREAIS PRONTOS PARA CONSUMO
5.1.3 SURTO DE INGREDIENTES VEGETAIS E FUNCIONAIS IMPULSIONADO POR PREOCUPAÇÕES COM A SAÚDE E O MEIO AMBIENTE
5.2 RESTRIÇÕES
5.2.1 FLUTUAÇÃO DOS PREÇOS DAS MATÉRIAS-PRIMAS E RISCOS CLIMÁTICOS
5.2.2 CRÍTICAS CRESCENTES SOBRE A ADIÇÃO DE AÇÚCAR E PROCESSAMENTO
5.3 OPORTUNIDADES
5.3.1 OS CONSUMIDORES ESTÃO CADA VEZ MAIS ESCOLHENDO CEREAIS RICO EM FIBRAS, BAIXO EM AÇÚCAR E ORGÂNICOS
5.3.2 A CRESCENTE MUDANÇA EM DIREÇÃO A PADRÕES DIETÉTICOS À BASE DE PLANTAS INFLUENCIANDO AS PREFERÊNCIAS DO CONSUMIDOR.
5.3.3 MERCEARIA ONLINE QUE PERMITE QUE MARCAS DE CEREAIS VENDA DIRETAMENTE, COLETE DADOS DO CONSUMIDOR E OFEREÇA ASSINATURAS
5.4 DESAFIOS
5.4.1 OBSTÁCULOS SIGNIFICATIVOS PARA AS CADEIAS DE SUPRIMENTOS DEVIDO A INTERRUPÇÕES LOGÍSTICAS, REGULAMENTAÇÕES COMPLEXAS E REDES DE DISTRIBUIÇÃO INEFICIENTES
5.4.2 AUMENTO DA CONCORRÊNCIA DE ALTERNATIVAS COMO GRANOLA, BARRAS DE PROTEÍNA, SMOOTHIES, IOGURTE E CAFÉS DA MANHÃ ÉTNICOS
6 MERCADO DE CEREAIS DA ÁSIA-PACÍFICO, POR TIPO DE CEREAL
6.1 VISÃO GERAL
6.2 TRIGO
6.2.1 TRIGO, POR TIPO
6.3 ARROZ
6.3.1 ARROZ, POR TIPO
6.4 MILHO
6.4.1 MILHO, POR TIPO
6,5 CEVADA
6.5.1 CEVADA, POR TIPO
6.6 AVEIA
6.6.1 AVEIA, POR TIPO
6.7 CENTEIO
6.7.1 CENTEIO, POR TIPO
6.8 SORGO
6.8.1 SORGO, POR TIPO
6,9 MILHO
6.9.1 MILLET, POR TIPO
6.1 QUINOA
6.10.1 QUINOA, POR TIPO
6.11 TRIGO SARRACENO
6.12 TRITICALE
6.13 FÔNIO
6.14 TEFF
6.15 AMARANTO
6.16 KAMUT
6.17 OUTROS
7 MERCADO DE CEREAIS DA ÁSIA-PACÍFICO, FORMA DO PRODUTO
7.1 VISÃO GERAL
7.2 GRÃOS INTEIROS
7.3 FARINHA
7.4 GRÃOS EM FLOCOS
7,5 GRÃOS LAMINADOS
7.6 GRÃOS INFLADOS
7.7 FARINHA DE TRIGO
7.8 GRÃOS QUEBRADOS
7,9 AMIDO
7.1 FARELO
7.11 GERME
7.12 OUTROS
8 MERCADO DE CEREAIS DA ÁSIA-PACÍFICO, POR NÍVEL DE PROCESSAMENTO
8.1 VISÃO GERAL
8.2 FORTIFICADO
8.3 DESCASCADO
8.4 POLIDO
8.5 PRÉ-COZIDO
8.6 MISTURADO
8.7 INSTANT
8.8 BROTOS
8.9 TORRADO
8.1 EXTRUDADO
8.11 PARCIALMENTE COZIDO
8.12 MICRONIZADO
8.13 RAW
8.14 TOTALMENTE COZIDO
8.15 COZIDO NO VAPOR
8.16 TEMPERADO
8.17 ADOÇADO
8.18 REVESTIDO
8.19 OUTROS
9 MERCADO DE CEREAIS DA ÁSIA-PACÍFICO, POR FORMATO DE CONSUMO
9.1 VISÃO GERAL
9.2 COMIDO À COLHER COM LEITE/IOGURTE
9.3 BARES PARA VIAGEM
9.4 MINGAU
9.5 LANCHE SECO
9.6 PACOTES DE LANCHE
9.7 PRONTO PARA COZINHAR
9.8 PRONTO PARA AQUECER
9.9 INGREDIENTES PARA MISTURAR
9.1 COM INFUSÃO DE BEBIDA
9.11 OUTROS
10 MERCADOS DE CEREAIS DA ÁSIA-PACÍFICO, POR CATEGORIA DE PRODUTO
10.1 VISÃO GERAL
10.2 INGREDIENTES DE PADARIA (MISTURAS DE FARINHA/GRÃOS)
10.3 CEREAIS DE CAFÉ DA MANHÃ
10.3.1 CEREAIS MATINAIS, POR TIPO
10.3.1.1 Pronto para consumo (RTE), por tipo
10.3.1.2 Cereais Quentes, Por Tipo
10.4 MATÉRIA-PRIMA/RAÇÃO ANIMAL
10.5 LANCHES DE CEREAIS
10.5.1 LANCHES DE CEREAIS, POR TIPO
10.6 MISTURAS DE CEREAIS INSTANTÂNEOS
10.7 CEREAIS INFANTIS
10.7.1 CEREAIS INFANTIS, POR TIPO
10.8 KITS DE REFEIÇÃO À BASE DE CEREAIS
10.9 INSUMOS PARA CERVEJARIA/DESTILIZAÇÃO
10.1 OUTROS
11 MERCADO DE CEREAIS DA ÁSIA-PACÍFICO, POR NATUREZA
11.1 VISÃO GERAL
11.2 CONVENCIONAL
11.3 ORGÂNICO
12 MERCADO DE CEREAIS DA ÁSIA-PACÍFICO, POR CATEGORIA
12.1 VISÃO GERAL
12.2 À BASE DE OGM
12.3 CERTIFICADO NÃO-OGM
13 MERCADO DE CEREAIS DA ÁSIA-PACÍFICO, POR BENEFÍCIOS FUNCIONAIS
13.1 VISÃO GERAL
13.2 FORTIFICADO COM VITAMINAS
13.3 RICO EM FIBRAS
13.4 BAIXO/SEM AÇÚCAR
13,5 ALTO TEOR DE PROTEÍNA
13.6 SEM GLÚTEN
13.7 SAUDÁVEL PARA O CORAÇÃO
13.8 PROBIÓTICO/PREBIÓTICO ENRIQUECIDO
13.9 REDUZ O COLESTEROL
13.1 BAIXO ÍNDICE GLICÊMICO
13.11 ENRIQUECIDO COM ÔMEGA-3
13.12 BAIXO TEOR DE GORDURA
13.13 SEM ALERGÊNICOS
13.14 ALTO FERRO
13.15 BAIXO/SEM SAL
13.16 PALEO-AMIGÁVEL
13.17 KETO-FRIENDLY
13.18 CERTIFICADO VEGANO
13.19 OUTROS
14 MERCADO DE CEREAIS DA ÁSIA-PACÍFICO, POR VALIDADE
14.1 VISÃO GERAL
14.2 LONGO PRAZO (ESTÁVEL EM PRATELEIRA AMBIENTE)
14.3 MÉDIO PRAZO
14.4 CURTO PRAZO (PERECÍVEIS)
15 MERCADO DE CEREAIS DA ÁSIA-PACÍFICO, POR EMBALAGEM
15.1 VISÃO GERAL
15.2 CAIXA
15.2.1 CAIXA, POR TIPO
BOLSA 15.3
15.3.1 BOLSA, POR TIPO
15.4 SACO
15.4.1 SACO, POR TIPO
15,5 SACHÊS/EMBALAGEM DE STICK
15,6 SACO (A GRANEL)
15,7 JARRAS
15.7.1 JAR, POR TIPO
15,8 TETRA PACK / CAIXA ASSÉPTICA
15.9 CANISTER
15.1 TAMBOR
15.11 EMBALAGEM ECOLÓGICA
15.11.1 EMBALAGEM ECOLÓGICA, POR TIPO
15.12 OUTROS
16 MERCADO DE CEREAIS DA ÁSIA-PACÍFICO, POR TAMANHO DE EMBALAGEM
16.1 VISÃO GERAL
16.2 PACOTES PEQUENOS (51G–250G)
16.3 EMBALAGENS MÉDIAS (251G–500G)
16,4 PACOTES GRANDES (501G–1KG)
16,5 PACOTES DE PORÇÃO INDIVIDUAL (ABAIXO DE 50G)
16,6 PACOTES EXTRA GRANDES (1,1 KG–2,5 KG)
16.7 PACOTES A GRANEL (ACIMA DE 2,5 KG)
17 MERCADO DE CEREAIS DA ÁSIA-PACÍFICO, POR FAIXA DE PREÇO
17.1 VISÃO GERAL
17.2 ECONOMIA (ATÉ USD 2,49)
17.3 MÉDIO (US$ 2,50-6,99)
17.4 PREMIUM (USD 7,00 E ACIMA)
18 MERCADO DE CEREAIS DA ÁSIA-PACÍFICO, POR CANAL DE DISTRIBUIÇÃO
18.1 VISÃO GERAL
18.2 B2B
18.3 B2C
18.3.1 B2C, POR TIPO
18.3.2 ONLINE, POR TIPO
18.3.3 OFFLINE, POR TIPO
19 MERCADO DE CEREAIS DA ÁSIA-PACÍFICO, POR REGIÃO
19.1 ÁSIA-PACÍFICO
19.1.1 CHINA
19.1.2 ÍNDIA
19.1.3 JAPÃO
19.1.4 AUSTRÁLIA
19.1.5 COREIA DO SUL
19.1.6 MALÁSIA
19.1.7 SINGAPURA
19.1.8 TAILÂNDIA
19.1.9 FILIPINAS
19.1.10 INDONÉSIA
19.1.11 NOVA ZELÂNDIA
19.1.12 HONG KONG
19.1.13 TAIWAN
19.1.14 RESTO DA ÁSIA-PACÍFICO
20 MERCADO DE CEREAIS DA ÁSIA-PACÍFICO
20.1 ANÁLISE DE AÇÕES DA EMPRESA: GLOBAL
21 ANÁLISE SWOT
22 PERFIS DE EMPRESAS
22.1 NESTLÉ
22.1.1 RESUMO DA EMPRESA
22.1.2 ANÁLISE DE RECEITA
22.1.3 ANÁLISE DAS AÇÕES DA EMPRESA
22.1.4 PORTFÓLIO DE MARCAS
22.1.5 DESENVOLVIMENTO RECENTE
22.2 ASSOCIATED BRITISH FOODS PLC
22.2.1 RESUMO DA EMPRESA
22.2.2 ANÁLISE DE RECEITA
22.2.3 ANÁLISE DAS AÇÕES DA EMPRESA
22.2.4 PORTFÓLIO DE NEGÓCIOS
22.2.5 NOTÍCIAS RECENTES
22.3 GENERAL MILLS INC.
22.3.1 RESUMO DA EMPRESA
22.3.2 ANÁLISE DE RECEITA
22.3.3 ANÁLISE DE AÇÕES DA EMPRESA
22.3.4 PORTFÓLIO DE MARCAS
22.3.5 DESENVOLVIMENTO RECENTE
22.4 POST HOLDINGS, INC.
22.4.1 RESUMO DA EMPRESA
22.4.2 ANÁLISE DE RECEITA
22.4.3 ANÁLISE DE AÇÕES DA EMPRESA
22.4.4 PORTFÓLIO DE MARCAS
22.4.5 DESENVOLVIMENTO RECENTE
22,5 SEMANAS KELLOGG CO
22.5.1 RESUMO DA EMPRESA
22.5.2 ANÁLISE DE RECEITA
22.5.3 ANÁLISE DE AÇÕES DA EMPRESA
22.5.4 PORTFÓLIO DE MARCAS
22.5.5 DESENVOLVIMENTO RECENTE
22.6 BAGRRY'S
22.6.1 RESUMO DA EMPRESA
22.6.2 PORTFÓLIO DE PRODUTOS
22.6.3 DESENVOLVIMENTOS/NOTÍCIAS RECENTES
22.7 B&G ALIMENTOS, INC.
22.7.1 RESUMO DA EMPRESA
22.7.2 ANÁLISE DE RECEITA
22.7.3 PORTFÓLIO DE PRODUTOS
22.7.4 DESENVOLVIMENTO RECENTE
22.8 PADARIA DA BARBARA
22.8.1 RESUMO DA EMPRESA
22.8.2 PORTFÓLIO DE PRODUTOS
22.8.3 DESENVOLVIMENTO RECENTE
22.9 BIO-FAMÍLIA EN
22.9.1 RESUMO DA EMPRESA
22.9.2 PORTFÓLIO DE PRODUTOS
22.9.3 DESENVOLVIMENTOS/NOTÍCIAS RECENTES
22.1 ALIMENTOS NATURAIS DO BOB'S RED MILL
22.10.1 RESUMO DA EMPRESA
22.10.2 PORTFÓLIO DE PRODUTOS
22.10.3 DESENVOLVIMENTOS/NOTÍCIAS RECENTES
22.11 CEREAL BIO
22.11.1 RESUMO DA EMPRESA
22.11.2 PORTFÓLIO DE PRODUTOS
22.11.3 DESENVOLVIMENTO RECENTE
22.12 CLEXTRAL
22.12.1 RESUMO DA EMPRESA
22.12.2 PORTFÓLIO DE PRODUTOS
22.12.3 DESENVOLVIMENTO RECENTE
22.13 DR. OETKER
22.13.1 RESUMO DA EMPRESA
22.13.2 ANÁLISE DE RECEITA
22.13.3 PORTFÓLIO DE PRODUTOS
22.13.4 DESENVOLVIMENTOS/NOTÍCIAS RECENTES
22.14 GRUPO DE HERÓIS
22.14.1 RESUMO DA EMPRESA
22.14.2 ANÁLISE DE RECEITA
22.14.3 PORTFÓLIO DE PRODUTOS
22.14.4 DESENVOLVIMENTOS/NOTÍCIAS RECENTES
22.15 KASHI LLC
22.15.1 RESUMO DA EMPRESA
22.15.2 PORTFÓLIO DE PRODUTOS
22.15.3 DESENVOLVIMENTO RECENTE
22.16 KWALIDADE
22.16.1 RESUMO DA EMPRESA
22.16.2 PORTFÓLIO DE PRODUTOS
22.16.3 DESENVOLVIMENTO RECENTE
22.17 LIMAGRÃO - INGREDIENTES
22.17.1 RESUMO DA EMPRESA
22.17.2 PORTFÓLIO DE PRODUTOS
22.17.3 DESENVOLVIMENTO RECENTE
22.18 MARICO
22.18.1 RESUMO DA EMPRESA
22.18.2 ANÁLISE DE RECEITA
22.18.3 PORTFÓLIO DE MARCAS
22.18.4 DESENVOLVIMENTOS/NOTÍCIAS RECENTES
22.19 CEREAIS DE CAFÉ DA MANHÃ MULDER
22.19.1 RESUMO DA EMPRESA
22.19.2 PORTFÓLIO DE PRODUTOS
22.19.3 DESENVOLVIMENTO RECENTE
22.2 CAMINHO DA NATUREZA
22.20.1 RESUMO DA EMPRESA
22.20.2 PORTFÓLIO DE PRODUTOS
22.20.3 DESENVOLVIMENTO RECENTE
22.21 PEPSICO
22.21.1 RESUMO DA EMPRESA
22.21.2 ANÁLISE DE RECEITA
22.21.3 PORTFÓLIO DE PRODUTOS
22.21.4 DESENVOLVIMENTO RECENTE
22.22 SAÚDE RUDE
22.22.1 RESUMO DA EMPRESA
22.22.2 PORTFÓLIO DE PRODUTOS
22.22.3 DESENVOLVIMENTOS/NOTÍCIAS RECENTES
22.23 SANITÁRIO
22.23.1 RESUMO DA EMPRESA
22.23.2 PORTFÓLIO DE PRODUTOS
22.23.3 RECENT DEVELOPMENT
22.24 SEITENBACHER
22.24.1 COMPANY SNAPSHOT
22.24.2 PRODUCT PORTFOLIO
22.24.3 RECENT DEVELOPMENTS/NEWS
22.25 SEVEN SUNDAYS
22.25.1 COMPANY SNAPSHOT
22.25.2 PRODUCT PORTFOLIO
22.25.3 RECENT DEVELOPMENTS/NEWS
22.26 SURREAL UK
22.26.1 COMPANY SNAPSHOT
22.26.2 PRODUCT PORTFOLIO
22.26.3 RECENT DEVELOPMENTS/NEWS
22.27 THE HAIN CELESTIAL GROUP, INC.
22.27.1 COMPANY SNAPSHOT
22.27.2 REVENUE ANALYSIS
22.27.3 BRAND PORTFOLIO
22.27.4 RECENT DEVELOPMENTS/NEWS
22.28 THE QUAKER OATS COMPANY
22.28.1 COMPANY SNAPSHOT
22.28.2 PRODUCT PORTFOLIO
22.28.3 RECENT DEVELOPMENTS/NEWS
22.29 THE SILVER PALATE
22.29.1 COMPANY SNAPSHOT
22.29.2 PRODUCT PORTFOLIO
22.29.3 RECENT DEVELOPMENT
22.3 WEETABIX
22.30.1 COMPANY SNAPSHOT
22.30.2 PRODUCT PORTFOLIO
22.30.3 RECENT DEVELOPMENTS/NEWS
23 QUESTIONNAIRE
24 RELATED REPORTS
Lista de Tabela
TABELA 1 RESUMO DO POSICIONAMENTO COMPETITIVO:
TABELA 2 ANÁLISE COMPARATIVA DE MARCAS
TABELA 3 EXPORTAÇÃO
TABELA 4 IMPORTAÇÃO
TABELA 5 CUSTO DOS EQUIPAMENTOS PRINCIPAIS E DAS FÁBRICAS DE PROCESSAMENTO DE CEREAIS EM GERAL
TABELA 6 CENÁRIOS DE MARGEM DE LUCRO
TABELA 7 COMPORTAMENTO DE COMPRA DO CONSUMIDOR
TABELA 8 PRODUÇÃO
TABELA 9 CONSUMO
TABELA 10 COMPORTAMENTO DE COMPRA DO CONSUMIDOR
TABELA 11 TAXAS DE TARIFAS DE IMPORTAÇÃO DE CEREAIS NOS 5 PRINCIPAIS MERCADOS (2024)
TABELA 12 PRODUÇÃO LOCAL V/S DEPENDÊNCIA DE IMPORTAÇÕES
TABELA 13 INCLINAÇÃO REGULAMENTAR
TABELA 14 PARCERIAS COMERCIAIS ENTRE OS PAÍSES
TABELA 15 ESTABELECIMENTOS DE ALIANÇAS
TABELA 16 ESTABELECIMENTO DE ZONAS ECONÔMICAS ESPECIAIS (ZEE) E PARQUES INDUSTRIAIS
TABELA 17 MERCADO DE CEREAIS DA ÁSIA-PACÍFICO, POR TIPO DE CEREAL, 2018-2032 (MIL USD)
TABELA 18 MERCADO DE CEREAIS DA ÁSIA-PACÍFICO, POR TIPO DE CEREAL, 2018-2032 (MIL TONELADAS)
TABELA 19 MERCADO DE TRIGO EM CEREAIS DA ÁSIA-PACÍFICO, POR REGIÃO, 2018-2032 (MIL USD)
TABELA 20 MERCADO DE TRIGO EM CEREAIS DA ÁSIA-PACÍFICO, POR TIPO, 2018-2032 (MIL USD)
TABELA 21 MERCADO DE ARROZ NA ÁSIA-PACÍFICO EM CEREAIS, POR REGIÃO, 2018-2032 (MIL USD)
TABELA 22 MERCADO DE ARROZ NA ÁSIA-PACÍFICO EM CEREAIS, POR TIPO, 2018-2032 (MIL USD)
TABELA 23 MILHO DA ÁSIA-PACÍFICO (MILHO) NO MERCADO DE CEREAIS, POR REGIÃO, 2018-2032 (MIL USD)
TABELA 24 MILHO DA ÁSIA-PACÍFICO NO MERCADO DE CEREAIS, POR TIPO, 2018-2032 (MIL USD)
TABELA 25 MERCADO DE CEVADA NA ÁSIA-PACÍFICO NO MERCADO DE CEREAIS, POR REGIÃO, 2018-2032 (MIL USD)
TABELA 26 CEVADA NA ÁSIA-PACÍFICO NO MERCADO DE CEREAIS, POR TIPO, 2018-2032 (MIL USD)
TABELA 27 AVEIA NO MERCADO DE CEREAIS DA ÁSIA-PACÍFICO, POR REGIÃO, 2018-2032 (MIL USD)
TABELA 28 AVEIA NO MERCADO DE CEREAIS DA ÁSIA-PACÍFICO, POR TIPO, 2018-2032 (MIL USD)
TABELA 29 CENTEIO NO MERCADO DE CEREAIS DA ÁSIA-PACÍFICO, POR REGIÃO, 2018-2032 (MIL USD)
TABELA 30 CENTEIO NO MERCADO DE CEREAIS DA ÁSIA-PACÍFICO, POR TIPO, 2018-2032 (MIL USD)
TABELA 31 MERCADO DE SORGO NA ÁSIA-PACÍFICO EM CEREAIS, POR REGIÃO, 2018-2032 (MIL USD)
TABELA 32 MERCADO DE SORGO NA ÁSIA-PACÍFICO EM CEREAIS, POR TIPO, 2018-2032 (MIL USD)
TABELA 33 MERCADO DE MILHO DA ÁSIA-PACÍFICO NO MERCADO DE CEREAIS, POR REGIÃO, 2018-2032 (MIL USD)
TABELA 34 MERCADO DE MILHO DA ÁSIA-PACÍFICO NO MERCADO DE CEREAIS, POR TIPO, 2018-2032 (MIL USD)
TABELA 35 QUINOA DA ÁSIA-PACÍFICO NO MERCADO DE CEREAIS, POR REGIÃO, 2018-2032 (MIL USD)
TABELA 36 QUINOA DA ÁSIA-PACÍFICO NO MERCADO DE CEREAIS, POR TIPO, 2018-2032 (MIL USD)
TABELA 37 MERCADO DE TRIGO SARRACENO NA ÁSIA-PACÍFICO, POR REGIÃO, 2018-2032 (MIL USD)
TABELA 38 TRITICALE NO MERCADO DE CEREAIS DA ÁSIA-PACÍFICO, POR REGIÃO, 2018-2032 (MIL USD)
TABELA 39 FONIO DA ÁSIA-PACÍFICO NO MERCADO DE CEREAIS, POR REGIÃO, 2018-2032 (MIL USD)
TABELA 40 MERCADO DE CEREAIS DE TEFF NA ÁSIA-PACÍFICO, POR REGIÃO, 2018-2032 (MIL USD)
TABELA 41 AMARANTO DA ÁSIA-PACÍFICO NO MERCADO DE CEREAIS, POR REGIÃO, 2018-2032 (MIL USD)
TABELA 42 OUTROS INGRESSOS NO MERCADO DE CEREAIS DA ÁSIA-PACÍFICO, POR REGIÃO, 2018-2032 (MIL USD)
TABELA 43 OUTROS INGRESSOS NO MERCADO DE CEREAIS DA ÁSIA-PACÍFICO, POR REGIÃO, 2018-2032 (MIL USD)
TABELA 44 MERCADO DE CEREAIS DA ÁSIA-PACÍFICO, POR FORMULÁRIO DE PRODUTO, 2018-2032 (MIL USD)
TABELA 45 GRÃOS INTEIROS NO MERCADO DE CEREAIS DA ÁSIA-PACÍFICO, POR REGIÃO, 2018-2032 (MIL USD)
TABELA 46 MERCADO DE FARINHA DE CEREAIS DA ÁSIA-PACÍFICO, POR REGIÃO, 2018-2032 (MIL USD)
TABELA 47 GRÃOS EM FLOCOS NO MERCADO DE CEREAIS DA ÁSIA-PACÍFICO, POR REGIÃO, 2018-2032 (MIL USD)
TABELA 48 GRÃOS LAMINADOS NO MERCADO DE CEREAIS DA ÁSIA-PACÍFICO, POR REGIÃO, 2018-2032 (MIL USD)
TABELA 49 GRÃOS TURBADOS NO MERCADO DE CEREAIS DA ÁSIA-PACÍFICO, POR REGIÃO, 2018-2032 (MIL USD)
TABELA 50 FARINHA DE TRIGO NO MERCADO DE CEREAIS DA ÁSIA-PACÍFICO, POR REGIÃO, 2018-2032 (MIL USD)
TABELA 51 GRÃOS FRAGMENTADOS NO MERCADO DE CEREAIS DA ÁSIA-PACÍFICO, POR REGIÃO, 2018-2032 (MIL USD)
TABELA 52 AMIDO NO MERCADO DE CEREAIS DA ÁSIA-PACÍFICO, POR REGIÃO, 2018-2032 (MIL USD)
TABELA 53 FARELO NO MERCADO DE CEREAIS DA ÁSIA-PACÍFICO, POR REGIÃO, 2018-2032 (MIL USD)
TABELA 54 GERME DA ÁSIA-PACÍFICO NO MERCADO DE CEREAIS, POR REGIÃO, 2018-2032 (MIL USD)
TABELA 55 OUTROS INDIVÍDUOS NO MERCADO DE CEREAIS DA ÁSIA-PACÍFICO, POR REGIÃO, 2018-2032 (MIL USD)
TABELA 56 MERCADO DE CEREAIS DA ÁSIA-PACÍFICO, POR NÍVEL DE PROCESSAMENTO, 2018-2032 (MIL USD)
TABELA 57 MERCADO DE CEREAIS FORTIFICADOS DA ÁSIA-PACÍFICO, POR REGIÃO, 2018-2032 (MIL USD)
TABELA 58 CEREAIS DESCASCADOS NO MERCADO DA ÁSIA-PACÍFICO, POR REGIÃO, 2018-2032 (MIL USD)
TABELA 59 ÁSIA-PACÍFICO POLIDO NO MERCADO DE CEREAIS, POR REGIÃO, 2018-2032 (USD MIL)
TABELA 60 MERCADO DE CEREAIS PRÉ-COZIDOS NA ÁSIA-PACÍFICO, POR REGIÃO, 2018-2032 (MIL USD)
TABELA 61 MERCADO DE CEREAIS MISTOS DA ÁSIA-PACÍFICO, POR REGIÃO, 2018-2032 (MIL USD)
TABELA 62 INSTANTÂNEO NO MERCADO DE CEREAIS DA ÁSIA-PACÍFICO, POR REGIÃO, 2018-2032 (MIL USD)
TABELA 63 CEREAIS GERMINADOS NA ÁSIA-PACÍFICO, POR REGIÃO, 2018-2032 (MIL USD)
TABELA 64 MERCADO DE CEREAIS TORRADOS NA ÁSIA-PACÍFICO, POR REGIÃO, 2018-2032 (MIL USD)
TABELA 65 MERCADO DE CEREAIS EXTRUDADOS DA ÁSIA-PACÍFICO, POR REGIÃO, 2018-2032 (MIL USD)
TABELA 66 MERCADO DE CEREAIS PARCIALMENTE COZIDOS NA ÁSIA-PACÍFICO, POR REGIÃO, 2018-2032 (MIL USD)
TABELA 67 ÁSIA-PACÍFICO MICRONIZADOS NO MERCADO DE CEREAIS, POR REGIÃO, 2018-2032 (MIL USD)
TABELA 68 MERCADO DE CEREAIS MATÉRIAS-PRIMAS DA ÁSIA-PACÍFICO, POR REGIÃO, 2018-2032 (MIL USD)
TABELA 69 MERCADO DE CEREAIS TOTALMENTE COZIDOS NA ÁSIA-PACÍFICO, POR REGIÃO, 2018-2032 (MIL USD)
TABELA 70 CEREAIS COZIDOS NO VAPOR NA ÁSIA-PACÍFICO, POR REGIÃO, 2018-2032 (MIL USD)
TABELA 71 CEREAIS TEMPERADOS NA ÁSIA-PACÍFICO, POR REGIÃO, 2018-2032 (MIL USD)
TABELA 72 ADOÇANTES NO MERCADO DE CEREAIS DA ÁSIA-PACÍFICO, POR REGIÃO, 2018-2032 (MIL USD)
TABELA 73 MERCADO DE CEREAIS REVESTIDOS NA ÁSIA-PACÍFICO, POR REGIÃO, 2018-2032 (MIL USD)
TABELA 74 OUTROS INGRESSOS NO MERCADO DE CEREAIS DA ÁSIA-PACÍFICO, POR REGIÃO, 2018-2032 (MIL USD)
TABELA 75 MERCADO DE CEREAIS DA ÁSIA-PACÍFICO, POR FORMATO DE CONSUMO, 2018-2032 (MIL USD)
TABELA 76 ÁSIA-PACÍFICO CONSUMO À COLHER COM LEITE/IOGURTE NO MERCADO DE CEREAIS, POR REGIÃO, 2018-2032 (MIL USD)
TABELA 77 BARRAS PARA VIAGEM NA ÁSIA-PACÍFICO NO MERCADO DE CEREAIS, POR REGIÃO, 2018-2032 (MIL USD)
TABELA 78 MINGAU DE CEREAIS NA ÁSIA-PACÍFICO, POR REGIÃO, 2018-2032 (MIL USD)
TABELA 79 MERCADO DE CEREAIS PARA LANCHES SECOS NA ÁSIA-PACÍFICO, POR REGIÃO, 2018-2032 (MIL USD)
TABELA 80 SACHÊS DE LANCHES NA ÁSIA-PACÍFICO NO MERCADO DE CEREAIS, POR REGIÃO, 2018-2032 (MIL USD)
TABELA 81 MERCADO DE CEREAIS PRONTOS PARA COZIMENTO NA ÁSIA-PACÍFICO, POR REGIÃO, 2018-2032 (MIL USD)
TABELA 82 MERCADO DE CEREAIS PRONTOS PARA AQUECER NA ÁSIA-PACÍFICO, POR REGIÃO, 2018-2032 (MIL USD)
TABELA 83 INGREDIENTES MISTOS NO MERCADO DE CEREAIS DA ÁSIA-PACÍFICO, POR REGIÃO, 2018-2032 (MIL USD)
TABELA 84 MERCADO DE BEBIDAS COM INFUSÃO EM CEREAIS NA ÁSIA-PACÍFICO, POR REGIÃO, 2018-2032 (MIL USD)
TABELA 85 OUTROS INDIVÍDUOS NO MERCADO DE CEREAIS DA ÁSIA-PACÍFICO, POR REGIÃO, 2018-2032 (MIL USD)
TABELA 86 MERCADO DE CEREAIS DA ÁSIA-PACÍFICO, POR CATEGORIA DE PRODUTO, 2018-2032 (MIL USD)
TABELA 87 INGREDIENTES DE PADARIA DA ÁSIA-PACÍFICO (MISTURAS DE FARINHA/GRANULADO) NO MERCADO DE CEREAIS, POR REGIÃO, 2018-2032 (MIL USD)
TABELA 88 CEREAIS MATINAIS DA ÁSIA-PACÍFICO NO MERCADO DE CEREAIS, POR REGIÃO, 2018-2032 (MIL USD)
TABELA 89 CEREAIS MATINAIS DA ÁSIA-PACÍFICO NO MERCADO DE CEREAIS, POR TIPO, 2018-2032 (MIL USD)
TABELA 90 MERCADO DE CEREAIS PRONTOS PARA CONSUMO (RTE) DA ÁSIA-PACÍFICO, POR TIPO, 2018-2032 (MIL USD)
TABELA 91 CEREAIS QUENTES DA ÁSIA-PACÍFICO NO MERCADO DE CEREAIS, POR TIPO, 2018-2032 (MIL USD)
TABELA 92 MERCADO DE CEREAIS PARA RAÇÃO ANIMAL/MATÉRIA-PRIMA NA ÁSIA-PACÍFICO, POR REGIÃO, 2018-2032 (MIL USD)
TABELA 93 SALADAS DE CEREAIS DA ÁSIA-PACÍFICO NO MERCADO DE CEREAIS, POR REGIÃO, 2018-2032 (MIL USD)
TABELA 94 SALADAS DE CEREAIS DA ÁSIA-PACÍFICO NO MERCADO DE CEREAIS, POR TIPO, 2018-2032 (MIL USD)
TABELA 95 MISTURAS DE CEREAIS INSTANTÂNEOS DA ÁSIA-PACÍFICO NO MERCADO DE CEREAIS, POR REGIÃO, 2018-2032 (MIL USD)
TABELA 96 CEREAIS INFANTIS DA ÁSIA-PACÍFICO NO MERCADO DE CEREAIS, POR REGIÃO, 2018-2032 (MIL USD)
TABELA 97 CEREAIS INFANTIS DA ÁSIA-PACÍFICO NO MERCADO DE CEREAIS, POR TIPO, 2018-2032 (MIL USD)
TABELA 98 KITS DE REFEIÇÃO À BASE DE CEREAIS DA ÁSIA-PACÍFICO NO MERCADO DE CEREAIS, POR REGIÃO, 2018-2032 (MIL USD)
TABELA 99 INSUMOS DE CERVEJARIA/DESTILIZAÇÃO NA ÁSIA-PACÍFICO NO MERCADO DE CEREAIS, POR REGIÃO, 2018-2032 (MIL USD)
TABELA 100 OUTROS INDUSTRIAIS DA ÁSIA-PACÍFICO NO MERCADO DE CEREAIS, POR REGIÃO, 2018-2032 (MIL USD)
TABELA 101 MERCADO DE CEREAIS DA ÁSIA-PACÍFICO, POR NATUREZA, 2018-2032 (MIL USD)
TABELA 102 MERCADO DE CEREAIS CONVENCIONAIS DA ÁSIA-PACÍFICO, POR REGIÃO, 2018-2032 (MIL USD)
TABELA 103 MERCADO DE CEREAIS ORGÂNICOS DA ÁSIA-PACÍFICO, POR REGIÃO, 2018-2032 (MIL USD)
TABELA 104 MERCADO DE CEREAIS DA ÁSIA-PACÍFICO, POR CATEGORIA, 2018-2032 (MIL USD)
TABELA 105 CEREAIS À BASE DE OGM NA ÁSIA-PACÍFICO, POR REGIÃO, 2018-2032 (MIL USD)
TABELA 106 CEREAIS NÃO OGM CERTIFICADOS NA ÁSIA-PACÍFICO, POR REGIÃO, 2018-2032 (MIL USD)
TABELA 107 MERCADO DE CEREAIS DA ÁSIA-PACÍFICO, POR BENEFÍCIOS FUNCIONAIS, 2018-2032 (MIL USD)
TABELA 108 MERCADO DE CEREAIS FORTIFICADOS COM VITAMINAS NA ÁSIA-PACÍFICO, POR REGIÃO, 2018-2032 (MIL USD)
TABELA 109 MERCADO DE CEREAIS RICO EM FIBRAS NA ÁSIA-PACÍFICO, POR REGIÃO, 2018-2032 (MIL USD)
TABELA 110 MERCADO DE CEREAIS COM BAIXO/SEM AÇÚCAR NA ÁSIA-PACÍFICO, POR REGIÃO, 2018-2032 (MIL USD)
TABELA 111 MERCADO DE CEREAIS COM ALTO TEOR DE PROTEÍNA NA ÁSIA-PACÍFICO, POR REGIÃO, 2018-2032 (MIL USD)
TABELA 112 MERCADO DE CEREAIS SEM GLÚTEN NA ÁSIA-PACÍFICO, POR REGIÃO, 2018-2032 (MIL USD)
TABELA 113 CEREAIS SAUDÁVEIS PARA O CORAÇÃO NO MERCADO DA ÁSIA-PACÍFICO, POR REGIÃO, 2018-2032 (MIL USD)
TABELA 114 PROBIÓTICOS/PREBIÓTICOS ENRIQUECIDOS NO MERCADO DE CEREAIS DA ÁSIA-PACÍFICO, POR REGIÃO, 2018-2032 (MIL USD)
TABELA 115 REDUÇÃO DO COLESTEROL NO MERCADO DE CEREAIS NA ÁSIA-PACÍFICO, POR REGIÃO, 2018-2032 (MIL USD)
TABELA 116 ÍNDICE GLICÊMICO BAIXO DA ÁSIA-PACÍFICO NO MERCADO DE CEREAIS, POR REGIÃO, 2018-2032 (MIL USD)
TABELA 117 MERCADO DE CEREAIS ENRIQUECIDOS COM ÔMEGA-3 NA ÁSIA-PACÍFICO, POR REGIÃO, 2018-2032 (MIL USD)
TABELA 118 MERCADO DE CEREAIS COM BAIXO TEOR DE GORDURA NA ÁSIA-PACÍFICO, POR REGIÃO, 2018-2032 (MIL USD)
TABELA 119 MERCADO DE CEREAIS LIVRES DE ALERGÊNICOS NA ÁSIA-PACÍFICO, POR REGIÃO, 2018-2032 (MIL USD)
TABELA 120 MERCADO DE CEREAIS COM ALTO TEOR DE FERRO NA ÁSIA-PACÍFICO, POR REGIÃO, 2018-2032 (MIL USD)
TABELA 121 MERCADO DE CEREAIS COM BAIXO/SEM SAL NA ÁSIA-PACÍFICO, POR REGIÃO, 2018-2032 (MIL USD)
TABELA 122 CEREAIS AMIGOS DA ÁSIA-PACÍFICO NO MERCADO DE CEREAIS, POR REGIÃO, 2018-2032 (MIL USD)
TABELA 123 CEREAIS AMIGOS DA CETOGÊNIA NA ÁSIA-PACÍFICO, POR REGIÃO, 2018-2032 (MIL USD)
TABELA 124 MERCADO DE CEREAIS CERTIFICADOS VEGANOS NA ÁSIA-PACÍFICO, POR REGIÃO, 2018-2032 (MIL USD)
TABELA 125 OUTROS INDIVÍDUOS NO MERCADO DE CEREAIS DA ÁSIA-PACÍFICO, POR REGIÃO, 2018-2032 (MIL USD)
TABELA 126 MERCADO DE CEREAIS DA ÁSIA-PACÍFICO, POR VALIDADE, 2018-2032 (MIL USD)
TABELA 127 MERCADO DE CEREAIS DE LONGO PRAZO (ESTÁVEL EM CONSERVAÇÃO AMBIENTE) NA ÁSIA-PACÍFICO, POR REGIÃO, 2018-2032 (MIL USD)
TABELA 128 MERCADO DE CEREAIS DE MÉDIO PRAZO NA ÁSIA-PACÍFICO, POR REGIÃO, 2018-2032 (MIL USD)
TABELA 129 MERCADO DE CEREAIS DE CURTO PRAZO (PERECÍVEIS) NA ÁSIA-PACÍFICO, POR REGIÃO, 2018-2032 (MIL USD)
TABELA 130 MERCADO DE CEREAIS DA ÁSIA-PACÍFICO, POR EMBALAGEM, 2018-2032 (MIL USD)
TABELA 131 ÁSIA-PACÍFICO BOX NO MERCADO DE CEREAIS, POR REGIÃO, 2018-2032 (MIL USD)
TABELA 132 ÁSIA-PACÍFICO BOX NO MERCADO DE CEREAIS, POR TIPO, 2018-2032 (MIL USD)
TABELA 133 MERCADO DE CEREAIS EM SACHÊ NA ÁSIA-PACÍFICO, POR REGIÃO, 2018-2032 (MIL USD)
TABELA 134 MERCADO DE CEREAIS EM SACHÊS DA ÁSIA-PACÍFICO, POR TIPO, 2018-2032 (MIL USD)
TABELA 135 MERCADO DE CEREAIS NA ÁSIA-PACÍFICO, POR REGIÃO, 2018-2032 (MIL USD)
TABELA 136 MERCADO DE CEREAIS NA ÁSIA-PACÍFICO, POR TIPO, 2018-2032 (MIL USD)
TABELA 137 SACHÊS/STICK PACKS NA ÁSIA-PACÍFICO NO MERCADO DE CEREAIS, POR REGIÃO, 2018-2032 (MIL USD)
TABELA 138 SACOS (A GRANEL) NO MERCADO DE CEREAIS DA ÁSIA-PACÍFICO, POR REGIÃO, 2018-2032 (MIL USD)
TABELA 139 MERCADO DE CEREAIS NA ÁSIA-PACÍFICO, POR REGIÃO, 2018-2032 (MIL USD)
TABELA 140 MERCADO DE CEREAIS NA ÁSIA-PACÍFICO, POR TIPO, 2018-2032 (MIL USD)
TABELA 141 TETRA PACK/CAIXA ASSÉPTICA NO MERCADO DE CEREAIS DA ÁSIA-PACÍFICO, POR REGIÃO, 2018-2032 (MIL USD)
TABELA 142 MERCADO DE CEREAIS NA ÁSIA-PACÍFICO, POR REGIÃO, 2018-2032 (MIL USD)
TABELA 143 TAMBOR NO MERCADO DE CEREAIS DA ÁSIA-PACÍFICO, POR REGIÃO, 2018-2032 (MIL USD)
TABELA 144 EMBALAGENS ECOLÓGICAS NO MERCADO DE CEREAIS DA ÁSIA-PACÍFICO, POR REGIÃO, 2018-2032 (MIL USD)
TABELA 145 EMBALAGENS ECOLÓGICAS NA ÁSIA-PACÍFICO NO MERCADO DE CEREAIS, POR TIPO, 2018-2032 (MIL USD)
TABELA 146 EMBALAGENS ECOLÓGICAS NO MERCADO DE CEREAIS DA ÁSIA-PACÍFICO, POR REGIÃO, 2018-2032 (MIL USD)
TABELA 147 MERCADO DE CEREAIS DA ÁSIA-PACÍFICO, POR TAMANHO DE EMBALAGEM, 2018-2032 (MIL USD)
TABELA 148 EMBALAGENS PEQUENAS DA ÁSIA-PACÍFICO (51G–250G) NO MERCADO DE CEREAIS, POR REGIÃO, 2018-2032 (MIL USD)
TABELA 149 EMBALAGENS MÉDIAS (251G–500G) DA ÁSIA-PACÍFICO NO MERCADO DE CEREAIS, POR REGIÃO, 2018-2032 (MIL USD)
TABELA 150 EMBALAGENS GRANDES (501G–1KG) DA ÁSIA-PACÍFICO NO MERCADO DE CEREAIS, POR REGIÃO, 2018-2032 (MIL USD)
TABELA 151 EMBALAGENS INDIVIDUAIS DA ÁSIA-PACÍFICO (ABAIXO DE 50G) NO MERCADO DE CEREAIS, POR REGIÃO, 2018-2032 (MIL USD)
TABELA 152 EMBALAGENS EXTRA GRANDES DA ÁSIA-PACÍFICO (1,1KG–2,5KG) NO MERCADO DE CEREAIS, POR REGIÃO, 2018-2032 (MIL USD)
TABELA 153 EMBALAGENS A GRANEL DA ÁSIA-PACÍFICO (ACIMA DE 2,5 KG) NO MERCADO DE CEREAIS, POR REGIÃO, 2018-2032 (MIL USD)
TABELA 154 MERCADO DE CEREAIS DA ÁSIA-PACÍFICO, POR FAIXA DE PREÇO, 2018-2032 (MIL USD)
TABELA 155 ECONOMIA DA ÁSIA-PACÍFICO (ATÉ US$ 2,49) NO MERCADO DE CEREAIS, POR REGIÃO, 2018-2032 (MIL USD)
TABELA 156 ÁSIA-PACÍFICO MÉDIO (US$ 2,50-6,99) NO MERCADO DE CEREAIS, POR REGIÃO, 2018-2032 (US$ MIL)
TABELA 157 PREMIUM DA ÁSIA-PACÍFICO (US$ 7,00 E ACIMA) NO MERCADO DE CEREAIS, POR REGIÃO, 2018-2032 (US$ MIL)
TABELA 158 MERCADO DE CEREAIS DA ÁSIA-PACÍFICO, POR CANAL DE DISTRIBUIÇÃO, 2018-2032 (MIL USD)
TABELA 159 MERCADO DE CEREAIS B2B DA ÁSIA-PACÍFICO, POR REGIÃO, 2018-2032 (MIL USD)
TABELA 160 MERCADO DE CEREAIS B2C DA ÁSIA-PACÍFICO, POR REGIÃO, 2018-2032 (MIL USD)
TABELA 161 B2C NO MERCADO DE CEREAIS DA ÁSIA-PACÍFICO, POR TIPO, 2018-2032 (MIL USD)
TABELA 162 ÁSIA-PACÍFICO ONLINE NO MERCADO DE CEREAIS, POR TIPO, 2018-2032 (MIL USD)
TABELA 163 ÁSIA-PACÍFICO OFFLINE NO MERCADO DE CEREAIS, POR TIPO, 2018-2032 (MIL USD)
TABELA 164 MERCADO DE CEREAIS DA ÁSIA-PACÍFICO, POR PAÍS, 2018-2032 (MIL USD)
TABELA 165 MERCADO DE CEREAIS DA ÁSIA-PACÍFICO, POR TIPO DE CEREAL, 2018-2032 (MIL USD)
TABELA 166 MERCADO DE CEREAIS DA ÁSIA-PACÍFICO, POR TIPO DE CEREAL, 2018-2032 (MIL TONELADAS)
TABELA 167 MERCADO DE TRIGO EM CEREAIS DA ÁSIA-PACÍFICO, POR TIPO, 2018-2032 (MIL USD)
TABELA 168 MERCADO DE ARROZ EM CEREAIS DA ÁSIA-PACÍFICO, POR TIPO, 2018-2032 (MIL USD)
TABELA 169 MILHO DA ÁSIA-PACÍFICO NO MERCADO DE CEREAIS, POR TIPO, 2018-2032 (MIL USD)
TABELA 170 MERCADO DE CEVADA NA ÁSIA-PACÍFICO NO MERCADO DE CEREAIS, POR TIPO, 2018-2032 (MIL USD)
TABELA 171 AVEIA NO MERCADO DE CEREAIS DA ÁSIA-PACÍFICO, POR TIPO, 2018-2032 (MIL USD)
TABELA 172 CENTEIO NO MERCADO DE CEREAIS DA ÁSIA-PACÍFICO, POR TIPO, 2018-2032 (MIL USD)
TABELA 173 SORGO NA ÁSIA-PACÍFICO NO MERCADO DE CEREAIS, POR TIPO, 2018-2032 (MIL USD)
TABELA 174 MERCADO DE MILHO DA ÁSIA-PACÍFICO NO MERCADO DE CEREAIS, POR TIPO, 2018-2032 (MIL USD)
TABELA 175 QUINOA DA ÁSIA-PACÍFICO NO MERCADO DE CEREAIS, POR TIPO, 2018-2032 (MIL USD)
TABELA 176 MERCADO DE CEREAIS DA ÁSIA-PACÍFICO, POR FORMULÁRIO DE PRODUTO, 2018-2032 (MIL USD)
TABELA 177 MERCADO DE CEREAIS DA ÁSIA-PACÍFICO, POR NÍVEL DE PROCESSAMENTO, 2018-2032 (MIL USD)
TABELA 178 MERCADO DE CEREAIS DA ÁSIA-PACÍFICO, POR FORMATO DE CONSUMO, 2018-2032 (MIL USD)
TABELA 179 MERCADO DE CEREAIS DA ÁSIA-PACÍFICO, POR CATEGORIA DE PRODUTO, 2018-2032 (MIL USD)
TABELA 180 CEREAIS MATINAIS DA ÁSIA-PACÍFICO NO MERCADO DE CEREAIS, POR TIPO, 2018-2032 (MIL USD)
TABELA 181 MERCADO DE CEREAIS PRONTOS PARA CONSUMO (RTE) NA ÁSIA-PACÍFICO, POR TIPO, 2018-2032 (MIL USD)
TABELA 182 CEREAIS QUENTES DA ÁSIA-PACÍFICO NO MERCADO DE CEREAIS, POR TIPO, 2018-2032 (MIL USD)
TABELA 183 SALADAS DE CEREAIS DA ÁSIA-PACÍFICO NO MERCADO DE CEREAIS, POR TIPO, 2018-2032 (MIL USD)
TABELA 184 CEREAIS INFANTIS DA ÁSIA-PACÍFICO NO MERCADO DE CEREAIS, POR TIPO, 2018-2032 (MIL USD)
TABELA 185 MERCADO DE CEREAIS DA ÁSIA-PACÍFICO, POR NATUREZA, 2018-2032 (MIL USD)
TABELA 186 MERCADO DE CEREAIS DA ÁSIA-PACÍFICO, POR CATEGORIA, 2018-2032 (MIL USD)
TABELA 187 MERCADO DE CEREAIS DA ÁSIA-PACÍFICO, POR BENEFÍCIOS FUNCIONAIS, 2018-2032 (MIL USD)
TABELA 188 MERCADO DE CEREAIS DA ÁSIA-PACÍFICO, POR VALIDADE, 2018-2032 (MIL USD)
TABELA 189 MERCADO DE CEREAIS DA ÁSIA-PACÍFICO, POR EMBALAGEM, 2018-2032 (MIL USD)
TABELA 190 CAIXA ÁSIA-PACÍFICO NO MERCADO DE CEREAIS, POR TIPO, 2018-2032 (MIL USD)
TABELA 191 MERCADO DE CEREAIS NA ÁSIA-PACÍFICO, POR TIPO, 2018-2032 (MIL USD)
TABELA 192 MERCADO DE CEREAIS DA ÁSIA-PACÍFICO, POR TIPO, 2018-2032 (MIL USD)
TABELA 193 MERCADO DE CEREAIS NA ÁSIA-PACÍFICO, POR TIPO, 2018-2032 (MIL USD)
TABELA 194 EMBALAGENS ECOLÓGICAS NO MERCADO DE CEREAIS DA ÁSIA-PACÍFICO, POR TIPO, 2018-2032 (MIL USD)
TABELA 195 MERCADO DE CEREAIS DA ÁSIA-PACÍFICO, POR TAMANHO DE EMBALAGEM, 2018-2032 (MIL USD)
TABELA 196 MERCADO DE CEREAIS DA ÁSIA-PACÍFICO, POR FAIXA DE PREÇO, 2018-2032 (MIL USD)
TABELA 197 MERCADO DE CEREAIS DA ÁSIA-PACÍFICO, POR CANAL DE DISTRIBUIÇÃO, 2018-2032 (MIL USD)
TABELA 198 MERCADO DE CEREAIS B2C DA ÁSIA-PACÍFICO, POR TIPO, 2018-2032 (MIL USD)
TABELA 199 ÁSIA-PACÍFICO ONLINE NO MERCADO DE CEREAIS, POR TIPO, 2018-2032 (MIL USD)
TABELA 200 ÁSIA-PACÍFICO OFFLINE NO MERCADO DE CEREAIS, POR TIPO, 2018-2032 (MIL USD)
TABELA 201 MERCADO DE CEREAIS DA CHINA, POR TIPO DE CEREAL, 2018-2032 (MIL USD)
TABELA 202 MERCADO DE CEREAIS DA CHINA, POR TIPO DE CEREAL, 2018-2032 (MIL TONELADAS)
TABELA 203 MERCADO DE TRIGO EM CEREAIS DA CHINA, POR TIPO, 2018-2032 (MIL USD)
TABELA 204 MERCADO DE ARROZ EM CEREAIS DA CHINA, POR TIPO, 2018-2032 (MIL USD)
TABELA 205 MILHO DA CHINA NO MERCADO DE CEREAIS, POR TIPO, 2018-2032 (MIL USD)
TABELA 206 CEVADA DA CHINA NO MERCADO DE CEREAIS, POR TIPO, 2018-2032 (MIL USD)
TABELA 207 AVEIA DA CHINA NO MERCADO DE CEREAIS, POR TIPO, 2018-2032 (MIL USD)
TABELA 208 CENTEIO DA CHINA NO MERCADO DE CEREAIS, POR TIPO, 2018-2032 (MIL USD)
TABELA 209 MERCADO DE SORGO EM CEREAIS DA CHINA, POR TIPO, 2018-2032 (MIL USD)
TABELA 210 MERCADO DE MILHO DA CHINA NO MERCADO DE CEREAIS, POR TIPO, 2018-2032 (MIL USD)
TABELA 211 QUINOA DA CHINA NO MERCADO DE CEREAIS, POR TIPO, 2018-2032 (MIL USD)
TABELA 212 MERCADO DE CEREAIS DA CHINA, POR FORMULÁRIO DE PRODUTO, 2018-2032 (MIL USD)
TABELA 213 MERCADO DE CEREAIS DA CHINA, POR NÍVEL DE PROCESSAMENTO, 2018-2032 (MIL USD)
TABELA 214 MERCADO DE CEREAIS DA CHINA, POR FORMATO DE CONSUMO, 2018-2032 (MIL USD)
TABELA 215 MERCADO DE CEREAIS DA CHINA, POR CATEGORIA DE PRODUTO, 2018-2032 (MIL USD)
TABELA 216 CEREAIS MATINAIS DA CHINA NO MERCADO DE CEREAIS, POR TIPO, 2018-2032 (MIL USD)
TABELA 217 MERCADO DE CEREAIS PRONTOS PARA CONSUMO (RTE) DA CHINA, POR TIPO, 2018-2032 (MIL USD)
TABELA 218 CEREAIS QUENTES DA CHINA NO MERCADO DE CEREAIS, POR TIPO, 2018-2032 (MIL USD)
TABELA 219 SALADAS DE CEREAIS DA CHINA NO MERCADO DE CEREAIS, POR TIPO, 2018-2032 (MIL USD)
TABELA 220 CEREAIS INFANTIS DA CHINA NO MERCADO DE CEREAIS, POR TIPO, 2018-2032 (MIL USD)
TABELA 221 MERCADO DE CEREAIS DA CHINA, POR NATUREZA, 2018-2032 (MIL USD)
TABELA 222 MERCADO DE CEREAIS DA CHINA, POR CATEGORIA, 2018-2032 (MIL USD)
TABELA 223 MERCADO DE CEREAIS DA CHINA, POR BENEFÍCIOS FUNCIONAIS, 2018-2032 (MIL USD)
TABELA 224 MERCADO DE CEREAIS DA CHINA, POR VALIDADE, 2018-2032 (MIL USD)
TABELA 225 MERCADO DE CEREAIS DA CHINA, POR EMBALAGEM, 2018-2032 (MIL USD)
TABELA 226 CAIXA DE PORÇÕES NO MERCADO DE CEREAIS, POR TIPO, 2018-2032 (MIL USD)
TABELA 227 SACHÊ DE PORCELANA NO MERCADO DE CEREAIS, POR TIPO, 2018-2032 (MIL USD)
TABELA 228 SACOLA DE PORCELANA NO MERCADO DE CEREAIS, POR TIPO, 2018-2032 (USD MIL)
TABELA 229 PORÇÃO DE CEREAIS NO MERCADO DE CEREAIS, POR TIPO, 2018-2032 (MIL USD)
TABELA 230 EMBALAGENS ECOLÓGICAS NA CHINA NO MERCADO DE CEREAIS, POR TIPO, 2018-2032 (MIL USD)
TABELA 231 MERCADO DE CEREAIS DA CHINA, POR TAMANHO DE EMBALAGEM, 2018-2032 (MIL USD)
TABELA 232 MERCADO DE CEREAIS DA CHINA, POR FAIXA DE PREÇO, 2018-2032 (MIL USD)
TABELA 233 MERCADO DE CEREAIS DA CHINA, POR CANAL DE DISTRIBUIÇÃO, 2018-2032 (MIL USD)
TABELA 234 MERCADO DE CEREAIS B2C DA CHINA, POR TIPO, 2018-2032 (MIL USD)
TABELA 235 CHINA ONLINE NO MERCADO DE CEREAIS, POR TIPO, 2018-2032 (MIL USD)
TABELA 236 CHINA OFFLINE NO MERCADO DE CEREAIS, POR TIPO, 2018-2032 (USD MIL)
TABELA 237 MERCADO DE CEREAIS DA ÍNDIA, POR TIPO DE CEREAL, 2018-2032 (MIL USD)
TABELA 238 MERCADO DE CEREAIS DA ÍNDIA, POR TIPO DE CEREAL, 2018-2032 (MIL TONELADAS)
TABELA 239 MERCADO DE TRIGO EM CEREAIS DA ÍNDIA, POR TIPO, 2018-2032 (MIL USD)
TABELA 240 MERCADO DE ARROZ EM CEREAIS DA ÍNDIA, POR TIPO, 2018-2032 (MIL USD)
TABELA 241 MILHO DA ÍNDIA NO MERCADO DE CEREAIS, POR TIPO, 2018-2032 (MIL USD)
TABELA 242 MERCADO DE CEVADA DA ÍNDIA EM CEREAIS, POR TIPO, 2018-2032 (MIL USD)
TABELA 243 AVEIA DA ÍNDIA NO MERCADO DE CEREAIS, POR TIPO, 2018-2032 (MIL USD)
TABELA 244 CENTEIO DA ÍNDIA NO MERCADO DE CEREAIS, POR TIPO, 2018-2032 (MIL USD)
TABELA 245 MERCADO DE SORGO EM CEREAIS DA ÍNDIA, POR TIPO, 2018-2032 (MIL USD)
TABELA 246 MERCADO DE MILHO DA ÍNDIA EM CEREAIS, POR TIPO, 2018-2032 (MIL USD)
TABELA 247 MERCADO DE QUINOA DA ÍNDIA EM CEREAIS, POR TIPO, 2018-2032 (MIL USD)
TABELA 248 MERCADO DE CEREAIS DA ÍNDIA, POR FORMULÁRIO DE PRODUTO, 2018-2032 (MIL USD)
TABELA 249 MERCADO DE CEREAIS DA ÍNDIA, POR NÍVEL DE PROCESSAMENTO, 2018-2032 (MIL USD)
TABELA 250 MERCADO DE CEREAIS DA ÍNDIA, POR FORMATO DE CONSUMO, 2018-2032 (MIL USD)
TABELA 251 MERCADO DE CEREAIS DA ÍNDIA, POR CATEGORIA DE PRODUTO, 2018-2032 (MIL USD)
TABELA 252 CEREAIS MATINAIS DA ÍNDIA NO MERCADO DE CEREAIS, POR TIPO, 2018-2032 (MIL USD)
TABELA 253 MERCADO DE CEREAIS PRONTOS PARA CONSUMO (RTE) DA ÍNDIA, POR TIPO, 2018-2032 (MIL USD)
TABELA 254 CEREAIS QUENTES DA ÍNDIA NO MERCADO DE CEREAIS, POR TIPO, 2018-2032 (MIL USD)
TABELA 255 SNACKS DE CEREAIS DA ÍNDIA NO MERCADO DE CEREAIS, POR TIPO, 2018-2032 (MIL USD)
TABELA 256 CEREAIS INFANTIS DA ÍNDIA NO MERCADO DE CEREAIS, POR TIPO, 2018-2032 (MIL USD)
TABELA 257 MERCADO DE CEREAIS DA ÍNDIA, POR NATUREZA, 2018-2032 (MIL USD)
TABELA 258 MERCADO DE CEREAIS DA ÍNDIA, POR CATEGORIA, 2018-2032 (MIL USD)
TABELA 259 MERCADO DE CEREAIS DA ÍNDIA, POR BENEFÍCIOS FUNCIONAIS, 2018-2032 (MIL USD)
TABELA 260 MERCADO DE CEREAIS DA ÍNDIA, POR VALIDADE, 2018-2032 (MIL USD)
TABELA 261 MERCADO DE CEREAIS DA ÍNDIA, POR EMBALAGEM, 2018-2032 (MIL USD)
TABELA 262 ÍNDIA CAIXA NO MERCADO DE CEREAIS, POR TIPO, 2018-2032 (USD MIL)
TABELA 263 MERCADO DE CEREAIS EM SACHÊ DA ÍNDIA, POR TIPO, 2018-2032 (MIL USD)
TABELA 264 MERCADO DE SACOS DE CEREAIS DA ÍNDIA, POR TIPO, 2018-2032 (MIL USD)
TABELA 265 ÍNDIA JAR NO MERCADO DE CEREAIS, POR TIPO, 2018-2032 (USD MIL)
TABELA 266 EMBALAGENS ECOLÓGICAS NO MERCADO DE CEREAIS DA ÍNDIA, POR TIPO, 2018-2032 (MIL USD)
TABELA 267 MERCADO DE CEREAIS DA ÍNDIA, POR TAMANHO DE EMBALAGEM, 2018-2032 (MIL USD)
TABELA 268 MERCADO DE CEREAIS DA ÍNDIA, POR FAIXA DE PREÇO, 2018-2032 (MIL USD)
TABELA 269 MERCADO DE CEREAIS DA ÍNDIA, POR CANAL DE DISTRIBUIÇÃO, 2018-2032 (MIL USD)
TABELA 270 ÍNDIA B2C NO MERCADO DE CEREAIS, POR TIPO, 2018-2032 (MIL USD)
TABELA 271 ÍNDIA ONLINE NO MERCADO DE CEREAIS, POR TIPO, 2018-2032 (MIL USD)
TABELA 272 ÍNDIA OFFLINE NO MERCADO DE CEREAIS, POR TIPO, 2018-2032 (MIL USD)
TABELA 273 MERCADO DE CEREAIS DO JAPÃO, POR TIPO DE CEREAL, 2018-2032 (MIL USD)
TABELA 274 MERCADO DE CEREAIS DO JAPÃO, POR TIPO DE CEREAL, 2018-2032 (MIL TONELADAS)
TABELA 275 MERCADO DE TRIGO NO JAPÃO EM CEREAIS, POR TIPO, 2018-2032 (MIL USD)
TABELA 276 MERCADO DE ARROZ NO JAPÃO EM CEREAIS, POR TIPO, 2018-2032 (MIL USD)
TABELA 277 MILHO DO JAPÃO (MILHO) NO MERCADO DE CEREAIS, POR TIPO, 2018-2032 (MIL USD)
TABELA 278 CEVADA DO JAPÃO NO MERCADO DE CEREAIS, POR TIPO, 2018-2032 (MIL USD)
TABELA 279 AVEIA DO JAPÃO NO MERCADO DE CEREAIS, POR TIPO, 2018-2032 (MIL USD)
TABELA 280 CENTEIO JAPÃO NO MERCADO DE CEREAIS, POR TIPO, 2018-2032 (MIL USD)
TABELA 281 SORGO NO MERCADO DE CEREAIS DO JAPÃO, POR TIPO, 2018-2032 (MIL USD)
TABELA 282 MERCADO DE MILHO NO JAPÃO, POR TIPO, 2018-2032 (MIL USD)
TABELA 283 QUINOA DO JAPÃO NO MERCADO DE CEREAIS, POR TIPO, 2018-2032 (MIL USD)
TABELA 284 MERCADO DE CEREAIS DO JAPÃO, POR FORMULÁRIO DE PRODUTO, 2018-2032 (MIL USD)
TABELA 285 MERCADO DE CEREAIS DO JAPÃO, POR NÍVEL DE PROCESSAMENTO, 2018-2032 (MIL USD)
TABELA 286 MERCADO DE CEREAIS DO JAPÃO, POR FORMATO DE CONSUMO, 2018-2032 (MIL USD)
TABELA 287 MERCADO DE CEREAIS DO JAPÃO, POR CATEGORIA DE PRODUTO, 2018-2032 (MIL USD)
TABELA 288 CEREAIS MATINAIS DO JAPÃO NO MERCADO DE CEREAIS, POR TIPO, 2018-2032 (MIL USD)
TABELA 289 MERCADO DE CEREAIS PRONTOS PARA CONSUMO (RTE) NO JAPÃO, POR TIPO, 2018-2032 (MIL USD)
TABELA 290 CEREAIS QUENTES DO JAPÃO NO MERCADO DE CEREAIS, POR TIPO, 2018-2032 (MIL USD)
TABELA 291 LANCHES DE CEREAIS DO JAPÃO NO MERCADO DE CEREAIS, POR TIPO, 2018-2032 (MIL USD)
TABELA 292 CEREAIS INFANTIS DO JAPÃO NO MERCADO DE CEREAIS, POR TIPO, 2018-2032 (MIL USD)
TABELA 293 MERCADO DE CEREAIS DO JAPÃO, POR NATUREZA, 2018-2032 (MIL USD)
TABELA 294 MERCADO DE CEREAIS DO JAPÃO, POR CATEGORIA, 2018-2032 (MIL USD)
TABELA 295 MERCADO DE CEREAIS DO JAPÃO, POR BENEFÍCIOS FUNCIONAIS, 2018-2032 (MIL USD)
TABELA 296 MERCADO DE CEREAIS DO JAPÃO, POR VALIDADE, 2018-2032 (MIL USD)
TABELA 297 MERCADO DE CEREAIS DO JAPÃO, POR EMBALAGEM, 2018-2032 (MIL USD)
TABELA 298 CAIXA JAPÃO NO MERCADO DE CEREAIS, POR TIPO, 2018-2032 (MIL USD)
TABELA 299 SACHÊ JAPÃO NO MERCADO DE CEREAIS, POR TIPO, 2018-2032 (MIL USD)
TABELA 300 SACOS DO JAPÃO NO MERCADO DE CEREAIS, POR TIPO, 2018-2032 (USD MIL)
TABELA 301 JAPÃO EM JARRAS NO MERCADO DE CEREAIS, POR TIPO, 2018-2032 (MIL USD)
TABELA 302 EMBALAGENS ECOLÓGICAS NO MERCADO DE CEREAIS NO JAPÃO, POR TIPO, 2018-2032 (MIL USD)
TABELA 303 MERCADO DE CEREAIS DO JAPÃO, POR TAMANHO DE EMBALAGEM, 2018-2032 (MIL USD)
TABELA 304 MERCADO DE CEREAIS DO JAPÃO, POR FAIXA DE PREÇO, 2018-2032 (MIL USD)
TABELA 305 MERCADO DE CEREAIS DO JAPÃO, POR CANAL DE DISTRIBUIÇÃO, 2018-2032 (MIL USD)
TABELA 306 JAPÃO B2C NO MERCADO DE CEREAIS, POR TIPO, 2018-2032 (MIL USD)
TABELA 307 JAPÃO ONLINE NO MERCADO DE CEREAIS, POR TIPO, 2018-2032 (MIL USD)
TABELA 308 JAPÃO OFFLINE NO MERCADO DE CEREAIS, POR TIPO, 2018-2032 (MIL USD)
TABELA 309 MERCADO DE CEREAIS DA AUSTRÁLIA, POR TIPO DE CEREAL, 2018-2032 (MIL USD)
TABELA 310 MERCADO DE CEREAIS DA AUSTRÁLIA, POR TIPO DE CEREAL, 2018-2032 (MIL TONELADAS)
TABELA 311 MERCADO DE TRIGO EM CEREAIS DA AUSTRÁLIA, POR TIPO, 2018-2032 (MIL USD)
TABELA 312 MERCADO DE ARROZ EM CEREAIS DA AUSTRÁLIA, POR TIPO, 2018-2032 (MIL USD)
TABELA 313 MILHO AUSTRÁLIA NO MERCADO DE CEREAIS, POR TIPO, 2018-2032 (MIL USD)
TABELA 314 CEVADA NA AUSTRÁLIA NO MERCADO DE CEREAIS, POR TIPO, 2018-2032 (MIL USD)
TABELA 315 AVEIA AUSTRÁLIA NO MERCADO DE CEREAIS, POR TIPO, 2018-2032 (MIL USD)
TABELA 316 CENTEIO AUSTRÁLIA NO MERCADO DE CEREAIS, POR TIPO, 2018-2032 (MIL USD)
TABELA 317 MERCADO DE SORGO EM CEREAIS DA AUSTRÁLIA, POR TIPO, 2018-2032 (MIL USD)
TABELA 318 MERCADO DE MILHO NO MERCADO DE CEREAIS DA AUSTRÁLIA, POR TIPO, 2018-2032 (MIL USD)
TABELA 319 MERCADO DE QUINOA EM CEREAIS DA AUSTRÁLIA, POR TIPO, 2018-2032 (MIL USD)
TABELA 320 MERCADO DE CEREAIS DA AUSTRÁLIA, POR FORMULÁRIO DE PRODUTO, 2018-2032 (MIL USD)
TABELA 321 MERCADO DE CEREAIS DA AUSTRÁLIA, POR NÍVEL DE PROCESSAMENTO, 2018-2032 (MIL USD)
TABELA 322 MERCADO DE CEREAIS DA AUSTRÁLIA, POR FORMATO DE CONSUMO, 2018-2032 (MIL USD)
TABELA 323 MERCADO DE CEREAIS DA AUSTRÁLIA, POR CATEGORIA DE PRODUTO, 2018-2032 (MIL USD)
TABELA 324 CEREAIS MATINAIS DA AUSTRÁLIA NO MERCADO DE CEREAIS, POR TIPO, 2018-2032 (MIL USD)
TABELA 325 CEREAIS PRONTOS PARA CONSUMO (RTE) NA AUSTRÁLIA, POR TIPO, 2018-2032 (MIL USD)
TABELA 326 CEREAIS QUENTES DA AUSTRÁLIA NO MERCADO DE CEREAIS, POR TIPO, 2018-2032 (MIL USD)
TABELA 327 SALADAS DE CEREAIS DA AUSTRÁLIA NO MERCADO DE CEREAIS, POR TIPO, 2018-2032 (MIL USD)
TABELA 328 CEREAIS INFANTIS DA AUSTRÁLIA NO MERCADO DE CEREAIS, POR TIPO, 2018-2032 (MIL USD)
TABELA 329 MERCADO DE CEREAIS DA AUSTRÁLIA, POR NATUREZA, 2018-2032 (MIL USD)
TABELA 330 MERCADO DE CEREAIS DA AUSTRÁLIA, POR CATEGORIA, 2018-2032 (MIL USD)
TABELA 331 MERCADO DE CEREAIS DA AUSTRÁLIA, POR BENEFÍCIOS FUNCIONAIS, 2018-2032 (MIL USD)
TABELA 332 MERCADO DE CEREAIS DA AUSTRÁLIA, POR VALIDADE, 2018-2032 (MIL USD)
TABELA 333 MERCADO DE CEREAIS DA AUSTRÁLIA, POR EMBALAGEM, 2018-2032 (MIL USD)
TABELA 334 CAIXA AUSTRÁLIA NO MERCADO DE CEREAIS, POR TIPO, 2018-2032 (MIL USD)
TABELA 335 MERCADO DE CEREAIS EM SACHÊS DA AUSTRÁLIA, POR TIPO, 2018-2032 (MIL USD)
TABELA 336 MERCADO DE CEREAIS NA AUSTRÁLIA, POR TIPO, 2018-2032 (MIL USD)
TABELA 337 AUSTRÁLIA JAR NO MERCADO DE CEREAIS, POR TIPO, 2018-2032 (USD MIL)
TABELA 338 EMBALAGENS ECOLÓGICAS NA AUSTRÁLIA NO MERCADO DE CEREAIS, POR TIPO, 2018-2032 (MIL USD)
TABELA 339 MERCADO DE CEREAIS DA AUSTRÁLIA, POR TAMANHO DE EMBALAGEM, 2018-2032 (MIL USD)
TABELA 340 MERCADO DE CEREAIS DA AUSTRÁLIA, POR FAIXA DE PREÇO, 2018-2032 (MIL USD)
TABELA 341 MERCADO DE CEREAIS DA AUSTRÁLIA, POR CANAL DE DISTRIBUIÇÃO, 2018-2032 (MIL USD)
TABELA 342 AUSTRÁLIA B2C NO MERCADO DE CEREAIS, POR TIPO, 2018-2032 (MIL USD)
TABELA 343 AUSTRÁLIA ONLINE NO MERCADO DE CEREAIS, POR TIPO, 2018-2032 (MIL USD)
TABELA 344 AUSTRÁLIA OFFLINE NO MERCADO DE CEREAIS, POR TIPO, 2018-2032 (MIL USD)
TABELA 345 MERCADO DE CEREAIS DA COREIA DO SUL, POR TIPO DE CEREAL, 2018-2032 (MIL USD)
TABELA 346 MERCADO DE CEREAIS DA COREIA DO SUL, POR TIPO DE CEREAL, 2018-2032 (MIL TONELADAS)
TABELA 347 MERCADO DE TRIGO EM CEREAIS DA COREIA DO SUL, POR TIPO, 2018-2032 (MIL USD)
TABELA 348 MERCADO DE ARROZ EM CEREAIS DA COREIA DO SUL, POR TIPO, 2018-2032 (MIL USD)
TABELA 349 MILHO DA COREIA DO SUL NO MERCADO DE CEREAIS, POR TIPO, 2018-2032 (MIL USD)
TABELA 350 MERCADO DE CEVADA DA COREIA DO SUL EM CEREAIS, POR TIPO, 2018-2032 (MIL USD)
TABELA 351 AVEIA NO MERCADO DE CEREAIS DA COREIA DO SUL, POR TIPO, 2018-2032 (MIL USD)
TABELA 352 CENTEIO DA COREIA DO SUL NO MERCADO DE CEREAIS, POR TIPO, 2018-2032 (MIL USD)
TABELA 353 MERCADO DE SORGO EM CEREAIS DA COREIA DO SUL, POR TIPO, 2018-2032 (MIL USD)
TABELA 354 MERCADO DE MILHO DA COREIA DO SUL EM CEREAIS, POR TIPO, 2018-2032 (MIL USD)
TABELA 355 MERCADO DE QUINOA EM CEREAIS DA COREIA DO SUL, POR TIPO, 2018-2032 (MIL USD)
TABELA 356 MERCADO DE CEREAIS DA COREIA DO SUL, POR FORMULÁRIO DE PRODUTO, 2018-2032 (MIL USD)
TABELA 357 MERCADO DE CEREAIS DA COREIA DO SUL, POR NÍVEL DE PROCESSAMENTO, 2018-2032 (MIL USD)
TABELA 358 MERCADO DE CEREAIS DA COREIA DO SUL, POR FORMATO DE CONSUMO, 2018-2032 (MIL USD)
TABELA 359 MERCADO DE CEREAIS DA COREIA DO SUL, POR CATEGORIA DE PRODUTO, 2018-2032 (MIL USD)
TABELA 360 CEREAIS MATINAIS DA COREIA DO SUL NO MERCADO DE CEREAIS, POR TIPO, 2018-2032 (MIL USD)
TABELA 361 COREIA DO SUL - MERCADO DE CEREAIS PRONTOS PARA CONSUMO (RTE), POR TIPO, 2018-2032 (MIL USD)
TABELA 362 CEREAIS QUENTES DA COREIA DO SUL NO MERCADO DE CEREAIS, POR TIPO, 2018-2032 (MIL USD)
TABELA 363 LANCHES DE CEREAIS DA COREIA DO SUL NO MERCADO DE CEREAIS, POR TIPO, 2018-2032 (MIL USD)
TABELA 364 CEREAIS INFANTIS DA COREIA DO SUL NO MERCADO DE CEREAIS, POR TIPO, 2018-2032 (MIL USD)
TABELA 365 MERCADO DE CEREAIS DA COREIA DO SUL, POR NATUREZA, 2018-2032 (MIL USD)
TABELA 366 MERCADO DE CEREAIS DA COREIA DO SUL, POR CATEGORIA, 2018-2032 (MIL USD)
TABELA 367 MERCADO DE CEREAIS DA COREIA DO SUL, POR BENEFÍCIOS FUNCIONAIS, 2018-2032 (MIL USD)
TABELA 368 MERCADO DE CEREAIS DA COREIA DO SUL, POR VALIDADE, 2018-2032 (MIL USD)
TABELA 369 MERCADO DE CEREAIS DA COREIA DO SUL, POR EMBALAGEM, 2018-2032 (MIL USD)
TABELA 370 COREIA DO SUL - CAIXA NO MERCADO DE CEREAIS, POR TIPO, 2018-2032 (MIL USD)
TABELA 371 MERCADO DE CEREAIS EM SACHÊ DA COREIA DO SUL, POR TIPO, 2018-2032 (MIL USD)
TABELA 372 MERCADO DE SACOS DE CEREAIS DA COREIA DO SUL, POR TIPO, 2018-2032 (MIL USD)
TABELA 373 COREIA DO SUL - MERCADO DE CEREAIS EM JARRAS, POR TIPO, 2018-2032 (MIL USD)
TABELA 374 EMBALAGENS ECOLÓGICAS NO MERCADO DE CEREAIS DA COREIA DO SUL, POR TIPO, 2018-2032 (MIL USD)
TABELA 375 MERCADO DE CEREAIS DA COREIA DO SUL, POR TAMANHO DE EMBALAGEM, 2018-2032 (MIL USD)
TABELA 376 MERCADO DE CEREAIS DA COREIA DO SUL, POR FAIXA DE PREÇO, 2018-2032 (MIL USD)
TABELA 377 MERCADO DE CEREAIS DA COREIA DO SUL, POR CANAL DE DISTRIBUIÇÃO, 2018-2032 (MIL USD)
TABELA 378 COREIA DO SUL B2C NO MERCADO DE CEREAIS, POR TIPO, 2018-2032 (MIL USD)
TABELA 379 COREIA DO SUL ONLINE NO MERCADO DE CEREAIS, POR TIPO, 2018-2032 (MIL USD)
TABELA 380 COREIA DO SUL OFFLINE NO MERCADO DE CEREAIS, POR TIPO, 2018-2032 (MIL USD)
TABELA 381 MERCADO DE CEREAIS DA MALÁSIA, POR TIPO DE CEREAL, 2018-2032 (MIL USD)
TABELA 382 MERCADO DE CEREAIS DA MALÁSIA, POR TIPO DE CEREAL, 2018-2032 (MIL TONELADAS)
TABELA 383 MERCADO DE TRIGO EM CEREAIS DA MALÁSIA, POR TIPO, 2018-2032 (MIL USD)
TABELA 384 MERCADO DE ARROZ DA MALÁSIA EM CEREAIS, POR TIPO, 2018-2032 (MIL USD)
TABELA 385 MILHO DA MALÁSIA NO MERCADO DE CEREAIS, POR TIPO, 2018-2032 (MIL USD)
TABELA 386 CEVADA DA MALÁSIA NO MERCADO DE CEREAIS, POR TIPO, 2018-2032 (MIL USD)
TABELA 387 AVEIA DA MALÁSIA NO MERCADO DE CEREAIS, POR TIPO, 2018-2032 (MIL USD)
TABELA 388 CENTEIO DA MALÁSIA NO MERCADO DE CEREAIS, POR TIPO, 2018-2032 (MIL USD)
TABELA 389 SORGO DA MALÁSIA NO MERCADO DE CEREAIS, POR TIPO, 2018-2032 (MIL USD)
TABELA 390 MILHETO DA MALÁSIA NO MERCADO DE CEREAIS, POR TIPO, 2018-2032 (USD MIL)
TABELA 391 QUINOA DA MALÁSIA NO MERCADO DE CEREAIS, POR TIPO, 2018-2032 (MIL USD)
TABELA 392 MERCADO DE CEREAIS DA MALÁSIA, POR FORMULÁRIO DE PRODUTO, 2018-2032 (MIL USD)
TABELA 393 MERCADO DE CEREAIS DA MALÁSIA, POR NÍVEL DE PROCESSAMENTO, 2018-2032 (MIL USD)
TABELA 394 MERCADO DE CEREAIS DA MALÁSIA, POR FORMATO DE CONSUMO, 2018-2032 (MIL USD)
TABELA 395 MERCADO DE CEREAIS DA MALÁSIA, POR CATEGORIA DE PRODUTO, 2018-2032 (MIL USD)
TABELA 396 CEREAIS MATINAIS DA MALÁSIA NO MERCADO DE CEREAIS, POR TIPO, 2018-2032 (MIL USD)
TABELA 397 CEREAIS PRONTOS PARA CONSUMO (RTE) DA MALÁSIA NO MERCADO, POR TIPO, 2018-2032 (MIL USD)
TABELA 398 CEREAIS QUENTES DA MALÁSIA NO MERCADO DE CEREAIS, POR TIPO, 2018-2032 (MIL USD)
TABELA 399 SNACKS DE CEREAIS DA MALÁSIA NO MERCADO DE CEREAIS, POR TIPO, 2018-2032 (MIL USD)
TABELA 400 CEREAIS INFANTIS DA MALÁSIA NO MERCADO DE CEREAIS, POR TIPO, 2018-2032 (MIL USD)
TABELA 401 MERCADO DE CEREAIS DA MALÁSIA, POR NATUREZA, 2018-2032 (MIL USD)
TABELA 402 MERCADO DE CEREAIS DA MALÁSIA, POR CATEGORIA, 2018-2032 (MIL USD)
TABELA 403 MERCADO DE CEREAIS DA MALÁSIA, POR BENEFÍCIOS FUNCIONAIS, 2018-2032 (MIL USD)
TABELA 404 MERCADO DE CEREAIS DA MALÁSIA, POR VALIDADE, 2018-2032 (MIL USD)
TABELA 405 MERCADO DE CEREAIS DA MALÁSIA, POR EMBALAGEM, 2018-2032 (MIL USD)
TABELA 406 MALÁSIA CAIXA NO MERCADO DE CEREAIS, POR TIPO, 2018-2032 (MIL USD)
TABELA 407 MALÁSIA EM SACHÊ NO MERCADO DE CEREAIS, POR TIPO, 2018-2032 (MIL USD)
TABELA 408 MERCADO DE CEREAIS DA MALÁSIA, POR TIPO, 2018-2032 (MIL USD)
TABELA 409 MALÁSIA JAR NO MERCADO DE CEREAIS, POR TIPO, 2018-2032 (USD MIL)
TABELA 410 EMBALAGENS ECOLÓGICAS DA MALÁSIA NO MERCADO DE CEREAIS, POR TIPO, 2018-2032 (MIL USD)
TABELA 411 MERCADO DE CEREAIS DA MALÁSIA, POR TAMANHO DE EMBALAGEM, 2018-2032 (MIL USD)
TABELA 412 MERCADO DE CEREAIS DA MALÁSIA, POR FAIXA DE PREÇO, 2018-2032 (MIL USD)
TABELA 413 MERCADO DE CEREAIS DA MALÁSIA, POR CANAL DE DISTRIBUIÇÃO, 2018-2032 (MIL USD)
TABELA 414 MALÁSIA B2C NO MERCADO DE CEREAIS, POR TIPO, 2018-2032 (MIL USD)
TABELA 415 MALÁSIA ONLINE NO MERCADO DE CEREAIS, POR TIPO, 2018-2032 (MIL USD)
TABELA 416 MALÁSIA OFFLINE NO MERCADO DE CEREAIS, POR TIPO, 2018-2032 (MIL USD)
TABELA 417 MERCADO DE CEREAIS DE SINGAPURA, POR TIPO DE CEREAL, 2018-2032 (MIL USD)
TABELA 418 MERCADO DE CEREAIS DE SINGAPURA, POR TIPO DE CEREAL, 2018-2032 (MIL TONELADAS)
TABELA 419 MERCADO DE TRIGO EM CEREAIS DE SINGAPURA, POR TIPO, 2018-2032 (MIL USD)
TABELA 420 MERCADO DE ARROZ EM CEREAIS DE SINGAPURA, POR TIPO, 2018-2032 (MIL USD)
TABELA 421 MILHO DE SINGAPURA NO MERCADO DE CEREAIS, POR TIPO, 2018-2032 (MIL USD)
TABELA 422 CEVADA NO MERCADO DE CEREAIS DE SINGAPURA, POR TIPO, 2018-2032 (MIL USD)
TABELA 423 AVEIA DE SINGAPURA NO MERCADO DE CEREAIS, POR TIPO, 2018-2032 (MIL USD)
TABELA 424 CENTEIO DE SINGAPURA NO MERCADO DE CEREAIS, POR TIPO, 2018-2032 (MIL USD)
TABELA 425 SORGO NO MERCADO DE CEREAIS DE SINGAPURA, POR TIPO, 2018-2032 (MIL USD)
TABELA 426 MILLET NO MERCADO DE CEREAIS DE SINGAPURA, POR TIPO, 2018-2032 (USD MIL)
TABELA 427 QUINOA EM CINGAPURA NO MERCADO DE CEREAIS, POR TIPO, 2018-2032 (MIL USD)
TABELA 428 MERCADO DE CEREAIS DE SINGAPURA, POR FORMULÁRIO DE PRODUTO, 2018-2032 (MIL USD)
TABELA 429 MERCADO DE CEREAIS DE SINGAPURA, POR NÍVEL DE PROCESSAMENTO, 2018-2032 (MIL USD)
TABELA 430 MERCADO DE CEREAIS DE SINGAPURA, POR FORMATO DE CONSUMO, 2018-2032 (MIL USD)
TABELA 431 MERCADO DE CEREAIS DE SINGAPURA, POR CATEGORIA DE PRODUTO, 2018-2032 (MIL USD)
TABELA 432 CEREAIS MATINAIS DE SINGAPURA NO MERCADO DE CEREAIS, POR TIPO, 2018-2032 (MIL USD)
TABELA 433 CEREAIS PRONTOS PARA CONSUMO (RTE) EM SINGAPURA, POR TIPO, 2018-2032 (MIL USD)
TABELA 434 CEREAIS QUENTES DE SINGAPURA NO MERCADO DE CEREAIS, POR TIPO, 2018-2032 (MIL USD)
TABELA 435 LANCHES DE CEREAIS DE SINGAPURA NO MERCADO DE CEREAIS, POR TIPO, 2018-2032 (MIL USD)
TABELA 436 CEREAIS INFANTIS DE SINGAPURA NO MERCADO DE CEREAIS, POR TIPO, 2018-2032 (MIL USD)
TABELA 437 MERCADO DE CEREAIS DE SINGAPURA, POR NATUREZA, 2018-2032 (MIL USD)
TABELA 438 MERCADO DE CEREAIS DE SINGAPURA, POR CATEGORIA, 2018-2032 (MIL USD)
TABELA 439 MERCADO DE CEREAIS DE SINGAPURA, POR BENEFÍCIOS FUNCIONAIS, 2018-2032 (MIL USD)
TABELA 440 MERCADO DE CEREAIS DE SINGAPURA, POR VALIDADE, 2018-2032 (MIL USD)
TABELA 441 MERCADO DE CEREAIS DE SINGAPURA, POR EMBALAGEM, 2018-2032 (MIL USD)
TABELA 442 SINGAPURA BOX NO MERCADO DE CEREAIS, POR TIPO, 2018-2032 (MIL USD)
TABELA 443 SINGAPURA EM SACHÊS NO MERCADO DE CEREAIS, POR TIPO, 2018-2032 (MIL USD)
TABELA 444 SINGAPURA - MERCADO DE CEREAIS, POR TIPO, 2018-2032 (MIL USD)
TABELA 445 JARRAS DE SINGAPURA NO MERCADO DE CEREAIS, POR TIPO, 2018-2032 (MIL USD)
TABELA 446 EMBALAGENS ECOLÓGICAS DE CINGAPURA NO MERCADO DE CEREAIS, POR TIPO, 2018-2032 (MIL USD)
TABELA 447 MERCADO DE CEREAIS DE SINGAPURA, POR TAMANHO DE EMBALAGEM, 2018-2032 (MIL USD)
TABELA 448 MERCADO DE CEREAIS DE SINGAPURA, POR FAIXA DE PREÇO, 2018-2032 (MIL USD)
TABELA 449 MERCADO DE CEREAIS DE SINGAPURA, POR CANAL DE DISTRIBUIÇÃO, 2018-2032 (MIL USD)
TABELA 450 SINGAPURA B2C NO MERCADO DE CEREAIS, POR TIPO, 2018-2032 (MIL USD)
TABELA 451 SINGAPURA ONLINE NO MERCADO DE CEREAIS, POR TIPO, 2018-2032 (MIL USD)
TABELA 452 SINGAPURA OFFLINE NO MERCADO DE CEREAIS, POR TIPO, 2018-2032 (MIL USD)
TABELA 453 MERCADO DE CEREAIS DA TAILÂNDIA, POR TIPO DE CEREAL, 2018-2032 (MIL USD)
TABELA 454 MERCADO DE CEREAIS DA TAILÂNDIA, POR TIPO DE CEREAL, 2018-2032 (MIL TONELADAS)
TABELA 455 MERCADO DE TRIGO EM CEREAIS DA TAILÂNDIA, POR TIPO, 2018-2032 (MIL USD)
TABELA 456 MERCADO DE ARROZ DA TAILÂNDIA EM CEREAIS, POR TIPO, 2018-2032 (MIL USD)
TABELA 457 MILHO DA TAILÂNDIA NO MERCADO DE CEREAIS, POR TIPO, 2018-2032 (MIL USD)
TABELA 458 CEVADA DA TAILÂNDIA NO MERCADO DE CEREAIS, POR TIPO, 2018-2032 (MIL USD)
TABELA 459 AVEIA DA TAILÂNDIA NO MERCADO DE CEREAIS, POR TIPO, 2018-2032 (MIL USD)
TABELA 460 CENTEIO DA TAILÂNDIA NO MERCADO DE CEREAIS, POR TIPO, 2018-2032 (MIL USD)
TABELA 461 SORGO DA TAILÂNDIA NO MERCADO DE CEREAIS, POR TIPO, 2018-2032 (MIL USD)
TABELA 462 MERCADO DE MILHO DA TAILÂNDIA NO MERCADO DE CEREAIS, POR TIPO, 2018-2032 (MIL USD)
TABELA 463 QUINOA DA TAILÂNDIA NO MERCADO DE CEREAIS, POR TIPO, 2018-2032 (MIL USD)
TABELA 464 MERCADO DE CEREAIS DA TAILÂNDIA, POR FORMULÁRIO DE PRODUTO, 2018-2032 (MIL USD)
TABELA 465 MERCADO DE CEREAIS DA TAILÂNDIA, POR NÍVEL DE PROCESSAMENTO, 2018-2032 (MIL USD)
TABELA 466 MERCADO DE CEREAIS DA TAILÂNDIA, POR FORMATO DE CONSUMO, 2018-2032 (MIL USD)
TABELA 467 MERCADO DE CEREAIS DA TAILÂNDIA, POR CATEGORIA DE PRODUTO, 2018-2032 (MIL USD)
TABELA 468 CEREAIS MATINAIS DA TAILÂNDIA NO MERCADO DE CEREAIS, POR TIPO, 2018-2032 (MIL USD)
TABELA 469 MERCADO DE CEREAIS PRONTOS PARA CONSUMO (RTE) DA TAILÂNDIA, POR TIPO, 2018-2032 (MIL USD)
TABELA 470 CEREAIS QUENTES DA TAILÂNDIA NO MERCADO DE CEREAIS, POR TIPO, 2018-2032 (MIL USD)
TABELA 471 LANCHES DE CEREAIS DA TAILÂNDIA NO MERCADO DE CEREAIS, POR TIPO, 2018-2032 (MIL USD)
TABELA 472 CEREAIS INFANTIS DA TAILÂNDIA NO MERCADO DE CEREAIS, POR TIPO, 2018-2032 (MIL USD)
TABELA 473 MERCADO DE CEREAIS DA TAILÂNDIA, POR NATUREZA, 2018-2032 (MIL USD)
TABELA 474 MERCADO DE CEREAIS DA TAILÂNDIA, POR CATEGORIA, 2018-2032 (MIL USD)
TABELA 475 MERCADO DE CEREAIS DA TAILÂNDIA, POR BENEFÍCIOS FUNCIONAIS, 2018-2032 (MIL USD)
TABELA 476 MERCADO DE CEREAIS DA TAILÂNDIA, POR VALIDADE, 2018-2032 (MIL USD)
TABELA 477 MERCADO DE CEREAIS DA TAILÂNDIA, POR EMBALAGEM, 2018-2032 (MIL USD)
TABELA 478 CAIXA DA TAILÂNDIA NO MERCADO DE CEREAIS, POR TIPO, 2018-2032 (MIL USD)
TABELA 479 MERCADO DE CEREAIS DA TAILÂNDIA, POR TIPO, 2018-2032 (MIL USD)
TABELA 480 SACOS DA TAILÂNDIA NO MERCADO DE CEREAIS, POR TIPO, 2018-2032 (MIL USD)
TABELA 481 MERCADO DE CEREAIS DA TAILÂNDIA, POR TIPO, 2018-2032 (MIL USD)
TABELA 482 EMBALAGENS ECOLÓGICAS NA TAILÂNDIA NO MERCADO DE CEREAIS, POR TIPO, 2018-2032 (MIL USD)
TABELA 483 MERCADO DE CEREAIS DA TAILÂNDIA, POR TAMANHO DE EMBALAGEM, 2018-2032 (MIL USD)
TABELA 484 MERCADO DE CEREAIS DA TAILÂNDIA, POR FAIXA DE PREÇO, 2018-2032 (MIL USD)
TABELA 485 MERCADO DE CEREAIS DA TAILÂNDIA, POR CANAL DE DISTRIBUIÇÃO, 2018-2032 (MIL USD)
TABELA 486 TAILÂNDIA B2C NO MERCADO DE CEREAIS, POR TIPO, 2018-2032 (MIL USD)
TABELA 487 TAILÂNDIA ONLINE NO MERCADO DE CEREAIS, POR TIPO, 2018-2032 (MIL USD)
TABELA 488 TAILÂNDIA OFFLINE NO MERCADO DE CEREAIS, POR TIPO, 2018-2032 (MIL USD)
TABELA 489 MERCADO DE CEREAIS DAS FILIPINAS, POR TIPO DE CEREAL, 2018-2032 (MIL USD)
TABELA 490 MERCADO DE CEREAIS DAS FILIPINAS, POR TIPO DE CEREAL, 2018-2032 (MIL TONELADAS)
TABELA 491 MERCADO DE TRIGO EM CEREAIS DAS FILIPINAS, POR TIPO, 2018-2032 (MIL USD)
TABELA 492 MERCADO DE ARROZ DAS FILIPINAS NO MERCADO DE CEREAIS, POR TIPO, 2018-2032 (MIL USD)
TABELA 493 MILHO DAS FILIPINAS NO MERCADO DE CEREAIS, POR TIPO, 2018-2032 (MIL USD)
TABELA 494 MERCADO DE CEVADA DAS FILIPINAS NO MERCADO DE CEREAIS, POR TIPO, 2018-2032 (MIL USD)
TABELA 495 AVEIA DAS FILIPINAS NO MERCADO DE CEREAIS, POR TIPO, 2018-2032 (MIL USD)
TABELA 496 CENTEIO DAS FILIPINAS NO MERCADO DE CEREAIS, POR TIPO, 2018-2032 (MIL USD)
TABELA 497 MERCADO DE SORGO NAS FILIPINAS NO MERCADO DE CEREAIS, POR TIPO, 2018-2032 (MIL USD)
TABELA 498 MERCADO DE MILHO DAS FILIPINAS NO MERCADO DE CEREAIS, POR TIPO, 2018-2032 (MIL USD)
TABELA 499 QUINOA NAS FILIPINAS NO MERCADO DE CEREAIS, POR TIPO, 2018-2032 (MIL USD)
TABELA 500 MERCADO DE CEREAIS DAS FILIPINAS, POR FORMULÁRIO DE PRODUTO, 2018-2032 (MIL USD)
TABELA 501 MERCADO DE CEREAIS DAS FILIPINAS, POR NÍVEL DE PROCESSAMENTO, 2018-2032 (MIL USD)
TABELA 502 MERCADO DE CEREAIS DAS FILIPINAS, POR FORMATO DE CONSUMO, 2018-2032 (MIL USD)
TABELA 503 MERCADO DE CEREAIS DAS FILIPINAS, POR CATEGORIA DE PRODUTO, 2018-2032 (MIL USD)
TABELA 504 CEREAIS MATINAIS DAS FILIPINAS NO MERCADO DE CEREAIS, POR TIPO, 2018-2032 (MIL USD)
TABELA 505 MERCADO DE CEREAIS PRONTOS PARA CONSUMO (RTE) NAS FILIPINAS, POR TIPO, 2018-2032 (MIL USD)
TABELA 506 CEREAIS QUENTES DAS FILIPINAS NO MERCADO DE CEREAIS, POR TIPO, 2018-2032 (MIL USD)
TABELA 507 LANCHES DE CEREAIS DAS FILIPINAS NO MERCADO DE CEREAIS, POR TIPO, 2018-2032 (MIL USD)
TABELA 508 CEREAIS INFANTIS DAS FILIPINAS NO MERCADO DE CEREAIS, POR TIPO, 2018-2032 (MIL USD)
TABELA 509 MERCADO DE CEREAIS DAS FILIPINAS, POR NATUREZA, 2018-2032 (MIL USD)
TABELA 510 MERCADO DE CEREAIS DAS FILIPINAS, POR CATEGORIA, 2018-2032 (MIL USD)
TABELA 511 MERCADO DE CEREAIS DAS FILIPINAS, POR BENEFÍCIOS FUNCIONAIS, 2018-2032 (MIL USD)
TABELA 512 MERCADO DE CEREAIS DAS FILIPINAS, POR VALIDADE, 2018-2032 (MIL USD)
TABELA 513 MERCADO DE CEREAIS DAS FILIPINAS, POR EMBALAGEM, 2018-2032 (MIL USD)
TABELA 514 FILIPINAS BOX NO MERCADO DE CEREAIS, POR TIPO, 2018-2032 (MIL USD)
TABELA 515 FILIPINAS EM SACHÊ NO MERCADO DE CEREAIS, POR TIPO, 2018-2032 (MIL USD)
TABELA 516 SACOLA DAS FILIPINAS NO MERCADO DE CEREAIS, POR TIPO, 2018-2032 (MIL USD)
TABELA 517 FILIPINAS JAR NO MERCADO DE CEREAIS, POR TIPO, 2018-2032 (MIL USD)
TABELA 518 EMBALAGENS ECOLÓGICAS NAS FILIPINAS NO MERCADO DE CEREAIS, POR TIPO, 2018-2032 (MIL USD)
TABELA 519 MERCADO DE CEREAIS DAS FILIPINAS, POR TAMANHO DE EMBALAGEM, 2018-2032 (MIL USD)
TABELA 520 MERCADO DE CEREAIS DAS FILIPINAS, POR FAIXA DE PREÇO, 2018-2032 (MIL USD)
TABELA 521 MERCADO DE CEREAIS DAS FILIPINAS, POR CANAL DE DISTRIBUIÇÃO, 2018-2032 (MIL USD)
TABELA 522 FILIPINAS B2C NO MERCADO DE CEREAIS, POR TIPO, 2018-2032 (MIL USD)
TABELA 523 FILIPINAS ONLINE NO MERCADO DE CEREAIS, POR TIPO, 2018-2032 (MIL USD)
TABELA 524 FILIPINAS OFFLINE NO MERCADO DE CEREAIS, POR TIPO, 2018-2032 (MIL USD)
TABELA 525 MERCADO DE CEREAIS DA INDONÉSIA, POR TIPO DE CEREAL, 2018-2032 (MIL USD)
TABELA 526 MERCADO DE CEREAIS DA INDONÉSIA, POR TIPO DE CEREAL, 2018-2032 (MIL TONELADAS)
TABELA 527 MERCADO DE TRIGO EM CEREAIS DA INDONÉSIA, POR TIPO, 2018-2032 (MIL USD)
TABELA 528 MERCADO DE ARROZ EM CEREAIS DA INDONÉSIA, POR TIPO, 2018-2032 (MIL USD)
TABELA 529 MILHO DA INDONÉSIA NO MERCADO DE CEREAIS, POR TIPO, 2018-2032 (MIL USD)
TABELA 530 MERCADO DE CEVADA DA INDONÉSIA NO MERCADO DE CEREAIS, POR TIPO, 2018-2032 (MIL USD)
TABELA 531 AVEIA DA INDONÉSIA NO MERCADO DE CEREAIS, POR TIPO, 2018-2032 (MIL USD)
TABELA 532 CENTEIO DA INDONÉSIA NO MERCADO DE CEREAIS, POR TIPO, 2018-2032 (MIL USD)
TABELA 533 MERCADO DE SORGO NA INDONÉSIA EM CEREAIS, POR TIPO, 2018-2032 (MIL USD)
TABELA 534 MERCADO DE MILHO DA INDONÉSIA NO MERCADO DE CEREAIS, POR TIPO, 2018-2032 (MIL USD)
TABELA 535 MERCADO DE QUINOA DA INDONÉSIA EM CEREAIS, POR TIPO, 2018-2032 (MIL USD)
TABELA 536 MERCADO DE CEREAIS DA INDONÉSIA, POR FORMULÁRIO DE PRODUTO, 2018-2032 (MIL USD)
TABELA 537 MERCADO DE CEREAIS DA INDONÉSIA, POR NÍVEL DE PROCESSAMENTO, 2018-2032 (MIL USD)
TABELA 538 MERCADO DE CEREAIS DA INDONÉSIA, POR FORMATO DE CONSUMO, 2018-2032 (MIL USD)
TABELA 539 MERCADO DE CEREAIS DA INDONÉSIA, POR CATEGORIA DE PRODUTO, 2018-2032 (MIL USD)
TABELA 540 CEREAIS MATINAIS DA INDONÉSIA NO MERCADO DE CEREAIS, POR TIPO, 2018-2032 (MIL USD)
TABELA 541 MERCADO DE CEREAIS PRONTOS PARA CONSUMO (RTE) DA INDONÉSIA, POR TIPO, 2018-2032 (MIL USD)
TABELA 542 CEREAIS QUENTES DA INDONÉSIA NO MERCADO DE CEREAIS, POR TIPO, 2018-2032 (MIL USD)
TABELA 543 LANCHES DE CEREAIS DA INDONÉSIA NO MERCADO DE CEREAIS, POR TIPO, 2018-2032 (MIL USD)
TABELA 544 CEREAIS INFANTIS DA INDONÉSIA NO MERCADO DE CEREAIS, POR TIPO, 2018-2032 (MIL USD)
TABELA 545 MERCADO DE CEREAIS DA INDONÉSIA, POR NATUREZA, 2018-2032 (MIL USD)
TABELA 546 MERCADO DE CEREAIS DA INDONÉSIA, POR CATEGORIA, 2018-2032 (MIL USD)
TABELA 547 MERCADO DE CEREAIS DA INDONÉSIA, POR BENEFÍCIOS FUNCIONAIS, 2018-2032 (MIL USD)
TABELA 548 MERCADO DE CEREAIS DA INDONÉSIA, POR VALIDADE, 2018-2032 (MIL USD)
TABELA 549 MERCADO DE CEREAIS DA INDONÉSIA, POR EMBALAGEM, 2018-2032 (MIL USD)
TABELA 550 CAIXA DA INDONÉSIA NO MERCADO DE CEREAIS, POR TIPO, 2018-2032 (MIL USD)
TABELA 551 INDONÉSIA EM SACHÊS NO MERCADO DE CEREAIS, POR TIPO, 2018-2032 (USD MIL)
TABELA 552 MERCADO DE SACOS DE CEREAIS DA INDONÉSIA, POR TIPO, 2018-2032 (MIL USD)
TABELA 553 MERCADO DE CEREAIS NA INDONÉSIA, POR TIPO, 2018-2032 (MIL USD)
TABELA 554 EMBALAGENS ECOLÓGICAS NA INDONÉSIA NO MERCADO DE CEREAIS, POR TIPO, 2018-2032 (MIL USD)
TABELA 555 MERCADO DE CEREAIS DA INDONÉSIA, POR TAMANHO DE EMBALAGEM, 2018-2032 (MIL USD)
TABELA 556 MERCADO DE CEREAIS DA INDONÉSIA, POR FAIXA DE PREÇO, 2018-2032 (MIL USD)
TABELA 557 MERCADO DE CEREAIS DA INDONÉSIA, POR CANAL DE DISTRIBUIÇÃO, 2018-2032 (MIL USD)
TABELA 558 INDONÉSIA ONLINE NO MERCADO DE CEREAIS, POR TIPO, 2018-2032 (MIL USD)
TABELA 559 INDONÉSIA OFFLINE NO MERCADO DE CEREAIS, POR TIPO, 2018-2032 (MIL USD)
TABELA 560 MERCADO DE CEREAIS DA NOVA ZELÂNDIA, POR TIPO DE CEREAL, 2018-2032 (MIL USD)
TABELA 561 MERCADO DE CEREAIS DA NOVA ZELÂNDIA, POR TIPO DE CEREAL, 2018-2032 (MIL TONELADAS)
TABELA 562 MERCADO DE TRIGO EM CEREAIS DA NOVA ZELÂNDIA, POR TIPO, 2018-2032 (MIL USD)
TABELA 563 ARROZ DA NOVA ZELÂNDIA NO MERCADO DE CEREAIS, POR TIPO, 2018-2032 (MIL USD)
TABELA 564 MILHO DA NOVA ZELÂNDIA NO MERCADO DE CEREAIS, POR TIPO, 2018-2032 (MIL USD)
TABELA 565 CEVADA DA NOVA ZELÂNDIA NO MERCADO DE CEREAIS, POR TIPO, 2018-2032 (MIL USD)
TABELA 566 AVEIA DA NOVA ZELÂNDIA NO MERCADO DE CEREAIS, POR TIPO, 2018-2032 (MIL USD)
TABELA 567 CENTEIO DA NOVA ZELÂNDIA NO MERCADO DE CEREAIS, POR TIPO, 2018-2032 (MIL USD)
TABELA 568 SORGO DA NOVA ZELÂNDIA NO MERCADO DE CEREAIS, POR TIPO, 2018-2032 (MIL USD)
TABELA 569 MILHETO DA NOVA ZELÂNDIA NO MERCADO DE CEREAIS, POR TIPO, 2018-2032 (USD MIL)
TABELA 570 QUINOA DA NOVA ZELÂNDIA NO MERCADO DE CEREAIS, POR TIPO, 2018-2032 (MIL USD)
TABELA 571 MERCADO DE CEREAIS DA NOVA ZELÂNDIA, POR FORMULÁRIO DE PRODUTO, 2018-2032 (MIL USD)
TABELA 572 MERCADO DE CEREAIS DA NOVA ZELÂNDIA, POR NÍVEL DE PROCESSAMENTO, 2018-2032 (MIL USD)
TABELA 573 MERCADO DE CEREAIS DA NOVA ZELÂNDIA, POR FORMATO DE CONSUMO, 2018-2032 (MIL USD)
TABELA 574 MERCADO DE CEREAIS DA NOVA ZELÂNDIA, POR CATEGORIA DE PRODUTO, 2018-2032 (MIL USD)
TABELA 575 CEREAIS MATINAIS DA NOVA ZELÂNDIA NO MERCADO DE CEREAIS, POR TIPO, 2018-2032 (MIL USD)
TABELA 576 MERCADO DE CEREAIS PRONTOS PARA CONSUMO (RTE) DA NOVA ZELÂNDIA, POR TIPO, 2018-2032 (MIL USD)
TABELA 577 CEREAIS QUENTES DA NOVA ZELÂNDIA NO MERCADO DE CEREAIS, POR TIPO, 2018-2032 (MIL USD)
TABELA 578 SNACKS DE CEREAIS DA NOVA ZELÂNDIA NO MERCADO DE CEREAIS, POR TIPO, 2018-2032 (MIL USD)
TABELA 579 CEREAIS INFANTIS DA NOVA ZELÂNDIA NO MERCADO DE CEREAIS, POR TIPO, 2018-2032 (MIL USD)
TABELA 580 MERCADO DE CEREAIS DA NOVA ZELÂNDIA, POR NATUREZA, 2018-2032 (MIL USD)
TABELA 581 MERCADO DE CEREAIS DA NOVA ZELÂNDIA, POR CATEGORIA, 2018-2032 (MIL USD)
TABELA 582 MERCADO DE CEREAIS DA NOVA ZELÂNDIA, POR BENEFÍCIOS FUNCIONAIS, 2018-2032 (MIL USD)
TABELA 583 MERCADO DE CEREAIS DA NOVA ZELÂNDIA, POR VALIDADE, 2018-2032 (MIL USD)
TABELA 584 MERCADO DE CEREAIS DA NOVA ZELÂNDIA, POR EMBALAGEM, 2018-2032 (MIL USD)
TABELA 585 NOVA ZELÂNDIA CAIXA NO MERCADO DE CEREAIS, POR TIPO, 2018-2032 (USD MIL)
TABELA 586 NOVA ZELÂNDIA EM SACHÊS NO MERCADO DE CEREAIS, POR TIPO, 2018-2032 (MIL USD)
TABELA 587 MERCADO DE CEREAIS DA NOVA ZELÂNDIA, POR TIPO, 2018-2032 (MIL USD)
TABELA 588 NOVA ZELÂNDIA JAR NO MERCADO DE CEREAIS, POR TIPO, 2018-2032 (USD MIL)
TABELA 589 EMBALAGENS ECOLÓGICAS NO MERCADO DE CEREAIS DA NOVA ZELÂNDIA, POR TIPO, 2018-2032 (MIL USD)
TABELA 590 MERCADO DE CEREAIS DA NOVA ZELÂNDIA, POR TAMANHO DA EMBALAGEM, 2018-2032 (MIL USD)
TABELA 591 MERCADO DE CEREAIS DA NOVA ZELÂNDIA, POR FAIXA DE PREÇO, 2018-2032 (MIL USD)
TABELA 592 MERCADO DE CEREAIS DA NOVA ZELÂNDIA, POR CANAL DE DISTRIBUIÇÃO, 2018-2032 (MIL USD)
TABELA 593 NOVA ZELÂNDIA B2C NO MERCADO DE CEREAIS, POR TIPO, 2018-2032 (MIL USD)
TABELA 594 NOVA ZELÂNDIA ONLINE NO MERCADO DE CEREAIS, POR TIPO, 2018-2032 (MIL USD)
TABELA 595 NOVA ZELÂNDIA OFFLINE NO MERCADO DE CEREAIS, POR TIPO, 2018-2032 (MIL USD)
TABELA 596 MERCADO DE CEREAIS DE HONG KONG, POR TIPO DE CEREAL, 2018-2032 (MIL USD)
TABELA 597 MERCADO DE CEREAIS DE HONG KONG, POR TIPO DE CEREAL, 2018-2032 (MIL TONELADAS)
TABELA 598 MERCADO DE TRIGO EM CEREAIS DE HONG KONG, POR TIPO, 2018-2032 (MIL USD)
TABELA 599 MERCADO DE ARROZ EM CEREAIS DE HONG KONG, POR TIPO, 2018-2032 (MIL USD)
TABELA 600 MILHO DE HONG KONG (MILHO) NO MERCADO DE CEREAIS, POR TIPO, 2018-2032 (MIL USD)
TABELA 601 CEVADA EM HONG KONG NO MERCADO DE CEREAIS, POR TIPO, 2018-2032 (MIL USD)
TABELA 602 AVEIA DE HONG KONG NO MERCADO DE CEREAIS, POR TIPO, 2018-2032 (MIL USD)
TABELA 603 CENTEIO DE HONG KONG NO MERCADO DE CEREAIS, POR TIPO, 2018-2032 (MIL USD)
TABELA 604 MERCADO DE SORGO EM CEREAIS DE HONG KONG, POR TIPO, 2018-2032 (MIL USD)
TABELA 605 MERCADO DE MILHO DE HONG KONG NO MERCADO DE CEREAIS, POR TIPO, 2018-2032 (USD MIL)
TABELA 606 MERCADO DE QUINOA EM CEREAIS DE HONG KONG, POR TIPO, 2018-2032 (MIL USD)
TABELA 607 MERCADO DE CEREAIS DE HONG KONG, POR FORMULÁRIO DE PRODUTO, 2018-2032 (MIL USD)
TABELA 608 MERCADO DE CEREAIS DE HONG KONG, POR NÍVEL DE PROCESSAMENTO, 2018-2032 (MIL USD)
TABELA 609 MERCADO DE CEREAIS DE HONG KONG, POR FORMATO DE CONSUMO, 2018-2032 (MIL USD)
TABELA 610 MERCADO DE CEREAIS DE HONG KONG, POR CATEGORIA DE PRODUTO, 2018-2032 (MIL USD)
TABELA 611 CEREAIS MATINAIS DE HONG KONG NO MERCADO DE CEREAIS, POR TIPO, 2018-2032 (MIL USD)
TABELA 612 MERCADO DE CEREAIS PRONTOS PARA CONSUMO (RTE) EM HONG KONG, POR TIPO, 2018-2032 (MIL USD)
TABELA 613 CEREAIS QUENTES DE HONG KONG NO MERCADO DE CEREAIS, POR TIPO, 2018-2032 (MIL USD)
TABELA 614 LANCHES DE CEREAIS DE HONG KONG NO MERCADO DE CEREAIS, POR TIPO, 2018-2032 (MIL USD)
TABELA 615 CEREAIS INFANTIS DE HONG KONG NO MERCADO DE CEREAIS, POR TIPO, 2018-2032 (MIL USD)
TABELA 616 MERCADO DE CEREAIS DE HONG KONG, POR NATUREZA, 2018-2032 (MIL USD)
TABELA 617 MERCADO DE CEREAIS DE HONG KONG, POR CATEGORIA, 2018-2032 (MIL USD)
TABELA 618 MERCADO DE CEREAIS DE HONG KONG, POR BENEFÍCIOS FUNCIONAIS, 2018-2032 (MIL USD)
TABELA 619 MERCADO DE CEREAIS DE HONG KONG, POR VALIDADE, 2018-2032 (MIL USD)
TABELA 620 MERCADO DE CEREAIS DE HONG KONG, POR EMBALAGEM, 2018-2032 (MIL USD)
TABELA 621 CAIXA DE HONG KONG NO MERCADO DE CEREAIS, POR TIPO, 2018-2032 (MIL USD)
TABELA 622 MERCADO DE CEREAIS EM SACHÊ DE HONG KONG, POR TIPO, 2018-2032 (MIL USD)
TABELA 623 MERCADO DE CEREAIS EM HONG KONG, POR TIPO, 2018-2032 (MIL USD)
TABELA 624 MERCADO DE CEREAIS EM HONG KONG, POR TIPO, 2018-2032 (MIL USD)
TABELA 625 MERCADO DE CEREAIS DE HONG KONG, POR TAMANHO DE EMBALAGEM, 2018-2032 (MIL USD)
TABELA 626 MERCADO DE CEREAIS DE HONG KONG, POR FAIXA DE PREÇO, 2018-2032 (MIL USD)
TABELA 627 MERCADO DE CEREAIS DE HONG KONG, POR CANAL DE DISTRIBUIÇÃO, 2018-2032 (MIL USD)
TABELA 628 HONG KONG B2C NO MERCADO DE CEREAIS, POR TIPO, 2018-2032 (MIL USD)
TABELA 629 HONG KONG ONLINE NO MERCADO DE CEREAIS, POR TIPO, 2018-2032 (MIL USD)
TABELA 630 HONG KONG OFFLINE NO MERCADO DE CEREAIS, POR TIPO, 2018-2032 (MIL USD)
TABELA 631 MERCADO DE CEREAIS DE TAIWAN, POR TIPO DE CEREAL, 2018-2032 (MIL USD)
TABELA 632 MERCADO DE CEREAIS DE TAIWAN, POR TIPO DE CEREAL, 2018-2032 (MIL TONELADAS)
TABELA 633 MERCADO DE TRIGO EM CEREAIS DE TAIWAN, POR TIPO, 2018-2032 (MIL USD)
TABELA 634 MERCADO DE ARROZ DE TAIWAN EM CEREAIS, POR TIPO, 2018-2032 (MIL USD)
TABELA 635 MILHO DE TAIWAN (MILHO) NO MERCADO DE CEREAIS, POR TIPO, 2018-2032 (MIL USD)
TABELA 636 CEVADA DE TAIWAN NO MERCADO DE CEREAIS, POR TIPO, 2018-2032 (MIL USD)
TABELA 637 AVEIA DE TAIWAN NO MERCADO DE CEREAIS, POR TIPO, 2018-2032 (MIL USD)
TABELA 638 CENTEIO DE TAIWAN NO MERCADO DE CEREAIS, POR TIPO, 2018-2032 (MIL USD)
TABELA 639 SORGO DE TAIWAN NO MERCADO DE CEREAIS, POR TIPO, 2018-2032 (MIL USD)
TABELA 640 MILHETE DE TAIWAN NO MERCADO DE CEREAIS, POR TIPO, 2018-2032 (USD MIL)
TABELA 641 QUINOA DE TAIWAN NO MERCADO DE CEREAIS, POR TIPO, 2018-2032 (MIL USD)
TABELA 642 MERCADO DE CEREAIS DE TAIWAN, POR FORMULÁRIO DE PRODUTO, 2018-2032 (MIL USD)
TABELA 643 MERCADO DE CEREAIS DE TAIWAN, POR NÍVEL DE PROCESSAMENTO, 2018-2032 (MIL USD)
TABELA 644 MERCADO DE CEREAIS DE TAIWAN, POR FORMATO DE CONSUMO, 2018-2032 (MIL USD)
TABELA 645 MERCADO DE CEREAIS DE TAIWAN, POR CATEGORIA DE PRODUTO, 2018-2032 (MIL USD)
TABELA 646 CEREAIS MATINAIS DE TAIWAN NO MERCADO DE CEREAIS, POR TIPO, 2018-2032 (MIL USD)
TABELA 647 CEREAIS PRONTOS PARA CONSUMO (RTE) DE TAIWAN NO MERCADO, POR TIPO, 2018-2032 (MIL USD)
TABELA 648 CEREAIS QUENTES DE TAIWAN NO MERCADO DE CEREAIS, POR TIPO, 2018-2032 (MIL USD)
TABELA 649 LANCHES DE CEREAIS DE TAIWAN NO MERCADO DE CEREAIS, POR TIPO, 2018-2032 (MIL USD)
TABELA 650 CEREAIS INFANTIS DE TAIWAN NO MERCADO DE CEREAIS, POR TIPO, 2018-2032 (MIL USD)
TABELA 651 MERCADO DE CEREAIS DE TAIWAN, POR NATUREZA, 2018-2032 (MIL USD)
TABELA 652 MERCADO DE CEREAIS DE TAIWAN, POR CATEGORIA, 2018-2032 (MIL USD)
TABELA 653 MERCADO DE CEREAIS DE TAIWAN, POR BENEFÍCIOS FUNCIONAIS, 2018-2032 (MIL USD)
TABELA 654 MERCADO DE CEREAIS DE TAIWAN, POR VALIDADE, 2018-2032 (MIL USD)
TABELA 655 MERCADO DE CEREAIS DE TAIWAN, POR EMBALAGEM, 2018-2032 (MIL USD)
TABELA 656 CAIXA DE TAIWAN NO MERCADO DE CEREAIS, POR TIPO, 2018-2032 (MIL USD)
TABELA 657 EMBALAGEM DE CEREAIS EM TAIWAN, POR TIPO, 2018-2032 (MIL USD)
TABELA 658 MERCADO DE CEREAIS DE TAIWAN, POR TIPO, 2018-2032 (MIL USD)
TABELA 659 FRASCO DE TAIWAN NO MERCADO DE CEREAIS, POR TIPO, 2018-2032 (MIL USD)
TABELA 660 EMBALAGENS ECOLÓGICAS DE TAIWAN NO MERCADO DE CEREAIS, POR TIPO, 2018-2032 (MIL USD)
TABELA 661 MERCADO DE CEREAIS DE TAIWAN, POR TAMANHO DE EMBALAGEM, 2018-2032 (MIL USD)
TABELA 662 MERCADO DE CEREAIS DE TAIWAN, POR FAIXA DE PREÇO, 2018-2032 (MIL USD)
TABELA 663 MERCADO DE CEREAIS DE TAIWAN, POR CANAL DE DISTRIBUIÇÃO, 2018-2032 (MIL USD)
TABELA 664 TAIWAN B2C NO MERCADO DE CEREAIS, POR TIPO, 2018-2032 (MIL USD)
TABELA 665 TAIWAN ONLINE NO MERCADO DE CEREAIS, POR TIPO, 2018-2032 (MIL USD)
TABELA 666 TAIWAN OFFLINE NO MERCADO DE CEREAIS, POR TIPO, 2018-2032 (MIL USD)
TABELA 667 MERCADO DE CEREAIS DO RESTO DA ÁSIA-PACÍFICO, POR TIPO DE CEREAL, 2018-2032 (MIL USD)
TABELA 668 MERCADO DE CEREAIS DO RESTO DA ÁSIA-PACÍFICO, POR TIPO DE CEREAL, 2018-2032 (MIL TONELADAS)
Lista de Figura
FIGURA 1 MERCADO DE CEREAIS DA ÁSIA-PACÍFICO
FIGURA 2 MERCADO DE CEREAIS DA ÁSIA-PACÍFICO: TRIANGULAÇÃO DE DADOS
FIGURA 3 MERCADO DE CEREAIS DA ÁSIA-PACÍFICO: ANÁLISE DROC
FIGURA 4 MERCADO DE CEREAIS DA ÁSIA-PACÍFICO: ANÁLISE DE MERCADO DA ÁSIA-PACÍFICO VS MERCADO REGIONAL
FIGURA 5 MERCADO DE CEREAIS DA ÁSIA-PACÍFICO: ANÁLISE DE PESQUISA DA EMPRESA
FIGURA 6 MERCADO DE CEREAIS DA ÁSIA-PACÍFICO: MODELAGEM MULTIVARIADA
FIGURA 7 CURVA DA LINHA DO TEMPO DO TIPO DE CEREAL
FIGURA 8 MERCADO DE CEREAIS DA ÁSIA-PACÍFICO: DEMOGRAFIA DA ENTREVISTA
FIGURA 9 MERCADO DE CEREAIS DA ÁSIA-PACÍFICO: GRADE DE POSIÇÃO DE MERCADO DBMR
FIGURA 10 MERCADO DE CEREAIS DA ÁSIA-PACÍFICO: ANÁLISE DA PARTICIPAÇÃO DOS FORNECEDORES
FIGURA 11 MERCADO DE CEREAIS DA ÁSIA-PACÍFICO: SEGMENTAÇÃO
FIGURA 12 MERCADO DE CEREAIS DA ÁSIA-PACÍFICO: DECISÕES ESTRATÉGICAS
FIGURA 13 MERCADO DE CEREAIS DA ÁSIA-PACÍFICO: RESUMO EXECUTIVO
FIGURA 14 DEZESSEIS SEGMENTOS COMPÕEM O MERCADO DE CEREAIS DA ÁSIA-PACÍFICO: POR TIPO DE CEREAL
FIGURA 15 A CRESCENTE DEMANDA POR ALIMENTOS NUTRICIONAIS E FUNCIONAIS DEVE IMPULSIONAR O MERCADO DE CEREAIS DA ÁSIA-PACÍFICO NO PERÍODO PREVISTO
FIGURA 16 O SEGMENTO DE TRIGO DEVE SER REPRESENTANTE DA MAIOR PARTICIPAÇÃO DO MERCADO DE CEREAIS DA ÁSIA-PACÍFICO EM 2025 E 2032
FIGURA 17 VISÃO GERAL DO PRODUTO E DA MARCA
FIGURA 18 PERSPECTIVAS DA CAPACIDADE DE PRODUÇÃO
FIGURA 19 ANÁLISE DA CADEIA DE VALOR
FIGURA 20 FIGURA: ANÁLISE DA CADEIA DE SUPRIMENTOS DO MERCADO DE CEREAIS
FIGURA 21 QUADRANTE DE AVALIAÇÃO DE EMPRESAS
FIGURA 22 NÚMERO TOTAL DE NEGÓCIOS
FIGURA 23 NEGÓCIOS POR TIPO
FIGURA 24 NEGÓCIOS POR SEGMENTO
FIGURA 25 ANÁLISE DE TENDÊNCIAS DE PREÇOS DO MERCADO DE CEREAIS
FIGURA 26 FAMÍLIAS DE PATENTES
FIGURA 27 FAMÍLIAS DE PATENTES
FIGURA 28 % DO CUSTO TOTAL DE TRANSPORTE
FIGURA 29 PONTUAÇÃO DE IMPORTÂNCIA (1-10)
FIGURA 30 PARTICIPAÇÃO ESTIMADA (%)
FIGURA 31 MOTIVADORES, RESTRIÇÕES, OPORTUNIDADES E DESAFIOS DO MERCADO DE CEREAIS DA ÁSIA-PACÍFICO
FIGURA 32 MERCADO DE CEREAIS DA ÁSIA-PACÍFICO: POR TIPO DE CEREAL, 2024
FIGURA 33 MERCADO DE CEREAIS DA ÁSIA-PACÍFICO: FORMA DO PRODUTO, 2024
FIGURA 34 MERCADO DE CEREAIS DA ÁSIA-PACÍFICO: POR NÍVEL DE PROCESSAMENTO, 2024
FIGURA 35 MERCADO DE CEREAIS DA ÁSIA-PACÍFICO: POR FORMATO DE CONSUMO, 2024
FIGURA 36 MERCADO DE CEREAIS DA ÁSIA-PACÍFICO: POR CATEGORIA DE PRODUTO, 2024
FIGURA 37 MERCADO DE CEREAIS DA ÁSIA-PACÍFICO: POR NATUREZA, 2024
FIGURA 38 MERCADO DE CEREAIS DA ÁSIA-PACÍFICO: POR CATEGORIA, 2024
FIGURA 39 MERCADO DE CEREAIS DA ÁSIA-PACÍFICO: POR BENEFÍCIOS FUNCIONAIS, 2024
FIGURA 40 MERCADO DE CEREAIS DA ÁSIA-PACÍFICO: POR VALIDADE, 2024
FIGURA 41 MERCADO DE CEREAIS DA ÁSIA-PACÍFICO: POR EMBALAGEM, 2024
FIGURA 42 MERCADO DE CEREAIS DA ÁSIA-PACÍFICO: POR TAMANHO DE EMBALAGEM, 2024
FIGURA 43 MERCADO DE CEREAIS DA ÁSIA-PACÍFICO: POR FAIXA DE PREÇO, 2024
FIGURA 44 MERCADO DE CEREAIS DA ÁSIA-PACÍFICO: POR CANAL DE DISTRIBUIÇÃO, 2024
FIGURA 45 MERCADO DE CEREAIS DA ÁSIA-PACÍFICO: INSTANTÂNEO (2024)
FIGURA 46 MERCADO DE CEREAIS DA ÁSIA-PACÍFICO: PARTICIPAÇÃO DA EMPRESA 2024 (%)
Metodologia de Investigação
A recolha de dados e a análise do ano base são feitas através de módulos de recolha de dados com amostras grandes. A etapa inclui a obtenção de informações de mercado ou dados relacionados através de diversas fontes e estratégias. Inclui examinar e planear antecipadamente todos os dados adquiridos no passado. Da mesma forma, envolve o exame de inconsistências de informação observadas em diferentes fontes de informação. Os dados de mercado são analisados e estimados utilizando modelos estatísticos e coerentes de mercado. Além disso, a análise da quota de mercado e a análise das principais tendências são os principais fatores de sucesso no relatório de mercado. Para saber mais, solicite uma chamada de analista ou abra a sua consulta.
A principal metodologia de investigação utilizada pela equipa de investigação do DBMR é a triangulação de dados que envolve a mineração de dados, a análise do impacto das variáveis de dados no mercado e a validação primária (especialista do setor). Os modelos de dados incluem grelha de posicionamento de fornecedores, análise da linha de tempo do mercado, visão geral e guia de mercado, grelha de posicionamento da empresa, análise de patentes, análise de preços, análise da quota de mercado da empresa, normas de medição, análise global versus regional e de participação dos fornecedores. Para saber mais sobre a metodologia de investigação, faça uma consulta para falar com os nossos especialistas do setor.
Personalização disponível
A Data Bridge Market Research é líder em investigação formativa avançada. Orgulhamo-nos de servir os nossos clientes novos e existentes com dados e análises que correspondem e atendem aos seus objetivos. O relatório pode ser personalizado para incluir análise de tendências de preços de marcas-alvo, compreensão do mercado para países adicionais (solicite a lista de países), dados de resultados de ensaios clínicos, revisão de literatura, mercado remodelado e análise de base de produtos . A análise de mercado dos concorrentes-alvo pode ser analisada desde análises baseadas em tecnologia até estratégias de carteira de mercado. Podemos adicionar quantos concorrentes necessitar de dados no formato e estilo de dados que procura. A nossa equipa de analistas também pode fornecer dados em tabelas dinâmicas de ficheiros Excel em bruto (livro de factos) ou pode ajudá-lo a criar apresentações a partir dos conjuntos de dados disponíveis no relatório.

